

Page 1

OMB-NETSCAN
Ethernet/Internet-Based
Data Logging & Control Instrument
User’s Guide
OMB-1035-0901
p/n
Rev
1.0
Page 2

OMEGAnetSM On-Line Service
http://www.omega.com
Servicing North America:
Internet e-mail
info@omega.com
USA:
Canada:
One Omega Drive, Box 4047
Stamford, CT 06907-0047
Tel: (203) 359-1660
e-mail: info@omega.com
976 Berger
Laval (Quebec) H7L 5A1
Tel: (514) 856-6928
e-mail: canada@omega.com
FAX: (203) 359-7700
FAX: (514) 856-6886
For immediate technical or application assistance:
USA and Canada:
Mexico and
Latin America:
Sales Service: 1-800-826-6342 / 1-800-TC-OMEGA
Customer Service: 1-800-622-2378 / 1-800-622-BEST
Engineering Service: 1-800-872-9436 / 1-800-USA-WHEN
TELEX: 996404 EASYLINK: 62968934 CABLE: OMEGA
Tel: (95) 800-TC-OMEGA
En Espanol: (95) 203-359-7803
SM
FAX: (95) 203-359-7807
e-mail: espanol@omega.com
SM
SM
SM
Servicing Europe:
Benelux:
Czech Republic:
France:
Germany/Austria:
United Kingdom:
It is the policy of OMEGA to comply with all worldwide safety and EMC/EMI regulations that
apply. OMEGA is constantly pursuing certification of its products to the European New Approach
Directives. OMEGA will add the CE mark to every appropriate device upon certification.
The information contained in this document is believed to be correct but OMEGA Engineering, Inc. accepts
no liability for any errors it contains, and reserves the right to alter specifications without notice.
WARNING: These products are not designed for use in, and should not be used for, patient-connected applications.
Postbus 8034, 1180 LA Amstelveen, The Netherlands
Tel: (31) 20 6418405
Toll Free in Benelux: 06 0993344
e-mail: nl@omega.com
ul. Rude armady 1868
733 01 Karvina-Hranice
Tel: 420 (69) 6311899
e-mail:czech@omega.com
9, rue Denis Papin, 78190 Trappes
Tel: (33) 130-621-400
Toll Free in France: 0800-4-06342
e-mail: france@omega.com
Daimlerstrasse 26, D-75392 Deckenpfronn, Germany
Tel: 49 (07056) 3017
Toll Free in Germany: 0130 11 21 66
e-mail: germany@omega.com
25 Swannington Road,
Broughton Astley, Leicestershire,
LE9 6TU, England
Tel: 44 (1455) 285520
FAX: 44 (1455) 283912
Toll Free in England: 0800-488-488
e-mail: uk@omega.com
FAX: (31) 20 6434643
FAX: 420 (69) 6311114
FAX: (33) 130-699-120
FAX: 49 (07056) 8540
P.O. Box 7, Omega Drive,
Irlam, Manchester,
M44 5EX, England
Tel: 44 (161) 777-6611
FAX: 44 (161) 777-6622
Page 3

How To Use This Manual
Chapter 1: Configuring and Starting NetScan provides information to get your NetScan system up and running on
the ethernet. Includes software installation instructions.
Chapter 2: ChartViewNET Quick Start and Tutorial includes basic concepts regarding the ChartViewNET
software program, and a ChartView tutorial to quickly familiarize you with the application.
Chapter 3: General Information and Specifications gives a general description of NetScan and related hardware
including NetScan’s expansion chassis and available signal conditioning cards.
Chapter 4: ChartView Software Reference includes information regarding Ch artView, ChartView Plus,
ChartViewNET, and ChartViewNET Plus. Topics include detailed explanations of the program’s pull-down
menus, toolbar icons, and keypad control options.
Chapter 5: PostView explains how to use this independent program to view charts recorded by the ChartView
programs.
Chapter 6: Calibration explains how to use ScanCal, a software-automated method of calibration, as well as how to
manually calibrate the master chassis and option cards.
Chapter 7: Hardware provides detailed information regarding NetScan hardware. The chapter includes information
regarding the front and rear panels, two-position voltage selector switch, memory addition, RS-232/422 serial
communication interfaces, digital I/O lines, external TTL connectors, signal conditioning modules, CSN/Exp
expansion chassis (option), and high current CSN/relay card (option).
Appendices
The Appendices provide programming-related information that is not necessary for users of ChartViewNET and
ChartViewNET Plus, but is useful to those wishing to write their own programs. The appendices are arranged as
follows:
Appendix A: API Commands describes the entire command set for NetScan. Syntax, parameters, interpretation, and
error codes are explained. Sections on the individual commands include their parameters, types, typical use,
related information, and a sample program excerpt.
Appendix B: Ethernet API provides information regarding ethernet-related commands.
Appendix C: Configuration Aspects for Programmers provides information on memory allocation, channel and
scan configuration, triggers, alarms, and digital I/O operation.
Appendix D: Registers, Data Formats, & Queries provides information regarding registers, d ata formats, status and
event reporting, and other operation-related factors.
Appendix E: NetScan Program Examples explains the program examples which are supplied on the release disk.
Typical tasks are covered including various kinds of data acquisition and alarm control.
Appendix F: ASCII Code Summary summarizes ASCCII control codes and character codes.
Appendix G: NetScan Error Messages lists and describes error codes pertaining to NetScan.
Appendix H: Abbreviations
&$87,21
If equipment is used in any manner not specified in this manual, or if specification limits are
exceeded, the function of the equipment, as well as the protection provided by it, may be
impaired.
© 1998 by IOtech, Inc. November 1998 Printed in the United St at es of America
Page 4

Table of Contents
1 Configuring and Starting NetScan
Overview……1-1
Inspect Your System ……1-1
Install Software ……1-2
Check and Install Hardware …… 1-2
Verify Voltage Setting ……1-2
Verify DIP Switch Setting ……1-2
Install Signal Conditioning Card(s) …..1-2
Connect Expansion Chassis (option)…..1-3
Setup for Ethernet Operation…… 1-4
Complete Hardware Setup for Ethernet
Operation…… 1-4
NetScan and TCP/IP Addressing …… 1-8
Protocol …… 1-8
IP Address …… 1-8
Sub-net Mask …… 1-8
Gateway Address …… 1-8
Configuration …… 1-9
Point-to Point Setup…… 1-9
Private LAN Setup …… 1-9
Private LAN Setup wi t h Multiple Networks……
1-10
LAN Setup with Internet Access ……1-10
Connect Channel Signal Inputs……1-10
2 ChartViewNET QuickStart and Tutorial
Overview ……2-1
ChartViewNET, Basic Concepts ……2-1
Configuration Files ……2-1
Groups, Charts, & Channels ……2-2
Three Ways of Using
ChartViewNET
ChartViewNET Tutorial ……2-6
3 - General Information and Specifications
General Description…… 3-1
Operational Aspects…… 3-2
Data Handling and Triggering…… 3-2
Software and Hardware…… 3-3
NetScan Specifications…… 3-3
4 ChartView Software Reference
Overview ……4-1
Groups, Charts, & Channels ……4-2
Three Ways of Using
What ChartView and ChartView Plus Provide
……4-3
Main Window ……4-4
Channel Information Region ……4-6
Status Indicator Region ……4-7
ChartView
……2-3
……4-2
Main Window Toolbar ……4-8
Group Select ……4-8
Start, Pause, and Stop Charts ……4-8
Scroll Faster & Scroll Slower ……4-8
Display Configuration ……4-9
Channel Configuration ……4-15
PostView post-acq data viewer ……4-15
Arm Acquisition ……4-15
Disarm ……4-15
Print Charts ……4-16
Main Window Pull-Down Menus ……4-16
Bar Graph, Analog, & Digital Meters …4-27
Overview ……4-27
Bar Graph Meters ……4-28
Analog Meters ……4-29
Digital Meters ……4-30
Meter Toolbars ……4-31
Meter Pull-Down Menus ……4-31
Meters Configuration Menu ……4-32
Setup Window ……4-33
Channel & Alarm Setup Dialog Box ……4-33
Acquisition Setup Dialog Box ……4-36
Channel Configuration Columns ……4-35
Alarm Configuration Columns ……4-36
Data Destination Dialog Box ……4-39
Data Destination ……4-39
Auto Re-arm (ChartView Plus only ) ……4-39
Why use Auto Re-arm? ……4-40
Disabling Auto Re-arm ……4-40
Chart Setup Wizard ……4-41
Introduction ……4-41
Automatic Chart Setup with Wizard ……4-41
Bypassing Automatic Chart Setup ……4-41
5 PostView
Introduction ……5-2
Starting PostView ……5-3
Toolbar ……5-4
Channel Information Region ……5-5
Menu Items ……5-6
Understanding Groups, Charts, and
Channels ……5-7
Chart Setup Wizard ……5-7
Introduction ……5-7
Automatic Display Creation ……5-8
Display Configuration ……5-9
Editing a Display ……5-10
Manually Creating a Display ……5-12
PostView Timebase ……5-15
ii NetScan User’s Manual
Page 5

6 Calibration
Introduction ……6-1
Calibration Setup ……6-1
Non-Volatile Storage of Calibration Constants
……6-2
Hardware Protected RAM ……6-2
ScanCal Software Application ……6-3
ScanCal’s Main Window ……6-3
Using ScanCal ……6-4
Interface Parameters
System Inventory
Calibration
Calibration Without ScanCal ……6-5
Password ……6-5
Calibration Mode Indicator ……6-5
Command Active Indicators ……6-5
Manual Calibration of Main Unit ……6-6
Offset Calibration of Main Unit ……6-6
Gain Calibration of Main Unit ……6-8
Manual Calibration of
Signal Conditioning Cards ……6-10
Offset Calibration of Cards ……6-10
Gain Calibration of Low Volts Cards ……6-12
Gain Calibration of High Volts Card ……6-15
Cold Junction Calibration ……6-17
Expansion Chassis, CSN/Exp (Option)
……7-17
Connecting the Expansion Chassis ……7-17
Automatic Channel Assignment ……7-19
Appendices
Appendix A API Commands
Appendix B
Appendix C
Programmers
Appendix D
Queries
Appendix E
Appendix F
Appendix G
Appendix H
Ethernet API
Configuration Aspects for
Registers, Data Formats, &
NetScan Program Examples
ASCII Code Summary
NetScan Error Messages
Abbreviations
7 Hardware Setup
Overview ……7-1
Front Panel ……7-1
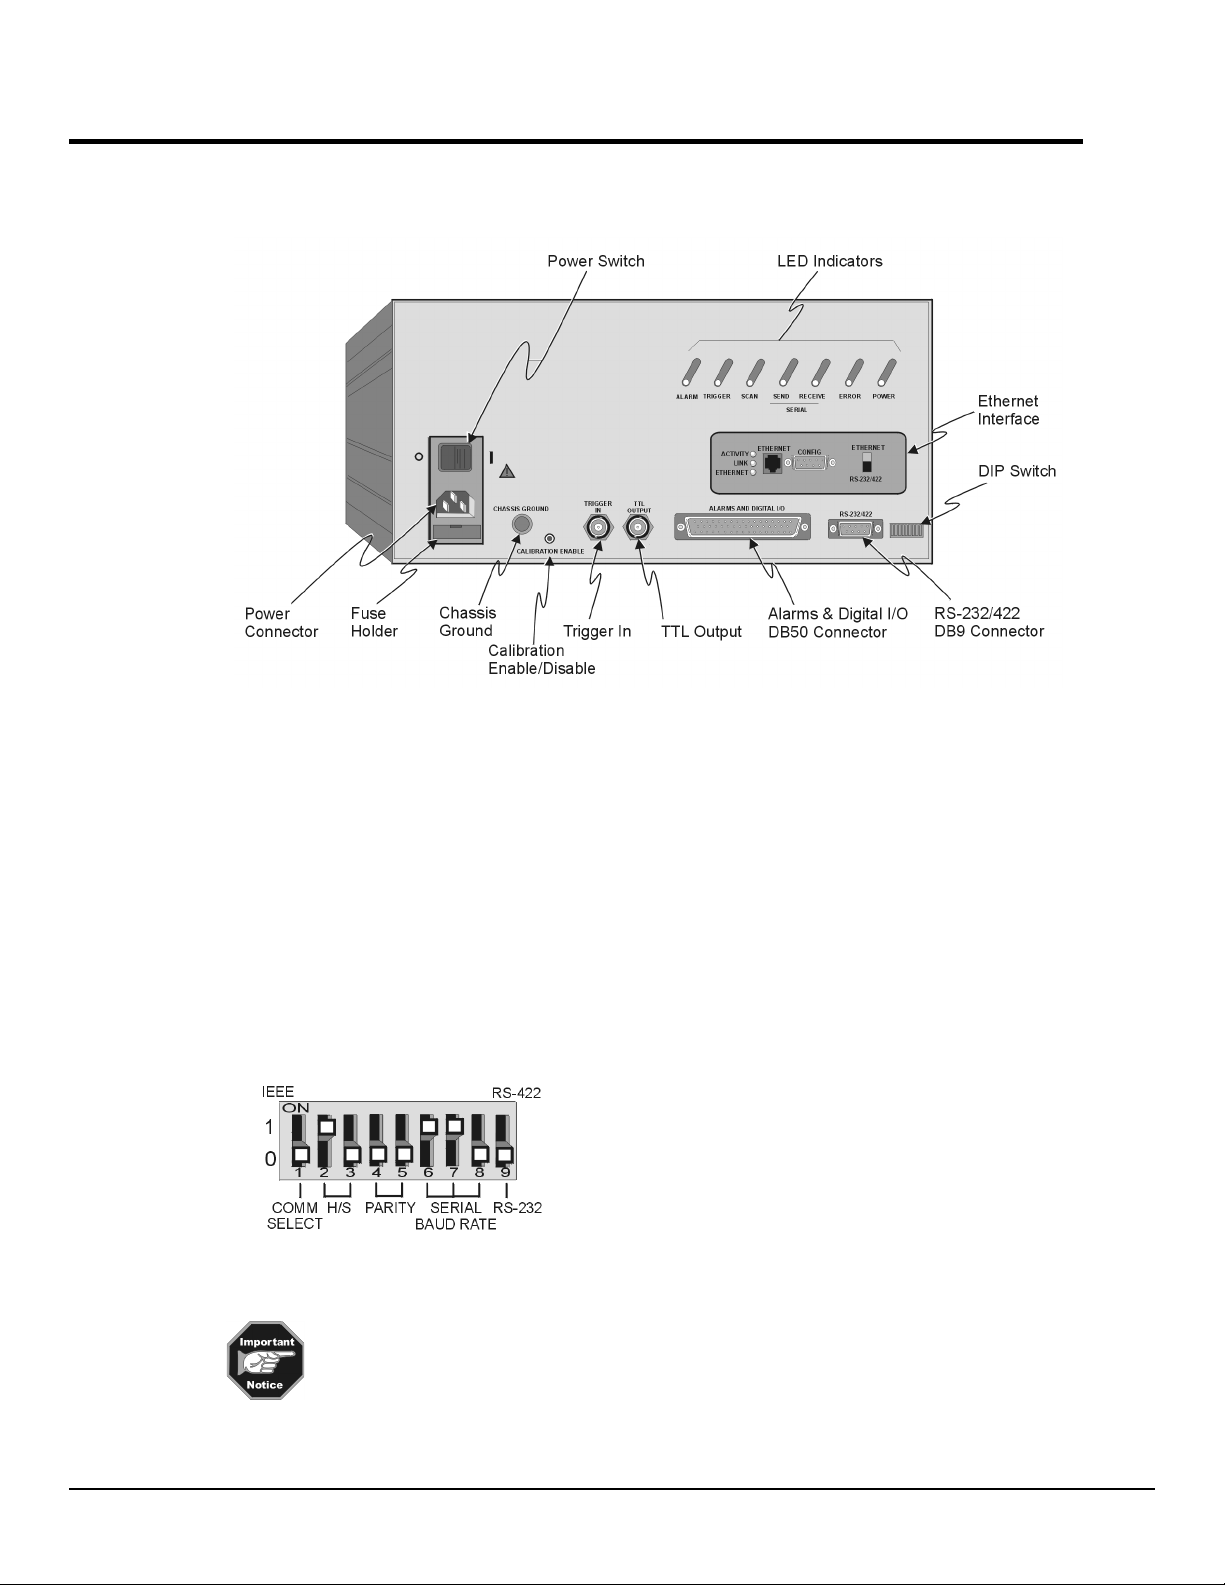
Rear Panel ……7-2
Power Aspects ……7-3
Changing the Voltage Setting ……7-3
Replacing the AC Power Supply Fuse ……7-4
Memory Configuration ……7-4
Expanded Memory Options ……7-4
Calibration Memory Write Enable/Disable
……7-6
Ethernet Interface Configuration ……7-6
RS-232/422 Interface Configuration ……7-6
Configuring RS-322/422 Parameters …… 7-7
Serial Port Pin Connectors ……7-8
Digital I/O Lines ……7-10
Logic Levels ……7-10
Digital I/O Port Pinout ……7-10
External TTL BNC Connectors ……7-11
Signal Conditioning Cards ……7-11
CSN14/TC/P Thermocouple and Low Volts
Card with Subminiature Plugs ……7-12
CSN14/LV/ (T, B, & S) Low Voltage Cards
……7-14
CSN14/HV/S High Voltage Card with Safety
Jack Connectors ……7-15
CSN/Relay Card (for High-Current Digital-
Output) ……7-16
CSN/Relay Card Specifications ……7-17
NetScan User’s Manual iii
Page 6

iv NetScan User’s Manual
Page 7

Configuring and Starting NetScan 1
Overview…… 1-1
Inspect Your System…… 1-1
Check and Install Hardware…… 1-2
Setup for Ethernet Operation…… 1-4
Overview
NetScan and TCP/IP Addressing …… 1-8
Protocol …… 1-8
IP Address …… 1-8
Verify Voltage Setting…… 1-2
Verify DIP Switch Settings…… 1-2
Install Signal Conditioning Card(s)…… 1-2
Connect Expansion Chassis (option)…… 1-3
Complete Hardware Setup for Ethernet
Operation…… 1-4
Install Software/Configure Address Settings
for Ethernet Operation…… 1-5
Sub-net Mask …… 1-8
Gateway Address …… 1-8
Configuration …… 1-9
Point-to Point Setup…… 1-9
Private LAN Setup …… 1-9
Private LAN Setup wit h M ul tiple Networks…… 1-10
LAN Setup with Internet Access ……1-10
Connect Channel Signal Inputs……1-10
For successful operation your computer needs to have the following:
•
10-Base-T Type Ethernet card and cables
•
Available COMM Port
•
PC system with Pentium processor
•
Windows 3.1+, Windows 95, or Windows 98
•
At least 8 Mbytes of RAM for Windows 3.1+ (16 Mbytes recommended)
•
At leasr 16 Mbytes of Ram for Windows95/98 (32 Mbytes recommended)
This chapter explains how to configure NetScan for ethernet use. The chapter provides steps for making proper
connection to the ethernet and includes power up instructions. Note that Chapter 7, Hardware Reference, contains
detailed information pertaining to hardware issues, including setup for RS-232 and RS-422 operation.
Inspect Your System
If you have not already done so, carefully unpack your shipping carton and check all contents for damage which may
have occurred during shipment. Immediately report all damage to the shipping agent and your sales representative.
Retain all shipping materials in case the unit must be returned to the factory.
Each NetScan is shipped with the following:
NetScan Ethernet/Internet-Based Data Logging and Control Instrument
------------------ Signal Conditioning Card(s) pre-installed per customer orde r
1035-0901 NetScan User’s Manual
1035-0601
CN-18-50 DB50 Digital I/O Mating Connector
CA-1 Power Cable
CA-192-5 10-Base-T “straight through” ethernet cabl e, 5 ft.
CA-192-Adapter 10-Base-T “cross-over” adapter
FU-1-.5 1/2A, 250V, Slo Blo, 3AG for 105 - 125V power line or
FU-1-.25 1/4A, 250V, Slo Blo, 3AG for 210 - 250V power line
Programmed Disk Set, includes ChartViewNET Software
NetScan User’s Manual,
11-16-98
Configuring and Starting NetSc an 1-1
Page 8
Check and Install Hardware
Depending on your order, your NetScan unit may not require all the steps under this heading. If a step does
not apply to your unit, simply go on to the next one.
NetScan Rear Panel
Verify Voltage Setting
Based on your order, your NetScan system was set at the voltage indicated on the sticker (located on the
rear of the unit, near the power switch). Verify that the voltage value indicated on the sticker matches the
voltage of your int ended AC power supply. If you need to c hange the voltage selection for a ny reason, refer
to Chapter 7’s section entitled, Power Aspects, Changing the Voltage Setting.
Verify DIP Switch Settings
The DIP switch is located on the lower right corner of NetScan’s rear panel. Default settings are as follows.
Note that micro-switch #1 must be set to the “0” position. The IEEE position does not apply to NetScan.
The IEEE position does not apply to NetScan.
Selection
COMM SELECT
HANDSHAKE (H/S)
PARITY
BAUD RATE
RS-232/422 SELECT
NetScan, Default DIP Switch Settings
MicroSwitch #
1
2,3
4,5
6,7,8
9
Setting
0 – Required for NetScan
1,0 – Hardware Handshake
0,0 – No Parity
1,1,0 – 19200 Baud
0 – RS-232 position
1-2 Configuring and Starting NetSc an NetScan User’s Manual
Page 9
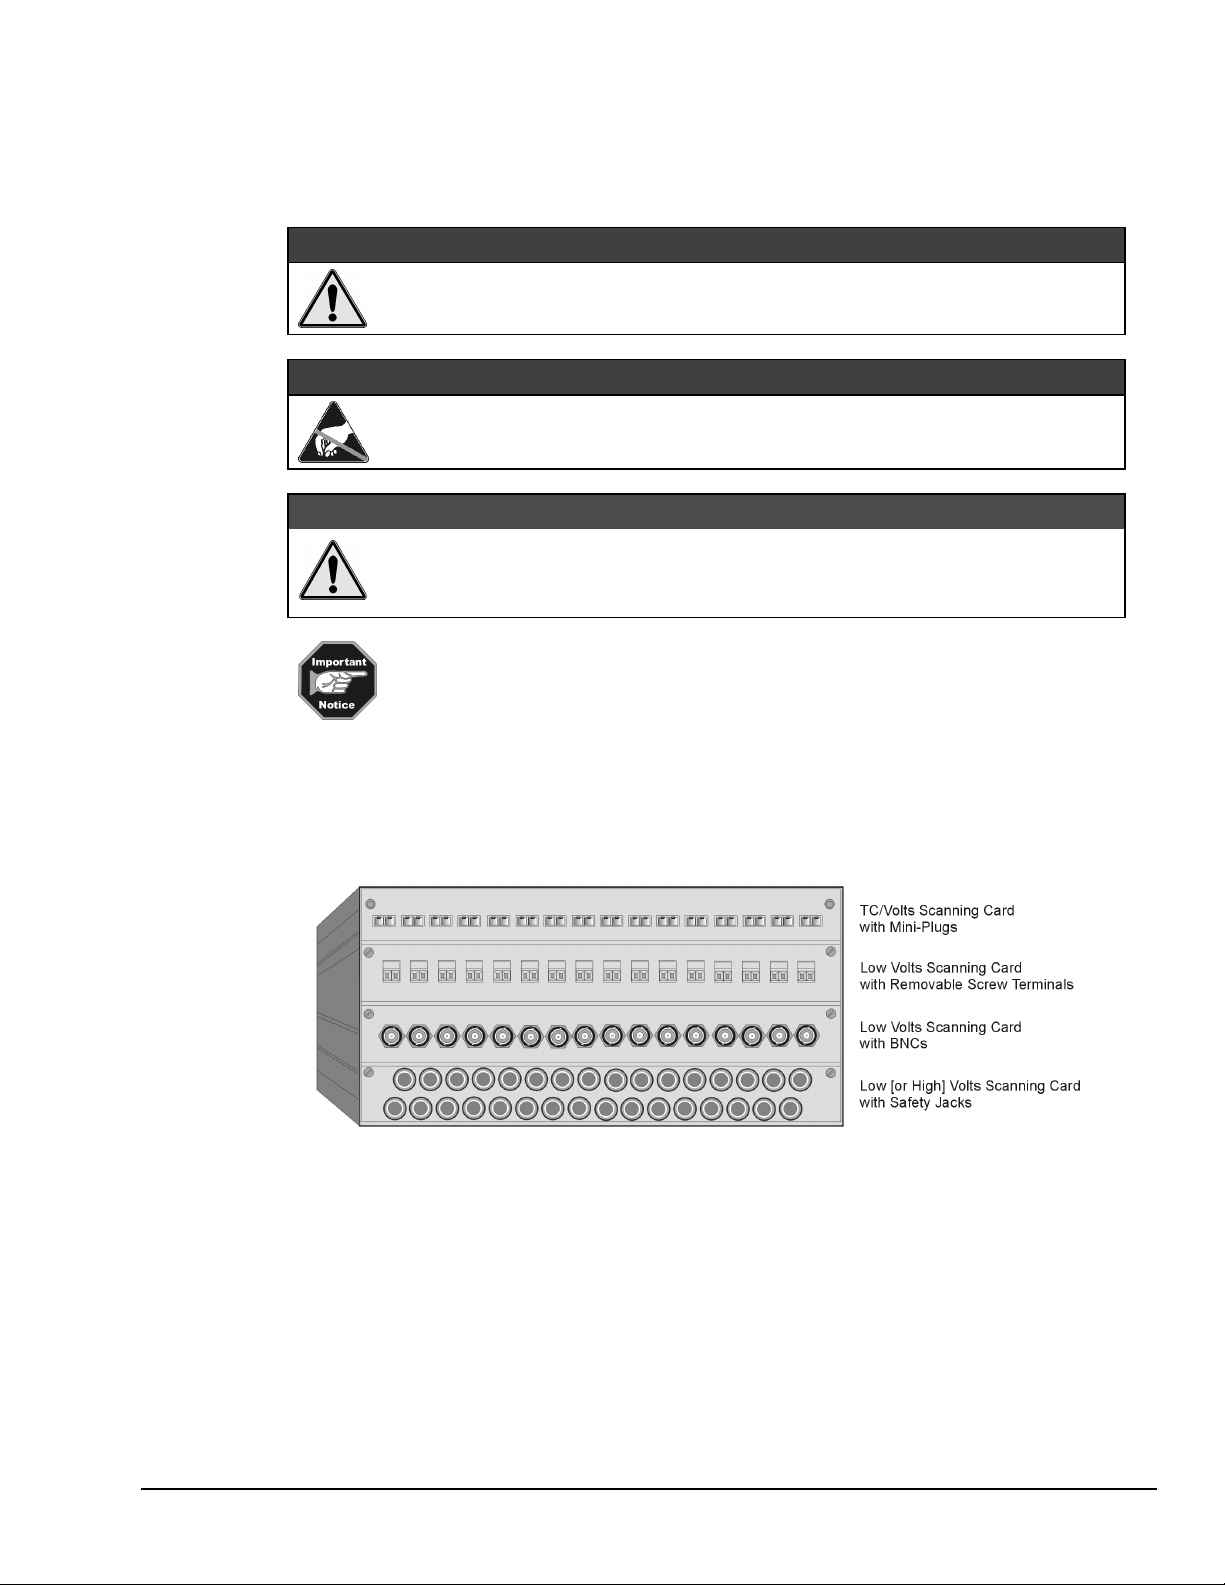
Install Signal Conditioning Card(s)
Signal conditioning cards are pre-installed per customer order. However, if you need to install a signal
conditioning card, or CSN/Relay card, perform the following steps. Repeat the steps for additional cards,
and for placing cards into the optional CSN/Exp expansion chassis, if applicable.
Ensure NetScan is powered down and not connected to any power source prior to
installing or removing a card. Failure to do so could cause equipment damage.
Use approved ESD precautions, including static-free work area and grounded wrist
strap, when handling circuit boards and electronic components. Failure to do so
could cause equipment damage due to electrosta t ic discharge.
Only one CSN/Relay card can be used in a NetScan system. Attempts to install the
CSN/Relay card in a slot other than slot #1 of NetScan’s main unit can cause
equipment damage.
The CSN/Relay card, if used, must be installed in the bottom slot of the main unit.
Aside from this requirement, cards may be installed in any slot.
&$87,21
&$87,21
&$87,21
1. Ensure NetScan is powered down and not connected to any power source.
2. With channel labels oriented upright, carefully slide the card into the unit, and along the card support
grooves. Gently force the card to engage its edge connector with NetScan’s internal mating connector.
3. Tighten the external screws snug, at each end of the card.
NetScan Front Panel, One of Many Possible Set-ups
Connect Expansion Chassis (option)
If you ordered a expansion chassis (CSN/Exp), please refer to Chapter 7 for installation instructions.
NetScan User’s Manual Configuring and Starting NetSc an 1-3
Page 10
Setup for Ethernet Operation
Complete Hardware Setup for Ethernet Operation
If you want to operate your NetScan unit independent of (not-connected to) the ethernet,
refer to Chapter 7 for serial operation.
If you ordered a expansion chassis (CSN/Exp), please refer to Chapter 7 for installation
instructions.
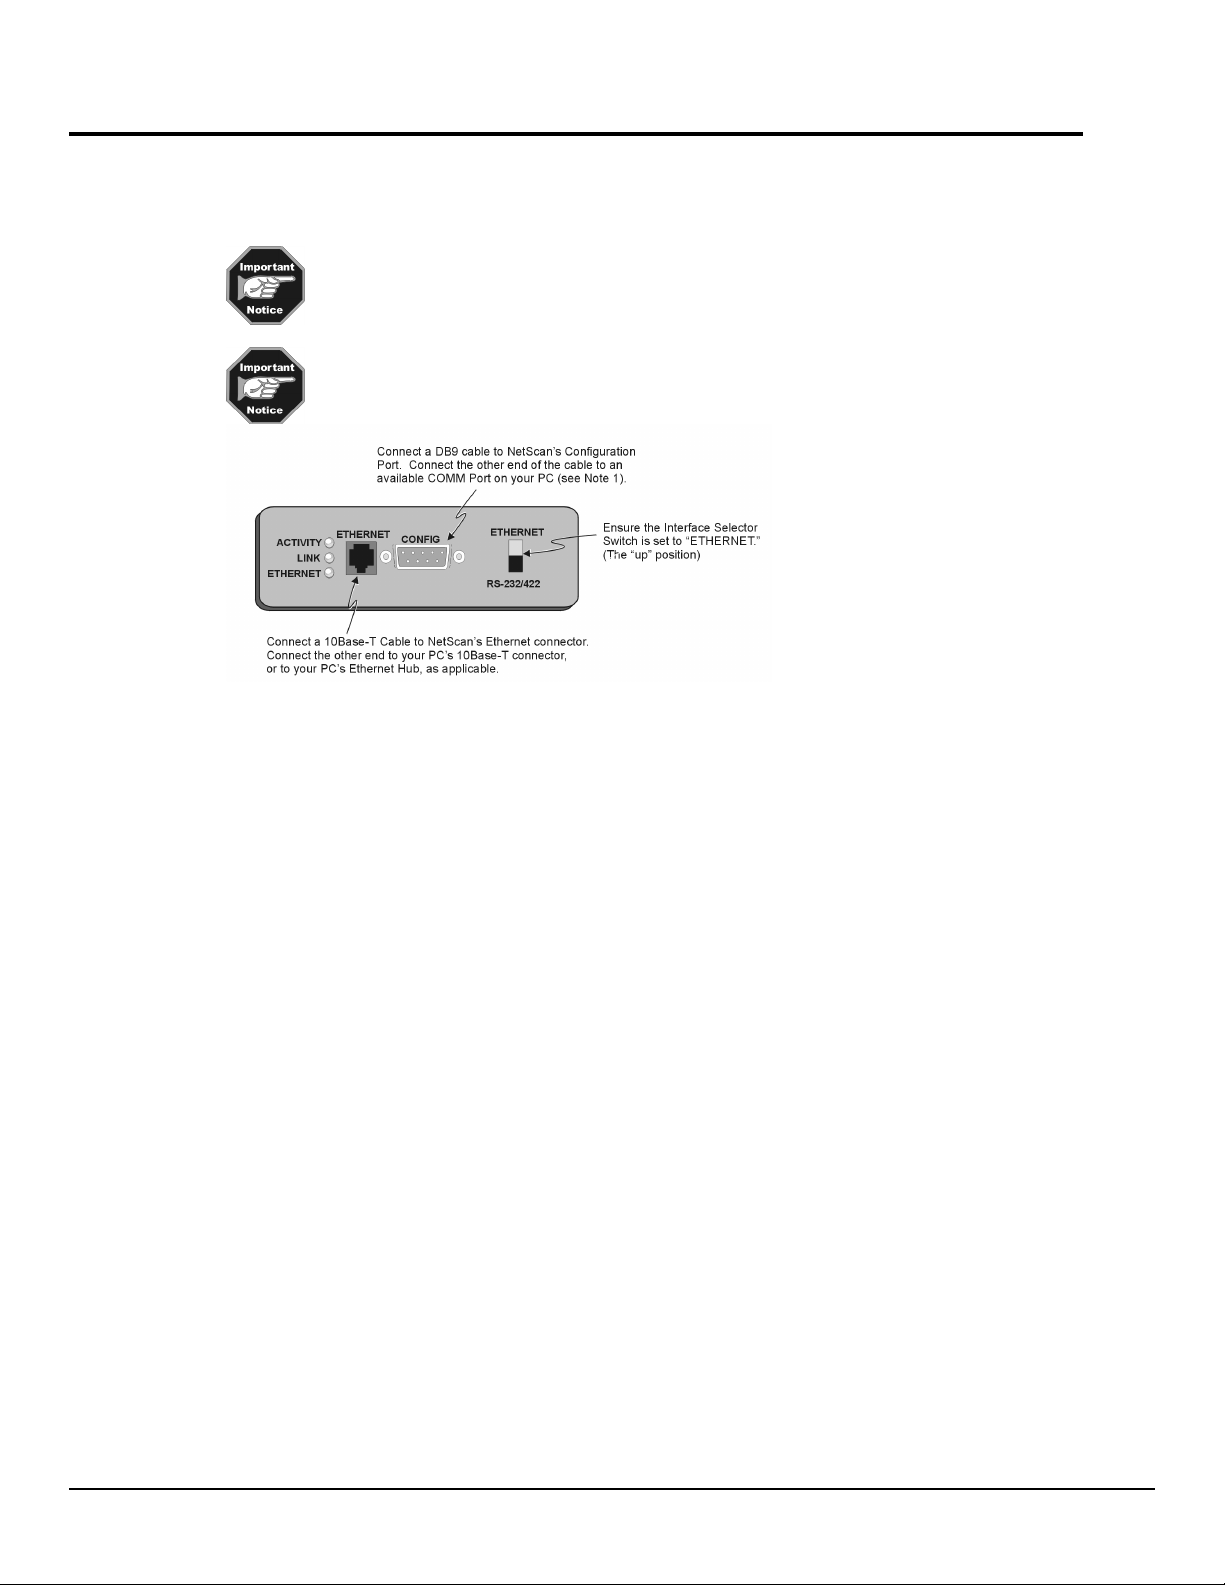
Note 1:
NetScan’s CONFIG Port is
required only during initial
configuration.
Note 2:
directly to your PC’s ethernet
connection, a 10-Base-T cross-over
adapter (or a cross-over cable)
must be use d.
Initial Connections for Ethernet Setup
Perform the following hardware-related steps to setup NetScan for ethernet operation.
1. If connecting NetScan directly to your PC:
(a) connect the cross-over adapter (CA-192-Adapter) to your PC’s ethernet connector
(b) connect the “straight-through” 10-Base-T type cable (CA-192-5) to NetScan’s ETHERNET Port
(c) connect t he other end of t he straight-through c able to the the cross-over adapter.
Option: A 10-Base-T cross-over cable may be used in place of an adap ter with straight-through cable
2. If connecting NetScan to a hub: connect a “straight-through” type 10-Base-T type ethernet cable
(CA-192-5) to NetScan’s ETHERNET Port; then connect the other end of the cable to the PC’s
ethernet hub.
3. Connect a CA-47 cable (or equivalent DB9 cable) to NetScan’s 9-pin sub D CONFIG Port.
4. Connect the other end (DB25 or DB9 connector end) of the CA-47 (or equivalent cable) to an available
COMM Port on your PC. Note that the PC COMM ports can be 25 pin, or 9 pin.
5.
Ensure NetScan’s Interface Selector Switch is set to the ETHERNET (up) position.
6. Make sure NetScan’s power switch is in the “0” (OFF) position.
7. Plug power cord CA-1 into NetScan’s power connector (located on the rear panel). Plug the other end
of the cord into an appropriate power receptacle.
8. Turn NetScan’s power switch to the “1” (ON) position. The Power LED should light up.
The DB9 connection to
If conneting NetScan
At initial power-up NetScan performs automatic self-tests to ensure that it is fully functional. The rear
panel LEDs indicate errors, if they occur. Possible error conditions and their corresponding indicator light
patterns are shown in the following table. Any pattern not shown is an internal error that is not fieldserviceable; in this case, contact the factory. When only the POWER and ERROR LEDs are on, a
configuration error exists as a result of the setup information in NV-RAM.
1-4 Configuring and Starting NetSc an NetScan User’s Manual
Page 11
If you observe a configuration error, perform an error status query (see E? in Appendix A). If you observe
any other type of error condition, make note of the error and contact your service representative.
Error Condition LED Indicators
ALARM TRIGGER SCAN ERROR POWER
General Hardware Failure ON ON -Flash- ON
ROM Invalid for U22, COMM2 -Flash- ON
ROM Checksum Error for
U21 Comm1
ROM Checksum Error for
U22 COMM2
Non-Volatile RAM Error ON -Flash- ON
Dynamic RAM Error ON ON -Flash- ON
Interprocessor COM Error ON ON ON -Flash- ON
Configuration Error ON ON
ON -Flash- ON
ON -Flash- ON
If no problems are found NetScan will begin its power-up initialization. This self-test is performed each
time the unit is powered up regardless of whether power-on was caused by the power switch or the PowerOn Reset (
*R
) co mmand.
During initialization, NetScan self test performs the following steps:
•
Checks for errors at power-up.
•
Checks the flag in the NV-RAM to determine if it should power-up with factory default
settings or a user -defined configur ation.
•
Loads appropriate registers with corresponding values in NV-RAM.
•
Checks a flag to see if alarms should be enabled at power-up, and if so, enables them.
•
Loads channel configuration regi sters.
•
Loads program sequencer with appropriate channel configurations.
•
Resets computations processor to begin acquiring scans.
The self-test takes approximately 5 seconds to complete; after which, NetScan is ready for normal
operation.
Install Software/Configure Address Settings for Ethernet Operation
Be sure you have completed the hardware-related steps on page 1-4 prior to performing
the steps below. Failure to complete the hardware-relat ed steps will result in a
communications error.
Use Microsoft Windows Run dialog box to configure NetScan’s address and install the ChartView program
group. Direct Windows to run the
SETUP.EXE
dialog boxes to complete a successful installation.
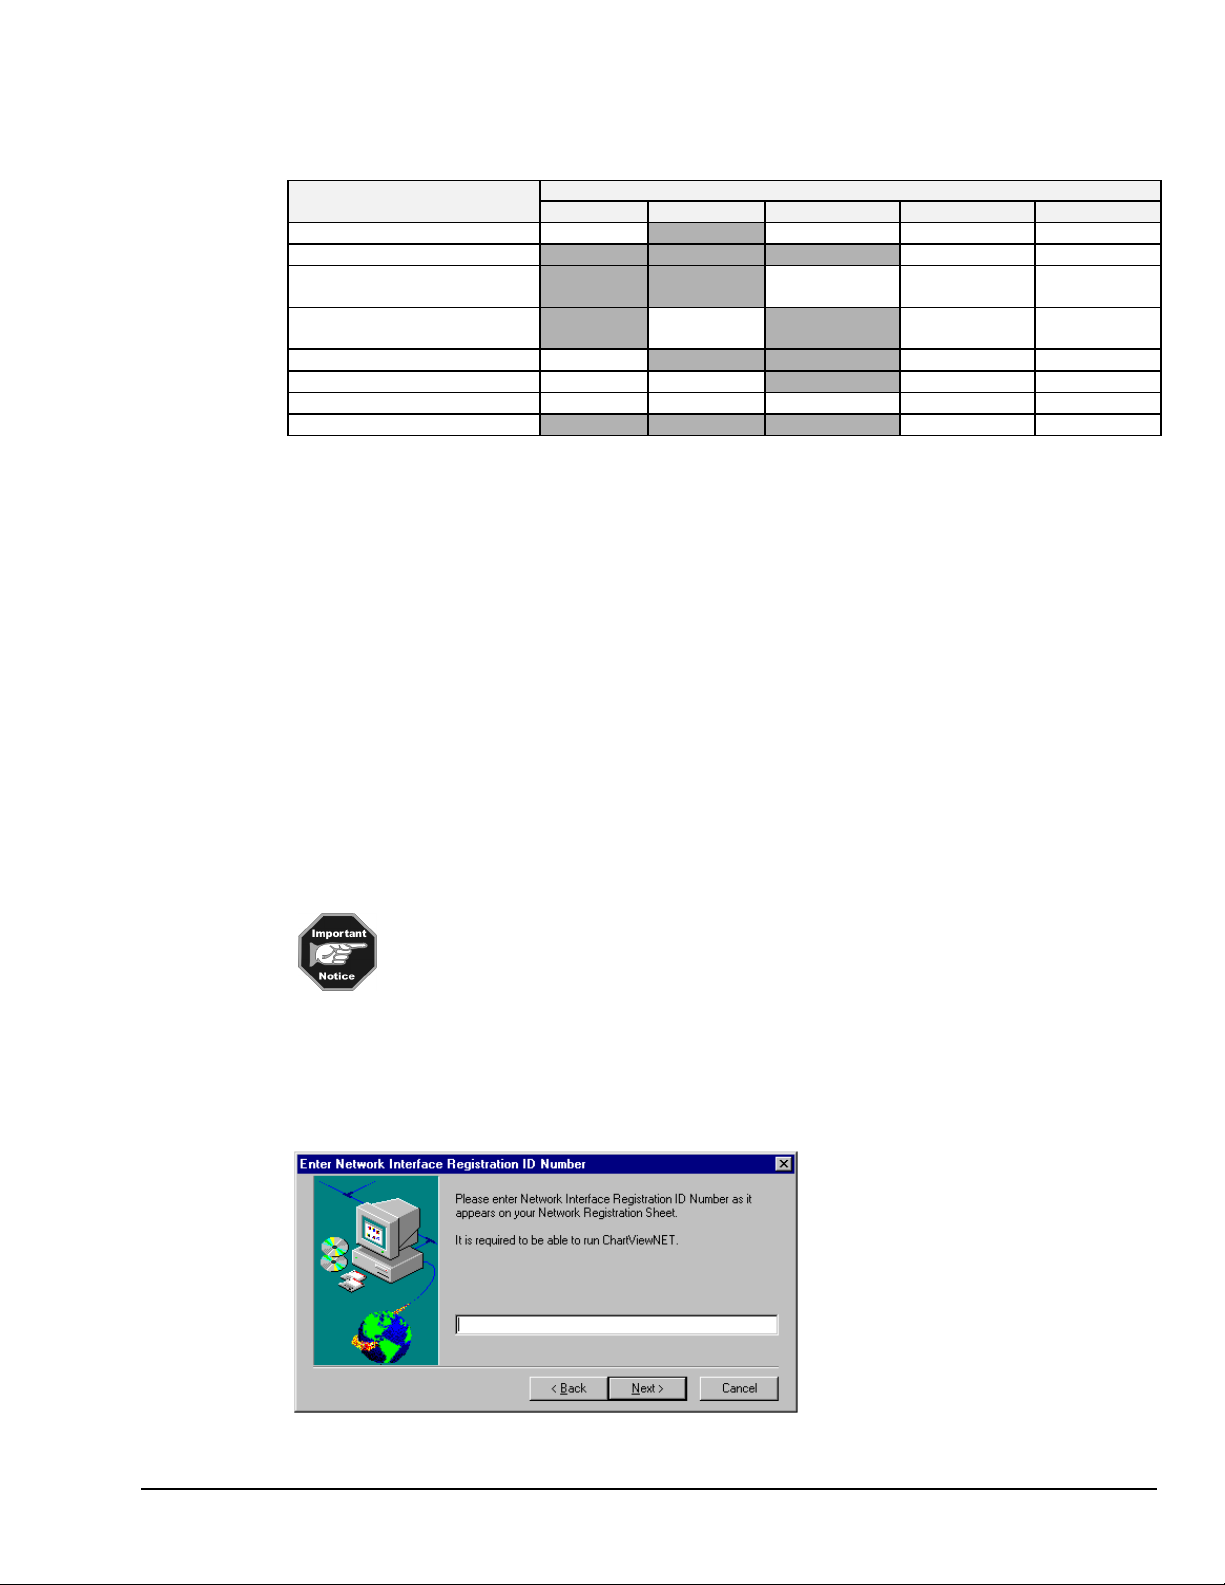
Early in the setup you will be prompted to enter your Network Interface ID Number. This number appears
on your Network Registration Sheet and must be entered to enable ChartViewNET.
file found on Installation Diskette 1. Follow the on-screen
Screen Prompt for Entering the Network Interface Registration ID
NetScan User’s Manual Configuring and Starting NetSc an 1-5
Page 12
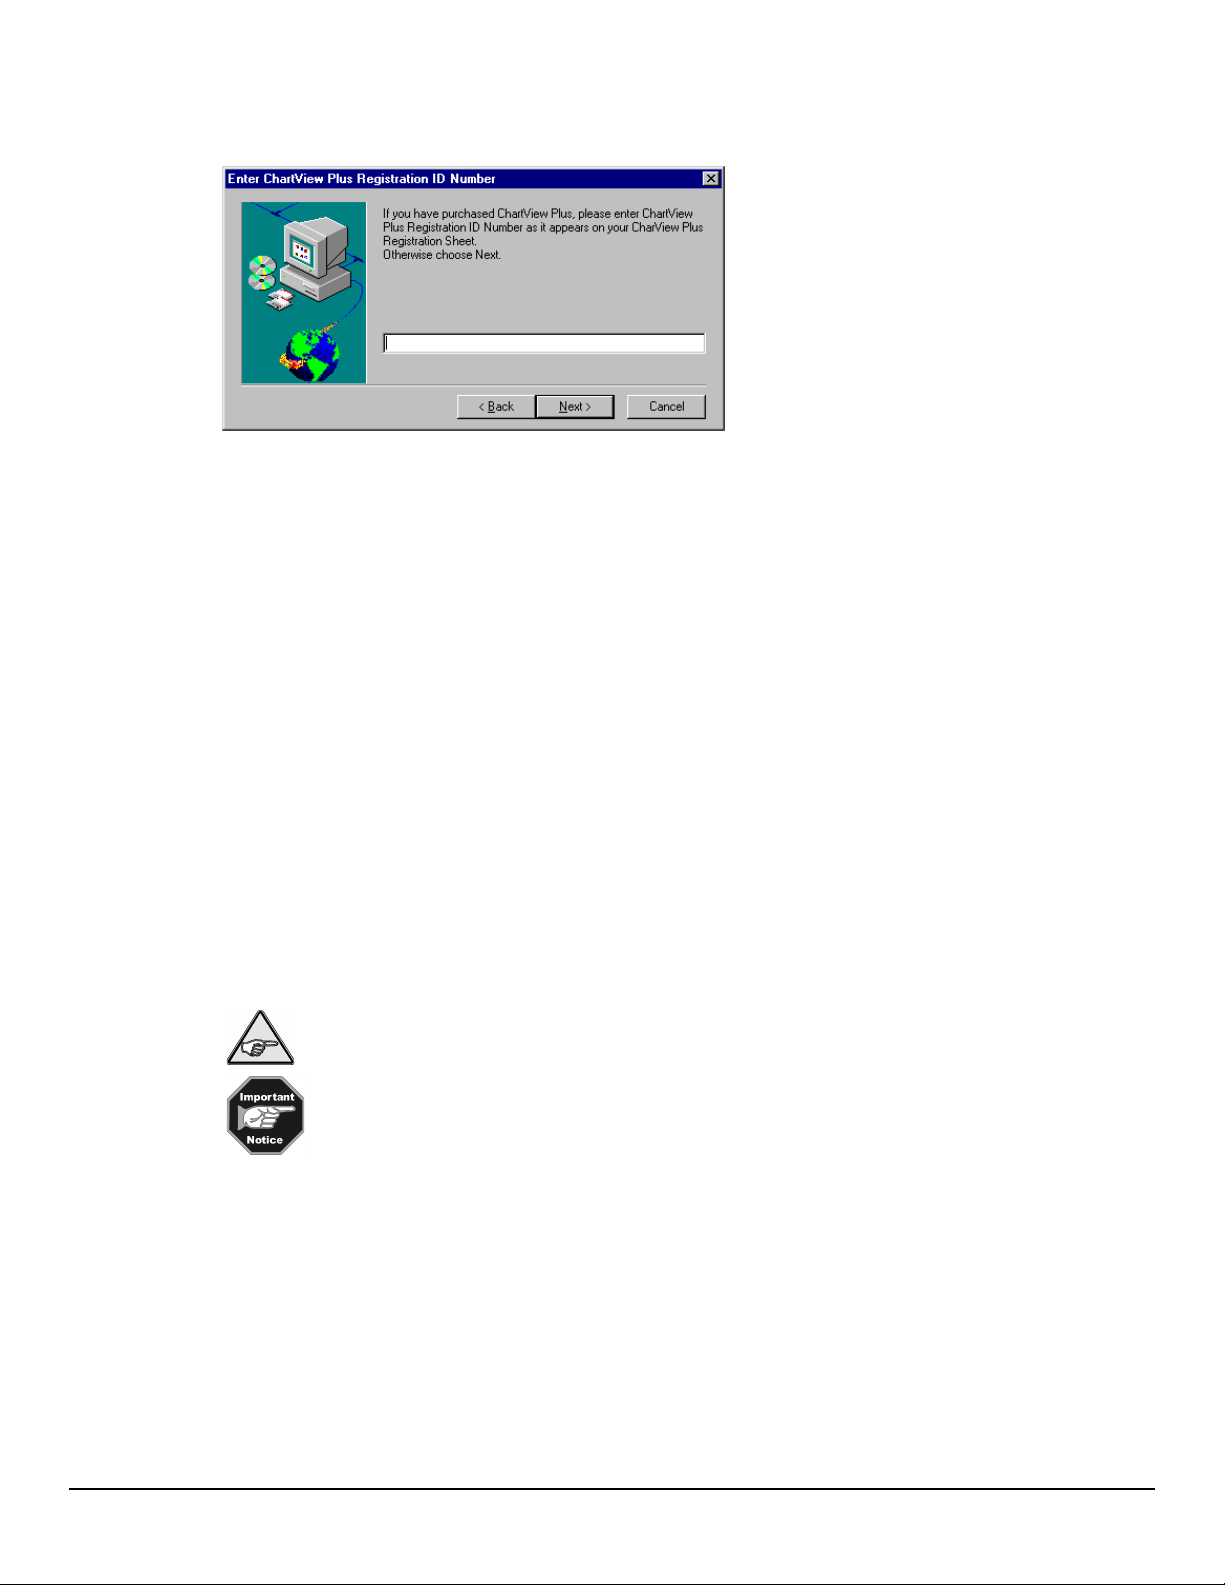
If you ordered ChartView Plus, you must enter the registration ID number as it appears on your
ChartView Plus Registration Sheet. Otherwise, press Next and continue to follow the screen prompts.
Screen Prompt for Entering the ChartView Plus ID
Using the NetScan Configuration Utility
NetScan must be configured before you can use it in the ethernet mode. Configuration is accomplished
through the NetScan Configuration Utility that activates after you select “NetScan” as your device type.
The utility’s window displays a “welcome” prior to prompting you through the required configur ation steps.
The following steps appear in the utility’s screen prompts. Note that each “step” has a corresponding tab
(see follo wing figure).
Note:
The network interface must be properly configured before NetScan can communicate with a
computer via the ethernet. The NetScan Configuration Utility application completes this task by
sending configuration settings from your computer’s serial port to the configuration port (CONFIG)
on NetScan’s Ethernet Interface.
Step 1
Select an available serial communication port (COMM Port) from your computer.
Step 2
a) Disconnect the network cable (10Base-T type) from NetScan’s ETHERNET connector on the Ethernet
Interface portion of NetScan.
b) Cycle NetScan’s power switch “Off,” then “On.”
c) Check (3) the on-screen box that states, “I have performed the actions desribed above.”
Step 3
Basic information regarding TCP/IP Addressing begins on page 1-8. The section includes
definitions and describes four different operating scenarios.
If you have any difficulty regarding address settings, please contact your network
administrator.
a) If necessary, make changes to the address settings, then press the Apply Changes button. You may
need to refer to the TCP/IP informat i on beginning on pa ge 1-8, or contact your network administrator.
b) Press the Next button (see following figure).
1-6 Configuring and Starting NetSc an NetScan User’s Manual
Page 13
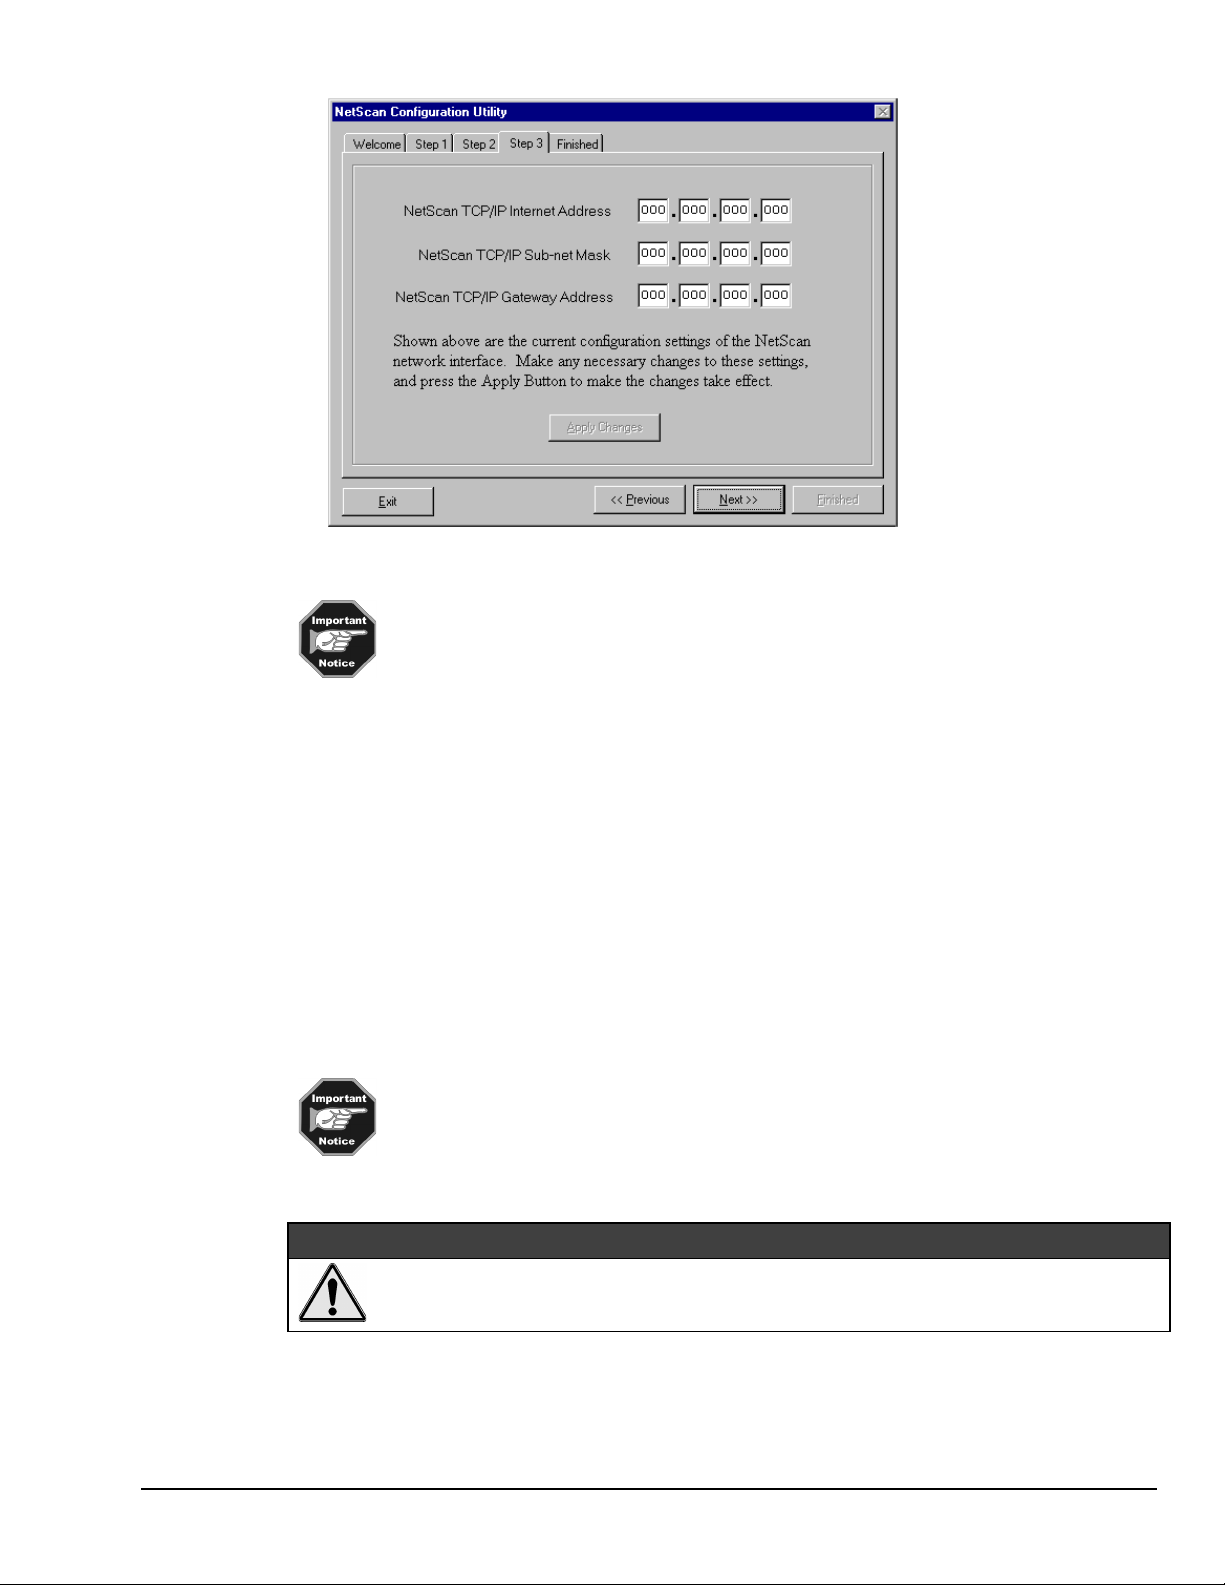
NetScan Configuration Utility, Step 3
You will receive a “>>Communications Error<<” if the NetScan Configuration Utility
fails to communicate with NetScan. Likely causes are:
1) Wrong COMM Port selected in the utility (step1).
2) Serial cable connected to wrong connector on NetScan, PC, or both.
If you received the error message, check system cable connections, correct the problem,
then return to Step 2 and perform the requested actions.
Finished
a) Exit the NetScan Configuration Utility.
b) Cycle NetScan’s power switch “Off” and “On.”
The ethernet interface can now be used.
Follow additional software installation prompts as applicable to your application.
Note:
After you have finished using the NetScan Configuration Utility to complete your unit’s address
settings you can remove the DB9 cable (the cable conecting the computer COMM Port to
NetScan’s Ethernet Interface CONFIG connector).
NetScan’s Ethernet Interface panel contains 3 indicator LEDs. These indicators have the
following meanings when lit:
ACTIVITY
LINK
ETHERNET
– Data is being transmitted over the ethernet.
– There is a good connection to the ethernet.
– NetScan’s ethernet interface mode is enabled and functional.
&$87,21
A flashing ETHERNET LED indicator (located on NetScan’s Ethernet Interface panel)
implies that the NetScan unit could have an interna l malfunction. If the ETHERNET
LED flashes, please turn the unit “Off” and contact your service representative.
NetScan User’s Manual Configuring and Starting NetSc an 1-7
Page 14

NetScan and TCP/IP Addressing
Protocol
The NetScan uses TCP/IP (Transport Control Protocol/Internet Protocol) for communications over the
ethernet. You can access NetScan devices from virtually anywhere in the world since the World Wide Web
uses this same protocol.
TCP/IP addressing consists of three parameters: the IP address, the Sub-net Mask, and the Gateway
Address. Each of these parameters consists of four different numbers which range from 0 to 255. The
numbers are typically represented in a dotted decimal format, for example: 192.88.247.11.
IP Address
The IP (Internet Protocol) is a device address that is unique to one specific device located on the network.
A device’s IP address can not be shared by any other device on the network. The only restrictions on the IP
address are:
1) the first number must be between 127 and 255
2) the last number must be between 1 and 254.
Sub-net Mask
The Sub-net Mask determines how many addresses are on the network. Note that Class C networks consist
of up to 256 addresses; and are quite common. For a Class C Network the Sub-net Mask would be
255.255.255.0. All computers on the network must have the same subnet mask.
Gateway Address
A gateway address is needed to a access a device (gateway, or router) that can route traffic from one
network to anothe r. The gateway address is the actual address of the gateway (router) device.
1-8 Configuring and Starting NetSc an NetScan User’s Manual
Page 15
Configuration
1) Point-to-Point Setup
2) Private Local Area Network (LAN) Setup
There are four basic network scenarios that pertain to NetScan ethernet operation. Note that proper TCP/IP
configuration i s extremely important, a nd you must obtain TCP/IP addressing parameters before
configuring the protocol. The rules for configuration differ for each scenario as follows:
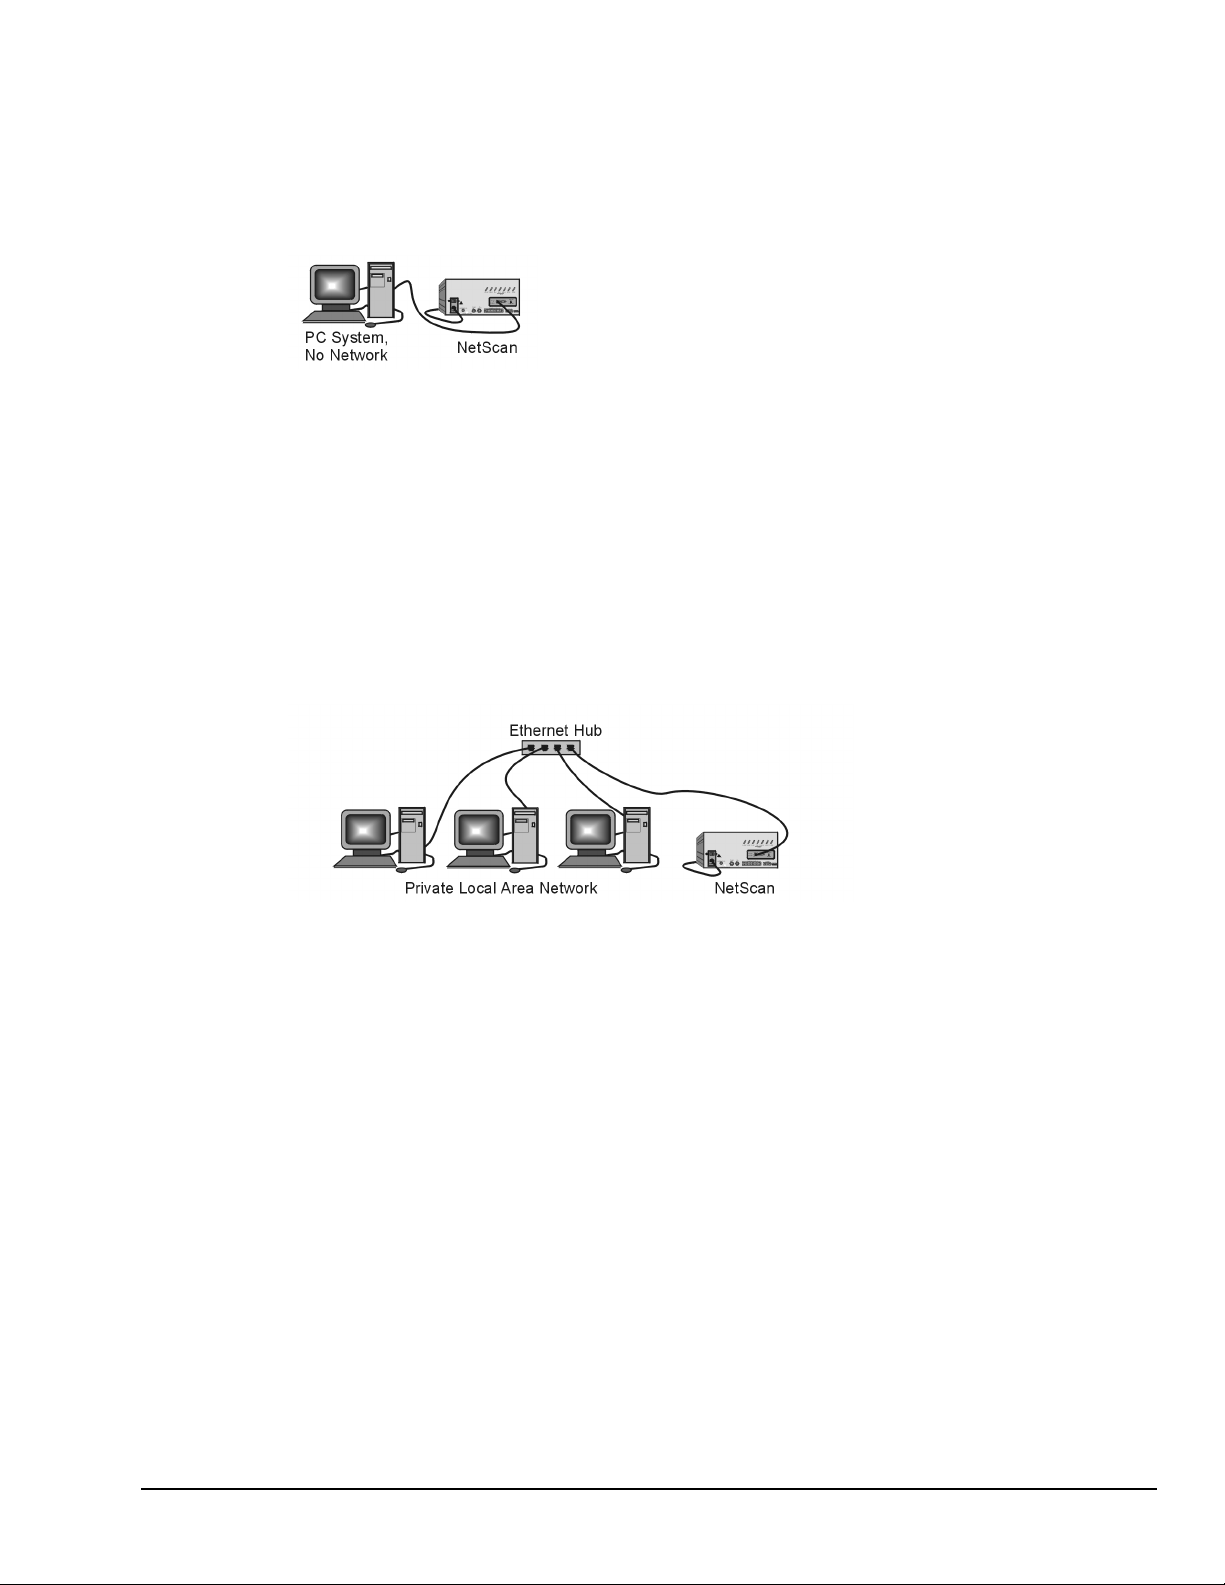
Point-to-Point Setup
In the Point-to-Point scenario, NetScan is connected directly to a PC using a crossover cable. Since there is
no actual network the only requirements are:
1) The first three numbers of NetScan’s IP address must match the first three numbers of the computer’s
IP address.
2) The sub-net mask should be set to 255.255.255.0
3) The gateway address can be omitted.
Example
TPC/IP address set to 192.88.247.1
Sub-net mask set to 255.255.255.0
Private LAN Setup
In this simple LAN scenario, NetScan is connected to a network with several PC’s using the TCP/IP
protocol. These networks typically use a system administrator or network analyst to address TCP/IP issues.
For private LAN setups, requirements are:
1) A unique IP address must be assigned to the NetScan device
2) The first three numbers of the IP address must be the same for all devices on the network
3) The sub-net mask should be set to 255.255.255.0
4) The gateway address can be omitted
Example
TPC/IP address set to 192.88.247.1 for NetScan device
First three numbers of all network devices are 192.88.247
Sub-net mask is set to 255.255.255.0
NetScan User’s Manual Configuring and Starting NetSc an 1-9
Page 16
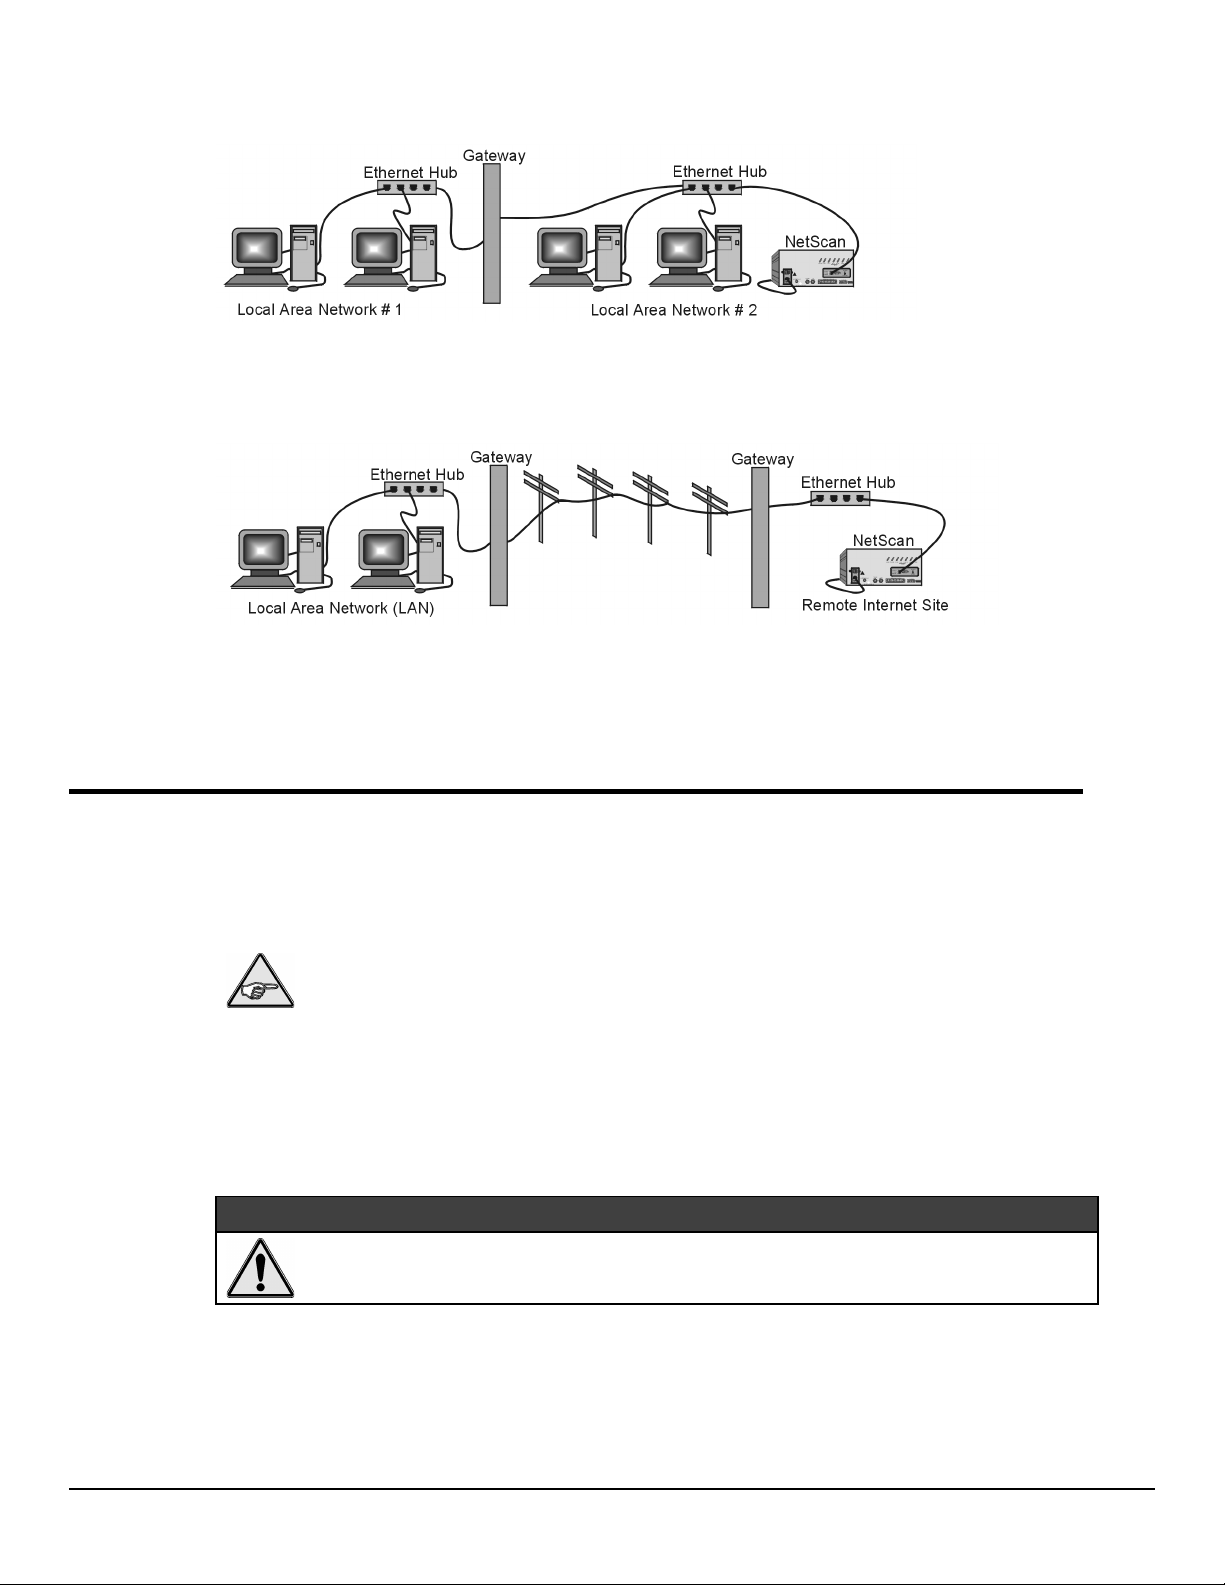
3) Private LAN Setup with Multiple Networks
Private LAN with Multiple Networks
In multiple-network scenarios, two or more networks connect to a common gateway via ethernet hubs. In
regard to multiple networks, a qualified network administrator should assign all TCP/IP parameters.
4) LAN Setup with Intern et Access
LAN Setup with Gateway Access to Internet
In internet access scenarios, a network adminstrator usually assigns T C P/IP parameters. Configuring for
this scenario is identical to that of scenario 2 (Private LAN Setup), with the following exception: The
internet access scenario requires the gateway address to be set to the address of the gateway (router) device
that handles routing to the internet.
Connect Channel Signal Inputs
Connect channel inputs to your signal conditioning cards. Each signal conditioning card can support up to
16 Channels. With use of the expansion chassis, you can have up to 8 signal conditioning cards.
Depending on the type(s) of cards used, your connections will be made via one or more of the following:
screw terminal, mini-plug, BNC, or safety jack type input connector.
Reference Note:
card that can be used with NetScan.
NetScan has eight digital input lines and thirty-two digital output lines available on the rear panel DB-50
connector (see pin-out, below).
Each digital output line will drive five (5) standard TTL loads. All digital input lines are one-eighth (0.125)
TTL loads. All inputs are protected against damage from high static voltage. Normal precautions should be
taken to limit the input voltages to the range of 0.0 to 5.3 volts. All digital I/O lines are referenced to the
connector’s ground pins.
Do not exceed the 0.0 to 5.3 volts levels described above. Exceeding these levels may
damage the NetScan unit in a way not covered by the warranty.
Note:
A CSN/Relay is available for high current alarm output applications. If used, this card must be
installed in the bottom slot of the NetScan’s main chassis. Installation instructions for CSN/Relay
are on page 1-3 of this manual. Refer to chapter 7 for detailed information regarding the
CSN/Relay card.
Chapter 7 contains information regarding each type of signal conditioning
&$87,21
1-10 Configuring and Starting NetSc an NetScan User’s Manual
Page 17
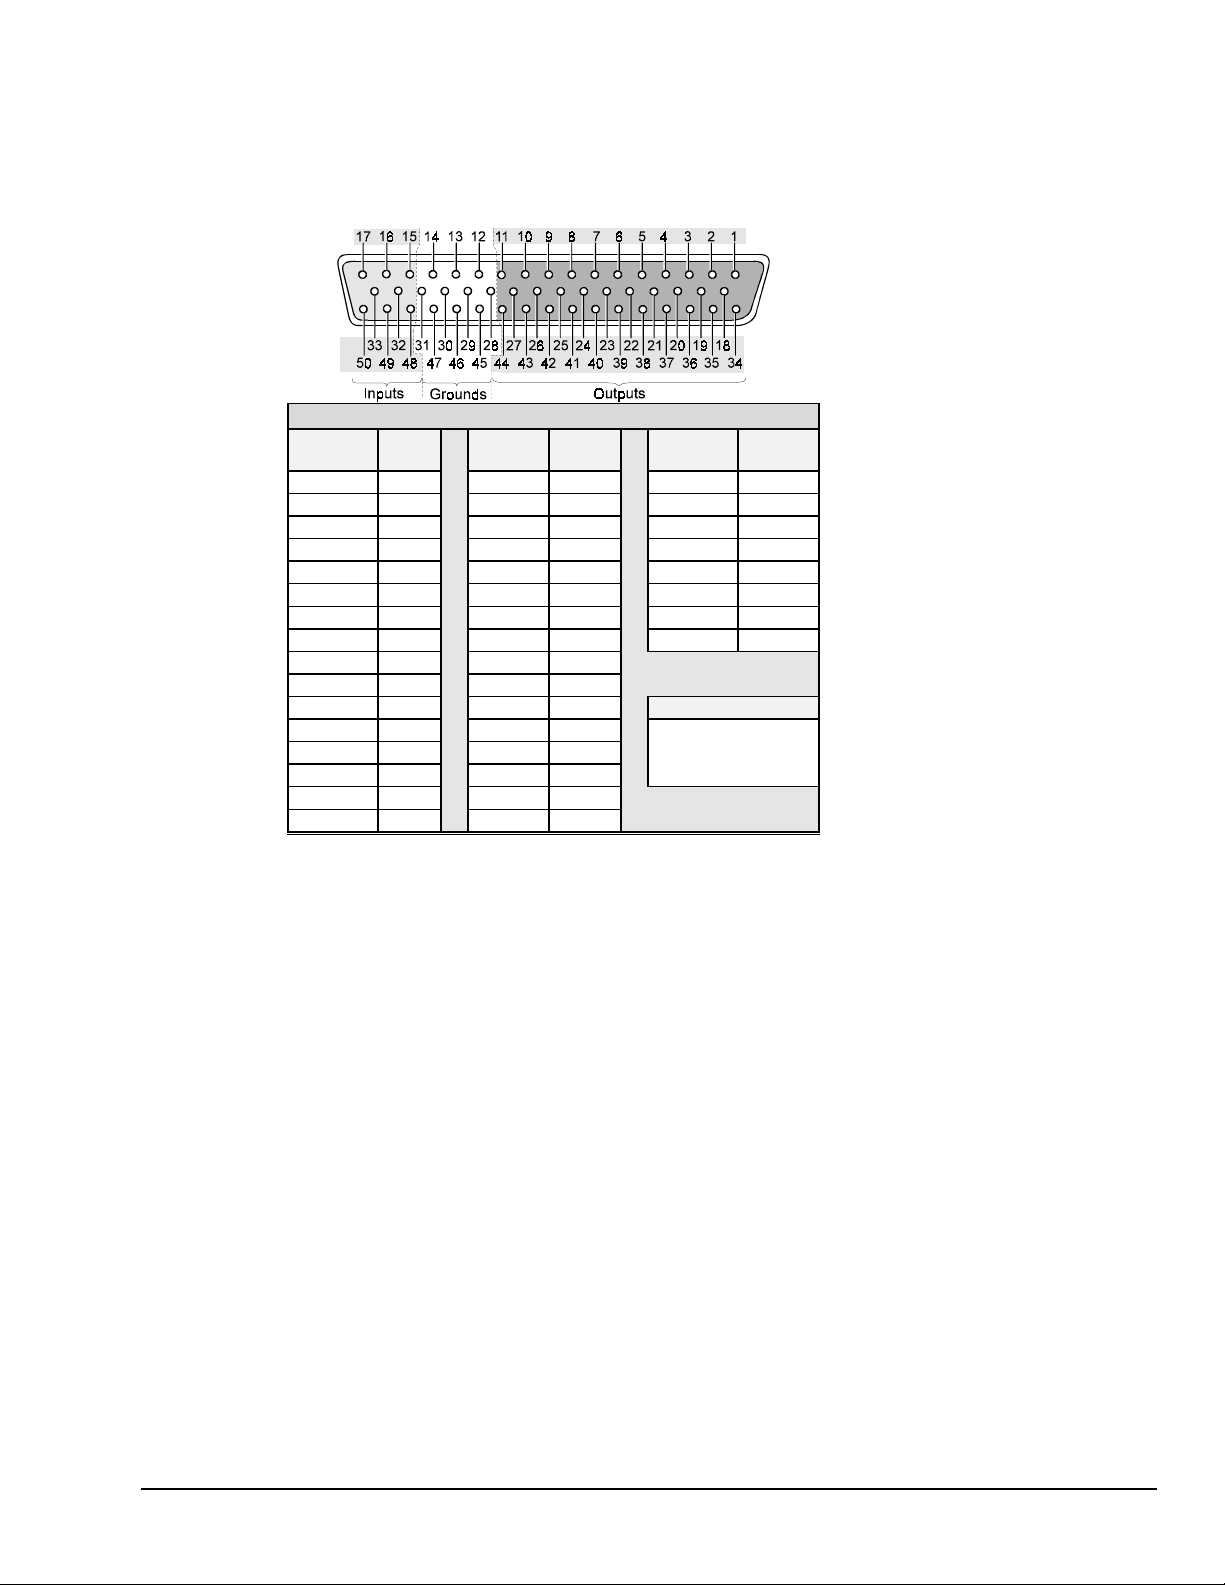
The following figure and table identify pin locations for outputs, inputs, and grounds associated with the
DB50 conne ctor. Outputs 1 through 32 ar e typically used for a larms 1 through 32, respectively. O ut puts
1 through 16 can be used with the relay card option. Chapter 7 contains add itional information.
DB50 Pin Descriptions
Output
Signal
11 17 39
234 18 23
318 19 7
42 20 40
535 21 24
619 22 8
73 23 41
836
920
10 4
11 37
12 21
13 5
14 38
15 22
16 6
Pin
No.
Output
Signal
Pin
No.
Input
Signal
Pin No.
115
248
332
416
549
633
717
24 25 850
25 9
26 42
27 26
Ground Pins
28 10 12, 13, 14,
29 43 28, 29, 30, 31,
30 27 45, 46, 47
31 11
32 44
NetScan User’s Manual Configuring and Starting NetSc an 1-11
Page 18

−
Notes
1-12 Configuring and Starting NetSc an NetScan User’s Manual
Page 19

ChartViewNET Quick Start and Tutorial 2
Overview ……2-1
ChartViewNET, Basic Concepts ……2-1
Configuration Files ……2-1
Understanding Groups, Charts, & Channels ……2-2
Three Ways of Using ChartViewNET ……2-3
ChartViewNET Quick Start ……2-3
ChartViewNET Tutorial ……2-6
Overview
This chapter provides the steps to connect, power up, and run NetScan using the TCP/IP protocol.
Although there are many ways to configure NetScan, this Startup is intended for a simple setup. In addition
to the following steps, this chapter includes a section on basic concepts and a ChartViewNET tutorial. These
are provided to help you gain a better understanding of the ChartView program. Note that Chapter 7,
Hardware Setup, contains detailed information pertaining to hardware issues and includes RS-232 and
RS-422 information.
ChartViewNET, Basic Concepts
An understanding of several basic concepts will help you master ChartViewNET more quickly, and should
be understood before proceeding with the tutorial.
ChartViewNET refers to a ChartView program that has the network feature of the program
activated, much like ChartView Plus refers to a ChartView program that has the enhanced
Configuration Files
ChartView makes use of one or more “user transparent” configuration files. Configuration files maintain
information regarding various aspects of your setup, serving as an initialization file for subsequent
ChartView startups. These files can be recognized by their
When you run ChartView for the very first time there will be no configuration file; however, one
Note:
chart feature of the program activated. The NET and Plus features are each activated by
separate registration ID codes; thus it is possible to have ChartViewNET Plus (when both
codes are used). For ease of discussion, this chapter’s use of the term ChartView also refers
to ChartViewNET; and ChartView Plus refers to ChartViewNET Plus.
will automatically generate and be saved after each use of the program.
.cvw
extensions.
NetScan User’s Manual,
11-16-98
2-1
Page 20
ChartView uses
Chartvw.cvw
as a default configuration file. This file maintains a location for ChartView
configuratio n information including:
Device Interface Mode
•
Hardware Configuration
•
Channel Settings:
•
Acquisition Configuration
•
Data Storage Settings
•
The configuration file ensures that when you restart ChartView, it will be in the same state upon your last
exit. This means that the
Channel Enable/Disable (On/Off)
⇒
Type
⇒
Label
⇒
Units
⇒
Alarm Settings (Limits)
⇒
Hysteresis Setting
⇒
Chartvw.cvw
file will be an updated copy of the configuration file you are using
at the time you exit ChartView.
It is not catastrophic if a configuration file is deleted, since it is a simple task to start ChartView when no
configuration file exists. This is described in the tutorial.
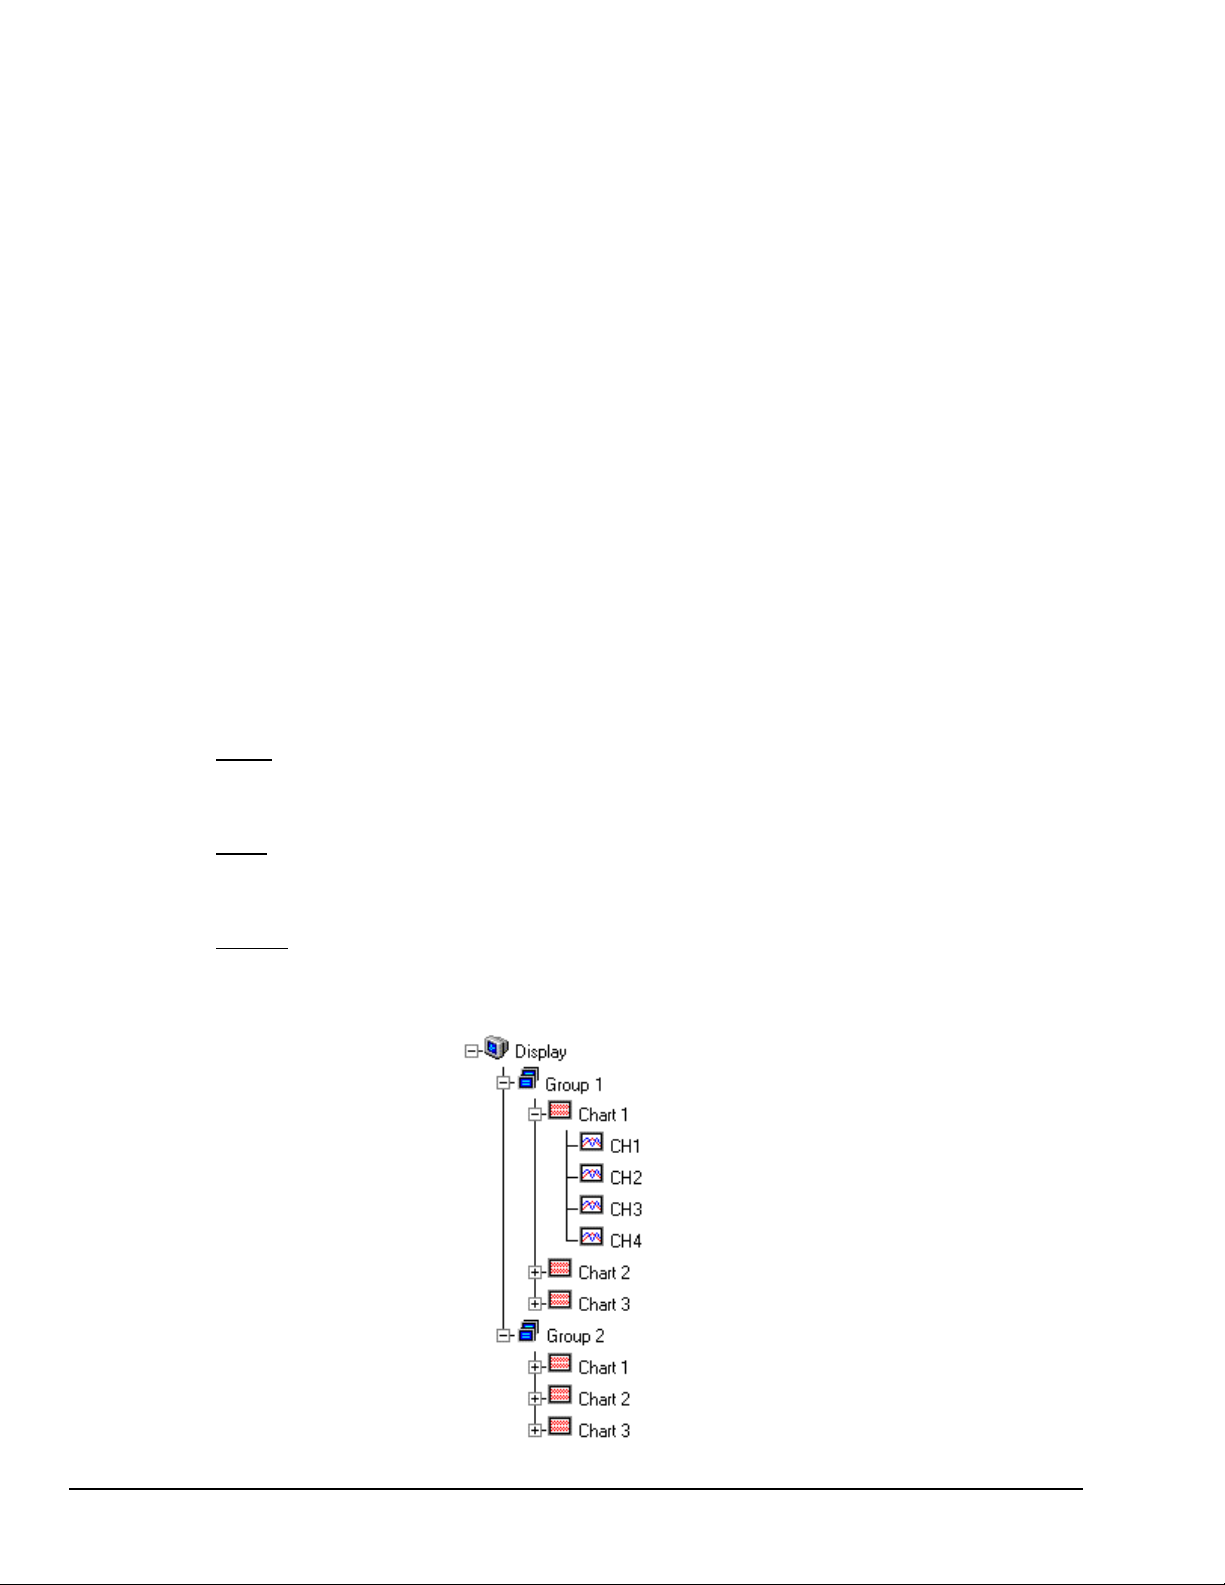
Understanding Groups, Charts, & Channels
When starting the program with no configuration file present, a feature called Chart Setup Wizard is
automatically activated to assist you with your setup. To make the best use of Chart Setup Wizard you need
to understand the relationship of Groups, Charts, and Channels.
ChartView and Chart Setup Wizard are detailed in Chapter 4 of this manual.
Note:
. “Group” refers to a group of charts. ChartView makes use of one chart group. ChartView Plus
Group
allows up to 64 groups, depending on the capabilities of your PC, but only displays data from one chart
group at a time.
. “Chart” refers to display area which reflects real-time channel data values and can be scrolled at
Chart
various rates. One chart can display data from up to four channels. In addition, each chart will display realtime information for a selected channel. You can assign up to 16 charts per group.
Channel
. “Channel” refers to a signal channel. You can have up to 4 channels assigned to one chart.
Channels will be displayed in units of °C, °F, °K, °R, mV, V, or in user-defined units, depending on the
configuration and type of signal conditioning card used. NetScan’s signal conditioning card options are
detailed in Chapter 7.
2-2 ChartView Quick Start and Tutorial NetScan User’s Manual
Page 21

Three Ways of Using ChartViewNet
You can use ChartViewNET to:
•
chart and monitor specific channels with no acquisition of data to disk
•
acquire data with no charting or meter use
•
use charting and/or meters while acquiring data to disk
1) Chart channels (and/or monitor with meters) with no ac quisit ion of data to disk
Prior to charting channels on ChartView’s Main Window, you need to configure a display in regard to
groups, charts, and channels . This aspect of configurati on is performed through Chart Setup Wizard
(discussed in the following text), or through a Display Setup dialog box which is accessed through the
Display Configuration Setup button (toolbar, item 7) on ChartView’s Main Window.
In addition to charting channels, you can monitor selected channels via digital, analog, and/or bar graph
meters. Meters are discussed in Chapter 4.
Note:
2) Acquire Data with no charting or meter use
Prior to acquiring data (for saving to disk) you need to configure the acquisition using the Acquisition
dialog box (accessed through the
the related icon button). You can enable the desired channels, assign high and low alarm values from the
channel configuration dialog box.
3) Chart channels and/or use meters while acquiring data t o disk
Prior to using ChartView for charting (and/or meter use) while simultaneously acquiring data to disk, you
need to configure a display and/or meter; as well as configure the acquisition. Note that the channels from
the display setup are automatically enabled. You can enable additional channels from the channel
configuration dialog box (for the data acquisition) to acquire more data; however, these additional channels
will not change your display setup, or the channels being monitored. In other words, you can acquire data
from channels which you do not monitor.
For ChartView Plus users, up to four channels will overlap on their assigned Chart, and will be
visible when the applicable Group is selected.
pull-down menu of ChartView’s Main Window, or through use of
Setup
ChartViewNET Quick Start
Starting ChartView, Configuring the System and Collecting Data
Note:
Use the ChartView icon in Windows to start the ChartView program. ChartView will run using the latest
configuration file. This is a file which is automatically saved upon exiting the program. The configuration file
contains all setup information, including that pertaining to channels, alarms, and acquisition configuration.
When ChartView opens using a configuration file, the program’s main window appears on the screen, as indicated in
the following figure.
Note:
NetScan User’s Manual ChartView Qui ck Start and Tutorial 2-3
The configuration file, discussed in this section, will not be present during your first start of the program.
In the following figure, item 24 (Status LEDs and labels) does not appear when using Windows 3.1.
However, when using Windows 3.1, text will appear in region 24 to inform you of the status. This is in
addition to the text in the Status Message Box (Item 22).
Page 22
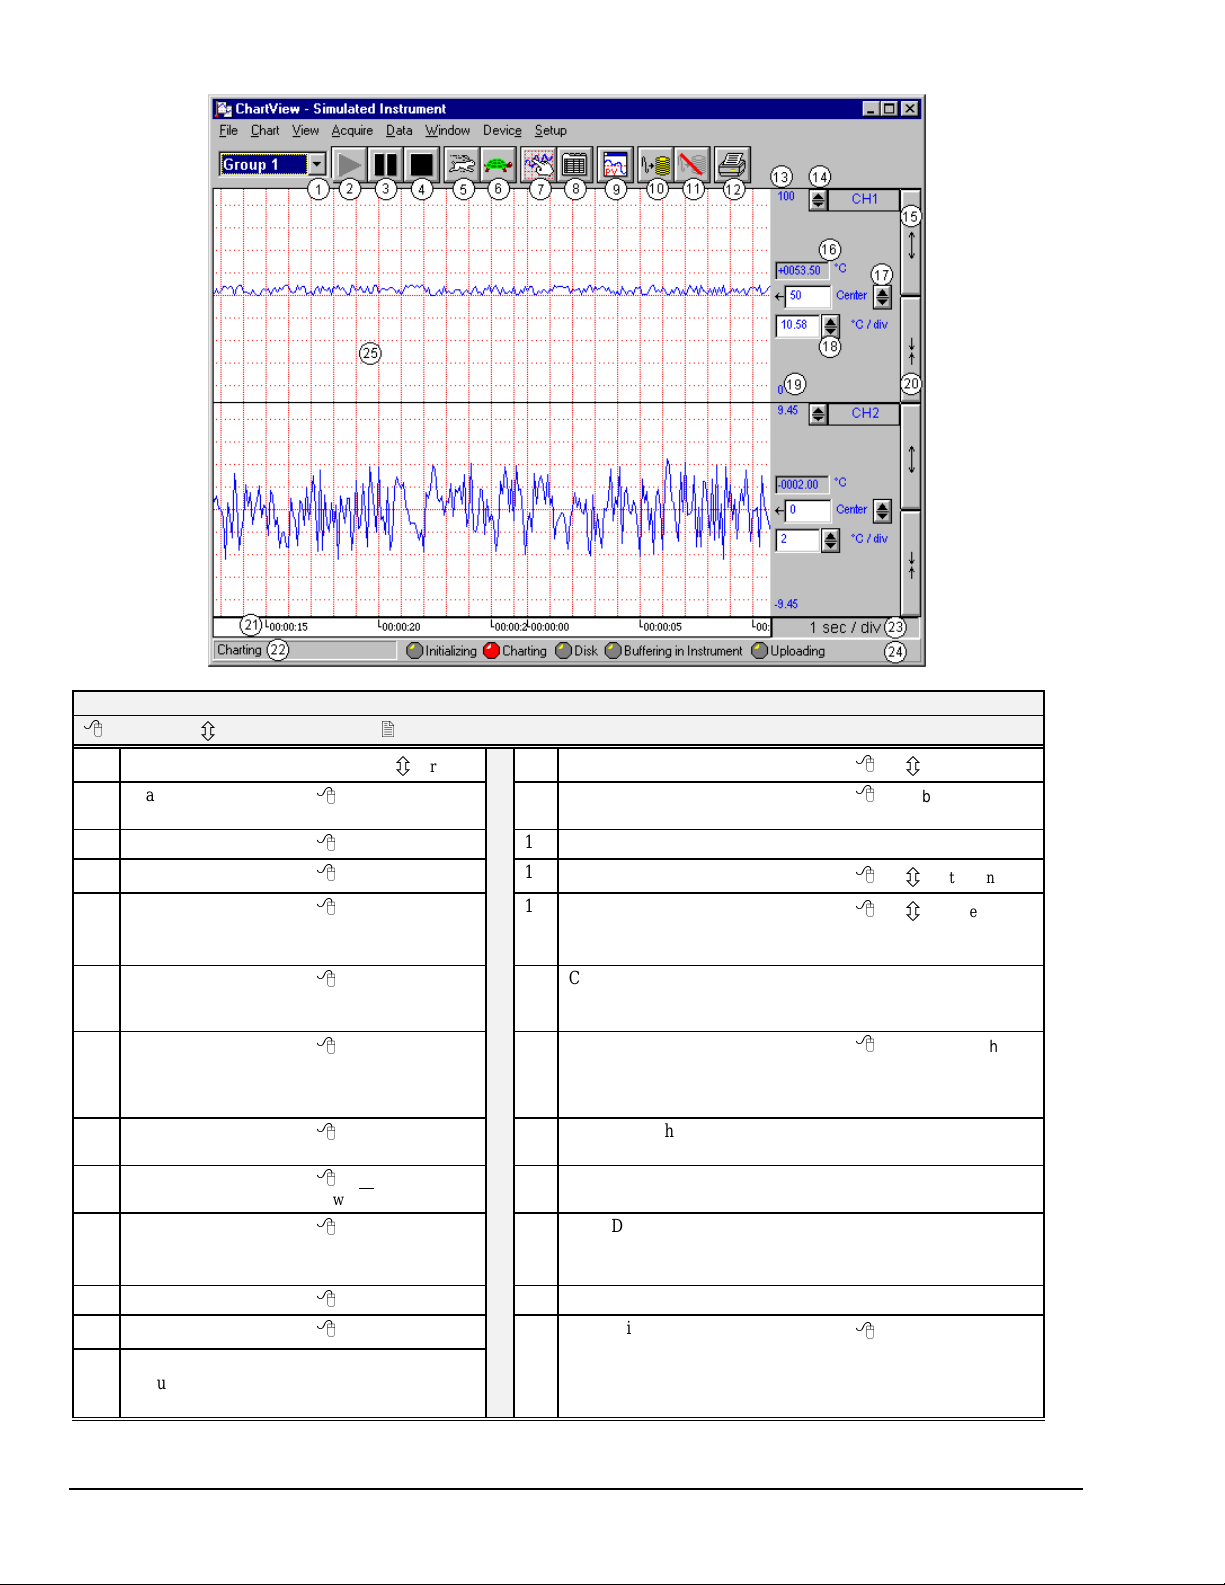
ChartView Main Window
ChartView Main Window Control Options
= Mouse, Ú= Arrow Keypads , = PageUp/PageDown Keypads
1 Group Select
2 Start Charts &
Indicators
3 Pause Charts
4 Stop Charts
5 Scroll Faster
6 Scroll Slower
7 Display Configuration
8 Channel
Configuration
9 PostView post- acq
data viewer
10 Arm Acquisition
11 Disarm …
12 Print Charts
13 Chart Max. Scale
Value (Grid Limit
Line)
or
Ctrl+G, or
and “right-click”
Current group will be
selected.
down menu
From Chart Pull-d own
menu or Chart Setup
Dialog Box
Ú
,
or,
F5
or,
F7
or,
F6
or,
Ctrl+Z
or,
Ctrl+X
or, Pointer over chart
or, Windows Pull-
or,
Ctrl+T
or,
Ctrl+Y
or,
Ctrl+P
14
15
16
17
18
19
20
21
22
23
24
25
Channel Selection
Multiply (x2)
Present Value of Selected Channel
Center (Value at Chart Mid- Lin e)
Units/Division
(Vertical increment per one grid
box)
Chart Min. Scale Value (Grid Limit
Line)
Divide (÷2)
Time Scroll (hr:min:sec)
Status Message Box
Time/Division (Chart Speed),
the Horizontal increment p er gri d
box
Status LEDs
Chart Display
Double-click left mouse button in selected chart to zoom in or zoom
back out. Right-click to bring up Chart Setup Dialog Box with the
current group and target chart selected.
or,
Ú
or,
[Tab to and hit
Spacebar]
N/A
or,
From Chart Pull-d own
menu or Chart Setup
Dialog Box
Spacebar]
Thru Pull-Down Menus
only
N/A
Ctrl+Z (Faster)
Ctrl+X (Slower)
N/A
, or type-in
Ú
or,
, or type-in
Ú
or,
[Tab to and hit
2-4 ChartView Quick Start and Tutorial NetScan User’s Manual
Page 23
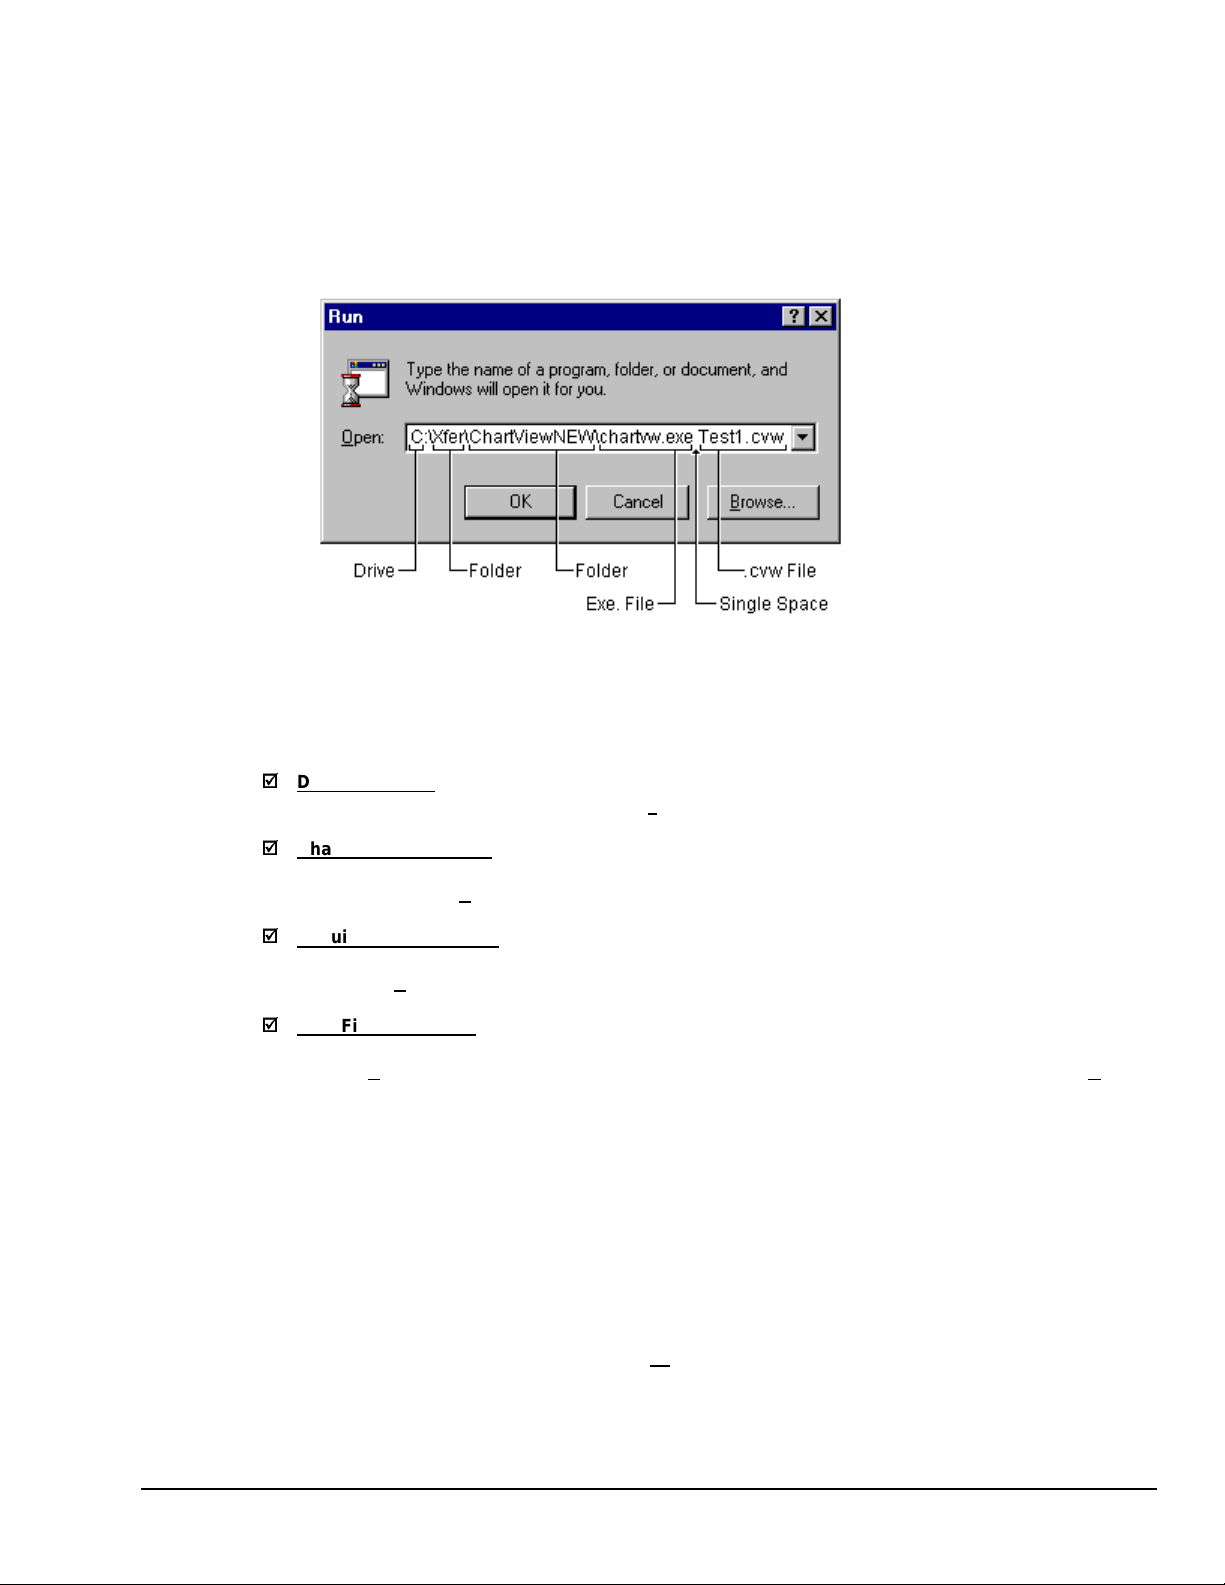
Once ChartView has a configuration file, you can start t he program quickly using the Windows Run dialog
box. Before executing this command [by clicking on the OK box] specify a configuration file as a
command line parameter. In the following example, the user has specified a configuration file which he had
previously saved as
Test1.cvw
.
Note:
The file name can be manually entered, or can be accessed using the pull-down arrow and scrolling
the list of available file names.
After executing the command, ChartView’s Main Window opens. At this point review the following
configurable items prior to Data Acquisition. Make changes, or load a different configuration file if
desired.
Device Interface
;
;
Check the Interface and Status via the Device pull-down menu.
Channel Configuration
;
;
Check channel and alarm configuration settings via the
window through the Setup pull-down menu.
Channel Configuration Window
. Access this
Acquisition Parameters
;
;
Check the acquisition parameters via the
through the Setup pull-down menu.
Acquisition Configuration window
. This window can be accessed
Data File Parameters
;
;
Check Data File Parameters. These parameters can be set from the
from the Setup pull-down menu), and from the
pull-down menu.
Data File Parameters
Data Destination
selection accessible from the D
window (accessible
ata
Using the Run Dialog box to specify a configuration file is very efficient. By using this method and various
configuration files, you should find that managing systems with more than one acquisition device is
relatively simple. With the use of a portable PC, you can quickly interface with a specific acquisition
system.
The pull-down menus and numbered areas represented in the previous figure and table are detailed in the
Chapter 4.
To start the charts scrolling, push the “Start Charts and Indicators” button (toolbar, item 2). More detailed
information pertaining to the charts and the ChartView Main Window appear in Chapter 4. In addition to
viewing the data as charts, you can select the
Windows
pull-down menu to select one or all of the
following:
NetScan User’s Manual ChartView Qui ck Start and Tutorial 2-5
Page 24
•
ChartView Analog M eters
•
ChartView Digital Meters
•
ChartView Bar Graph Meters
The meter-type data displays, along with the charts, can be on your computer screen at the same time. They
can be re-sized and repositioned as desired. Analog, Digital, and Bar Graph meters are detailed in
Chapter 4.
ChartViewNET Tutorial
This tutorial is intended to help you gain a good understanding of ChartView. The tutorial is based on an
initial startup with no configuration file present
ChartView allows you to operate in one of four different Device Interface modes (IEEE 488, RS-232/422,
Network (ethernet) or Simulated Instrument) , depending on your system’s scanning device. This tut orial
makes use of the Simulated Instrument mode. This mode provides a means of running ChartView and
inspecting its features without hardware concern. Note that you can change the interface mode at anytime
during a configur ation setup.
The arrow symbol
complete. Text without the arrow is for information content, and does not require you to take any action.
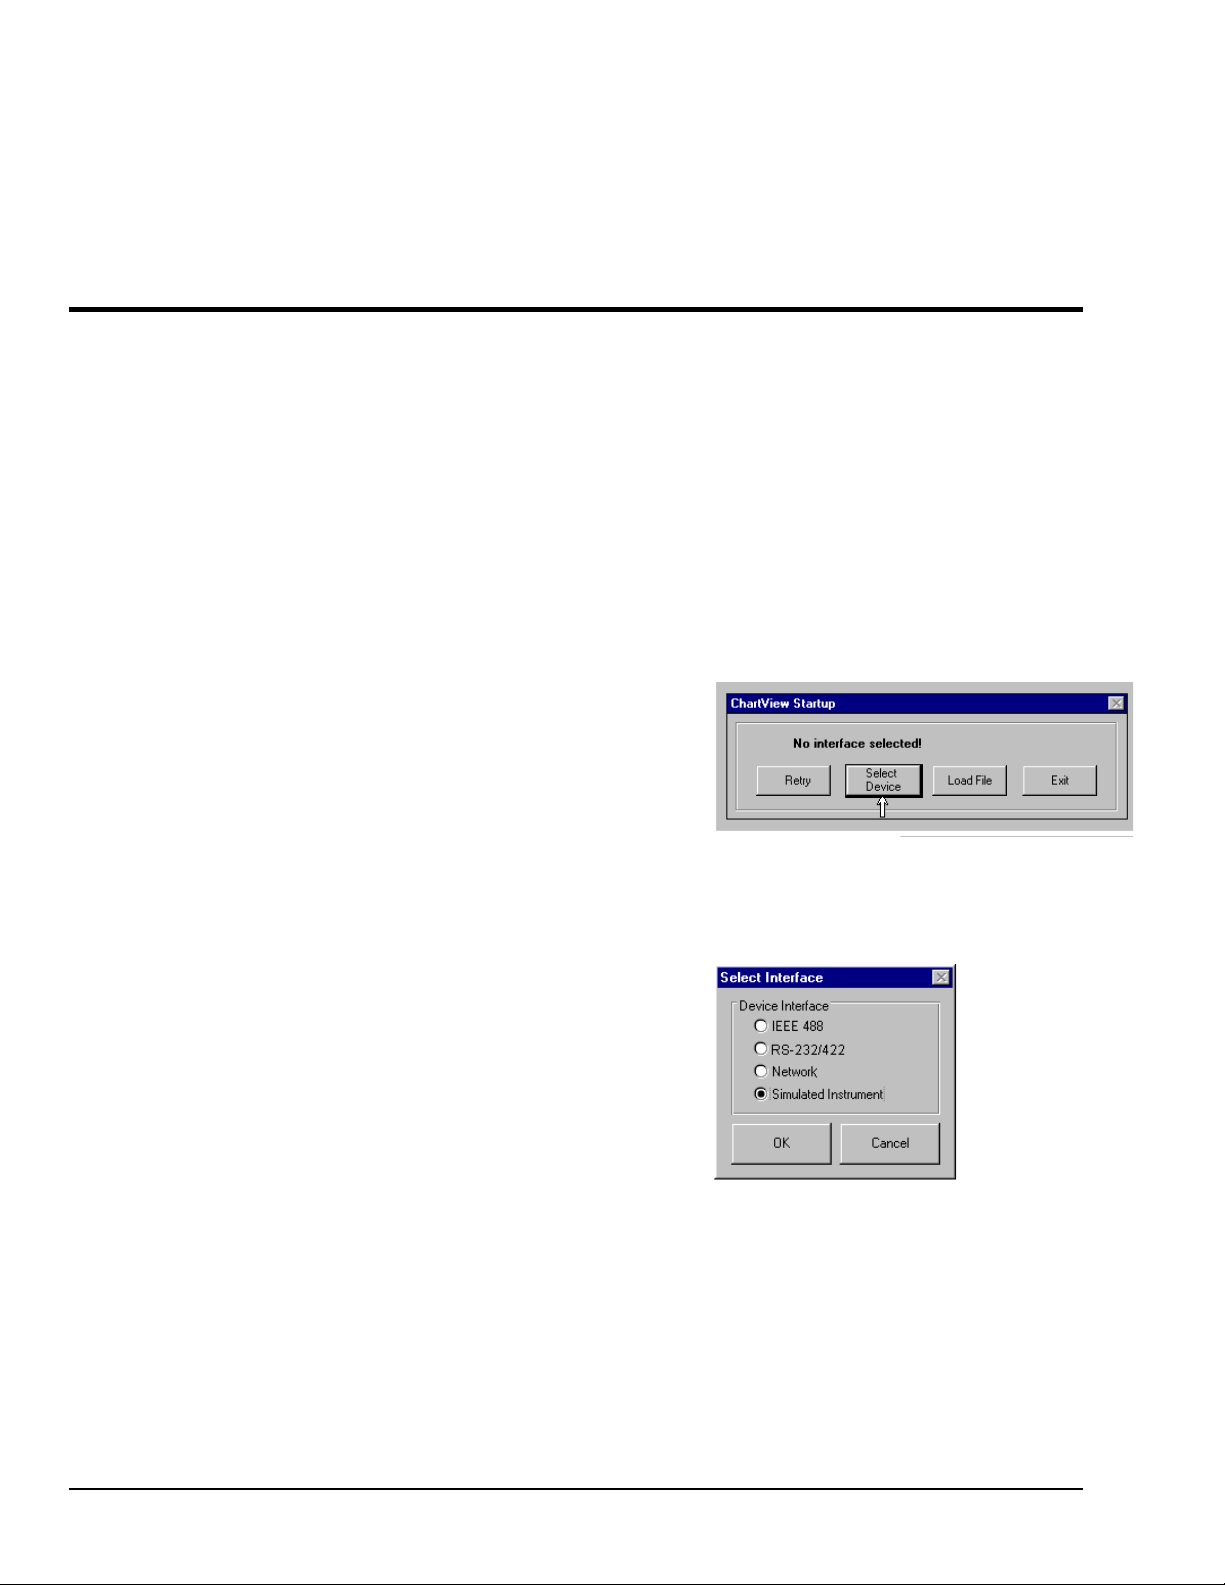
1. Select Interface Device
◊
(1) From Windows, start ChartView by double-clicking on the
ChartView icon. The ChartView Startup dialog box
appears.
.
◊
, followed by a number, is used throughout the tutoria l to indicate an action you are to
◊
(2) Choose the
Dialog Box appears, as indicated in the following figure.
The
Note:
configuratio n file.
◊
(3) Select Simulated Instrument. In an actual application you
would select IEEE 488, RS-232/422, or NetWork
depending on the type of device.
Note: IEEE 488 device interface does not apply to NetScan units.
Select Device
Load File
button is for loading a previously saved
button. The Select Interface
2-6 ChartView Quick Start and Tutorial NetScan User’s Manual
Page 25
2. Configure Chart Setup
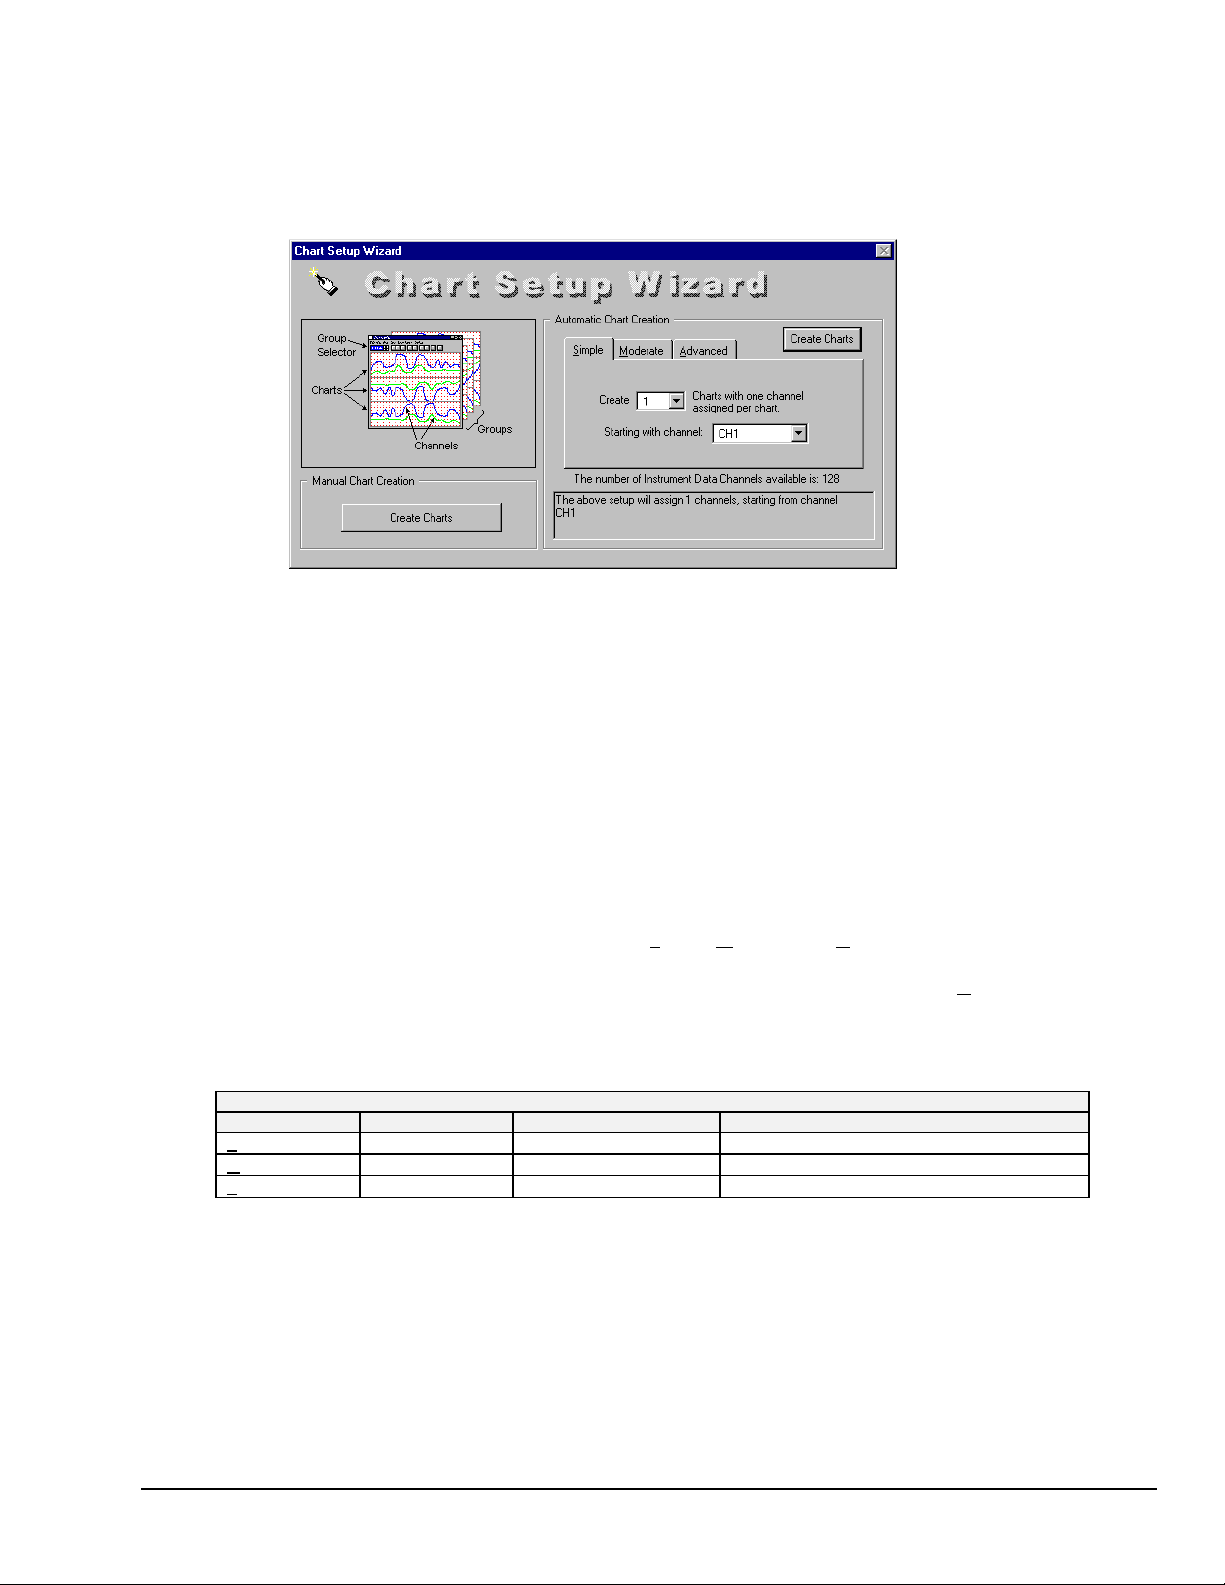
(4) On the Select Interface box, shown in step 1, click “OK.” A
◊
Chart Setup Wizard
following figure).
Chart Setup Wizard
Note:
ChartView Plus
has
Chart Setup Wizard
options including
Chart Creation, as well as the ability to create multiple groups.
unlocked by use of an authorized registration ID numbe r as an unlock code. Contact your service
representative for more detailed information.
The chart setup determines how your
ChartView Main Window
groups available for viewing, the number of charts shown for each selected group, and the number of
overlapping channels in each chart (not to exceed 4). As stated in the previous note, only
allows the use of multiple groups and overlapping channels.
You can choose to manually create a configuration, or have one created automatically. In addition, you can
use Chart Setup Wizard to make a r ough display configuration, and then manual l y fine tune it. The
automatic setup method offers three choices: Simple, M
oderate, and Advanced.
The “Manual Chart Creation” option provides you with the same capabilities as the Advanced Automatic
Setup selection, but allows you to vary the number of assigned channels per chart, as well as vary the
number of charts per group.
Chart Setup Wizard, Automatic Option s
Setup Type
Simple
Moderate*
Advanced*
Moderate and Advanced modes are only available with activat i on of ChartView Plus.
*
Group Setup
1 group only
1 group only
Up to 64 groups
Chart Setup
Up to 16 charts
Up to 16 charts
Up to 16 charts per group Up to 4 overlapping channels per chart
Channel Setup
1 channel per chart
Up to 4 overlapping channels per chart
window appears (see
Moderate
ChartView Plus
and
Advanced
Automatic
features can be
will appear in regard to the number of
ChartView Plus
NetScan User’s Manual ChartView Qui ck Start and Tutorial 2-7
Page 26
Note:
For the purpose of our tutorial, complete the following steps.
are catered to
presented in brackets [ ].
(5) Verify that the Advanced tab (under Automatic Chart Creation) is selected.
◊
[Simple must be used for standard program].
(6) Choose “2” for the number of groups. [Standard program is limited to 1 group].
◊
(7) Choose “3” for the number of charts.
◊
(8) Choose “4” for the number of channel s .
◊
(9) Click Automatic Chart Creations/Create Charts. At this point your chart
◊
appears on the Main Window.
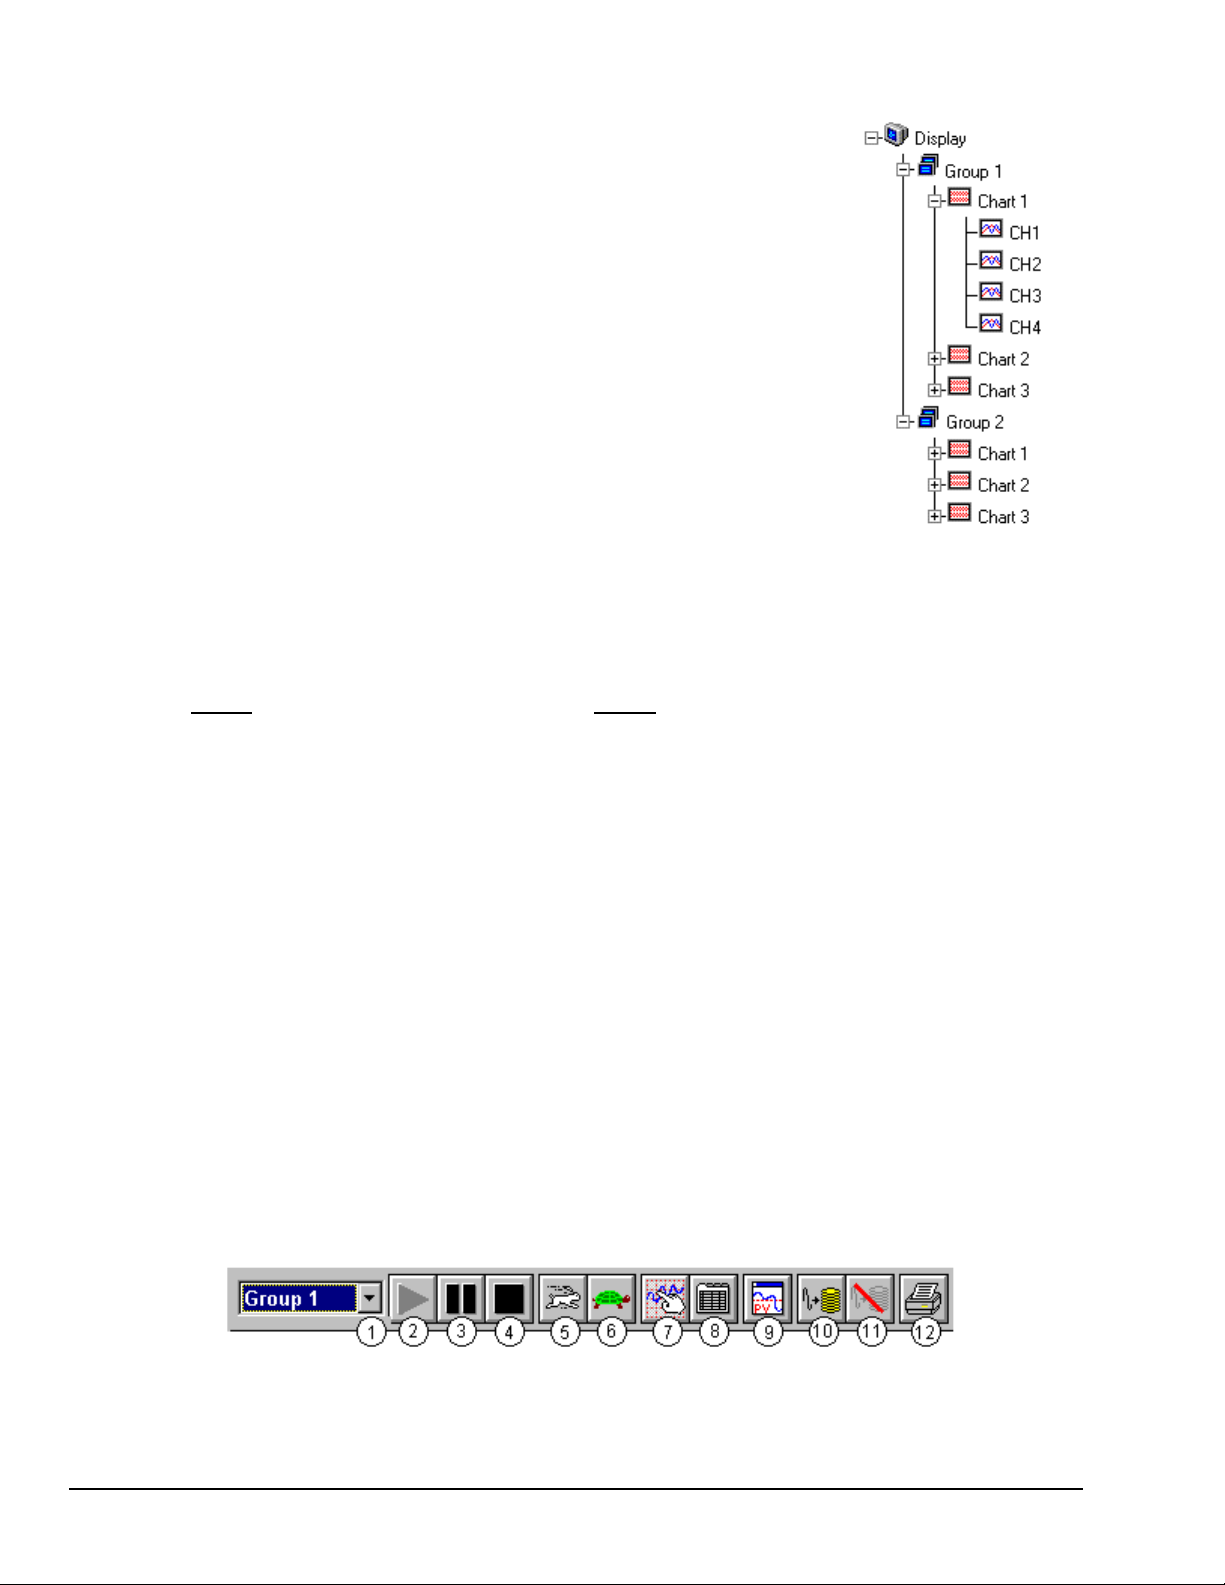
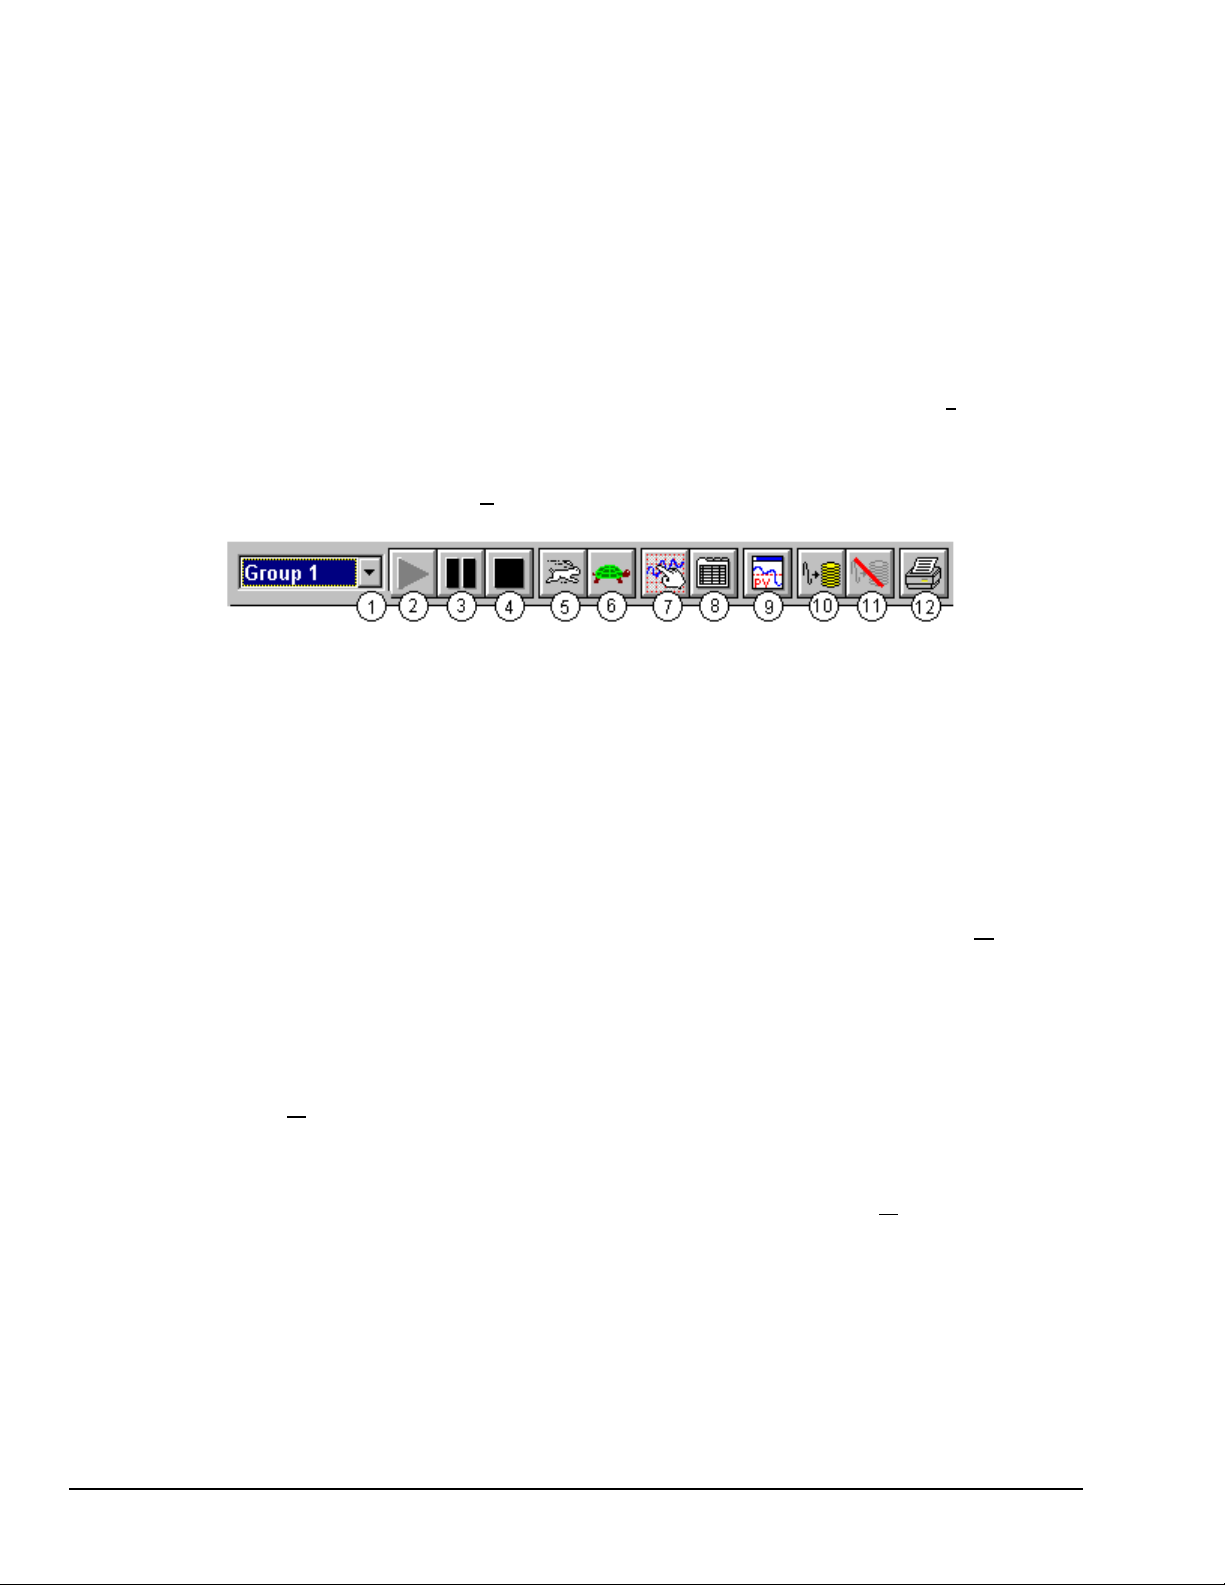
(10) Click on the Display Configuration button (item 7, see toolbar figure, below).
◊
Though you usually won’t do this at this point, this act permits you to see a
representa tion of your configur ation, and permits you to make changes.
You should end up with a configuration display of two groups, each with 3 charts, and each chart with 4 channels
[for standard ChartView users the display will be for 1 group only].
Because Automatic Chart Creation was chosen (starting with Channel 1) for ChartView Plus users, the Channel
arrangement was automatically assigned as follows:
Group 1
Chart 1
Chart 2
Chart 3
Once your chart setup is complete you can always go back and edit
the setup.
Note that these steps
ChartView Plus. Comments regarding standa rd ChartView are
CH1, CH2, CH3, CH4
CH5, CH6, CH7, CH8
CH9, CH10, CH11, CH12
Group 2
Chart 1
Chart 2
Chart 3
CH13, CH14, CH15, CH16
CH17, CH18, CH19, CH20
CH21, CH22, CH23, CH24
By using the mouse arrow and clicking on a Group, Chart, or Channel you will alter the appearance of the
display, but not alter its actual configuration. For example, in the previous Display tree figure we see channels 1
through 4 assigned to Chart 1 of the fi rst Group.
(11) ChartView Plus users: click on the word/number “Group 2.”
◊
(12) ChartView Plus users: click on the word/number “Chart 3” (of Group 2). You should now see channels
◊
21 through 24 listed at that location.
The channels in the setup you just created will be automatically enabled and will appear in chart form
on ChartView’s Main Window. The Channels will overlap on their assigned Chart, and will be
visible when the applicable Group is selected. Note that only one group of charts can be viewed at a
time, even if you are using ChartView Plus.
You can enable additional channels from the Channel Configuration window. This allows you to
acquire more data; however, it will not change your display on ChartView’s Main Window. In other
words, you can acq ui re data from cha nnels which you do not monitor.
(13) Click “Okay” to exit the dialog box.
◊
1- Group Select
2- Start Charts & Indicators
3- Pause Charts
4- Stop Charts
5- Scroll Faster
Scroll Slower
6-
7- Display Configuration
8- Channel Configuration
9- PostView
10- Arm Acquisition
11- Disarm
Print Charts
12-
2-8 ChartView Quick Start and Tutorial NetScan User’s Manual
Page 27
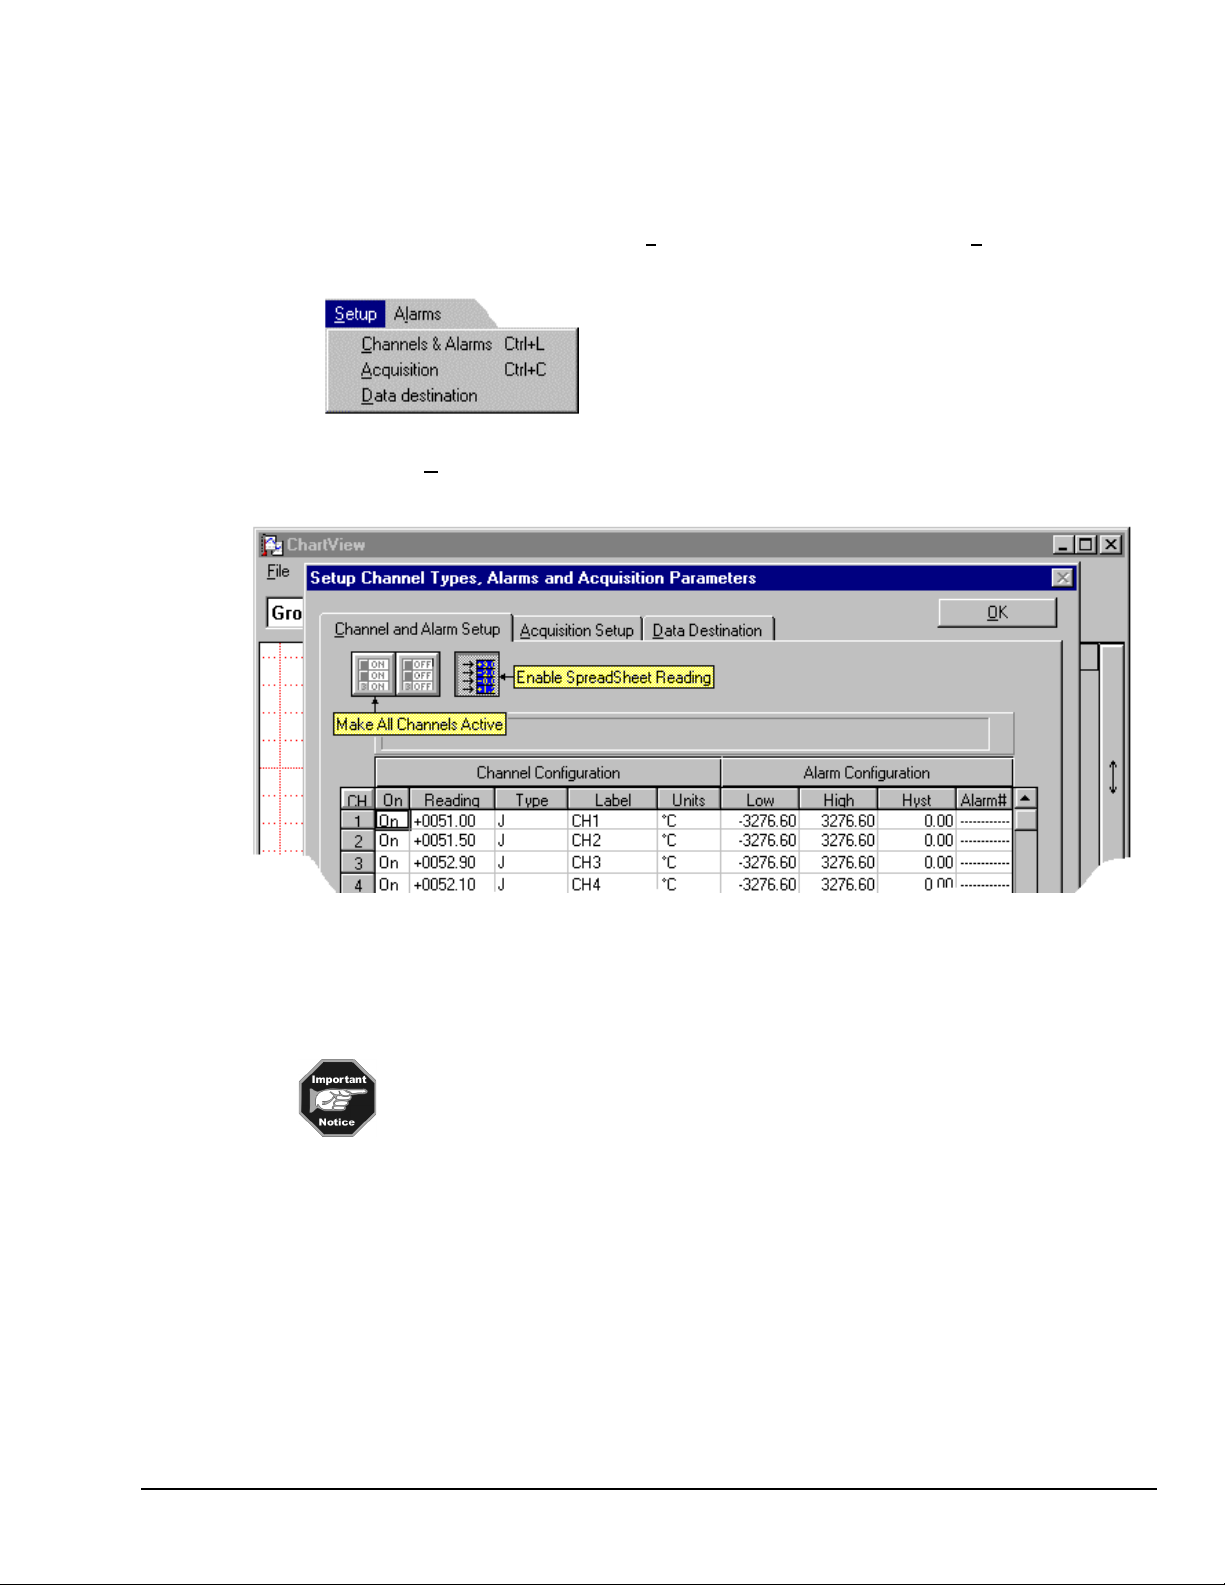
3. Configure Channels & Alarms
Configure channels and alarms as follows.
(14) On ChartView’s Main Window, click on
◊
menu appears, allowing you to make more specific selections.
(15) Click on the
◊
to that shown in the following figure.
Channels & Alarms
ChartView Toolbar Reference
Setup
selection. The Channel and Alarm Setup dialog box appears, similar
in the pull-down menu row. The
S
etup
pull-down
(16) Enable the desired channels. You can enable channels by double-clicking on the applicable channel’s
◊
“On” column, obtaining “On” indicating enabled or “Off” indicating disabled. You can also use a pulldown list which appears for enable/disable. See Chapter 4 if more detail is needed.
Channels set up for your display will be automatically enabled. You can enable additional
channels for data acquisition. These additional channels will not appear on ChartView’s
(17) Click on the “Enable SpreadSheet Reading” button (see previous figure). This activates the display
◊
scanned data in the reading column. Since we are in the Simulated Instrument mode, the Reading column
of the Analog Input SpreadSheet will now display simulated data. Selecting the Enable SpreadSheet
Reading button again will freeze the Reading column’s display.
Main Window, but data from them will still be acquired.
NetScan User’s Manual ChartView Qui ck Start and Tutorial 2-9
Page 28
4. Configure Acquisition.
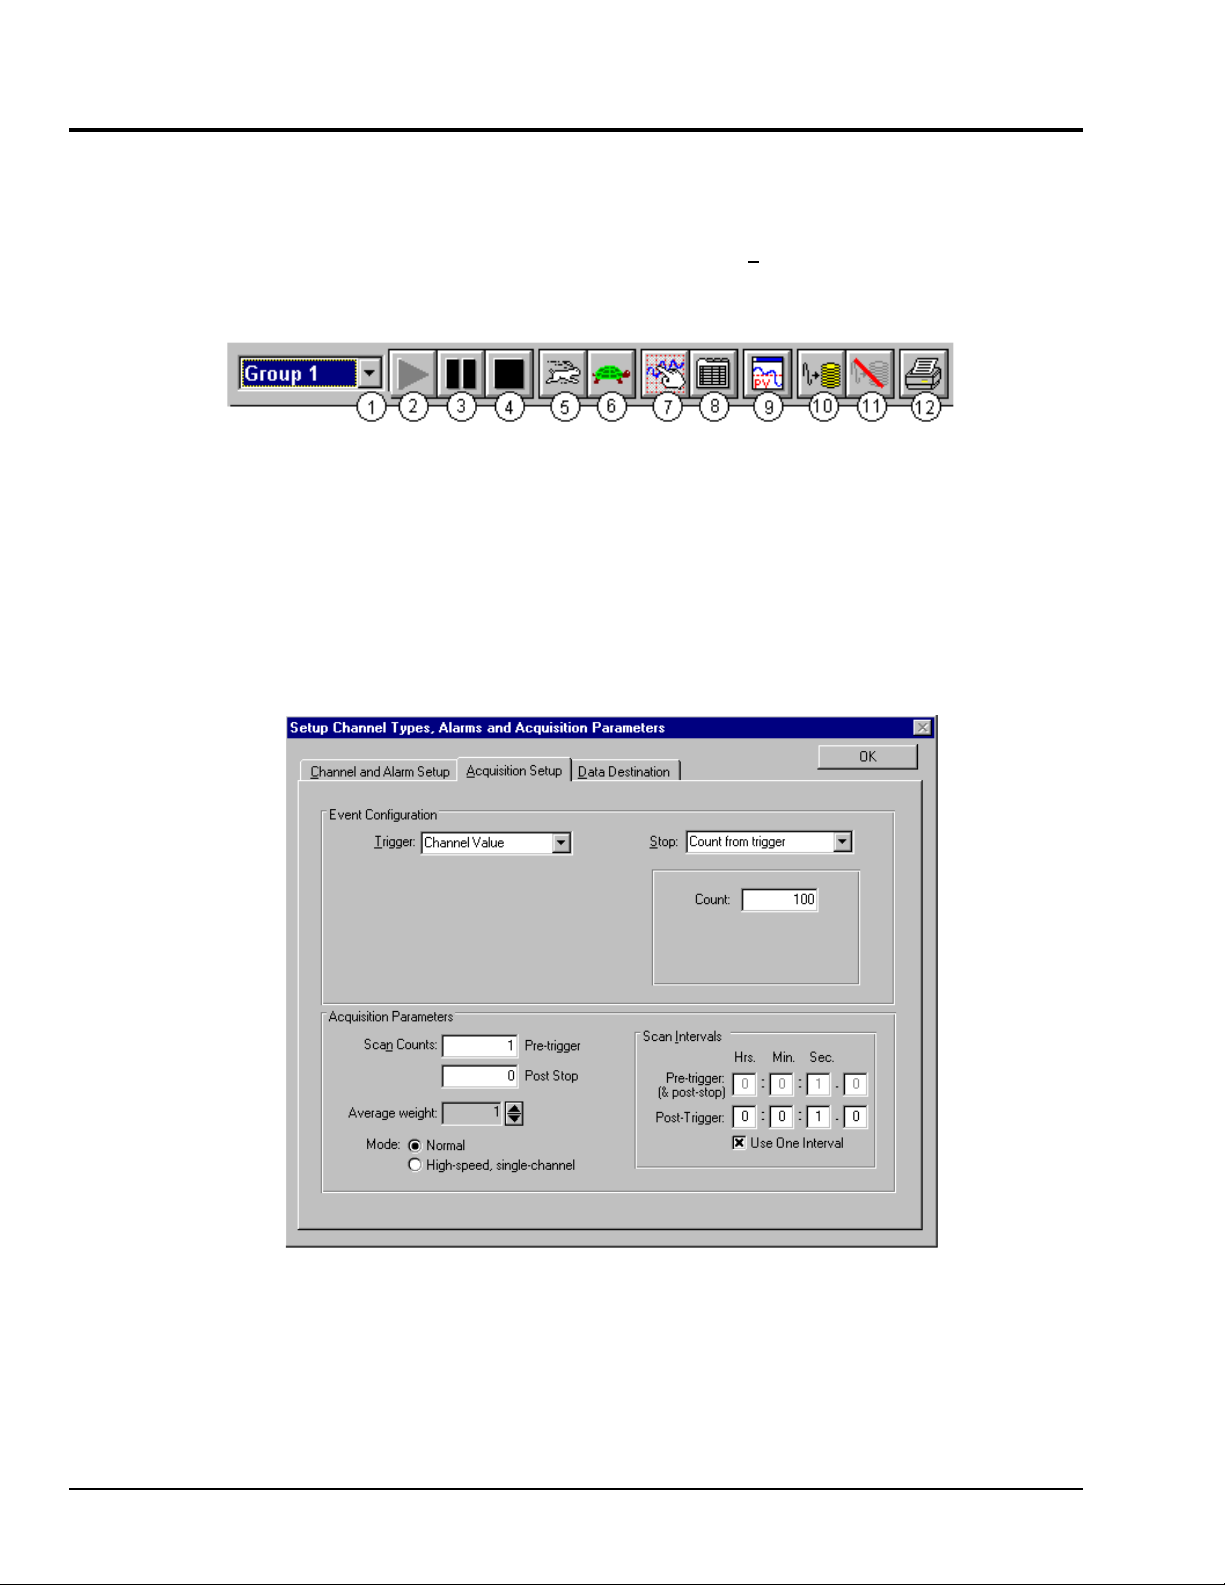
(18) Click on the Acquisition Setup tab (see previous figure). An Acquisition Configuration dialog box appears.
◊
The box can be in either of two modes – (1)
can also access the Acquisition Configuration dialog box from the
Configuration
button (item 8, below).
Normal
or (2)
,
High-speed, single channel
pull-down menu or the
Setup
. Note that you
Channel
1- Group Select
2- Start Charts & Indicators
3- Pause Charts
4- Stop Charts
5- Scroll Faster
Scroll Slower
6-
ChartView Toolbar Reference
7- Display Configuration
8- Channel Configuration
9- PostView
10- Arm Acquisition
11- Disarm
Print Charts
12-
The information entered in the Acquisition window is used by the Arm Acquisition command to set up the
acquisition of data to disk. When the trigger is satisfied, the scans are collected at the selected scan
frequency and stored to disk in the designated file.
Acquisition Dialog Box, Normal Mode
(19) Click “Okay” to exit the Acquisition dialog box. Note that we are using the Acquisition default settings, and
◊
the Data Destination default settings in this tutorial (as shown in the above figure).
The following table provides a brief description of various acquisition setup parameters.
Note:
2-10 ChartView Quick Start and Tutorial NetScan User’s Manual
Page 29

Acquisition Setup
Parameter
Event Configuration
Trigger:
Set a trigger scan in the Acquisition by using one of t he following:
Keyboard -
Externa l TTL Channel Value Alarm Absolute Time -
Use Console Trigger dialog box to st art trigger scan.
Note: If the Keyboard Trigger is selected the use of Pre-t ri gger i s disabled.
Use an external signal to s t art the trigger scan.
Use specified value of a gi ven channel.
Use an Alarm value to start the trigger scan.
Use a time of day to st art the trigger scan.
Note: If Absolute Time is selected, the use of Auto Re-arm is disabled.
Stop:
Set a stop scan in the Acquisition by using one of the above selections or Count (as
specified below). Keyboard i sn’t applicable. If a Mul t i Scan/1200 or NetScan is
connected and High-Speed Single-Channel (Burst Mode) is selected, then “Count from
trigger” is the only Stop avai l abl e for the event configuration.
Acquisition Paramet ers
Count:
Scan Counts:
Average weight:
Scan Intervals:
High Speed Setup:
Specify a number of sc ans to be read before a stop scan is set.
Specify the number of scans in an acquisition
Pre-trigger
Post Stop
Average weight can be specif i ed onl y when in the Normal Mode. The value for
the average weight determines the num ber of samples to be averaged when in
Normal Mode. Values of 1, 2, 4, and 8 are for high-speed multiple channel
applications for thermoc oupl es and DC voltages where noise filtering is not an
issue.
Values of 16, 32, 64, 128, and 256 are rec om m ended for AC noise rejection.
Time between scans (frequency of scans)
Pre-trigger and Post Stop
Post-trigger
Use one Interval
Allows for channel and scan rate entries for high-speed, si ngl e channel mode.
These parameters cannot be altered whil e an acquisition is in progress .
Note:
5. Review Configuration.
Options
Reviewing the configuration prior to data acquisition is optional; however, you should complete a review at
this time (in the tutorial) to help with your familiarization of ChartView. In an actual application, a review
such as this provides you with a chance to correct configuration errors.
Device Interface
(20)
◊
Check the Interface and Status via the
Channel Configuration
(21)
◊
Check channel and alarm configuration settings via the
the
Setup
Acquisition Parameters
(22)
◊
Check the acquisition parameters via the
Setup
Data File Parameters
(23)
◊
Check Data File Parameters. These parameters can be set from the
Setup
pull-down menu.
pull-down menu.
pull-down menu), and from the
pull-down menu.
Device
Channel Configuration Dialog Box
Acquisition Configuration Dialog Box
Data Destination Dialog Box
Data File Parameters
selection accessible from the
. Access this box through
. This box can be accessed th rough the
(accessible from the
pull-down menu.
D
ata
NetScan User’s Manual ChartView Qui ck Start and Tutorial 2-11
Page 30
6. [Optional]. Save Configuration File.
Although the updated
Chartvw.cvw
file will automatically save upon Exit, there may be times when you
want to manually initiate a save. This will help you save time if an error occurs that may corrupt your
configuration. You may create a new configuration file b y using an existing one and making the necessary
changes. In actual applications, use the File pull-down menu to manually save configuration files, if this
option is desired.
Note:
The
.cvw
file contains all setup information. Setup information includes channel information, alarm
configurations, and acquisition configuration information.
7. [Optional]. Check the System Inventory and Device System Time.
Check the System Inventory and Device System Time via the
selection from the
Status
menu.
In an actual application, if the System Inventory and Device System Time configurations were acceptable,
you would proceed to Arm an Acquisition by clicking the Arm Acquisition button (item 10), or by using the
Arm Acquisition selection in the
Acquire
pull-down menu.
1- Group Select
2- Start Charts & Indicators
3- Pause Charts
4- Stop Charts
5- Scroll Faster
Scroll Slower
6-
ChartView Toolbar Reference
7- Display Configuration
8- Channel Configuration
9- PostView
10- Arm Acquisition
11- Disarm
Print Charts
12-
Device
pull-down
8. Start Charts.
(24) Push the Start Charts and Indicators button (Toolbar, item 2). Charts will begin scrolling. More detailed
◊
information pertaining to the charts and the ChartView Main Window appear in Chapter 4’s
ChartView Main Window section. In addition to viewing the data as charts, you can select the
pull-down menu to select one or all of the following:
(25) Select the
◊
meter’s specific toolbar to activate that meter.
Meters and charts can be on your computer screen at the same time. They can be re-sized and repositioned
as desired. Analog, Digital, and Bar Graph meters are detailed in Chapter 4.
Note that a PostView Post Acquisition viewing program is also selectable from the Windows menu.
PostView is discussed in Chapter 5.
A Note In Closing.
This completes the tutorial. You may continue running ChartView in the simulated instrument mode and try
various options to get a better feel for the program. Remember, while in the simulated instrument mode
there are no NetScan hardware concerns.
ChartView Analog M eters
•
ChartView Digital Meters
•
ChartView Bar Graph Meters
•
Windows
pull-down menu and try each meter option. Push the triangular play button of each
Windows
2-12 ChartView Quick Start and Tutorial NetScan User’s Manual
Page 31

General Information and Specifications 3
&$87,21
If equipment is used in any manner not specified in this manual, or if specification limits
are exceeded, the function of the equipment, as well as the protection provided by it, may
be impaired.
General Description…… 3-1
Operational Aspects…… 3-2
Data Handling and Triggering…… 3-2
Software and Hardware…… 3-3
NetScan Specifications…… 3-3
General Description
NetScan is an advanced hybrid data recorder that combines the desirable features of paper-based stripchart recorders
with the latest PC-based data acquisition technology, including Ethernet/Internet-based data logging and control.
The device provides from 16 to 128 isolated channels. In addition, 32 digital outputs can be set to automatically
function as alar m out puts, or be controlled individually through a network. Eight inputs p rovide a means of r eading
digital input status through the network. An outstanding feature of NetScan is tha t the device can communicate
remotely through the inter net. This feature is made possible b y the system’s use of TCP/IP protocol.
In addition to chart displays, NetScan can be used to display “meters” in digital, analog, and bar graph formats. The
unit can measure up to 64 differential input channels and can easily be expanded up to 128 channels with the use of
an expansion module.
NetScan is well suited for temperature and voltage measurements requiring channel-to-channel isolation. This
isolation is made possible by the use of individual relays on each of the 64 channels. The unit provides 500 V
isolation for voltage inputs and 200 V isolation for thermocouples. The instrument scans at a rate of up to 147
channels per second and includes a single-channel burst mode for digitizing waveforms at rates up to 20 kHz.
Measurements include:
•
isolated temperature from thermocouples
•
DC volts
•
AC volts
•
waveforms
NetScan includes ChartViewNET, a software program which provides a Windows-based graphical-user-interface
approach to obtaining data collection and display; PostView, a post-acquisition data review program; and ScanCal, a
software application that automates instrument calibration.
Optional software, shipped with separate documentation, includes the following:
CIMScan
is a HMI/SCADA application. A single screen can display data from [and control outputs of] several
NetScan devices connected through a network. With CIMScan, users can customized applications accessing
thousands of channels from network-connected NetScan devices. CIMScan does not require programming
knowledge.
ScanServer
(including thos e from Wonderware
such as Microsoft Excel
is a driver that permits access to multiple NetScans from popular HMI/SCADA applications
.
and Intellution.) ScanServer supports OPC/DDE-compliant environments,
NetScan User’s Manual,
11-9-98
General Information and Specifi cations 3-1
Page 32

Although NetScan ca n acquire temperature read i ngs at a rate of 147 channels/sec, you may also program the unit to
acquire data at specified time intervals using the
hh:mm:ss.t
format. For the ultimate in flexibility, you may also
program separate pre-and post-trigger sample rates. As an example, NetScan can be programmed to sample data
once per hour and then sample once per second when channel 2 reaches 70°C.
NetScan was designed with the convenience of remot e operation t hrough the ethernet. If desired, RS-232 or RS-422
serial connections can be used instead of ethernet connections. Chapter 7, Hardware, contains information regarding
non-ethernet use of NetScan.
Statistics such as High, Low, and Last are available for each channel for data reduction. In addition, up to 32 alarms
may be programmed using the programmable high and low limits for each channel.
NetScan’s features include:
•
Thirty-two TTL (Transistor-to-Transistor Logic) digital alarm outputs and 8 TTL-compatible digital
inputs.
•
Two programmable scan rates: (1) a programmable scan rate for pre-trigger and post-trigger sampling,
and (2) a programmable scan rate for accelerated sampling on-event detection.
•
A built in real-time clock which synchronizes the acquisition to the time of day and provides time and
date stamping for trend analysis. Time stamping may be in relative or absolute time.
•
10Base-T Ethernet Interface; with alternate choice of RS-232/422 interface.
•
256 Kbytes of memory, expandable up to 8 Mbytes. If your application must gather large amounts of
data, options are available for expanding the standard 256 kB of memory to 1 MB, 4 MB, or 8 MB.
•
Capable of channel expansion up to 128 channels with the use of a CSN/Exp expansion chassis.
Operational Aspects
Data Handling and Triggering
Also, see Software & Hardware table and NetScan Specifications.
Note:
Data Handling
Built-in memory
10Base-T ethernet interface
RS-232 serial interface
RS-422 serial interface
Time & date stamping
Digital inputs
Programmable alarm outputs 32
Triggering
Digital trigger input
Analog trigger input
Trigger on “time of day”
Pre-trigger scan rate
Post-trigger scan rate
256 Kbyte
3
ethernet
3
serial, non-ethernet
3
serial, non-ethernet
3
8
3
3
3
Programmable
Programmable
3-2 General Information and Specif i cations NetScan User’s Manual
Page 33

Software and Hardware
Software
ChartViewNET
PostView
ScanCal
CIMScan
ScanServer
16-Channel Signal Conditioning Cards (
Low-voltage
terminal block input module
Low-voltage
module
Low-voltage
input module
Isolated TC/voltage
plug type input module
Isolated high-voltage
safety jack input module
with removable
with BNC input
with safety jack
with
Cables
CA-47,
Computer-to-NetScan Cable
PC/AT/XT serial port (9- & 25-pin sub D) to NetScan (9-pin
sub D) RS-232/422 cable, 6 ft.
CA-192-5
CA-192-Adapter
Additional Hardware Options
4-slot expansion chassis
Memory expansion options:
16 output CSN/Relay card
, 10-Base-T “straight-through” ethernet cable, 5ft.
, 10-Base-T ethernet “cross-over” adapter
1 Mbyte, 4 Mbyte, or 8 Mbyte
with
(optional)
(optional)
Optional
(CSN14/LV/T)
(CSN14/LV/B)
(CSN14/LV/S)
(CSN14/TC/P)
(CSN14/HV/S)
)
NetScan Specifications
&$87,21
If equipment is used in any manner not specified in this manual, or if specification limits
are exceeded, the function of the equipment, as well as the protection provided by it,
may be impaired.
NOTE: Specifications for signal conditioning cards and for the NetScan Expansion Chassis appear in their
respective sections of this manual.
Measurement Parameters
A/D resolution
Accuracy (with type J TC) ± 0.5°C
TCs supported
DCV
ACV
Ch-to-ch isolation
Ch-to-system isolation
AC line rejection
16 bit w/over sampling
J,K,T,E,R,S,B,N
3
3
500 V or 200 V
500 V
3
Scanning Parameters
Switching Technology
Max scan rate
Max single-ch scan rate
NetScan User’s Manual General Information and Specifi cations 3-3
mechanical relays
147 chs. per sec.
20 Khz
Page 34

Min channel configuration
Max channel configuration 128 channels
General
Installation Category:
•
CE: Category 2 for Line Voltage Input terminal.
All other terminals are Category 1.
16 channels
Warm Up:
•
1 hour to rated accuracy.
Expansion Connector:
•
40-conductor connector for connecting expansion chassis via ribbon cable.
NetScan’s expansion connector (PH401) is located on the analog backplane
board.
Chassis Ground Connection:
•
Screw terminal.
Dimensions:
•
330 mm wide × 241 mm deep × 152 mm high (13” × 9.5” × 6”).
Weight:
• ≈
4.3 kg (9.6 lbs.) with 4 signal conditioning cards installed
Operating Environment:
•
Standard: Indoor use, 0 to 50°C;
0 to 95% RH (non-condensing) to
35°C; linearly derate 3% RH/°C
•
CE: Indoor use at altitudes below 2000 m,
5 to 40°C; 0 to 80% RH up to 31°C
decreasing linearly to 50% RH at 40°C.
from 35 to 50°C.
Control:
•
Power Switch, Ethernet or RS-232/422 option, handshake, parity, baud rate,
calibration memory write enable/disable.
Rear Panel LED Indicators:
•
ALARM, TRIGGER, SCAN, ERROR, and POWER
•
SEND and RECEIVE (for RS-232/422 serial interface only)
•
ACTIVITY, LINK, and ETHERNET (for Ethernet Interface only)
Power:
•
105-125V, or 210-250V, 50/60 Hz; 20 VA maximum. Set via internal,
two-position slide switch.
Transient Overvoltage according to Installation Categories:
•
Overvoltage Category II for mains supply. The minimum and normal
category is II.
Pollution Degree:
•
I − in accordance with IEC 664
Channels
Number of Option Card Slots:
•
4
Number of Channels:
•
up to 64 channels, expandable to 128 with NetScan expansion chassis
•
16 channels per card
•
up to 4 cards installed in NetScan
(up to 4 additional cards with use of NetScan expansion chassis)
Channel Attributes:
•
High and low set point s; hysteresis values for high a nd low set points.
Scan Sequence:
•
Any combination of temperature and voltage channels may be scanned, but
channels are scanned in ascending numerical order.
3-4 General Information and Specif i cations NetScan User’s Manual
Page 35

Scan Interval:
•
Absolute time between scans (
hh:mm:ss.t
); min = 00:00:00.0,
max = 99:59:59.9. Note: Specifying a value of 00:00:00.0 results in no delay
between channel scans.
Triggers
Installation Category:
•
CE: Category 1.
Programmable Triggering:
•
Temperature or Voltage level (above or below), absolute time of day, alarm
condition (on or off), external TTL trigger (rising or falling), specified
number of readings.
Temperature-Level Trigger:
•
Programmable value for any one channel. Not available in Burst mode.
TTL Trigger:
•
Programmable for rising or fall ing edges.
Pre-Trigger Count and Post-Trigger Count:
•
Programmable integer (< memory size -1); and programmable integer..
Digital Filtering:
•
Average 16 samples at 50/60 Hz for line cycle noise.
TC Reference:
•
TC reference tables based on the IPTS-68 standard as listed with the US
Department of Commerce (NTIS). International Electrotechnical
Commission (IEC) 43 760.
Trigger Input Connector:
External BNC connector
Trigger Output Connector:
External BNC connector
Data Storage & Format
Storage:
•
128 K reading (256 Kbyte) standard; optional 500 K reading (1 Mbyte),
2 M reading (4 Mbyte), 4 M reading (8 Mbyte).
Data Formats:
•
ASCII and binary; binary format returns a 16-bit compensated and linearized
temperature value (0.1°C/bit); user-programmable for hi/low byte or low/hi
byte.
Statistical Parameters:
•
High, Low, and Last available per channel (during acquisition only). Not
available in single channel burst mode.
Time Stamp:
•
Available for each scan group and for each channel’s high, low, and last
parameters.
Time Format:
•
Relative time (
date and time (
hh:mm:ss.mil
dd/mm/yy hh:mm:ss.mil
), absolute time (
hh:mm:ss.mil
). Not available in single channel
burst mode.
Alarm Stamp:
•
Available for each scan group. Not available in single channel burst mode.
) or absolute
NetScan User’s Manual General Information and Specifi cations 3-5
Page 36

Digital I/O Interface & Alarms
Installation Category:
•
CE: Category 1.
Number of Digital Inputs:
•
8 bits, LS-TTL compatible.
Number of Digital Outputs:
•
32 bits, TTL level compatible. Can be programmed as alarms.
Note: The 32 TTL outputs can be set or cleared via program control.
Alarm Conditions:
•
May be detected by software query.
Alarm Update Rate:
•
Alarms are updated whenever a channel assigned to an alarm is measured.
Connector:
•
Female DB50 50-pin (32 Alarms, 8 digital inputs, 10 ground pins), mating
connector supplied.
Note: See chapter 7 for information regarding External TTL BNC Connectors.
:$51,1*
Service must be performed by qualified personnel. All electrical connections to device,
including the AC line and analog inputs, must be disconnected prior to opening the NetScan
main unit or the expansion chassis. Internal voltage potentials exist which could cause bodily
injury or death!
:$51,1*
NetScan’s ground (on the AC power connector) must be connected to an external earth
ground. Failure to make such a connection could present an electric shock hazard, causing
bodily injury or death!
Fuse:
1/2A, 250V, Slo Blo, 3AG for 100-140V power line, or
1/4A, 250V, Slo Blo, 3AG for 200-240V power line
&$87,21
Fuse failure indicates a possible problem within the device circuitry. If a fuse blows, contact
a qualified service representative. Replacement fuses are to be installed by qualified service
personnel with the unit disconnected from the power source and with all other terminals
disconnected. If the line voltage selector is changed, then the fuse designated for that line
voltage must be used.
3-6 General Information and Specif i cations NetScan User’s Manual
Page 37

Calibration
Calibration must be completed periodically to ensure equipment is accurate, and
can be performed manually, or with the use of ScanCal. Chapter 6 contains
instructions, including calibration equipment requirements, for the following:
NetScan main unit calibration for offset and gain
Offset calibration for all card types
Gain calibration for low volts cards
Gain calibration for high volts cards
Cold junction calibration for TC cards
Note: NetScan main unit constants are stored in NV-RAM.
Signal Conditioning Card constants stored in each card’s EEPROM.
Note: Industry standard calibration period is once every year.
NetScan User’s Manual General Information and Specifi cations 3-7
Page 38

−
Notes
3-8 General Information and Specif i cations NetScan User’s Manual
Page 39

ChartView Software Reference 4
ChartView, ChartView Plus, ChartViewNET, and ChartViewNET Plus
Overview ……4-1
Groups, Charts, & Channels ……4-2
Three Ways of Using ChartView ……4-2
What ChartView and ChartView Plus Provide
……4-3
Main Window ……4-4
Channel Information Region ……4-6
Status Indicator Region ……4-7
Main Window Toolbar ……4-8
Group Select ……4-8
Start, Pause, and Stop Charts ……4-8
Scroll Faster & Scroll Slower ……4-8
Display Configuration ……4-9
Channel Configuration ……4-15
PostView post-acq data viewer ……4-15
Arm Acquisition ……4-15
Disarm ……4-15
Print Charts ……4-16
Main Window Pull-Down Menus ……4-16
Reference Note: This chapter serves as a reference for ChartView, ChartView Plus, ChartViewNET,
ChartViewNET Plus, and Chart Setup Wizard. For very first time start-up of a ChartView application,
or to run through the program tutorial, re fer to Chapter 2.
Bar Graph, Analog, and Digital Mete rs ……4-27
Overview ……4-27
Bar Graph Meters ……4-28
Analog Meters ……4-29
Digital Meters ……4-30
Meter Toolbars ……4-31
Meter Pull-Down Menus ……4-31
Meters Configuration Menu ……4-32
Setup Window ……4-33
Channel & Alarm Setup Dialog Box ……4-33
Acquisition Setup Dialog Box ……4-36
Channel Configuration Columns ……4-35
Alarm Configuration Columns ……4-36
Data Destination Dialog Box ……4-39
Data Destination ……4-39
Auto Re-arm (ChartView Plus only ) ……4-39
Why use Auto Re-arm? ……4-40
Disabling Auto Re-arm ……4-40
Chart Setup Wizard ……4-41
Introduction ……4-41
Automatic Chart Setup with Wizard ……4-42
Bypassing Automatic Chart Setup ……4-43
ChartViewNET refers to a ChartView program that has the network feature of the program activated, much
like ChartView Plus refers to a ChartView program that has the enhanced chart feature of the program
activated. The NET and Plus features are each activated by separate registration ID codes; thus it is
possible to have ChartViewNET Plus (when both codes are used). For ease of discussion, this chapter’s
use of the term ChartView also refers to ChartViewNET; and ChartView Plus refers to
ChartViewNET Plus.
Overview
ChartView is a graphic Microsoft Windows-based program that can be used for various data acquisition applications.
The program was designed for ease-of-use with no need for programming or expertise in configuration.
ChartView Plus permits multiple groups and up to four overlapping channels (per chart). These enhanced
features are activated by use of a registration ID code. Please consult your service representative for more
detailed information.
NetScan User’s Manual
11-13-98
ChartView Software Reference 4-1
Page 40

Groups, Charts, & Channels
When starting the program with no configuration file present (see Chapter 2 if necessary), a feature called Chart Setup
Wizard is automatically activated to assist you with your display setup. To make the best use of Chart Setup Wizard you
need to understand the relationship of Groups, Charts, and Channels.
Group. “Group” refers to a group of charts. ChartView makes use of one chart group.
ChartView Plus allows up to 64 groups, depending on the capabilities of your PC, but
can only display one group at a time.
Chart. “Chart” refers to display area that reflects real-time channel data values for a
selected channel and can be scrolled at various rates. You can assign up to 16 charts per
group. ChartView Plus enables each chart to display up to four overlapping channels.
Channel. “Channel” refers to a signal channel. Channels will be displayed in units of
°C, °F, °K, °R, mV, V, or in user-defined units, depending o n the configuration and type
of signal conditioning card used. With ChartView Plus you can have up to 4
overlapping channels assigned to one chart.
Three Ways of Using ChartView
You can use ChartView to:
•
chart and monitor specific channels with no acquisition of data to disk
•
acquire data with no charting or meter use
•
use charting and/or meters while acquiring data to disk
Chart channels (and/or monitor with meters) with no acquisitio n of data to disk (Acquisition State:
Waiting for Trigger) Prior to charting channels on ChartView’s Main Wind ow, you need to configure
a display in regard to groups, charts, and channels. This aspect of configuration is performed through
Chart Setup Wizard (discussed in the following text), or through a Chart Setup window accessed
through the “Channel Configuration” button on ChartView’s Main Window.
In addition to charting channels, you can monitor selected channels via digital, analog, and/or bar graph
meters. Meter discussion begins on page 4-27 of this manual. A detailed discussion of configuring
Meters begins on page 4-32.
Note: Only one group of charts can be viewed at a time.
Acquire data with no charting or meter use (Possible Acquisition Scenarios: Acquiring and Uploading
Acquisition, Buffering Acquisition in Instrument, and Uploading Data from Instrument Buffer). Prior
to acquiring data (for saving to disk) you need to configure the acquisition using the Acquisition
window (accessed through the Setup pull-down menu of ChartView’s Main Window, or through use of
the related icon button). You can enable the desired channels and assign high and low alarm values
from the configuration window.
Chart channels and/or use meters while acquiring data to disk (Possible Acquisition States: Acquiring
and Uploading Acquisition, Buffering Acquisition in Instrument, and Uploading Data from Instrument
Buffer). Prior to using ChartView for charti ng (and/or meter use) while simultaneously acquiri ng data
to disk, you need to configure a display and/or meter; as well as configure the acquisition. Channels
from the display setup are automatically enabled. You can enable additional channels from the
Channel Configuration window (for the data acquisition) to acquire more data; however, these
additional channels will not change your display setup, or the channels being monitored. In other
words, you can acquire data from channels you do not chart or monitor.
4-2 ChartView Software Reference NetScan User’s Manual
Page 41

Some of the data acquisition scenarios pertaining to ChartView are as follows:
1) Waiting for Trigger
Sensor
B uffe r
Acquisiton Device
Data is received by acquisition device, but not stored. Selected
channels can be viewed graphically in scrolling charts, as well
as in one or more meters (analog, digital, or bar graph).
3) Buffering Acquisition in Instrument
Sensor
B uffe r
Acquisiton Device
Acquired data (from point of trigger) is received by acquisition device
and temporarily stored in device buffer. As in the previous scenarios,
selected display channels can be viewed.
Hard Disk
Computer System
Hard Disk
Computer System
Four Basic Data Acquisition Scenarios
2) Acquiring & Uploading Acquisition
Sensor
B uffe r
Acquisiton Device
Device has been triggered. Data is temporarily stored in device
buffer prior to being uploaded to PC system hard disk. As in the first
scenario, selected display channels can be viewed.
4) Uploading Data from Instrument Buffer
Sensor
B uffe r
Acquisiton Device
Acquired data is uploaded to the PC hard disk from the device buffer.
As in the previous scenarios, selected display channels can be
viewed.
Hard Disk
Computer System
Hard Disk
Computer System
What ChartView and ChartView Plus Provide
ChartView and ChartView Plus provide you with the capability to connect to, and control any member of the
ChartScan, NetScan, MultiScan, or TempScan family of data acquisition instruments, as well as:
Create and edit chart display s etups ………………………………
Set up analog input parameters (selecting: Channels, …………
TC types, Units) to acquire dat a.
Configure alarms, log alarms………………………………………. See pages 4-24, 4-33, and 4-36.
Configure and arm an acquisiti on…………………………………..
View real-time display of channel data via the Main Wi ndow….
Save data to disk……………………………………………………..
Transmit data to Microsoft Excel via DDE (Dynamic Data ……..
Exchange).
PostView
Start
, an independent application that al l ows you t o… See Chapter 5,
graphically view data channels from a file.
Use remote RS-232 com munications by attaching the ………….
acquisition device to a modem configured for Aut o Answer
Display Configuration
See
Chart Setup Wizard
Setup Window
See
Acquisition Setup Di al og B ox
See
Main Window
See
File
See
, page 4-16 and
Data
See
, beginning on page 4-20.
, beginning on page 4-41.
, beginning on page 4-33.
, beginning on page 4-4.
PostView
Device
See
, page 4-23.
, beginning on page 4-9 and
, page 4-36.
Data Destination
, page 4-39.
.
NetScan User’s Manual ChartView Software Reference 4-3
Page 42

Main Window
While using this chapter, refer to the Main Window figure and its associated control option table as
needed. Because of the graphic aspect of the window, you should be able to develop a good
understanding of the program’s capabilities and associated operating techniques within a very short
time.
The following comments apply to the figure and table on the following page.
•
•
Channel Selection (14) can also be made by tabbing to the Center Control (17) or Units/Div
•
The min and max scale values (13) and (19) are automatically generated, but can also be set from
•
You can use the Chart pull-down menu to turn grid limit lines Off, or On. Limit lines can be solid
•
In regard to the time stamp (region 21), if you stop the chart the time stamp will begin at 00:00:00
•
Mor e detailed information regarding the pull-down menus and toolbar buttons is provided
In regard to the control option table presented on the facing page, the symbols: (mouse),
(arrow keypads), (Page Up/Page Down keypads), and [spacebar] are control options that allow
you to tab to a field and make changes with the specified control.
Control (18) and using PageUp or PageDown ().
the Chart Setup Dialog.
or dots.
upon restarting the chart (if using relative time), or at the real clock time (if using absolute time).
throughout the chapter.
Ú
4-4 ChartView Software Reference NetScan User’s Manual
Page 43

ChartView Main Window and Control Options
= Mouse, Ú= Arrow Keypads , = PageUp/PageDown Keypads
1
Group Select
2
Start Charts and
Indicators
3
Pause Charts
4
Stop Charts
5
Scroll Faster
6
Scroll Slower
7
Display Configuration
8
Channel
Configuration
9
PostView post- acq
data viewer
10
Arm Acquisition
11
Disarm …
12
Print Charts
13 Chart Max. Scale
Value (Grid Limit
Line)
or
or
Ú
Ctrl+G,
or,
F5
or,
F7
or,
F6
or,
Ctrl+Z
or,
Ctrl+X
or, Pointer over chart
and “right-click” Current
group will be selected.
,
or, Windows Pull-
down menu
or,
Ctrl+T
or,
Ctrl+Y
or,
Ctrl+P
From Chart Pull-d own
menu or Chart Setup
Dialog Box
14 Channel Selection
15 Multiply (x2)
16 Present V alue of Selected
17 Center (Value at Chart M i d-
18
19 Chart Min. Scale V al ue (Grid
20 Divide (÷2)
21 Time Stamp (hr:min:sec)
22 Status Message Box
23
24 Status LEDs
25 Chart Display
Note: The bulleted list on page 4-4 relates to this table.
or,
Ú
or, Tab-to/Spacebar
N/A
Channel
or,
Line)
Units/Division
(Vertical increment per one grid
box)
Limit Line)
Time/Division (Chart Speed),
the Horizontal increment per
grid box
From Chart Pull-d own
menu or Chart Setup
Dialog Box
Thru Pull-Down Menus
only
N/A
Ctrl+Z (Faster)
Ctrl+X (Slower)
N/A; For Windows3.1
see note on page 4-7.
, or type-in
Ú
or,
, or type-in
Ú
or, Tab-to/Spacebar
Double-click left mouse button in selected chart to zoom in or
zoom back out. Right-click to bring up Chart Setup Dialog Box
with the current group and target chart selected.
NetScan User’s Manual ChartView Software Reference 4-5
Page 44

Channel Information Region
Channels can return values in units of °C, °F, °K, °R, mV, V, or user
defined units (if the mX + b option is used). With exception of mX + b
user defined-units, units depend on the configuration and type of signal
conditioning card used. Signal conditioning cards are detailed in the
user’s manual for you data acquisition device. The Channel
Information Region is located on the right-hand side of ChartView’s
main window. The values displayed in this region are the real-time
values of the selected channel.
By clicking on the up or down arrows (
σ
, or τ) by the channel selection
box (item 14), you can select one (of a maximum of 4 channels) that
were assigned to a chart. You could then observe the chart-related
information of the chosen channel.
You can also select a new channel for the information region by placing the cursor in (or tabbing over
to) the “Center” or “Units/Div” fields and then pressing PageUp or PageDown. This is particularly
useful when your main window has been re-sized such that the channel selection boxes are not visible.
The following list identifies the various areas of the region.
13 Chart Max. Scale Value
(Grid Limit Line)
14 Channel Selection
(Of chart’s available channels)
15 Multiply (x2) 19 Chart Min. Scale Value (Grid Limit Li ne)
16 Present Value 20 Divide (÷2)
17 Center
(Value at chart mid-li ne)
18 Units/Division
(Provides the vertical increment of one grid box.)
Note: The basic ChartView program does not permit overlapping channels or having more than
one chart group. Multiple group applications (ChartView Plus) can be activated by use of a
special code, allowing up to four overlapping channels per chart. Regardless of whether you
are using the basic ChartView program, or ChartView Plus, there is a maximum limit of 16
charts per group.
Multiply and Divide Buttons -
In addition to reading channel values, you can increase or decrease the
size of the selected channel’s chart. This is accomplished with the Multiply (15) and Divide (20)
push-buttons. The Multiply push-button effectively increases the size of the selected channel’s chart by
a factor of two, while automatically adjusting the chart’s high and low values (items 13 and 19). Aside
from “clicking” on the Multiply/Divide controls, you can use your keyboard spacebar to control this
feature once the button (15 or 20) is selected. Selection may be with mouse, or by tabbing over to the
control.
Making changes to a channel’s chart parameters does not affect the parameters of the other channels,
with the following exception: Holding the keyboard’s control key down while adjusting either spinner
σ/τ
(
) for center (item 17), or spinner for units/div (item 18) causes the parameter change to apply to all
channels displayed for the chart, not just the currently selected channel display. This feature applies to
the spinners and keyboard up and down arrow keys, but not to the text input.
Center Control - The Center
control (item 17) changes the value of the selected channel’s chart
centerline. Changing the value of center results in an automatic change of the chart’s high and low end
values (items 13 and 19), and possibly an automatic change of the units/div (item 18). Aside from
using the center spinner controls to change center, you can change the center value by placing the
mouse cursor in (or tabbing over to) the field and then either typing in the desired value, or using the
PC keyboard up and down arrow control keys.
4-6 ChartView Software Reference NetScan User’s Manual
Page 45

Units/div - The units in units/div
vertical grid. In the example above for Channel 1, each vertical grid increment represents 10.58°C per
division. Changing the uni ts/division spinne r controls (
max scale and min scale va lues (items 13 and 19). Aside fr om using the units/div tria ngular control s to
change the value, you can change units/div by placing the mouse cursor in (or tabbing over to) the field
and then either typing in the desired value, or using the PC keyboard arrow control keys.
Status Indicator Region
The status indicator region of the Main Window, located along the bottom of the window, consists of
the following items:
(18) can be °C, °F, °K, °R, mV, or V. The division referenced is one
σ/τ
) will result in an automatic adjustment of the
21 Scrolling Time 23 Chart Speed (Time/Div)
22 Status Message Box 24 Status LEDs
Scrolling Time - Scrolling Time (21) is turned On or Off from the V
1
iew pull-down menu. Time Stamp
can be “absolute” (real time) or “relative.” Absolute time is based on your computer clock, whereas
relative time starts at 00:00:00 hours/minutes/seconds, and then continues timing in increments relative
to the Chart Speed (23). The Absolute or Relative time stamp style is selected from the Chart
pull-down file.
Status Message Box - The Status Message Box (22) informs you of the status of the data acquisition
device. Several sample messages ap pear below:
Sample Status Messages
Attaching to device … Trigger device. Setting acqui sition parameters.
Setting channel configurat i on … Acquisition active. Updat i ng active.
Setting the acquisit i on parameters. Acquisition acti ve. No updating.
Charting … Waiting for t ri gger …
Chart Speed - Chart Speed (23) consists of a “time per division” value that can be changed using the
“faster” (rabbit) button or “slower” (turtle) button. Fourteen possible chart speeds are as follows:
0.1 sec/div 1 sec/div 10 sec/div 2 min/div 30 min/div
0.2 sec/div 2 sec/div 30 sec/div 5 min/div 1 hr/div
0.5 sec/div 5 sec/div 1 min/div 10 min/div
Status LEDs
1
- ChartView’s Main Window contains five virtua l LEDs (item 24) for conveying the
state of the system. Each of the five indicators is labeled on the main window. These indicators are:
Initializing:
Charting:
Disk:
Buffering in
Instrument:
Uploading:
Note 1:
NetScan User’s Manual ChartView Software Reference 4-7
The
However, when using Windows 3.1, the labels will appear at the time the function is active,
e.g., when uploading, the text “[Uploading]” shows in region 24. This text message is in
addition to the text in the
Indicates
Indicates charting is in progress . This indicator is useful when charts are scrolling at a very
slow speed.
Indicates
Indicates the data acqui sition instrument i s storing scans that are not being saved to disk.
Indicates data in the instrument is being uploaded to t he PC.
Status LEDs
ChartView
ChartView
and their labels (listed above) do not appear when using Windows 3.1.
is configuring the data acqui sition instrument.
is writing to disk.
Status Message Box
(Item 22).
Page 46

Main Window Toolbar
Each item in the toolbar, with exception of Group Select (1), is represented by an individual button
icon. Toolbar-related functions can also be activated from pull-down menus (discussed later). Placing
the cursor on the button and clicking the mouse button enables the tool, or opens a corresponding
dialog box. Each Toolbar button has a pop-up label that appears when the mouse is placed over the
button.
Note: The toolbar represented below is for ChartView’s Main Window. Separate toolbars exist for
Bar Graph, Digital Meters, and Analog Meters options (selectable from the Windows pull-down
menu.) These other toolbars are discussed later in the chapter.
1 Group Select 7 Display Configuration
2 Start Charts and Indicators 8 Channel Configuration
3 Pause Charts 9 PostView post-acq d at a viewer
4 Stop Charts 10 Arm Acquisition
5 Scroll Faster 11 Disarm …
6 Scroll Slower 12 Print Charts
Group Select
This feature indicates the chart group being charted. Clicking on the down arrow (τ) reveals other chart
groups configured by the user. The standard ChartView program allows the use of only one chart
group, while ChartView Plus can be configured to display up to 64 groups (one group at a time). To
select a different chart group, simply pull down the group list and select the desired group. The group
list can be obtained by any of the control options provided in the table on page 4-5. These are: a)
clicking the do wn arrow (
arrow key, d) using the page up or page down key. If using a control option other than “a,” you may
need to select the group select box by repeatable pressing the keyboard’s Tab key until the group select
box is selected. The name of the currently selected group appears in white on a dark background.
τ
)), b) using Ctr l + G on the keyboar d, c) using the keyboard up or down
Start, Pause, and
Stop Charts
As their names imply, these three buttons are used to start, pause, or stop the charts. Pressing “pause”
suspends chart scrolling, but does not stop the “charting” process. While “pause” is pressed, the
channel region of the main window will continue to display real time values. Pressing “pause” a
second time restarts the scrolling action. Pressing “stop” causes the charting process to stop and
instantly freezes the channel region at its present values. This does not affect the acquisition.
Scroll Faster &
Scroll Slower
These buttons provide a means of speeding up and slowing the chart’s scrolling rate, also referred to as
chart speed. These two buttons do not affect the scan rates of the acquisition device. The chart speed
(item 23) is indicated in the lower right-hand corner of the main window as time/div. There are 14
possible chart speeds, as follows:
0.1 sec/div 1 sec/div 10 s ec/div 2 min/div 30 min/div
0.2 sec/div 2 sec/div 30 s ec/div 5 min/div 1 hr/div
0.5 sec/div 5 sec/div 1 min/div 10 min/div
4-8 ChartView Software Reference NetScan User’s Manual
Page 47

Display
Configuration
The Display Configuration button accesses a Display Configuration Setup dialog box. This box will
also be displayed if: a) Create Charts Manually is selected during use of the Wizard Chart Setup
program, b) you select Setup from the Chart pull-down menu, c) you right-click on the chart region in
ChartView’s Main Window.
Note:
If multiple chart groups are present in the display configuration, the current group will be
selected in the display configuration tree.
When you first click on the Display Configuration button, a Display Configuration Setup box appears.
A display region shows the configured structure of the groups, charts, and channels. From this box,
you can select the number of charts to be assigned to a specific group. With the use of the mouse
cursor, you can also select a chart or channel for additional editing. In addition to the text presented in
the following sub-sections: Normal Edit and Manually Creating a Display, you can refer to the
following for related information:
•
The chapter 2 tutorial walks through a display setup from beginning to end.
•
In this chapter, Chart Setup Wizard provides information on the use of Chart Setup Wizard for the
set up of groups, charts, and channels.
Reference Note:
For the very first display setup, or when the configuration file has been
deleted, you will need to use Chart Setup Wizard. First time use is discussed in the
ChartView tutorial of Chapter 2. Additional Chart Setup Wizard information begins on
page 4-41.
The method you use to access the Display Configuration Setup window makes a difference. When you
use the toolbar button or the pull-down menu’s Setup selection, the Display Configuration Setup
window appears with the current chart display configuration intact. With this type of access you
would simply edit your existing chart display. Channel and alarm configurations do not change, with
exception that newly displayed channels will be enabled.
When you access the Display Configuration Setup from the Chart Setup Wizard, the Display
Configuration Setup window appears with no existing display. This allows for a “clean slate” approach
to creating a chart display, as opposed to an “editing” approach. Channel and alarm configurations do
not change, with exception that newly displayed channels will be enabled.
Normal Edit
To explain editing a configuration, we make use of an example where changes are desired for Chart 1.
In the following figure, Chart 1 was highlighted by clicking on it with the mouse cursor. The Display
Configuration Setup box then changed, allowing you to see specific channel types (such as volts only)
or to “Show all Types,” as in the example. From this setup box you can add or delete charts and
channels. You can:
•
hold down the
•
hold down the
•
double-click on an
•
double-click on a
NetScan User’s Manual ChartView Software Reference 4-9
Shift key
Ctrl key
and use the
and use the
available channel
selected channel
cursor
to select several consecutive channels for additi on or del et i on
cursor
to select several non-consecutive channels for additi on or del et i on
to add it to the selected channels
to remove it from t he selected channels lis t
Page 48

Display Configuration Setup Dialog Box with an Existing Configuration
Note: When a chart contains overlapping channels [and the channels share values such that their traces
reside on top of each other], then the channels listed lower in the display list (the most recently added
channels) will obscure the channels higher in the list (those that were added first).
Adding Channel 2 to Chart 1
Another variation of the Display Configur ation Setup bo x appears when you highlight a channel. In the
following figure, Channel 1 (of Chart 1, Group 1) was selected, resulting in a new screen image. From
this screen, you can edit the channel setup.
4-10 ChartView Software Reference NetScan User’s Manual
Page 49

Adjusting Channel Setup for Channel 1
ChartView
and
ChartView Plus
data channels can operate in one of two modes: Units Full Scale or,
Units/Div. The mode is selected by radio button.
Units Full Scale. When Units Full Scale is selected, as depicted in the above figure, you can alter
Y Max and Y Min. These are the upper and lower limits of the Channel as they will appear on the
chart when the channel is selected. When you change either parameter, Y Center and Units/Division
are automatically adjusted. You can not directly adjust Y Center or Units/Division while “Units Full
Scale” is selected. You can change Y Max and Y Min by using the up and down arrows, or by
highlighting the existing va l ue, typing in the new value, the pressing “Enter” on your PC keyboard.
Note: If the window size is changed, a chart operating in the Units Full Scale mode will maintain its
full scale
setting across the chart.
Units/Div. When Units/Div. is selected, you can alter Y Center and Units/Div. Y Center is the
centerline value of the chart when the channel is selected. Units/Div. is the vertical value of on chart
grid increment. When you change Y Center or Units/Div. Y Max and Y Min are automatically
adjusted. You can not directly adjust Y Max or Y Min while “Units/Div” is selected. You can change
Y Center and Uni t s /Div. by using the up and down arrows, or by highli ghting the existing value, typing
in the new value, the pressing “Enter” on your PC keyboard.
Note: If the window size is changed, a chart operating in the Units/Div. Mode will maintain its
units per division scale
The channels (in the display) will be enabled, and will appear in
Channels will overlap on their assigned Chart (for
setting across the chart.
ChartView Plus
ChartView’s
Main Window. The
applications), and will be visible
when the applicable Group is selected. Only one group of charts can be viewed at a time.
It is important to understand that other channels (those not in the display setup) maintain their existing
configuration status. They are not affected by the edit of the configuration display.
You can enable additional channels from the Channel and Alarm Setup window. Enabling additional
channels allows you to acquire more data; however, it will not change your display on
ChartView’s
Main Window. In other words, you ca n acquire dat a from channels you do not monitor.
NetScan User’s Manual ChartView Software Reference 4-11
Page 50

Manually Creating a Display
For ChartView Plus users, if you plan to have a chart setup that is not weighted evenly, i.e., different
numbers of channels per chart and different numbers of charts per group, you may want to manually
setup your chart display from scratch, i.e., without beginning from a pre-existing display configuration.
This method is arrived at from the Chart Setup Wizard window by selecting “Manual Chart Creation.”
When this button is clicked, the program exits the Chart Setup Wizard and enters the manual method of
Display Configuration Setup. Although this method is referred to as “manual,” it still contains some
automatic elements, such as Automatically Add Groups to the Setup (available with ChartView Plus).
Note: Even if an unevenly distributed chart display is desired, you can always edit a pre-existing
chart setup, or create a new setup by one of the Chart Setup Wizard’s automatic methods, and
then edit the setup.
To manually setup your chart display, using the “clean slate” approach (as opposed to “editing an
existing display”) perform the following steps.
1. Select Wizard from the Chart pull-down menu of ChartView’s main window. The New Display
Setup dialog box appears.
2. Click OK on the New Display Setup dialog box. The Wizard setup window appears (see following
figure)
3. Click on the Manual Chart Creation button. The Display Configuration Setup box appears. Since
the previous display configuration was reset, no groups or charts are seen in the display area on the
left side of the screen.
Note: If you have ChartView Plus, you will be allowed to have more than one group, as well as
overlapping channels (up to four per char t). If you have the basic ChartView program, you
will be limited to one group, and only one channel per chart.
Display Configuration Setup, The “Clean Slate” Approach
4. As seen in the previous figure for the “Clean Slate” approach, you have two options at this point.
Perform (4a) or (4b) as appropriate. With ChartView Plus, option (4a) is typically used.
4-12 ChartView Software Reference NetScan User’s Manual
Page 51

Automatically add groups to the setup
(4a)
and typing in the value, or by using the pull-down arrows (τ) and making the appropriate selections; then click
on the Create Groups button.
Manually add groups to the setup
(4b)
Group button.
The Display Configuration Setup screen changes to show chart groups, and the number of charts
. Enter the number of groups and charts desired by using the cursor
. Type in the name of the chart group; then click on the Add Display
for the selected (black highlighted) chart group. From this screen you can change the number of
charts in a group, as well as change the group name.
Adding a Chart to Group 1
5. Change the number of charts per group if desired.
6. Change the group name if desired.
7. Click on a group to see the chart(s) assigned to the group. In the above example there is one group
with one chart.
8. Click on a chart to assign channels to the chart. A screen similar to the following will appear.
Assigning Channels to Chart 1 of Group 1
NetScan User’s Manual ChartView Software Reference 4-13
Page 52

9. Choose channels for the selected chart. With ChartView Plus, you can select up to four
overlapping channels per chart. With the basic ChartView program, you are limited to one channel
per chart. There are four methods of adding channels. These are as follows:
•
Highlight an available channel using t he cursor and left-hand mouse button; then click the A dd but ton.
Repeat for each channel to be added.
•
Double-click on the channel (i n the available channels list t o add; in the selected channels l i st to remove)
•
Hold down the keyboard’s
available channels (up to 4); then click the Add button. E xam pl e: CH3, CH4, CH5,CH6.
•
Hold down the keyboard’s Ctrl button and use the l eft-hand mouse button to s el ect up to 4 available
channels (these can be non-cons ecutive); then click t he A dd button.
Example: CH1, CH3, CH5, CH7, as i n the previous figure.
Shift Key
and use the left-hand mouse but ton to select a block of consecutive
Note: You can also remove channels in a similar manner by highlighting a channel(s) in the Sele ct
Channels box, and then clicking on the Remove button. In the previous figure, CH7 (in the
select box) is highlighted. Clicking the Remove button would delete the channel from
Chart1.
Note: When a chart contains overlapping channels [and the channels share values such that their
traces reside on top of each other], then the channels that are listed lower in the display list
(the most recently added channels) will obscure the channels higher in the list (those that
were added first).
10. In the display area (on the left-hand side of the screen) click on a channel to check the channel’s
configuration and to re-configure the channel, if desired. The Display Configuration Setup
Window will appear similar to the following figure.
Note: Changing the display configuration does not change the existing channel and ala rm
configuration. It only changes how the chart groups, charts, and channels will be displayed.
This screen contains two “radio buttons” for selecting the method of adjusting the display mode
and channel setup. It is the same screen discussed in the sub-section, Editing an Existing Display
Configuration. From this screen you need to choose Units Full Scale or Units/Div. Each method
was previously discussed (see page 4-11).
Adjusting Channel Setup for Channel 1
Remember, you can enable additional channels from the Channel and Alarm Setup window. Enabling
additional channels allows you to acquire more data; however, it will not change your display on
ChartView’s Main Window. In other words, you can acquire data fr om channels you do not moni t or.
4-14 ChartView Software Reference NetScan User’s Manual
Page 53

Channel Configuration
The “Channel Configuration” button brings up the Setup Window with one of three “tabbed” dialog
boxes displayed: Acquisition Setup (page 4-33), Channel & Alarm Setup (page 4-33), or Data
Destination (page 4-39). The information entered in the Acquisition Setup dialog box is used by the
Arm Acquisition command to set up the acquisition of data to disk. When the trigger is satisfied, the
scans are collected at the selected scan frequency and stored to disk in the designated file. The
Channels & Alarms dialog box is used to configure channels and alarms; the Data Destination dialog
box is used to assign a filename and folder location for data, select an Excel or binary format (
.IOT
respectively), and to select optional Time/Date and/or Alarm Stamps (to be included in the data)
if desired. You can tab back and forth from each one of these dialog boxes to the other.
PostView post-acq data viewer
The “PostView post acquisition data viewer” button accesses the PostView program. This independent
program allows you to view waveforms recorded by data acquisition programs such as ChartView,
ChartView Plus, and TempView. PostView is detailed in Chapter 5 of this manual.
Arm Acquisition
You can use the Arm Acquisition button to activate an acquisition. When you click on this button the system is
“armed” to begin collecting data by a recognized trigger (as set in the acquisition setup dialog box.) Three cases
are as follows:
.TXT
or
1) If there is no Pre-trigger defined, the Trigger option under the Event Configuration portion of the
2) When a Pre-trigger is defined, the Arm process is initiated as soon as the Arm Acquisition is selected.
3) If a keystroke is chosen as the trigger, the Console Trigger dialog box will appear when the Arm
Disarm...
Use the “Disarm…” button to deactivate the data acquisition process at any point during an active acquisition.
The following confirmation dialog box will appear when this item is selected.
Acquisition Setup dialog box will determine when the Arm process is initiated.
Acquisition is selected.
NetScan User’s Manual ChartView Software Reference 4-15
Page 54

Print Charts
The Print Charts button activates a screen print of ChartView’s main window.
Main Window Pull-Down Menus
The ChartView main window features several pull-down menus. As an alternative to the menus, you
can enable several menu items by using Toolbar buttons, previously discussed. The common items (for
the pull-down menus and toolbar) are described in more detail in the Toolbar section.
File
(see File Menu Note, immediately following this text)
New
(Ctrl + N)
Open…
(Ctrl +O)
Save
(Ctrl + S)
Save As…
Print…
(Ctrl + P)
About…
Sets all channel parameters to their startup (factory default) setting.
Sets all channel parameters as directed by a specified configuration file (
ChartView
files.
Saves the existing all-inclusive channel configuration set t ings for later recall. The Save
command overwrites the exist i ng version if the versions are nam ed t he same.
Saves the existing configuration for later recall; asks whether to overwrite the original version or
save under a new filename.
The Print Charts button act i vat es a screen print of
contains overlapping channels [and the channels share values such that their traces resi de on
top of each other], then the channels listed lower in the display l i st (the most recent l y added
channels) will obscure the channels higher in the list (t hose that were added first).
Clicking
version number.
entering a valid Registration ID Number and clicking the OK but ton. Your program can be
registered through your service representative.
Setup window prompts you to select from a list of previousl y saved configuration
About
will display a “
ChartView Plus
ChartView
ChartView’s
ChartView Plus
” or “
can be activated from t he
main window. When a chart
” dialog box, as well as the software
ChartView
.cvw
). The Load
dialog box, upon
Dialog Boxes for ChartView and ChartView Plus
Exit
4-16 ChartView Software Reference NetScan User’s Manual
Exits the
ChartView
program
.
Page 55

File Menu Note
When ChartView is started for the very first time there is no default channel configuration file. In this
case a ChartView Startup dialog box appears, providing you with the following four choices: Retry,
Select Device, Load File, and Exit Program. After choosing Select Device a Select Interface dialog
box appears, allowing you to choose IEEE 488, RS-232/422, Network, or Simulated Instrument.
For ethernet operation, “Network” must be selected as the device interface.
Note: NetScan devices can not make use of the IEEE 488 selection.
After the selection has been made, when ChartView is shutdown, the selected interface device and all
channel configuration settings will be automatically saved in a default configuration file. Upon the
next start of ChartView, the default configuration is automatically loaded.
If the default configuration becomes corrupt, or if you would like to bypass the default configuration
when starting ChartView, you can hold down the Shift Key when starting ChartView. This causes the
program to ignore the default channel configuration settings and causes the ChartView Startup dialog
box to appear. This allows you to select Load File to make use of a specified channel configuration
file from a previously saved configuration.
Chart
Wizard Ctrl+W
Setup
Accesses
Accesses Chart S etup window, allowing you to edit your display configurati on.
Chart Setup Wizard
feature for automated chart configuration.
NetScan User’s Manual ChartView Software Reference 4-17
Page 56

Display config.
Allows you to: Open a previously saved display configuration file, save the current
display configuration fi l e, or save the current display configuration file in a different
location (or under a different fi l e name). (See following note).
Note:
Start F5
Stop F6
Pause F7
Next Group Ctrl+G
Faster Ctrl+Z
Slower Ctrl+X
Zoom
[ Restore ]
Grid limit lines
Off Ctrl+F1
Solid Ctrl+F2
Dots Ctrl+F3
There will be no default Display Configuration file present the first time
started. In this case,
setup. When
a default configuration file that will load upon the next startup of
If the default display configuration becomes c o rrupt , or if you would like to bypass this
configuration when starting
ChartView
starting
and await your creation of a new display.
Starts, stops, or pauses chart scrolling.
Selects the next chart group in t he di splay configuration.
Used to alter the chart sc rol l i ng speed. There are fourteen possible chart speeds. The
range of speeds is from 0.1 sec/div to 1.0 hr/div.
causes the Main Window to display one chart only. For example, i f you were
Zoom
viewing 3 charts and desired to get a bett er vi ew of Chart 2, you could use Zoom to
view Chart 2 using the full chart viewing area, as compared to using one third of the
area. The zoom feature can also be i nvoked by double-clicking in the c hart region of
the chart you want to apply the zoom t o.
Once you have zoomed in on a chart, the pul l -down m enu Zoom option is replaced by a
Allows you to turn the chart’s grid limit lines (items 13 & 19) on or off. If “on”, you can
option. Selecting
Restore
previous multiple chart viewing status. The restore feat ure can also be invoked by
again double-clicking in the chart region.
have the grid lines appear as solid or dot s.
Chart Setup Wizard
ChartView
is shutdown, the display conf i guration is automatic al l y s aved i n
. This causes the program to ignore the default display c onfiguration
ChartView
estore
R
activates, allowing you to c reat e a di splay
, you can hold down the Control Key when
from the menu will return the main window to its
ChartView
ChartView
is
.
Timestamp
Absolute Ctrl+F4
Relative Ctrl+F5
View
Toolbar
Timestamps &
Chartspeed
Statusbar
Allows you to select an Absolute or Relative style of timestamp.
A 9 by Toolbar indicates the toolbar will be visible. The absence of the 9 indicates the
visible toolbar option is not chosen, and in t his case will not appear on the Main Window.
Use the mouse to select or de-select the toolbar opt i on.
A 9 by Timestamps & Chartspeed indicates the opti ons are selectable and visible. The
absence of the 9 indicates the timestamp/charts peed opt i on i s not chosen, and therefor
not visible on the Main Window. Use the mouse to sel ect or de-select this opt i on.
A 9 by Statusbar indicates the Status Message Box and Status LEDs are visible (items
22 and 24, page 4-5). The absence of the 9 indicates the status bar will not be visible
on the Main Window. Use the mouse to select or de-select this option.
4-18 ChartView Software Reference NetScan User’s Manual
Page 57

Options
System
Acquisition
PostView Comment
Charts
Option Settings incl udes three separate dialog boxes, accessible by tabs, as indicat ed i n
the following screen captures.
Restricts Scroll Speed to Eliminate Aliasing
It is possible for chart displays to exhibit alias i ng when using ChartScan, NetScan, or
MultiScan devices. The ali asing effect can be eliminated from the display by enabl i ng the
“Restrict scroll speed to actual scan rate” feature. This reduces the scroll speed to a
range that results in non-aliased displays.
Determines Communication Timeout in Seconds
The system communications timeout det ermines how long the software will wait before
declaring a detected com munications error. If l i nked to Excel, the
(indicated in the above figure) will be overridden by the timeout value in the
Configuration for Excel
dialog box (accessed from the Dat a pul l-down menu).
system timeout
DDE
value
PostView Comment and Auto Re-arm Trigger Options
Enabling this option allows the us er to enter a comment in a text box located in the
Setup/Data Destination di al og box. The fol l owing screen capture provides an example.
The message is stored i n the header file (that is created when an acquisition saves data to
disk.)
The PostView Comment option should only be used for systems having PostView version
3.3 or later. The comment field in the header file is not compatible with the earlier versi ons
of PostView.
Example of a Data Commentary Entry for PostView
When in PostView (version 3.3 or greater), the data commentary can be read by select i ng
Data Commentary
in a message box.
from PostView’s Option pull-down menu. The commentary is di splayed
NetScan User’s Manual ChartView Software Reference 4-19
Page 58

Acquisition
(continued)
Acquire
Arm Acquisition
(Ctrl + T)
Disarm…
(Ctrl + Y)
Automatic Keyboard
Trigger
on Auto Re-arm
Arms the data acquisition device in preparation of recei vi ng a t ri gger.
Disarms the data acqui sition device and disconti nues the acquisition of data.
This feature works in conjuncti on with
used. Auto Re-arm is di scussed on page 4-39.
If the option is disabled,
re-arms. ChartView displays the Trigger dialog box and waits for the trigger button to be
pressed by the user before beginning the next acquisition.
If the option is enabled
automatically sent to the acquisition device. The automatic trigger may be delayed by up
to 2 seconds (after the previous acquisition has fini shed).
acquisition data is saved to disk, and the device aut omatically
(3), the trigger dialog box is not displayed and t he trigger is
Keyboard Triggering
when
Auto Re-arm
is being
Acquisition Status...
Start All Indicators
Stop All Indicators
Data
DDE Configuration for Excel…
Displays the condition of a data acquisition.
Starts all selected indicators for: the s preadsheet Reading column, Charts, and Meters.
Stops all selected i ndi cators for spreadsheet Reading c ol umn, Charts, and Meters.
Configures the DDE (Dynamic Data Exchange) operation of
down menu allows you to dynamically load c o l l ected
Excel spreadsheet. The three field regi ons are: Command Characters , Data
Destination, and Timeout . These are discussed on the fol l owing page.
ChartView
ChartView
. This pull-
data into an open
4-20 ChartView Software Reference NetScan User’s Manual
Page 59

Command
Characters
This area contains two fields for entering command characters, one for row setting and one for c ol umn
setting. Enter the c haracters (Excel parameters) to match the applicable versi on of Excel; for example:
France
- Row = L, Column =
Germany
United States
- Row = Z, Column =
C
S
- Row = R, Column = C.
Data Destination Assign the Data Destination.
Timeout Region
Link to Excel…
Upload Data
During
spreadsheet. Specify t he data starting point by entering a number for row, and another for column. The
two numbers designate the upper left hand corner cell of the Excel data entry.
Positioning Data in Excel.
regard to positioning data in Excel on subsequent scans. Options are as follows:
Row 1 Column 1
spreadsheet. Changing the values in the “Row” and “Column” boxes (above figure) will automatically enter
the new values in the corresponding fields of the “Row # Column #” placement ass i gnment. For example,
If you entered a 3 in the row box and a 5 in the column box you would see Row 3 Column 5, ins tead of
Row 1 Column 1, in the above figure; and the next sc an would start at row 3 column 5 in Excel.
Row after last scan
where the previous acquisition left off.
Prompt each time
will ask if you want to
spreadsheet, starting with t he existing column and row designation. If you select “No,” the next scan will
begin on the spreadsheet’s next row (from where the previous acquisition left off ).
Increment the Row on each new scan.
rows, one row for each new data scan. Wit h no check-mark, the s preadsheet will make use of one row
only and will continue to display the latest scan inform at ion in t hat row.
Timestamp Format.
Setup/Destination dialog box. I f this is the case, you can select a pre-configured format for the times tamps
sent to the Excel spreadsheet. Available formats are indi cated in the previous screen capt ure. This
feature only affects t he timestamp fo rmat in the Excel spreadsheet. It has no effect on timestamps saved
to disk.
This field allows you to enter a DDE li nk timeout value from 5 to 3276 seconds. The value is how long the
data import to Excel can be suspended while you perform a second Excel ac tivity, such as dis pl ayi ng
graphs. A screen mes sage informs you when the DDE link i s timed out, terminating the DDE link to E xcel.
Creates DDE link to Excel spreadsheet. Excel must already be runni ng, and Excel Format must be
selected in the Setup/Data Destination dialog box.
Enables
active.
ChartView
. This selection starts the next scan at the designat ed row and column on the Excel
. When “Prompt each time” is selected, after each acquisit i on i s completed a dialog box
The data destination region also all ows you t o select one of three options in
. When “Row after last scan” is selected the next scan will begin at the point in Excel
return to origin
This feature can only be used if
to retrieve scans from device memory as data becomes available. The acquisition is
Acquisition
(automatic control )
This area allows you to assign the data destination on the Excel
. If you select “Yes”, you will have an overwrite on the Excel
With this selected (9), the Excel spreadsheet will use multiple
Timestamps
have been enabled in the
ChartView’s
Stop Upload
(Ctrl + J)
control)
NetScan User’s Manual ChartView Software Reference 4-21
(manual
Stops
transfer of data from the instrument to dis k.
Page 60

Upload Available
Scans
(Ctrl + U)
control)
(manual
Enables
ChartView
scans that are currently avai l abl e.
to access device memory for all scans currently available. This func t ion only uploads
Upload Scans
Until Done
Window
Bar Graph Meters
Analog Meters
Enables
Selecting Bar Graph Meters from
This window displays several channels in bar graph format. To activate t he display, select the S tart button
in the meter toolbar. At least one meter must be assigned to an
view up to 32 meters at a given time. (See page 4-28).
ChartView
to access device memory and upload scans unti l scanning is complet e.
ChartView’s
Window pull-down menu brings up the B ar Graph window.
(On) channel. You can select t o
active
Selecting Analog Meters from ChartView’s Window pull-down menu brings up the Analog
Meters window. This window displays several channels in a dial/gage format. To activate the
display, select the Start button in the meter toolbar. At least one meter must be assigned to an
active (On) channel. You can select to view up to 32 meters at a given time. (See page 4-29).
Digital Meters
PostView
data viewer
post-acq
Selecting Digital Meters from ChartView’s Window pull-down menu brings up the D i gital
Meters window to display several channels in numeric format. To activate the display, select
the Start button from the toolbar. At least one meter must be assigned to an active (On)
channel. You can select to view up to 32 meters at a given time. (See page 4-30).
The “PostView post acquisition data viewer” selection accesses the PostView program. This
independent program allows you to view waveforms recorded by data acquisition programs
such as ChartView, ChartView Plus, and TempView. PostView is detailed in Chapter 5 of this
manual.
4-22 ChartView Software Reference NetScan User’s Manual
Page 61

Device
… Interface
¾
¾
Setup IEEE 488
Setup
RS-232/422
The IEEE 488 Setup dialog box appears. Valid addresses are 0 to 30. DIP switch settings must agree
with this setup. For ChartScan, an IEEE 488 interf ace card is required for use of IEEE 488 interface.
NetScan devices can not mak e us e of the IEEE 488 interface.
When using ChartView with IEEE 488 applications, you must make use of an IOt ec h Driver 488/W31, /W95,
or /WNT when made available. In addition, the device must be configured in the Driver 488 and be named
WAVE.
NetScan devices can not mak e us e of the IEEE 488 interface.
The RS-232/422 Setup dialog box appears. If “Yes” is c hosen for modem, the RS-232/422 Setup window
changes, allowing you to cancel your
phone number. The Cancel Code pull-down list provides three common code opt i ons. Instead of using a
code from the list , you can type in the desired code. Note that the device DIP switch settings must match
those entered in the text boxes.
call waiting
service by entering your cancellation code and your modem
Comm Port
Baud Rate
Parity
Handshaking
Modem
Cancel Codes
Call Waiting
for
NetScan User’s Manual ChartView Software Reference 4-23
1-16
300, 600, 1200, 2400, 4800, 9600, 19200
None, Odd, or Even
None or RTS/CTS
No or Yes
*70, 70#, 1170, or type in other acceptabl e code
Page 62

Network
Network brings up the Network Interface S ettings dialog box. A valid registrat i on number must be entered
st
screen below) to gain access t o t he ChartView’s Network Interface support f eature. The second dialog box
(1
allows users of NetScan or Net232 t o configure the ethernet interface.
Simulated
Instrument
Device
… Status
Instrument
Inventory
Alarms
Status
The program will generate data from a sim ulated instrument with no actual hardware concerns.
¾
¾
Accesses the S ystem Inventory dialog box.
Brings up selection list for Status, Log configuration, and Log Enable
Brings up the Alarm St atus box. The Alarm Status box shows the current state of each alarm. The alarm state
appears as either a “1” or “0”, the “1” being digital High, and the “0” being digital Low (0). A one-for-one
correlation between the alarm num ber and channel can only occur if each c hannel of a 32 channel [or less]
system is assigned to a dedicated alarm number.
Log configuration
Alarm logging is a feat ure of
instrument, and save selected informati on t o a file whenever any of the states change.
Alarm logging is implement ed by periodic ally polling the instrument; the tim e int erval between polls
is about one second. With this in m i nd, be aware any event that could trigger an alarm [
one second or less
4-24 ChartView Software Reference NetScan User’s Manual
ChartView Plus
], could be miss ed and not logged.
only. Alarm Logging allows you to monitor the Alarm s t ates of the
lasting
Page 63

From the Alarm configuration dialog box, you can define the information that will be saved in the log file.
Options include the Tim e and Date when the state change occurred, the A l arm number, the Channel(s) that
tripped the alarm along with the current readi ng, and the state of the alarm i tself or all alarms, ei ther 1 or 0.
Additionally you can define the c haracter that is used to separate the information in the f i l e. This is useful if
you want to read the file into a program that presents the information in a tabular format, such as Microsoft
Excel.
By using combinations of option settings you can def i ne how the alarm log file is filled. If you choose not to
save Alarm ID's (Alarm numbers) in combination with saving All Alarm States, your Alarm file will be saved with
one line of text each time an Alarm state change is detected during polling. The line will contain the opt ional
Time and Date and 32 digits, one f or each alarm, set to either 0 or 1. The left most digit bei ng Alarm one, the
rightmost Alarm 32. You can not choose to save channel information if you have selected not to save Alarm
ID's.
The following example shows what the Alarm log entries look like if this configuration is select ed:
1:21:10 PM 10/29/98 00000000000000000000000000000000
1:21:11 PM 10/29/98 01000000000000000000000000000000
1:21:13 PM 10/29/98 11000000000000000000000000000000
1:21:14 PM 10/29/98 00000000000000000000000000000000
If you choose to log Alarm ID's and multiple A l arm state changes are detec ted during a single poll, mult i pl e
lines of text will be saved in the log file; one for each alarm that had a state change. By examining the optional
Time and Date informat i on you can identify which lines in the Al arm log are associated with Alarms that were
detected during a specific polling event. If you have Alarm ID's enabled, you can also choose to log Channel
information. The channel i nf ormation contains the c hannel l abel and the current reading associated with t he
channel. The following example shows what the alarm l og entries look like if thi s configuration is selected:
1:39:46 PM 10/29/98 Alarm-01 (CH1-68.72) 1
1:39:46 PM 10/29/98 Alarm-02 (CH3-68.54) 1
1:40:11 PM 10/29/98 Alarm-01 (CH1-73.22) 0
1:40:12 PM 10/29/98 Alarm-01 (CH1-86.36) 1
1:40:27 PM 10/29/98 Alarm-01 (CH1-71.42) 0
1:41:10 PM 10/29/98 Alarm-01 (CH1-69.98)(CH2-71.24) 0
NetScan User’s Manual ChartView Software Reference 4-25
Page 64

Log Enable
(Ctrl+A)
Once an alarm log file exists , log enable can be used to activate the logging process; or to disabl e an
active log. A check -mark (9) preceding Log Enable indicates t hat the log is active. No check-mark
present indicates the alarm log has not been enabled.
Instrument Error
Status
Instrument
Realtime Clock
Brings up the Device Error Status dialog box. This box lists existing error types, including invalid
command and channel c onf i guration errors.
Brings up the Device System Time dialog box. You can adjust t he time and date settings from this
box.
Device … Configuration
You can expand the Device pull-down menu by pressing t he F12 function key (on your comput er keyboard) prior to
pulling down the menu. After pressing F12, the pull-down m enu will show a listing ent it led “Configuration.” The
expanded-menu setting is not saved i n t he configuration file when exiting
desired, you must press F12 each time you start
operator. The
troubleshooting by experienced technici ans.
Raw Thermocouple Input
¾
A Device Expanded Menu
¾
Raw Temperature Sensor Input
and
Device Status Dialog Boxes
(obtained with use of the F12 Key)
ChartView
This expanded menu is typically not us ed by the
.
ChartView
selections primarily exist as an aid in
. If the expanded menu is
4-26 ChartView Software Reference NetScan User’s Manual
Page 65

Setup
Channels & Alarms Ctrl+L
Acquisition
Ctrl+C
Data Destination
Accesses the Setup Window for configuring channels and alarms. From the
channels & alarms dial og box, you c an select the Acquisition Setup and Data
Destination dialog boxes.
Accesses the Acquisition Setup dialog box. From the Acquisition Setup box,
you can select the Channels & Alarms dialog box, as well as the Data
Destination dialog box.
Accesses the S etup Window for assigning t he Data Destination and provides a
means of configuring t he A uto Re-arm feature for
4-39). From the Data Destinat i on di al og box you can directly access the
Acquisition Setup and t he Channel s & Alarms dialog boxes.
Bar Graph, Analog, and Digital Meters
Overview
This section pertains to channel data display screens (windows, or dialog boxes) other than the main
chart screen (ChartView’s main window).
After a brief discussion and illustration of each meter type, commonalties to these three types of meters
is presented. These common areas include: Toolbars, Pull-Down Menus, and two special Pop-Up
Menus, one for configuring the meters, and the other for replacing a represented channel with another.
Note: T he acquisition-to-disk has a higher priority then the updating of Charts, Meters, and the Reading
column. Therefore, data is displayed as soon as the acquisition task is satisfied. As the scan rate is
increased, the acquisition-to-disk task will take up more processor (CPU) time and the displaying of
data will be updated as time allows. If you select linear conversion (
configuration you should expect a further impact on real time display performance. The
conversion is discussed in the section, Channel and Alarm Setup Dialog Box.
ChartView Plus
mX + b
(see page
) as the units for channel
mX + b
Note: T he meter channels selected are independent of the group chart assignments.
NetScan User’s Manual ChartView Software Reference 4-27
Page 66

Bar Graph Meters
Selecting Bar Graph Meters from ChartView’s Window pull-down menu brings up the Bar G raph
window. This window displays several channels in bar graph format. To activate the display, select
the Start button from the toolbar. At least one meter must be assigned to an active (On) channel. You
can select to view up to 32 meters at a given time.
Bargraph Meters, Shown with 3 Meters Selected for Viewing
Note 1: Double-clicking the left mouse button in a meters scale area brings up a channel selection pop-up
menu. A single click with the right mouse button in this same area brings up a configuration pop-up
menu (item H). Both of these pop-up menus are discussed in the section, Meters Configuration Menu.
The items in this window are as follows:
A - Start C - Rese t Peak Hold E - Print G - Number of Me ters
B - Stop D - Stay On Top F - Rows x Columns H - Co nfiguration Pop-Up Menu
These items are discussed in more detail, following the description of Digital Meters.
Configuration Note: …. for Bar Graph Meters
For Bar Gr aph Meters, configure the meter settings by first clicking the right mouse button
anywhere within the meter display area. A pop-up menu will appear allowing you to reconfigure
the meter in regard to scale, limits, channel selection, adding peak hold indicators, etc. Refer to the
section entitled Meters Configuration Menu for more detail.
4-28 ChartView Software Reference NetScan User’s Manual
Page 67

Analog Meters
Selecting Analog Meters from ChartView’s Window pull-down menu brings up the Analog Meters
window. This window displays several channels in a dial/gage format. To activate the display, select
the Start button from the toolbar. At least one meter must be assigned to an active (On) channel. You
can select to view up to 32 meters at a given time.
Analog Meters, Shown with 4 Meters Selected for Viewing
Double-clicking the left mouse button in a meters scale area brings up a channel selection pop-up menu
(not shown). A single-clic k with the right mouse button in this same area brings up a configuration
pop-up menu (see Bar Graph Meters figure, item H). Both of these pop-up menus are discussed in the
section, Meters Configuration Menu.
Note that Meter #3 (CH3) in the above figure shows Peak Indicators near the pointer, as well as a
trend indicator in the upper right hand corner of the meter.
The items in this window are as follows:
A- Start C - Reset Peak Hold E - Print G - Number of Meters
B- Stop D - Stay On Top F - Rows x Columns H - Confi guration Pop -U p Menu
These items are discussed in more detail, following the description of the Digital Meters.
Configuration Note: …. for Analog Meters
For Analog Meters, configure the meter settings by first clicking the right mouse button anywhere
within the meter display area. A pop-up menu will appear allowing you to reconfigure the meter
in regard to scale, limits, channel selection, adding peak hold indicators, etc. Refer to the section
entitled Meters Configuration Menu for more detail.
NetScan User’s Manual ChartView Software Reference 4-29
Page 68

Digital Meters
Selecting Digital Meters from ChartView’s Window pull-down menu brings up the Digital Meters
window to display several channels in numeric format. To activate the display, select the Start button
from the toolbar. At least one meter must be assigned to an active (On) channel. You can select to
view up to 32 meters at a given time.
Digital Meters, Shown with 6 Meters Selected for Viewing
Note: Although the Digital Meters instrument is capable of displaying 6 decimal places, there is not 6
place accuracy in the readings. Due to transducer and transient noises, the accuracy of voltage
readings is ± 0.02%. Temperature accuracy varies, depending on thermocouple type; with type J
having ± 0.5°C for a range of -100°C to +760°C. For your application, please refer to
specifications of the signal conditioning card(s) used, as well as the thermocouple type, and the
data acquisition instrument used (TempScan, MultiScan, ChartScan, or NetScan).
Double-clicking the left mouse button in a meters scale area brings up a channel selection pop-up menu
(not shown). A single-clic k with the right mouse button in this same area brings up a configuration
pop-up menu (see Bar Graph Meters figure, item H). Both of these pop-up menus are discussed in the
section, Meters Configuration Menu. Note that each of the above channels shows a trend indicator on
the left side of the meter.
The items in this window are as follows:
A - Start C - N /A E - Print G - Number of Meters
B - Stop D - Stay On Top F - Rows x Columns H - Co nfiguration Pop-Up Menu
Toolbar items A through G are d iscussed in more detail in the following section, Meter Toolbars.
Item H is discussed in the subsequent section, Meters Configuration Menu.
Configuration Note: …. For Digital Meters
Configure the Digital Meters settings by first clicking the right mouse button anywhere within the
digital meter display area. A pop-up menu will appear allowing you to reconfigure the meter in
regard to scale, limits, channel selection, etc. Refer to the section entitled Configure Meter
Settings for more detail.
4-30 ChartView Software Reference NetScan User’s Manual
Page 69

Meter Toolbars
The toolbars for the three meter types are identical, with exception that the Digital Meters toolbar does
not have a Reset Peak Hold button (item C in the following figure).
Item Name Function
A Start Starts meters.
B Stop Stops meters.
Meters Toolbar Buttons
C Reset Peak Hold
Indicator
DStay On Top
(Push pin)
EPrint
FRows x Columns
G Number of Meters
Meter Pull-Down Menus
The meters windows each have a Control and View pull-down menu, as indicated by the following
figure. The functions of these menus can also be implemented by using the toolbar buttons.
Resets the floating markers. Upon reset, the markers will instantly
adjust to indicate the highest and lowest values reached since the time
of the reset. This feature does not apply to the Digital Meters.
Locks or unlocks the meter window on top of other windows.
Sends the meter(s) display image to connected printer.
Opens a small menu with “row x column” arrangement options.
When the number of meters is 6 the grid options will be: 6x1, 3
2x4 with the first number being the number of rows. If you then select 3x2,
you will have 3 rows of meters with 2 meters per row.
Specifies the number of meters to appear on the screen.
A maximum number of 32 meters can be selected.
Example
x2, 2x3, and
:
NetScan User’s Manual ChartView Software Reference 4-31
Page 70

Meters Configuration Menu
A meters configuration menu (lower left corner of figure) will appear when you place the mouse
pointer over a meter and click the right-hand mouse button. The menu allows you to access various
dialog boxes for changing parameters for an individual meter, or simultaneously for a group of meters.
The steps for configuring a meter are detailed below.
Note: The Show Peak Hold Indicator / Reset Peak Hold Indicator selections are not an option for
Digital Meters and do not appear on the configuration window for digital meters.
Meter Configuration Menu and Related Dialog Boxes
Configuring a Meter
1. Bring up the desired meter group (Bar Graph, Analog, or Digital).
2. Place the mouse cursor over the meter you desire to reconfigure.
3. Click on the right mouse button. A Meters Configuration Menu, similar to that in the above figure, will
appear.
Note: The Show Peak Hold Indicator / Reset Peak Hold Indicator selections are not an option for
Digital Meters and do not appear on the configuration window for digital meters.
4. Select the desired option from the meter configuration menu.
5. If a dialog box is required, for example, to change a limit, simply enter in the new value in the
appropriate parameter box and press “Apply” or “OK.” Pressing “Apply” implements your changes,
but keeps the dialog box open, allowing you to make additional changes. Pressing “OK” implements
your changes and closes the dialog box.
The following table, as well as the preceding figure, serve as a quick reference to meters configuration.
4-32 ChartView Software Reference NetScan User’s Manual
Page 71

Configure Meter Settings, Function Descript ions
Function Description
1 Select Channel
2Set Scale
3 Show Peak Hold
Indicator
Reset Peak Hold
Indicator
4 Show T rend
Indicator
5Set Limits
Show Limits
6 Properties
Select a new channel for display. The selected channel will replace the one currently seen in
the meter. Note, double-clicking the left mouse button in the meter region will also bring up
a dialog box that allows you to select a new channel.
Set the high and low points of the scale, as well as define the decimal place format.
Places high and low uni-directional floating markers on the scale to indicate the highest and
lowest values reached up t o the present time.
Meters selection.
Resets the floating markers. Upon reset, the markers will instantly adjust to indicate the
highest and lowest values reached si nce the ti me of the reset.
to the Digital Meters selection.
Displays a pointer to indicate the direction of the trend. Note, during rapid meter
fluctuations the increase and decrease pointers will appear to blink simultaneously.
Provides a way of establishing high and low limit set-points.
Displays limits in color (red for high, blue for low). The color i s applied to scale region s >
the set limit values. For Digital Meters, the limits are indicated by red numbers and an
upper red bar for hitting or exceeding the high limit; and blue numbers and a lower blue bar
when reachi ng or exceeding the low limit.
Allows setting and showing limits, as well as opening the Scale dialog box.
This feature do es not apply to the Digital
This feature does not apply
You can access a different dialog box from the one initially selected. For example, from the Set Scale
dialog box you can select Limits to access the Set Limits/Show Limits display, as well as select “Misc.”
to “Show Trend Indicator” and “Show P
eak Hold Indicators.” You can use the Simulated Instrument
mode to familiarize yourself with various meter configuration options.
Setup Window
The Setup Window is used to configure channels, setup acquisition parameters, and assign data
destinations, and configure the auto re-arm feature. The Setup Window contains three tabs:
and Alarm Setup, Acquisition Setup
an inactive dialog box by clicking on its related tab. The three tabs remain visible; regardless of which
dialog box is active.
Access the Setup window using one of the following methods:
•
Use the Setup pull-down menu (on
dialog box
•
Double-click the Channel Configuration button (item 8, main window figure), then click
on the appropriate dialog box tab
Channel & Alarm Setup Dialog Box
The Channel and Alarm Setup dialog box consists primarily of a configuration spread-sheet. The
dialog box allows you to configure the input channels, and displays them. Each row shows a single
channel and its configuration. The number of rows may vary (depending on the number of channels
present in your acquisition system). Four of the columns (On,
cells to be selected and altered at the same time. Clicking on one of these column headers selects the
entire column.
When a cell is selected, the message box reveals a note, and often a related pull-down list. In the
following figure, the cell for channel “Type” has been selected. This caused the “CHOOSE TYPE->”
message to appear, along with the type p ull-down menu. Depending on the column, you can make
changes to the information contained in the cell by either of the following methods:
(Channel and Alarm Setup, Acquisition Setup, or Data Destination)
Data Destination
, and
. Once in the Setup window you can access
ChartView’s
Channel
main window) and select the desired
Type, Label
, and
Units
) allow blocks of
•
double clicking the cell with the mouse
•
highlighting the cell and typing in the new value or label
•
selecting from a list
•
using copy (
NetScan User’s Manual ChartView Software Reference 4-33
Ctrl+C
) and paste (
Ctrl+V
) functions
Page 72

Channel and Alarm Setup Dialog Box
Message and Pull-Down List Aspects
Column Message
1 CH N/A --2 On ENABLE or DISABLE
3 Reading N/A --4 Type CHOOSE TYPE->
5 Label ENTER LABEL (MAX = 8 LETTER) --6 Units CHOOSE UNITS->
7 Low ENTER DES I RED LOW LIMIT --8 High ENTER DESIRED HIGH LIMIT --9 Hyst ENTER DESIRED HYSTERESIS --10 Alarm# SELECT AN ALARM#
*A
“3” indicates the associ ated item has a pull-down list f rom
which a selection can be made.
List
3
3
3
3
*
The preceding table indicates message and pull-down menu aspects of the Channel and Alarm Setup
Dialog Box.
The pull-down list selection or copy/paste process are useful for making multiple channel configuration
changes within a column. You may do uble-click within a cell t o make your way through all the
possible selections. The selections are repetitive; in other words, you will eventually advance to the
same selection with which you started.
The following text provides more detail regarding the channel and alarm configuration parameters.
The number preceding the text refers to the column number with “1” being the left-hand column and
“10” being the right-hand column of the Channel and Alarm Setup Dialog Box.
4-34 ChartView Software Reference NetScan User’s Manual
Page 73

Channel Configuration Columns
Channel (CH)
1)
This column serves only as a channel number indicator. The channel number cannot be
changed from this column.
On
2)
The On column allows you to enable a channel for data collection. When a cell or block of cells in
this column is selected, a selection box will appear that allows “On” to enable or “Off” to disable the
channel. Double-clicking a cell in this column toggles the channel’s enable status. Clicking the Make All
Channels Active button enables (turns all channels “on”). Clicking on the Make All Channels Inactive
button disables all channels (turns them “off”), with the exception that channels assigned to charts can only
be turned off from the display configuration setup.
Readings
3)
The reading column displays the scanning device input readings. The column is activated
when you select the Enable SpreadSheet Reading button. The column’s values are real-time channel values
from the instrument and cannot be altered by the user. This column will update the readings as fast as the
computer will allow.
Other areas of the SpreadSheet cannot be altered while the channel Readings column is enabled.
Note:
Type
4)
A block of cells in this column can be selected for convenience of single type selection.
Double-clicking a cell will select the next available type.
Label
5)
The Label column identifies the input channel by descriptive name. The label is used when
selecting a channel in the trigger and chart selection lists. The label column automatically uses the channel
number as a default. You can change the label to any alpha-numeric designation not exceeding eight
characters. Each label used must be unique (specific) to its designated channel.
Units
6)
Cells in the Units column are dependent on the Type selected and automatically change when the
type is changed, for example temperature units will be replaced by volts units when changing from a
thermocouple type to a volts type.
If the channel is configured for Temperature, the units automatically change to °C (default); at this point,
you have the option of selecting a different engineering temperature unit (°F, °K, °and R).
mX+b
equation, discussed in the following te xt , is
temperature data will be linear.
example: setting
b to -32
in order to watch deviations from freezing point when temperature is in °F.
However, you can use the equation in temperature applications, for
typically not used
for temperature readings, since
Note that the
In addition, with ChartView Plus you can subtract a reference channel from the mX+b equation to obtain a
temperature differential, as indicated in the following example.
Example:
A heated room has 2 thermocouples (T1 for CH1 and T2 for CH2); with T1 being in the center of the room
and T2 positioned at an outer wall. If the outer wall is monitored to ensure a temperature within ±2°F (of
the temperature indicated by thermocouple T1), then CH1 can be used as a reference channel such that its
value will be subtracted from the actual value for channel 2. Assume the central thermocouple is reading
90.5°F and the outer thermocouple (for CH2) is reading 89.0°F. In this case, we can use the equation so
channel 2’s charted reading will not be of the actual temperature, but will be the differential between CH1
and CH2, e.g.:
y = (mX + b) - ref. chan
= Channel 2’s charted value (a temperature
y
differential)
= 1
m
= 0
b
= CH2
X
ref. Chan.
Channel 2’s charted value = (1 x CH2 + 0) - CH1
Channel 2’s charted value = (1 x 89.0°F + 0) - 90.5°F
Channel 2’s charted value = -1.5°F
= CH1
; where:
The reference channel feature is only available with ChartView Plus.
Note:
NetScan User’s Manual ChartView Software Reference 4-35
Page 74

Note: When using a channel as a reference channel, remember that lower numbered channels are calculated
ahead of higher numbered channels, e.g., CH1 is calculated ahead of CH2. This makes a difference
when subtracting a reference channel in regard to the time aspect of the reference value.
If the channel is configured for Volts, the units automatically change to V; at this point, you have the
option of selecting the millivolt unit (mV). The user can also change each channel to apply a linear
equation (mX+b) to the data. When the mX+b option is selected the Configure Engineering Uni ts dialog
box is displayed. You are prompted to define “m” and “b” and the engineering units label; as well as which
standard units the mX+b equation should be applied to. The engineering units chosen will be displayed in
the “Units” column, and the “mX+b” equation will be applied to the reading from the device before the
reading is displayed or written to disk.
The mX+b option is convenient for obtaining a value that has a linear relation to a channel reading.
X is the scanned voltage value read back from the acquisition device
m is [but not limited to] a proportionality constant or gain factor, but not zero.
b is the offset value (the value of the calculated reading when the scanned value is “zero”).
Alarm Configuration Columns
Low Limit
1)
High Limit
2)
Hysteresis
3)
See Appendix C, Set Point Hysteresis, page C-27.
Alarm #
4)
assigned to the same alarm number. A given digital output will be set “true” (1) if at least one of the
common channels (assigned to a single alarm) enters an alarm state.
Set alarm low limit.
Set alarm high limit.
A hysteresis value can be set for each channel to avoid a “chatter” problem.
You can assign one alarm number (1 to 32) to a channel. Any number of channels can be
Acquisition Setup Dialog Box
The information entered in the Acquisition Setup dialog box is used by the Arm Acquisition command
to set up the acquisition of data to disk. When the trigger is satisfied, the scans are collected at the
selected scan frequency and stored to disk in the designated file.
The Acquisition Setup dialog box can be accessed in one of three ways: a) clicking on the Channel
Configuration button (item 8 in Main Window figure), b) clicking on the Acquisition Setup tab from
the Channels or Data Destination dialog boxes, c) using the Setup pull-down menu and selecting
Acquisition.
ChartScan, NetScan, and MultiScan have two modes of data acquisition, these are:
•
Normal mode
•
High-speed, single-channel mode (burst mode)
4-36 ChartView Software Reference NetScan User’s Manual
Page 75

The mode is selected from the lower left-hand portion of the dialog box. The following figure
represents a screen capture with normal mode selected.
Acquisition Setup Dialog Box, Normal Mode
The following figure depicts components of an acquisition. The Trigger and Stop Points represent the
entries described under the Event Configuration selection in the table on the following page.
In the “High-speed, single-channel” mode the Scan Intervals parameters section is replaced with a
High-Speed Setup parameters section with boxes for selection of Channel and Scan Rate, as indicated
in the following figure.
Note: In the High-speed, single-channel (bur st mode) all ChartView display functions are
intentionally disabled. Data acquisition and storage to disk are the only services that remain
functional. Whe n you select the High-speed, single channel mode, a Warning dialog box
appears with this information, providing you with the opportunity to cancel if desired.
NetScan User’s Manual ChartView Software Reference 4-37
Page 76

Acquisition Setup Dialog Box, High-Speed, Single-Channel Mode
Parameter Options
Acquisition Setup
Event Configuration
Acquisition Parameters
Trigger:
Stop:
Count:
Scan Counts:
Average weight:
Scan Intervals:
High Speed Setup:
Set a trigger scan in the Acquisition by using one of the f ol l owing:
Keyboard
Externa l TTL
Channel Value Alarm Absolute Time
Set a stop scan in the Acquisition by us i ng one of the above selections or Count (as
specified below). Keyboard isn’t appl i cable. If a MultiScan, ChartScan, or NetScan is
connected and High-Speed Single-Channel (Burst Mode) is selected, then “Count from
trigger” is the only Stop available for the event configuration.
Specify a number of scans to be read before a
- Use Console Trigger dialog box to start trigger scan.
Note: If the Keyboard Trigger is selected the use of Pre-t ri gger i s disabled.
- Use an external signal to start the trigger scan.
Use specified value of a given channel.
Use an Alarm value to st art the trigger scan.
- Use a time of day to start the trigger scan.
Note: If Absolute Time is selected, the use of Auto Re-arm is disabled
Specify the number of scans in an acquisition
Pre-trigger
Post Stop
Average weight can be specified only when in the Norm al Mode. The val ue f or
the average weight determines the number of samples to be averaged when in
Normal Mode. Values of 1, 2, 4, and 8 are for high-speed multiple channel
applications for thermocouples and DC voltages where noise filtering is not an
issue.
Values of 16, 32, 64, 128, and 256 are rec ommended for AC noise rejec t i on.
Time between scans (frequency of scans)
Pre-trigger and Post Stop
Post-trigger
Use one Interval
Allows for channel and scan rate ent ri es for high-speed, single channel mode.
stop scan
.
is set.
These parameters cannot be altered while an acquisition is in progress .
Note:
4-38 ChartView Software Reference NetScan User’s Manual
Page 77

Data Destination Dialog Box
Data Destination
The Data Destination portion of the box is used to assign a filename and folder location for data, select an
Excel or binary format (
(to be included in the data) if desired. The dialog box can be accessed from the Channel and Alarm Setup
and Acquisition Setup dialog boxes by selecting the Data Destination tab, or by selecting Data Destination
from the Setup pull-down menu. You can quickly access the Channel and Alarm Setup and Acquisition
Setup dialog boxes by selecting the appropriate folder tab image located near the top of the Data
Destination dialog box.
.TXT
or
.IOT
respectively), and to select optional Time/Date and/or Alarm Stamps
Destination Dialog Box
The following items describe key areas of the Data Destination box. If you have ChartView Plus, you
can use the lower section of the Data Destination box to configure Auto Re-arm as described in the
sub-section below, entitled Auto Re-arm (for ChartView Plus Only).
Folder:
Filename:
Format:
Scan Format:
These parameters cannot be altered while the acquisition is in progres s.
Note:
The drive and directory where data will be written.
Name of data file.
File saved as an Excel (
Data marked with Time/Date Stamp and/or Alarm S t amp.
.TXT
) or Binary (
.IOT
) format.
Auto Re-arm (for ChartView Plus only)
Auto Re-arm is a feature available with ChartView Plus. As seen in the previous figure, Auto Re-arm
is accessed from the Data Destination box. The Auto Re-arm feature allows for a large number of
acquisitions to take place automatically, with each acquisition using the same configuration settings.
With Auto Re-arm, the system immediately re-arms itself, waiting for the trigger to be satisfied, as soon
as the previous trigger block is terminated.
NetScan User’s Manual ChartView Software Reference 4-39
Page 78

Auto Re-arm allows you to choose one of the following three options:
•
capture one trigger block (default, Auto Re-arm disabled)
•
capture multiple trigger blocks in one file
•
capture multiple trigger blocks in indexed files
Why use Auto Re-arm?
You can use Auto Re-arm as a convenient way to monitor and analyze specific types of trigger events.
For example, if you set Cha nnel 1 going above 30°C as a trigger, you can choose to repeat 100 (or
more) acquisitions with this same trigger criteria (Channel 1 > 30°C). Whether you select to capture
the trigger blocks in one file, or each in a separate file, each of the data acquisitions will occur
automatically; and each will make use of your set configuration.
Disabling Auto Re-arm
To disable Auto Re-arm, simply use Auto Re-arm’s default setting of “Capture one trigger block.”
When you capture only one trigger block you are, in essence, not making use of the automatic re-arm
feature.
Note: The trigger event, trigger by absolute time, is not suitable for automatic re-arming. In this instance, the
default of “Capture one trigger block” is automatically forced.
4-40 ChartView Software Reference NetScan User’s Manual
Page 79

Chart Setup Wizard
Reference Note: For very first time start-up of ChartView and a program tutorial (that includes a first
time use of the Chart Setup Wizard) refer to Chapter 2.
Introduction
Chart Setup Wizard is a feature of ChartView, ChartView Plus and PostView. The feature allows you
to set up your initial chart display configuration using an automated method, or manually create a new
display configuration. The following points are important in regard to the Chart Setup Wizard.
•
•
•
•
Activating the Chart Setup Wizard from the Chart pull-down menu will result in the following dialog
box and warning.
The Chart Setup Wizard window appears when you attempt to run ChartView for the very first time, as
well as when a configuration file does not exist. When a configuration file already exists, you can
easily access the Chart Setup Wizard by selecting Wizard in the Chart pull-down menu. It is important
to realize running the Chart Setup Wizard will result in a reset of your display setup; it will not,
however, change your c hannel and alarm configuration (with the exception of new display channels
now enabled).
You can edit the chart display by accessing the Display Configuration Setup dialog box from
the Chart pull-down menu; or by clicking of the Chart Setup button in the main window
toolbar. This method does not use the Chart Setup Wizard and does not reset your chart
display configuration setup.
Activating the Chart Setup Wizard will reset your chart Display Configuration Setup. It
will not reset your Channel and Alarm configuration.
Chart Setup Wizard, as described in this text, covers the expanded setup applications available
with ChartView Plus. The basic ChartView program does not permit overlapping channels or
having more than 1 chart group.
Expanded applications (ChartView Plus) can be activated by use of a special code available
from the factory. Please consult your service representative for more detailed information.
The chart setup determines how your ChartView Main Window will appear in regard to the following:
•
number of chart groups available for viewing
•
number of charts shown for each selected group
•
the number of overlapping channels in each chart (not to exceed 4)
You can choose to manually create a configuration, or have one created automatically. The automatic
setup method offers three choices: Simple, M
available with ChartView Plus.
Note: You can use Chart Setup Wizard to quickly set up a large number of charts. You can then
fine-tune the layout manually via the Manual Chart Creation feature.
NetScan User’s Manual ChartView Software Reference 4-41
oderate, and Advanced. Moderate and advanced are only
Page 80

A Manual Chart Creation, Create Charts button allows you to bypass the Chart Setup Wizard and enter a
manual mode. This option makes use of ChartView’s Display Configuration feature (reference page 4-9).
Manual chart creation allows you to vary the number of assigned channels per chart, as well as vary the number
of charts per group.
Chart Setup Wizard, Simple Mode
Chart Setup Wizard, Automatic Setup Options
Setup Type Group Setup
Simple
Moderate
Advanced
Note1:
Moderate and Advanced modes of Aut omatic Chart Creation are only avail abl e with
standard
Note2:
The
enter a manual create chart di splay mode.
(for Chart Groups)
1 group only Up to 16 charts 1 channel per chart
1
1 group only Up to 16 charts Up to 4 overlapping channels per chart
1
Up to 64 groups Up to 16 charts per
ChartView
Manual Chart Creation, Create Charts
program allows for 1 chart group only, and does not permit overlapping channels.
Chart Setup Channel Setup
Up to 4 overlapping channels per chart
group
button (above figure) allows you to exit the
ChartView Plus
Chart Setup Wizard
. The
and
Automatic Chart Setup with Wizard
The previous figure shows the Simple mode dialog box for Automatic Chart Creation. The following figures show the
Moderate and Advanced mode dialog boxes (available only with ChartView Plus).
Dialog Boxes for Moderate and Advanced Modes of Automatic Chart Creation, ChartView Plus Only
4-42 ChartView Software Reference NetScan User’s Manual
Page 81

It is a simple task to create chart display configurations using the automatic method. The following
steps apply to this feature of Chart Setup Wizard.
1. Select Wizard from the Chart pull-down menu of ChartView’s main window. The New Display
Setup dialog box appears.
2. Click OK on the New Display Setup dialog box. The Wizard setup window appears.
3. Select the desired mode tab (Simple, Moderate, or Advanced). Moderate and advanced modes are
only available with ChartView Plus.
4. Use the pull-down arrows (
number of groups, charts, and channels as applicable.
5. If you desire to start with a channel other than channel 1, use the pull-down arrow and select the
desired starting channel number.
6. When your setup is complete, click on the Automatic Chart Creation, Create Charts button. A
percentage of completion bar will appear, followed by the Channel and Alarm Setup box.
7. Make appropriate configuration changes, if any are desired, including enabling additional
channels; then click on the OK button. After clicking OK, the Main Window appears and you can
begin running charts. The Channel and Alarm Setup section of this chapter contains related
information.
The channels in the setup you create will be automatically enabled and will appear in chart form on
ChartView’s Main Window. The Channels will overlap on their assigned Chart (for ChartView Plus
applications), and will be visible when the applicable Group is selected. Only one group of charts can
be viewed at a time.
As mentioned earlier, you can enable additional channels from the Channel and Alarm Setup window.
Enabling additional channels allows you to acquire more data to disk; however, it will not change your
display on ChartView’s Main Window. In other words, you can acquire d ata from channels you do not
monitor.
Bypassing Automatic Chart Setup
You can bypass Chart Setup Wizard by clicking on the Manual Chart Creation, Create Charts button
in Chart Setup Wizard’s main window. After selecting this option you will be using the Display
Configuration Setup dialog boxes to create a display from scratch, i.e., using a “clean slate” approach.
This is method is detailed with an example, in the section Manually Creating a Display, beginning on
page 4-12.
τ
), or use the cursor and type in a new value to make selections for the
NetScan User’s Manual ChartView Software Reference 4-43
Page 82

−
Notes
4-44 ChartView Software Reference NetScan User’s Manual
Page 83

PostView
Introduction ……5-2
Starting PostView ……5-3
Toolbar ……5-4
Channel Information Region ……5-5
Menu Items ……5-6
Understanding Groups, Charts, and Channels ……5-7
Chart Setup Wizard ……5-7
Introduction ……5-7
Automatic Display Creation ……5-8
Display Configuration ……5-9
Editing a Display ……5-10
Manually Creating a Display ……5-12
PostView Timebase ……5-15
Data File Accessibility
PostView post-data-acquisition software supports several programs, including: ChartView, DaqView,
LogView, Personal DaqView, TempView, and WaveView. These six acquisition programs create data files
that can be viewed and analyzed in PostView after the acquisition has been completed.
5
PostView makes use of ASCII (
.txt
) or PostView Binary (
programs create the data files in raw binary format (
.bin
.iot
) files. However, most acquisition
) during the acquisition. For these programs, a
conversion of the file format must be completed before PostView can access the data. A further explanation
follows:
•
Personal DaqView, DaqView, LogView, and WaveView create raw binary (
.bin
) formatted
files during the data acquisition. After the acquisition is complete, these programs convert the
.bin
formats to
.iot
or
.txt
formats (as determined by the user). PostView can then
access the re-formatted data.
•
ChartView and TempView create
.iot
or
.txt
formatted data files during the acquisition.
Since PostView makes direct use of these formats, charts can be updated in “real-time” while
the acquisition is in progress.
Reference Note: Refer to PostView's Help file for data file information relating to specific
data acquisition programs. Note that some data acquisition programs can convert data
formats to
.sma
format for Snap-Master or
.dat
for DADiSP.
Note: This chapter is based on PostView version 3.x. PostView 3.x is used in 32-bit applications, and
PostView 2.x is used in 16-bit applications. Most differences between these versions exist at the
program level and are not visible to the user.
NetScan User’s Manual,
11-06-98
PostView 5-1
Page 84

Introduction
PostView is an independent program that allows you to view waveforms recorded by various data
acquisition programs. As the data file is being created, a descriptor file used by PostView is also created.
PostView Control Options
= Mouse, Ú= Arrow Keypads , = PageUp/PageDown Keypads
1 Group Select
2 Open
3Print
4 Setup
5 Zoom Out
6 Zoom In
7 AutoScale
8 Show Grid
9 Show Markers
, Ú
,
, or
, or
,
,
or
,
or Ctrl+O
Ctrl+P
Ctrl+S
Ctrl+G
Ctrl+K
12 Multiply (x2)
13 Value at Marker
14 Offset
15 Units/Division
16 Chart Min. Scale
17
18 Time Stamp
19 Scroll
20 Access Chart Setup
1
2
2
Value
Divide (÷2)
2
2
2
-------------
, Ú
, Ú
Setup Dialog Box
2
Hours: mins: seconds. Tenths
Time stamp can be
absolute
Default is
edit menu for select ed
chart and channel.
10 Chart Max
Scale Value
11 Channel
Selection
1
For keypad options, first use the
Note:
2
Setup Dialog Box 21 Number of Samples
2
Ú
, or
key to “tab over” to the desired control item. For example,
Tab
Displayed
22 Time at Marker Indic ates time at mark er
Automatic indic ation of
no. of samples per chart
position.
you can use the tab key to highlight the Group Select (item 1), then use any of the following 3
methods to obtain the desired group: Ctrl+G, keypad arrows, or PageUp/P ageDown keys .
2
: Items 10 through 17, and i tem 22 are discussed in t he section,
Note
, page -5.
Region
3
: Toolbar button functions are di scussed on page -4.
Note
4
: Ctrl+J will show the software version number.
Note
PostView Channel Inf ormati on
spacebar
, or [
, or
, or
or
spacebar
[
,
.
relative
Right-click to access
type-in
type-in
time stamp.
]
]
relative
or
5-2 PostView NetScan User’s Manual
Page 85

Starting PostView
The main ways of starting PostView are:
1) Open PostView directly from the Windows Explorer, Desktop Icon, or Start Run browse feature (on
desktop).
2) From the acquisition program’s main window, click on the toolbar’s PostView button, or select
PostView from the pull-down menu.
Each of these methods is illustrated in the following figure. Actions in the decision diamond are
performed automatically by PostView and require no user action.
Method 1: O pe n PostView D irectly from W indow s Ex plorer, Desktop Icon, or Start Run brow se
Windows Explorer
PostView
Method 2: O pe n PostView directly from the Data Acquisition Program
File Chart View Acquire Data W indow D evice Setup
Group 1
Charting
Init ial izin g
Open PostView from the data acquisition
program by using the button, or by
selecting from the appropriate
pull-down menu.
PV
Charting Buffer ing in Instrumen tDisk
PostView
Open
Data1.iot
OK
Data2.iot
Data3.txt
PostView's File/Open B ox
x
Does
Data File
Exist
?
Uploading
PostView
Configuration
1
NO
Does
Display
Fi le Exist
2
?
NO
Open
Data1.iot
Data2.iot
Data3.txt
PostView's
File/Open Box
YES
PostView op ens
Chart Setup Wizard
OK
PostView us es
existing Display
Configuration
File (Data1.io#)
Does
Display
Configuration
Fi le Exist
?
PostView us es
YESYES
2
NO
existing Display
Configuration
File (Data1.io#)
PostView op ens
Chart Setup Wizard
When you first open PostView the program automatically checks for the existence of an
file (previous figure). If no data file can be found, PostView displays its File Open dialog box so you can
select the desired file. In addition, PostView checks for a Display Configuration File (see Note). If none is
found the File Open dialog box still allows you to select the desired file. In this later case the Chart Setup
Wizard opens, providing a means of setting up a chart display (the number of chart groups, number of
charts per group, channel assignments for each chart, and types of channels).
1
Note: PostView automatically checks for Data Files. These files are recognized by .iot or .txt filename
2
Note: PostView automatically checks for Display Configuration files. These files are automatically
3
Note: Several copies of PostView can be active at the same time; allowing you to view different data
NetScan User’s Manual,
Two Basic Methods of Opening PostView
.iot
extensions.
saved when exiting your data acquisition program. These files are recognized by filename
extensions of: .io# (for binary files) and .tx# (for ASCII files).
files during the same session. To view a data file from PostView, select Open under PostView’s
File menu, and select the desired data file.
11-06-98
.txt
or
data
PostView 5-3
Page 86

Toolbar
Note: Chart Setup Wizard can be started from the File pull-down menu. Chart Setup Wizard’s use in
PostView is discussed on page -7.
The following table explains PostView toolbar items, while the next page begins a description of PostView
Menu items. Menu and toolbar items are shown in the figure below.
PostView Toolbar Items
Item#Item Description
1 Group Select This feature indicates the chart group, which is being charted. Click i ng on the down
2 Open Accesses the Open Data File window.
3 Print Sends PostView chart(s) to an assigned printer.
4 Display
Configuration
5 Zoom Out
(><)
6 Zoom In
(<>)
7 Autoscale Clicking the Auto Scale button adjusts the Y-axis labels so that the waveform fills 90%
Y-axis Adjust The Y-axis Adjust fields s how the c hart’s minimum and maximum for current l y s e l ected
8 Show Grid Places a gri d on the chart (s), or removes t he gri d i f already present.
9 Show Markers Eac h chart contains a cross-hai r marker that shows the numeri cal values of time and
Trigger Event
Marker
Stop Event
Marker
The Scroll Bar at the bottom of the PostView window allows the waveforms t o be scrolled right or left in two ways:
τ
) reveals other chart groups confi gured by the user. To select a diff erent chart
arrow (
group, simply pull down the group list and select the desired group. The group lis t can
be obtained by any of the following control opti ons: a) clicking the down arrow (
b) using Ctrl + G on the keyboard, c) us i ng the keyboard up or down arrow key, d) using
the page up or page down key. If using a control opt i on other than “a,” you may need to
select the
group select
group appears in white on a dark background.
The Display Configuration button ac cesses a
This box will also be displayed if
Chart Setup program. Clicking on the button access es a
box, which displays the configured st ructure of the groups, charts, and channels. From
this box you can select the number of charts to be assigned to a specific group. With
the use of the mouse c ursor you can also select a chart or channel for additional editing.
Display Configuration is discussed in more detai l , immediately after description of the
pull-down menu options.
The Zoom Out button doubles the visible timebase, s howing m ore of the waveform. For
example, if 10 seconds of i nf ormation is visible, clicking the Zoom Out button will
show 20 seconds.
The Zoom In button halves the visible timebase, s howing les s of the waveform. For
example, if 10 seconds of informat ion is visible, clicking the Zoom I n but ton will show
5 seconds.
of the chart’s range. Affects all channels of the selected group.
charts in the engineering units shown. Clicking the Auto Scal e button automatically
adjusts the Y-axis Adjust fields.
magnitude at its pres ent location in the waveform. The Markers start out at the far left
of every chart, showing the time and magnitude of the firs t visible point.
Ctrl+Left Mouse Button
The Options menu contains a function which allows you to turn mark ers on and off.
When a check appears in front of this item, its associ ated indicator is on or visible.
Selecting the menu it em toggles the indicator (and the check mark) on and off .
The Trigger Event Marker on the time axis shows the l ocation of the trigger point.
(See figure,
The Stop Event Marker on the time axis shows the location of the stop point .
(See figure,
group select
box is selected. When this happens the name of t he currently selected
PostView TimeBase
PostView TimeBase
box by repeatable pressing the keyboard’s
manual setup
moves the markers from all the charts
)
)
Display Configuration Set up
is selected during use of t he Wizard
Display Configuration Set up
Tab
in unison
τ
),
key until the
dialog box.
.
1. When clicked on, the small left and right arrow boxes scroll the waveforms approxim ately 20%.
2. The plain scroll button s hows t he rel ative location of the visibl e regi on of the waveforms and can be
dragged along the scroll bar to any locat i on desired.
5-4 PostView NetScan User’s Manual
Page 87

Channel Information Region
By clicking on the up or down arrows (σ, or τ) by the channel selection box (item 11), you can select one
channel (of a maximum of 4 overlapping channels) that were assigned to that chart. You could then observe
the chart-related information for that specific channel. You can also select a new channel for the
information region by placing the cursor in (or tabbing over to) the “Center” or “Units/Div” fields and then
pressing PageU p or PageDown. This is particularly useful when your main window has been re-sized such
that the channel selection boxes are not visible.
The following list identifies the various areas of the region.
(10) Chart Max. Scale Value (Grid Limit Line)
(11) Channel Selection (Of chart’s available channels)
(12) Multiply (x2)
(13) Value at Marker
(14) Center(Value at chart mid-line)
(15) Units/Division (Provides the vertical increment of one
grid box.)
(16) Chart Min. Scale Value (Grid Limit Line)
(17) Divide (÷2)
(22) Time at Marker
Multiply and Divide Buttons (12 & 17) - In addition to r eading channel values, you can increase or
decrease the size of the selected channel’s chart. This is accomplished with the Multiply (12) and
Divide (17) push buttons. The Multiply push-button effectively increases the size of the selected channel’s
chart by a factor of 2, while automatically adjusting the chart’s high and low values (items 10 and 16).
Aside from “clicking” on the Multiply/Divide controls, you can use your keyboard spacebar to control this
feature once the button (12 or 17) is selected. Selection may be with mouse, or by tabbing over to the
control.
Making changes to a channel’s chart parameters does not affect the parameters of the other channels, with
the following exception: Holding the keyboard’s control key down while adjusting either spi nner (
σ/τ
) for
center (item 14), or spinner for units/div (item 15) causes the parameter change to apply to all channels
displayed for the chart, not just the currently selected channel display. This feature applies to the spinners
and keyboard up and down arrow keys, but not to the text input.
Value at Marker (13) - is the charted channel value at the marker position. Item (22) indicates the time
this value was read.
Center Control (14) - changes the value of the selected channel’s chart centerline. Changing the value of
center results in an automatic change of the chart’s high and low end values (items 10 and 16), and possibly
an automatic change of the units/div (item 15). Aside from using the center spinner controls to change
center, you can change the center value by placing the mouse cursor in (or tabbing over to) the field and
then either typing in the desired value, or using the PC keyboard up and down arrow contro l keys.
Units/div (15) - The units in units/div
(15) can be °C, °F, °K, °R, mV, or V. The division referenced is one
vertical grid. In the example above for Channel 1, each vertical grid increment represents 0.1231°C per
division. Changing the uni ts/division spinne r controls (
σ/τ
) will result in an automatic adjustment of the
max scale and min scale va lues (items 10 and 16). Aside fr om using the units/div tria ngular control s t o
change the value, you can change units/div from the Display Configuration Setup dialog box as described
on page 5-14.
Time at Marker (22) - is the time at the marker position. It is also the time that the indicated chart value
(13) was read.
NetScan User’s Manual,
11-06-98
PostView 5-5
Page 88

Menu Items
File
Open Opens a data file created by the data acquisition program. PostView automatically
Print Prints the present Pos tView window.
Setup Accesses Dis pl ay Configuration Setup dialog box, allowing you to edit t he di splay
Wizard Accesses the Chart Set up Wizard.
Exit Exits the File menu.
detects whether the file contains ASCII or binary data.
configuration.
Go To
Percentage
(Ctrl+P)
Scan Number
(Ctrl+S)
Time
(Ctrl+m)
Trigger Point
(Ctrl+T)
In PostView Version 3.0 – If there is a Pre-trigger, then Pre-tri gger and Post-trigger times (i n seconds) are
Note:
displayed in the Go To menu’s dialog box.
Automatically scrolls the waveform suc h that the displayed waveform begins at the
specified percentage.
Automatically scrolls the waveform suc h that the displayed waveform begins at the
specified scan num ber.
Automatically scrolls the waveform suc h that the displayed waveform begins at the
specified time.
Automatically scrolls the waveform suc h that the displayed waveform begins at the trigger
point (t = 0).
Options
Zoom Graph Out Allows more of a chart(s) to be seen by decreasing the dimensions .
Zoom Graph In Zooms in on a chart(s), providing m ore detail to a smaller area of t he chart(s).
Zoom Chart
Zoom Chart
3 charts and desired to get a better view of Chart 2, you could use Zoom to vi ew Chart 2
using the full chart viewing area, as compared to using one third of t he area. The zoom
feature can also be invoked by double-c l i cking in the chart region of the chart for which
you want to apply the zoom.
Once you have zoomed in on a chart, the pul l -down m enu Zoom option is replaced by a
Restore
previous multiple chart viewing status. The restore feat ure can also be invoked by again
double-clicking in the c hart regi on.
causes PostView to display one chart only. For example, if you were viewing
option. Selecting
R
from the menu will return the main window to its
estore
Absolute time
(Ctrl+A)
Relative time
(Ctrl+R)
Autoscale Current
Channel
Autoscale All
Channels
Show Grid
(Ctrl+G)
Show Markers
(Ctrl+K)
Data Commentary
(Ctrl+C)
Places the tim ebase in a 24-hour
25.2 seconds after 3:08 p.m. would appear as 15:08:25.2.
(Also see PostView Tim ebase, page -15.)
Places the timebase in a
and having other times represent ed as hours, minutes, seconds and tenths which have
elapsed since the start t i me. (Also see Post View Timebase, page -15.)
For the currently selected channel , automatically generates a scale, in contrast t o
manually assigning the s cale.
Automatically generat es a scale for each channel in every chart of the selected group.
Allows grids to be turned off and on for al l vi sible graphs. When a check appears in front
of an item, its i ndi cator is on or visible.
Allows markers to be turned off and on for all visible graphs. When a check appears i n
front of an item, its indicator is on or vis i bl e.
This function is hidden unless a comment has been added to the data header file. If such
a comment has been entered, then Data Commentary will be visible, allowing you to
display the comm ent in a message box. The comment feature is supported by certain
acquisition software, and c an onl y be used by PostView versions 3.3 or greater. For
ChartView users: note that c ommentary can be entered in ChartV iew’s Setup/Data
Destination dialog box, providing the commentary feature is enabl ed. To enable the
feature in ChartView, start with the View pull-down menu and navigate as follows:
View ⇒ Options ⇒ Acquisition ⇒ (3) Enable PostView Comm ent (refer to the software
chapter, if needed.)
absolute time
relative time
format. For example:
format, typicall y havi ng 00: 00:00.0 as the start time
Help
Contents The initial Pos tView help screen provides an overview and listing of the help file contents.
Search Type a word or select one from the Show Topics l i st for quick acces s to help information.
Help on Help
About Provides PostView’s version number.
A single topic can be sel ected for quick acces s to help information.
Provides instructions on how to use a
Windows
Help system.
5-6 PostView NetScan User’s Manual
Page 89

Understanding Groups, Charts, and Channel s
As indicated in the figure on page -3, when no display configuration file is found, PostView opens the
Chart Setup Wizard to assist you in creating a display file. To make the best use of Chart Setup Wizard you
need to understand the relationship of Groups, Charts, and Channels. The Chart Setup Wizard feature is
discussed immediately following this text.
Group. “Group” refers to a group of charts. You can add and remove
groups to your display, and you can add or remove charts to each group.
Depending on the capabilities of your PC, you can have up to 64 groups
assigned to your display.
Note: PostView can only display data from one group at a time.
Chart. A “Chart” is a display area containing up to four channels. You can
assign up to 16 charts per group. Charts can be displayed with or without
gridlines.
Channel. “Channel” refers to a signal channel. Y ou can have up to 4
channels assigned to one chart. Channels will be displayed in units of °C,
°F, °K, °R, mV, V, or user defined units, depending on the configuration and
type of signal conditioning card which was used during data acquisition.
Chart Setup Wizard
Introduction
The Chart Setup Wizard feature allows you to create PostView’s initial chart display configuration with an
automated or manual method. When PostView can not locate a display configuration file, it automatically
accesses the Chart Setup Wizard feature. If a display configuration file is located, PostView bypasses the
Chart Setup Wizard.
Note: You can manually activate the Chart Setup Wizard from the File pull-down menu. Activating the
Chart Setup Wizard will reset an existing display configuration. Prior to manually activating the
Wizard feature, a “New Display Setup” box will appear to remind you of the display reset. You
can then activate Wizard by selecting “OK,” or discontinue by selecting “cancel.”
Note: You can edit the display configuration file without use of the Chart Setup Wizard by using the
Display Configuration Setup dialog box. This box can be accessed from Setup in the File pull-
down menu, or by clicking on the Chart Setup button in PostView’s toolbar. This method of
display editing is discussed in the section, Display Configuration, beginning on page -9.
The chart display setup determines how your PostView window will appear in regard to the following:
•
number of chart groups available for viewing
•
number of charts shown for each selected group
•
the number of overlapping channels in each chart (not to exceed 4)
You can choose to manually create a display configuration, or have one created automatically. The
automatic setup method offers three choices: Simple, M
oderate, and Advanced.
NetScan User’s Manual,
11-06-98
PostView 5-7
Page 90

A Manual Chart Creation, Create Charts button allows you to bypass the Chart Setup Wizard and enter a
manual editing mode. This option makes use of PostView’s Display Configuration feature (discussed in the
following Display Configuration section). Manual Chart Creation allows you to vary the number of
assigned channels per chart, as well as vary the number of charts per group.
Chart Setup Wizard, Automatic Setup Options for PostView
Setup Type Group Setup
Simple
Moderate
Advanced
Note:
The
enter the manual
(for Chart Groups)
1 group only Up to 16 charts 1 channel per chart
1 group only Up to 16 charts Up to 4 overlapping channels per chart
Up to 64 groups Up to 16 charts per
Manual Charts Creation, Create Charts
Display Configuration
Chart Setup Wizard, Simple Mode
Chart Setup Channel Setup
Up to 4 overlapping channels per chart
group
button (above figure) allows you to exit the
mode.
Chart Setup Wizard
and
Automatic Display Creation
The previous figure shows the Simple mode dialog box for Automatic Chart Creation. The following
figures show the Moderate and Advanced mode dialog boxes.
Dialog Boxes for Moderate and Advanced Modes of Automatic Chart Creation
5-8 PostView NetScan User’s Manual
Page 91

It is a simple task to create a chart display configuration using the automatic method. The following steps
apply to this feature of Chart Setup Wizard.
Note: If PostView locates a display configuration file, Chart Setup Wizard will not be activated unless
you choose to manually activate the Wizard from the File pull-down menu.
1. From the Chart Setup Wizard window, select the desired mode (Simple, Moderate, or Advanced).
Note: Selecting Manual Chart Creation, Create Charts bypasses the Chart Setup Wizard and enters a
manual editing mode. This option makes use of PostView’s Display Configur ation feature
discussed in the following section, Display Configuration.
2. Use the pull-down arrows (
number of groups, charts, and channels as applicable.
3. If you desire to start with a channel other than channel 1, use the pull-down arrow and select the desired
starting channel number.
4. When your setup is complete, click on the Create Charts button. A percentage of completion bar will
appear, followed by the PostView window.
The channels in the setup you create will appear in chart form on PostView’s window. The Channels will
overlap on their assigned Chart (for configurations making use of multiple channels per chart), and will be
visible when the applicable Group is selected. Note that only one group of charts can be viewed at a time.
Display Configuration
Note: When PostView does not find a display configuration file it automatically opens the Chart Setup
Wizard. You can use this feature to automatically create a display configuration. You also have
the option of selecting Manual Chart Creation, Create Charts to bypass the Chart Setup Wizard
and enter the manual editing mode, as discussed in this section.
The Display Configuration button accesses a Display Configuration Setup dialog box. This box will also
be displayed if:
a) Manual Chart Creation, Create Charts is selected from the Wizard Chart Setup window
b) You select Setup from the File pull-down menu
c) You right-click on the chart regi on in PostView’s window
τ
), or use the cursor and type in a new value to make selections for the
Note: If multiple chart groups are present in the display configuration, the current group will be selected
When you first click on the Display Configuration button, a Display Configuration Setup box appears. A
display region shows the configured structure of the groups, charts, and channels. From this box you can
select the number of charts to be assigned to a specific group. With the use of the mouse cursor you can
also select a chart or channel for additional editing.
The rest of this section has been divided into two parts. The first pertains to editing an existing display;
while the second section pertains to manually creating a display configuration from scratch, i.e., there is no
existing display configuration to edit. Both methods make use of Display Configuration Setup dialog
boxes.
NetScan User’s Manual,
in the display configuration tree.
11-06-98
PostView 5-9
Page 92

Editing a Display
To explain editing a configuration, we make use of an example in which assumes you want to edit Chart 1.
In the following figure, Chart 1 was highlighted by clicking on it with the mouse cursor. The
Configuration Setup
“Show all Types,” as in the example. From this setup box you can add or delete charts and channels. You
can:
•
Use the
•
double-click on an
•
double-click on a
Display Configuration Setup Dialog Box with an Existing Configuration
box then changed, allowing you to see specific channel types (such as volts only) or to
Shift
Ctrl key
or
in conjunction with the
available channel
selected channel
to add it to the selected channels
to remove it from t he selected channels lis t
cursor
to select several channel s for addition or deletion
Display
Note: When a chart contains overlapping channels which share values (such that their traces reside on top
of each other), the more recent channel will obscure the earlier channel. Note that the lower a
channel is on the display list, the more recent it is in regard to the display.
Adding Channel 2 to Chart 1
5-10 PostView NetScan User’s Manual
Page 93

Another variation of the Display Configuration Setup box appears when you highlight a channel. In the
following figure, Channel 1 (of Chart 1, Group 1) was selected, resulting in a new screen image. From this
screen you can edit the channel setup.
Adjusting Channel Setup for Channel 1
PostView channels can be set for either of two modes: Units Full Scale or, Units/Div. The mode is selected
by radio button. Mode descriptions are as follows:
Units Full Scale. When Units Full Scale is selected, as depicted in the above figure, you can alter Y Max
and Y Min. These are the upper and lower limits of the Channel as they will appear on the chart when the
channel is selected. When you change either parameter, Y Center and Units/Division are automatically
adjusted. You can not directly adjust Y Center or Units/Division while “Units Full Scale” is selected. You
can change Y Max a nd Y Min by using the up and down arrows, or by highlighting the existing value,
typing in the new value, the pressing “Enter” on your PC keyboard.
Note: If the window size is changed, a chart operating in the Units Full Scale mode will maintain its
setting across the chart.
scale
full
Units/Div. When Units/Div. is selected you can alter Y Center and Units/Div. Y Center is the centerline
value of the chart when the channel is selected. Units/Div. is the vertical value of on chart grid increment.
When you change Y Center or Units/Div. Y Max and Y Min are automatically adjusted. You can not
directly adjust Y Max or Y Min while “Units/Div.” Is selected. You can change Y Center and Units/Div. by
using the up and down arrows, or by highlighting the existing value, typing in t he new value, the pressing
“Enter” on your PC keyboard.
Note: If the window size is changed, a chart operating in the Units/Div. Mode will maintain its
division scale
setting across the chart.
units per
NetScan User’s Manual,
11-06-98
PostView 5-11
Page 94

Manually Creating a Display
Note: This method of creating a display can only be accessed from the Chart Setup Wizard. It cannot be
accessed if PostView is using an existing display configuration file.
Unlike editing a display, as just described, this method involves creating a display from scratch. If you plan
to have a chart setup which is not weighted evenly, i.e., different numbers of channels per chart and
different numbers of charts per group, you may want to manually create your chart display in this manner.
This method can only be arrived at from the Chart Setup Wizard by selecting Manual Chart Creation,
Create Charts. This bypasses the Chart Setup Wizard and enters the manual editing mode, discussed.
Although this method i s referred t o as “manual,” it still contains automatic elements, such as Automatically
Add Groups to the Setup.
Perform the following steps to manually create your chart display.
1. From the Chart Setup Wizard window, select Manual Chart Creation, Create Charts. This bypasses
the Chart Setup Wizard and enters the manual editing mode.
Display Configuration Setup, Initial Screen During Manual Creation
2. Perform (2a) or (2b) as appropriate to your application.
Automatically add groups to the setup
(2a)
typing in the value, or by using the pull -down arrows (τ) and making the appropriate selections; then click on the
Create Groups button.
Manually add groups to the setup
(2b)
button.
The Display Configuration Setup screen changes to show chart groups, and the number of charts for the
. Enter the number of groups and charts desired by using the cursor and
. Type in the name of the chart group; then click on the Add Display Group
selected (black highlighted) chart group (see following figure). From this screen you can change the
number of charts in a group, as well as change the group name.
5-12 PostView NetScan User’s Manual
Page 95

Adding a Chart to Group 1
3. Change the number of charts per group if desired.
4. Change the group name if desired.
5. Click on a group to see the chart(s) assigned to the group. In the above example there is one group
with one chart.
6. Click on a chart to assign channels to the chart. A screen similar to the following will appear.
7. Choose channels for the selected chart. You can select up to 4 overlapping channels per chart. There
•
•
•
•
NetScan User’s Manual,
Assigning Channels to Chart 1 of Group 1
are four methods of adding channels. These are as follows:
Highlight an available channel using the cursor and left-hand mouse button; then click t he A dd button. Repeat for
each channel to be added.
Double-click on the channel (i n the available channels list t o add; in the selected channels l i st to remove)
Hold down the keyboard’s
channels (up to 4); then click the Add button. Example: CH3, CH4, CH5,and CH6.
Hold down the keyboard’s Ctrl button and use the l eft-hand mouse button to s el ect up to 4 available channels
(these can be non-consecutive); then click the Add butt on.
Example: CH1, CH3, CH5, and CH7, as i n the previous figure.
11-06-98
Shift Key
and use the left-hand mouse but ton to select a block of consecutive available
PostView 5-13
Page 96

Note: You can remove channels by highlighting a channel(s) i n t he Select Channels box, and then
clicking on the Remove button. In the previous figure, CH7 (in the select box) is highlighted.
Clicking the Remove button would delete that channel from Chart1.
Note: When a chart contains overlapping channels which share values (such that their traces reside on
top of each other), the more recent channel will obscure the earlier channel. Note that the lower a
channel is on the display list, the more recent it is in regard to the display.
8. In the display area (on the left-hand side of the screen) click on a channel to check the channel’s
configuration and to re-configure the channel, if desired. The Display Configuration Setup Window
will appear similar to that in the following figure.
This screen contains two “radio buttons” for selecting the method of adjusting the display mode and
channel setup. It is the same screen that was discussed in the sub-section, Editing an Existing Display
Configuration. From this screen you need to choose Units Full Scale or Units/Div.
Adjusting Channel Setup for Channel 1
Units Full Scale. When Units Full Scale is selected, as depicted in the above figure, you can alter Y Max
and Y Min. These are the upper and lower limits of the Channel as they will appear on the chart when the
channel is selected. When you change either parameter, Y Center and Units/Division are automatically
adjusted. You can not directly adjust Y Center or Units/Division while “Units Full Scale” is selected. You
can change Y Max a nd Y Min by using the up and down arrows, or by highlighting the existing value,
typing in the new value, the pressing “Enter” on your PC keyboard.
Note: If the window size is changed, a chart operating in the Units Full Scale mode will maintain its full
scale setting across the chart.
Units/Div. When Units/Div. is selected you can alter Y Center and Units/Div. Y Center is the centerline
value of the chart when the channel is selected. Units/Div. is the vertical value of on chart grid increment.
When you change Y Center or Units/Div. Y Max and Y Min are automatically adjusted. You can not
directly adjust Y Max or Y Min while “Units/Div.” Is selected. You can change Y Center and Units/Div. by
using the up and down arrows, or by highlighting the existing value, typing in t he new value, the pressing
“Enter” on your PC keyboard.
The Channels will overlap on their assigned Chart and will be visible when the applicable Group is selected.
Note that only one group of charts can be viewed at a time.
Note: If the window size is changed, a chart operating in the Units/Div. Mode will maintain its units per
division scale setting across the chart.
5-14 PostView NetScan User’s Manual
Page 97

PostView Timebase
PostView automatically detects and displays the data file timebase along the X-axis at the bottom of the
PostView window. The timebase can be displayed as relative time or as absolute time in the format:
00:00:00.0 (hour/minute/second/tenth). The timebase format of absolute or relative can be selected in
PostView’s Option pull-down menu, or by using Ctrl+A or Ctrl+R respectively.
Note: PostView automatically displays milliseconds (ms) or microseconds (µs) when applicable to
acquisition programs that make use of such time scales. Aside from selecting the type of timebase
desired (absolute or relative) no user action is required in regard to the timebase display.
Two Points About the PostView Timebase
•
When a data file is loaded into PostView for the very
first time, the relative timebase format will be used.
•
You can not select absolute timebase when the data
file has no timebase. In this case PostView will
automatically use relative time.
The following figure illustrates a partial timebase in the relative format. Note that the user could switch to
absolute time with Ctrl+A on the keypad, or by selecting Absolute time from the Options pull-down menu.
The example below resulted from a ChartScan/1400 using ChartView software.
Example of a PostView Timebase
Note: For many data acquisition programs, trigger point (t = 0) may not be the first point in the data file.
NetScan User’s Manual,
11-06-98
PostView 5-15
Page 98

It is possible for the data acquisition program to create files containing multiple timebases, pre-trigger, posttrigger, and post-stop data. PostView accommodates all these features, as shown in the previous example
(taken from a ChartScan/1400 unit with the ChartView data acquisition program).
•
If pre-trigger scans are available, they will be shown prior to the trigger point and labeled with
negative time numbers.
•
If post-stop data is available (scans collected after the Stop Event), they are displayed after the Stop
Event marker.
•
If a dual timebase was used when collecting the data, PostView will show a discontinuity in the time
axis when the timebase changes. When a dual timebase is used, the post-trigger scans are collected at
one frequency while the pre-trigger and post-stop scans are collected at another.
Note: Some timebase aspects may differ, depending on the actual data acquisition program used. Refer
to PostView’s Help File for timebase information relating to specific data acquisition programs.
5-16 PostView NetScan User’s Manual
Page 99

Calibration 6
Introduction ……6-1
Calibration Setup ……6-1
Non-Volatile Storage of Calibration Constants
……6-2
Hardware Protected RAM ……6-2
ScanCal Software Application ……6-3
ScanCal’s Main Window ……6-3
Using ScanCal ……6-4
Interface Parameters
System Inventory
Calibration
Calibration Without ScanCal ……6-5
Password ……6-5
Calibration Mode Indicator ……6-5
Command Active Indicators ……6-5
Use approved ESD precautions, including static-free work area a nd grounded wrist strap,
when handling circuit boards and electronic components. Failure to do so could cause
equipment damage due to electrostatic discharge.
Introduction
ScanCal is a Window’s based software program that provides step-by-step calibration instructions. If you
do not wish to use ScanCal, you can manually calibrate the system according to instructions presented later
in this chapter. Note that this chapter has been written for both ChartScan and NetScan devices.
Note:
The main unit (ChartScan or NetScan) and signal condi tioning cards are calibrated prior t o shipment; however,
these items require periodi c calibration to ensure acc uracy is maintained. The indus try standard for this
calibration is once every year.
Note:
Main unit calibration is supported only when operating in the Calibration Mode. A specific set of commands is
provided for performing manual calibration.
Manual Calibration of Main Unit ……6-6
Offset Calibration of Main Unit ……6-6
Gain Calibration of Main Unit ……6-8
Manual Calibration of
Signal Conditioning Cards ……6-10
Offset Calibration of Cards ……6-10
Gain Calibration of Low Volts Cards ……6-12
Gain Calibration of High Volts Card ……6-15
Cold Junction Calibration ……6-17
&$87,21
Calibration Setup
To ensure accurate measurements, calibration must only be performed by authorized
personnel.
Failure to comply with this requirement can result in faulty equipment performance and
necessitate additional services of an authorized metrology lab.
The VDC Calibrator used must meet the following criteria:
1)
2)
3)
4)
Failure to comply with this requirement can result in faulty equipment performance and
necessitate additional services of an authorized metrology lab.
NetScan User’s Manual,
11-16-98
&$87,21
&$87,21
Range: 0 - 100 mV Resolution: 0.1 µV
Range: 0 - 10 V Resolution: 10 µV
Range: 0 - 1000 V Resolution: 1 mV (for CSN14/ HV/S card calibration)
Remote sensing terminals. Note that stabilizing capacitors will typically be required at the
point of connection to the main unit due to the relatively low bandwidth of high resolution VDC
calibrators.
Calibration 6-1
Page 100

&$87,21
The digital voltmeter (or digital multimeter) used to verify calibration voltage accuracy
must meet the following criteria:
1) Minimum Resolution: 6-1/2 digits
2) Minimum DC Accuracy: 0.005% full scale
Failure to comply with this requirement can result in faulty equipment performance and
necessitate additional services of an authorized metrology lab.
&$87,21
Use approved ESD precautions, including static-free work area a nd grounded wrist strap,
when handling circuit boards and electronic components. Failure to do so could cause
equipment damage due to electrostatic discharge.
The main main unit and each signal conditioning card are calibrated separately.
Note that the main unit and its signal conditioning cards contain components for saving
calibration constants, allowing for card swapping within a system, card swapping between
systems, and system expansion. Calibration relates to the main unit and cards as follows:
Main Unit
Signal Conditioning Cards
are used).
: NetScan or ChartScan main chassis, c al i brated for offset and gain only.
: Calibrated for offset, gain, and cold junction sensor offset (if therm ocouples
Non-Volatile Storage of Calibration Constants
To preserve calibration constants, main unit constants are stored in an on-board battery backed up RAM
and the constants for each signal conditioning card are stored on the card’s EEPROM.
Hardware Protected RAM
Your scanning device contains a security circuit. This circuit disables writing to the portion of battery
backed up RAM which holds the main unit’s calibration constants and calibration password. You must
enable the calibration mode prior to calibrating the main unit or changing the password.
To enable calibration, locate the Calibration Enable/Disable Pushbutton. (ChartScan User’s
see notes 1 and 2, below). Push the button so it is in the indent position. This enables
writing to RAM.
NetScan, Rear Panel
Note 1:
Note 2:
6-2 Calibration NetScan User’s Manual
ChartScan users only
For units with no calibration pushbut t on, a DIP Switch is used instead of the pushbutton, as described in
note 2. ChartScan units that do have t he pushbutton will have it located on the rear panel, as in the above
NetScan figure.
ChartScan users only (for units with no Calibrat i on Enable/Disable Pushbutton)
production ChartScan unit, with no calibrati on pushbutton, then you will enable the calibration mode by
positioning the DIP switch right-most mi cro-switch (#9) to the “1” (up) position.
.
Early production ChartScan units do not have a
Calibration Enable/Disable P ushbutton
. If you are using an early
.
 Loading...