

Page 1

MMS Raman Spectrometer
A Product
Installation and Operation Manual
Document Number 000-40000-02-0906
Offices:
E-mail: Info@OceanOptics.com (General sales inquiries)
Ocean Optics™, Inc.
830 Douglas Ave., Dunedin, FL, USA 34698
Phone 727.733.2447
Fax 727.733.3962
8 a.m.– 8 p.m. (Mon-Thu), 8 a.m.– 6 p.m. (Fri) EST
Ocean Optics B.V. (Europe)
Geograaf 24, 6921 EW DUIVEN, The Netherlands
Phone 31-(0)26-3190500
F ax 31-(0)26-3190505
Info@OceanOpticsBV.com (European sales inquiries)
Orders@OceanOptics.com (Questions about orders)
TechSupport@OceanOptics.com (Technical support)
A
Page 2

Ocean Optics offers the most comprehensive, innovative and high-quality line of modular spectroscopy
tools in the world. Centice is an essential and valuable partner in this enterprise. We have partnered with
Centice because they are committed to the same goals of innovation and quality that inspire us here at
Ocean Optics. As always, Ocean Optics conducts its business in an open, honest and technically available
fashion. We invite you to contact us at Ocean Optics, Inc. (see front cover for contact information) or
Centice with any technical questions, comments, or applications inquiries. Centice can be contacted at the
following location:
Centice Corporation
4020 Stirrup Creek Dr, Suite 115
Durham, NC 27703
Phone: 919 405 4264
Fax: 919 405 4268
Web: http://www.centice.com
Copyright © 2001-2006 Ocean Optics, Inc.
All rights reserved. No part of this publication may be reproduced, stored in a retrieval system, or transmitted, by any means, electronic,
mechanical, photocopying, recording, or otherwise, without written permission from Ocean Optics, Inc.
This manual is sold as part of an order and subject to the condition that it shall not, by way of trade or otherwise, be lent, re-sold, hired out or
otherwise circulated without the prior consent of Ocean Optics, Inc. in any form of binding or cover other than that in which it is published.
Trademarks
Microsoft, Windows, Windows 95, Windows 98, Windows Me, Windows NT, Windows 2000, Windows XP and Excel are either registered
trademarks or trademarks of Microsoft Corporation.
Limit of Liability
Every effort has been made to make this manual as complete and as accurate as possible, but no warranty or fitness is implied. The information
provided is on an “as is” basis. Ocean Optics, Inc. shall have neither liability nor responsibility to any person or entity with respect to any loss or
damages arising from the information contained in this manual.
Page 3

Table of Contents
About This Manual .......................................................................................................... iii
Document Purpose and Intended Audience.............................................................................. iii
What’s New in This Document .................................................................................................. iii
Document Summary.................................................................................................................. iii
Product-Related Documentation ............................................................................................... iv
Upgrades......................................................................................................................... iv
Laser Safety ....................................................................................................................iv
Chapter 1: Installation ........................................................................5
Introduction...................................................................................................................... 5
Applications ............................................................................................................................... 5
About SpectraSuite.................................................................................................................... 6
Features..................................................................................................................................... 6
Parts Included ................................................................................................................. 6
Other Equipment Needed..........................................................................................................6
Installation Procedure...................................................................................................... 7
Chapter 2: Operating the Spectrometer............................................9
Sample Placement .......................................................................................................... 9
Acquiring Spectra ............................................................................................................ 10
Appendix A: Specifications................................................................15
Appendix B: Introduction to Multimodal Multiplex Sampling.........17
Introduction...................................................................................................................... 17
Theory of Operation ........................................................................................................ 18
Coded Aperture ............................................................................................................... 18
Coded Aperture ............................................................................................................... 19
Multiplex (SNR) Advantage .......................................................................................................19
Multimodal (Etendue) Advantage .............................................................................................. 19
Imaging Aspect of MMS ............................................................................................................19
MMS and Conventional Multiplex Spectroscopy....................................................................... 20
Performance Comparison ............................................................................................... 20
Etendue ..................................................................................................................................... 20
000-40000-000-02-0906 i
Page 4

Table of Contents
Signal to Noise Ratio ................................................................................................................. 22
Measuring in Scattering Media.................................................................................................. 23
Conclusion....................................................................................................................... 23
Appendic C: Remote Interlock...........................................................25
Index .....................................................................................................................27
ii 000-40000-02-0906
Page 5

About This Manual
Document Purpose and Intended Audience
This document provides you with installation information to get your system up and running. It also
contains an in-depth discussion of Multimodal Sampling technology.
What’s New in This Document
This version of the MMS Raman Spectrometer Installation and Operation Manual adds clarification to
the Acquiring Spectra
Document Summary
Chapter Description
procedure.
Chapter 1: Installation Provides a list of system components, and
operating requirements. Also contains instructions
for installing the MMS Raman spectrometer.
Chapter 2: Operating the Spectrometer Contains instructions for using the MMS Raman
spectrometer.
Appendix A: Specifications Provides product specifications for the MMS
Raman spectrometer.
Appendix B: Introduction to Multimodal
Multiplex Sampling
Appendix C: Remote Interlock Contains information on the Remote Interlock
Contains a whitepaper with technical information
describing the operation of the MMS Raman
spectrometer.
feature.
000-40000-000-02-0906 iii
Page 6

About This Manual
Product-Related Documentation
You can access documentation for Ocean Optics products by visiting our website at
http://www.oceanoptics.com. Select Technical → Operating Instructions, then choose the appropriate
document from the available drop-down lists. Or, use the Search by Model Number field at the bottom
of the web page.
• Detailed instructions for SpectraSuite Spectrometer Operating Software are located at:
http://www.oceanoptics.com/technical/spectrasuite.pdf
You can also access operating instructions for Ocean Optics products on the Software and Technical
Resources CD included with the system.
Engineering-level documentation is located on our website at Technical → Engineering Docs.
.
Upgrades
Occasionally, you may find that you need Ocean Optics to make a change or an upgrade to your system.
To facilitate these changes, you must first contact Customer Support and obtain a Return Merchandise
Authorization (RMA) number. Please contact Ocean Optics for specific instructions when returning a
product.
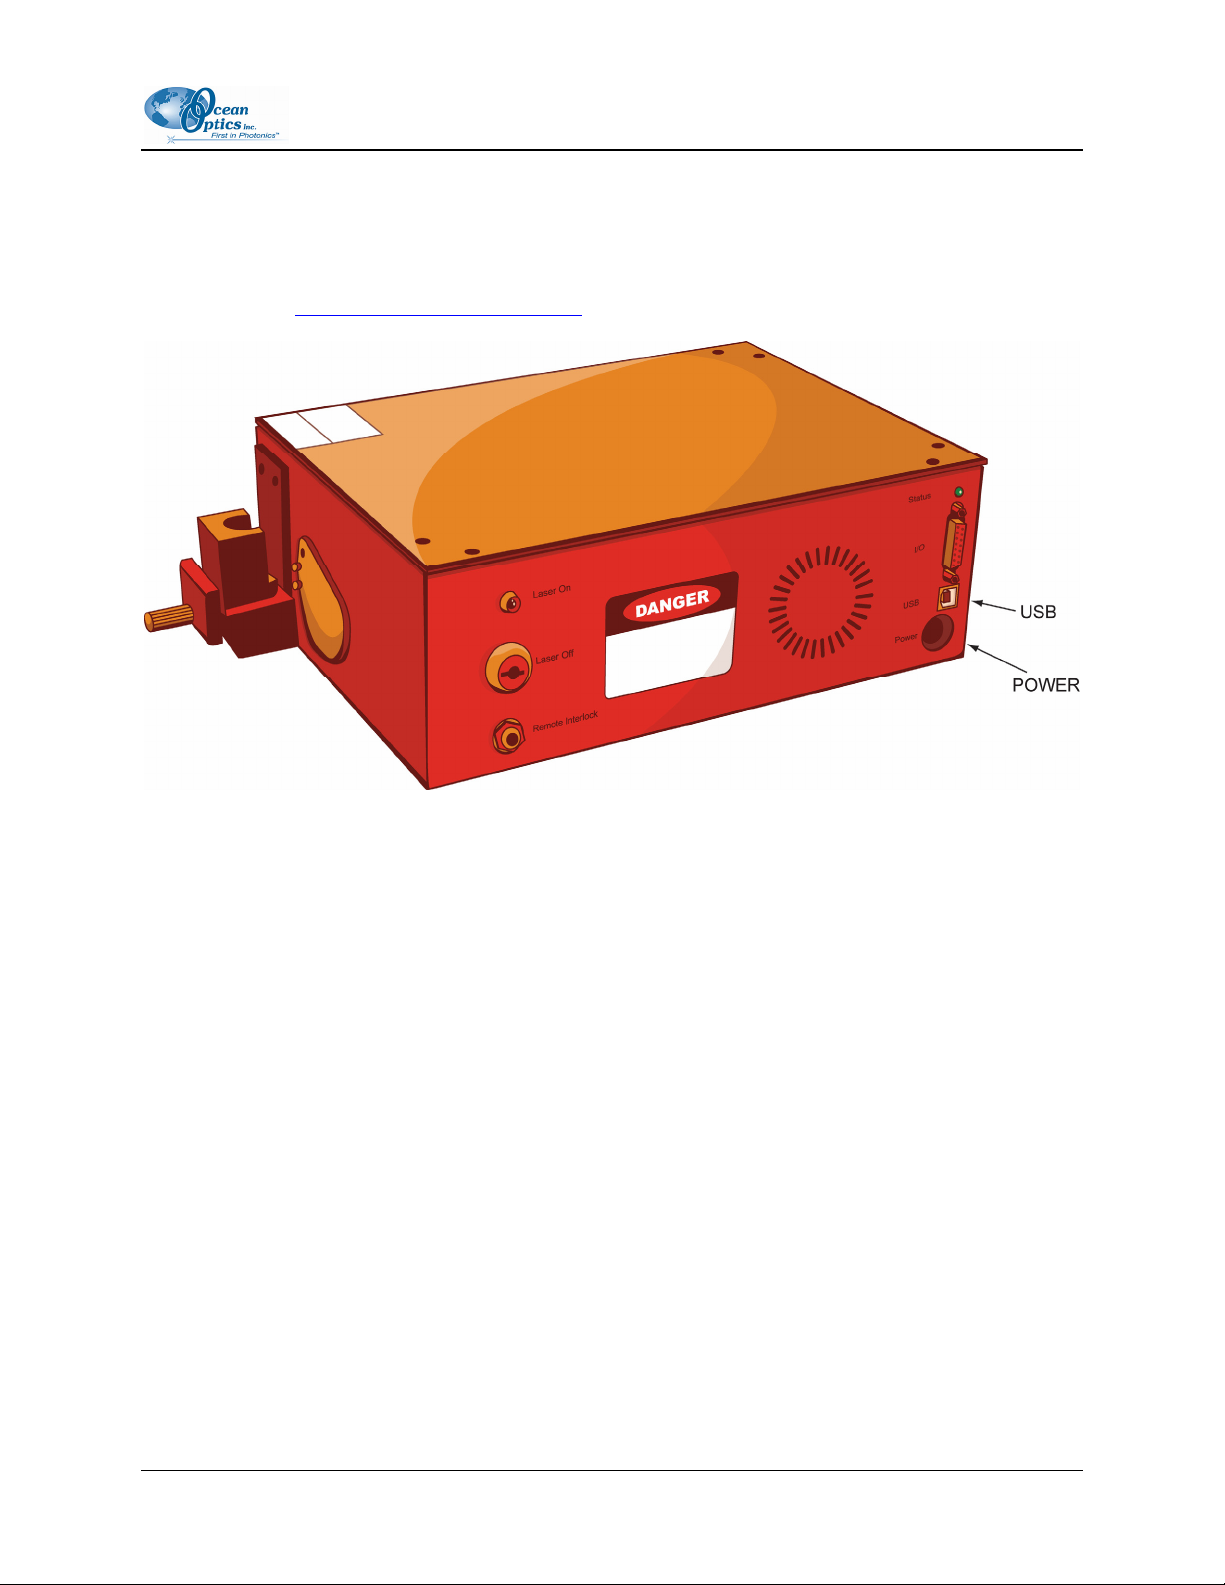
Laser Safety
Although the MMS Raman Spectrometer is laser-safe, we advise that laser safety eyewear must be worn
while operating the system. The MMS Raman uses a Class 3b laser that can cause serious eye injury. The
unit contains a remote interlock feature that deactivates the laser when a plug is inserted (see Remote
Interlock
Optics
for more information). Safety goggles are available for use with the system. Contact an Ocean
Applications Scientist for details.
iv 000-40000-000-02-0906
Page 7
Chapter 1
Installation
Introduction
The Centice Multimodal Multiplex Sampling (MMS) Raman spectrometer provides significantly higher
measurement sensitivity than a conventional grating based slit entrance spectrometer due to its unique
multimodal multiplex sampling (MMS) technology. An MMS-based spectrometer samples nearly 1,000
optical channels simultaneously through a large area coded aperture – instead of a slit – then applies
proprietary algorithms to precisely construct the spectral content of a source. With MMS technology, both
high resolution and high light throughput can be achieved simultaneously in a single shot measurement.
SpectraSuite software is available with this spectrometer to aid you with your spectral analysis.
The Centice Raman spectrometer is designed to be easy to use and operate with minimal set-up. Follow
the detailed step by step instructions described in this chapter to install the spectrometer.
Applications
MMS-based instruments are ideal for measuring weak, scattering and diffuse sources and samples
because the spectrometer can collect and process far more light through its wide area aperture, without
affecting spectral resolution.
Key applications include material inspection, identification of unknown materials, and quantitative
analysis of both intermediates and final products in the chemical and pharmaceutical industries. Any
material that is Raman-active and fits within the sample chamber of the instrument can be measured.
Typical samples include powders, liquids and polymers. The system is also ideal for teaching and
research applications in colleges and universities.
The MMS system uses a wide-area aperture that cannot be illuminated effectively with a fiber input. The
aperture should be slightly overfilled to obtain the best spectrum. The wide-area aperture and grating
cannot be changed. The MMS aperture and grating are designed specifically for the detector. For fiberbased Raman analysis, consider our
000-40000-000-02-0906 5
QE65000 Spectrometer or the Raman Systems R-3000.
Page 8

1: Installation
About SpectraSuite
SpectraSuite is a completely modular, Java-based spectroscopy software platform that operates on
Windows, Macintosh and Linux operating systems. The software can control any Ocean Optics USB
spectrometer and device, as well as any other manufacturer’s USB instrumentation using the appropriate
drivers. SpectraSuite is a user-customizable, advanced acquisition and display program that provides a
real-time interface to a variety of signal-processing functions. With SpectraSuite, you have the ability to
perform spectroscopic measurements (such as absorbance, reflectance, and emission), control all system
parameters, collect and display data in real time, and perform reference monitoring and time acquisition
experiments.
Features
• Novel Multimodal Multiplex Spectroscopy (MMS)
-1
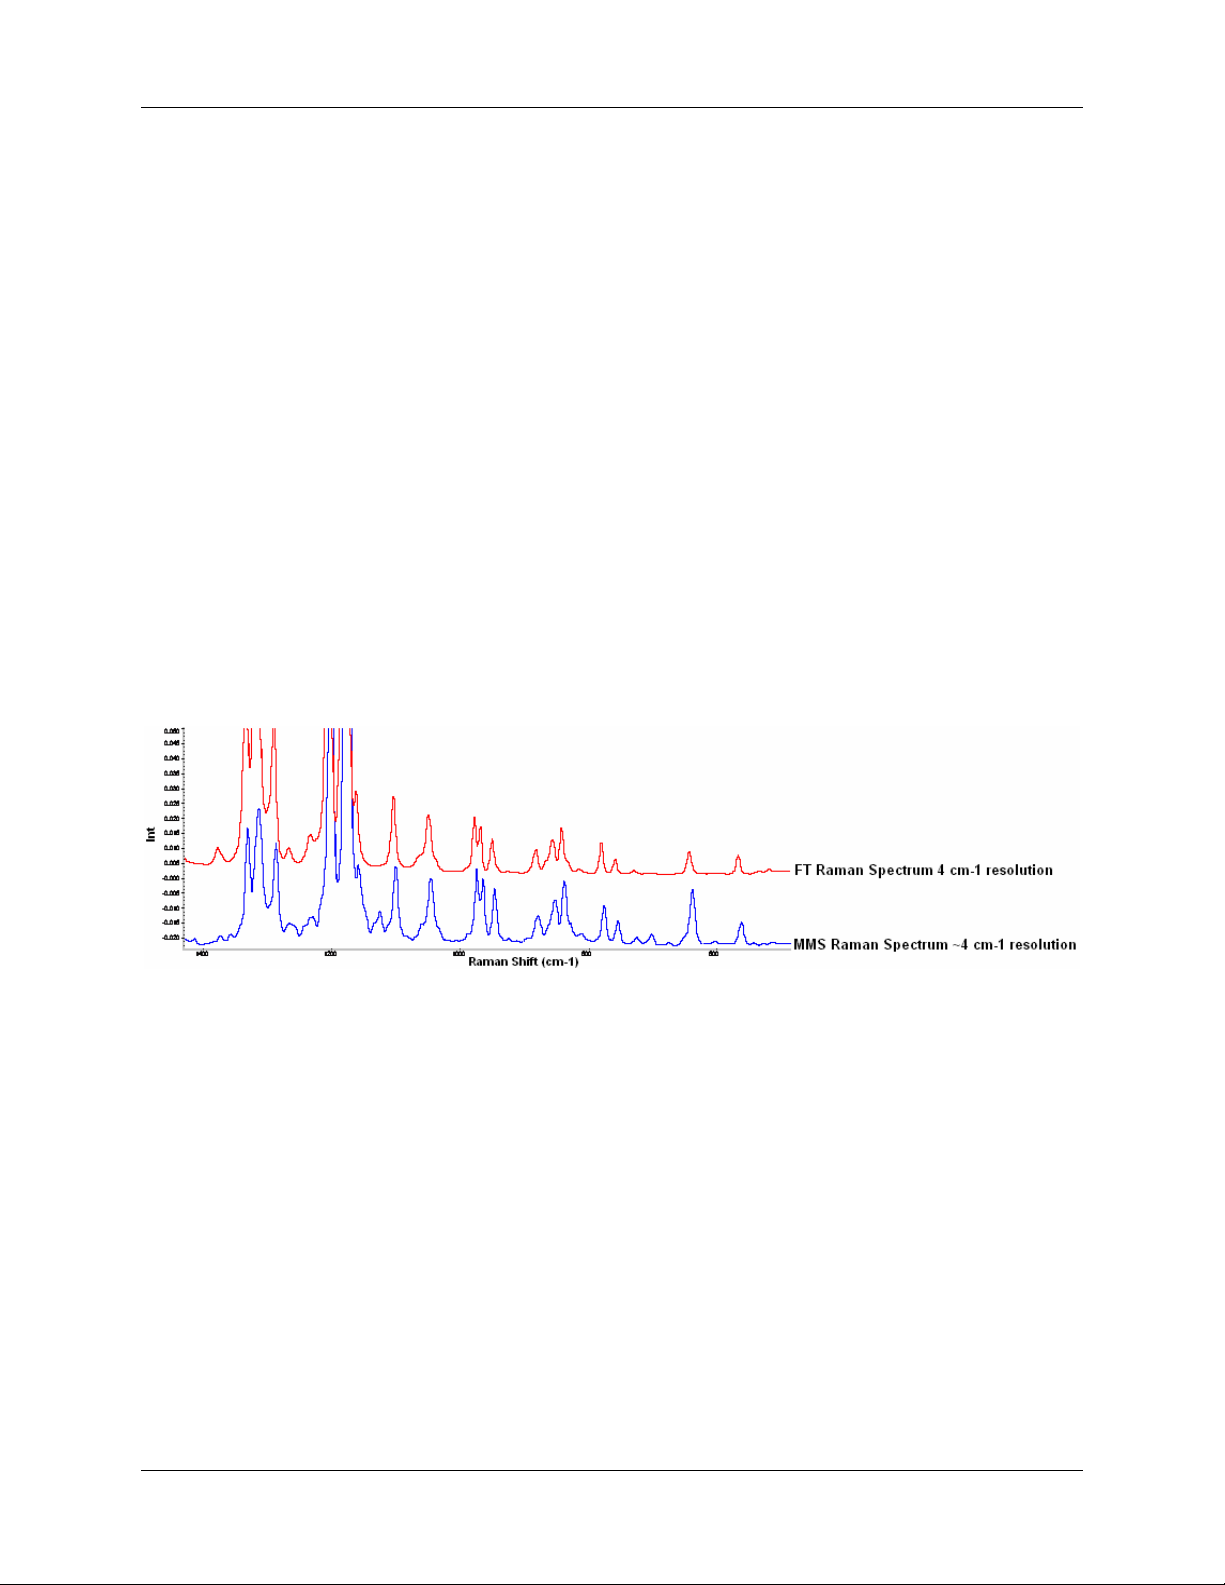
• Spectral resolution of ~4 cm
• Spectral range of 220-2000 cm
• Integration times ranging from 50 ms-100 seconds
• Sample holder for cuvettes and test tubes
• Rapid analysis, with no sample preparation
-1
Parts Included
• Digital Raman Spectrometer with integrated sample holder (holds up to 10-mm cuvettes and test
tubes)
• Power supply for the Spectrometer CCD Camera
• Key for turning the laser on/off
• Removable Remote Interlock plug to automatically disable the laser (see Remote Interlock
more information)
• USB cable to interface to the PC
• Ocean Optics Software and Technical Resources CD with this user manual
Caution
You must first install the software before you power up the spectrometer.
Other Equipment Needed
In addition to the parts you received with your spectrometer, you will need the following equipment to
run your experiments:
• Ocean Optics’ SpectraSuite Spectrometer Operating Software
• A computer to run the software. See the SpectraSuite Spectrometer Operating Software
Installation and Operation Manual for SpectraSuite system requirements.
• Safety goggles (such as the R-2001-GL goggles from Ocean Optics)
for
6 000-40000-000-02-0906
Page 9
1: Installation
Installation Procedure
Before you power up your Raman spectrometer, you must install the software. See the SpectraSuite
Spectrometer Operating Software Installation and Operation Manual for software installation
instructions. See Product-Related Documentation
for more information on accessing this document.
Procedure
►
1. Install SpectraSuite on the destination computer. See the SpectraSuite Spectrometer Operating
Software Installation and Operation Manual for information on SpectraSuite.
2. Connect the camera power supply to the power interface of the device, and plug the power supply
into an AC outlet. All functions of the spectrometer are operational when it is powered on except
for the laser.
3. Locate the USB cable provided with the spectrometer. Connect one end of the USB cable to the
USB interface of the spectrometer camera and the other end into the computer. Your computer
system should detect the new hardware. Follow the instructions for your computer system for it to
recognize the new hardware device.
000-40000-000-02-0906 7
Page 10

1: Installation
8 000-40000-000-02-0906
Page 11

CHAPTER 2
Operating the Spectrometer
This chapter describes the procedure to operate your MMS Raman spectrometer. Follow these
instructions carefully for optimum results.
A schematic layout of the MMS Raman spectrometer is shown below:
Sample Placement
The MMS Raman spectrometer contains an attached sample holder. Remove the sample holder cover and
place the cuvette with your sample into the sample holder. You can adjust its distance from the lens using
the z-axis knob. In general, liquid samples should be placed as close to the lens as possible; solid samples
should be placed as far from the lens as possible.
000-40000-000-02-0906 9
Page 12

3: Operating the Spectrometer
Acquiring Spectra
► Procedure
1. Remove the sample holder cover.
2. Place the sample cuvette in the sample holder and adjust its distance from the lens using the Zaxis knob. Then, replace the cover.
3. Turn the laser safety key to the On position (vertical) to activate the laser. The laser is not active
at this point. A signal is sent to the spectrometer’s processor requesting activation of the laser.
The LED on the spectrometer lights. Two seconds after the processor receives the laser activation
request, the processor sends the activation signal to the laser controller. The laser is now
operating.
Note
If you attempt to take a scan with the laser off, a warning appears in SpectraSuite:
4. If you have not already done so, start the SpectraSuite software application.
SpectraSuite should now recognize the spectrometer (a picture of the spectrometer appears in the
Data Sources pane of the SpectraSuite window).
10 000-40000-000-02-0906
Page 13

3: Operating the Spectrometer
5. Click on the line under the MMS Raman Spectrometer’s Acquisition node (expand the node if
necessary) in the Data Sources pane, then click on the spectrum graph to activate the acquisition
controls at the top of the screen.
6. Click
(single shot) to start a scan after installing the MMS Raman Spectrometer. Unlike
other Ocean Optics spectrometers, you must first click an acquisition control to start a scan after
installing the MMS Raman Spectrometer. This precaution is taken since the MMS Raman
Spectrometer uses an internal laser.
7. The spectrum graph appears in wavelength units. Select either Processing | Processing Mode |
Raman Shifts or Processing | x-axis Units | Raman Shifts. The next acquisition appears in
Raman Shifts. Click
(single shot) or (continuous) acquisition control on the
SpectraSuite screen to take your Raman spectrum.
000-40000-000-02-0906 11
Page 14

3: Operating the Spectrometer
Note
SpectraSuite automatically takes a dark reading for you.
8. You can display the CCD image, if desired. Either right-click on the spectrometer in the Data
Sources pane and select Spectrometer Features or select Spectrometer | Spectrometer
Features from the menu. Use Auto Equalize to adjust the contrast and brightness.
12 000-40000-000-02-0906
Page 15

3: Operating the Spectrometer
9. Save the spectrum or export it to an ASCII text file.
000-40000-000-02-0906 13
Page 16

3: Operating the Spectrometer
14 000-40000-000-02-0906
Page 17

Appendix A
Specifications
Specification Value
Spectral Range 220-2200 cm-1
Spectral Resolution ~4 cm-1
Grating (*) 1200 lines/mm Transmissive Volume phase grating
CCD specifications:
Chip Hamamatsu CCD
Pixel Array 512 x 122 Active pixels
Pixel Size 24 x 24 microns
Well Capacity 300,000 electrons
Quantum Efficiency 85% at 250 nm
Dark Noise 200 e-/pixel/sec @ 0o C
A/D resolution 16 bits
Exposure Time 50ms to 100 s
Detector readout noise 8 e- RMS
Gain 4.7 e-/ADC count
Cooling to 20o C below ambient temperature
Laser Source Requirements:
Lasing Wavelength: 785 nm
Power Output: > 70 mW
Spectral Line-width: < 0.2 nm
000-40000-000-02-0906 15
Page 18

A: Specifications
Specification Value
General Specs:
Operating temperature range -10o to 35o C
Operating Voltage 120 VAC, 50-60Hz
Power Consumption (Maximum) 25 W
Computer Interface USB 2
16
000-40000-000-02-0906
Page 19

Appendix B
Introduction to Multimodal
Multiplex Sampling
Introduction
This appendix describes a new generation of spectrometer technology that employs multimodal multiplex
sampling (MMS). The performance of a spectrometer based on MMS is then compared to conventional
slit and fiber input spectrometers.
Dispersive spectrometers come in two basic designs: scanned-grating monochromators and static grating
designs with detector arrays. With the availability of inexpensive linear detectors and charge coupled
devices (CCDs) in the UV/Visible/NIR region, dispersive spectrometers are moving away from scannedgrating designs to static implementations. Static implementations are preferred for their single shot
measurements, fast data acquisition times and
high mechanical reliability. A typical static
grating design is shown in Figure 1.
Figure 1: A traditional static grating spectrometer
Most dispersive designs use a fiber based input
while some implement a vertical slit which is
binned on the detector to increase sensitivity. In
such traditional designs, there is an inherent
tradeoff between resolution and light throughput.
While spectral resolution increases as slit width
decreases, a narrow input slit greatly limits
photon throughput and likewise, measurement
sensitivity.
Centice is introducing a new patent pending
spectrometer design based on an optical sensing
technology originally developed at
Duke University called Multimodal Multiplex
Sampling (MMS).
000-40000-000-02-0906 17
Page 20

B: Introduction to Multimodal Sampling
An MMS-based spectrometer samples nearly 1,000 optical channels simultaneously through a coded
aperture – instead of a slit – then applies proprietary algorithms to precisely construct the spectral content
of a source. With MMS technology, both resolution and throughput (aka etendue) can be maintained and
optimized in a single-shot measurement. Interestingly, while the exact performance advantages of MMS
vary with the particular circumstances, in no case can a fiber or slit input spectrometer outperform an
identically configured MMS system.
The most dramatic MMS performance advantage is realized when making difficult measurements such as
measuring weak, scattering and/or diffuse sources commonly occurring in life science applications as well
as field or portable use. Diffuse and scattering samples are particularly challenging for conventional
sensors to measure because light collection is extremely low and thus, spectral features of interest are
flattened or are not detected at all. MMS systems inherently alleviate this problem. Furthermore, MMS
technology can be used for UV-Visible, NIR, Fluorescence and Raman spectroscopy. In this whitepaper,
we will provide an overview of MMS and compare its performance to slit/fiber based spectrometers.
Theory of Operation
The layout of a typical MMS spectrometer is shown in Figure 2. This particular design uses a dispersive
grating geometry with a coded aperture in place of a traditional slit/fiber. Light enters the system through
the coded aperture and is collimated onto the grating by a collimating lens. The grating spectrally
disperses the light which is then mapped
to a 2-D detector array such as a CCD.
The dispersive element could be a
transmissive volume phase hologram or a
reflective holographic grating depending
on the spectral range and other system
design parameters. It is important to note
that the MMS technology platform can b
implemented using a wide variety of
optical designs and be applied to any
spectral range.
e
Figure 2: Schematic of a MMS spectrometer
18 000-40000-000-02-0906
Page 21

B: Introduction to Multimodal Sampling
Coded Aperture
The coded aperture is fabricated in such a manner that it has
transmissive and blocking apertures. MMS allows for the
flexible use of these aperture codes and custom codes can be
implemented to optimize the performance for any specific
application. To estimate a spectrum, place the source at the
input to illuminate the whole aperture. For ease and
convenience, a fiber bundle can also be attached to the aperture
if the sample is physically remote from the spectrometer. By
the use of collimating and focusing lenses, the input aperture is
spectrally imaged onto the CCD. The CCD measures
multiplexed patterns of the aperture depending on the spectral
content of the source. The CCD measurements are then inverted
by the use of appropriate algorithms and the source spectrum is
reconstructed. It is important to know the particular aperture code that is implemented in the system for
the inversion algorithms. Figure 3 illustrates the spectrum from an Argon lamp obtained with a MMS
spectrometer. Some key differentiators for this technique include the following:
Multiplex (SNR) Advantage
Figure 3: Spectrum of Argon lamp
obtained with an MMS
spectrometer
A slit/fiber spectrometer measures each spectral channel separately onto a pixel in the detector. However
in MMS, each pixel in the detector measures several spectral channels of the source in tandem. This is the
multiplex advantage of MMS; resulting in a substantial improvement in signal-to-noise ratio (SNR) (see
Signal to Noise Ratio
).
Multimodal (Etendue) Advantage
MMS spectrometers offer an etendue advantage (see Etendue). Every spectral source radiates into
numerous spatial modes. For fiber or slit based systems, only a few modes can be coupled into the
system. Since the aperture area of the MMS input is comparatively large, many modes of the source can
be simultaneously coupled into the optical system.
Imaging Aspect of MMS
Inherently, MMS is an imaging spectrometer design. So this technique can be easily adapted to
simultaneously measuring many spectral inputs using a single detector array.
000-40000-000-02-0906 19
Page 22

B: Introduction to Multimodal Sampling
MMS and Conventional Multiplex Spectroscopy
Multiplex design has been applied to spectroscopy for over 50 years, including both Fourier and
Hadamard transform designs. In general, these designs have been applied to infrared spectroscopy and
have emphasized minimizing the number of electronic detectors used. For example, dynamic mask
Hadamard transform spectrometers employ spatial light modulators (SLM) such as MEMS based devices
or electro-optic elements to temporally multiplex spectral channels. SLM is a device that controls the
transmission or reflection of light electronically and is placed between the grating and the detector. The
SLM spectrally encodes the dispersed light from the grating and combines them in coded fashion (like a
Hadamard transform) onto the detector, one row at a time. Since the coding is done between the grating
and the detector, there is no real etendue advantage in such spectrometers. Furthermore, data acquisition
is performed serially.
In contrast, MMS is a true 2-dimensional parallel acquisition and processing system that captures both
spatial and spectral information simultaneously throughout the entire aperture. This leads to a number of
performance advantages (not the least of which is higher etendue and SNR) as well as unique features
such as multi-input and hyperspectral imaging. These important differences enable MMS designs to
outperform conventional multiplex as well as fiber and slit entrance spectrometer designs. In addition to
its performance advantages, MMS can be implemented using commonly available low cost components.
Performance Comparison
In this section, the performance of MMS spectrometer is compared with that of a conventional slit and
fiber input spectrometers. System components for each system (f number, grating, lenses, filters, detector
etc.) are identical. For these experiments, a Raman spectrometer with an excitation wavelength of 663 nm
is used as the test-bed.
This system implements an f/2 optical design and a Kodak CCD detector, cooled to -18oC. The system
was set up to accommodate each of three entrance designs: 1) pin hole, 2) vertically binned slit, and 3)
coded aperture. To provide a fair performance comparison of the three sampling methods, the width of the
pin hole, slit width and feature size of coded aperture are equivalent. Thus the optical resolution of each
configuration is equal. Additionally, the height of the slit and aperture are equal.
Etendue
Etendue is a well accepted measure for optical throughput as it specifies the geometric capability of an
optical system to transmit radiation. The numeric value of the etendue is a constant of the system and is
calculated as the product of the entrance aperture (or slit area) and the solid angle through which light is
accepted.
Assume that the input aperture implements an order N matrix. Such an aperture typically has 2N x N
aperture elements, with each element proportional to the pixel size. The etendue of such a spectrometer is
given by:
Etendue (MMS) = 0.5 x 2N x N x Ω
where Ω is the input solid angle and the factor of 0.5 takes into account the fact that only 50% of the
aperture elements are transparent.
20 000-40000-000-02-0906
Page 23

B: Introduction to Multimodal Sampling
The etendue for a slit based spectrometer achieving the same resolution is:
Etendue (Slit) = 2N x 1 x Ω
and for a fiber input-based spectrometer, the etendue is:
Etendue (Fiber) = 1 x 1 x Ω
Therefore,
E
MMS
NE=
/2
Slit
and
E
MMS
Fiber
2
NE=
Typical MMS implementations use proprietary coding schemes that range in order from N=16-48. That
translates to an etendue advantage of 8-24X compared to slit based spectrometers or 256-2304X
compared to fiber based spectrometers. This is illustrated in Figures 4 and 5.
Figure 4: Etendue advantage of
MMS compared to a binned slit.
Figure 5: Etendue advantage of
MMS compared to a pin hole.
000-40000-000-02-0906 21
Page 24

B: Introduction to Multimodal Sampling
Signal to Noise Ratio
A better understanding of the performance advantage of MMS spectroscopy can be obtained by
comparing spectra from real samples. Raman spectra of Toluene are measured with three different
configurations and an integration time of 2 seconds: fiber-input (Figure 6), vertically binned slit (Figure
7), and MMS (Figure 8), where all other system parameters are equivalent. These data show a noticeable
signal to noise ratio advantage of MMS. The specific advantage depends on the source noise
characteristics, detector noise characteristics and the spectral content of the source, and therefore cannot
be generalized for all cases. However, MMS spectrometers always offer superior signal to noise
performance versus these conventional designs.
Figure 6: Raman spectrum of
toluene with a pinhole aperture
.
Figure 7: Raman spectrum of toluene
measured with a slit.
Figure 8: Raman spectra of toluene
measured with MMS.
Additional Raman spectra obtained with the MMS spectrometer are shown in Figures 9 and 10.
Figure 9: Raman spectrum of Tylenol with MMS
spectrometer (20s integration)
Figure 10: Raman spectrum of toluene with MMS
spectrometer (20s integration)
22 000-40000-000-02-0906
Page 25

B: Introduction to Multimodal Sampling
Measuring in Scattering Media
igh etendue MMS systems perform extremely well when measuring scattering samples such as blood or
H
ssue. For comparative purposes, we measure the Raman spectrum of ethanol in lipid. Lipid is a blood
ti
ulating medium which offers scattering properties similar to that of blood. The Raman spectra are
em
own in Figures 11, 12 and 13. A higher percentage of Raman scattered photons – the signal of interest –
sh
entering the wide area aperture of the MMS system as evidenced by the stronger primary ethanol peak
is
these figures. The spectra have been zoomed in to 800-1100 cm-1 range. Note that this is a 663 nm
in
excitation sy
stem, so some of the Raman ethanol peaks are lost in the background fluorescence.
Figure 11: Raman spectrum of
ethanol in lipid with pinhole
Figure 12: Raman spectrum of
ethanol in lipid with a binned slit.
Figure 13: Raman spectrum of
ethanol in lipid
with MMS
Conclusion
Multimodal multiplex spectroscopy is an example of how digital instruments can be adapted to specific
measurement tasks, in this case efficient signal collection from wide area sources. Of course, sensors are
evaluated in practice by how well they perform specific tasks. For MMS systems, attractive applications
focus on molecular recognition and imaging for life and chemical science applications. While we have
shown in this white paper that MMS systems offer performance advantages over conventional systems,
the use of MMS systems as embedded biological and chemical sensors will perhaps be more significant
than their application as general purpose bench top spectrometers.
000-40000-000-02-0906 23
Page 26

B: Introduction to Multimodal Sampling
24 000-40000-000-02-0906
Page 27

Appendix C
Remote Interlock
The laser activation request signal passes through the Remote Interlock, a 0.25” phone jack on the panel
of the spectrometer. The Remote Interlock feature has been designed to pass this signal with no plug
inserted into the jack. An unwired plug (0.25” phone plug, 3 conductor type: Tip, Ring, and Shield,
provided) inserted into the jack opens this signal path. The spectrometer processor will no longer receive
the activation request and will stop sending the activation signal to the laser controller, shutting off the
laser. This will also cause the Laser On LED to turn off.
Connecting the Tip and Ring conductors of the plug to the normally closed (NC) contacts of an external
user-specified switch maintains the laser activation request signal path when the plug is inserted into the
Remote Interlock jack. Opening the external switch contacts disables the laser.
000-40000-000-02-0906 25
Page 28

B: Introduction to Multimodal Sampling
26 000-40000-000-02-0906
Page 29

Index
theory of operation, 18
A
additional equipment, 6
applications, 5
C
coded aperature, 19
comparison to conventional spectrometer, 20
conventional multiplex spectroscopy, 20
D
document
audience, iii
purpose, iii
summary, iii
E
etendue, 18, 19, 20
P
parts included, 6
product-related documentation, iv
R
remote interlock, iv
S
scattering samples, 23
signal-to-noise ratio, 19, 22
specifications, 15
spectra
acquiring, 10
SpectraSuite, 6
spectrometer
operation, 9
placement, 9
specifications, 15
F
T
features, 6
theeory of operation, 18
I
U
imaging, 19
installation, 5, 7
upgrades, iv
M
MMS, 17
000-40000-000-02-0906 27
Page 30

000-40000-000-02-0906 28
 Loading...