

Page 1

Laser-Induced Spectroscopy
LIBS2000+
Installation and Operation Manual
Document Number 161-00000-000-02-0406
Offices:
E-mail: Info@OceanOptics.com (General sales inquiries)
Ocean Optics, Inc.
830 Douglas Ave., Dunedin, FL, USA 34698
Phone (727) 733-2447
Fax (727) 733-3962
8 a.m.– 8 p.m. (Mon-Thu), 8 a.m.– 6 p.m. (Fri) EST
Ocean Optics B.V. (Europe)
Geograaf 24, 6921 EW DUIVEN, The Netherlands
Phone 31-(0)26-3190500
F ax 31-(0)26-3190505
Info@OceanOpticsBV.com (European sales inquiries)
Orders@OceanOptics.com (Questions about orders)
TechSupport@OceanOptics.com (Technical support)
Page 2

Copyright © 2001-2006 Ocean Optics, Inc.
All rights reserved. No part of this publication may be reproduced, stored in a retrieval system, or transmitted, by any means, electronic,
mechanical, photocopying, recording, or otherwise, without written permission from Ocean Optics, Inc.
This manual is sold as part of an order and subject to the condition that it shall not, by way of trade or otherwise, be lent, re-sold, hire d out or
otherwise circulated without the prior consent of Ocean Optics, Inc. in any form of binding or cover other than that in which it is published.
Trademarks
All products and services herein are the trademarks, service marks, registered trademarks or register ed service marks of their respective owners.
Limit of Liability
Every effort has been made to make this manual as complete and as accurate as possible, but no warranty or fitness is implied. The information
provided is on an “as is” basis. Ocean Optics, Inc. shall have neither liability nor responsibility to any person or entity with respect to any loss or
damages arising from the information contained in this manual.
Page 3

Important Safety Notices
WARNING
The LIBS System uses a Class IV laser. Exposure to the laser can cause eye and skin
damage. Although the LIBS System incorporates numerous safety features, due care
is required when using a laser to prevent injury.
1. Use safety goggles at all times when operating the laser as a standalone unit.
2. Only permit trained personnel to operate the laser.
3. Read all the instructions that accompanied your laser.
161-00000-000-02-0406 i
Page 4

Important Safety Notices
ii 161-00000-000-02-0406
Page 5

Table of Contents
About This Manual .......................................................................................................... v
Document Purpose and Intended Audience.............................................................................. v
What’s New In This Document .................................................................................................. v
Document Summary.................................................................................................................. v
Product-Related Documentation ............................................................................................... v
Upgrades......................................................................................................................... vi
Chapter 1: Introduction ......................................................................1
Product Overview ............................................................................................................ 1
How the LIBS2000+ Works ....................................................................................................... 1
Advantages of Broadband LIBS Techniques ............................................................................1
LIBS Emission ID....................................................................................................................... 2
Applications ..................................................................................................................... 3
Laser Requirements for LIBS2000+ ................................................................................ 3
Shipment Components.................................................................................................... 4
Standard LIBS System .............................................................................................................. 4
Other Required Equipment........................................................................................................4
Additional Recommended Equipment ....................................................................................... 5
Chapter 2: Installing the LIBS System..............................................7
Overview ......................................................................................................................... 7
Hardware Set-up ............................................................................................................. 7
Software Installation ........................................................................................................ 9
OOIBase32 Software Installation .............................................................................................. 9
OOILIBS Software ..................................................................................................................... 10
Hardware Cabling............................................................................................................ 10
System Start-up............................................................................................................... 13
Assigning Spectrometers........................................................................................................... 13
Loading the Element Library .....................................................................................................15
161-00000-000-02-0406 i
Page 6

Table of Contents
Chapter 3: Operation ..........................................................................17
Overview ......................................................................................................................... 17
Configuration ...................................................................................................................17
Set Q-Switch Delay ................................................................................................................... 17
Setup Options............................................................................................................................18
Set up Radiometric Information................................................................................................. 19
Initial Testing ................................................................................................................... 20
Using OOILIBS Software Modes ..................................................................................... 21
Pixel Correlation Mode .............................................................................................................. 21
Pixel Correlation Procedure .................................................................................................. 22
Element ID Mode.......................................................................................................................24
Elemental ID Procedure........................................................................................................ 24
Peak Analysis Mode .................................................................................................................. 25
Lines to Analyze Options ...................................................................................................... 25
Lines Information................................................................................................................... 26
Peak Analysis Procedure ...................................................................................................... 26
Performing Correlation in OOILIBS ................................................................................. 27
Accessing the Correlation Window............................................................................................ 27
Adding Samples to the Correlation Library................................................................................ 28
Saving the Correlation Library...................................................................................................30
Correlation Tips ......................................................................................................................... 30
Chapter 4: Troubleshooting...............................................................31
Overview ......................................................................................................................... 31
HR2000 Connected to PC Prior to OOILIBS Installation................................................. 31
Remove the Unknown Device from Windows Device Manager................................................31
Remove Improperly Installed Files ............................................................................................ 32
Laser Troubleshooting..................................................................................................... 33
Problem ..................................................................................................................................... 33
Probable Cause.........................................................................................................................33
Solution...................................................................................................................................... 33
Spectrometer Troubleshooting ........................................................................................ 33
Continuous Beeping from System............................................................................................. 33
Problem.................................................................................................................................33
Probable Cause .................................................................................................................... 33
Solution ................................................................................................................................. 33
System Prompts for ezusb.sys or an .inf File ............................................................................ 34
Problem.................................................................................................................................34
Probable Cause .................................................................................................................... 34
Solution...................................................................................................................................... 34
Verifying Device Setup .............................................................................................................. 34
Problem.................................................................................................................................34
Solution ................................................................................................................................. 34
ii 161-00000-000-02-0406
Page 7

Table of Contents
OOILIBS Software Troubleshooting ................................................................................ 35
Program Keeps Freezing or Locking Up ................................................................................... 35
Problem.................................................................................................................................35
Probable Cause .................................................................................................................... 35
Solution ................................................................................................................................. 35
Appendix A: Specifications................................................................37
Appendix B: User Interface................................................................39
Menu Bar......................................................................................................................... 39
File Menu...................................................................................................................................39
View Menu................................................................................................................................. 40
Overlay Sub-Menu ................................................................................................................40
ScanType Menu ........................................................................................................................ 41
Mode Menu................................................................................................................................ 41
Background Menu .....................................................................................................................42
Background | Mode Menu..................................................................................................... 42
Library Options Menu ................................................................................................................ 42
Library Options | Element ID Menu....................................................................................... 43
Library Options | Correlation Menu ....................................................................................... 43
Tools Menu................................................................................................................................ 44
Stage Menu ............................................................................................................................... 44
Tool Bar........................................................................................................................... 44
Dialog Bar........................................................................................................................ 45
Status Bar.................................................................................................................................. 46
Graph Window................................................................................................................. 47
Index .....................................................................................................49
161-00000-000-02-0406 iii
Page 8

Table of Contents
iv 161-00000-000-02-0406
Page 9
About This Manual
Document Purpose and Intended Audience
This document provides the user of the LIBS 2000+ for setting up, calibrating and performing
experiments with their system.
What’s New In This Document
This version of the Laser-Induced Spectroscopy LIBS2000+ Installation and Operation Manual updates
the safety instructions.
Document Summary
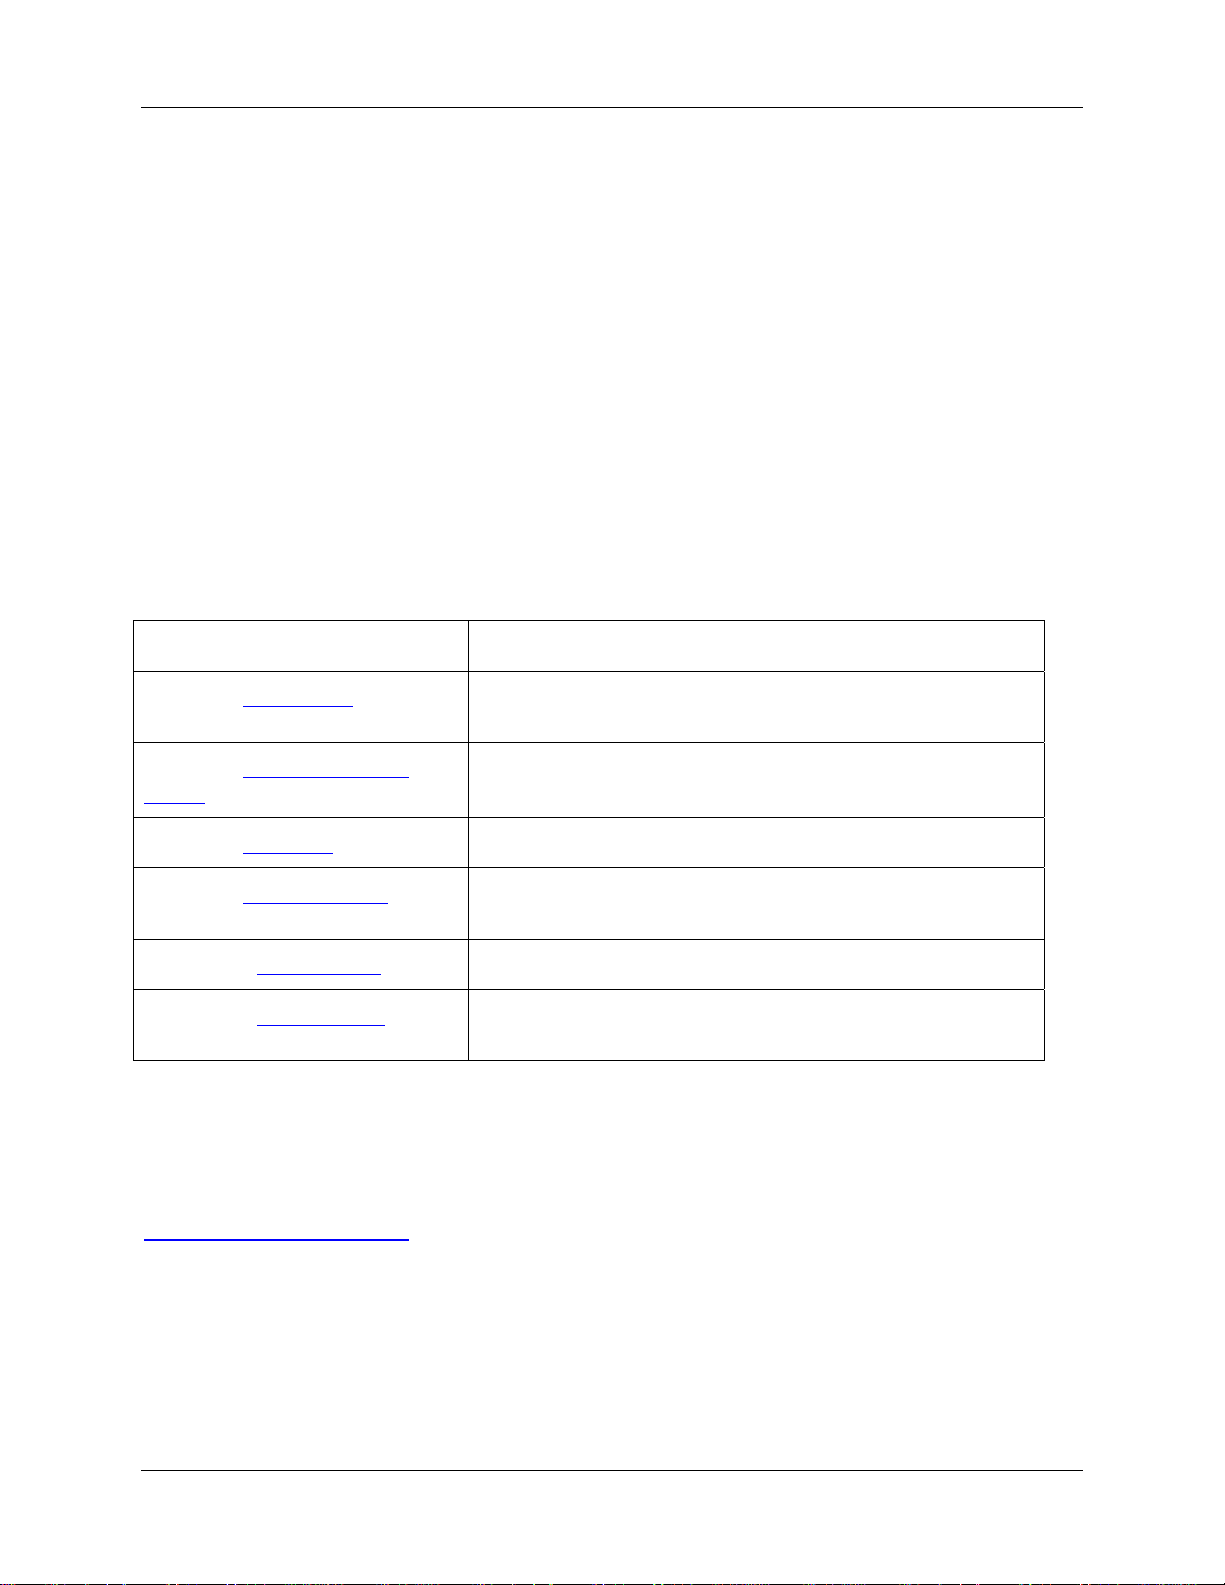
Chapter Description
Chapter 1: Introduction
Chapter 2: Installing the LIBS
System
Chapter 3: Operation
Chapter 4: Troubleshooting
Appendix A: Specifications
Appendix B: User Interface
Contains descriptive information about the LIBS2000+ system.
It also provides laser requirements and shipment components.
Provides installation and configuration instructions.
Contains instructions for operating the LIBS2000+ System.
Contains recommended steps to isolate and correct common
problems.
Provides product specification data.
Contains a quick reference guide to the OOILIBS user
interface features.
Product-Related Documentation
You can access documentation for Ocean Optics products by visiting our website at
http://www.oceanoptics.com. Select Technical → Operating Instructions, then choose the appropriate
document from the available drop-down lists. Or, use the Search by Model Number field at the bottom
of the web page. You can also access operating instructions for Ocean Optics products from the Software
and Technical Resources CD that ships with the product. Engineering-level documentation is located on
our website at Technical → Engineering Docs.
Other Ocean Optics documentation related to your LIBS system includes the following:
161-00000-000-02-0406 v
Page 10

About This Manual
• HR2000 and HR2000CG-UV-NIR High-Resolution Fiber Optic Spectrometers Installation and
Operation Manual located at http://www.oceanoptics.com/technical/hr2000.pdf
.
• LIBS Imaging Module Installation and Operation Instructions located at
http://www.oceanoptics.com/technical/LIBS Install.pdf
• OOIBase32Spectrometer Operating Software located at
http://www.oceanoptics.com/technical/ooibase32.pdf
• Correcting Device Driver Issues located at
http://www.oceanoptics.com/technical/engineering/correctingdevicedriverissues.pdf
Upgrades
Occasionally, you may find that you need Ocean Optics to make a change or an upgrade to your system.
To facilitate these changes, you must first contact Customer Support and obtain a Return Merchandise
Authorization (RMA) number. Please contact Ocean Optics for specific instructions when returning a
product.
vi 161-00000-000-02-0406
Page 11
Chapter 1
Introduction
Product Overview
The Ocean Optics LIBS2000+ Laser-induced Breakdown Spectrometer is a detection system that permits
real-time, qualitative measurements of trace elements. This broadband, high-resolution instrument allows
for spectral analysis from 200-980 nm, with resolution of ~0.1 nm (FWHM). Sensitivity has been
reported to parts-per-billion and picogram levels.
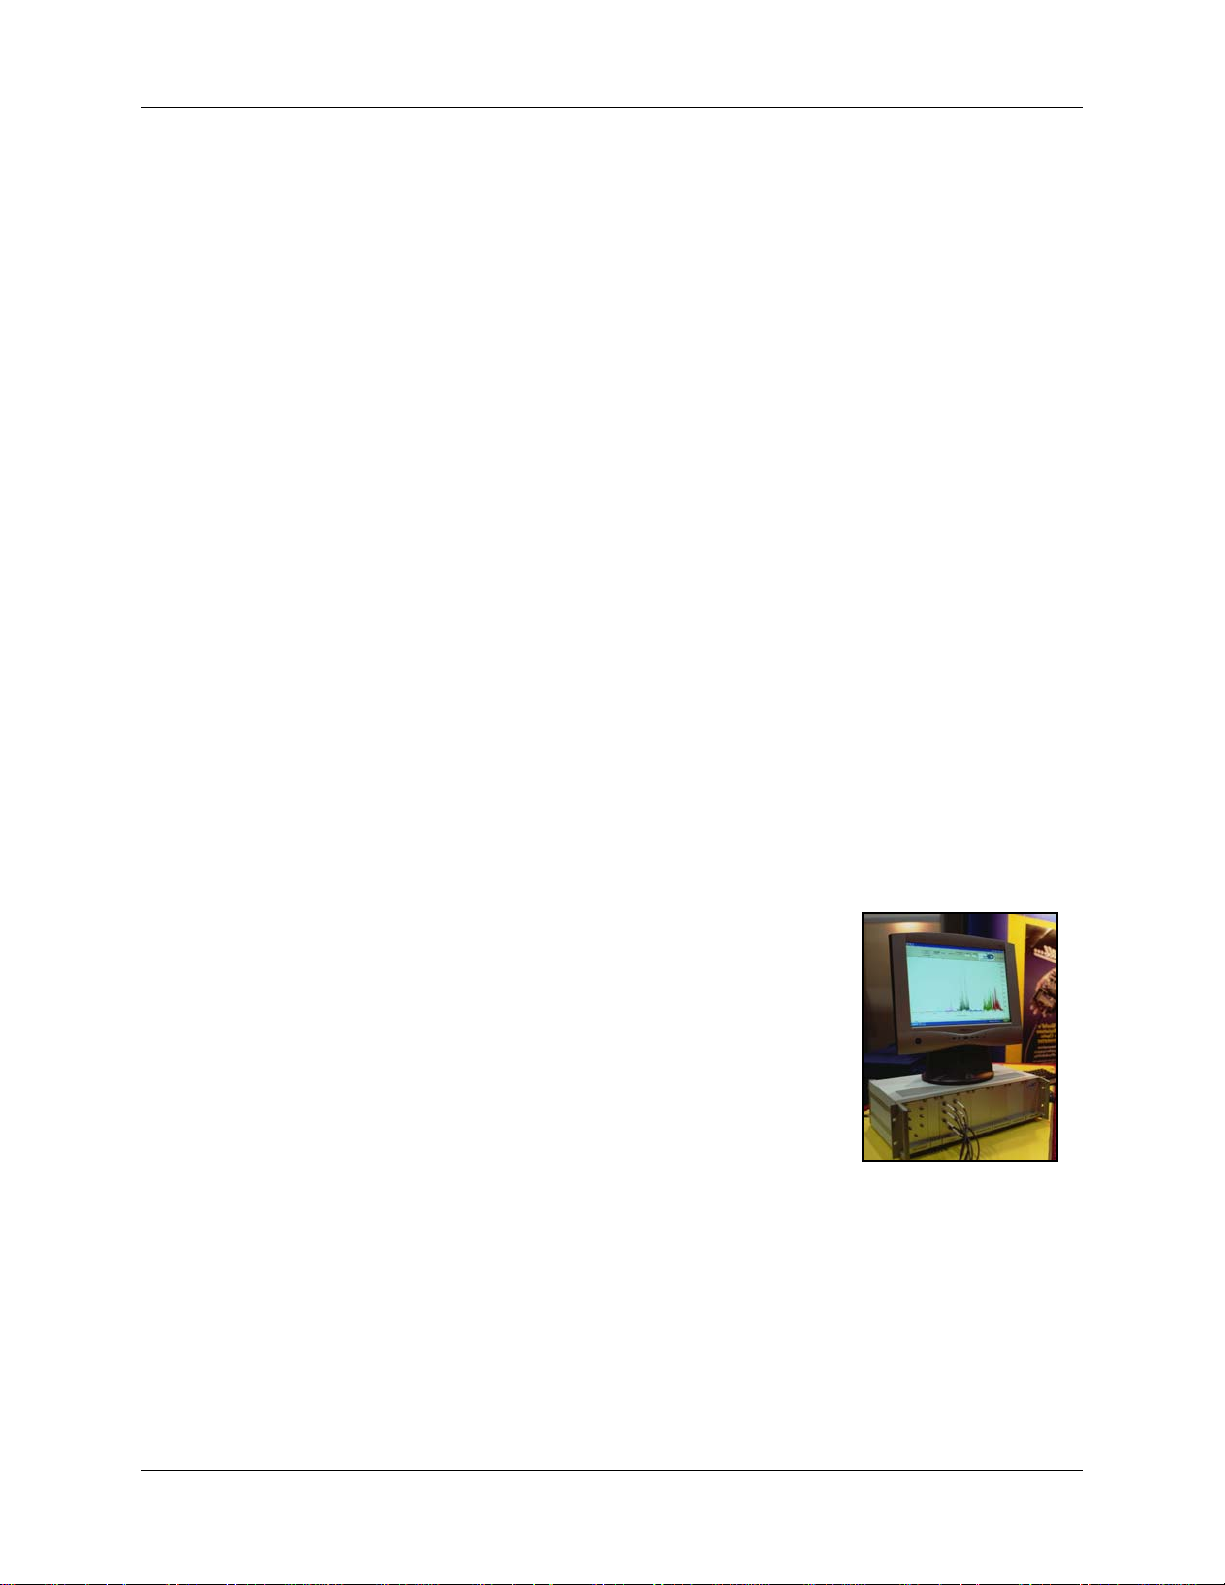
The LIBS2000+ comes in a standard 3U rack case with handles for extra convenience. The LIBS2000+
operates with any 32-bit, USB-compatible Windows PC. We provide OOILIBS Application Software
with spectral-saving and data-logging capabilities for operating the LIBS2000+ and for firing the laser.
Correlation Software, developed with the University of Florida, provides instant material identification
when using the LIBS2000+ and a spectral library consisting of 2500 atomic emission lines from the NIST
(National Institute of Standards and Technology) tables for elemental identification.
The LIBS Imaging Module is available for use with the LIBS system to enable you to precisely adjust the
laser to focus on the exact spot on the sample that you wish to analyze. The LIBS Imaging Module also
comes with PixeLINK™ software for the camera to capture high quality images on your PC.
How the LIBS2000+ Works
A high-intensity, 10 nanosecond-wide laser pulse beam is focused on the
sample area. When the laser is fired, the high temperature of the laser ablates
the surface of the sample and creates plasma. As the plasma decays or cools,
excited atoms in the plasma emit light of characteristic wavelengths distinct to
the elements present. All elements have emission spectra in the 200-980 nm
region. The detection system uses seven of our HR2000 High-resolution
Miniature Fiber Optic Spectrometers, each with a 2048-element linear CCD
array. All spectrometers are triggered to acquire and read out data
simultaneously. The detectors in the broadband (200-980 nm) LIBS2000+
collect the signal; software included with the system displays and identifies the
emission spectrum.
Advantages of Broadband LIBS Techniques
Many LIBS systems have a small spectral range. The LIBS2000+ is the first to provide broadband
spectral analysis. Because the system is noninvasive, you can perform real-time measurements in situ, in
hostile industrial, chemical and biochemical environments with little or no sample preparation.
161-00000-000-02-0406 1
Page 12

1: Introduction
LIBS Emission ID
The reason we at Ocean Optics have designed a broadband high-resolution spectrometer is to be able to
both see and resolve all the lines from all the elements. Our resolution is ~0.1 nm, less than this in the
UV-blue and a bit higher in the red-IR. Because the LIBS-generated lines are stark broadened to about 0.2
nm or so in the UV and about 0.3 nm in the IR, the system can resolve everything that is possible to
observe.
The laser-induced plasma begins life as very hot 15,000 K plasma emitting a large bremsstrahlung
continuum. Depending on the sample matrix, most emission analysis is performed for a few microseconds
for this to decay so as to not mask the line structure. During this time, the higher order transitions decay
away, leaving mostly I and II atomic emissions. These are the ones that are idenified.
Also entering into the emissions from the elements in the interrogated plasma are the collision dynamics
of the plasma. Rate equations can be used to analyze the target, but emission signatures, sample-standards
and correlation techniques are preferred to identify materials with the OOILIBS Software.
Elemental analysis and identification are very important in understanding content, and in some cases are
used for quantitative analysis. To perform analysis and identification, you must use an element catalog to
help determine when a particular element is present.
Currently we use a catalog that was derived from the MIT wavelength tables. It consists of the persistent
lines of the elements from spark spectra and is the closest to a complete catalog of the brightest lines
around the temperature of the decayed plasma. As part of an international standards committee project,
Ocean Optics is in the process of compiling a persistent line emission set for LIBS, using the LIBS
plasma. This will take some time and will be integrated into our base table as time goes on. These studies
are to be done in an Argon gas environment.
How can we be sure that the identified elements are actually present? OOILIBS software contains two
rating mechanisms:
• The first rating mechanism indicates how many lines of those in our persistent line set are
present. Thus, if 5 of 7 possible have been identified, you can be fairly certain that that element is
present. If one of 7 is present, could it be something else? Perhaps a line that is not in our catalog
from another species?
• For the second analysis technique, the emission lines have an appearance value based on
experimental observation. It could be that this single line is the brightest of those from this
element and the others are weak. So, we rate the element using a formula based on these
appearance levels. If only the weakest line of the 7 appears, it is ranked very low and indicates
that this is from one of the unknowns. If it is the strongest line, it will be rated high, allowing you
to be certain that it was present. If you have the highest 5 of the 7 in the table, the rating will be
extremely high.
OOILIBS software allows you to call any number of spectral libraries you wish to use. Our present library
has greater than 2000 lines available. There are no overlaps, but as we advance to more sophisticated
libraries, there certainly will be. The full NIST catalog has so many lines (>100,000) that everything
would be identified many times over, even though the probability of appearance may be small to zero.
That is why we have not included it.
2 161-00000-000-02-0406
Page 13
1: Introduction
Refer to http://physics.nist.gov/PhysRefData/contents-atomic.html to print lists and observe the latest
work. For a list of the persistent lines of spark spectra, consult one of the CRC manuals (Handbook of
Chemistry and Physics). Even the old publications are quite accurate.
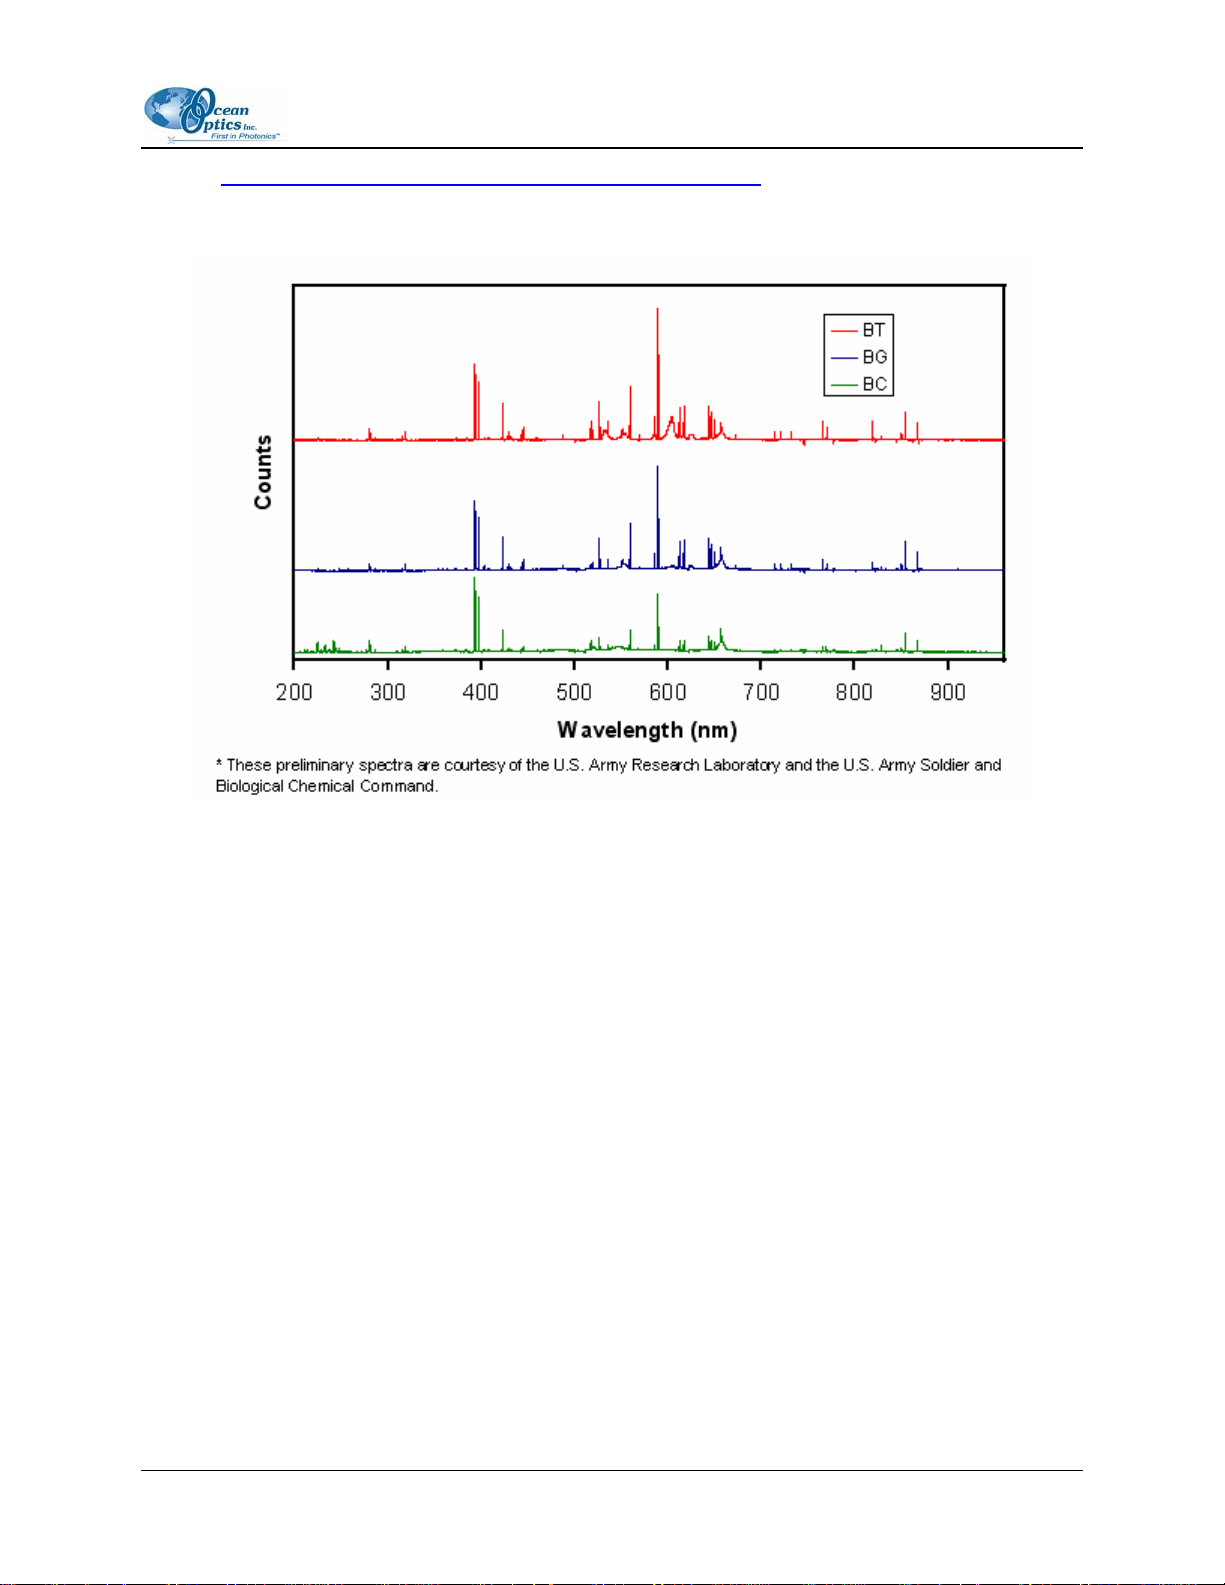
LIBS2000+ Spectra of Anthrax SurrogatesBC (Bacillus Cereus), BG (Bacillus Globigii), BT
(Bacillus Thuringiensis)
Applications
The LIBS technique is useful in areas such as:
• Environmental monitoring (soil contamination, particulates)
• Materials analysis (metals, plastics)
• Forensics and biomedical studies (teeth, bones, glass)
• Military and safety applications (explosive particles, chemical and biological warfare agents)
• Art restoration/conservation (pigments, precious/ancient metals)
Laser Requirements for LIBS2000+
You can supply your own Q-switched laser (from our certified list), or you can purchase one through
Ocean Optics. We recommend the ULTRA CFR Nd:YAG laser from Big Sky Laser Technologies
(www.bigskylaser.com/compactseries.html). The ULTRA CFR was used when testing prototypes of the
LIBS2000+. The rugged and field-portable ULTRA CFR delivers Q-switched pulses at 1.06 µm, with
variable repetition rates from 1 to 20 Hz. At 1.06 µm, the laser has a pulse stability of ±3%.
161-00000-000-02-0406 3
Page 14

1: Introduction
Shipment Components
Ocean Optics’ LIBS functionality can be purchased as a complete system, including the spectrometers
and related fibers, laser, LIBS Imaging Module, and OOILIBS software. The system is also completely
customizable. The modular nature of the LIBS2000+ system allows you to purchase just the spectrometer.
Users can then provide their own fixtures and/or Q-switched laser. You can specify the number of
spectrometers (1–7), as well as their gratings, lenses, slits and filters. Contact an Ocean Optics
Application Scientist for more information on customizing your LIBS System.
Standard LIBS System
A standard-channel LIBS System ships with the following components:
Seven (7) HR2000 Spectrometers in a rack enclosure
One (1) + 5 VDC Power Supply – For the spectrometer rack assembly
Four (4) BNC cables
One (1) heptafurcated fiber (seven-to-one furcation)
One (1) fiber bundle
One USB interface cable
Packing List – The packing list is inside a plastic bag attached to the outside of the shipment box
(the invoice arrives separately). It lists all items in the order, including customized components in
the spectrometer (such as the grating, detector collection lens, and slit). The packing list also
includes the shipping and billing addresses, as well as any items on back order.
OOILIBS CD – This disc contains the OOILIBS software that not only controls the
spectrometer and the laser, but also provides for extensive data analysis. It also contend
OOIBase32 software, which is required to use OOILIBS software.
Software and Technical Resources CD -- This disc contains software, operating instructions,
and product information for all Ocean Optics products. You need Adobe Acrobat Reader version
6.0 or higher to view these files (version 7.0 is included on the CD).
With the exception of OOIBase32 Spectrometer Operating Software, all Ocean Optics software
requires a password during the installation process. You can locate passwords for the other
software applications on the back of your CD package.
Laser Safety Manual
Other Required Equipment
LIBS Sample Chamber (LIBS-SC) and 12-VDC power supply – Permits a clear view of the
sample ablation. Includes a manual x-y-z stage. The inside lens and spectrometer probe mounting
hardware are reconfigurable with additional components readily available. The sample chamber
also includes a blower and evacuation system to feed in alternate gasses (such as argon) and a
laser safety cutoff switch.
4 161-00000-000-02-0406
Page 15

1: Introduction
Laser (LIBS-LASER) – You can supply your own laser or purchase one through Ocean Optics.
We recommend the ULTRA CFR Nd:YAG laser from Big Sky Laser Technologies
(www.bigskylaser.com/compactseries.html
). Laser requirements include a low-divergence laser
beam (a tight focus is required to achieve a spark), an active electro-optic Q-switch, and external
triggering and synchronization for the laser flashlamp and Q-switch through the OOILIBS
Software.
Personal computer – With Windows 98/Me/2000/XP operating system
Additional Recommended Equipment
LIBS Imaging Module – Consists of a PixeLINK™ Megapixel FireWire Camera, either black
and white (LIBS-IM) or color (LIBS-IM-SC), in a box mounted in between the LIBS laser and
the LIBS Sample Chamber. This product is designed to enable you to precisely adjust the laser to
focus on the exact spot on the sample that you wish to analyze. The imaging module also comes
with PixeLINK software for the camera to capture high quality images on your PC and a 12 VDC
power supply.
Argon Gas Tank and Cable – Supplies argon gas to the LIBS Sample Chamber to prevent
Pennington-type reactions from occurring
Safety goggles – Although the LIBS Sample Chamber is constructed of special safety glass to
protect you from the laser, it is recommended that you purchase safety goggles to use whenever
you are working with a Class III or above laser.
161-00000-000-02-0406 5
Page 16

1: Introduction
6 161-00000-000-02-0406
Page 17

Chapter 2
Installing the LIBS System
Overview
In general, installing the LIBS2000+ involves the following steps:
Procedure
►
1. Unpack and set up the LIBS2000+ components. See Hardware Set-up.
2. Install the OOILIBS software on the PC you intend to use with your LIBS 2000+ System, and
then restart the PC. See Software Installation
.
3. Connect the cables to the appropriate connectors on the LIBS2000+ equipment (see Hardware
Cabling
4. Test that the LIBS 2000+ System is operational (see System Start-up
Consult the instructions provided with the LIBS Imaging Module and the laser being
used for complete installation and operation instructions for those products. General
guidelines are provided in this manual, but may not cover all the information that you
need to install and operate these components of your LIBS System.
).
).
Note
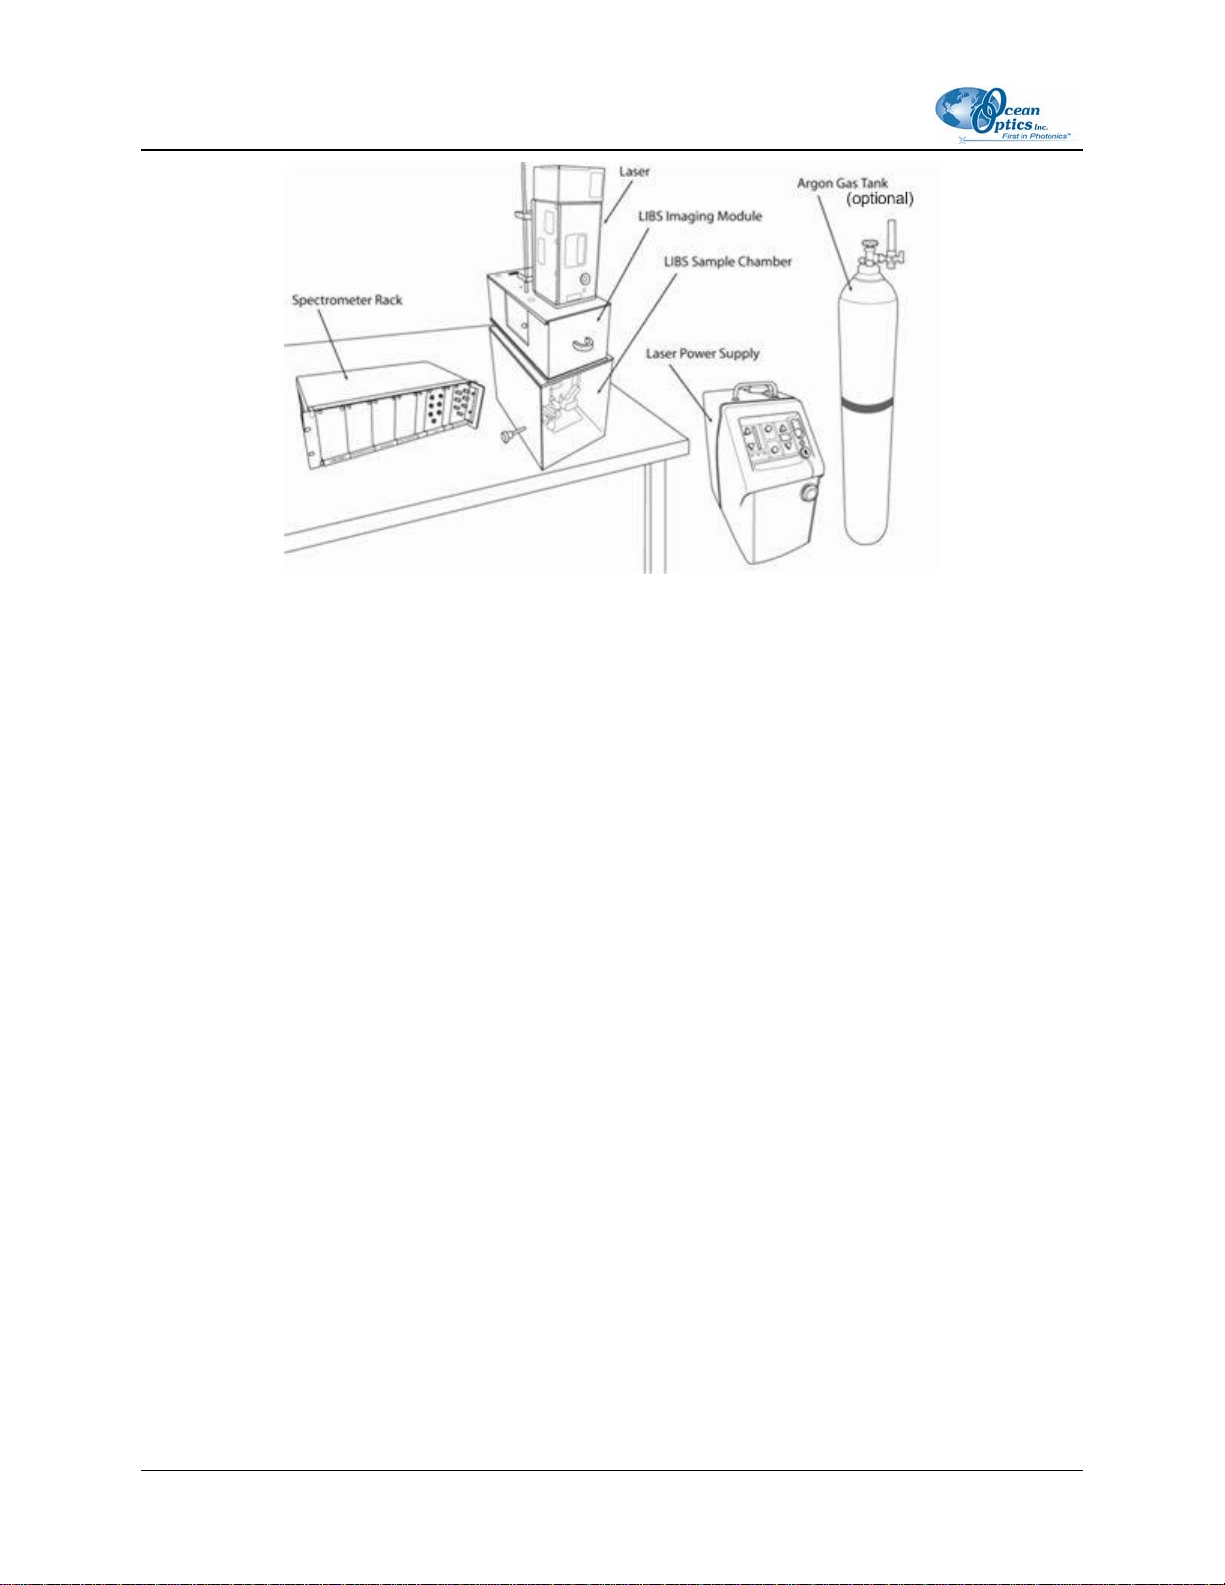
Hardware Set-up
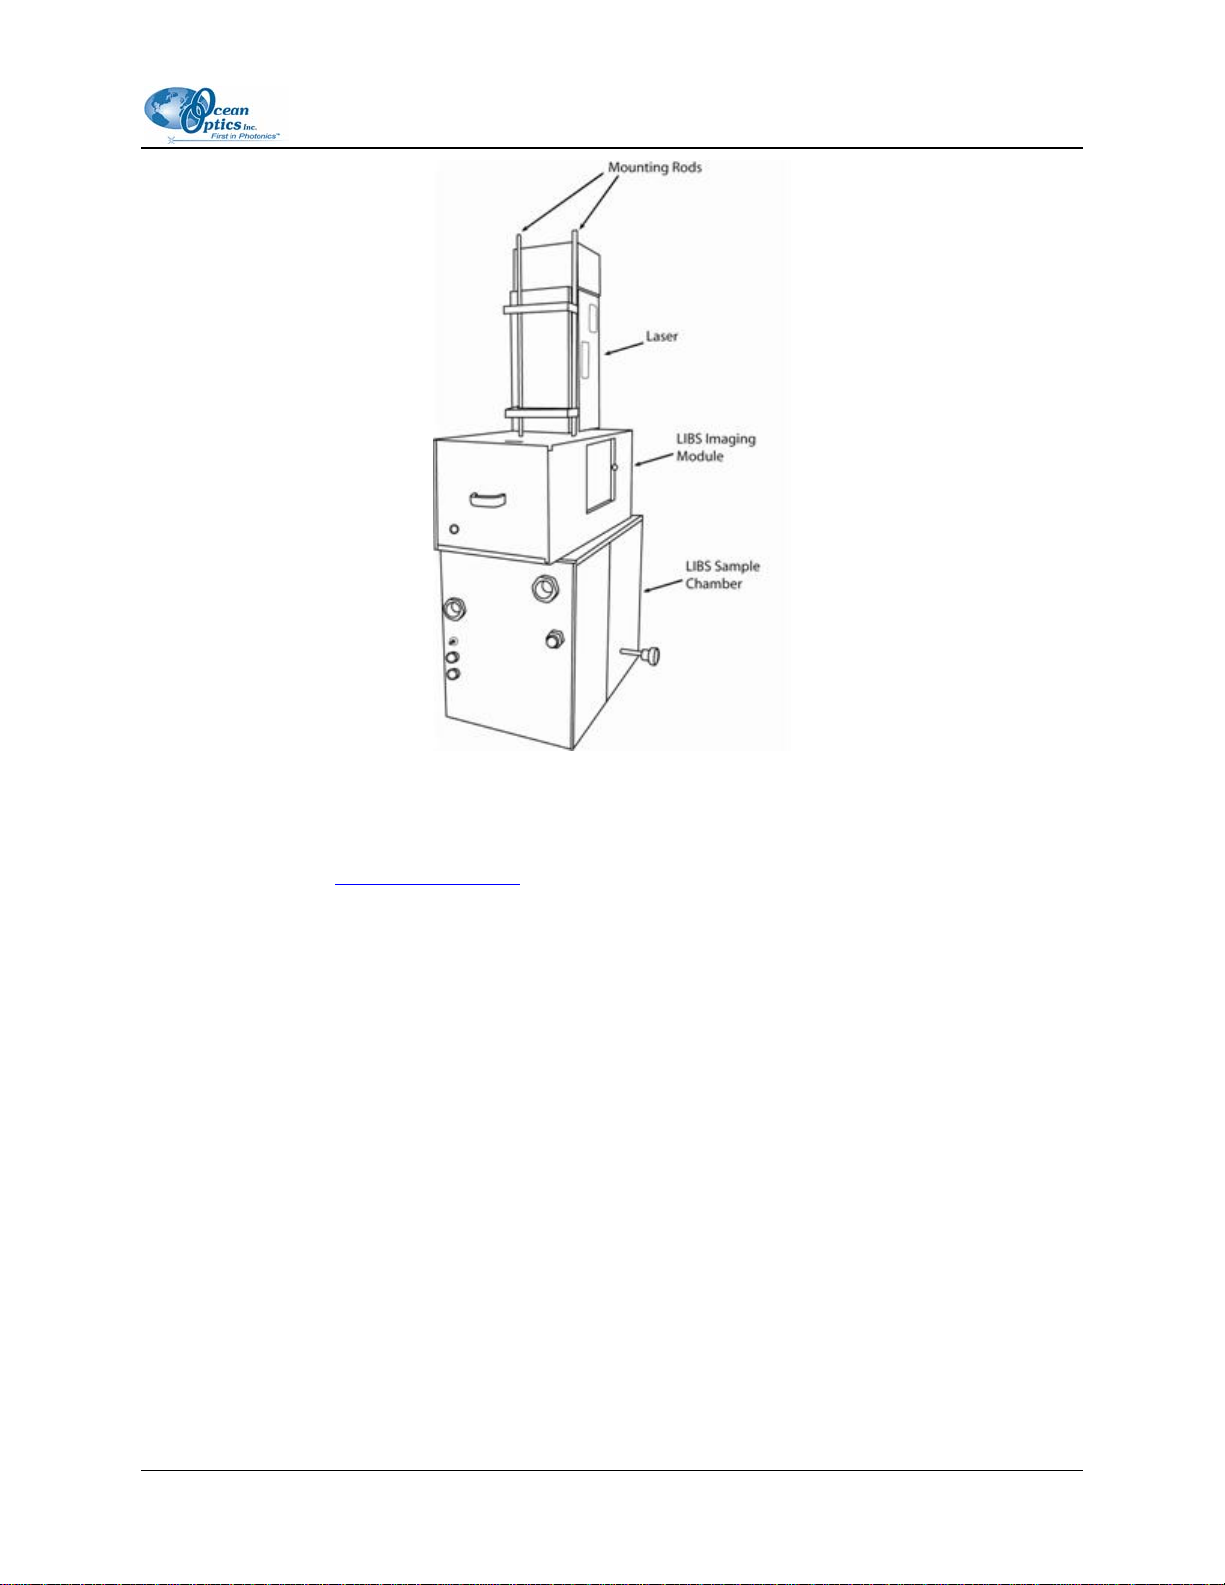
Set up your LIBS2000+ System in the configuration shown in the following figure. Do NOT connect any
of the cables until you have installed the OOILIBS Software.
161-00000-000-02-0406 7
Page 18
2: Installing the LIBS System
LIBS2000+ Hardware Set-up
► Procedure
1. Remove the LIBS2000+ components and laser from their packaging.
2. Place the sample chamber and the rack of spectrometers on a clean, flat surface.
3. If you have purchased the LIBS Imaging Module, place it on top of the sample chamber.
4. Mount the laser head on top of the LIBS Imaging Module (if purchased), or directly on top of
the sample chamber if you do not have an imaging module. A mounting bracket is attached to
the laser head with steel rods to facilitate mounting and laser alignment into the sample
chamber.
5. Insert rods from the laser through the imaging module and into the sample chamber for firm
support. The laser rests flush on top of the imaging module (or sample chamber, if you do not
have an imaging module).
8 161-00000-000-02-0406
Page 19
2: Installing the LIBS System
Mounting the Laser (Rear View)
6. Fill the laser power supply with distilled water (only).
7. Go on to Software Installation
.
Software Installation
OOIBase32 Software Installation
OOIBase32 Spectrometer Operating Software must be installed for you to use OOILIBS software.
OOIBase32 is located both on your OOILIBS CD and on the Software and Technical Resources CD. You
can install it from either CD. This software is also available from our Ocean Optics website at
http://www.oceanoptics.com/technical/softwaredownloads.asp. You can also install it from the web.
For further OOIBase32 installation instructions, see the OOIBase32 Spectrometer Operating Software
Installation and Operation Manual on either the OOILIBS CD or the Software and Technical Resources
CD.
161-00000-000-02-0406 9
Page 20
2: Installing the LIBS System
OOILIBS Software
OOILIBS Software was designed specifically for the LIBS2000+ System. It records and stores data for
export to Microsoft Excel and similar programs using the standard Microsoft commands such as File
Save, File Print, etc.
Caution
You MUST install the OOILIBS software application prior to connecting the LIBS
System hardware to the PC. The OOILIBS software installation installs the drivers
required for HR2000 spectrometer installation. If you do not install OOILIBS first,
the system will not properly recognize the spectrometers.
If you have already connected the spectrometers to the PC prior to installing OOIBase32, consult Chapter
4: Troubleshooting
Procedure
►
1. Insert the Software and Technical Resources CD that you received with your LIBS2000+ System
and download the OOILIBS software that you purchased to your PC. The password for this
software is on the back of the CD jacket.
for information on correcting a corrupt HR2000 installation.
2. Follow the prompts in the Installation Wizard to install the software.
Hardware Cabling
► Procedure
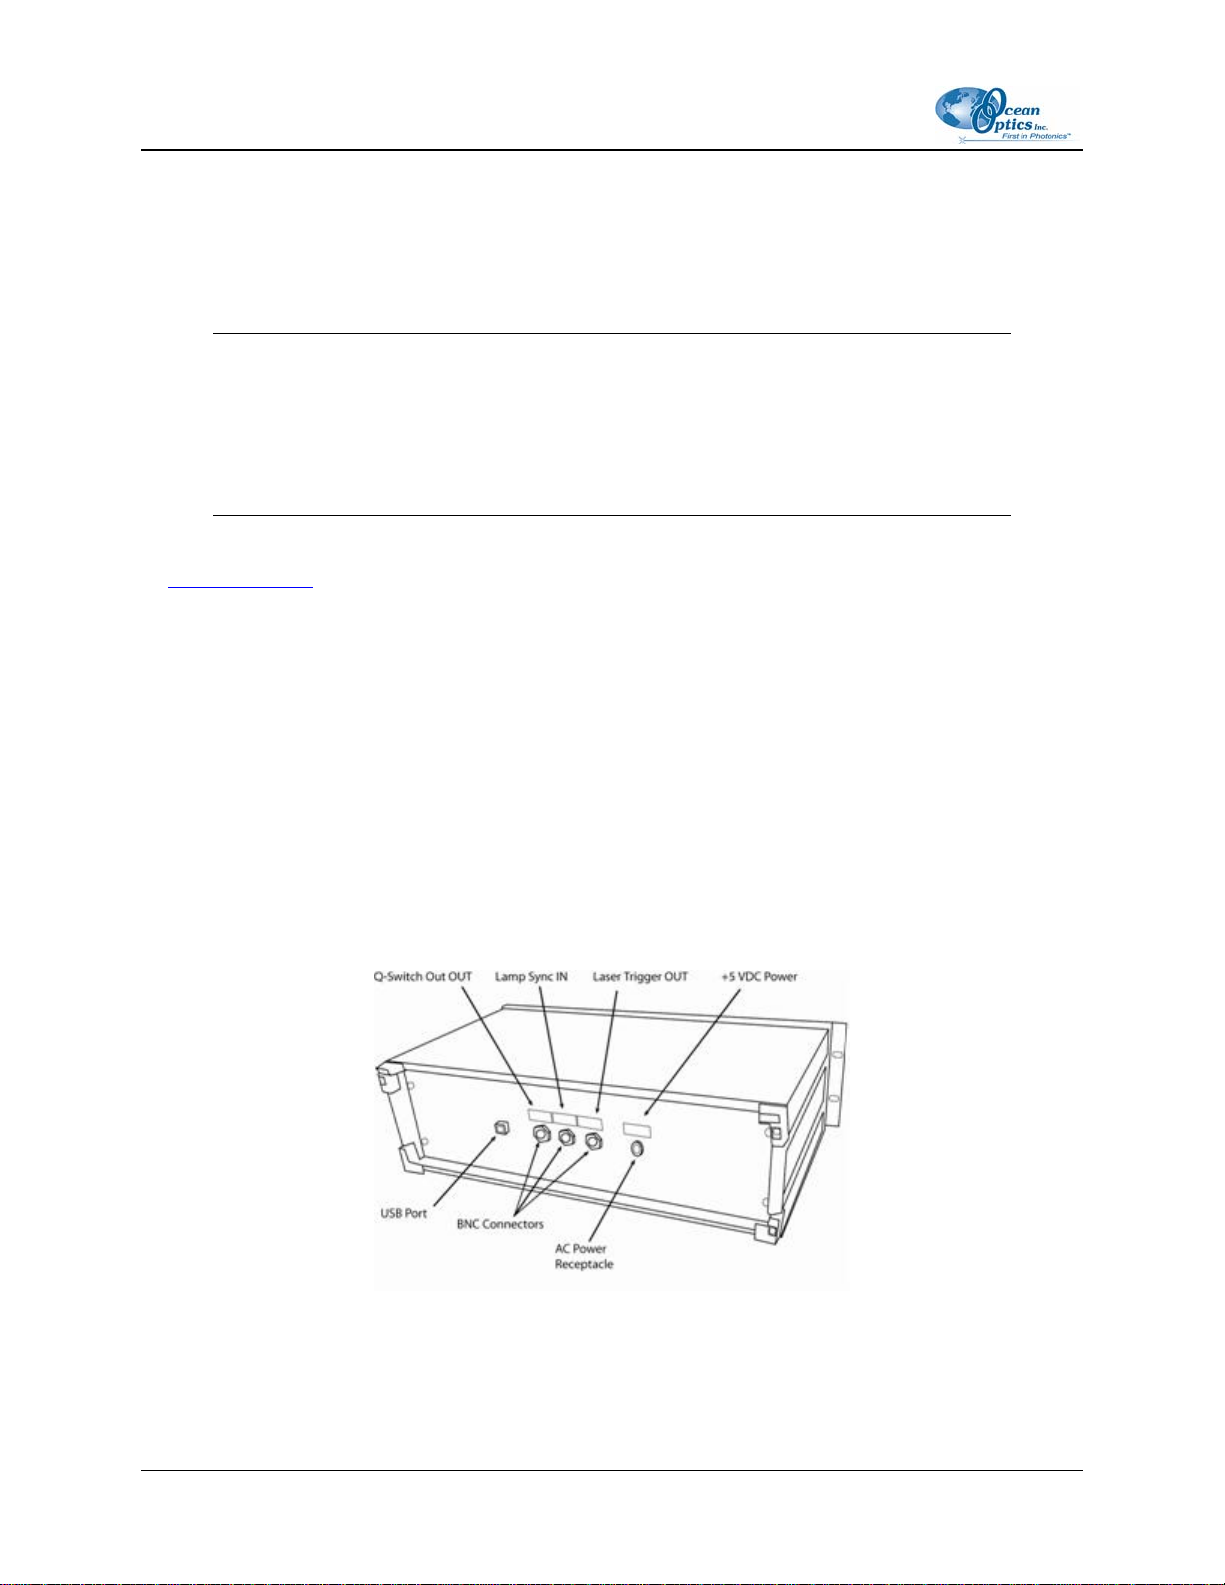
1. Plug the external +5 VDC power supply into the spectrometer rack.
Rear Panel of Spectrometer Rack
2. Plug the USB cable into the USB port on the rear of the spectrometer rack, then into the PC’s
USB port.
10 161-00000-000-02-0406
Page 21

2: Installing the LIBS System
3. Connect the heptafurcated fiber from the rear of the Sample Chamber to the seven spectrometer
channel SMA connectors on the front of the spectrometer rack. The computer's operating system
will recognize the new hardware and load the appropriate drivers for each of the seven
spectrometers in the LIBS system.
4. Start the OOILIBS software and configure your spectrometers (see System Start-up).
5. Attach the laser cables from the laser to the laser power supply. See your laser’s documentation
for specific instructions.
6. Using the supplied BNC cables, attach them to the connectors on the back of the laser power
supply, then connect them to the Laser Trigger OUT, Lamp Sync IN, and Q-Switch OUT to the
BNC connectors on the rear panel of the spectrometer rack.
Caution
Beware of lasers that use negative logic and/or high voltage outputs. Lamp Sync
signals as high as 33 volts have been observed in testing, and the electronics in the
LIBS2000+ may not survive pulse voltages of this intensity. The spectrometer
electronics are designed to drive the 50ohm loads associated with BNC connectors,
and all signals are 5V TTL.
Laser Connection Spectrometer
Function
Connection
External Trigger
(IN)
Flash Lamp Fire
(OUT)
External Q-switch
(IN)
Laser Trigger OUT This cable is connected to the external trigger
connection of the laser. It initiates a laser fire.
Lamp Sync IN This cable is connected to the lasers’ strobe
synchronization output. It tells the spectrometer
the exact time the strobe is firing. If such a line
is not available, connect this to the Laser
Trigger OUT cable using a BNC tee.
Q-Switch OUT This cable connects to the external Q-switch of
the laser. It fires the Q-switch under software
control. Most lasers have a switch that must be
set to allow this to happen. If only an external
trigger input is available, you do not need to use
this line, but you will have no control over the Qswitch event.
7. If you are using the LIBS Imaging Module, plug in its 12 VDC power supply and connect the
firewire cable from the camera to the PC. Then install the PixeLink software from the LIBS and
PixeLink Software CD that comes with the imaging module. See the LIBS Imaging Module
Installation and Operation Instructions that came with your LIBS Imaging Module. Refer to
Product-Related Documentation
to get another copy of these instructions.
161-00000-000-02-0406 11
Page 22

2: Installing the LIBS System
Rear Panel of LIBS Imaging Module
8. Connect the 12 VDC power supply to the LIBS Sample Chamber.
9. Connect one end of the BNC cable to the LIBS Sample Chamber. Remove the cap from the
Remote Interlock (Remote Intlk) connector on the back of the laser power supply and attach the
other end of the BNC cable.
Connecting the LIBS Sample Chamber to the Laser Power Supply and Argon Gas
10. Install the fiber optic assembly in the Sample Chamber and roughly align.
11. Ensure that the switches on the rear of the laser power supply are set for external triggering.
12. If you intend to use argon gas in your set-up, connect the argon gas tank to the LIBS Sample
Chamber.
12 161-00000-000-02-0406
Page 23
2: Installing the LIBS System
System Start-up
When you first use this LIBS2000+ Spectrometer on this computer, you must assign spectrometers to
channels and load the element library.
Assigning Spectrometers
► Procedure
1. Start the OOILIBS program. You may receive an error message the first time you start the
software. This is normal. Continue to Step 2.
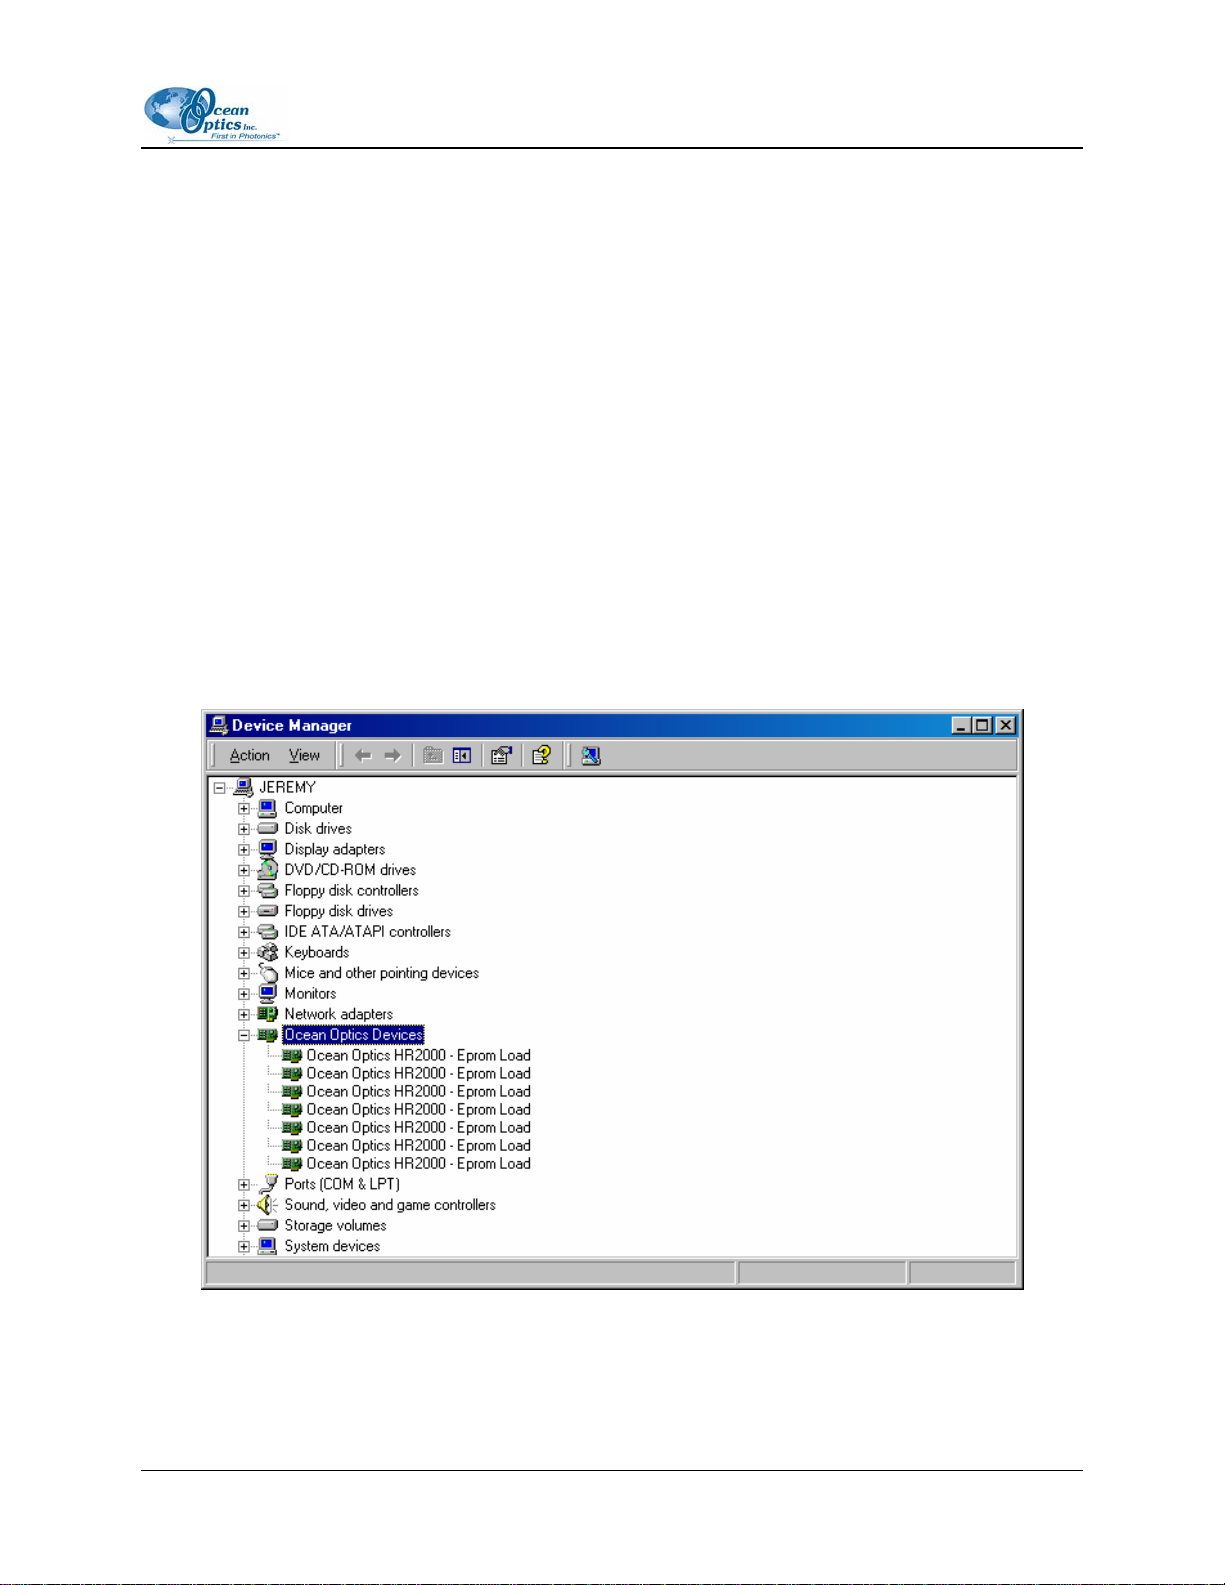
2. Confirm that the spectrometers have installed properly. To do this,
a. Navigate to Control Panel | System (or right-click on My Computer and select Properties):
For Windows 2000/XP: Click the Hardware tab, then click the Device Manager button.
For Other Windows Versions: Click the Device Manager tab. The System Properties
screen appears.
b. Click on the Ocean Optics Devices node. If this node is absent, expand the USB Devices
node. Seven HR2000 Spectrometer entries should be visible. This indicates that the
LIBS2000+ spectrometers have been properly installed.
161-00000-000-02-0406 13
Page 24
2: Installing the LIBS System
Note
If there are any yellow or red symbols next to each spectrometer entry, then you must
reinstall OOILIBS, reboot the system, and then reconnect the spectrometer.
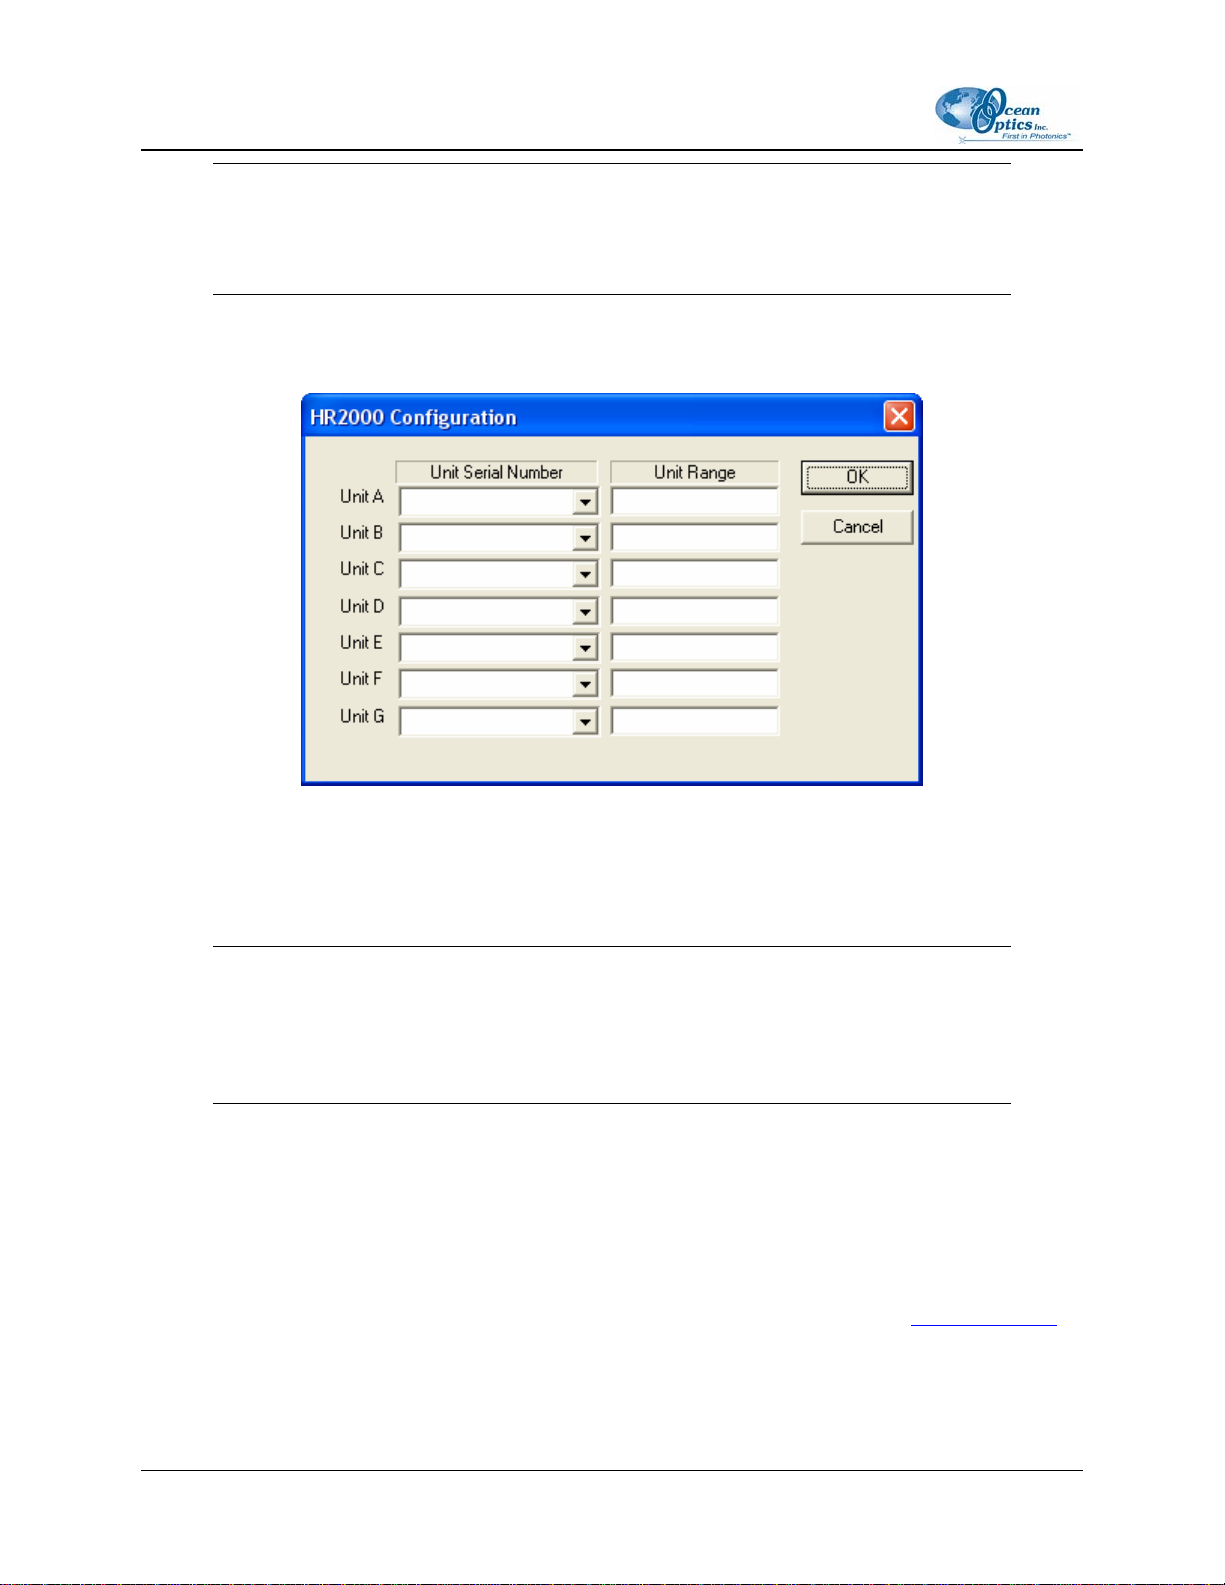
3. In the OOILIBS program, select Tools | Select Spectrometer Modules. The HR2000
Configuration screen appears. Of the 8 possible spectrometer assignments, only 7 are active.
4. Click on the arrow for the first box (Unit A) to see a selection of 7 serial numbers.
5. Double-click on the lowest number and assign it to the first space. This is important in that it tells
the software which serial number correlates to the lowest wavelength spectrometer. The range
box should display the range of the spectrometer (this feature is not fully implemented).
Note
If you mistakenly assign an incorrect serial number, click on the text in the Unit Serial
Number column for that serial number. Highlight the text and delete it. Then, reassign the
correct serial number.
6. Proceed to assign serial numbers (in order of ascending serial numbers) to Units B-G.
7. Click the OK button when you have assigned all serial numbers.
8. You have now configured the Select Spectrometer Modules screen.
9. Exit OOILIBS software.
10. Restart OOILIBS software. The range at the bottom of the screen should be about 200–980 nm. If
this is not the case, or if you receive another error message, refer to Chapter 4: Troubleshooting
Otherwise, you are ready to take data.
.
14 161-00000-000-02-0406
Page 25
2: Installing the LIBS System
Loading the Element Library
The element library enables you to identify the elements present in a sample by comparing the emission
lines detected in the sample to elements in a standard catalog.
Procedure
►
To load the Element ID Library,
1. Select Library Options | Element ID | Load Library from the OOILIBS software menu.
2. Browse to the element catalog that you want to load. By default, the OOILIBS installation places
the catalog in Program Files | Ocean Optics | OOILIBS, unless you changed its location.
3. Select the file (*.spe) and click Open to load the file. It is recommended that you select the
OOISpeciesB.spe file since it contains more element lines than the OOISpecies.spe file.
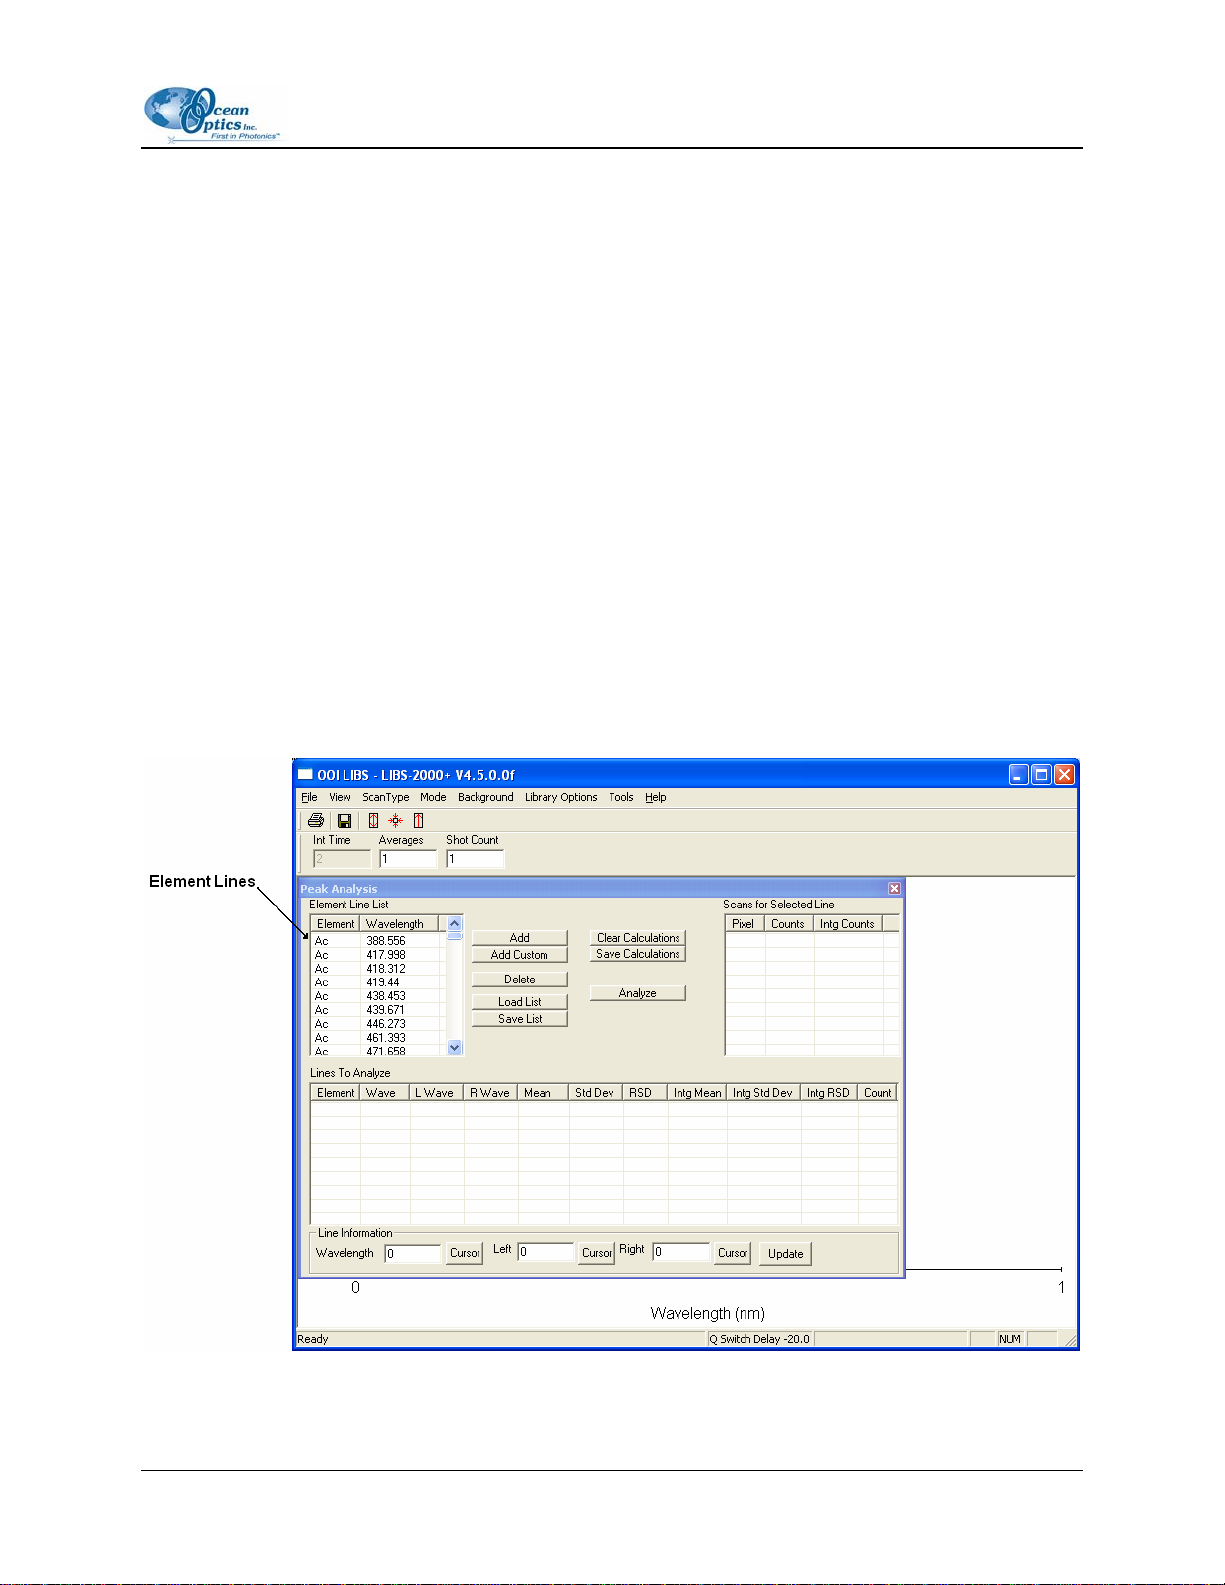
You can check that the library has loaded successfully on the Peak Analysis screen.
Procedure
►
To check that the Element ID Library has loaded successfully,
1. Select Mode | Peak Analysis from the menu. The Peak Analysis screen appears.
2. Verify that data from the Element ID Library appears in the Element Line List.
161-00000-000-02-0406 15
Page 26

2: Installing the LIBS System
16 161-00000-000-02-0406
Page 27

Chapter 3
Operation
Overview
Laser-Induced Breakdown Spectroscopy (LIBS) is based on the interaction of a laser with a sample to
produce an optical emission spectrum specific to that sample. A pulsed laser focused onto a solid, liquid,
or gas sample vaporizes a small portion of that sample for analysis. The super-heated, ablated material is
transformed into a plasma. Plasma is a form of matter in which the original chemical bonds of the
substance are broken apart and the resulting atoms are converted into a mixture of neutral atoms, ions,
and electrons. The atoms and ions within the expanding plasma release some of their energy by emitting
light, which produces a characteristic emission spectrum in the UV, VIS, and NIR spectral range.
Configuration
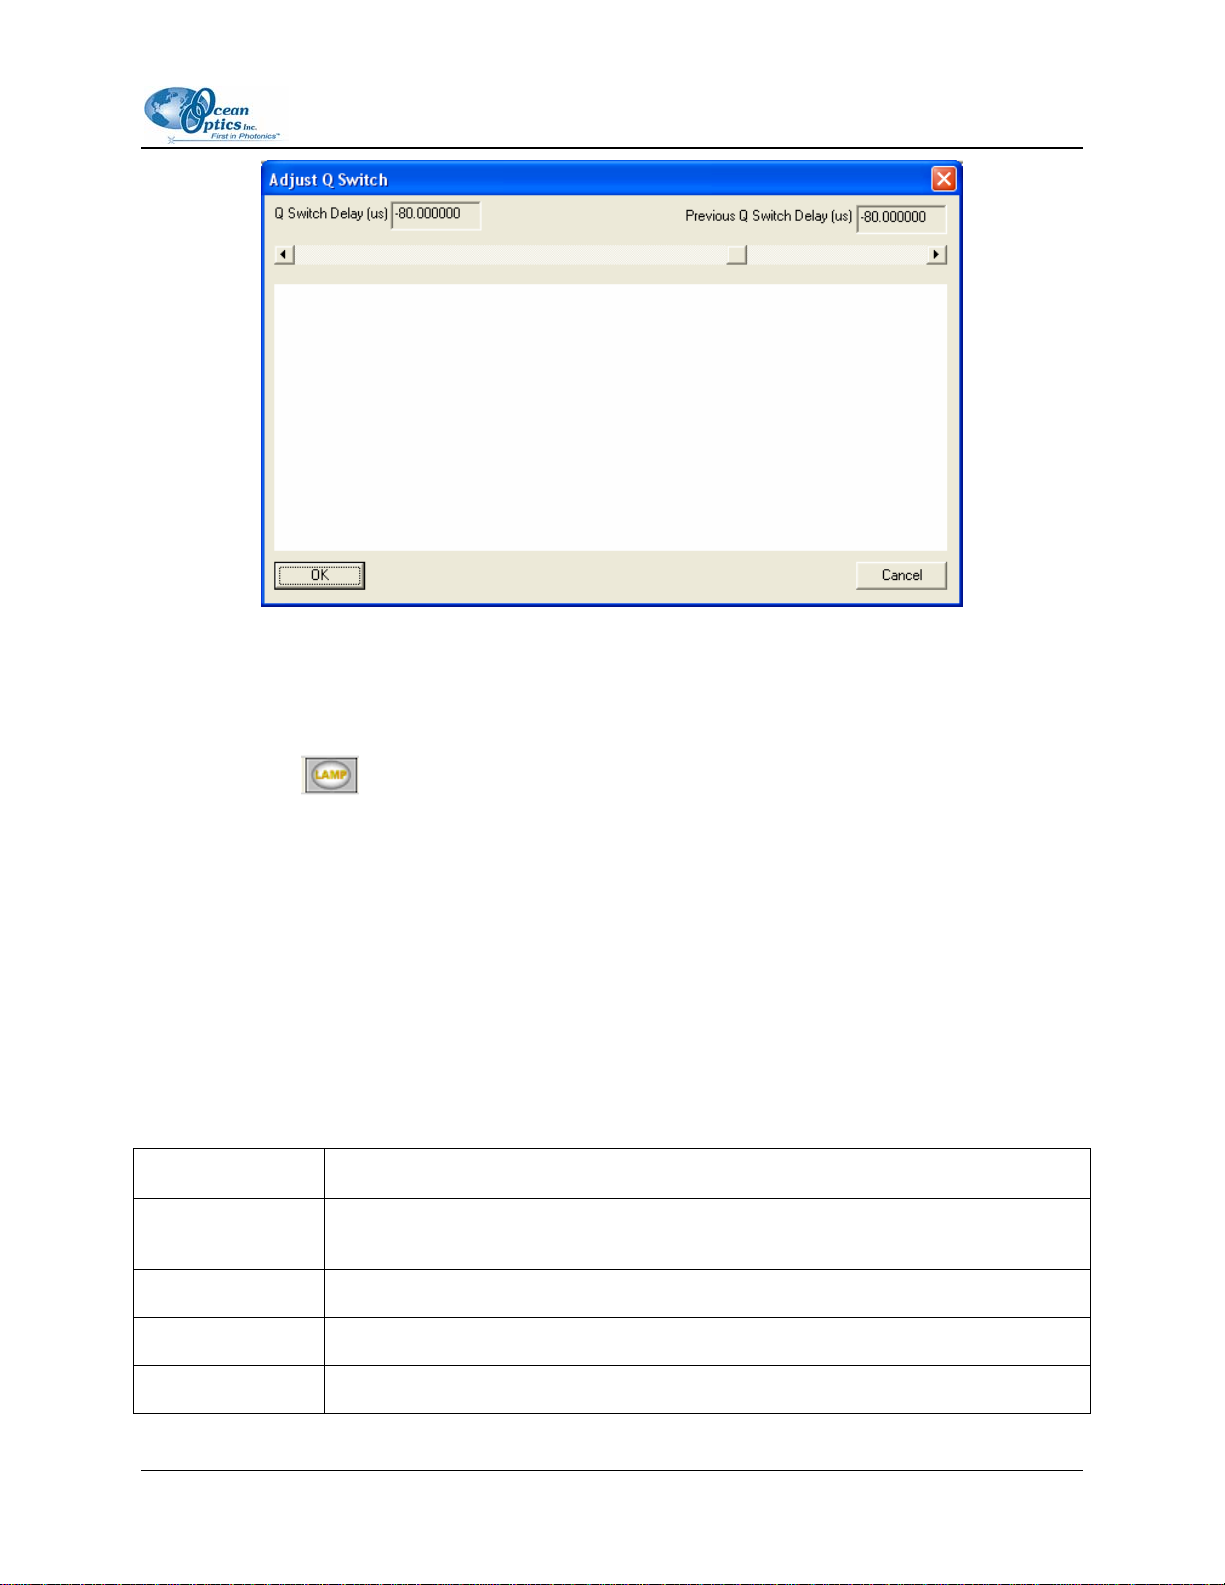
Set Q-Switch Delay
The Q-Switch window allows you to set the position of the firing of the laser with respect to the opening
of the electronic aperture. If you do not hear the laser firing, it is most likely due to an improper setting of
the Q-Switch:
Value Meaning
Negative (–) Q-Switch is being fired before aperture has opened
Positive (+) Q-Switch is being fired after aperture has opened
161-00000-000-02-0406 17
Page 28

3: Operation
Procedure
►
1. Move the slider to the desired time to set the Q-switch delay.
After moving the slider, OOILIBS will take a shot and display the spectrum. The current time is
set in the Q Switch Delay box, and the original (previous) time is shown in the Previous Q Switch
Delay box.
2. Click the OK button to save the new time, or click the Cancel button to cancel any changes.
Setup Options
Use this screen to configure the setup options for your LIBS system.
18 161-00000-000-02-0406
Page 29

3: Operation
Option Description
Percent Adjust Multiplier for the Real Time Background options. OOILIBS calculates the
background and multiplies it by this variable before subtracting.
Clean Shots
• Number of clean shots to take when you click the Clean button,
or
• Number of clean shots to take before each scan if you enable the
Use button.
Use External Triggering DLL Uses the External Triggering DLL. OOILIBS makes calls before and after
scans to this DLL file. You can replace this file with custom code.
Saturation Detect Displays a message if the spectrum is saturated.
Continuous Laser Mode Instructs the software to use the Continuous Laser mode. Only use this
mode with laser systems that must continuously fire the flash lamp.
Time Between Samples
Continuous Mode
Delay Between Scans
Averaging
Use Radiometric Calibration Enables the radiometric calibration files
Delay that occurs after a scan (in Continuous mode) and prior to the next
scan.
Delay between scans on any type of scan (averaging, shot count, etc.).
Set up Radiometric Information
Use this screen to assign calibration files to each channel.
To use the Radiometric Calibration screen, select the calibration files for each channel using the browse
button located between the two columns.
161-00000-000-02-0406 19
Page 30

3: Operation
The first radiometric calibration file is for Spectrometer Unit A, the second file is for Spectrometer Unit
B, etc. You can also apply a channel-specific Radiometric Adjustment to scale the calibrated data.
Initial Testing
Once you have set up your LIBS2000+ system and configured it, you are ready to perform initial testing
with a sample.
Procedure
►
1. Check that the switches on the rear of the laser power supply are set for external triggering.
2. Turn the laser power supply on, making sure that the prf (laser repetition rate) is set to 0, the QSwitch is on, and the power bar is adjusted to 5 bars.
3. Push the Run button on the laser power supply. The flash lamp capacitor should charge and
remain idle while waiting for an external trigger.
4. Open the door of the Sample Chamber and make sure that the laser power supply automatically
shuts down.
5. Close the Sample Chamber door and push the Run button again to recharge the flash lamp
capacitors.
6. Insert a standard LIBS sample into the Sample Chamber.
7. In OOILIBS, select Scan Type | Single Shot from the menu bar.
8. In OOILIBS, click the Scan button. The laser should fire in the Sample Chamber.
9. In the Sample Chamber, align the fiber optic assembly relative to the sample plasma to optimize
sensitivity of the LIBS measurement.
10. In OOILIBS, select Tools | Set Q Switch Delay from the menu bar. This opens the Adjust Q
Switch window, displaying the signal based on the Q-switch delay. You can be sure that this is
functioning properly by observing the change in continuum and emission strength as a function of
delay settings, both positive and negative.
20 161-00000-000-02-0406
Page 31
3: Operation
11. In OOILIBS, select Scan Type | Continuous from the menu bar.
12. Change the power settings on the laser power supply and verify that the power adjusts
accordingly. You should hear a “pop” of the laser in the Sample Chamber, indicating a change in
power.
13. Click the
button in OOILIBS to test the LED targeting sources.
Using OOILIBS Software Modes
The mode windows (Mode menu selection) or analysis windows provide multiple ways of analyzing
LIBS data. When you select a mode from the Mode menu, the control window for that mode opens. You
can then analyze your data.
You can have multiple windows open at once, but only the current mode will automatically update after
each scan. You will need to manually configure the other windows to update with each new scan.
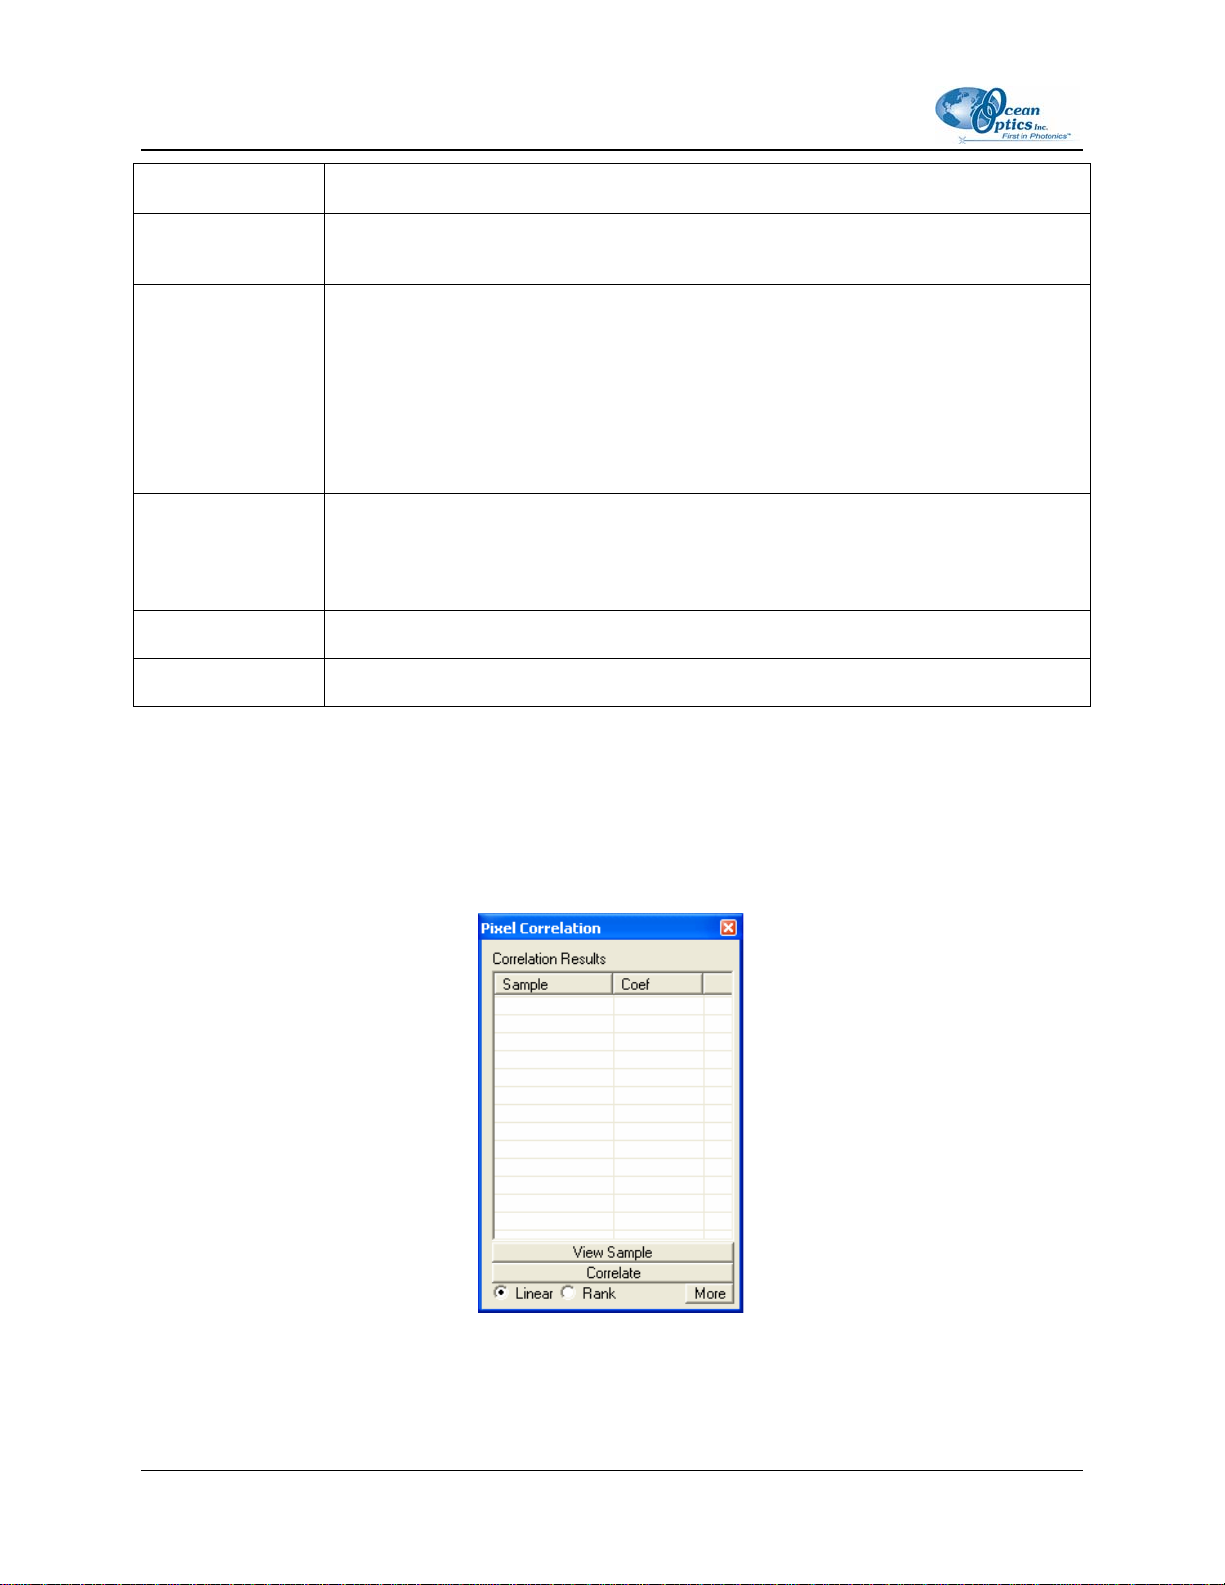
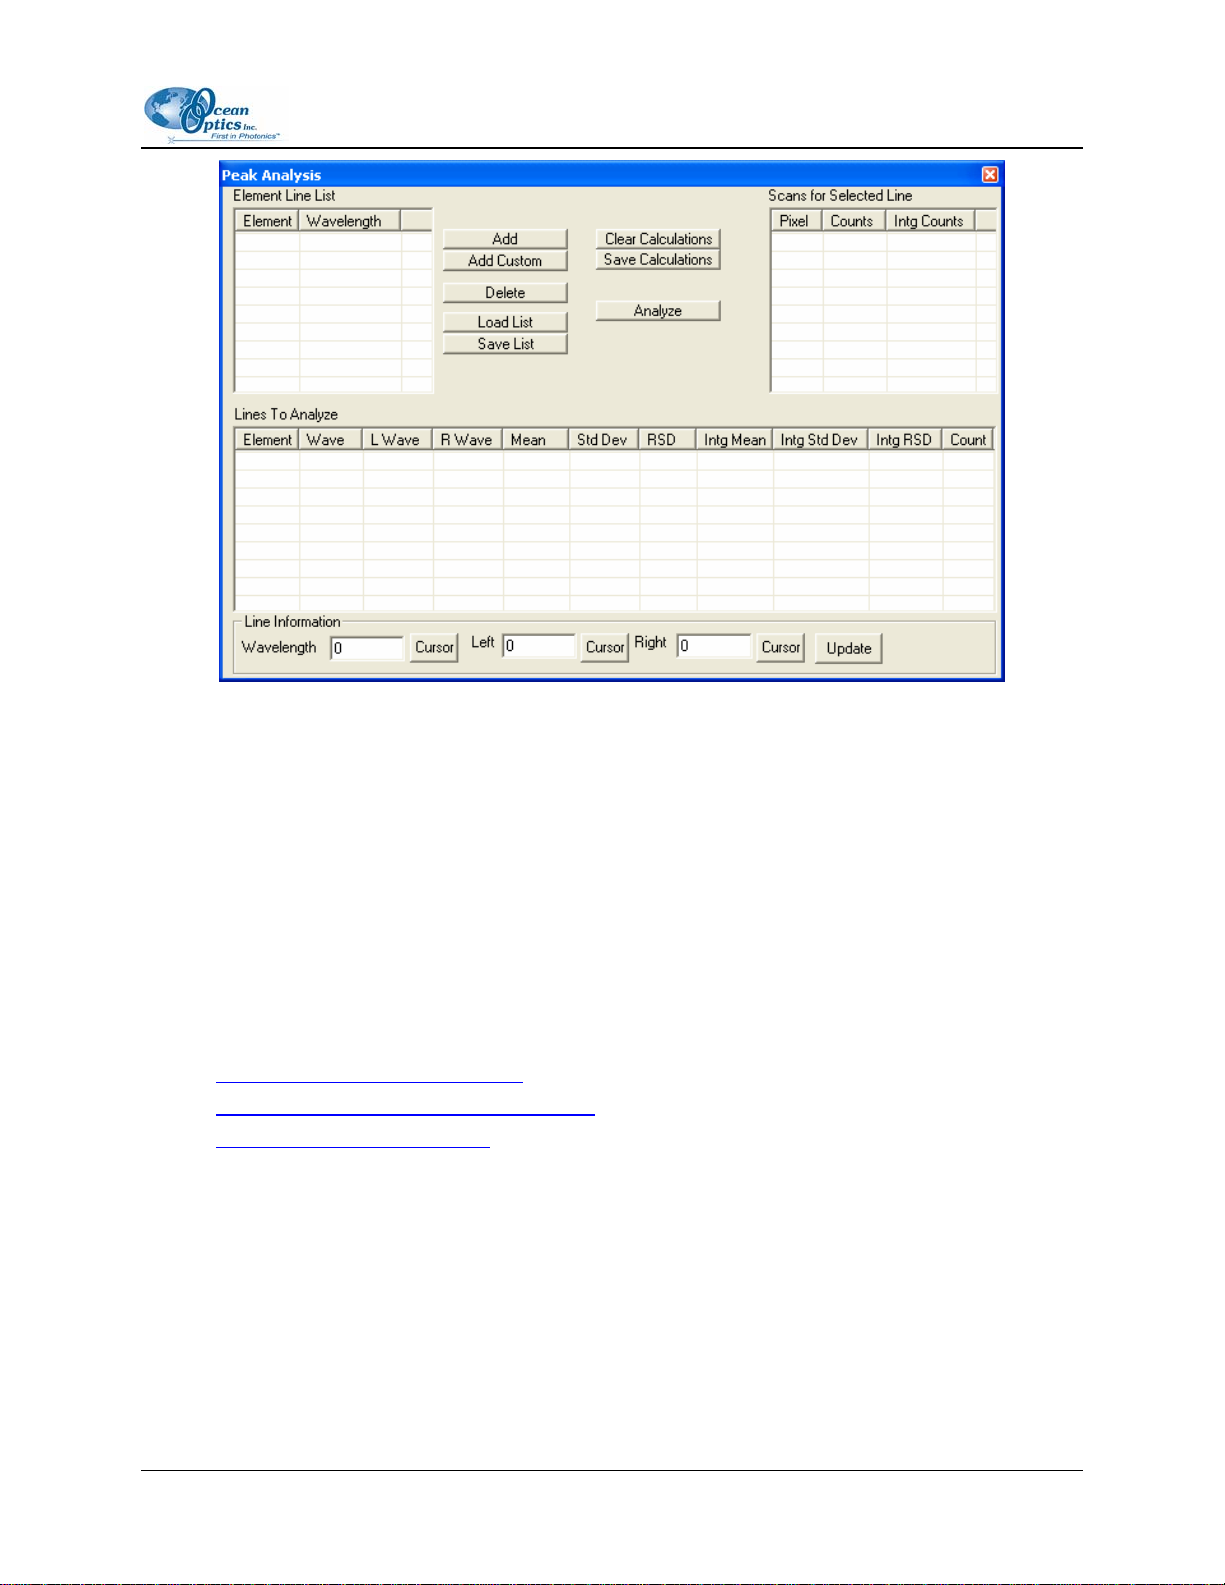
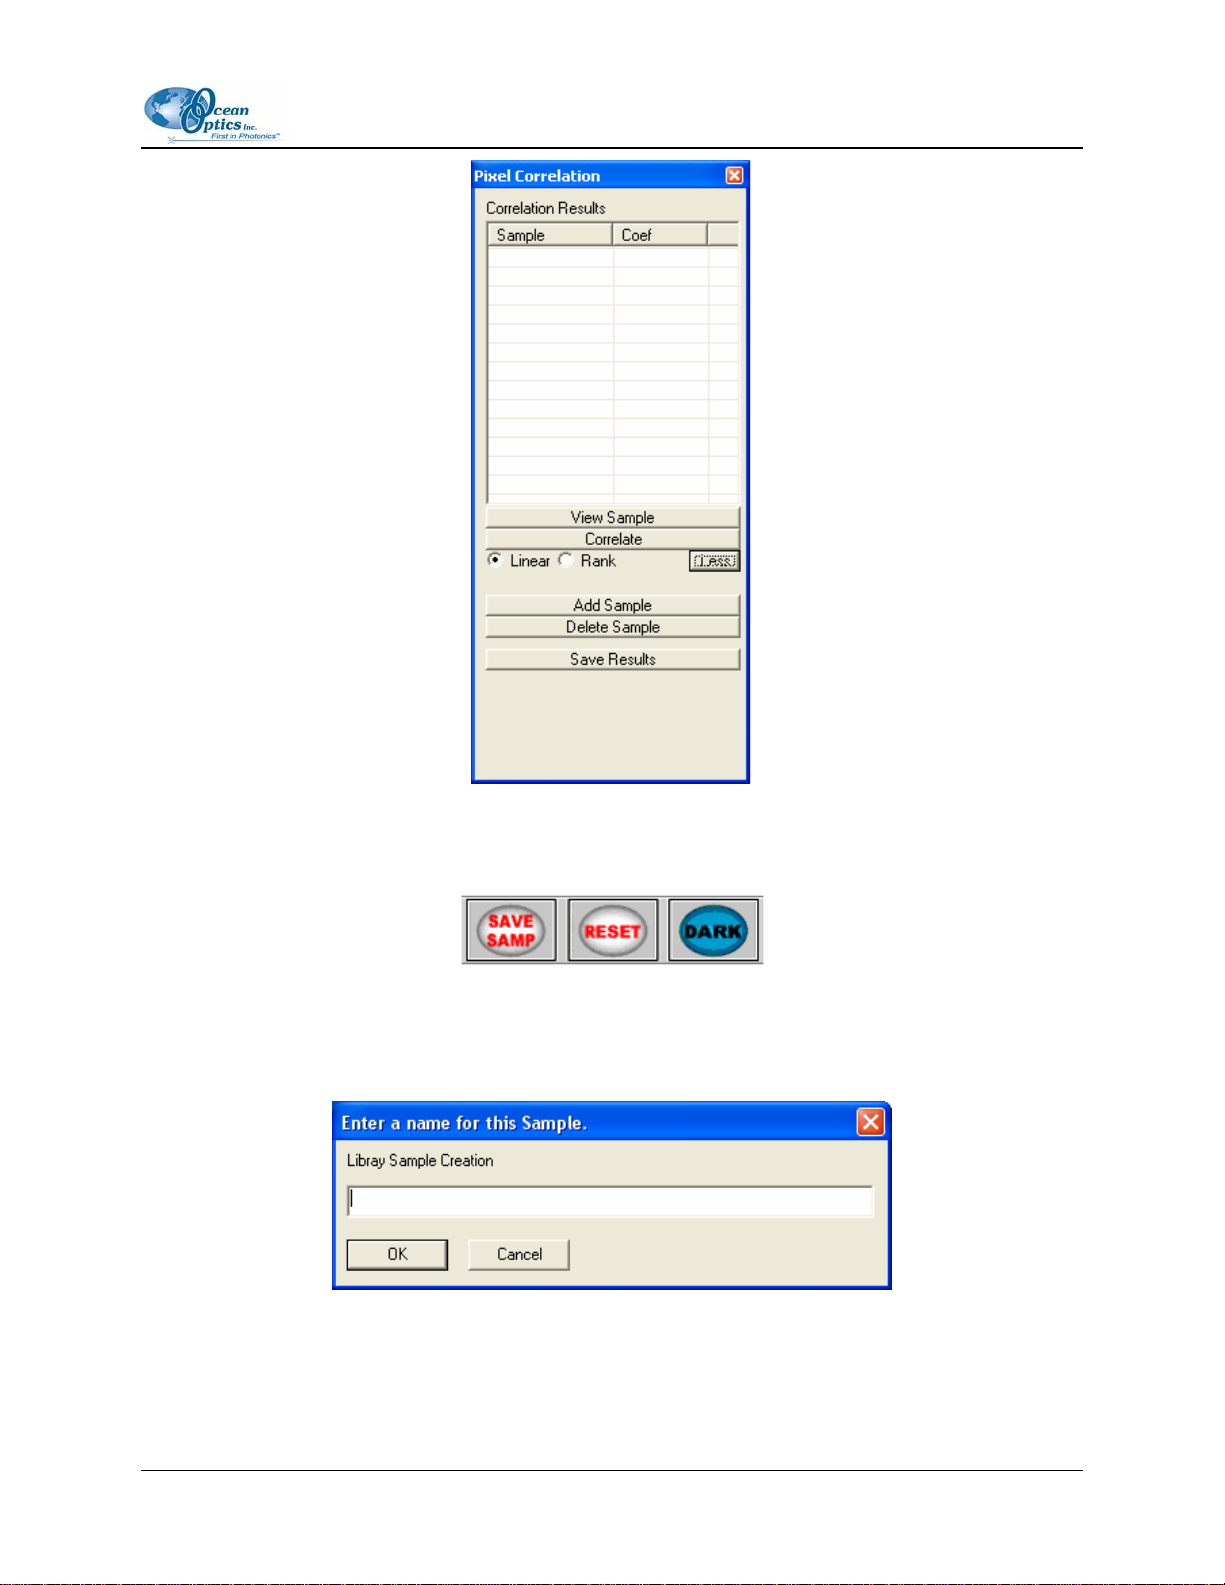
Pixel Correlation Mode
Option Description
Correlation
Results
View Sample Displays the selected library entry in the graph window.
Correlate Correlates the sample in memory against the current library.
Displays the library entries and their correlation coefficient, comparing each to the
current sample in memory.
Linear/Rank Two different methods of correlation.
161-00000-000-02-0406 21
Page 32
3: Operation
Option Description
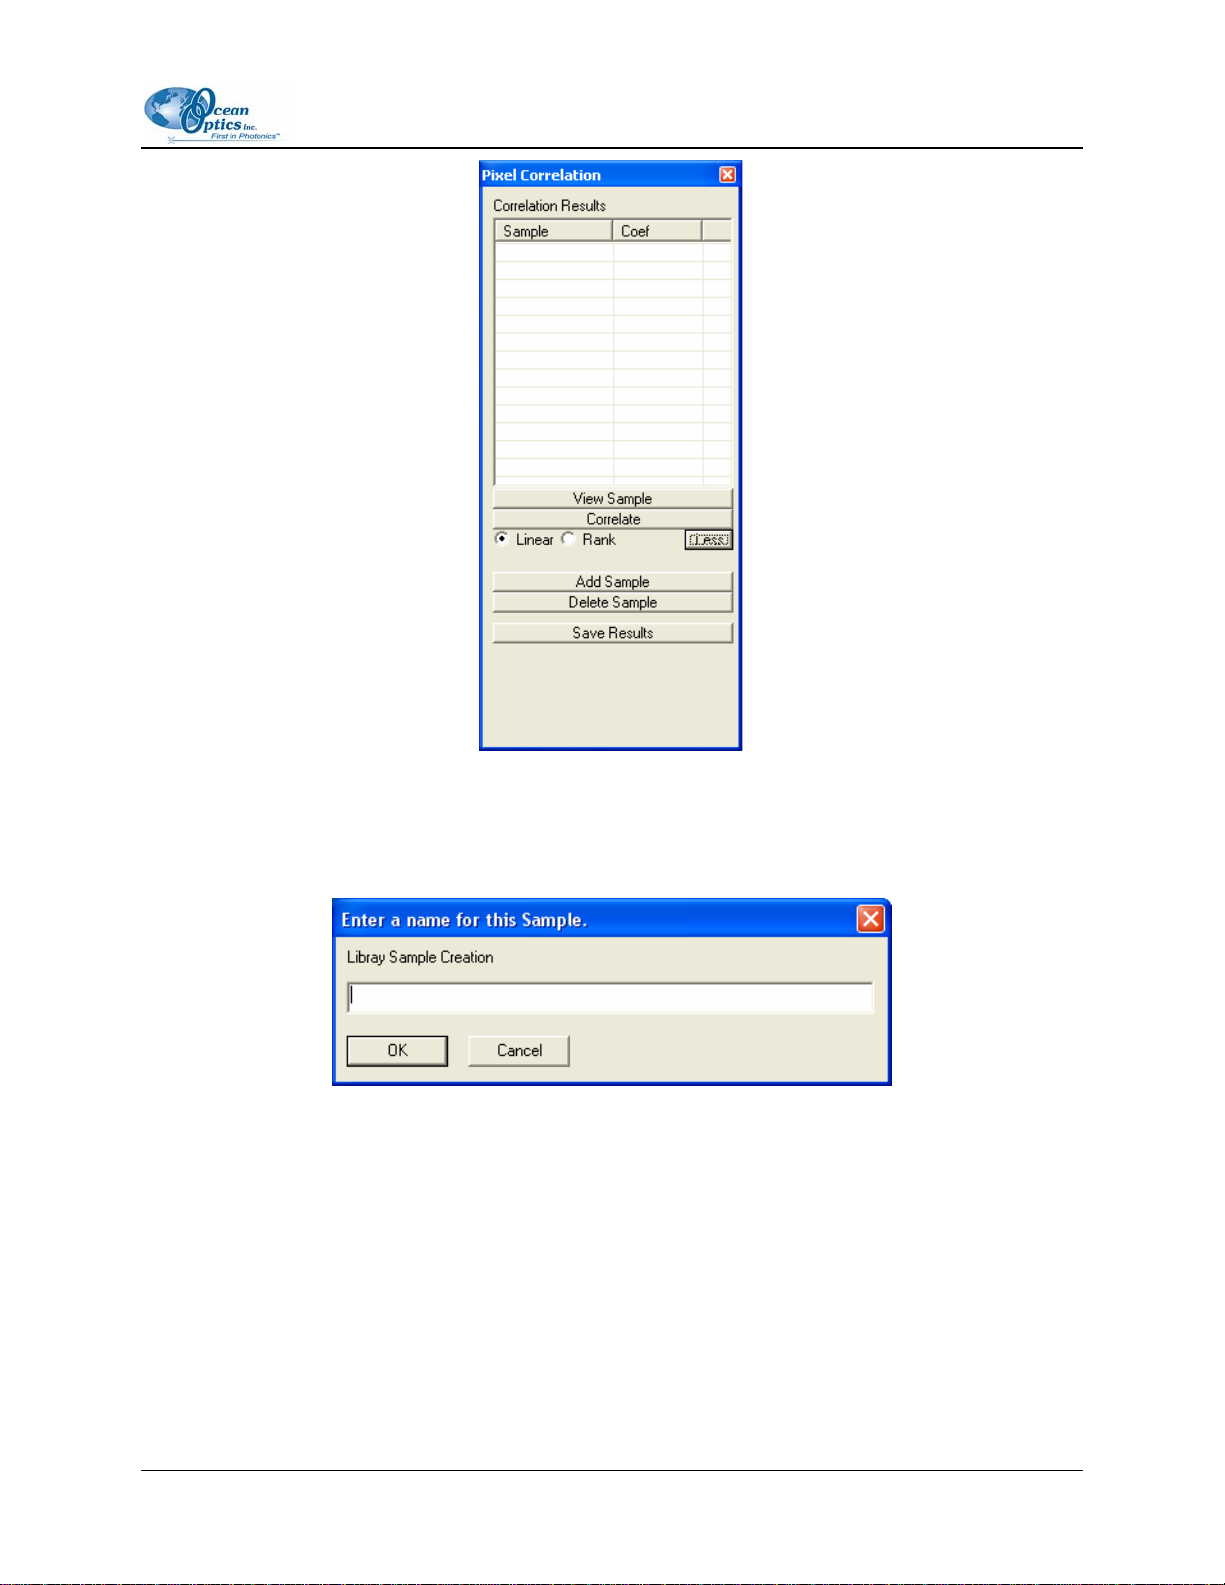
More/Less Changes the size of the window. Allows you to shrink the window to allow better
viewing when not adding new samples.
Add Sample Adds a new sample to the current library.
Click the Scan button to take a scan. After the scan is complete, you will be asked
to enter a name for the sample. Once you enter a name, the sample is added to the
library.
Remember to save the library (Library Options | Correlation | Linear Correlation
| Save Library).
Delete Sample Deletes the selected sample from the library.
After deleting a sample, the changes to the library are not saved. Save the changes
(Library Options | Correlation | Linear Correlation | Save Library).
Start Range Specifies the beginning boundary used in the correlation.
End Range Specifies the end boundary used in the correlation.
Pixel Correlation Procedure
► Procedure
Follow the steps below to use the Pixel Correlation Mode:
1. Select Mode | Pix Correlation from the menu.
2. Click the More button.
22
161-00000-000-02-0406
Page 33
3: Operation
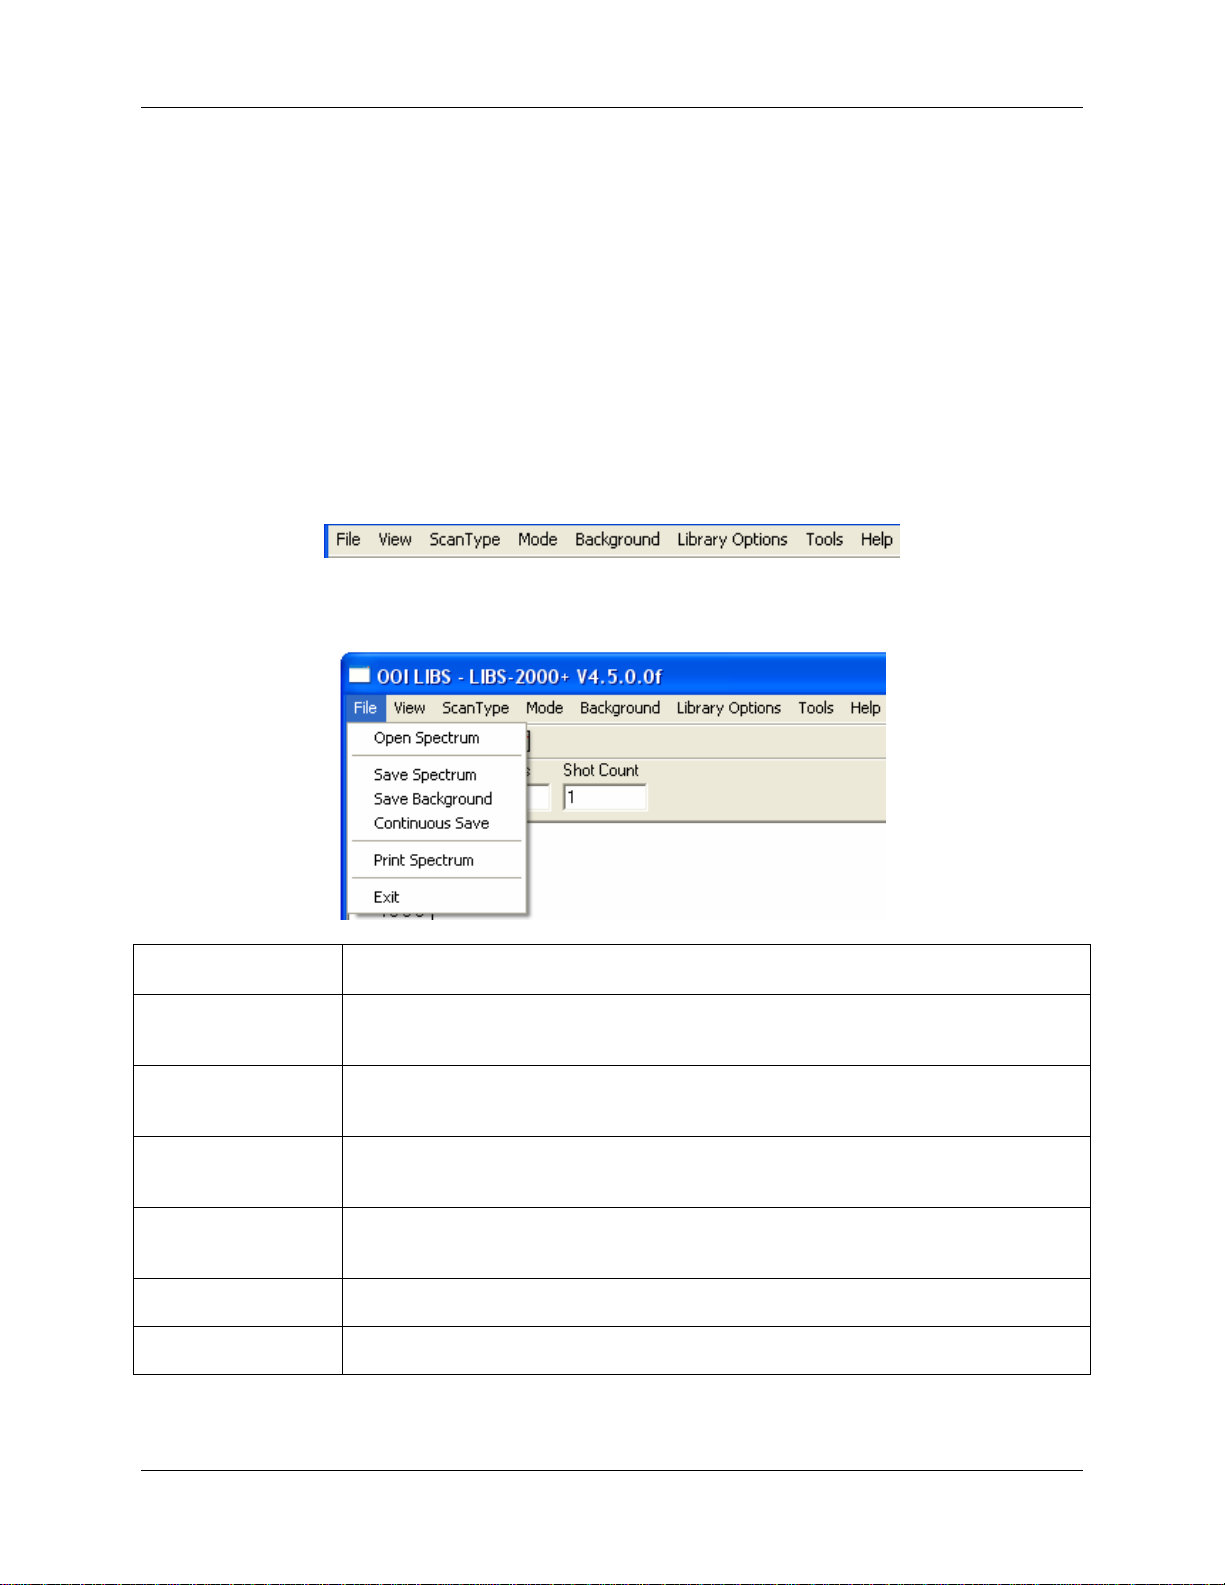
3. Click the Add Sample button. The Scan button now changes to a Sample button.
4. Set the number of averages you want to use, then click the Save Sample button.
5. Enter a library name for the saved sample.
6. Click the Correlate button. You should get a 1.
7. Click the Scan button. You should get a number very close to 1.
8. Save the new library using the Correlation menu.
161-00000-000-02-0406 23
Page 34
3: Operation
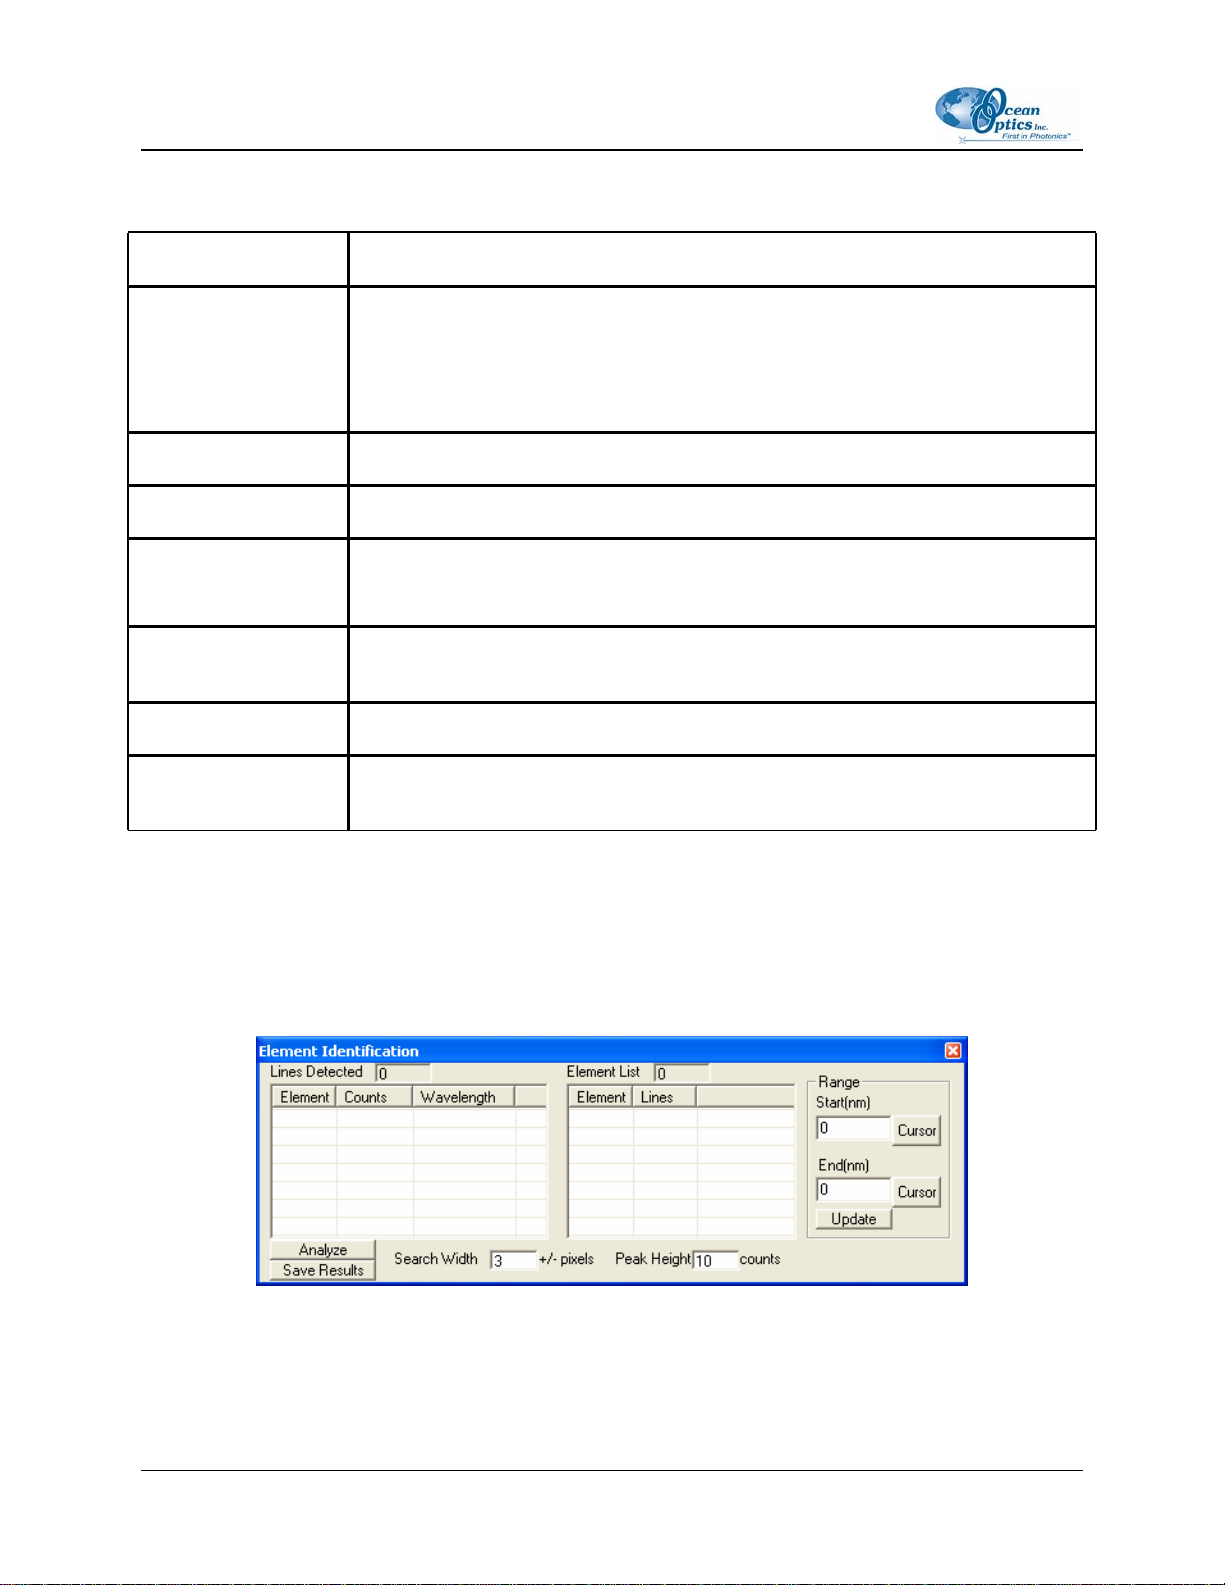
Element ID Mode
Option Description
Lines Detected Displays the number of Elemental Lines detected, and lists them in a table
below.
You can click on any column header to sort the data by that column.
Double click on any line to zoom in on that line.
Analyze Analyzes the current sample in memory and displays the results.
Save Results Writes an ASCII file containing a list of the lines and elements.
Element List Displays the number of elements detected and displays a table of them below.
The element name, number of lines found, and the element probability are listed.
Search Width Specifies the range of pixels surrounding the wavelength to examine when
detecting a peak.
Peak Height Specifies the minimum height of a peak to qualify for inclusion on the list.
Range Sets the elemental analysis range. You can click the cursor buttons to use
current cursor positions.
Elemental ID Procedure
► Procedure
Follow the instruction below to use the Elemental ID Mode:
1. Select Mode | Element ID from the menu to open the Element Identification window.
2. Click the Scan button.
You should now have a list of lines detected in the left window of the Element Identification
window. If you do not obtain this data, increase the search width or decrease the peak height.
24 161-00000-000-02-0406
Page 35

3: Operation
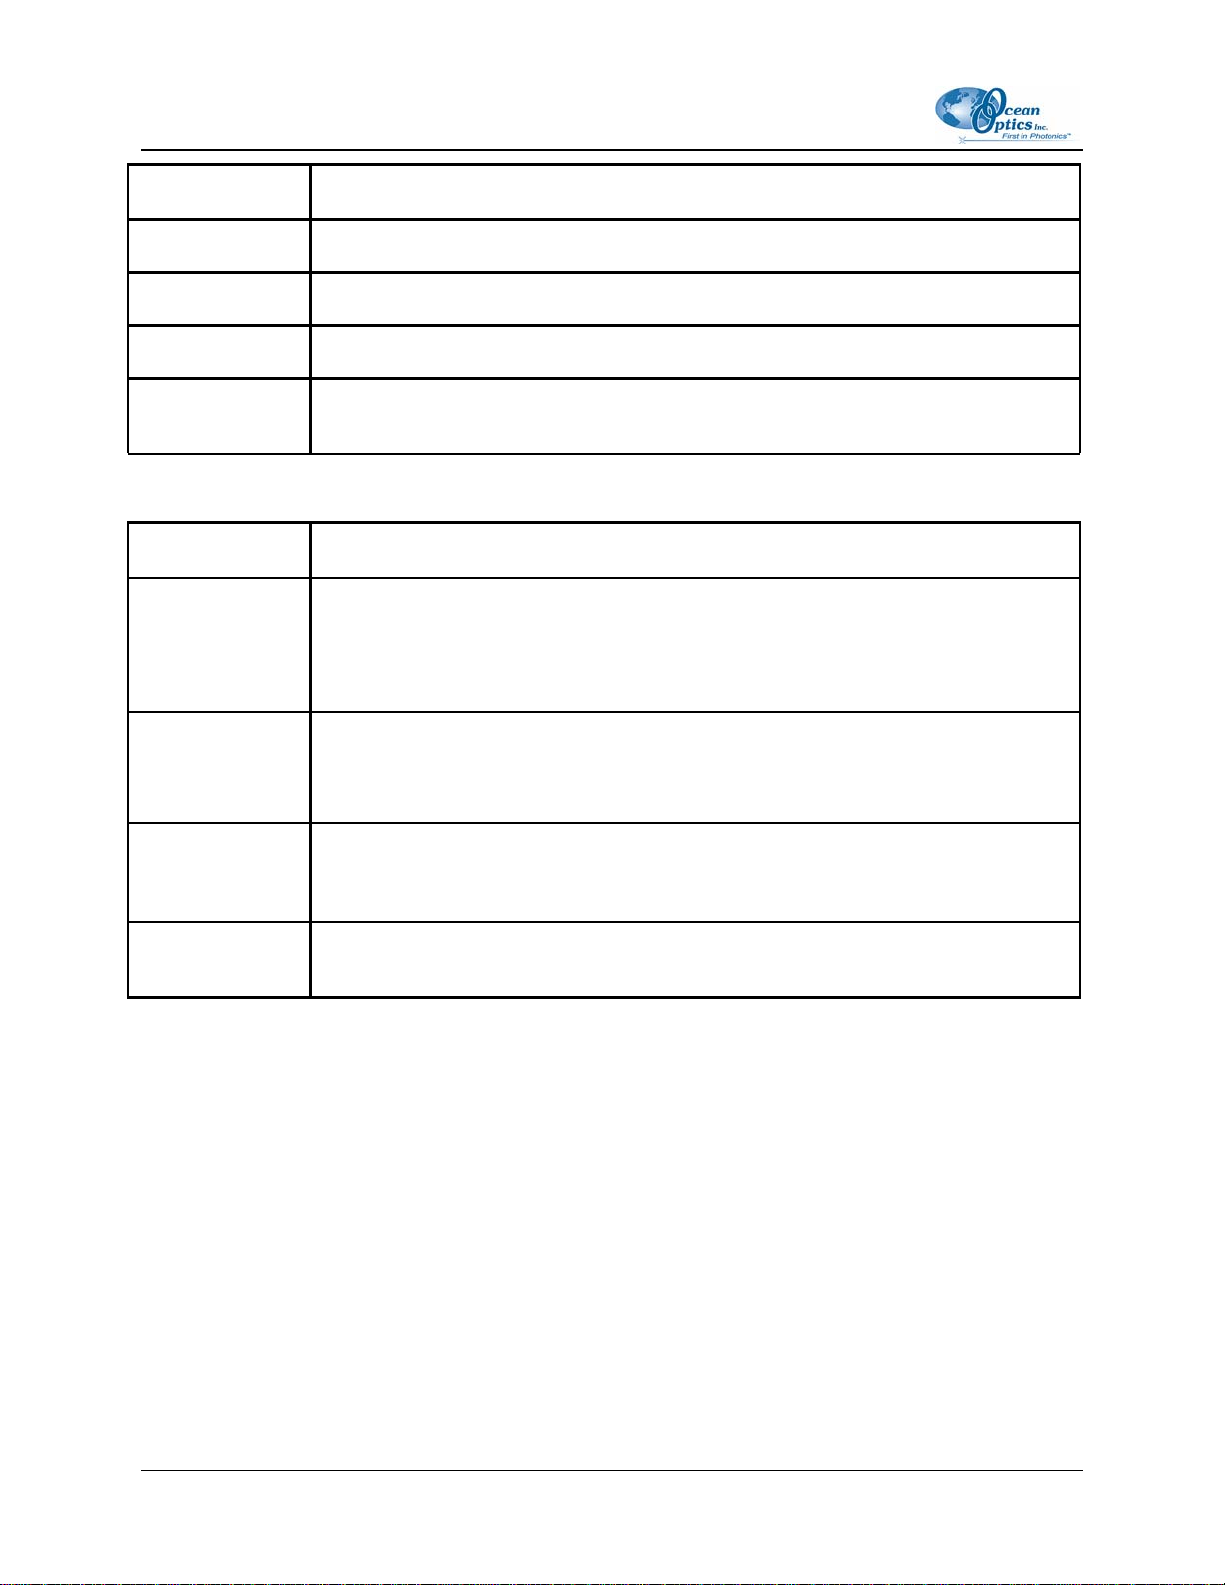
Peak Analysis Mode
Option Description
Elements List Displays a list of all elements in the Elemental Library.
Scans for Selected
Line
Add Adds the selected elements from the Elements List to the Lines to Analyze list.
Add Custom Adds a blank element to the Lines to Analyze list. You must set the wavelength
Delete Removes the selected line from the Lines to Analyze list.
Save List Saves the list of lines to an ASCII file, allowing you to load it later.
Load List Loads the saved list of lines.
Lines to Analyze Displays the list of lines for analysis including the Element Name, Wavelength,
Clear Calculations Clear the calculations.
Save Calculation Save the calculations to an ASCII file.
Displays the individual scan data for the selected lines in the Lines to Analyze
window.
after adding a custom type.
and several other values (see table below)
Lines to Analyze Options
Option Description
L Wave/R Wave Left and right side of the peak used to subtract background. The system draws a
line from the left and right points, then subtracts that value from the peak.
Mean Mean/average intensity of all count scans taken.
Std Dev Standard deviation of all count scans taken.
RSD Residual standard deviation of all count scans taken.
Intg Integrated values, calculated by adding the intensities from the L Wave to the R
Wave. All Intg calculations are based on this value.
161-00000-000-02-0406 25
Page 36
3: Operation
Option Description
Intg Mean Integrated mean/average of all count scans taken.
Intg Std Dev Integrated standard deviation of all count scans taken.
Intg RSD Integrated residual standard deviation of all count scans taken.
Count Number of scans taken for each line. This value is used in the calculations
described above.
Lines Information
Option Description
Wavelength Wavelength assigned to the currently selected line. You can change this value, and
set the custom value for a custom line.
Place the graph cursor at the desired position and click the cursor button to set this
value.
Left Left wavelength, or L Wave.
Place the graph cursor at the desired position and click the cursor button to set this
value.
Right Right wavelength, or R Wave.
Place the graph cursor at the desired position and click the cursor button to set this
value.
Update Save the information to the currently selected line. No changes will be made until
you click the update button.
Peak Analysis Procedure
► Procedure
Follow the instruction below to use the Peak Analysis Mode:
1. Select Mode | Peak Analysis from the menu. The Peak Analysis screen appears.
26
161-00000-000-02-0406
Page 37
3: Operation
2. Select a line from the element list, then click the Add button. Repeat this step until you have
loaded all the desired lines.
3. Modify any properties, the L Wave, the R Wave, or set the Wavelength value for custom waves.
4. Click the Update button to save the changes.
5. Click the Scan button repeatedly.
You should begin to see data appear in the Lines to Analyze section.
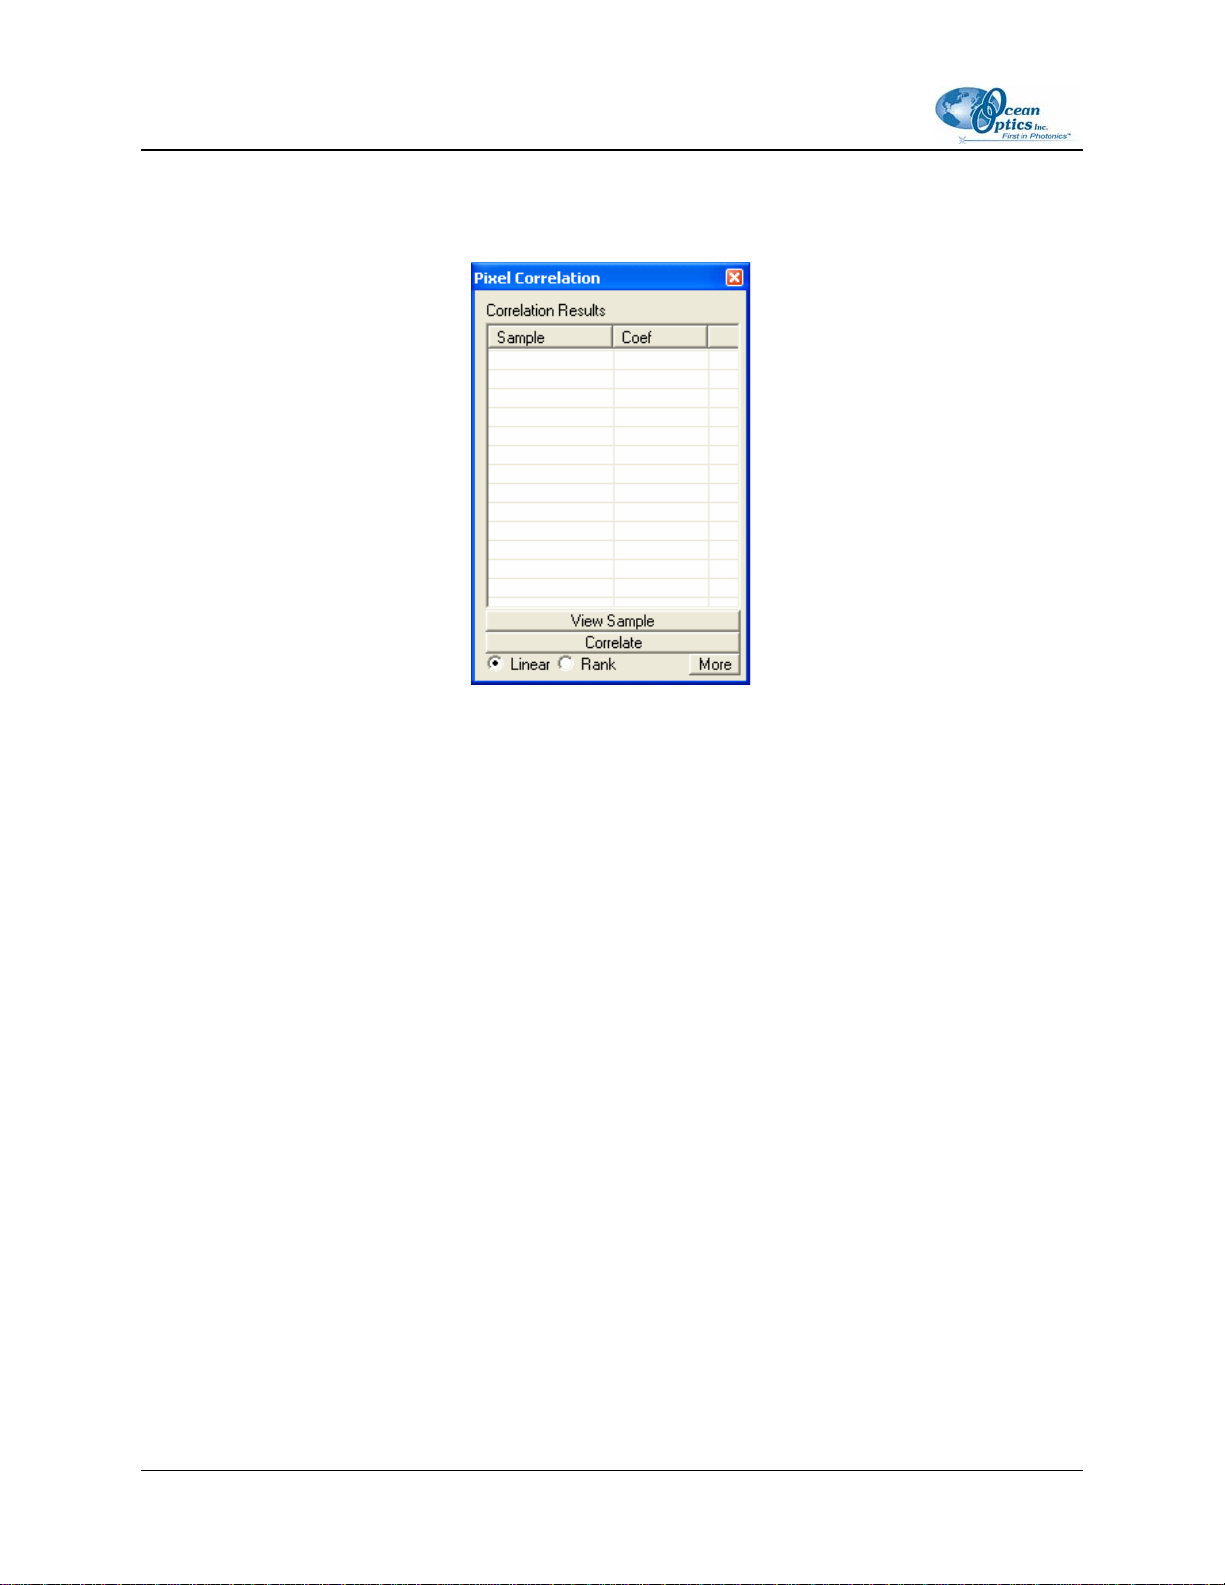
Performing Correlation in OOILIBS
Follow the instructions in the sections below to perform a correlation in OOILIBS:
• Accessing the Correlation Window
• Adding Samples to the Correlation Library
• Saving the Correlation Library
Accessing the Correlation Window
► Procedure
1. Start the OOILIBS software.
2. Obtain a few samples to make sure that the system is working correctly.
161-00000-000-02-0406 27
Page 38
3: Operation
3. Then select Pix Correlation from the Mode menu available from the OOILIBS menu bar.
The main Pixel Correlation window appears:
From this point, you can add a sample to the correlation library.
Adding Samples to the Correlation Library
► Procedure
1. Click the More button to expand the Pixel Correlation window. Notice that the library is
currently empty (indicated by the empty correlation results list).
28 161-00000-000-02-0406
Page 39
3: Operation
You can now add samples to the library.
2. Click the Add Sample button. The Scan button changes to a Save Samp button.
3. Set the number of scans to average and click the Save Samp button. A dialog box opens.
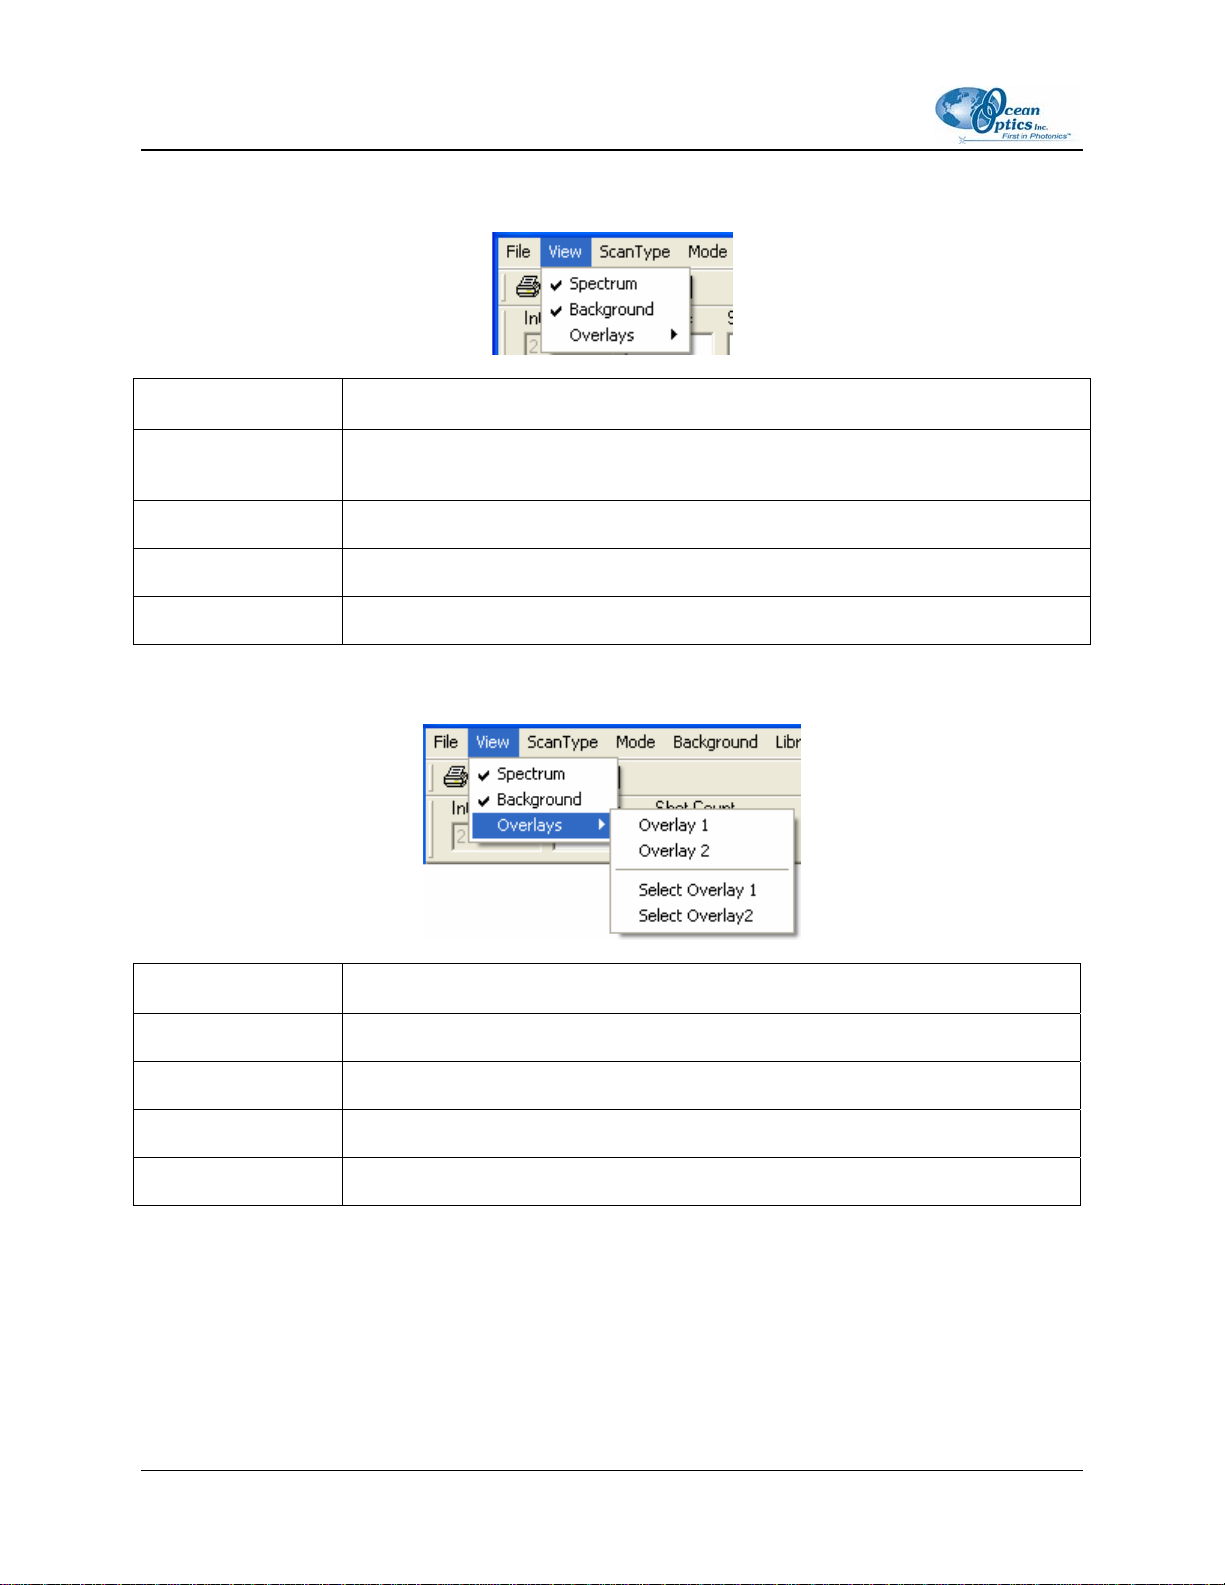
4. Enter the name of the sample in the dialog box and click the OK button. You are then prompted
to enter a name for the sample.
Assign a name that is indicative of the sample it will be representing. If you do not want to name
the sample, click the Cancel button to abort the sampling process.
161-00000-000-02-0406 29
Page 40

3: Operation
The new sample then appears in the list in the Correlation Results window. Click the Scan
button to update the list with the results of the scan of your sample. You should now have a
correlation coefficient very close to 1, depending on the properties of the material.
5. Repeat this process for as many samples as you would like to compare against.
6. Click the Less button to minimize the extra information. You only need to expand this option
when you are adding new samples.
Saving the Correlation Library
► Procedure
1. Open the Library Options Menu.
2. Select Correlation | Linear Correlation | Save Library.
3. Enter the name of the library to save and click the Save button.
Upon startup, the software automatically loads the last library in use. If you now load the saved
library, then exit and restart the program, your saved library will automatically load upon startup.
In Pixel Correlation mode, each time you take a scan, the system will automatically correlate it. If
you are in a different mode, you must manually click the Correlate button. The system then
correlates the library against the current spectrum in memory.
Correlation Tips
The following tips will help you perform a correlation with OOILIBS:
• On occasion, you may only want to look at a specific range. You can do this by manually
defining a Correlation Range. Place the cursor at the starting wavelength and click the Cursor
button. This populates the starting wavelength. Then, repeat for the ending wavelength. After you
enter the range, click the Update button to save them. To use the full range, set both the starting
and ending wavelengths back to 0.
• There are two methods of correlation: Linear and Rank. Rank is more powerful, but you should
experiment with Linear to see how your results differ. Switch between modes by toggling the
button between Linear and Rank.
• You may receive better results by taking multiple single shots, then loading the shots into their
library rather than averaging a single sample into the library. For instance, if you are sampling
stone, you would add a sample called Stone 1. Then, you would move the stone to a different spot
and take another sample, saving it as Stone 2, etc. This way, you have several samples of the
same material. A scan that identifies any of these materials will return a match for stone.
30 161-00000-000-02-0406
Page 41

Chapter 4
Troubleshooting
Overview
The following sections contain information on troubleshooting issues you may encounter when using the
LIBS 2000+ system. If the suggested solutions do not correct the situation, contact Ocean Optics
Technical Support.
HR2000 Connected to PC Prior to OOILIBS Installation
If you connected your Ocean Optics USB device(s) to the computer prior to installing your Ocean Optics
software application, you may encounter installation issues that you must correct before your Ocean
Optics device will operate properly.
Follow the applicable steps below to remove the incorrectly installed device, device driver, and
installation files.
Note
If these procedures do not correct your device driver problem, you must obtain the
Correcting Device Driver Issues document from the Ocean Optics website:
http://www.oceanoptics.com/technical/engineering/correctingdevicedriverissues.pdf.
Remove the Unknown Device from Windows Device Manager
► Procedure
1. Open Windows Device Manager. Consult the Windows operating instructions for your computer
for directions, if needed.
2. Locate the Other Devices option and expand the Other Devices selection by clicking on the "+"
sign to the immediate left.
161-00000-000-02-0406 31
Page 42

4: Troubleshooting
Note
Improperly installed USB devices can also appear under the Universal Serial Bus
Controller option. Be sure to check this location if you cannot locate the unknown device.
3. Locate the unknown device (marked with a large question mark). Right-click on the Unknown
Device listing and select the Uninstall or Remove option.
4. Click the OK button to continue. A warning box appears confirming the removal of the Unknown
Device. Click the OK button to confirm the device removal.
5. Disconnect the HR2000 Spectrometer(s) from your computer.
6. Perform the steps in the following Remove Improperly Installed Files
section.
Remove Improperly Installed Files
► Procedure
1. Open Windows Explorer.
2. Navigate to the Windows | INF directory.
Note
If the INF directory is not visible, you must disable the Hide System Files and Folders
and Hide File Extensions for Known File Types options in Windows Folder Options.
Access Windows Folder Options from Windows Explorer, under the Tools | Folder
Options menu selection.
3. Delete the OOI_USB.INF in the INF directory. If your computer is running either the Windows
2000 or XP operating system, you must also delete the OOI_USB.PNF file in the INF directory.
4. Navigate to the Windows | System32 | Drivers directory.
5. Delete the EZUSB.SYS file.
6. Reinstall your Ocean Optics application and reboot the system when prompted.
7. Plug in the USB device.
The system is now able to locate and install the correct drivers for the USB device.
32 161-00000-000-02-0406
Page 43

4: Troubleshooting
Laser Troubleshooting
Problem
The laser will not start.
Probable Cause
On water-cooled lasers, bubbles may have developed in the cooling system. This will prevent water from
traveling to the laser head and result in a nonfunctional laser.
Solution
► Procedure
1. Tilt the power supply of the laser 30 degrees right or left.
2. Allow the power supply to remain in that position until the bubbles clear.
3. Try to start the laser again.
Spectrometer Troubleshooting
Continuous Beeping from System
Problem
The system is continuously beeping.
Probable Cause
The PC cannot communicate with the USB devices.
Solution
► Procedure
1. Remove the USB devices from the PC,
2. Remove all installed Ocean Optics USB drivers, and
3. Restart the system.
4. Ensure that OOILIBS is installed, then reconnect the LIBS2000+ Spectrometer to the PC.
161-00000-000-02-0406 33
Page 44

4: Troubleshooting
System Prompts for ezusb.sys or an .inf File
Problem
During installation, the system is requesting a file named ezusb.sys or an .INF file.
Probable Cause
The system cannot locate the USB drivers or .INF files.
Solution
Navigate to the appropriate directory for each file.
For the ezusb.sys file:
• Windows 98/ME - C:\windows\system32\drivers
• Windows 2K/XP - Directory may be winnt instead of windows. All other information the same.
For the .INF file:
• Windows 98/ME - C:\windows\inf or C:\windows\inf\other
• Windows 2K/XP - Directory may be winnt instead of windows. All other information the same.
Verifying Device Setup
Problem
How do I verify that the devices have been setup correctly?
Solution
► Procedure
Follow the steps below to verify device installation:
1. Navigate to Start | Settings | Control Panel.
2. Double-click on the System icon.
3. Select the Device Manager tab (Windows 98/ME), or click the Device Manager button
(Windows 2K/XP). A list of installed devices appears.
4. Expand the USB Devices tree. The Ocean Optics HR2000 should be listed several times,
depending on the number of units in your system.
5. Verify that there are no entries with yellow or red warning symbols next to them. If this is the
case, the devices are correctly installed. If this is not the case, follow the instructions in Remove
Improperly Installed Files
You have now verified device setup.
.
34 161-00000-000-02-0406
Page 45

4: Troubleshooting
OOILIBS Software Troubleshooting
Program Keeps Freezing or Locking Up
Problem
The OOILIBS software keeps freezing or locking up.
Probable Cause
Multiple causes.
Solution
► Procedure
1. Click on the Reset button. If the system unfreezes, the problem is solved.
2. Reboot the computer. You must also reset the spectrometer system by disconnecting the USB
cable and power from the PC.
3. Verify that the Lamp Sync trigger is being transmitted to the spectrometer.
4. Ensure that the same serial numbers are not assigned twice in the
window.
Select Spectrometer Modules
161-00000-000-02-0406 35
Page 46

4: Troubleshooting
36 161-00000-000-02-0406
Page 47

Specification Value
Spectrometer range: 200-980 nm
Resolution: 0.1 nm (FWHM)
Detection: CCDs with a combined 14,336 pixels
Appendix A
Specifications
Frame rate: 10 Hz capability, computer-controlled
Integration time: 2.1 ms; variable in the free-run mode
Trigger delay:
Trigger jitter: +/-250 ns
Trigger level: TTL not to exceed 5.5 V
Computer
connection:
Software: OOILIBS
Power requirement: 5 volts at <1 amp, power supply included
Input optical fiber:
Size: 84HP x 3U Rack Housing with handles (130 mm x 483 mm x 350 mm)
Certification: CE
-121 µs to +135 µs in 500 ns steps, computer-controlled
USB 1.1 (in all computers)
2-meter, multimode sampling probe with SMA connector and collimating
lens
161-00000-000-02-0406 37
Page 48

B: User Interface
38 161-00000-000-02-0406
Page 49
Appendix B
User Interface
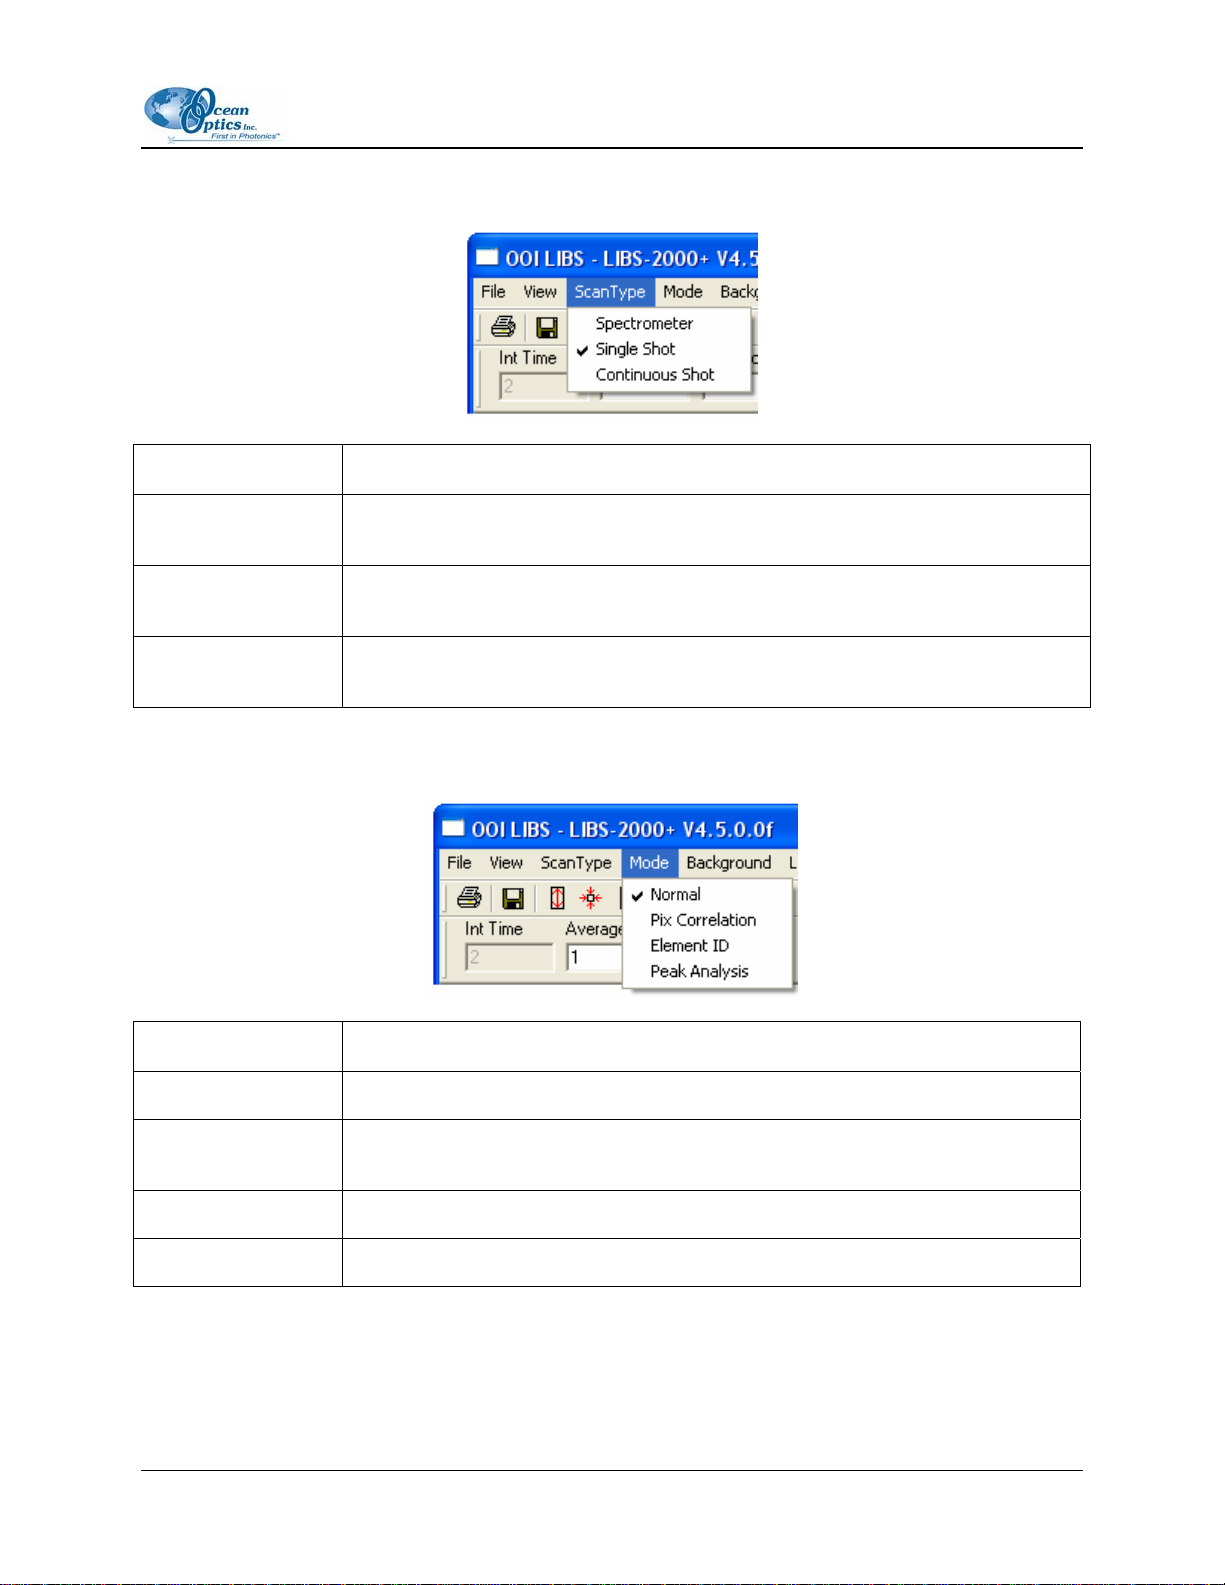
Menu Bar
The OOILIBS Menu Bar is located at the top of the OOILIBS screen and features the following options:
File Menu
Menu Option Description
Open Spectrum Opens a Saved Spectrum file and displays it in the graph. You can analyze this
data.
Save Spectrum Saves a spectrum file (.ols). You can load this file into overlays or opened it
directly.
Save Background Saves a background spectrum. You can use this for background subtraction, but it
cannot be loaded for overlays or display.
Continuous Save Starts Continuous Save. When activated, each scan is saved with a file appended
with a incremental file number.
Print Spectrum Prints the spectrum displayed in the graph window.
Exit Exits the program.
161-00000-000-02-0406 39
Page 50
B: User Interface
View Menu
Menu Option Description
Cursor Info Displays the Cursor info dialog box. This dialog box lets you customize and record
information about the cursor.
Spectrum Display the Spectrum in the graph window.
Background Display the background data in the graph window.
Overlays Brings up the Overlay sub-menu, which displays and loads an overlay.
Overlay Sub-Menu
Menu Option Description
Overlay 1 Display overlay 1
Overlay 2 Display overlay 2
Select Overlay 1 Load an .ols file into Overlay 1.
Select Overlay 2 Load an .ols file into Overlay 2.
40 161-00000-000-02-0406
Page 51
B: User Interface
ScanType Menu
Menu Option Description
Spectrometer Selects Spectrometer mode. You can set the integration time in this mode, but
laser control is not enabled.
Single Shot Selects Single Shot mode. This mode controls the laser and allows you to
manually fire it.
Continuous Shot Selects Continuous mode. This mode fires the laser on a interval set in the Setup
Options, and the software acquires and analyzes data.
Mode Menu
Menu Option Description
Normal Data collection only. No analysis is performed.
Pix Correlation Allows you to correlate against a library and determine the closest match based
on pixel information.
Element ID Attempts to pick out the lines of elements contained in the spectrum.
Peak Analysis Allows you to get some statistical information on user definable peaks.
161-00000-000-02-0406 41
Page 52

B: User Interface
Background Menu
Menu Option Description
Mode Allows you to select the type of background subtraction
Load Sampled
Background
Add Sampled
Background
Mix Sample
Background
Loads a background file to be subtracted off in Sampled Background mode.
Adds together a sampled background doing a per point add-on to the
background files.
Mixes two background files, retaining the higher counts per point.
Background | Mode Menu
Menu Option Description
None No background subtraction.
Sampled
Background
Dark Dark subtraction uses the masked pixels of each detector as the background.
Sampled background subtraction loaded using
Background Menu options.
Library Options Menu
42 161-00000-000-02-0406
Page 53

B: User Interface
Menu Option Description
Element ID
Correlation
Brings up the Element ID library menu (see
Brings up the Correlation library menu (see
Library Options | Element ID Menu
Menu Option Description
Load Library Loads an Element ID library.
Analyze For future use.
Library Options | Correlation Menu
Library Options | Element ID Menu.
Library Options | Correlation Menu.
Menu Option Description
New Library Creates a new correlation library.
Save Library Saves the correlation library.
Load Library Loads a correlation library.
161-00000-000-02-0406 43
Page 54
B: User Interface
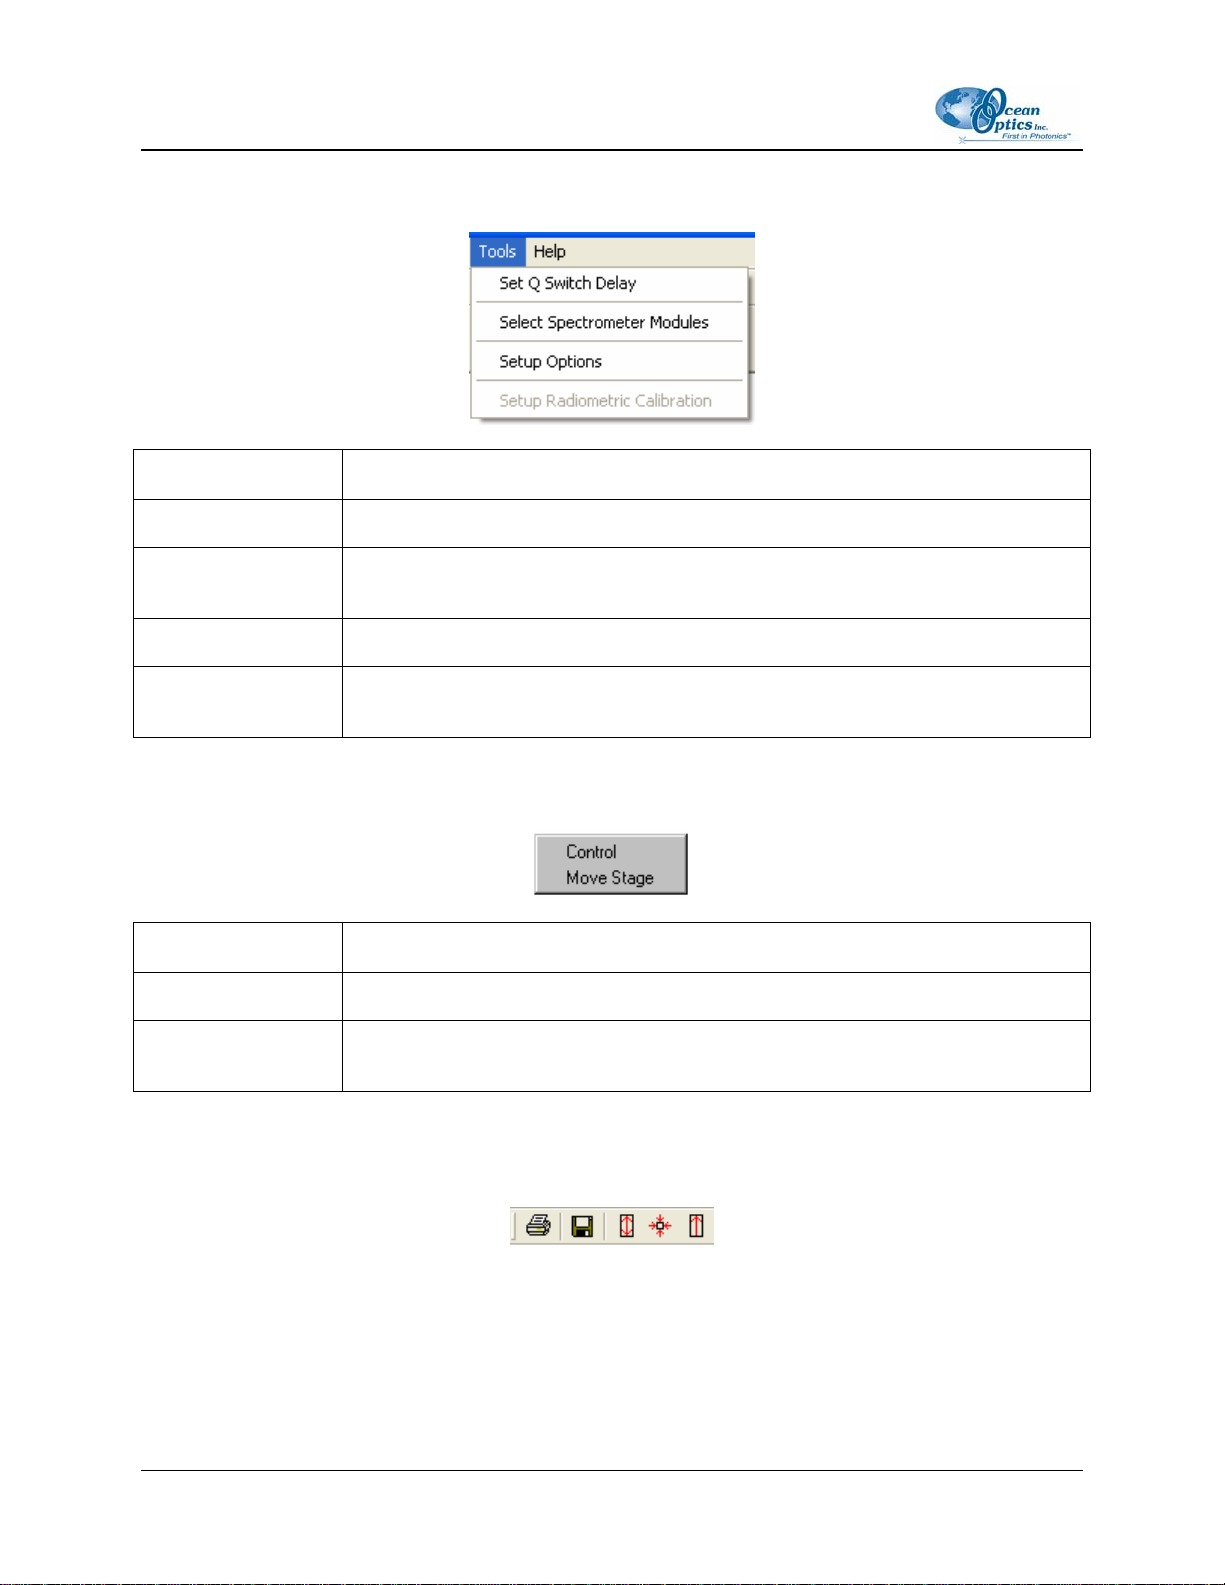
Tools Menu
Menu Option Description
Set Q Switch Delay Opens the Adjust Q Switch window.
Select Spectrometer
Modules
Setup Options Sets up general options for OOILIBS software.
Setup Radiometric
Calibration
Selects the serial numbers of the spectrometers to be used.
Sets up the radiometric calibration options.
Stage Menu
Menu Option Description
Control Opens the Sample Chamber stage control window.
Move Stage Automatically moves the stage during sampling. Only available on the closed loop
sample chamber.
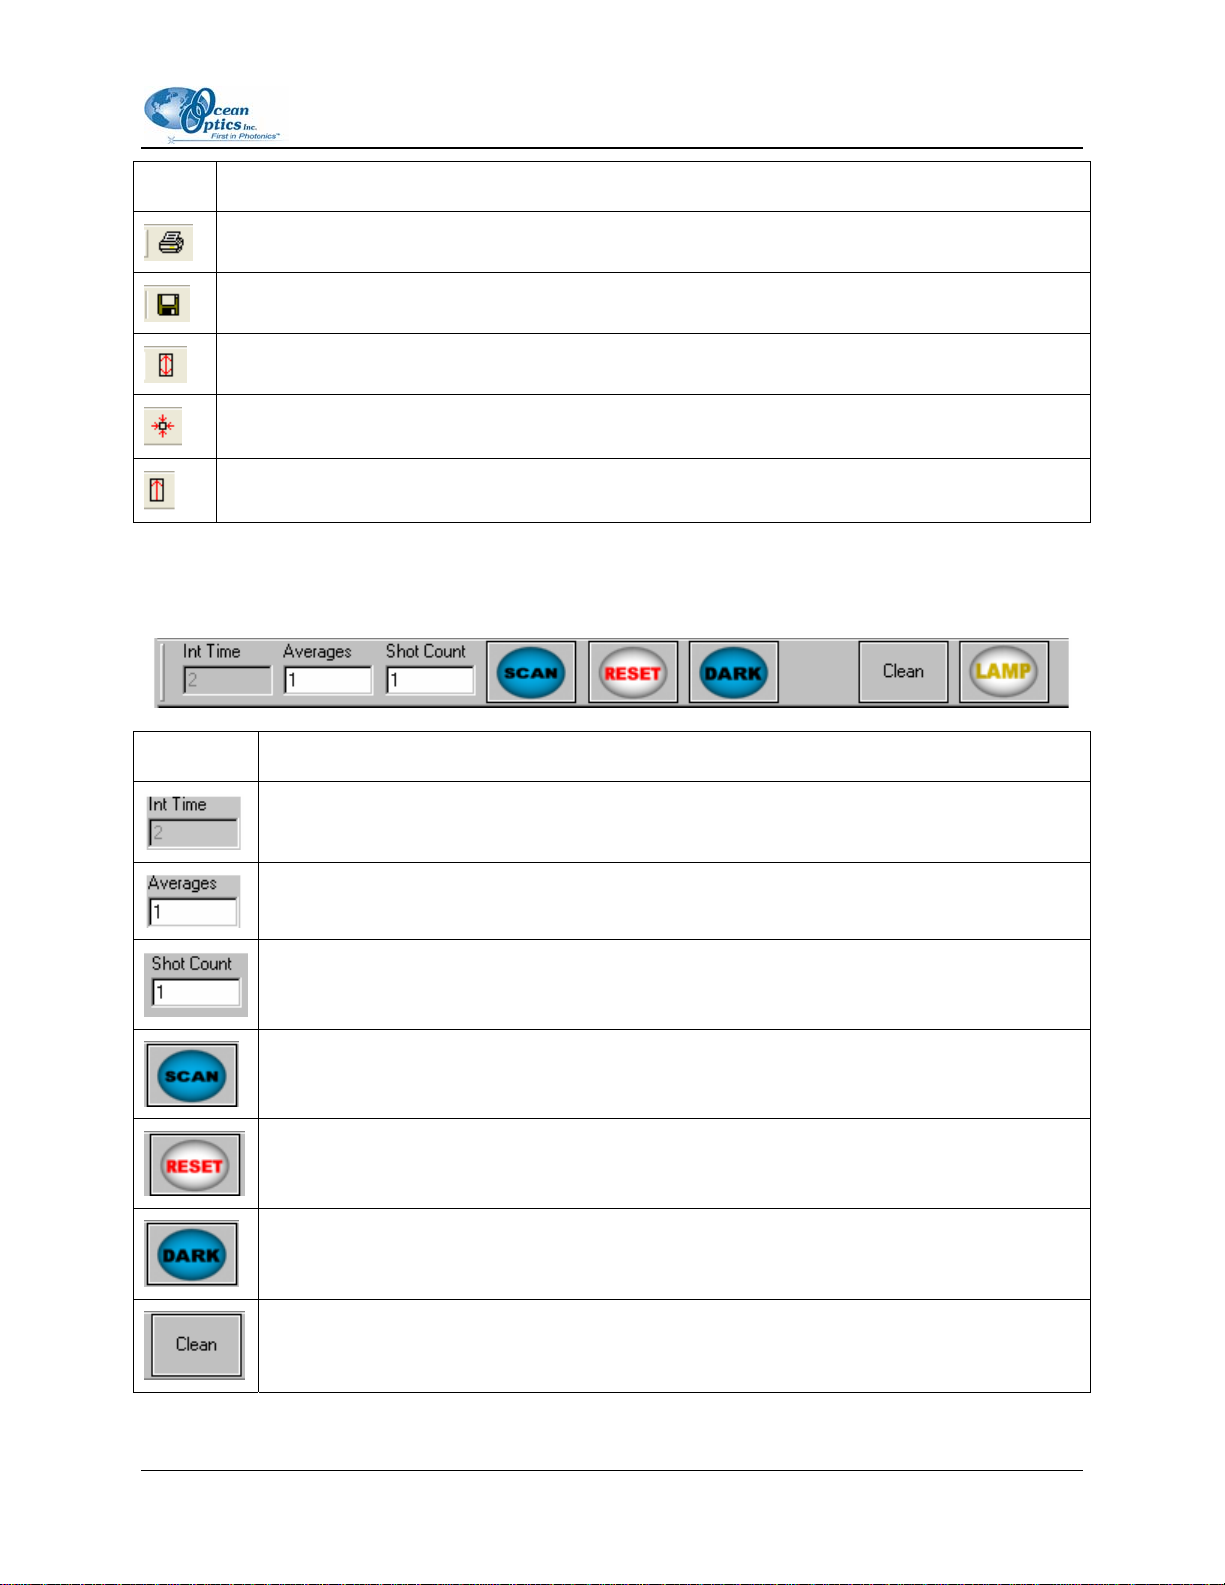
Tool Bar
The OOILIBS tool bar, located at the top of the screen, features the following options:
44 161-00000-000-02-0406
Page 55
B: User Interface
Icon Description
Prints the contents of the graph window.
Saves the contents of the graph window
Scale the contents of the graph window according to the highest and lowest readings.
Auto-scales the contents of the graph window.
Scales the contents of the graph window according to the highest readings.
Dialog Bar
Icon Description
Displays the integration time (in Spectrometer Mode).
Displays the averages of the specified number of scans (all modes).
Displays the number of shots to take and the average (Single and Continuous Shot
Modes).
Allows you to manually take a scan (Single Shot Mode).
Resets the spectrometer (in the event that a trigger is missed).
Not used.
Takes the specified number of cleaning shots. This option is configured in the Setup
Options window.
161-00000-000-02-0406 45
Page 56
B: User Interface
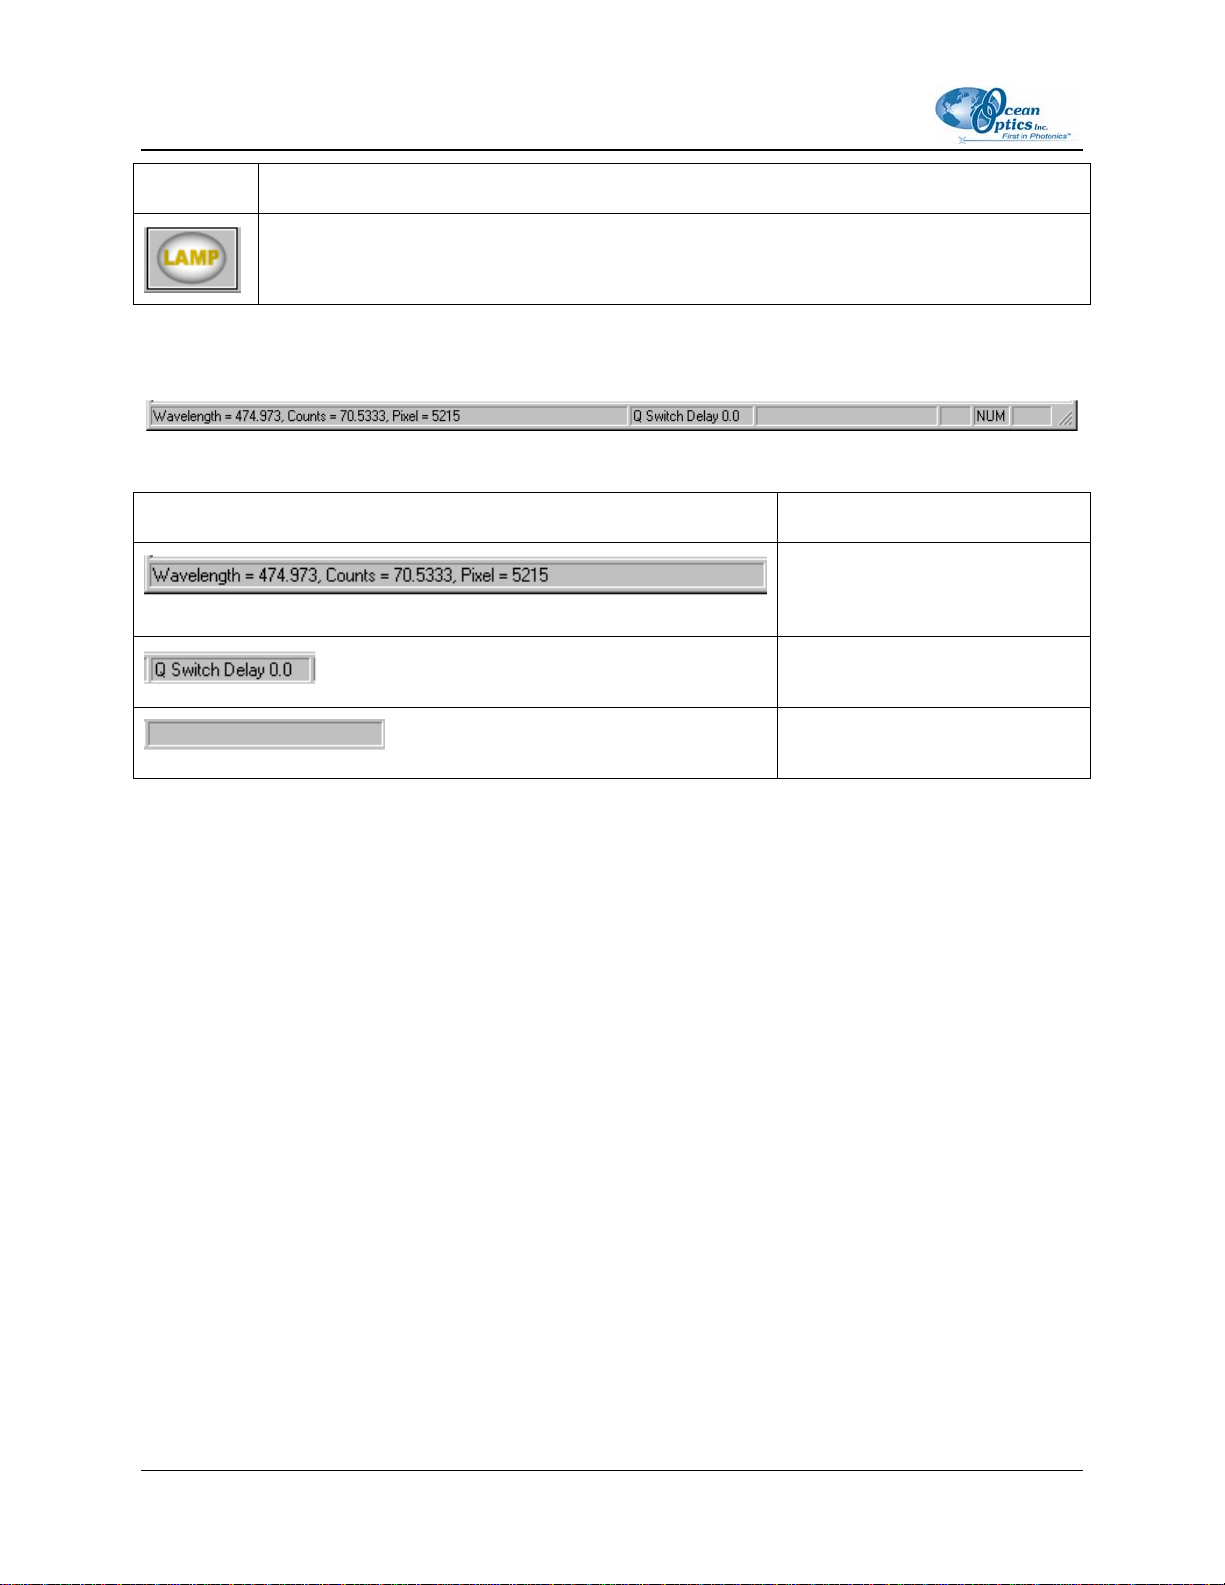
Icon Description
Turns the alignment light on or off.
Status Bar
The OOILIBS Status Bar, located at the bottom of the screen, features the following options:
Option Description
Displays the wavelength, counts
and pixel number of the current
cursor location.
Displays the current Q Switch
delay.
Displays the current Continuous
Save File name (when in use).
46
161-00000-000-02-0406
Page 57
B: User Interface
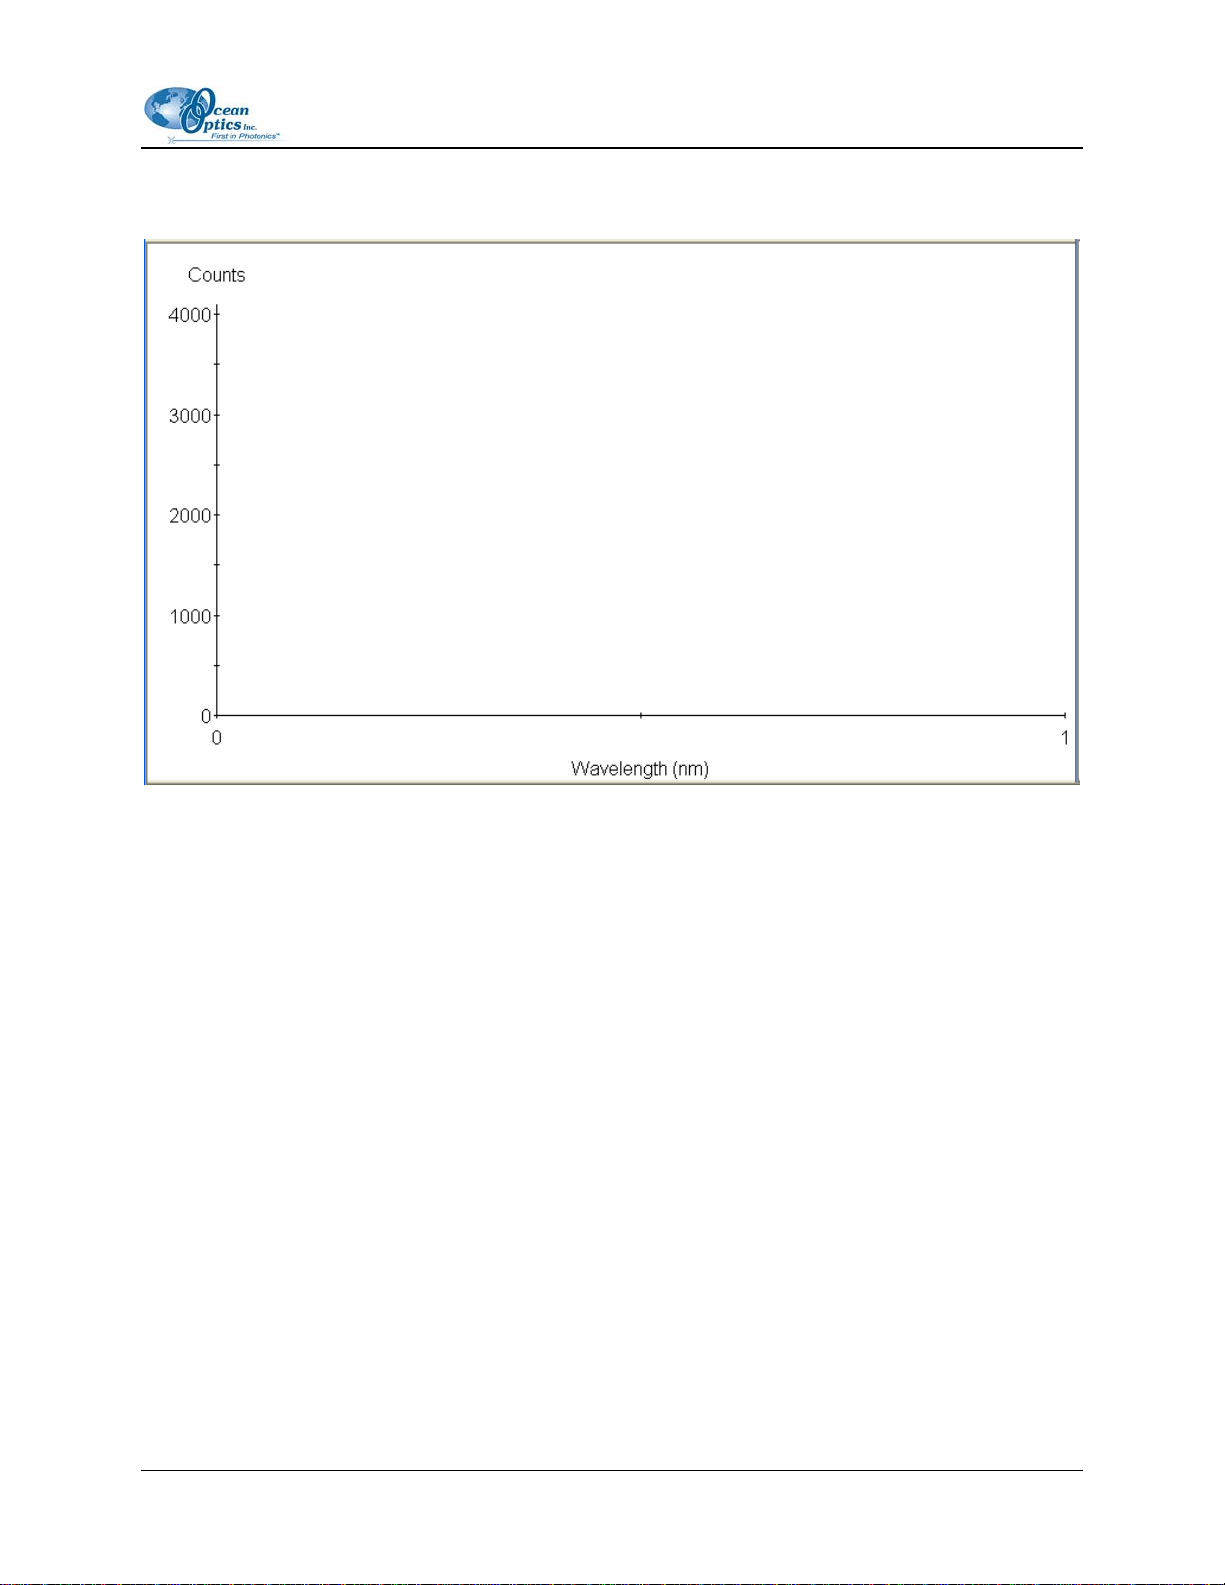
Graph Window
The OOILIBS Graph Window, located in the center of the screen, features the following options:
• In the main display window, the X axis represents Wavelength and the Y axis represents Counts
(or arbitrary intensity, if Use Radiometric Calibration is checked).
• Click directly on the graph window to place the cursor at a specific point.
• Double-click on the graph window to reset the zoom ranges.
• Hold the both the SHIFT and left mouse buttons down, then drag and outline a region to zoom in
on that region.
161-00000-000-02-0406 47
Page 58

B: User Interface
48 161-00000-000-02-0406
Page 59

Index
A
Adobe Acrobat Reader, 4
applications, 3
argon, 5
Argon, 5
B
Background | Mode menu, 42
Background menu, 42
beep, 33
broadband, 1
C
cabling, 10
components, 4
computer
requirements, 5
configuration, 17
correlation
library, 28, 30
performing in OOILIBS, 27
tips, 30
window, 27
E
Element ID, 24
element library, 15
emission ID, 2
equipment
other required, 4
recommended, 5
standard, 4
ezusb.sys file, 34
F
File menu, 39
G
graph window, 47
H
hardware
cabling, 10
setup, 7
HR2000, 4, 31
configuration, 14
D
I
Device Manager, 13, 31
Dialog bar, 45
document
audience, v
purpose, v
summary, v
161-00000-000-02-0406 49
imaging module, 1, 5
cabling, 11
setup, 8
inf file, 34
installation, 7
hardware, 10
software, 10
Page 60

Index
L
laser, 1
cabling, 11
requirements, 3, 5
setup, 8
troubleshooting, 33
library
add samples, 28
saving, 30
Library Options | Correlation menu, 43
Library Options | Element ID menu, 43
Library Options menu, 42
Lines Information, 26
Lines to Analyze options, 25
M
menu
Background, 42
Background | Mode, 42
File, 39
Library Options, 42
Library Options | Correlation, 43
Library Options | Element ID, 43
Mode, 41
Overlay, 40
ScanType, 41
Stage, 44
Tools, 44
View, 40
Mode menu, 41
O
OOIBase32, 9
OOILIBS, 1, 2, 5
freeze, 35
installation, 10
lock up, 35
operation, 1
options
Lines to Analyze, 25
Overlay sub-menu, 40
P
packing list, 4
passwords, 4
Peak Analysis, 25
procedure, 26
Pixel Correlation, 21
product-related documentation, v
Q
Q-Switch
delay, 17
R
radiometric
setup, 19
remove
improperly installed files, 32
unknown device, 31
requirements
laser, 3
S
sample chamber
setup, 8
samples
add to library, 28
save
library, 30
ScanType menu, 41
setup
hardware, 7
setup options, 18
shipment components, 4
Software and Resources Library CD, 4
software modes, 21
Element ID, 24
Peak Analysis, 25
Pixel Correlation, 21
software troubleshooting, 35
specifications, 37
spectrometer
cabling, 10
50 161-00000-000-02-0406
Page 61

B: User Interface
S (Cont'd)
configuration, 14
HR2000, 4
troubleshooting, 33
Stage menu, 44
Status bar, 46
system start-up, 13
testing, 20
Tool bar, 44
Tools menu, 44
troubleshooting, 31
laser, 33
OOILIBS, 35
spectrometer, 33
Troubleshooting, 17
U
unknown device
remove, 31
upgrades, vi
user interface, 39
V
T
View menu, 40
161-00000-000-02-0406 51
Page 62

Index
52 161-00000-000-02-0406
 Loading...