

Page 1
NXP Semiconductors
Document Number: S32DBGUG
User Guide
Rev. 1, 10/2018
S32 Debug Probe User Guide
by: NXP Semiconductors
Page 2

S32 Debug Probe User Guide, Rev.1, 10/2018
NXP Semiconductors
2
Contents
Chapter 1 Introducing S32 Debug Probe ....................................................... 4
1.1 What is S32 Debug Probe? ....................................................................................................... 4
1.1.1 Product highlights ............................................................................................................................... 5
1.1.2 Debugging environment ...................................................................................................................... 6
1.1.3 S32 Debug Probe benefits .................................................................................................................. 6
1.1.4 Target connections ............................................................................................................................. 6
1.2 Operating requirements ............................................................................................................ 6
1.2.1 Standard electrostatic precautions ...................................................................................................... 6
1.2.2 Operating temperature ........................................................................................................................ 7
1.2.3 Electrical requirements ....................................................................................................................... 7
1.3 Related documentation .............................................................................................................. 9
Chapter 2 Connecting to Network ................................................................ 10
2.1 Connecting S32 Debug Probe to network ............................................................................. 10
2.2 Customizing S32 Debug Probe ............................................................................................ 11
2.3 Testing network communication ........................................................................................... 13
Chapter 3 Connecting to Target System ...................................................... 14
3.1 Debug port connector information ........................................................................................ 14
3.2 Connecting to target system ................................................................................................ 14
3.2.1 Connecting probe tip to target ................................................................................................ ............ 15
Chapter 4 Using S32 Debug Probe ............................................................... 21
4.1 Debugging with S32 Debug Probe system ............................................................................... 21
4.1.1 Run/Pause/Mixed mode states...................................................................................................... 21
4.2 Accessing S32 Debug Probe Remotely ................................................................................... 23
Chapter 5 Hardware Specifications .............................................................. 24
5.1 LEDs on S32 Debug Probe.................................................................................................. 24
5.1.1 Transmit/Receive indicator ............................................................................................................ 25
5.1.2 Run/Pause indicator...................................................................................................................... 25
5.1.3 RJ45 Ethernet connector with link and activity indicators ............................................................... 26
5.2 Host connectors on S32 Debug Probe ................................................................................. 26
5.2.1 RJ45 Ethernet connector .............................................................................................................. 27
5.2.2 USB connector ............................................................................................................................. 27
5.3 Target connectors on S32 Debug Probe............................................................................... 27
Page 3

S32 Debug Probe User Guide, Rev.1, 10/2018
NXP Semiconductors
3
5.3.1 Probe tip connector ....................................................................................................................... 28
5.3.2 Electrical characteristics................................................................................................................ 28
5.3.3 Physical considerations................................................................................................................. 28
Chapter 6 S32 Debug Probe Setup Utility Commands ................................ 30
6.1 Connecting to S32 Debug Probe setup utility ........................................................................ 30
6.2 S32 Debug Probe setup utility commands and variables ....................................................... 30
6.2.1 Commands to configure communications ...................................................................................... 31
6.2.2 Commands to troubleshoot communication ................................................................................... 32
Chapter 7 Network Administration ............................................................... 35
7.1 S32 Debug Probe network ports .............................................................................................. 35
7.2 Configuring S32 Debug Probe using netparam .................................................................... 35
7.2.1 Configuring dynamic IP address ................................................................ .................................... 36
7.2.2 Configuring static IP address ......................................................................................................... 36
7.2.3 Static routing ................................................................................................................................. 37
7.2.4 Changing existing route entry ........................................................................................................ 37
7.2.5 Entering static routes..................................................................................................................... 37
7.3 Using CCS to search for S32 Debug Probes ....................................................................... 38
7.3.1 Sample output ............................................................................................................................... 39
Chapter 8 S32 Debug Probe Firmware .......................................................... 40
8.1 Boot loader ........................................................................................................................ 40
8.1.1 Operating system .......................................................................................................................... 40
8.1.2 Shell software ............................................................................................................................... 40
8.2 Reprogramming S32 Debug Probe firmware images............................................................ 40
8.2.1 Reprogramming Firmware through Ethernet Port ........................................................................... 44
Chapter 11 Arm® CoreSight™ Connector Information ................................ 45
Chapter 12 Troubleshooting ......................................................................... 57
12.1 Troubleshooting communication problems ........................................................................... 57
12.1.1 Verify network communication ....................................................................................................... 57
12.1.2 View network connections ............................................................................................................. 58
12.2 Troubleshooting power problems ........................................................................................ 58
Index ............................................................................................................... 59
Page 4

S32 Debug Probe User Guide, Rev.1, 10/2018
NXP Semiconductors
4
Introducing S32 Debug Probe
What is S32 Debug Probe?
Chapter 1
Introducing S32 Debug Probe
The S32 Debug Probe allows your personal computer to communicate with NXP automotive microcontrollers and processors
via JTAG debug connection.
CAUTION
The S32 Debug Probe contains components that are subject to damage from electrostatic
discharge. Whenever you are using, handling, or transporting the S32 Debug Probe, or
connecting to or disconnecting from a target system, always use proper anti-static protection
measures, including static-free bench pads and grounded wrist straps.
This chapter explains:
• What is S32 Debug Probe? on page 4
• Operating requirements on page 6
• Related documentation on page 9
1.1 What is S32 Debug Probe?
The S32 Debug Probe uses advanced emulation technology to provide control and visibility into your target embedded
system.
Combined with S32 Design Studio, the S32 Debug Probe speeds the debugging process by letting you interactively control
and examine the state of your target system.
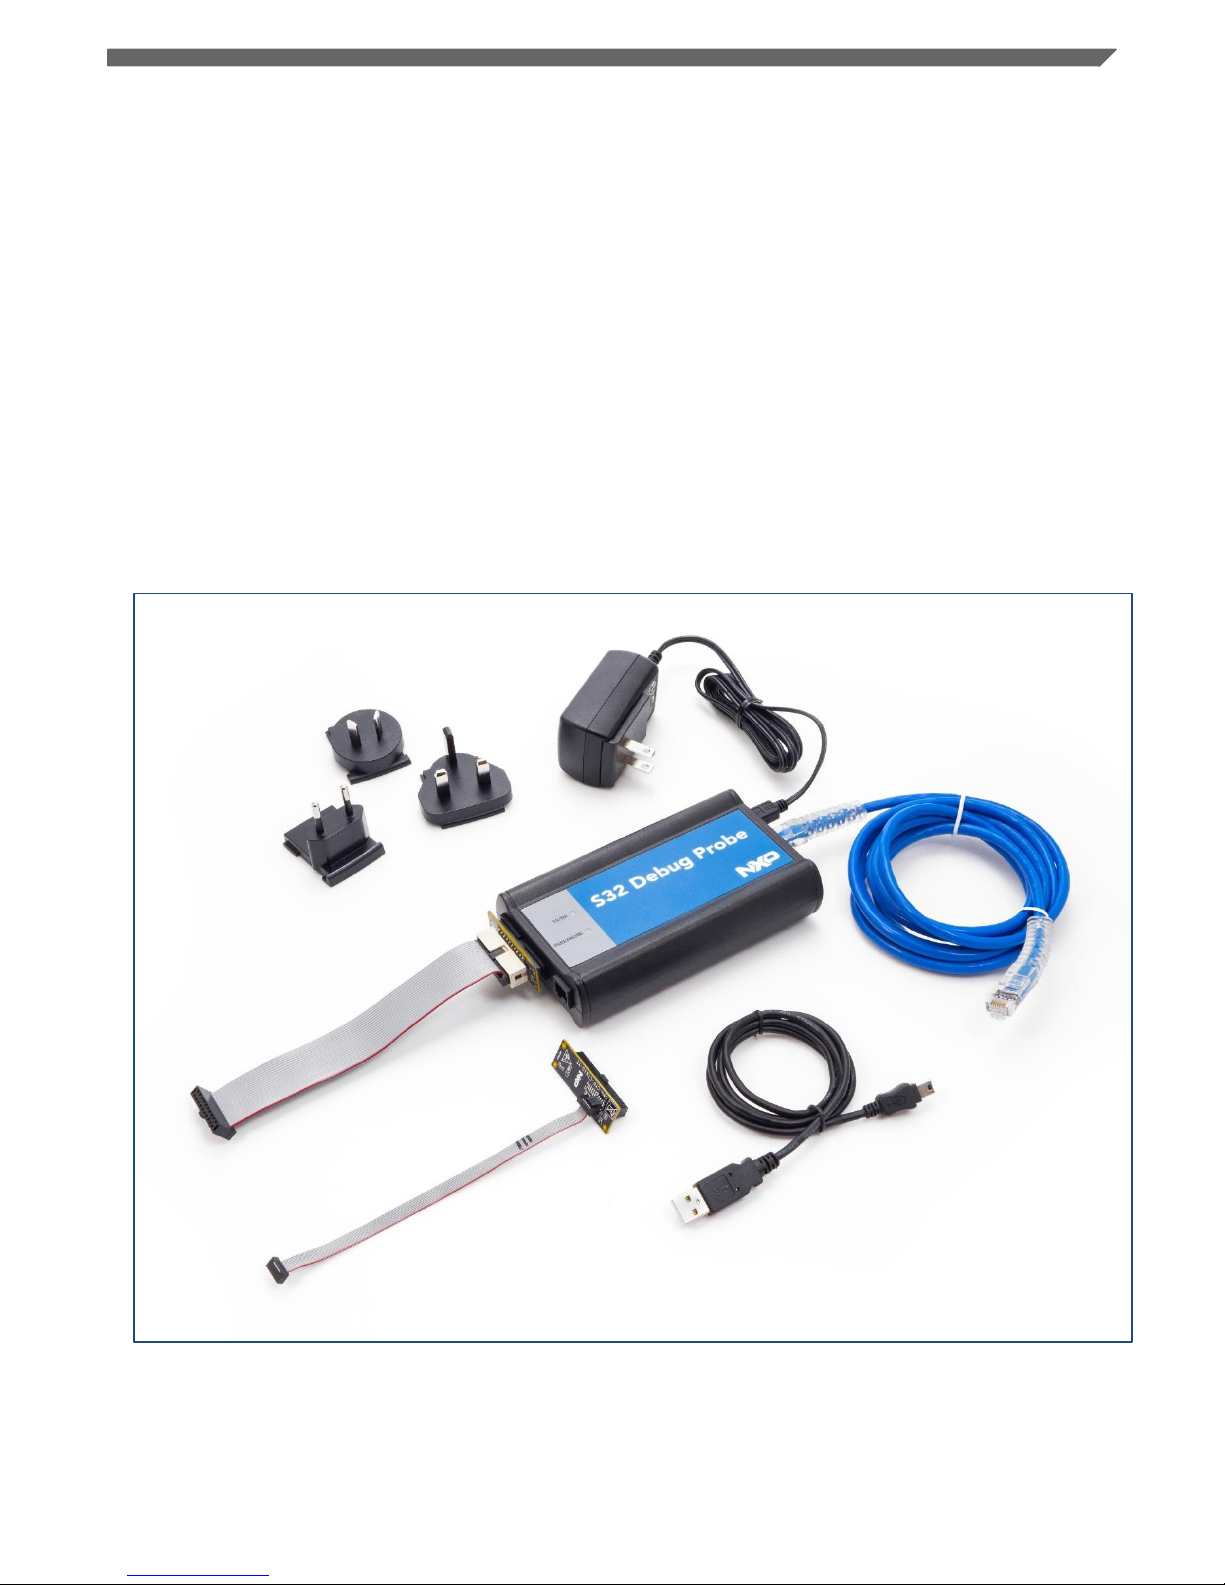
The basic S32 Debug Probe system is composed of two parts:
• The S32 Debug Probe, which provides visibility into and control of your target sy stem using a JTAG interface and
connects to your host computer through either USB or Ethernet.
• Arm 10 pin or 20 pin probe tip, which is designed to provide a physical and electrical interface to the target system
processor that you want to gain visibility into.
Page 5

S32 Debug Probe User Guide, Rev.1, 10/2018
NXP Semiconductors
5
Introducing S32 Debug Probe
What is S32 Debug Probe?
Figure 1. S32 Debug Probe
1.1.1 Product highlights
This section lists the S32 Debug Probe features.
The S32 Debug Probe has these features:
• Supports NXP automotive microcontrollers and processors. Go to the nxp.com/S32debugprobe for the latest supported
NXP processors
• Supports all CPU core speeds
• Allows you to control and debug software running in-target, with minimal intrusion into the target sy stem operation
• Allows you to debug code in cache, ROM, RAM, and flash memory
• Supports 10/100 Ethernet network connection
• Supports USB 2.0 high-speed connection
• USB powered
• Supports both big and little endian byte-order
• Software debug capabilities, usually part of host software like S32 Design Studio, include:
• Control instruction execution
Page 6

S32 Debug Probe User Guide, Rev.1, 10/2018
NXP Semiconductors
6
Introducing S32 Debug Probe
• Display and modify target system memory
• Examine and modify any processor registers
• Run to breakpoints in ROM, RAM, or flash memory
• Single-step through source and assembly language code views
• Step into, over, or out of functions
• Collect and analyze real-time data
• Perform boundary scan testing with support from correct host-level software
• Program all onboard memories with support from correct host-level software
1.1.2 Debugging environment
The S32 Debug Probe works with the S32 debugger to give you control over the emulation functions and your target
system.
1.1.3 S32 Debug Probe benefits
The S32 Debug Probe provides these key benefits:
• Visibility: Allows you to observe registers and the current state of target system memory. You can halt program
execution at predefined states and examine the data for a particular program state.
• Control: Enables you to control the state of the target system by downloading code, manually modifying
processor registers and memory, single-stepping through the code, or setting breakpoints.
1.1.4 Target connections
The S32 Debug Probe connects to your target through the standard debug port for the processor family, and supports a
single target connection, based on the connected probe tip.
For details on processor list, go to nxp.com/S32debugprobe.
For information on connecting to a target, see Connecting to target sy stem topic.
1.2 Operating requirements
Before setting up the system, ensure that the operating environment is prepared.
1.2.1 Standard electrostatic precautions
This instrument contains static-sensitive components that are subject to damage from electrostatic discharge.
Use standard precautions when transporting, handling, or using the instrument and the target, when
connecting/disconnecting the instrument and the target, and when removing the cover of the instrument.
It is recommended that you use the following precautions:
• Use wrist straps or heel bands with a 1Mohm resistor connected to ground.
• On the work surface and floor, use static conductive mats with a 1Mohm resistor connected to ground.
Page 7

S32 Debug Probe User Guide, Rev.1, 10/2018
NXP Semiconductors
7
Introducing S32 Debug Probe
Operating requirements
• Keep high, static-producing items, such as non-ESD-approved plastics, tape, and packaging foam away from the
instrument and the target.
The above precautions should be considered as minimum requirements for a static-controlled environment.
1.2.2 Operating temperature
This section contains the operating temperature considerations for the S32 Debug Probe. For operating temperature of the S32
Debug Probe, see Physical considerations topic.
1.2.3 Electrical requirements
The S32 Debug Probe can be powered through a USB cable and does not require an external power supply.
It is designed to be plugged directly into a host computer, but can also work with self-powered hubs. For details on Bus-
powered hubs, see Electrical characteristics topic. If your hub is not able to provide sufficient power, connect the S32 Debug
Probe directly to your host PC, or purchase a self-powered USB hub.
If you only plan to use Ethernet communications, the S32 Debug Probe can be powered from the external power supply
provided with your unit. It can use line voltages of 100-240 VAC (50/60 Hz).
NOTE
It is recommended to use a surge protector between the power supply and AC power.
1.2.3.1 Connecting power supply cable
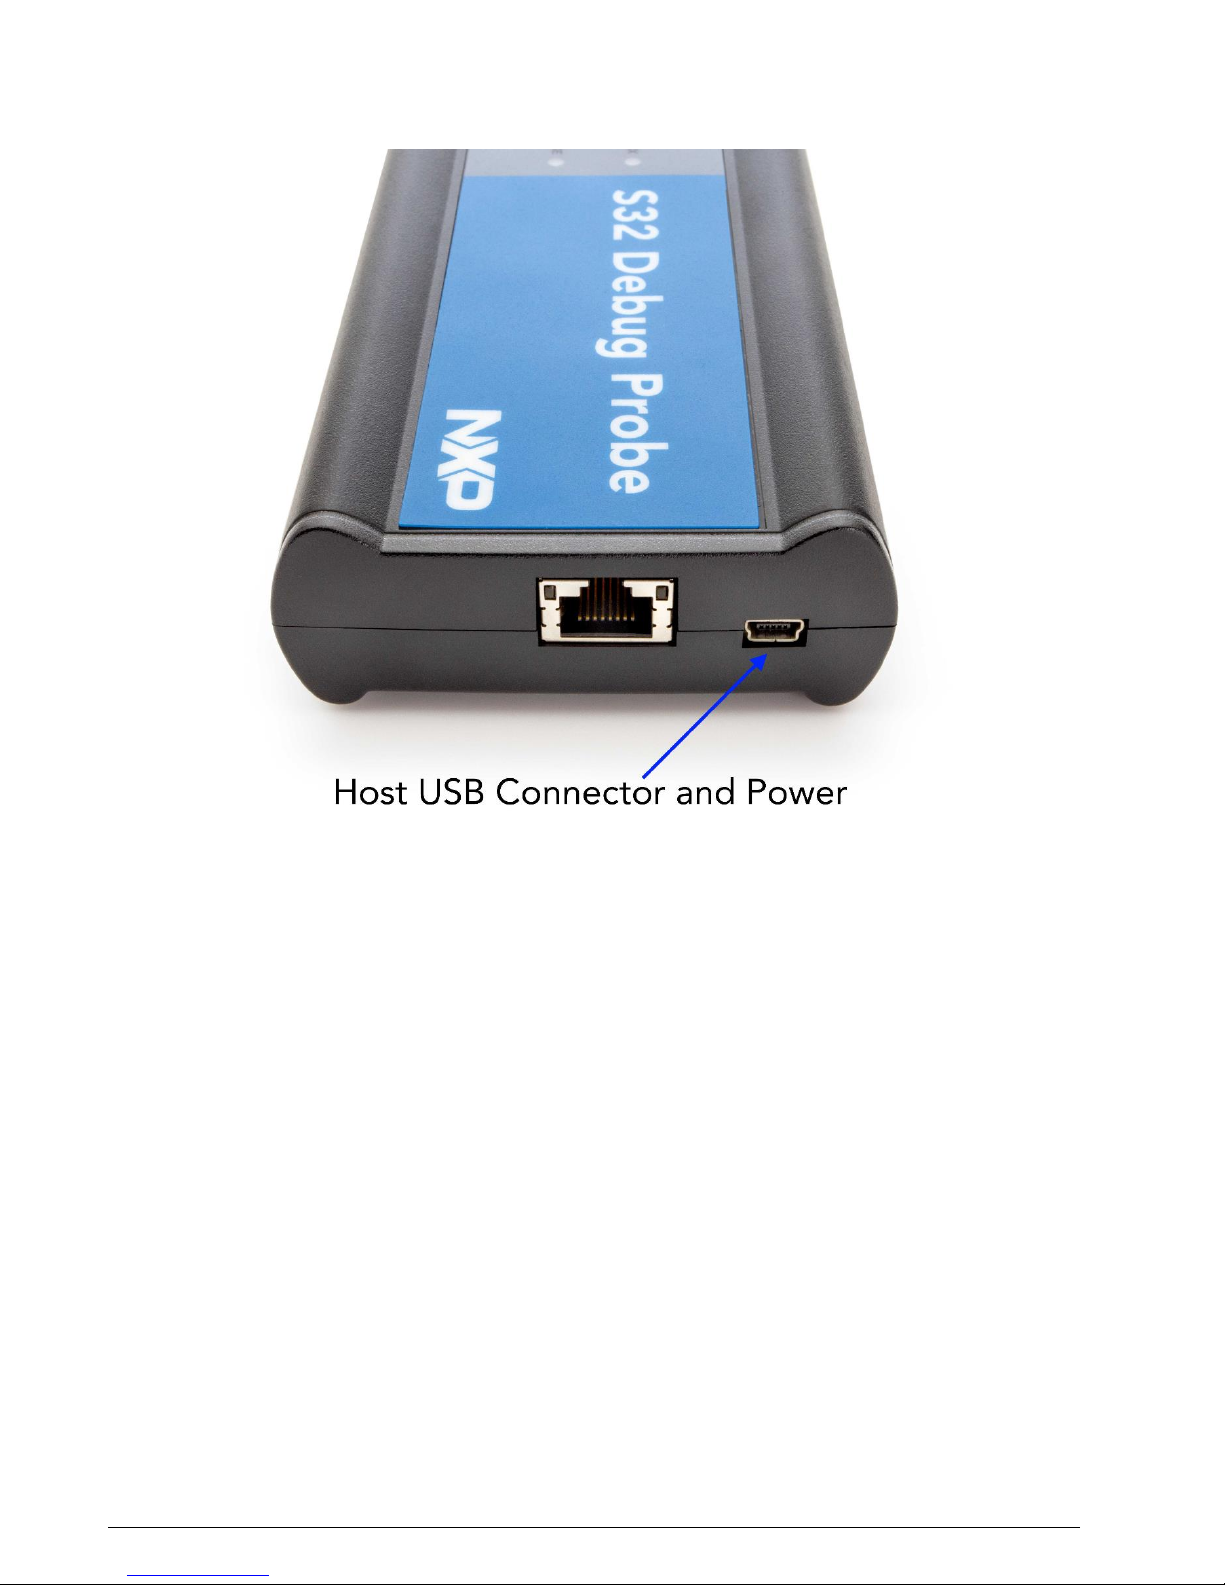
This section explains how to connect the USB cable to the connector on the S32 Debug Probe.
Connect the power supply connector to the USB connector on the S32 Debug Probe as shown below.
CAUTION
Connect only the provided power supply to the S32 Debug Probe. Other power supplies may look
similar, but can damage the probe if the supply specifications differ from the required specifications.
Page 8
S32 Debug Probe User Guide, Rev.1, 10/2018
NXP Semiconductors
8
Introducing S32 Debug Probe
Figure 2. S32 Debug Probe with USB connector
1.2.3.2 Cycling power to system
When you need to apply or cycle power to the S32 Debug Probe, connect or disconnect the power cable from the
power source or from the probe.
After you have connected the probe to your target system, use the following sequence for applying or removing the power.
To turn the power on:
1. Turn on the S32 Debug Probe power.
2. Turn on the target system power.
To turn the power off:
1. Turn off the target system power.
2. Turn off the S32 Debug Probe power.
Page 9

S32 Debug Probe User Guide, Rev.1, 10/2018
NXP Semiconductors
9
Introducing S32 Debug Probe
Related documentation
1.3 Related documentation
The S32DS documentation explains how to install and configure the S32DS IDE and debugger and use the S32
Debug Probe.
Page 10

Connecting to Network
S32 Debug Probe User Guide, Rev.1, 10/2018
NXP Semiconductors
10
Connecting S32 Debug Probe to network
Chapter 2
Connecting to Network
This chapter describes how to connect the S32 Debug Probe to an existing TCP/IP network.
The S32 Debug Probe is a device that may be configured for either using to acquire its IP configuration (the default method)
or through a static IP configuration.
This chapter explains:
• Connecting S32 Debug Probe to network
• Customizing S32 Debug Probe
• Testing network communication
2.1 Connecting S32 Debug Probe to network
The S32 Debug Probe’s default operation is to acquire its network configuration automatically using DHCP and attempt to
register its hostname with a name server.
The factory assigned host name is FSLXXYYZZ where XXYYZZ is the last three octets of the MAC address, provided on a
label on the bottom side of the probe. For example, if the probe's MAC address is 00:04:9f:00:77:31, the host name will be
FSL007731. The S32 Debug Probe can connect directly to a network using Ethernet (10/100BaseT) cables. To connect to
the Ethernet interface:
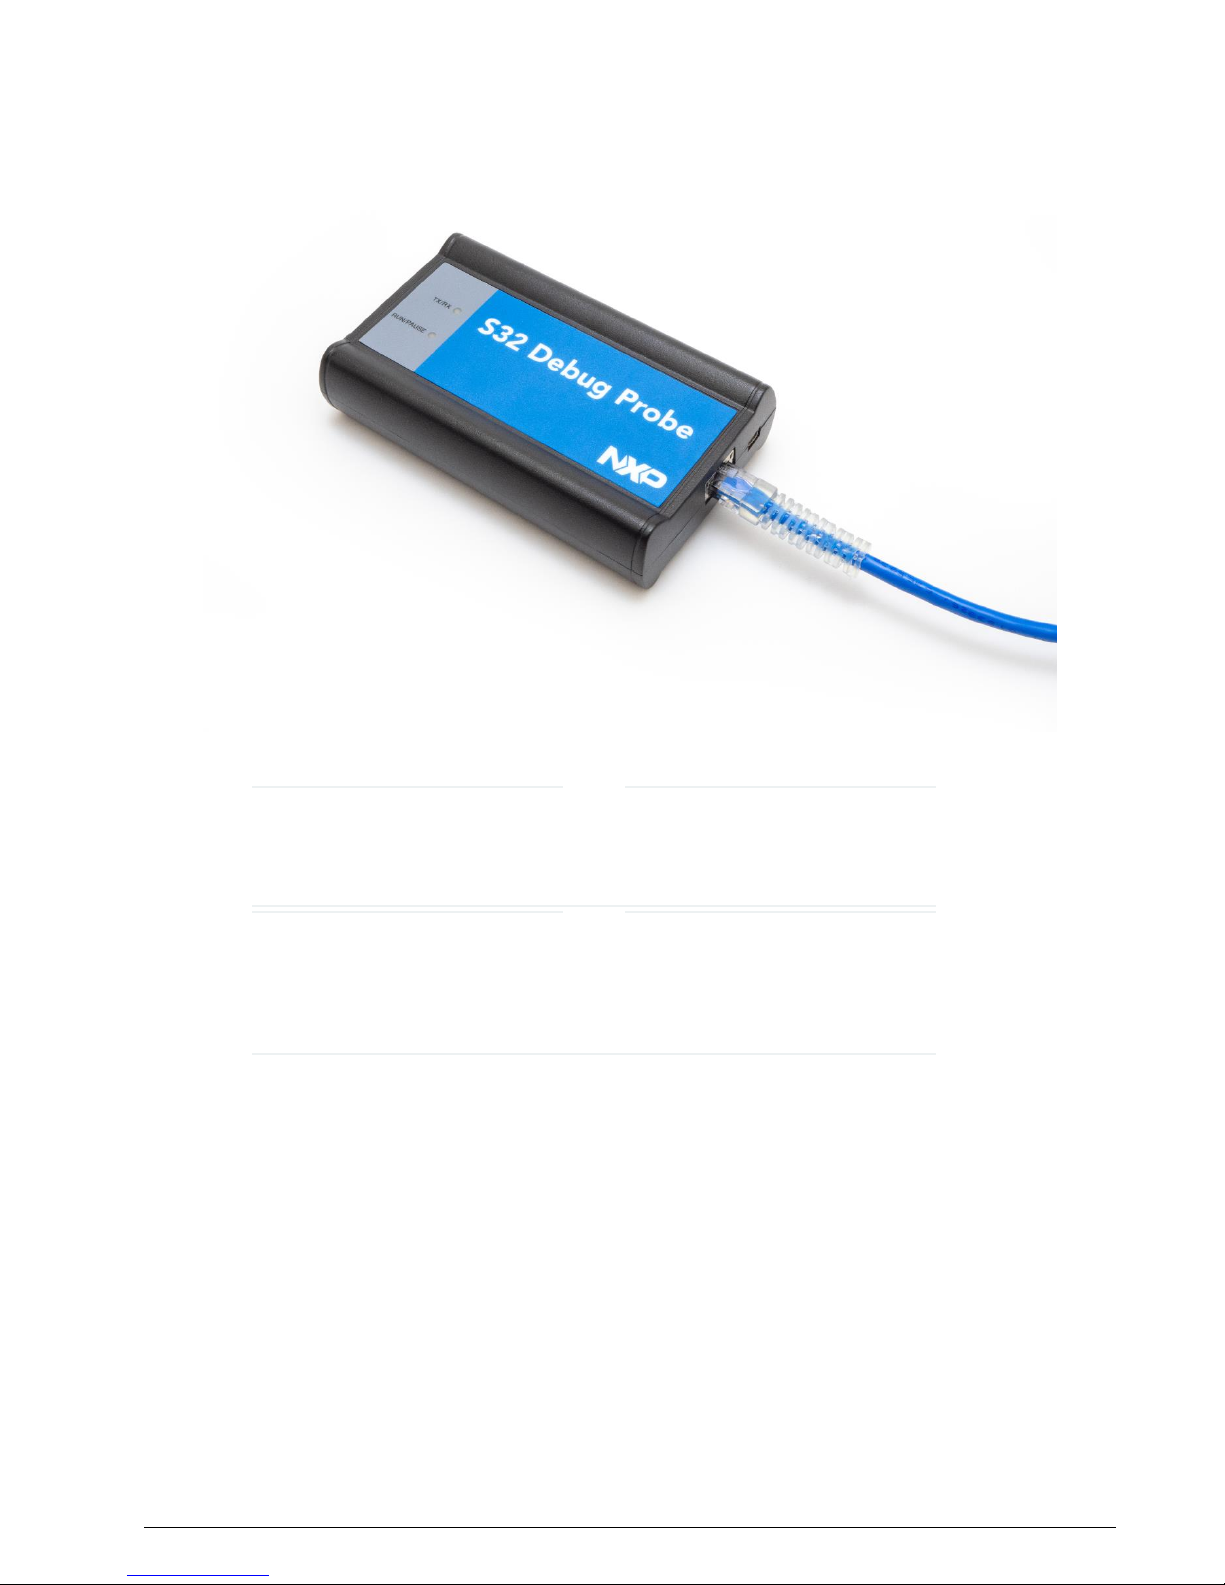
1. Plug one end of the supplied RJ45 cable (p/n 600-75499) into the RJ45 connector of the S32 Debug Probe.
Figure 3. S32 Debug Probe with Ethernet connector
Page 11
Connecting to Network
S32 Debug Probe User Guide, Rev.1, 10/2018
NXP Semiconductors
11
Connecting S32 Debug Probe to network
2. Connect the other end of the RJ45 cable into the RJ45 connector of the Ethernet network or host computer.
Figure 4. S32 Debug Probe with an RJ45 cable attached
NOTE
When you configure the debugger for the hardware connection, you will need to specify the S32
Debug Probe IP address or hostname. The CCS findcc utility is used to search any probe on the
local subnet. For more information, see Using CCS to search for S32 Debug Probe topic.
NOTE
Depending on the type and complexity of your network, your network administrator may need to
update network server tables so that the network accesses the S32 Debug Probe correctly.
Updating network server tables requires both a detailed knowledge of Ethernet address resolution
and network routing with write access permission to the server tables. For more information on
network administration, see Network administration topic.
2.2 Customizing S32 Debug Probe
The S32 Debug Probe acquires its network configuration automatically using DHCP. If you cannot use DHCP, you must
configure the probe for your network using static IP address resolution.
To manually configure the network settings of S32 Debug Probe for your network, access the probe configuration console
as described below and use the probe on-board setup utility netparam to change the probe network settings. The probe
netparam utility lets you select and modify network parameters that are saved in probe memory. Use netparam to configure
the probe to match the network address resolution and routing protocols.
If the probe needs to communicate with hosts on other subnets, you will need to configure the probe for one of the following
routing options:
• Default gateways
• Static routing tables
Customizing S32 Debug Probe
Page 12
Connecting to Network
S32 Debug Probe User Guide, Rev.1, 10/2018
NXP Semiconductors
12
To access S32 Debug Probe configuration console:
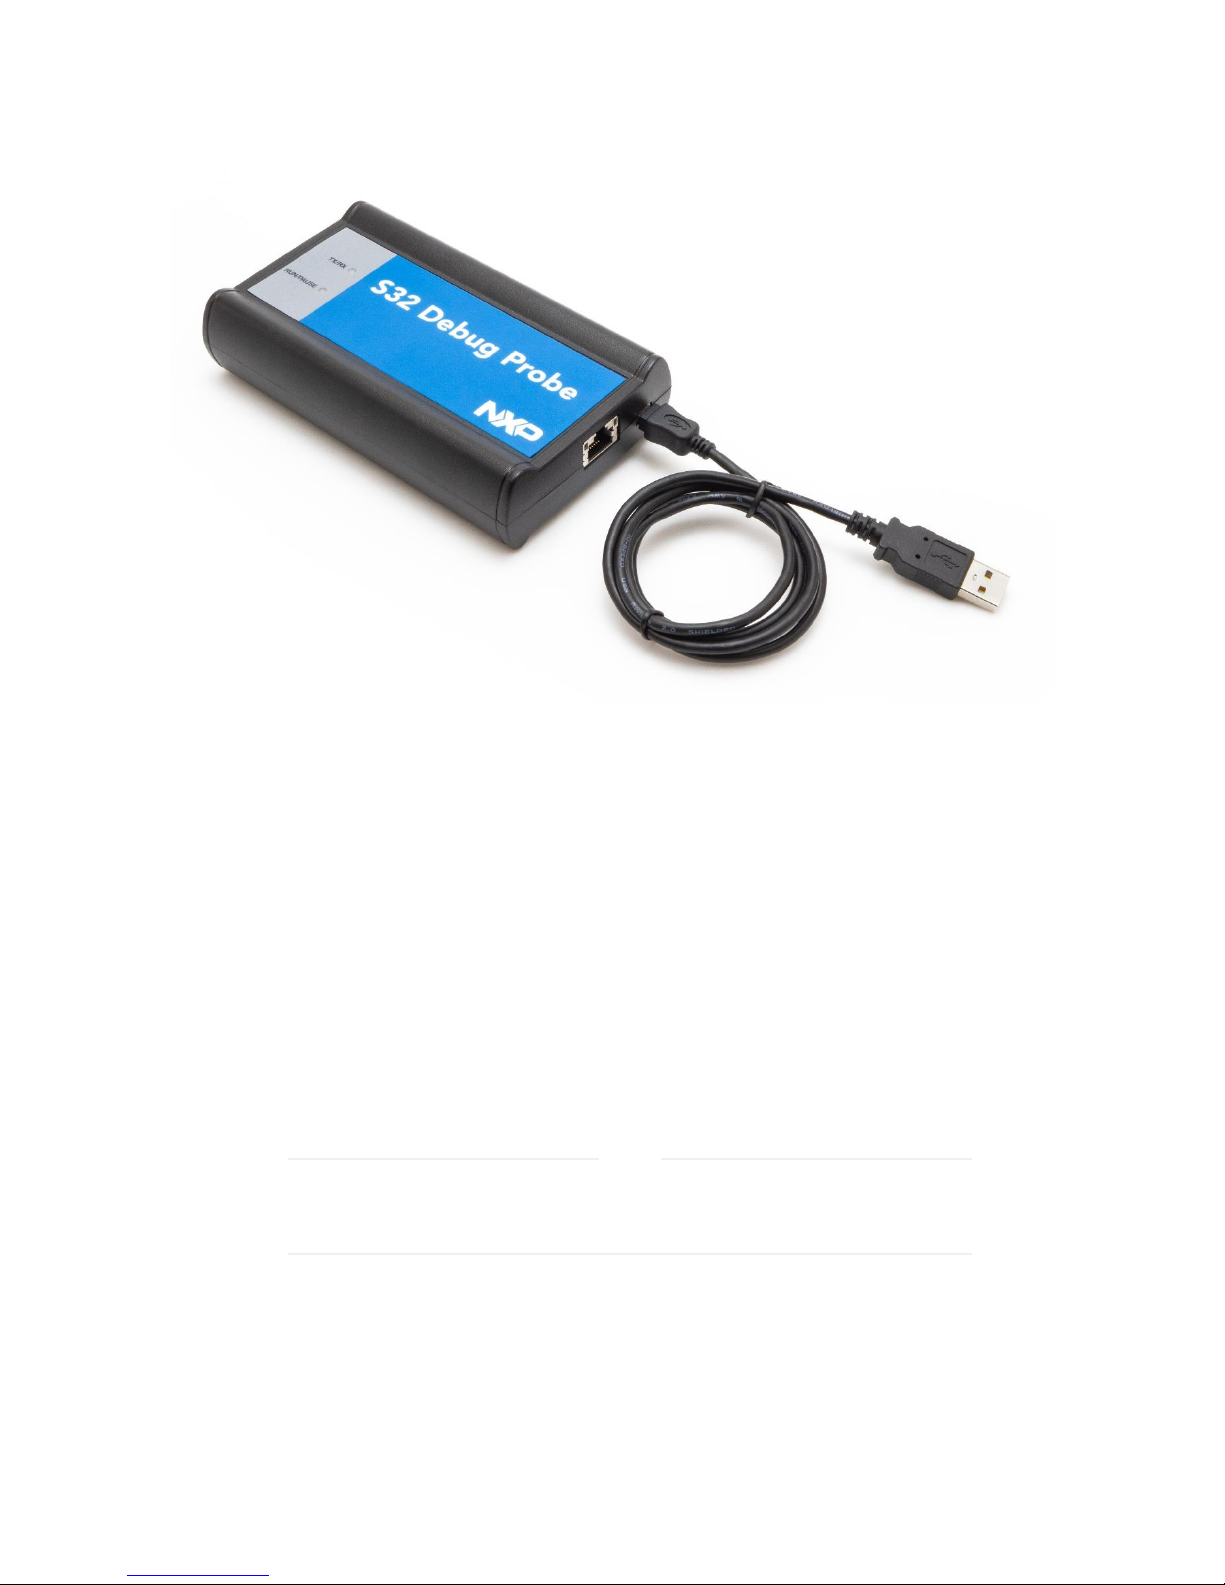
1. Connect the other end of the USB cable to the USB connector of the S32 Debug Probe.
Figure 5. S32 Debug Probe with USB cable attached
2. Wait for the TX/RX LED to start flashing green.
3. Identify the serial port device assigned to the S32 Debug Probe. On Windows, go to Device Manager > Ports and
then select USB serial port from the ports list. On Linux, the device file is located at: /dev/ttyACM0.
4. When prompted, press Enter. The login banner should be displayed and the core> command-line prompt appears.
To customize the S32 Debug Probe network settings:
1. Change the S32 Debug Probe network settings.
a. At the core> prompt, enter the netparam command to view the current settings.
b. For network setup, see netparam topic for syntax and options. For more information on installing the S32 Debug
Probe on a network, see Network administration topic.
c. At the core> prompt, enter the netparam commands and required parameters.
2. At the core> prompt, enter reset to reboot the S32 Debug Probe to activate the new network settings.
NOTE
If you connect to the S32 Debug Probe using telnet rather than the USB configuration console, you
may lose access when you change network settings, and will need to reconnect after the settings
have changed.
Example: Assign a static IP address and hostname to the S32 Debug Probe
Page 13

Connecting to Network
S32 Debug Probe User Guide, Rev.1, 10/2018
NXP Semiconductors
13
Testing network communication
If the S32 Debug Probe has a static IP address of 195.121.1.2 and a hostname of lab01, enter the following commands:
core> netparam static_ip_address 195.121.1.2
core> netparam bootconfig static:lab01
core> reset
The netparam utility copies its settings into non-volatile memory on the probe. Follow these rules while using the netparam
utility:
• Each time you enter a netparam command, wait for the core> prompt to re-appear before entering the next command.
The prompt indicates that the parameter change is logged.
• When you have finished entering all settings, type reset at the core> prompt. When the probe restarts, it will use the
new netparam parameters.
2.3 Testing network communication
The ping command is used to test the network communication.
You can use the ping command to ensure that the S32 Debug Probe can communicate with the host. To verify
communication, type the following at a host command prompt:
ping hostname | ip_address
where hostname is the name and ip_address is the IP address assigned to the S32 Debug Probe. If no output is
displayed on the screen, check the following:
• The physical connections are tight.
• The S32 Debug Probe address and netmask in the hosts file match those in S32 Debug Probe flash.
• The netmask used for the S32 Debug Probe and for the Ethernet Network Interface Card (NIC) are appropriate to the
class of the IP address.
Page 14

S32 Debug Probe User Guide, Rev.1, 10/2018
NXP Semiconductors
14
Connecting to Target System
Connecting to Target System
Debug port connector information
Chapter 3
Connecting to Target System
To use your S32 Debug Probe, you must have a prototype hardware or an evaluation board. This chapter explains how to
connect a S32 Debug Probe to the target system.
This chapter explains:
• Debug port connector information
• Connecting to target sy stem
3.1 Debug port connector information
The S32 Debug Probe offers debugging capabilities without modifying any target system code or any special I/O port in the
target system for communication with a monitor program running on the target system.
Target system connections can be made using the debug ports. The S32 Debug Probe connects to the target system's
JTAG header using a probe tip adapter and ribbon cable. The S32 Debug Probe is a powerful development tool for use with
a wide variety of processors. The following topics describe the debug port connector specifications:
• Arm CoreSight connector information
3.2 Connecting to target system
The target system must have a debug port header that you can connect to the S32 Debug Probe.
Make sure that you properly align the S32 Debug Probe multi-pin socket connector with the multi-pin header on your target
system.
CAUTION
Failure to properly connect the S32 Debug Probe to the target may damage the probe or target. Verify all
connections before applying power.
Page 15

S32 Debug Probe User Guide, Rev.1, 10/2018
NXP Semiconductors
15
Connecting to Target System
Connecting Probe Tip to Target
Figure 6. S32 Debug Probe - connecting probe tip to the probe
NOTE
Pin 1 is clearly marked on the gray ribbon cable by a red line down one side of the cable and a
small triangle in the plastic socket.
3.2.1 Connecting probe tip to target
This section explains how to connect the S32 Debug Probe cable to the target debug port header. To connect the S32
Debug Probe cable to the target debug port header:
1. Turn off the power to the target system.
2. Make sure that the USB cable from the S32 Debug Probe is not connected to the host computer.
3. Connect the probe tip to the S32 Debug Probe.
4. Make sure that pin 1 of the gray ribbon cable connector aligns with pin 1 on the target's debug port header.
Page 16

S32 Debug Probe User Guide, Rev.1, 10/2018
NXP Semiconductors
16
Connecting to Target System
Figure 7. S32 Debug Probe - connecting to target
5. Gently (but firmly) press the connector onto the target sy stem debug port header.
Connecting Probe Tip to Target
Page 17

Using S32 Debug Probe
S32 Debug Probe User Guide, Rev.1, 10/2018
NXP Semiconductors
21
Chapter 4
Using S32 Debug Probe
Debugging with S32 Debug Probe system
This chapter provides system startup procedures and explains how S32 Debug Probe is accessed remotely. This
chapter contains the following topics:
• Debugging with S32 Debug Probe system
• Accessing S32 Debug Probe remotely
4.1 Debugging with S32 Debug Probe system
Before starting debugging with S32 Debug Probe, you need to install S32 Design Studio on your machine.
This topic explains how to start debugging with the S32 Debug Probe. Before starting debug with the S32 Debug Probe,
make sure you have:
• Connected the S32 Debug Probe to your network or computer.
• Connected the S32 Debug Probe to the target system.
• Installed the debugger software such as S32 Design Studio and properly configure it to communicate with the S32
Debug Probe.
To start the S32 Debug Probe:
1. Apply power to the S32 Debug Probe.
2. Apply power to the target system.
3. Start the S32 debugger.
4. Configure the debugger for the S32 Debug Probe connection.
LEDs are provided to indicate the status of the S32 Debug Probe. For details on the LED indicators, see LEDs on S32
Debug Probe topic.
You are now ready to begin your debug session. Refer to the debugger documentation to become familiar with the
system operation.
The following topics provide information specific to S32 Debug Probe operation:
• Run/Pause/Mixed mode states
4.1.1 Run/Pause/Mixed mode states
When the host debugger is connected to the target using the S32 Debug Probe, the probe is always in one of the states:
run, pause, or mixed mode.
The three states (modes) are run, pause, or mixed mode. The on the probe will indicate the mode.
• Run mode - The Run/Pause LED will be green. In this mode, all target system processor cores ex ecute the target code.
• Pause mode - The Run/Pause LED will be red. In this mode, all target system processor cores have stopped executing
the target code.
• Mixed mode - The Run/Pause LED will be orange. In this mode, some target system processor cores are in run mode
and others are in pause mode.
Page 18

Using S32 Debug Probe
S32 Debug Probe User Guide, Rev.1, 10/2018
NXP Semiconductors
23
Accessing S32 Debug Probe Remotely
4.2 Accessing S32 Debug Probe Remotely
You can remotely access the internal setup utility after you connect the probe to your network.
If the host computer is not physically located near the probe, remote access is useful when you need to:
• Reconfigure communications
• Reset the probe through your Ethernet connection
To remotely access the setup utility:
Open a telnet session and connect to the probe by entering the command:
telnet hostname | ip_address
Use the host name or IP address of the probe. For static IP, the host name must be the same one you entered into the hosts
database file; see Connecting to network topic. To identify the IP address of any probe on the subnet, see Using CCS to
search for S32 Debug Probes topic.
The login banner is displayed, followed by the core > command-line prompt.
Page 19

Using S32 Debug Probe
S32 Debug Probe User Guide, Rev.1, 10/2018
NXP Semiconductors
24
LEDs on S32 Debug Probe
Chapter 5
Hardware Specifications
This chapter provides hardware specifications for the probe.
The following sections are covered in this chapter:
• LEDs on S32 Debug Probe
• Host connectors on S32 Debug Probe
• Target connectors on S32 Debug Probe
5.1 LEDs on S32 Debug Probe
This section lists the LEDs of the S32 Debug Probe.
The figure below shows the various LEDs of the S32 Debug Probe.
Figure 10. S32 Debug Probe - LED indicators
Page 20

S32 Debug Probe User Guide, Rev.1, 10/2018
NXP Semiconductors
25
Hardware Specifications
Transmit/Receive Indicator
Figure 11. S32 Debug Probe - Ethernet and USB connector
5.1.1 Transmit/Receive indicator
The (labeled TX/RX) indicates the status of communication between the probe and the network/host as follows:
• The LED is red until the probe boot code starts running.
• The LED flashes orange (1 Hz) during configuration of the network/USB interface.
• The LED flashes green (1 Hz) after network/USB interface has is successfully configured. During firmware updates, the
LED flashes green at a higher frequency (5Hz).
NOTE
Do not remove power, unplug the network, or press the reset button during firmware updates.
• The LED flashes orange when the S32 Debug Probe is communicating with the target.
• The LED is unlit if the probe is not powered on.
5.1.2 Run/Pause indicator
The status LED (labeled RUN/PAUSE) indicates the state of the target as follows:
• The LED is off when no target power is detected.
• The LED is green when the target is in run mode.
Page 21

S32 Debug Probe User Guide, Rev.1, 10/2018
NXP Semiconductors
26
Hardware Specifications
Host connectors on S32 Debug Probe
• The LED is red when the target is in pause mode.
• The LED is orange when the target is in mixed mode.
• The LED is initially unlit and remains so until the TX/RX LED starts flashing.
5.1.3 RJ45 Ethernet connector with link and activity indicators
The probe interface connects directly to 10/100 twisted pair networks. See Connecting to network topic for more
information on connecting to a network.
The S32 Debug Probe link and activity indicators are integrated into the RJ45 S32 Debug Probe connector. The yellow
indicator is turned on when the S32 Debug Probe is connected to any network, and flickers when data is being transferred
across the network. The green indicator is turned on when the S32 Debug Probe is connected to a 100BaseT network, and
flickers when data is being transferred across the network.
5.2 Host connectors on S32 Debug Probe
The figure below shows the host connectors of the S32 Debug Probe.
Figure 12. S32 Debug Probe - host side view
Page 22

S32 Debug Probe User Guide, Rev.1, 10/2018
NXP Semiconductors
27
Hardware Specifications
Physical Considerations
5.2.1 RJ45 Ethernet connector
The Ethernet connector on the S32 Debug Probe is used to connect to a 10/100BaseT Ethernet.
5.2.2 USB connector
The USB port on the S32 Debug Probe acts as both a virtual serial device and virtual Ethernet device. The virtual serial
interface is used for configuring network communication, entering routing tables, and for diagnostics. The virtual Ethernet
device is used by the debugger to communicate with the S32 Debug Probe.
5.3 Target connectors on S32 Debug Probe
The figure below shows the target connectors of the S32 Debug Probe.
Figure 13. S32 Debug Probe - target side view
Page 23

S32 Debug Probe User Guide, Rev.1, 10/2018
NXP Semiconductors
28
Hardware Specifications
Physical Considerations
5.3.1 Probe tip connector
The 30-pin debug port header is used to connect the probe to a debug port header on your target system.
NOTE
Ensure that Pin 1 of the probe tip is connected to the Pin 1 of the header.
The probe tip consists of a 6-inch or 12-inch ribbon cable with the appropriate debug adapter attached. The ribbon cable has a
red stripe down one side to indicate the location of pin 1.
5.3.2 Electrical characteristics
The probe affects the load on only those signals that are connected to the debug port connector. Loading depends on the
method used to connect the probe to the target system. See Connecting to the Target System topic for description of each
connection method.
The probe affects the target processor and target electrical characteristics. Caution should be taken in designing the target
to accommodate the small signal delays associated with in-circuit emulator or other test equipment.
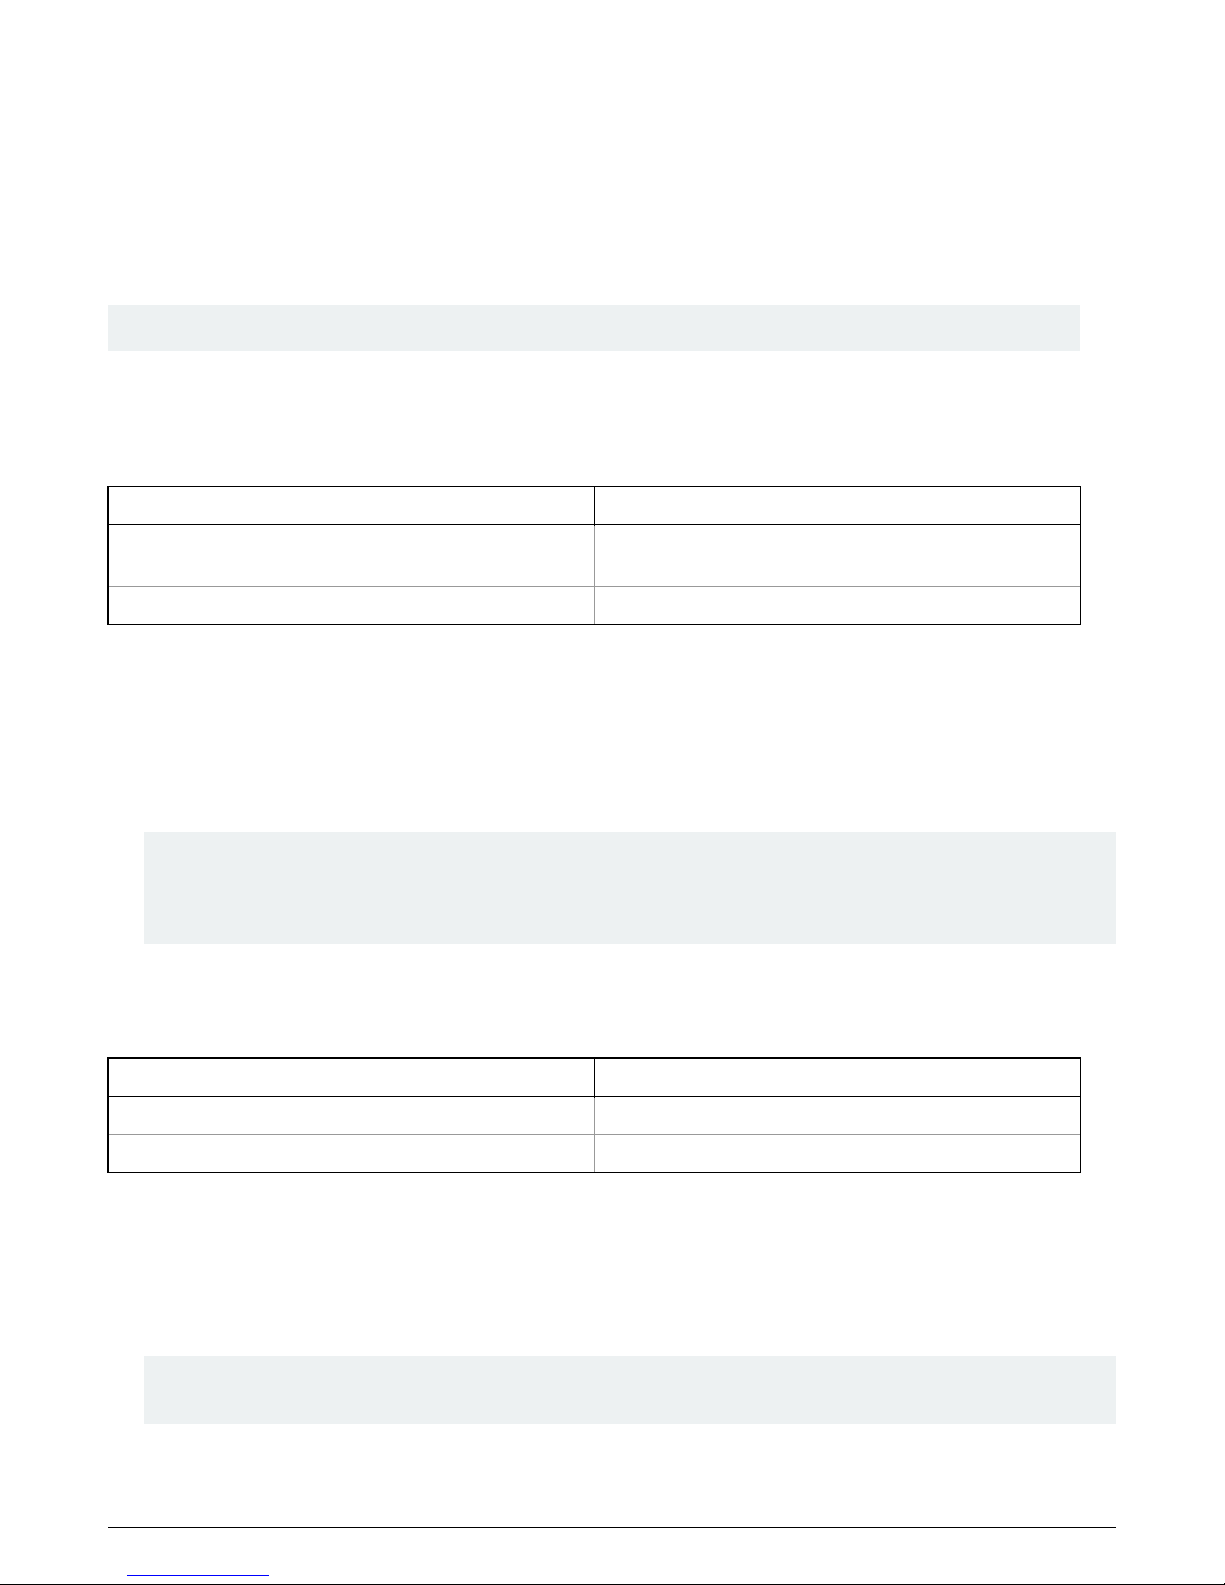
This table shows the electrical characteristics of the S32 Debug Probe.
Table 3. S32 Debug Probe - electrical characteristics
Electrical Characteristics
Target voltage levels supported
1.2V to 3.3V; 5V tolerant
probe power consumption from target
Less than 50 mA to detect target power
USB Power Supply
5V, 500mA
NOTE
Bus powered USB hubs are not designed to provide 500mA to devices. The S32 Debug Probe
must be directly connected to a self-powered hub, PC, or the AC adapter included in the kit.
5.3.3 Physical considerations
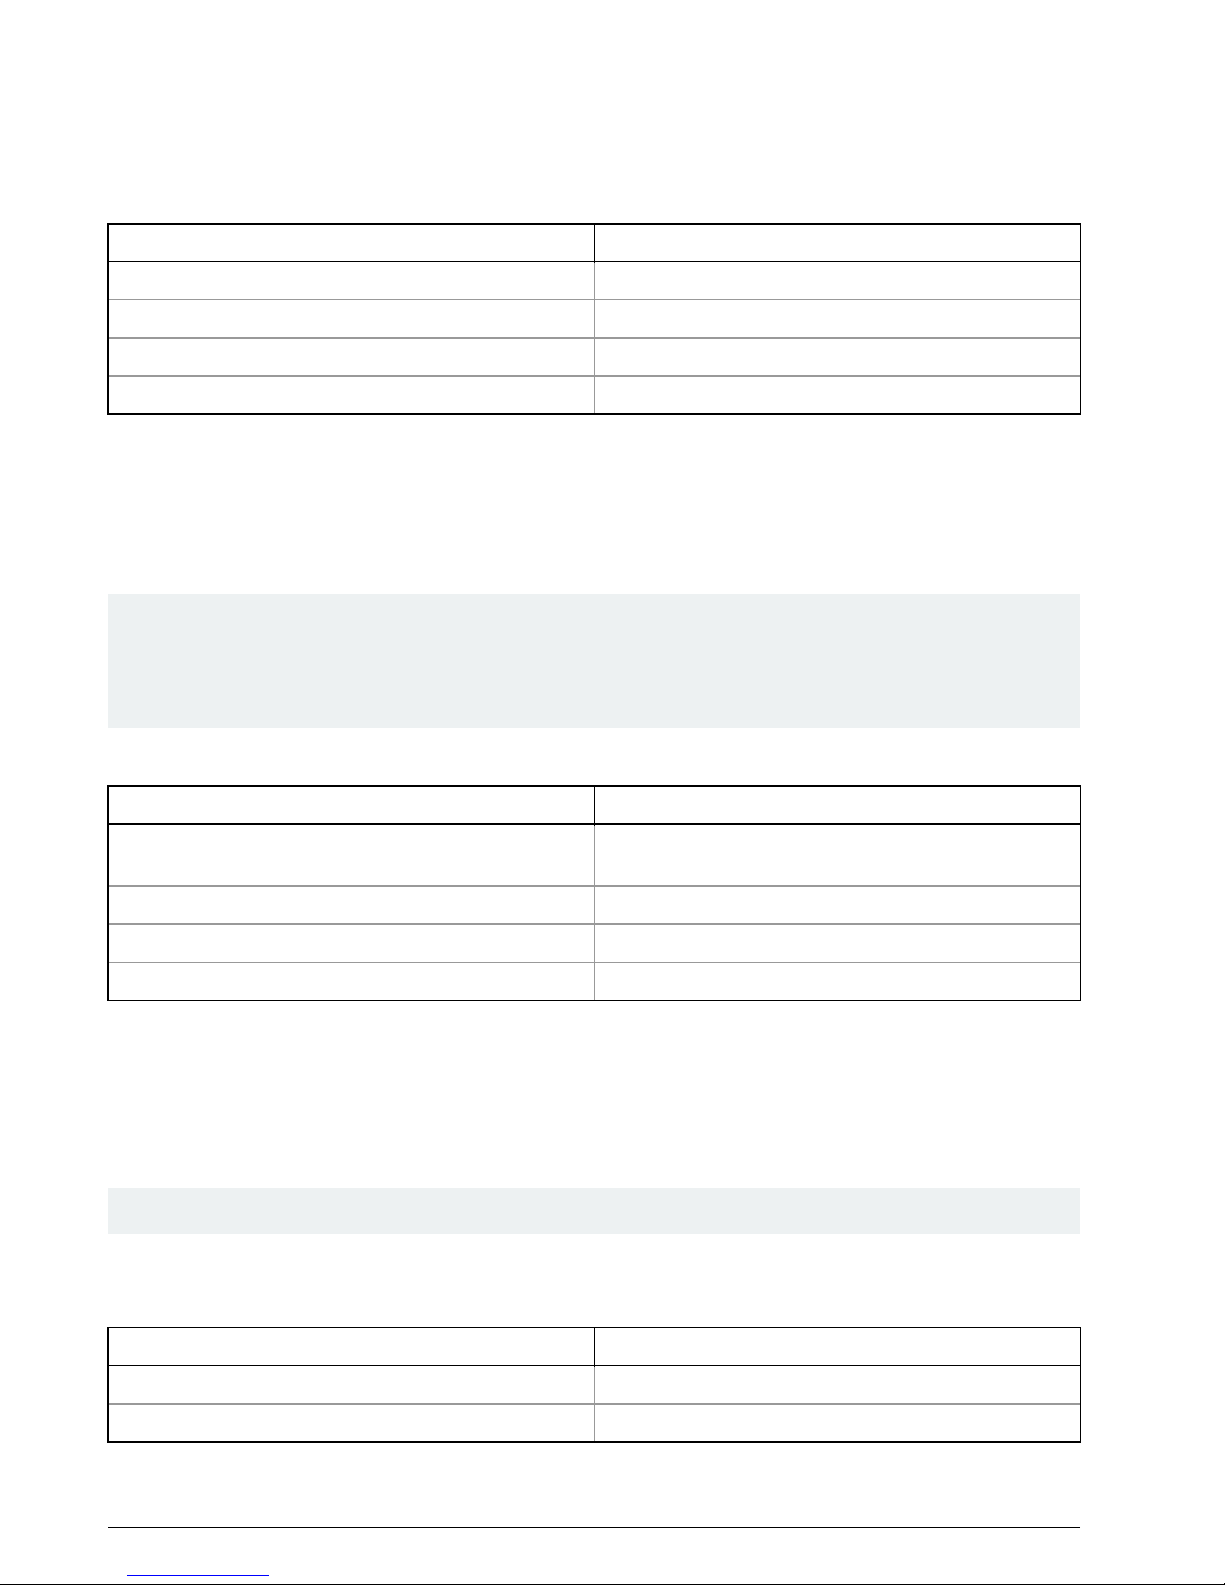
This table shows the physical characteristics of the probe.
Table 4. S32 Debug Probe - physical characteristics
Physical Characteristics
Environmental requirements
Operating temperature
0 to 40 ×C (32 to 104 ×F)
Storage temperature
-40 to 70 ×C (-40 to 158 ×F)
Humidity
5% to 95% relative humidity, non-condensing
Physical
probe dimensions
Table continues on the next page...
Page 24

S32 Debug Probe User Guide, Rev.1, 10/2018
NXP Semiconductors
29
Hardware Specifications
Physical Considerations
Table 4. S32 Debug Probe - physical characteristics (continued)
Physical Characteristics
Length
5.5" (7.5" with cables)
Width
3.25"
Height
1.375"
Probe tip cable socket dimensions
Height (above board)
0.375" (0.95 cm)
Thickness
0.20" (0.51 cm)
Pin-to-pin spacing
0.1" (0.25 cm)
Width
Number of Positions x 0.1" (0.25 cm) + 0.18" (0.46 cm)
Page 25

S32 Debug Probe User Guide, Rev.1, 10/2018
NXP Semiconductors
30
S32 Debug Probe Setup Utility Commands
S32 Debug Probe setup utility commands and variables
Chapter 6
S32 Debug Probe Setup Utility Commands
This chapter explains how to access the S32 Debug Probe internal setup utility.
It describes all available setup utility commands and arguments.
This chapter contains the following topics:
• Connecting to S32 Debug Probe setup utility
• S32 Debug Probe setup utility commands and variables
NOTE
The commands described in this chapter are for reference only. For detailed procedures on using
these commands, see specific chapter that covers the topic of interest.
6.1 Connecting to S32 Debug Probe setup utility
There are two methods for accessing the S32 Debug Probe internal setup utility. To
connect to the setup utility:
• Connect to the S32 Debug Probe USB port. Use this method if the S32 Debug Probe is not connected to your
network. For more information, see Customizing S32 Debug Probe topic.
• Telnet to the S32 Debug Probe through an existing Ethernet connection. Use this method if the S32 Debug Probe
probe is currently connected to your network.
Telnet is the Internet standard protocol for remote logins. Most TCP/IP networks provide a telnet program that you can use
to login across the network to another machine. Note that if you lose your Ethernet connection by improperly configuring
the S32 Debug Probe from a telnet session, then you will have to connect to the USB port to re-establish network
communications.
To connect to the setup utility using the telnet port:
1. Open a telnet session and connect to the S32 Debug Probe.
telnet hostname
Use the hostname that you entered into the hosts database file, for more details, see Connecting to network topic.
2. After the login banner is displayed, the core command-line prompt appears.
NOTE
Use the help command at the core> prompt for a list of all the internal S32 Debug Probe
commands available or use help and the command name for a brief description of the command
and a list of the command's arguments.
6.2 S32 Debug Probe setup utility commands and
variables
The S32 Debug Probe internal setup utility commands are for configuration and troubleshooting.
Page 26

S32 Debug Probe User Guide, Rev.1, 10/2018
NXP Semiconductors
31
S32 Debug Probe Setup Utility Commands
S32 Debug Probe setup utility commands and variables
6.2.1 Commands to configure communications
The following internal setup utility commands are used to configure the S32 Debug Probe for network communication
(netparam).
6.2.1.1 netparam
The netparam command displays or sets non-volatile networking parameters stored in the flash EPROM of S32 Debug
Probe. Entered without options, it displays all current settings. To change parameters, specify one or more options. To
activate new settings, the unit must be rebooted. For more information on netparam command, see Configuring S32 Debug
Probe using netparam topic.
Syntax
netparam [add_host host ip_address ] [add_route host gateway hop_# ]
[bootconfig {static | dhcp}[:host]]
[delete_host host ]
[delete_route host]
[static_ip_address address[:mask]]
[static_dns_server address]
Table 5. Netparam parameters
Field
Description
<null>
Reports the current configuration
add_host host ip_address
Adds a hostname-address pair to the static host table. Table
entries are automatically entered into the system on reset.
host - Name to associate with the address ip_address - IP
address to use for host, specified in dotted-decimal notation
add_route host gateway hop_#
Adds a route to S32 Debug Probe static route table. Table
entries are automatically entered into the system on reset. If
the specified parameters are invalid for the operating
network, they are not stored. host - Destination IP address
of host or host network, specified in dotted-decimal notation.
Default is a valid entry for host, and equivalent to 0.0.0.0.
gateway - Gateway IP address for probe, specified in dotted-
decimal notation hop_# - Decimal number of gateway hops
between S32 Debug Probe and destination host or network
Table continues on the next page...
Page 27

S32 Debug Probe User Guide, Rev.1, 10/2018
NXP Semiconductors
32
S32 Debug Probe Setup Utility Commands
S32 Debug Probe setup utility commands and variables
Table 5. Netparam parameters (continued)
Field
Description
bootconfig {static | dhcp }[:host]
Sets the IP address resolution protocol. It determines the
boot method of S32 Debug Probe. Use bootconfig to
connect to the network either by DHCP or by storing the IP
address in the flash EPROM of S32 Debug Probe. When
using DHCP, you can specify the host name that you would
like the probe to try to register with a name server when it
acquires its network configuration. The factory assigned
host name is FSLXXYYZZ, where XXYYZZ is the last three
octets of the MAC address, provided on a label on the bottom
side of the probe. For example, if the probe's MAC address
is 00:00:f6:00:77:31, the default host name will be
FSL007731. static - Use IP address stored in S32 Debug
Probe dhcp - Use the network DHCP protocol to resolve IP
address, netmask, and default gateway (default). host Host name for the S32 Debug Probe. Ifdhcp is specified,
the probe will attempt to register this host name with the
DHCP server. There should be no white space before:
host. The ccs findcc search utility will report the host
name of the probe for both the dhcp and static options
delete_host host
Deletes a hostname-address pair from the static host table.
host - Destination IP address of host or host network
delete_route
Deletes a route from the static route table host- Destination
IP address of host or host network
static_ip_address address [:mask]
Sets the S32 Debug Probe IP address and optional
netmask address - IP address in dotted-decimal format (for
example, 128.8.1.1). When entering the IP address by itself
(without also entering the netmask), the S32 Debug Probe
uses the standard netmask assigned to that IP address.
mask - Netmask in dotted-decimal format (for example,
255.255.0.0). If subnetting is required, you must store the
netmask by entering it on the same command line,
immediately following the IP address.
static_dns_server address
Sets the DNS server to use static bootconfig address - IP
address in dotted-decimal format (for example, 128.1.1). The
DNS server at this address will be used for domain name
resolution when bootconfig is set to static.
6.2.2 Commands to troubleshoot communication
The following commands are used to troubleshoot problems connecting to your network. The procedures for troubleshooting
communication are covered in the Troubleshooting topic.
NOTE
In this manual, commonly used options for these commands are described.
Page 28
S32 Debug Probe User Guide, Rev.1, 10/2018
NXP Semiconductors
33
S32 Debug Probe Setup Utility Commands
S32 Debug Probe setup utility commands and variables
6.2.2.1 arp
Use the arp command to edit the arp table by assigning hostnames to specific Ethernet addresses. Without options, it displays
the current arp table.
Syntax
arp [-s hostname ethernet _address | -d hostname]
Options
Table 7. ARP - options
Field
Description
-s hostname ethernet _address
Assign a hostname alias to an Ethernet address in the arp
table
-d hostname
Delete a hostname alias from the arp table
6.2.2.2 host
Use the host command to edit the host table by assigning hostnames to specific IP addresses without permanently storing
the routing tables in the flash EPROM of the S32 Debug Probe. Without options, it displays the current host table.
Syntax
host [add hostname ip_address | delete hostname ip_address]
Options
Table 8. Host - options
Field
Description
add hostname ip_address
Assign a hostname alias to an IP address in the host table.
delete hostname ip_address
Delete a hostname alias from the host table.
6.2.2.3 netstat
Displays network information and statistics.
Syntax
netstat -a --inet | -i | -s | -r
Page 29
S32 Debug Probe User Guide, Rev.1, 10/2018
NXP Semiconductors
34
S32 Debug Probe Setup Utility Commands
S32 Debug Probe setup utility commands and variables
Options
Table 9. Netsat - options
Field
Description
-a --inet
Display network connections
-i
Display device status
-s
Display protocol statistics
-r
Display route table
6.2.2.4 ping
Use the ping command to verify that the S32 Debug Probe is connected to your network.
Syntax
ping [-s size] [-c cnt][hostname | ip_address]
Table 10. Ping - options
Field
Description
hostname
Use the hostname stored in S32 Debug Probe host table
(see the host command).
ip_address
Use the IP address of the host you are trying to reach.
size
The size, in bytes, to use for request packets.
cnt
The number of packets to send.
6.2.2.5 route
Use the route command to test network routing without permanently storing the routing tables in the S32 Debug Probe flash
EPROM. Without options, it displays the current route table or default gateway.
Syntax
route [add destination gateway | delete destination]
Options
Table 11. Route - options
Field
Description
add destination gateway
Add a dynamic route to the route table.
delete destination
Delete a dynamic route from the route table.
Page 30

S32 Debug Probe User Guide, Rev.1, 10/2018
NXP Semiconductors
35
Network Administration
Chapter 7
Network Administration
S32 Debug Probe network ports
This chapter guides the network administrators in installing S32 Debug Probe.
The S32 Debug Probe is a host device that may be configured for TCP/IP using DHCP to acquire its IP configuration (the
default method) or through a static IP configuration.
This chapter contains the following sections:
• S32 Debug Probe network ports
• Configuring S32 Debug Probe using netparam
• Using CCS to search for S32 Debug Probes
7.1 S32 Debug Probe network ports
Software uses several network ports to communicate with S32 Debug Probe. In case the S32 Debug Probe and host
software are on the same network, you do not need to be aware of these ports.
However, in case where a S32 Debug Probe is located in a protected network, an administrator will need to provide access
to these ports if you want to connect to the S32 Debug Probe from another network. This table lists the ports used by the
S32 Debug Probe and a brief description of each port.
Table 12. S32 Debug Probe network ports
Port number
Description
23
Telnet access to configuration console
1087
Used for firmware updates and by S32DS to initialize the
probe
41474
Used by S32DS to control the S32 Debug Probe
7.2 Configuring S32 Debug Probe using netparam
Use the netparam command to select the network parameters:
• Address resolution protocol
• Static address resolution data
• Static routing tables
CAUTION
netparam writes its settings into non-volatile flash memory on the S32 Debug Probe. Each time
you enter a netparam command, wait for the core> prompt to re-appear before entering the
next command.
Page 31

S32 Debug Probe User Guide, Rev.1, 10/2018
NXP Semiconductors
36
Network Administration
7.2.1 Configuring dynamic IP address
To configure a dynamic IP address:
1. Connect to the S32 Debug Probe internal setup utility, as explained in the Connecting to S32 Debug Probe setup utility
topic.
2. At the core prompt, use netparam to specify the protocol appropriate to your network:
netparam bootconfig dhcp[:hostname]
DHCP is the default setting. If you specify a hostname for the S32 Debug Probe, the probe will attempt to register the
host name with the DHCP server, which may then update any name servers on the network.
7.2.2 Configuring static IP address
If you do not have a DHCP server on your network or you prefer to manually configure your network settings, the S32 Debug
Probe is capable of storing its IP address and netmask in flash memory. When bootconfig is set to static, the S32 Debug Probe
uses this stored information to resolve its own IP and netmask requests.
NOTE
Because this is a simple proven way to add a S32 Debug Probe to any TCP/IP network, we
strongly recommend using it if you have any network communication problems.
To enter the IP and optional netmask in flash:
1. Have your network administrator assign an unused IP address and host name to the probe.
2. Enter the name/address pair into the hosts database file. Windows hosts files are typically located in the
%system_root%\system32\drivers\etc\ directory.
NOTE
You should create or update the hosts file on the network server or on each local workstation
that needs access to the probe.
3. At the core> prompt, use netparam to set and store the IP address and netmask (subnetting only) in the S32 Debug
Probe flash EPROM.
netparam static_ip_address
nnn.nnn.nnn.nnn [:mmm.mmm.mmm.mmm]
where nnn.nnn.nnn.nnn represents the IP address and mmm.mmm.mmm.mmm represents the subnetting mask.
Page 32

S32 Debug Probe User Guide, Rev.1, 10/2018
NXP Semiconductors
37
Network Administration
7.2.3 Static routing
Configuring S32 Debug Probe using netparam
The simplest networks consist of one or more subnets. Routers forward network traffic from one point on the network to
another across these subnets.
If the S32 Debug Probe uses DHCP to automatically acquire its network settings, it is most likely that a default gateway
setting was acquired and the probe will be accessible on other subnets.
However, when using a static IP configuration or where the DHCP configuration is incomplete, you may have to provide
additional routing information, including:
• Store a default gateway in flash memory
• Load static routing tables into flash memory
7.2.3.1 Specify default gateway or static route table (optional)
If you are using a static IP configuration or your DHCP configuration does not specify a default gateway, you can manually
enter the IP address of the default gateway to use. This gateway must be accessible on your local subnet.
To specify a default gateway:
A default gateway entry must specify the IP address of the first gateway that the network traffic from probe crosses. This
gateway must be aware of the network's complete route table. Use the following netparam syntax:
netparam add_route 0.0.0.0 gateway_ip 1
For gateway_ip , provide the IP address of the router or gateway in dot notation. The default value is 0.0.0.0 .
7.2.4 Changing existing route entry
NOTE
When entered in the S32 Debug Probe, static routes are not updated automatically. You must update
these routes if changes in network topology affect the static routes.
Before entering the static routes, make a map of all gateway paths between the S32 Debug Probe as starting point and
each workstation that must have access to it.
To change an existing routing entry:
1. At the core> prompt, delete the existing routing entry:
netparam delete_route host_ip
2. Enter the new route as described above:
netparam add_route host_ip gateway_ip hop_#
NOTE
host_ip can identify an individual workstation or a network serving multiple hosts. The
gateway_ip is the first gateway the probe traffic crosses when communicating with the
destination workstation. The hop_# is the decimal number of gateways between the probe and
the destination workstation.
7.2.5 Entering static routes
NOTE
When entered in the S32 Debug Probe, static routes are not updated automatically. You must update
these routes if changes in network topology affect the static routes.
Page 33

S32 Debug Probe User Guide, Rev.1, 10/2018
NXP Semiconductors
38
Network Administration
Before entering the static routes, make a map of all gateway paths between the S32 Debug Probe, as starting point, and
ensure each workstation has access to it.
To enter a static route or default gateway:
1. At the core> prompt, use the netparam command to enter the first host/gateway pair:
netparam add_route host_ip gateway_ip hop_#
Wait for the core> prompt between each netparam entry.
NOTE
host_ip can identify an individual host or a network serving multiple hosts. The gateway_ip is
the first gateway the S32 Debug Probe crosses when communicating with the destination host. The
hop_# is the decimal number of gateways between the S32 Debug Probe and the destination
host. For more details on netparam command, see S32 Debug Probe setup utility commands
topic.
2. Add routes until all destination hosts or networks are defined.
3. When the core> prompt returns, reset the S32 Debug Probe by cycling power, or by entering the reset
command.
7.3 Using CCS to search for S32 Debug Probes
The CCS is a component of the S32 Debugger and it is included in the S32 Design Studio. The CCS console provides a
findcc command line utility which searches for all the S32 Debug Probes on the local subnet of each network interface of the
host and lists the probes' IP addresses, as well as other information. It uses mDNS multicast packets to discover S32 Debug
Probe devices. Multicast packets are typically limited to the local subnet and typically are not routed or passed through VPNs.
If your S32 Debug Probe acquires its IP address using DHCP, but is not able to register its host name on the network, you
will need the probe's IP address. To find the probe's address, perform the following steps:
1. Launch CCS and open the CCS Command window. The procedure is slightly different on Windows and Linux/Solaris
host machines.
• For Windows, run the command: ccs\bin\ccs.exe
This will launch CCS and add a CCS icon (see CCS icon topic) to your taskbar. Double-click that icon in the taskbar to
open the Command window.
• For Linux, run the command: ccs/bin/ccs
This will launch CCS and open the Command window automatically.
Figure 17. CCS icon
2. The findcc command takes the following arguments when searching for S32 Debug Probes:
findcc S32dbg [-quiet|-verbose]
Page 34

S32 Debug Probe User Guide, Rev.1, 10/2018
NXP Semiconductors
39
Network Administration
Using CCS to search for S32 Debug Probes
7.3.1 Sample output
% findcc s32dbg
FSL04CC99 (10.222.24.220): S32 Debug Probe (3.3V)
Cortex-10 Probe Tip
Boot Loader v1.0.1
Operating System v1.0.5
Page 35

S32 Debug Probe User Guide, Rev.1, 10/2018
NXP Semiconductors
40
Chapter 8
S32 Debug Probe Firmware
This chapter explains the methods for reprogramming the Boot Loader and Operating System images stored in the flash
EPROM of the S32 Debug Probe.
Before reprogramming the flash EPROM, make sure you have already configured the S32 Debug Probe network
communication.
This chapter contains the following sections:
• Boot Loader
• Reprogramming S32 Debug Probe firmware images
8.1 Boot loader
The S32 Debug Probe Boot Loader image performs hardware initialization and starts up the OS.
When the S32 Debug Probe first powers up, it ex ecutes the Boot Loader. This occurs while the heartbeat LED is solid red.
The Boot Loader is not generally visible to the user and should rarely require reprogramming or updating. If an update is
required, see Reprogramming firmware through Ethernet port topic.
8.1.1 Operating system
The S32 Debug Probe OS image provides tools for configuring and testing network communication, for re-loading the
probe software and the underlying software framework required to work with the debugger.
When the S32 Debug Probe finishes ex ecuting the Boot Loader, it loads the OS. This is indicated by the core prompt in the
S32 Debug Probe’s setup utility, and by flashing a orange or green heartbeat LED. To reprogram the OS image stored in the
S32 Debug Probe flash EPROM, see Reprogramming S32 Debug Probe firmware images topic.
8.1.2 Shell software
The S32 Debug Probe shell software is transparent to the user, and the application tells the probe how to control the target
system. It recognizes the specific target system processor and debug port interface and carries out the instructions of the
debugger. The shell software is automatically stored and updated in flash, and therefore does not require manual
reprogramming.
8.2 Reprogramming S32 Debug Probe firmware images
You need to reprogram S32 Debug Probe firmware images when you are installing an update to existing software
At some point, you may be required to reprogram the S32 Debug Probe firmware images stored in its flash EPROM.
Typically, this occurs when you are installing an update to existing software, and the release letter specifies a later version of
probe Boot Loader or Operating System software. The firmware is distributed in two images:
• s32dbg_bl.gp contains the Boot Loader
• s32dbg_os.gp contains the Operating System
A flash file loader (updates32dbg) utility is included with the debugger software. Updates32dbg provides the ability to
reprogram the S32 Debug Probe firmware images stored in its flash EPROM.
Page 36

S32 Debug Probe User Guide, Rev.1, 10/2018
NXP Semiconductors
44
S32 Debug Probe Firmware (Core)
Reprogramming Firmware through Ethernet Port
8.2.1 Reprogramming Firmware through Ethernet Port
In order to use the following instructions, the S32 Debug Probe communications must already be configured (see
Connecting to network topic).
To reprogram the firmware image:
1. Launch CCS and open the CCS command window. For information on launching CCS, see Using CCS to search for
S32 Debug Probes topic.
2. In the CCS Command window, enter the command:
updates32sbg {hostname | ip_address}
3. As it executes, updates32dbg reports its progress. When the process is complete, updates32dbg reports:
All updates completed successfully.
CAUTION
Do nothing to disrupt operation while running the updates32dbg command. The heartbeat LED
will flash at a faster frequency while the update is in progress, and the probe will automatically
reboot when the update is complete. Power failures, network disruptions, and S32 Debug Probe
resets during an update and can create a non-working state that may require factory repair.
These procedures must be performed on each S32 Debug Probe that you plan to use with the current version of
debugger.
Page 37

S32 Debug Probe User Guide, Rev.1, 10/2018
NXP Semiconductors
45
Arm CoreSight Connector Information
Arm pins
Signal mnemonics
Signal directions
Description
1
VTREF
From target system
2Mohm pull-down, plus
0.01F load
2
TMS
From S32 Debug Probe
connector
50mA driver
3
GND
- n/a -
-
4
TCK
From S32 Debug Probe
connector
50mA driver
5
GND
- n/a -
- 6 TDO
From target system
17pF load
Table continues on the next page...
Chapter 11
Arm CoreSight Connector Information
Figure 20. S32 Debug Probe for Arm connector pin assignments on page 54 image shows the pin assignments of the
probe Arm CoreSight connector.
Table 17. S32 Debug Probe for Arm signal directions on page 54 lists Arm signal names, direction, pin numbers,
descriptions, and drive capabilities for the probe Arm CoreSight connector.
Table 18. S32 Debug Probe for Arm signal recommendations and requirements on page 55 provides a general
description of each Arm signal and the operational requirements.
NOTE
All Arm signals must meet accepted standards for Arm signal design. To ensure proper and stable
operation between the S32 Debug Probe and the target system, the Arm signals must meet the
requirements listed in Table 18. S32 Debug probe for Arm signal recommendations and
requirements on page 55
TMS
2
TCK 4
TDO 6
TDI 8
SRST 10
1 VTREF
3
GND
5 GND
7 No Connect
9 GND_DETECT
Figure 20. S32 Debug Probe for Arm connector pin assignments Table
17. S32 Debug Probe for Arm signal directions
Page 38

S32 Debug Probe User Guide, Rev.1, 10/2018
NXP Semiconductors
46
Arm CoreSight Connector Information
Table 17. S32 Debug Probe for Arm signal directions (continued)
Arm pins
Signal mnemonics
Signal directions
Description
7
No Connect
- n/a -
-
8
TDI
From S32 Debug Probe
connector
50mA driver
9
GND_DETECT
From S32 Debug Probe
connector
Grounded by S32 Debug
Probe
10
SRST_B
Bi-directional
Open-drain. 5ohm to ground
when asserted by S32
Debug Probe, 22pF load
when not asserted
Table 18. S32 Debug Probe for Arm signal recommendations and requirements
Arm pins
Signal mnemonics
Requirements
1
VTREF
Must be wired to the target sy stem. The
S32 Debug Probe uses this signal to
determine if power is applied to the
target system. This signal is also used
as a voltage reference for the signals
driven by the S32 Debug Probe
(CKSI_B, TRST_B, TCK, TMS, TDI).
TGT PWR (pin 6) should be connected
to the target system Vcc through a pullup resistor. The S32 Debug Probe will
draw less than 50 A from this signal, so
a weak pullup is sufficient (1KOhm).
2
TMS
Must be wired to the target system
processor. The S32 Debug Probe drives
the TMS output with up to 50mA. TMS
should be kept as short as possible
and maintain a "twosignal- width"
spacing from any other parallel
dynamic signal trace. TMS should have
a termination option at the processor.
3
GND
Must be wired to the target system.
GND is connected directly to the ground
inside the S32 Debug Probe.
4
TCK
Must be wired to the target system
processor. The S32 Debug Probe drives
the TCK output with up to 50mA. The
TCK trace run should be kept as short
as possible, and should maintain a
"two-signal-width" spacing from any
other parallel dynamic signal trace.
Table continues on the next page...
Page 39

S32 Debug Probe User Guide, Rev.1, 10/2018
NXP Semiconductors
47
Arm CoreSight Connector Information
Table 18. S32 Debug Probe for Arm signal recommendations and requirements (continued)
Arm pins
Signal mnemonics
Requirements
5
GND
Must be wired to the target system.
GND is connected directly to the ground
inside the S32 Debug Probe.
6
TDO
Must be wired to the target system
processor. TDO is an output from the
target system processor and an input to
the S32 Debug Probe. The TDO trace
run should be kept short and should
maintain a "two-signalwidth" spacing
from any other parallel dynamic signal
trace. TDO should have a series
termination resistor located near the
target system processor.
7
No Connect
Not required for emulation.
8
TDI
Must be wired to the target system
processor. The S32 Debug Probe drives
the TDI output with up to 50mA. The
TDI trace should be kept short and
should maintain a "twosignal- width"
spacing from any other parallel dynamic
signal trace. TDI should have an RC
termination option at the processor.
9
GND_DETECT
Target can use a pull-up to detect
presence of a JTAG probe. If this
functionality is not needed, targets
should also ground this pin.
10
SRST_B
May be wired to the target sy stem
processor. During reset, the S32 Debug
Probe drives SRST_B to ground
through a 5Ohm resistor.
Page 40

S32 Debug Probe User Guide, Rev.1, 10/2018
NXP Semiconductors
57
Troubleshooting
Troubleshooting communications problems
Chapter 12
Troubleshooting
This chapter provides S32 Debug Probe troubleshooting information. This
chapter contains the following topics:
• Troubleshooting communications problems
• Troubleshooting power problems
12.1 Troubleshooting communication problems
You will understand how to troubleshoot the communication problems between the debugger and the S32 Debug Probe.
If the debugger is unable to communicate with the S32 Debug Probe:
• Check the cable and connections between the network cable and the S32 Debug Probe.
The S32 Debug Probe connects directly to networks that use twisted pair (10/100BaseT) cables.
• Make sure communication was configured correctly for your network.
• Make sure the S32 Debug Probe probe is receiving power. See LEDs on S32 Debug Probe topic for a description of
the status LEDs.
• Make sure the S32 Debug Probe is running the OS software. For more information on loading the OS software, see
S32 Debug Probe firmware topic.
• Use the communication troubleshooting utilities of S32 Debug Probe to verify that it is recognized on your
network, or to help diagnose problems connecting to your network.
To troubleshoot communication, see Verify network communication topic. To list all the S32 Debug Probes on your local
subnets, use the CCS findcc host utility. See Using CCS to search for S32 Debug Probes topic.
• Make sure the debugger is set up correctly for Ethernet communication with the S32 Debug Probe.
If all the settings are correct and the debugger cannot communicate with the S32 Debug Probe, contact the Customer
Support for assistance.
12.1.1 Verify network communication
If you want to verify that the S32 Debug Probe is up and running on your network, enter the ping command at the core
prompt of the S32 Debug Probe.
To verify network communication:
1. Connect to the S32 Debug Probe internal setup utility, see Connecting to S32 Debug Probe setup utility
topic.
2. Verify communication by entering this command at the core> prompt:
ping ipaddress | hostname
For example, to ping a hostname, named my_probe at IP address 128.9.230.61, enter the command as follows:
ping 128.9.230.61
Page 41

S32 Debug Probe User Guide, Rev.1, 10/2018
NXP Semiconductors
58
Troubleshooting
Troubleshooting communications problems
- or -
ping my_probe
NOTE
When establishing communication, you will have to ping the IP address that was used during the
setup process, as the S32 Debug Probe may not automatically recognize the hostname. To ping a
hostname, the S32 Debug Probe internal host table must first be updated.
12.1.2 View network connections
If you want to check your network configuration and activity, use the netstat command. This command displays all the
network statistics on active connections such as their current status, all hosts that are connected, and which programs are
running. You can also see information about the routing table and even get statistics on your network interfaces.
To run the netstat command:
1. Connect to the internal setup utility of S32 Debug Probe.
2. At the core prompt, enter the netstat command using this syntax:
netstat -s
The output of this command indicates whether any data is being sent or received over the network. For description of the
netstat options, see netstat topic.
12.2 Troubleshooting power problems
If the S32 Debug Probe behaves erratically, check the connections to the external power supply.
The LED labeled HEARTBEAT indicates whether the S32 Debug Probe is receiving power. If this LED is not lit, check the
connections to the external power supply.
Page 42

S32 Debug Probe User Guide, Rev.1, 10/2018
NXP Semiconductors
59
Index
Index
A
Accessing S32 Debug Probe Remotely 23
Arm Connector Information 54
arp 34
B
Boot loader 43
C
CCS Remote Connection 22
Changing existing route entry 39
S32 Debug Probe benefits 6
S32 Debug Probe Firmware 43
S32 Debug Probe network ports 37
S32 Debug Probe Setup Utility Commands 31
S32 Debug Probe setup utility commands and
variables 31
Commands to configure communications 32
Commands to troubleshoot communication 34
Configuring S32 Debug Probe using netparam 37
Configuring dynamic IP address 38
Configuring static IP address 38
Connecting S32 Debug Probe to network 10
Connecting S32 Debug Probe to target system 18
Connecting power supply cable 7
Connecting probe tip to target 16
Connecting to S32 Debug Probe probe setup utility 31
Connecting to Network 10
Connecting to target sy stem 15
Connecting to Target System 15
Customizing S32 Debug Probe 12
Cycling Power to the System 8
D
Debug port connector information 15
Debugging with S32 Debug Probe system 21
DHCP 10
E
Electrical characteristics 29
Electrical requirements 7
Entering static routes 39
ESD precautions 6
H
Hardware Specifications 24
host 35
Host connectors on S32 Debug Probe 26
I
Introducing S32 Debug Probe 4
L
LEDs on S32 Debug Probe 24
N
netparam 32
netstat 35
Network Administration 37
O
Operating requirements 6
Operating system 43
Operating temperature 7
P
Physical considerations 29
ping 35
Probe tip connector 28
Product highlights 5
R
Related documentation 9
Reprogramming S32 Debug Probe firmware images
43
Reprogramming Firmware through Ethernet Port 44
RJ45 connector 26
RJ45 Ethernet connector 27
RJ45 Ethernet connector with link and activity indicators 26
route 36
Run/Pause indicator 25
Run/Pause LED 21
Page 43

S32 Debug Probe User Guide, Rev.1, 10/2018
NXP Semiconductors
60
Index
Run/Pause/Mixed mode states 21
S
Sample output 42
Shell software 43
Specify default gateway or static route table (optional) 39
Standard electrostatic precautions 6
Static route example 40
Static routing 39
T
Target connections 6
Target connectors on S32 Debug Probe 27
TCP/IP 10
Testing network communication 14
The Debugging environment 6
Transmit/Receive indicator 25
Transmit/Receive LED 25
Troubleshooting 57
Troubleshooting communications problems 57
Troubleshooting power problems 58
U
USB cable 7
USB connector 27
Using CCS to search for S32 Debug Probes 41
Using S32 Debug Probe 21
V
Verify network communication 57
View network connections 58
W
What is S32 Debug Probe? 4
Page 44

S32 Debug Probe User Guide, Rev.1, 10/2018
NXP Semiconductors
61
How To Reach Us
Home Page:
nxp.com
Web Support:
nxp.com/support
Information in this document is provided solely to enable system and software implementers
to use NXP products. There are no express or implied copyright licenses granted hereunder
to design or fabricate any integrated circuits based on the information in this document. NXP
reserves the right to make changes without further notice to any products herein.
NXP makes no warranty, representation, or guarantee regarding the suitability of its products
for any particular purpose, nor does NXP assume any liability arising out of the application
or use of any product or circuit, and specifically disclaims any and all liability, including without
limitation consequential or incidental damages. “Typical” parameters that may be provided in
NXP data sheets and/or specifications can and do vary in different applications, and actual
performance may vary over time. All operating parameters, including “typicals,” must be
validated for each customer application by customer's technical experts. NXP does not convey
any license under its patent rights nor the rights of others. NXP sells products pursuant to
standard terms and conditions of sale, which can be found at the following address: nxp.com/
SalesTermsandConditions.
NXP, the NXP logo, NXP SECURE CONNECTIONS FOR A SMARTER WORLD, Freescale, the
Freescale logo are the trademarks of NXP B.V. All other product or service names are the
property of their respective owners. Arm, the Arm logo, and Cortex are registered trademarks of
Arm Limited (or its subsidiaries) in the EU and/or elsewhere. All rights reserved.
© 2018 NXP B.V
Document Number: S32DBGUG
Rev. 1
10/2018
 Loading...