

Page 1

Information
MINIATURE SIGNAL RELAYS
ED2 SERIES (DIP TYPE)
EF2 SERIES (SMD TYPE)
TECHNICAL DATA
Document No. 0172EMDD03VOL01E
Date Published July 2002 P
Printed in Japan
Page 2

[MEMO]
2
Page 3

The information in this document is based on documents issued in July, 1999 at the latest.
The information is subject to change without notice. For actual design-in refer to the latest publications
of data sheet, etc., for the most up-date specifications of the device.
No part of this document may be copied or reproduced in any form or by any means without the
prior written consent of NEC/TOKIN Corporation. NEC/TOKIN Corporation assumes no responsibility
for any errors which may appear in this document.
NEC/TOKIN Corporation does not assume any liability for infringement of patents, copyrights or
other intellectual property rights of third parties by or arising from use of a device described herein
or any other liability arising from use of such device. No license, either express, implied or
otherwise, is granted under any patents, copyrights or other intellectual property rights of NEC
/TOKIN Corporation or others.
While NEC/TOKIN Corporation has been making continuous effort to enhance the reliability of its
electronic components, the possibility of defects cannot be eliminated entirely. To minimize risks
of damage or injury to persons or property arising from a defect in an NEC/TOKIN electronic component,
customers must incorporate sufficient safety measures in its design, such as redundancy, firecontainment, and anti-failure features. NEC/TOKIN devices are classified into the following three
quality grades:
"Standard," "Special," and "Specific". The Specific quality grade applies only to devices
developed based on a customer designated "Quality assurance program" for a specific
application. The recommended applications of a device depend on its quality grade, as indicated
below. Customers must check the quality grade of each device before using it in a particular
application.
Standard: Computers, office equipment, communications equipment, test and measurement
equipment, audio and visual equipment, home electronic appliances, machine tools,
personal electronic equipment and industrial robots
Special: Transportation equipment (automobiles, trains, ships, etc.), traffic control systems,
anti-disaster systems, anti-crime systems, safety equipment and medical
equipment (not specifically designed for life support)
Specific: Aircrafts, aerospace equipment, submersible repeaters, nuclear reactor control
systems, life support systems or medical equipment for life support, etc.
The quality grade of NEC/TOKIN devices is "Standard" unless otherwise specified in NEC/TOKIN’s
Data Sheets or Data Books. If customers intend to use NEC/TOKIN devices for applications other
than those specified for Standard quality grade, they should contact an NEC/TOKIN sales representative
in advance.
(Note)
(1) "NEC/TOKIN" as used in this statement means NEC/TOKIN Corporation and also includes
its majority-owned subsidiaries.
(2) "NEC/TOKIN electronic component products" means any electronic component product developed
or manufactured by or for NEC/TOKIN (as defined above).
DE0102
3
Page 4

[MEMO]
4
Page 5

CONTENTS
1. Preface........................................................................................................................................... 7
2. Structure........................................................................................................................................ 8
3. Basic Characteristics ................................................................................................................... 9
3.1 Switching power ..................................................................................................................................... 9
3.2 Maximum coil voltage ............................................................................................................................. 9
3.3 Coil temperature rise .............................................................................................................................. 10
3.4 Driving power vs. timing ......................................................................................................................... 11
3.5 Thermal characteristics .......................................................................................................................... 12
3.6 Magnetic interference ............................................................................................................................. 13
3.7 High-frequency characteristics ............................................................................................................... 14
3.8 Coil inductance ....................................................................................................................................... 15
3.8.1 Measurement by LCR meter ...................................................................................................... 15
3.8.2 Measurement by coil current waveform ..................................................................................... 15
3.9 Capacitance ........................................................................................................................................... 16
3.10 Resistance to surge voltage ................................................................................................................... 17
3.11 Resistance to carrying current................................................................................................................ 18
4. Distribution of Characteristics..................................................................................................... 19
4.1 Operate & release voltages (set & reset voltages) ................................................................................. 19
4.2 Operate & release times (set & reset times) .......................................................................................... 20
4.3 Transfer time .......................................................................................................................................... 21
4.4 Timing and details .................................................................................................................................. 22
4.5 Contact resistance.................................................................................................................................. 26
4.6 Breakdown voltage ................................................................................................................................. 27
4.7 Thermal Electromotive Force (EMF) (offset voltage between contacts) ................................................ 27
5. Test Data ....................................................................................................................................... 28
5.1 Environmental tests ................................................................................................................................ 29
5.1.1 High-temperature test ................................................................................................................. 29
5.1.2 Low-temperature test ................................................................................................................. 31
5.1.3 Moisture resistance test ............................................................................................................. 32
5.1.4 Heat shock test ........................................................................................................................... 33
5.1.5 Vibration test .............................................................................................................................. 34
5.1.6 Shock test ................................................................................................................................... 35
5.1.7 Resistance to solder heat test (only ED2 series) ....................................................................... 36
5.1.8 Resistance to reflow solder heat test (only EF2 series) ............................................................. 37
5.1.9 Terminal strength test (only ED2 series) .................................................................................... 39
5.2 Contact life tests ..................................................................................................................................... 40
5.2.1 Non-load test (Mechanical life test, T
5.2.2 Resistive load test A (10 vdc, 10 mA, Ta = 85°C) ....................................................................... 41
5.2.3 Resistive load test B (50 vdc, 110 mA, Ta = 25°C) ..................................................................... 41
5.2.4 Resistive load test C (30 vdc, 1 A, Ta = 25°C) ........................................................................... 42
a = 25°C) .......................................................................... 40
5
Page 6

[MEMO]71. Preface
6
Page 7
Miniature signal relays are used in a wide range of application fields including communication, measurement, and
factory automation. This document gives the basic characteristics and test data of NEC’s ED2 and EF2 series
miniature signal relays.
Notes 1. The symbo
Likewise,
shown in the graphs throughout this document indicates the maximum value of the data.
indicates the minimum value, and indicates the mean value.
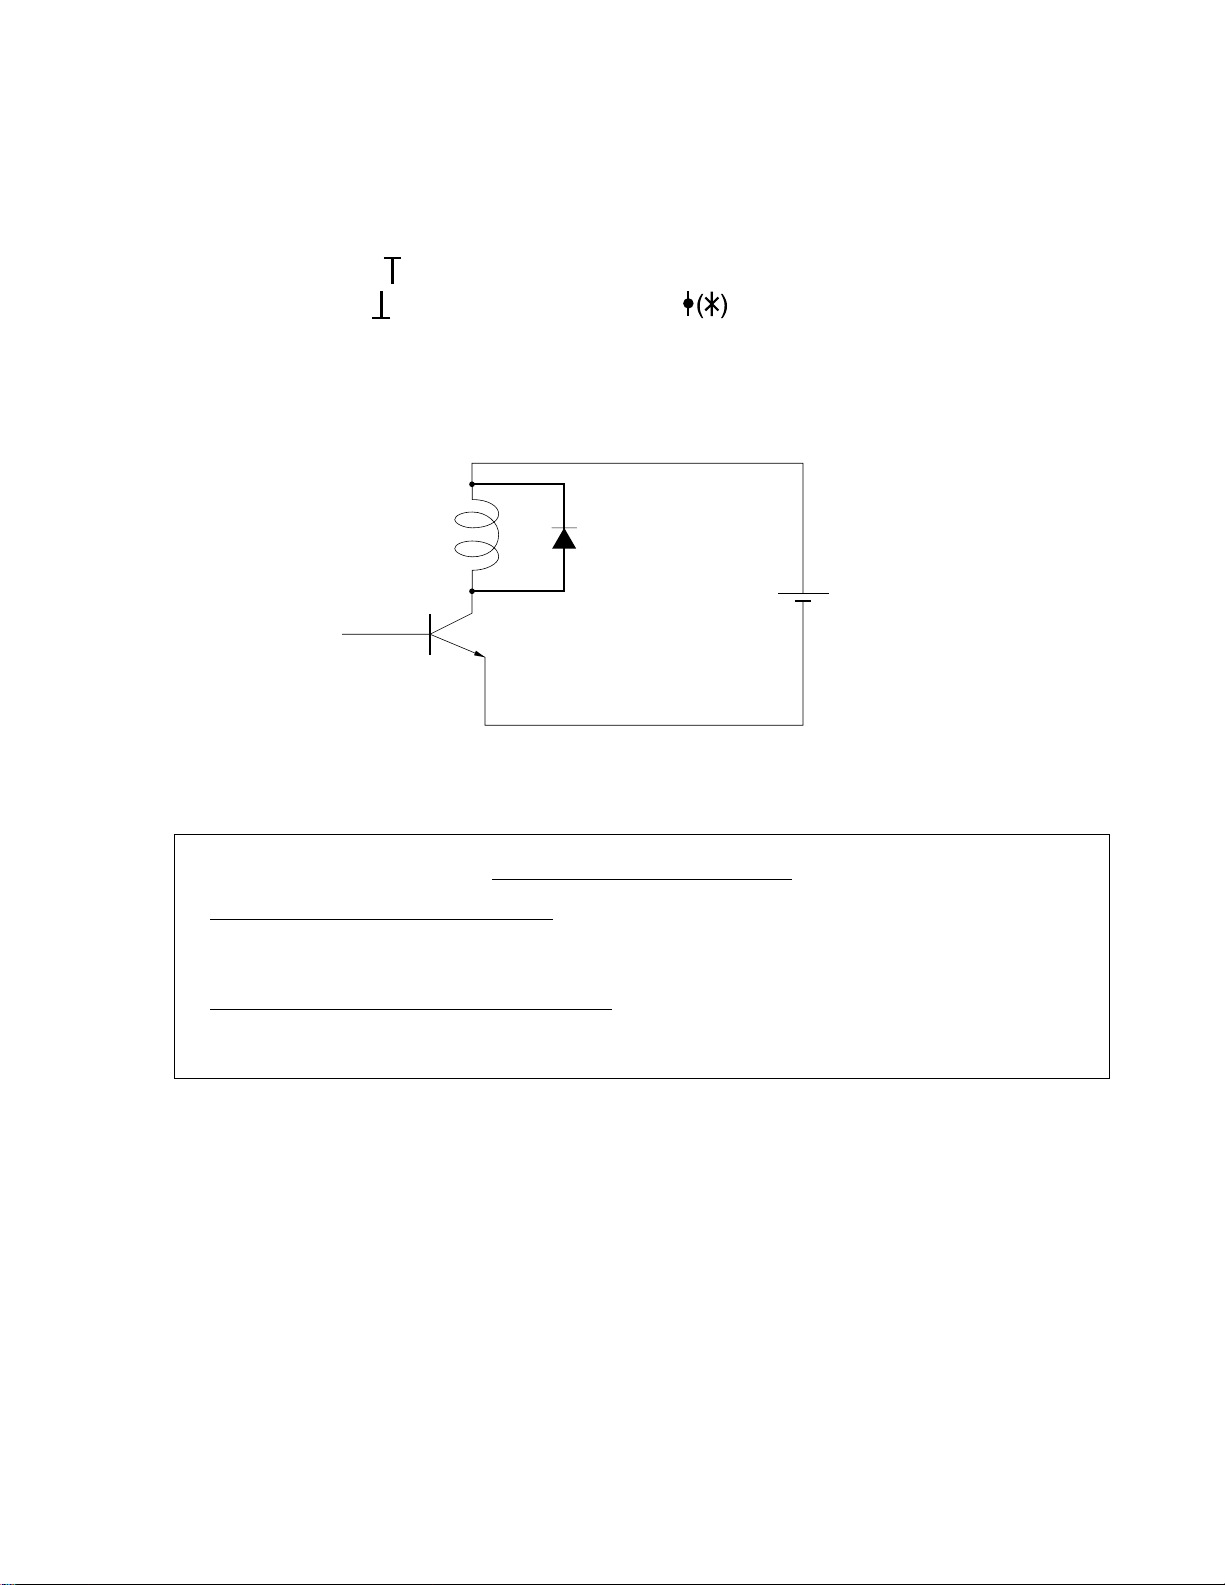
2. When a relay is driven by an IC, a protective element such as a diode may be connected in parallel
with the relay coil to protect the IC from damage caused by the counter-electromotive force (EMF) due
to the inductance of the coil. However, unless otherwise specified, the operate time and release time
(set and reset times) shown in this document are measured without such a protective element.
Relay Coil
Tr
Diode
Power Supply
For Right Use of Miniature Relays
DO NOT EXCEED MAXIMUM RATINGS.
Do not use relays under exceeding conditions such as over ambient temperature, over voltage and over
current. Incorrect use could result in abnormal heating, damage to related parts or cause burning.
READ CAUTIONS IN THE SELECTION GUIDE.
Read the cautions described in NEC/TOKIN’s “Miniature Relays” (0123EMDD03VOL01E) when you choose
relays for your application.
Page 8
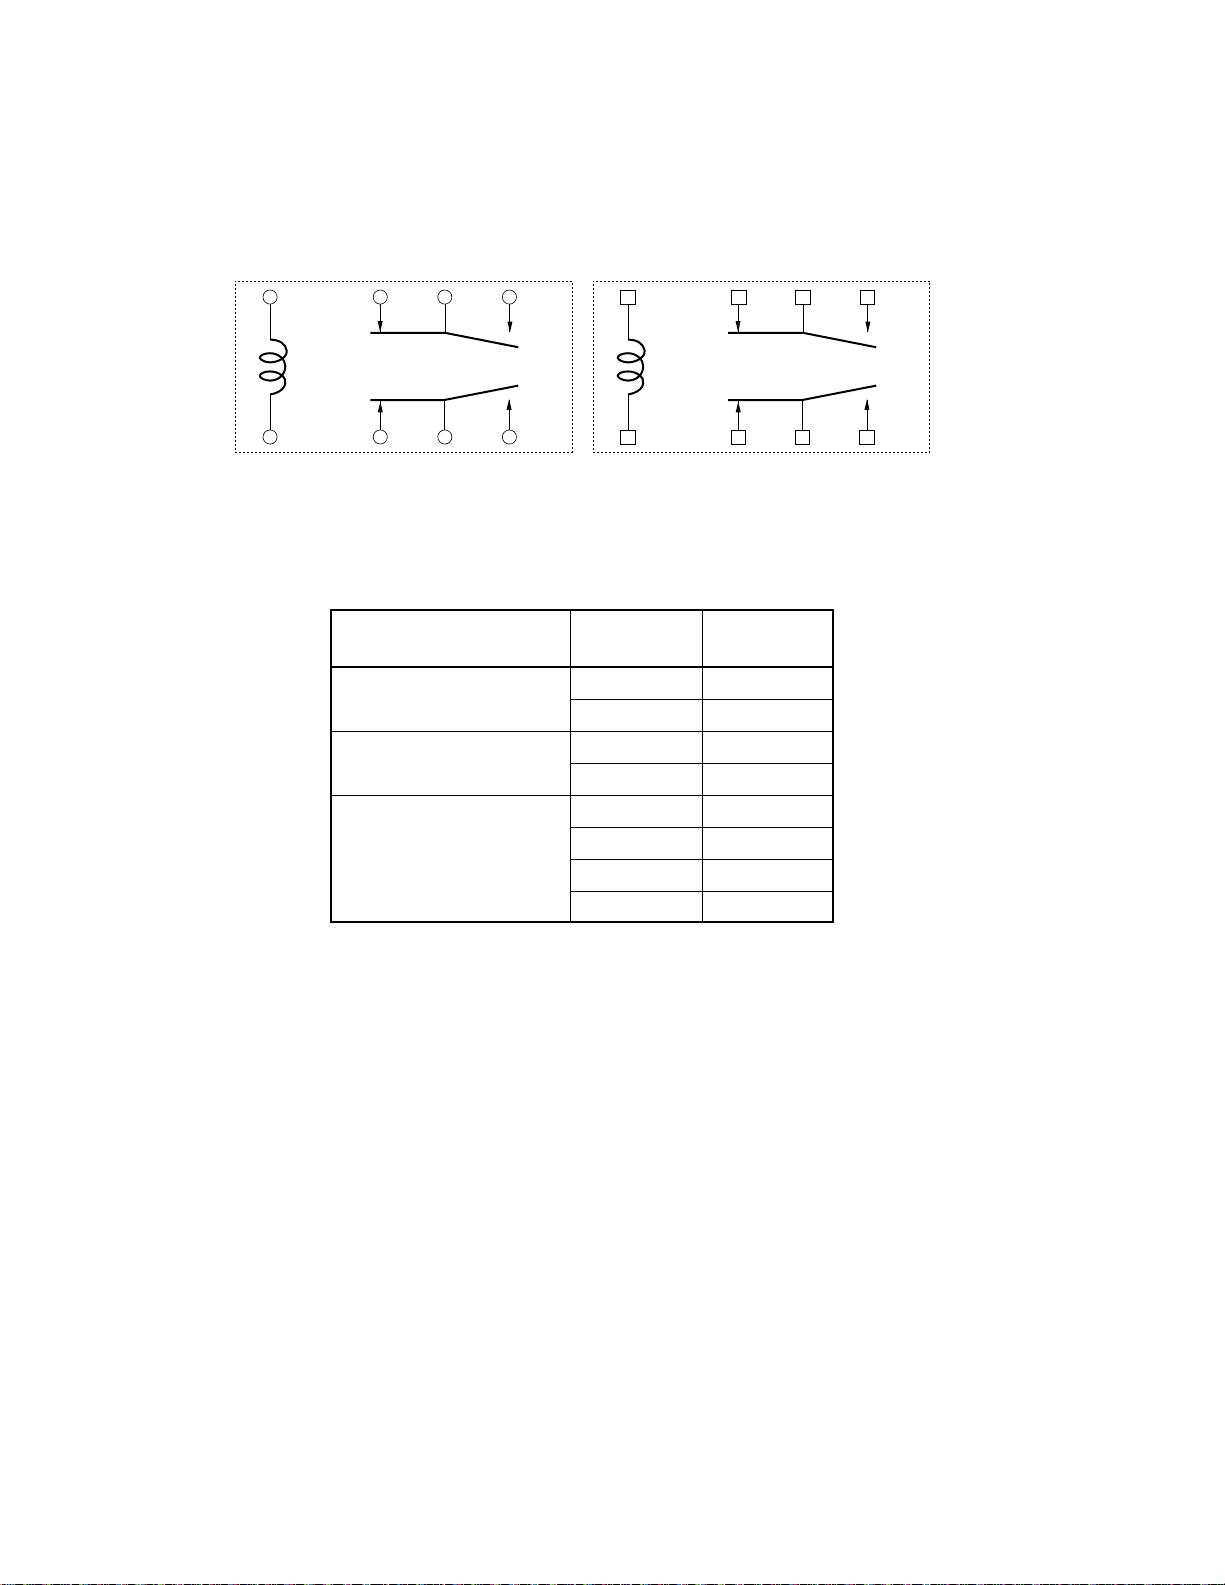
2. Structure
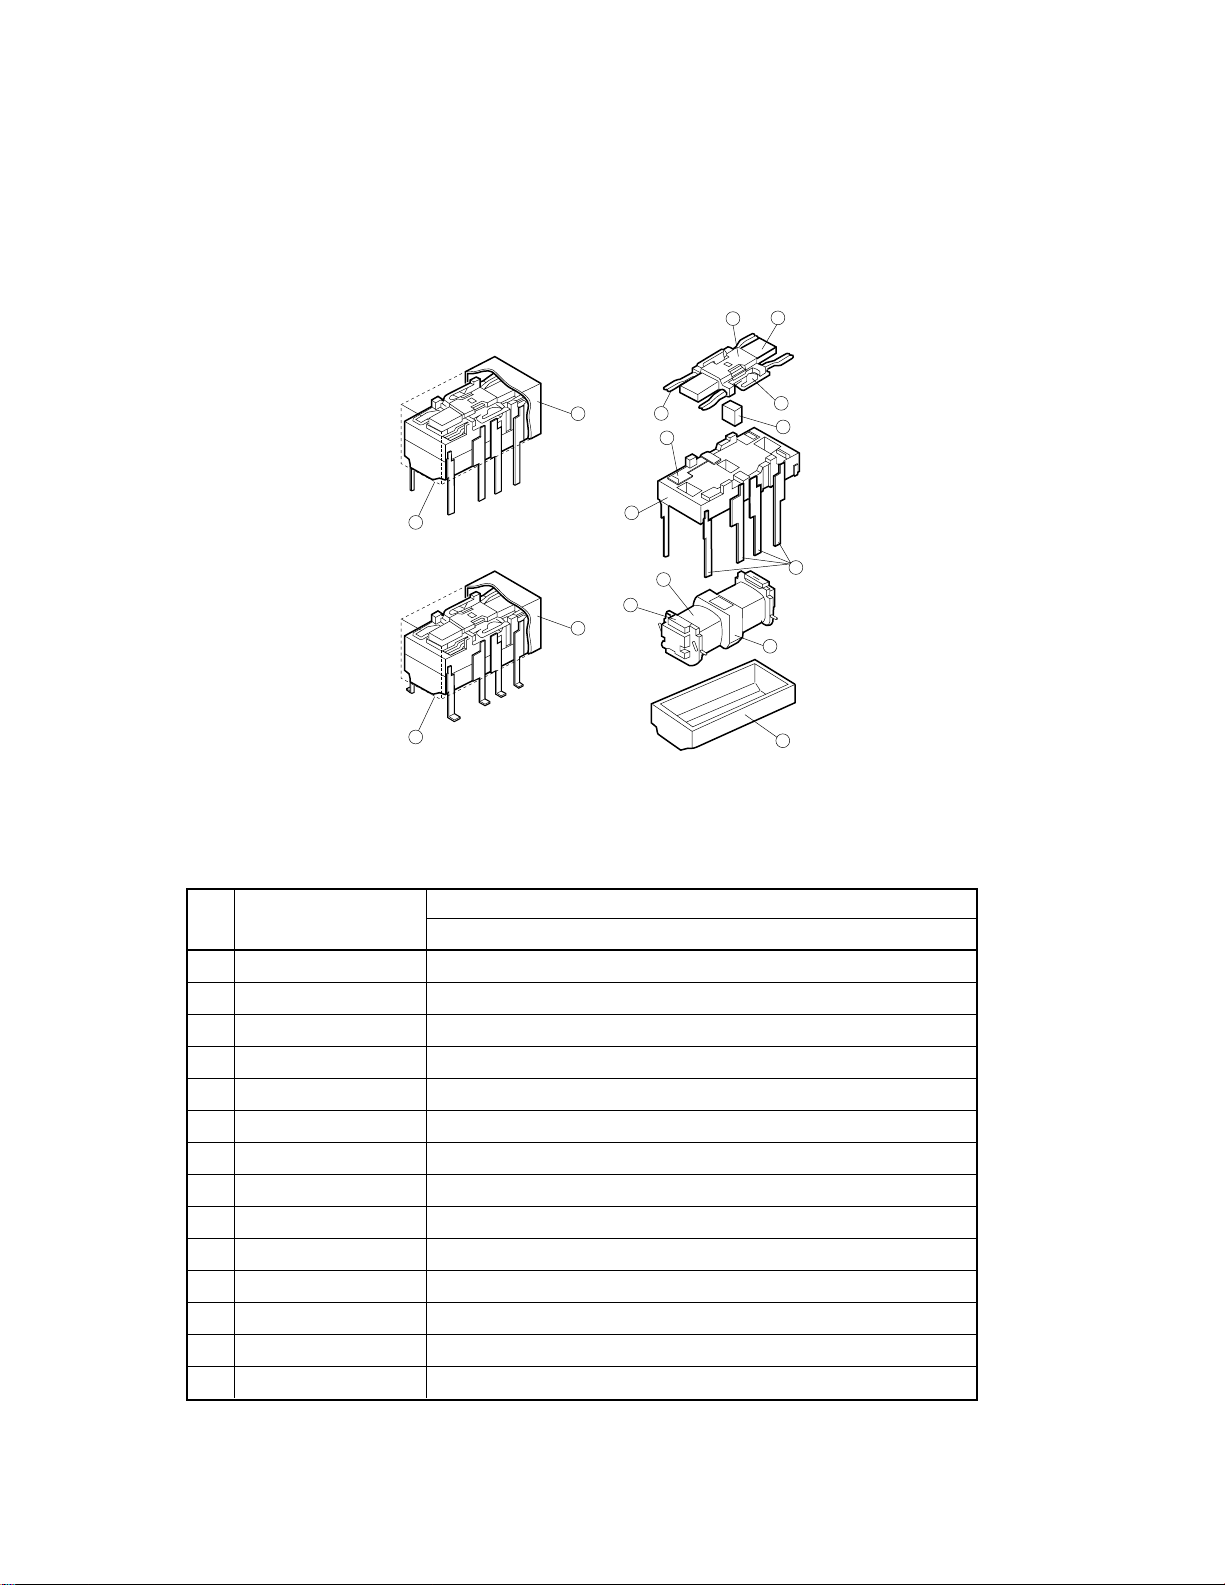
Figure 2.1 shows the structures of the ED2 and the EF2 series relays. ED2 series relay has a terminal configuration
called dual in-line leads (DIL), and EF2 series relay has a resistibility to solder heat, and a terminal configuration that
conforms to surface mounting. Table 2.1 lists the parts constituting relay.
ED2 series and EF2 series relays have a common structure except difference of a terminal configuration and some
parts.
11
[ED2 series]
12
10
13
7
5
3
14
[EF2 series]
14
1
1
8
9
2
4
6
Figure 2.1 Structure of the ED2/EF2 Series Relay
Table 2.1 Parts of ED2/EF2 Series Relay
No. Parts
1 Cover Liquid crystalline polymer
2 Base Liquid crystalline polymer
3 Base pad Liquid crystalline polymer
4 Coil wire Polyurethane copper wire
5 Coil spool Polyphenylene sulfide
#
6 Core Pure iron
7 Terminal Phosphor bronze (surface is treated with preparatory solder)
8 Moving contact Au-alloy + Ag-alloy
9 Stationary contact Au-alloy + Ag-alloy
*
*
10 Contact spring Phosphor bronze
11 Armature Pure iron
12 Armature block mold Liquid crystalline polymer
13 Magnet Cobalt magnet
14 Sealing material Epoxy resin
Material
ED2/EF2 Series
#
#
#
#
Note: *: Standard type
#: Conforms to UL94V-0
8
Page 9
3. Basic Characteristics
)
This section provides data necessary for designing an external circuit that uses the relay.
ED2 and EF2 series relays are designed with common specifications. So, this section shows common
characteristics of ED2 and EF2 series.
3.1 Switching power
If the contact load voltage and current of the relay are in the region enclosed by the solid and dotted lines in the
figure below, the relay can perform stable switching operation. If the relay is used at a voltage or current exceeding
this region, the life of the contacts may be significantly shortened.
2.0
1.0
0.5
Load Current (A)
0.2
62.5 V
20 30 50 100 200 250
Load Voltage (V
DC Resistive Load
AC Resistive Load
0.25 A
0.136 A
220 V
Figure 3.1 Switching Power
3.2 Maximum coil voltage
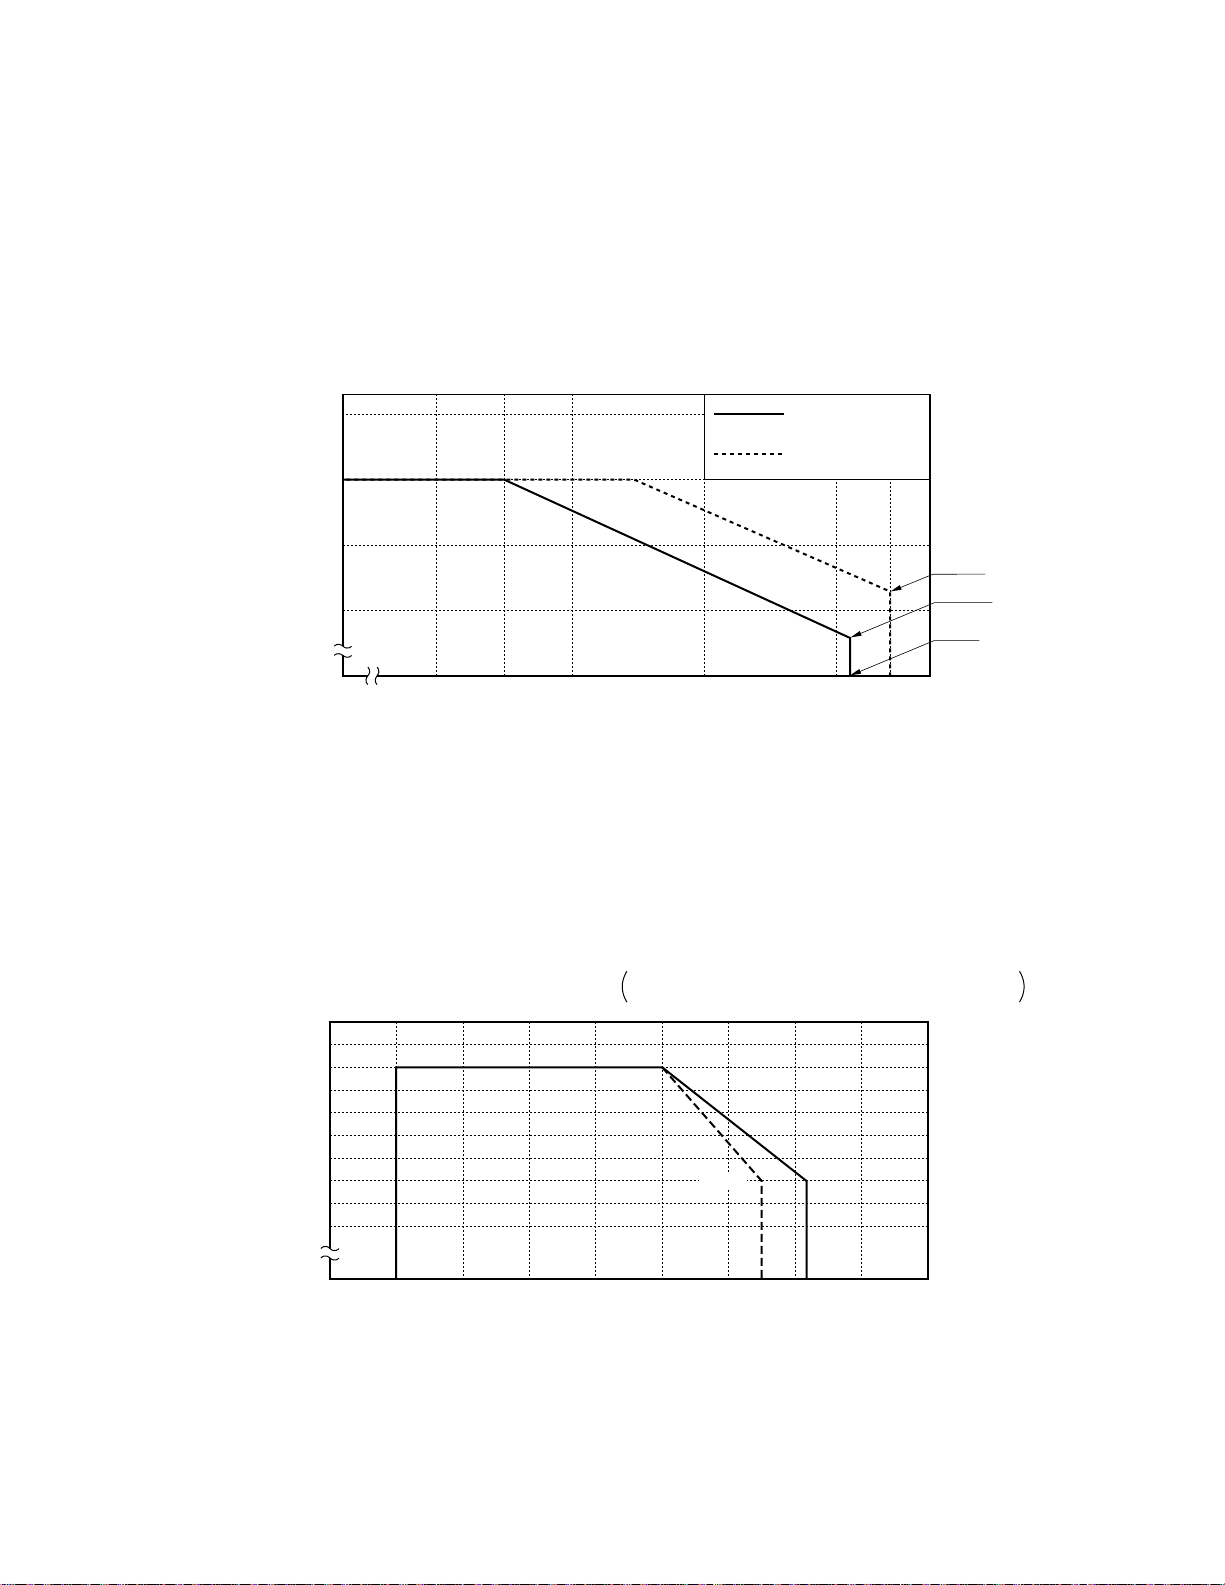
Figure 3.2 shows the ratio of maximum voltage that can be continuously applied to the coil of the relay to the nominal
voltage. As long as the relay is used in the enclosed region in this figure, the coil is not damaged due to burning
and the coil temperature does not rise to an abnormally high level.
(* Rated Coil Voltage: 1.5 to 24 Vdc)
*1 Rated of decrease in maximum voltage: 50%/30°C
*2 Rated of decrease in maximum voltage: 50%/45°C
150
100
Ratio of maximum applied voltage
to nominal voltage (%)
0 –40 –200 20406080100
Ambient temperature (°C)
70°C
*1
Figure 3.2 Maximum Voltage Applied to Coil
85°C
*2
9
Page 10
3.3 Coil temperature rise
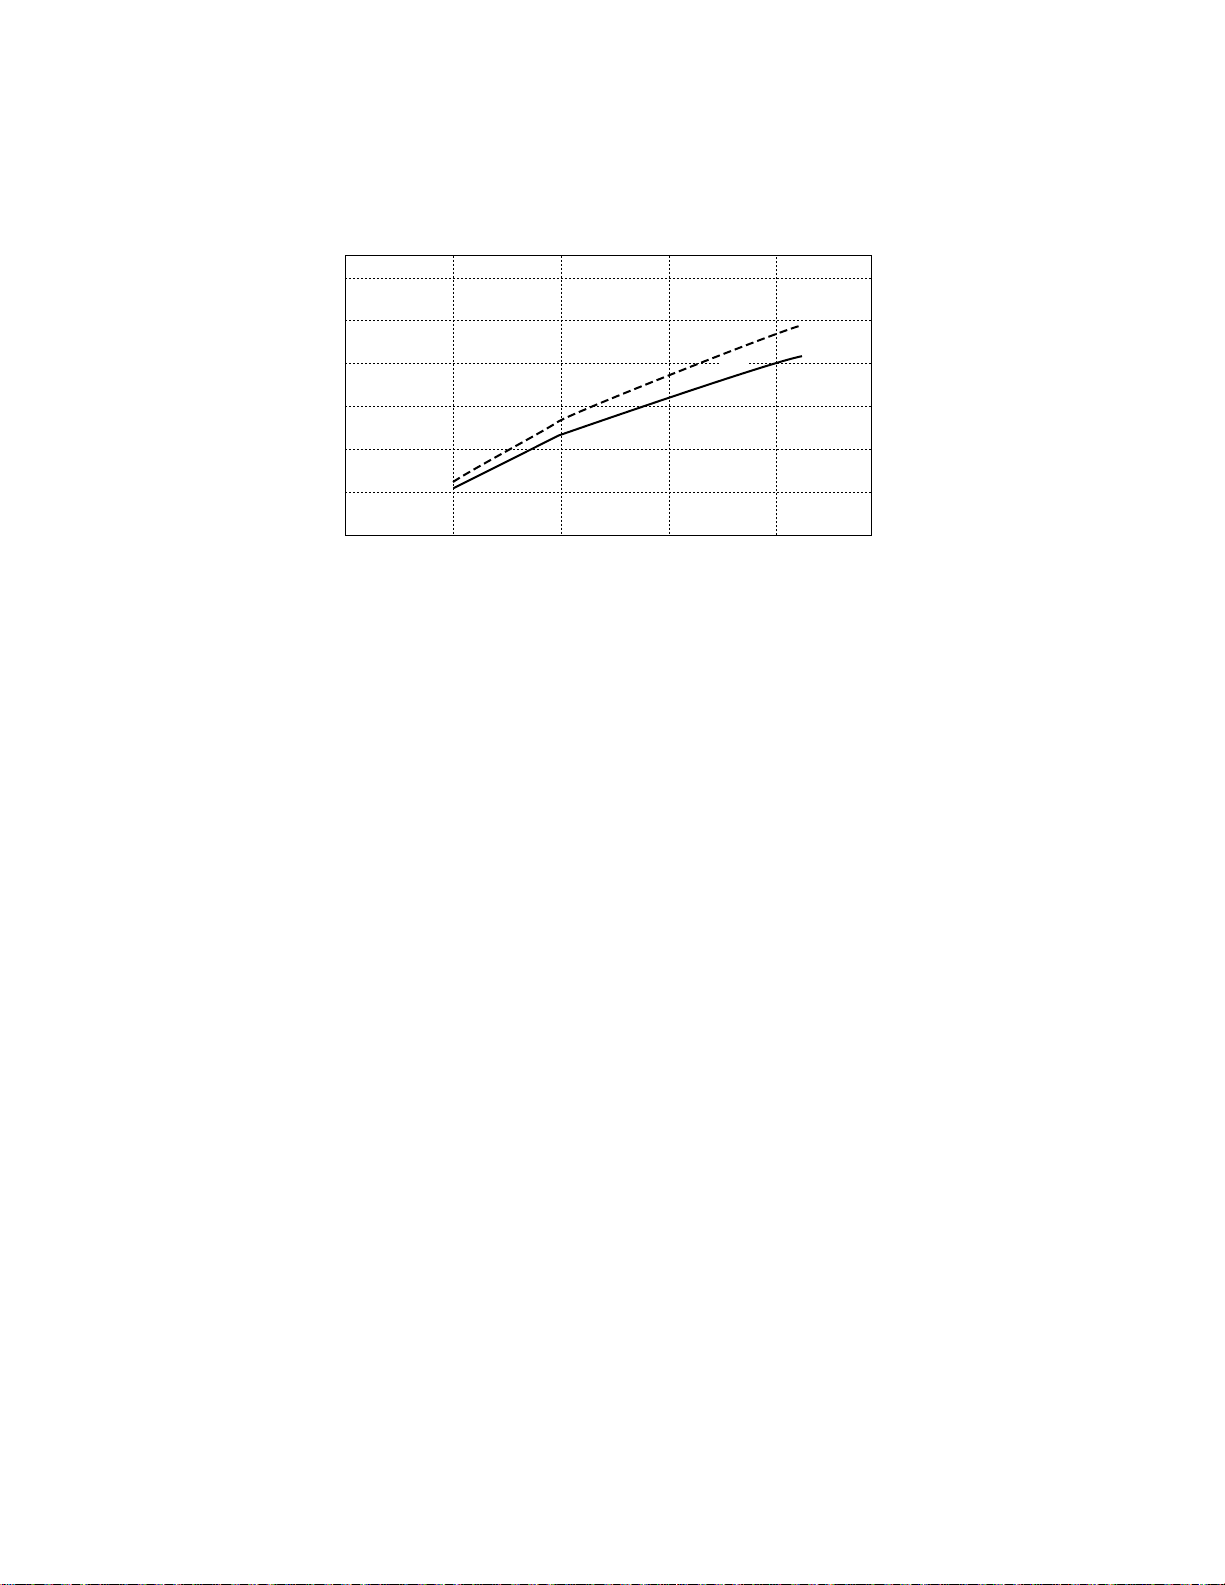
Figure 3.3 shows the relation between the rise in coil temperature and the power (product of the coil voltage and
current) dissipated by the coil. This figure shows the difference between the temperature before the power is applied
to the coil and the saturated temperature after application of power to the coil.
60
50
40
30
20
Temperature Rise (°C)
10
0 100 200 300 400
Applied Power (mW)
2 A
0 A
Figure 3.3 Coil Temperature Rise
Carrying
Current
10
Page 11
3.4 Driving power vs. timing
Figure 3.4 (1) shows the relations among the power applied to drive the relay, the operate time, and the bounce
time. Figure 3.4 (2) shows the relations among the supplied power, the release time, and the bounce time, and Figure
3.4 (3) shows the relations among the supplied power, the release time, and the bounce time when a diode is not
connected to the coil to absorb surges.
(1) Operate time
Operate time
4
3
2
1
Operate Time
Operate Bounce Time (ms)
0 50 100 150
(2) Release time (with diode)
Applied Power (mW)
Operate bounce time
(3) Release time
Release time
4
3
2
1
Release Bounce Time (ms)
(with diode)
Release Time
0 50 100 150
Applied Power (mW)
Release time
4
3
2
1
Release Time
Release Bounce Time (ms)
0 50 100 150
Applied Power (mW)
Release bounce time
Release bounce time
Figure 3.4 Driving Power vs. Timing
11
Page 12
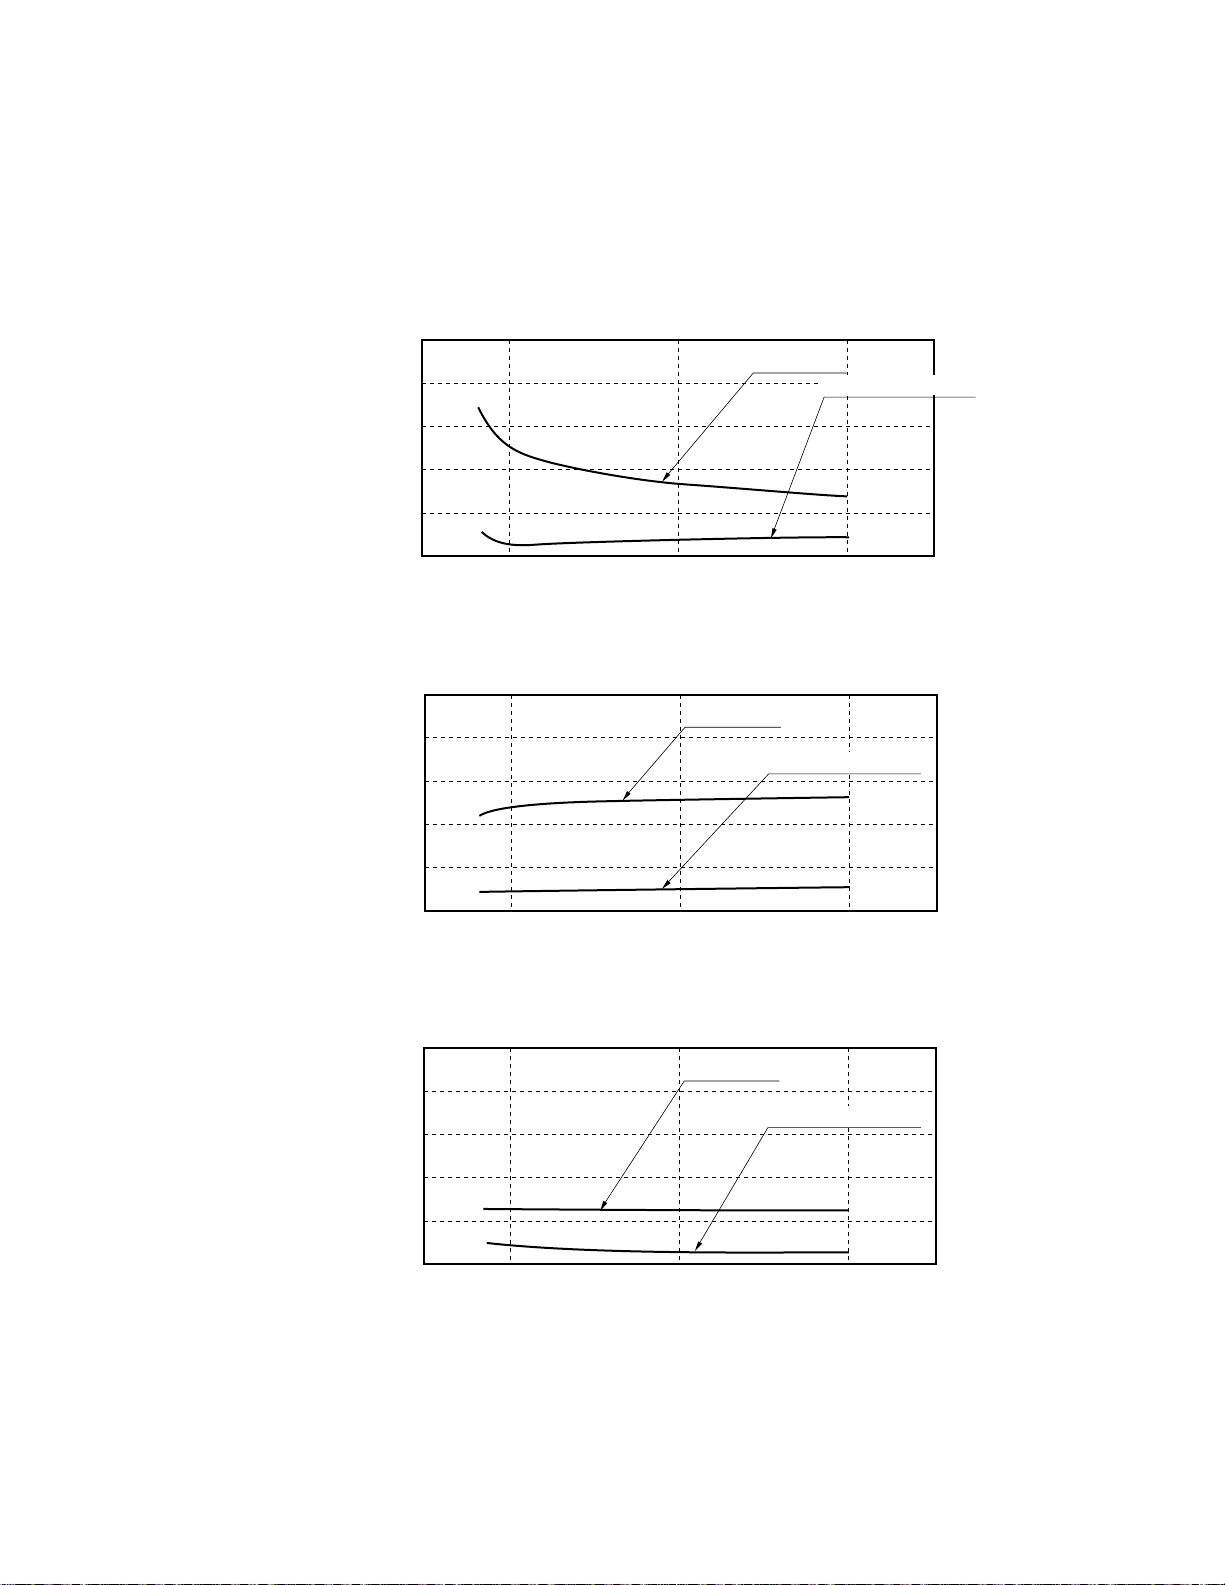
3.5 Thermal characteristics
p
)
The general characteristics of a relay gradually change with the ambient temperature. Figure 3.5 shows the typical
characteristics of the ED2 series relay.
(1) Operate & release voltages
130
120
Operate
Release
110
100
90
80
70
Change in Must Operate and Must
Release Voltages (%)
–40 –20 0 20406080100
Ambient Temprature T
a
(°C)
(2) Contact resistance* (4) Transfer times
130
120
110
100
90
80
70
Changes in Contact Resistance (%)
–40 –20 0 20406080100
Ambient Temprature T
a
(°C)
130
120
110
100
90
80
Cange in Transfer Time (%)
70
–40 –20 0 20406080100
Operate
Release
Ambient Temprature T
a (°C)
(3) Operate & release times (5) Coil resistance
130
120
110
100
90
80
70
Change in Must Operate and Must
Release Times (%)
–40 –20 0 20406080100
Operate
Release
Ambient Temprature T
a
(°C)
130
120
110
100
90
80
70
Change in Coil Resistance (%)
–40 –20 0 20406080100
Ambient Tem
rature Ta (°C
Figure 3.5 Temperature Characteristics
* The contact resistance includes the conductive resistance of the terminals. It is this conductive resistance
component that can change with the temperature.
12
Page 13
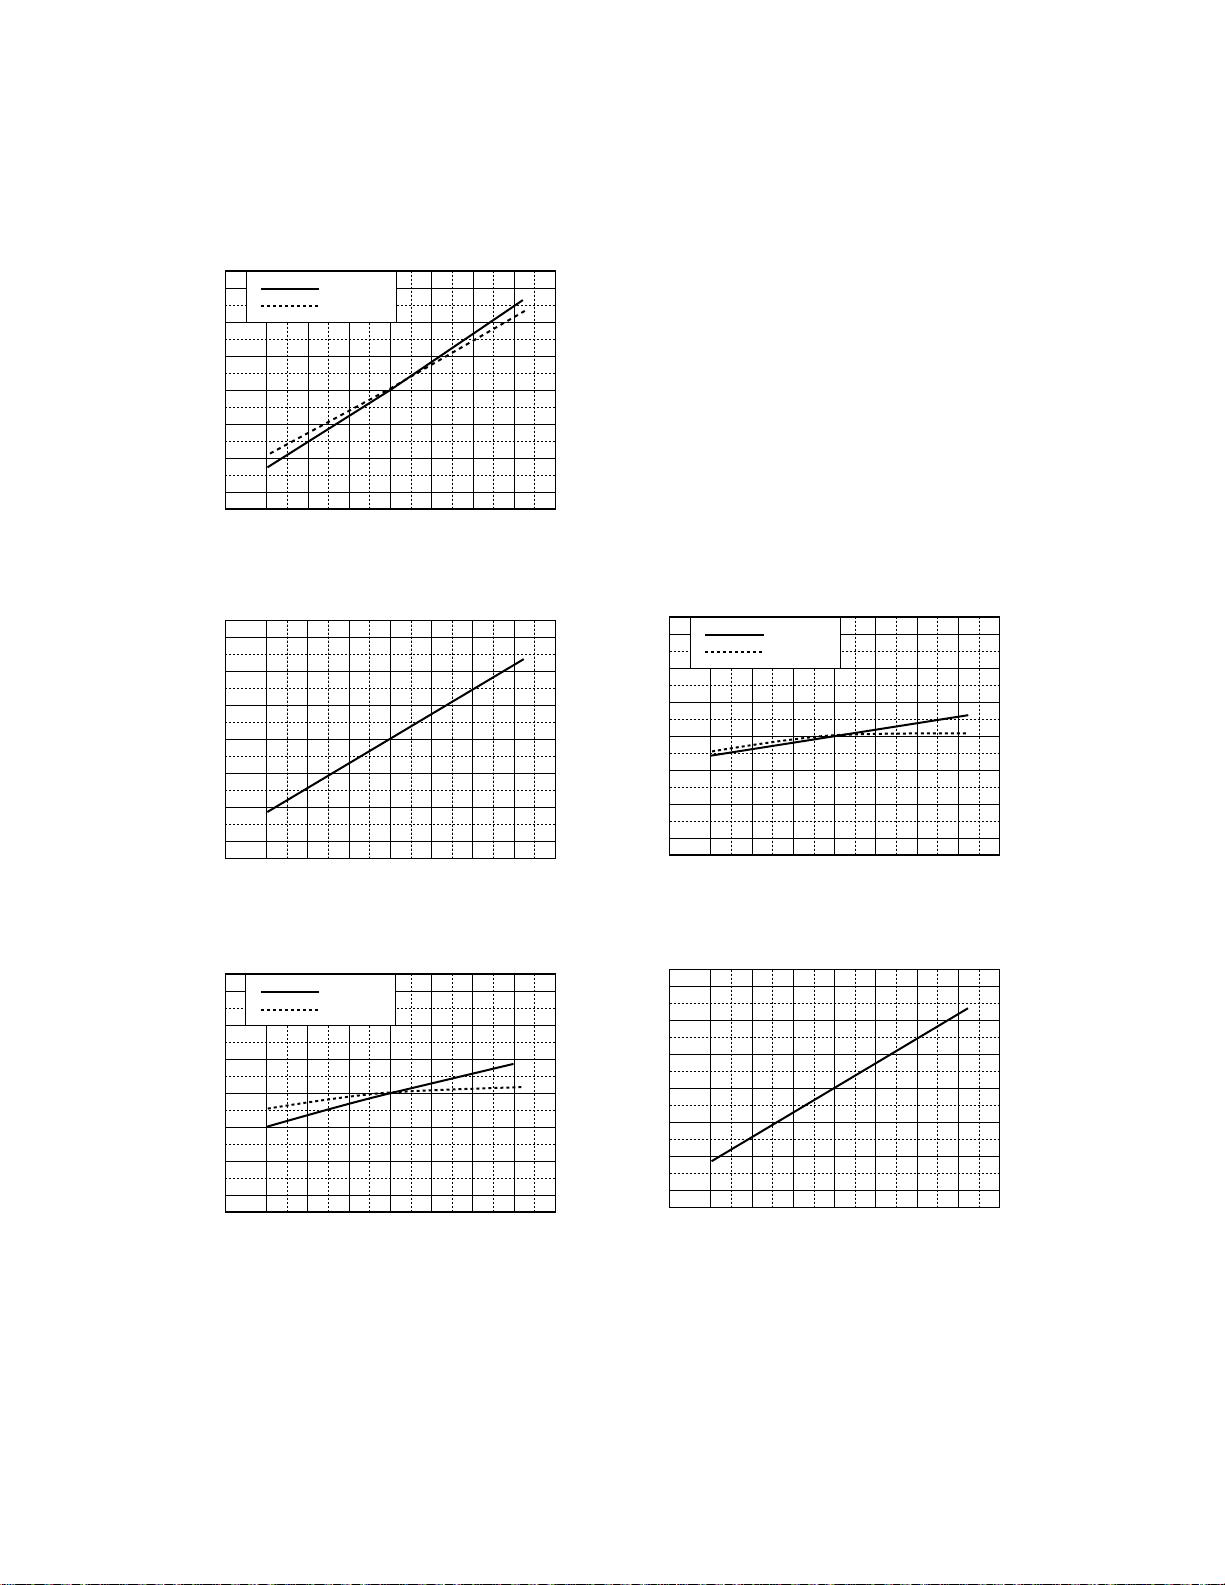
3.6 Magnetic interference
This section describes changes in the operate voltage caused by mutual magnetic interference when several relays
are closely mounted on a printed circuit board (PCB). Figure 3.6 (1) shows the distance among the relays mounted
on the PCB. As shown, the pin pitch of each relay is 2.54 mm. Figure 3.6 (2) shows the relay that is subject to
interference. In this figure, the hatched relay shown in the center of each relay arrangement is subject to interference,
and the surrounding relays influence the center relay. The condition under which the center relay suffers interference
and the surrounding relays affect the center relay differs depending on whether power is supplied to each relay. Figure
3.6 (3) shows the deviation in percent of the operate and release voltages of the center relays in Figure 3.6 (2).
(1) Mounting pitch (mm) (2) Relay arrangement
[ED2 series]
6 × 2.54
[EF2 series]
3 × 2.54
2.54
10.16
2.54
ON
Condition1 Condition2
Condition5 Condition6
ON OFF OFF
ON
ON
ON
ON
ON
Condition3 Condition4
OFF
OFF
OFF
OFF
OFF
(3) Deviation of must operate and must release voltages
+20
+10
0
6 × 2.54
2.54
2.54
–10
Deviation of Must
Operate Voltage (%)
–20
+20
+10
0
–10
Deviation of Must
Release Voltage (%)
–20
Figure 3.6 Magnetic Interference
123456
Condition
123456
Condition
13
Page 14
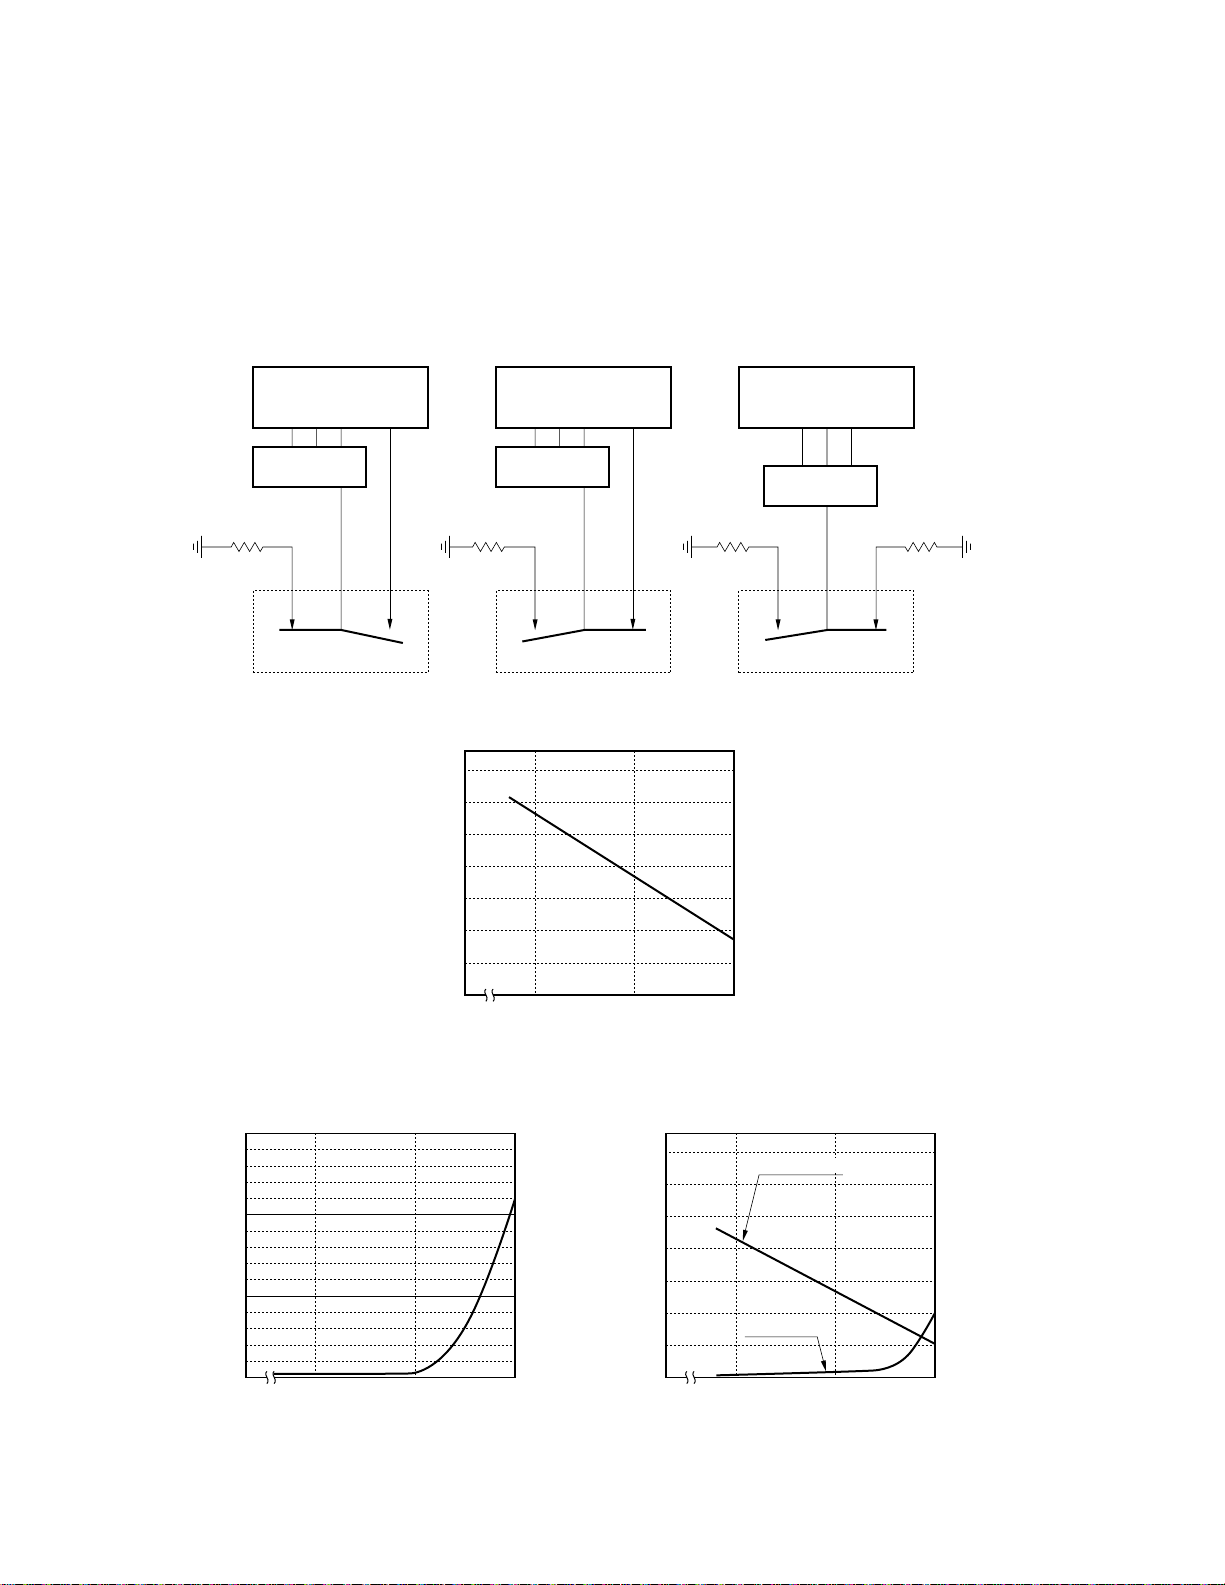
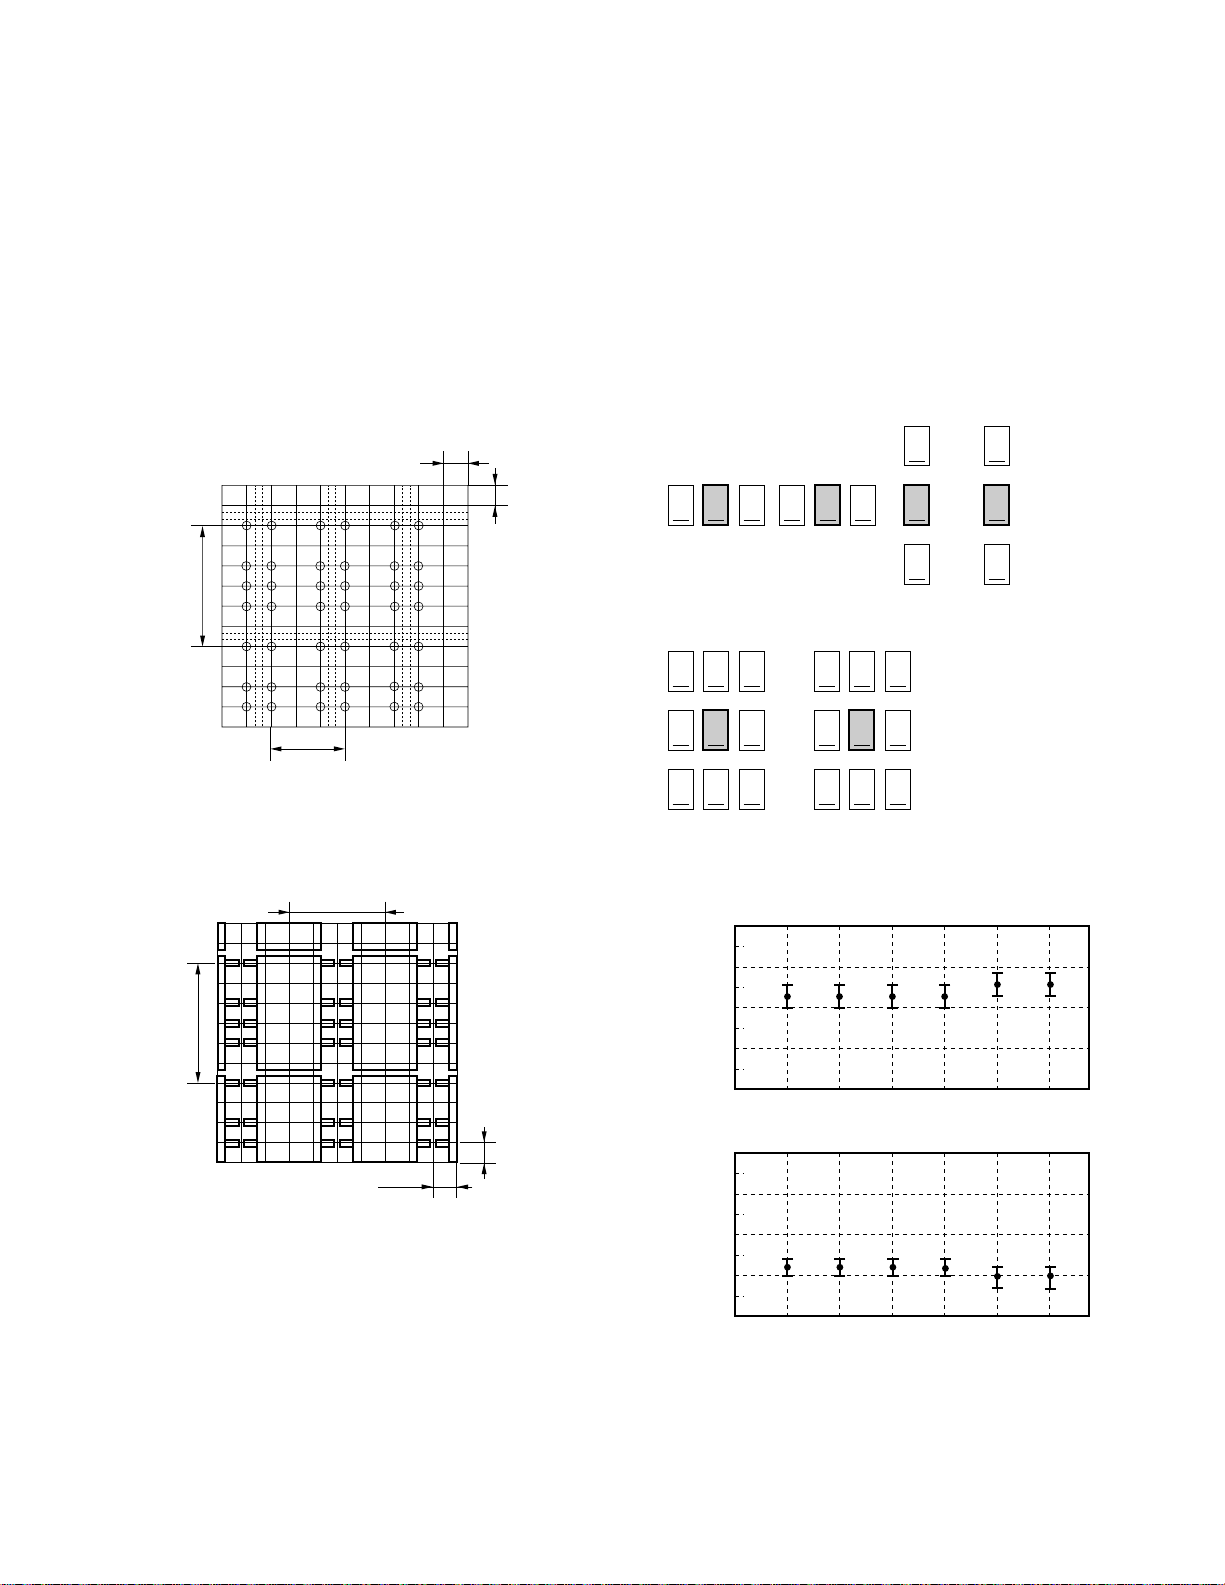
3.7 High-frequency characteristics
Figure 3.7 shows the performance of the ED2 and the EF2 series relays when a high-frequency signal is switched
by the contacts of the relay. Figure 3.7 (1) shows the test circuit. Figure 3.7 (2) shows the isolation loss of the relay.
Figure 3.7 (3) and Figure 3.7 (4) respectively show the insertion loss and return loss.
(1) Test circuit
Test equipment: HP8753B Network Analyzer (characteristic impedance: 50 Ω)
50 Ω
(2) Isolation loss
Isolation Loss
Network Analyzer
Test Set
IN
OUT
50 Ω
70
60
50
40
30
Isolation Loss (dB)
20
10
0
Insertion Loss
Network Analyzer
OUT
Test Set
IN
50 Ω
10 100 1000
Frequency (MHz)
Return Loss
Network Analyzer
IN
Bridge
OUT
50 Ω
(3) Insertion loss (4) Return loss
1.5
1.0
0.5
Insertion Loss (dB)
0
10 100 1000
Frequency (MHz)
70
60
50
40
30
Return Loss (dB)
20
10
0
Figure 3.7 High-frequency characteristics
14
Return Loss
V. S. W. R.
10 100 1000
Frequency (MHz)
3
2
V. S. W. R.
1
Page 15

3.8 Coil inductance
The control input of a relay is the coil. The coil inductance can be measured using the following two methods.
Either method may be used based on preference.
Table 3.1.1 and 3.1.2 show the results of measurement.
3.8.1 Measurement by LCR meter
Table 3.1.1 Coil Inductance
(Unit: mH)
Part Number
Non-latching type Inductance
(Standard type)
ED2/EF2-1.5 34
ED2/EF2-3 126
ED2/EF2-4.5 195
ED2/EF2-5 221
ED2/EF2-9 690
ED2/EF2-12 1103
ED2/EF2-24 3513
(Measurement frequency: 1 kHz)
3.8.2 Measurement by coil current waveform
The inductance is calculated by observation of
τ
: Determined by current waveform I = Imax (1 – e
Coil Current
τ
Table 3.1.2 Coil Inductance
Part Number
Non-latching type Inductance
(Standard type)
ED2/EF2-1.5 0.9
ED2/EF2-3 5
ED2/EF2-4.5 8
ED2/EF2-5 15
ED2/EF2-9 32
ED2/EF2-12 60
ED2/EF2-24 222
τ
equaling 63.2 % of max value
-t/τ
).
100 %
63.2 %
τ
= × R
L
= Coil resistance
R
= Coil current
Time (t)
I
(Unit: mH)
(Applied voltage = Nominal D.C. voltage)
15
Page 16
3.9 Capacitance
Table 3.2 shows the capacitance between terminals of the ED2 and the EF2 series relay.
Note that the terminals not tested are left open.
[ED2 series] [EF2 series]
1 345
1 345
12 10 9 8
Internal Connection of Relay (Bottom View)
Table 3.2 Capacitance
Parameter
Between Coil and Contact 1, 4 1.6
Between Opening Contacts 4, 5 0.8
Between Adjacent Contacts 4, 8 0.5
12 10 9 8
(Unit: pF)
Terminal
Number
9, 12 1.6
8, 9 0.8
4, 9 0.8
5, 8 0.3
5, 9 0.5
Capacitance
16
Page 17

3.10 Resistance to surge voltage
When a relay is used in a communication circuit, it may be subjected to a lightning surge via the circuit or due to
induction. A surge voltage test is conducted to measure the resistance of the ED2 and the EF2 series relays to surge
voltage.
(1) Test condition 1
The voltage waveform used for this test is specified by the Federal Communications Commission (FCC) Standard
Part 68.
The ED2 series relay can withstand even if the surge voltage shown in Figure 3.8 is applied (1) between opening
contacts, (2) between coil and contacts, or (3) between adjacent contacts.
V
MAX
. = 1500 V
µ
10 s
V
MAX
.
V
MAX
./2
Voltage (V)
0
µ
160 s
Time
Figure 3.8 Surge Voltage Waveform
(2) Test condition 2
The voltage waveform used for this test is specified by the Bellcore Standard. The ED2 and the EF2 series relay
can withstand even if the surge voltage shown in Figure 3.9 is applied between coil and contact.
2500
2250
1250
250
Voltage (V)
0
2 s
µ
10 s
Time
µ
Figure 3.9 Surge Current Waveform
17
Page 18

3.11 Resistance to carrying current
If an abnormally high current flows continuously through the closed contacts of the relay for a long time, meltdown
of inner mold of the relay, and large deviation of characteristics may occur.
Figure 3.10 shows the relation between the value of the carrying current at which the relay can operate normally
and time.
20
Meltdown of Inner Mold
<Destruction Region>
Large Deviation of Characteristics
10
Carrying Current (A)
5
2
After Test
10 s 20 s 30 s 40 s 50 s 2 m 5 m1 m
Time
Figure 3.10 Resistance to Carrying Current
(Hints on correct use)
Limit the carrying current of the contacts to a maximum of 2 A to maintain the reliability of the relay.
18
Page 19

4. Distribution of Characteristics
This chapter presents the distribution data of the general characteristic values of the ED2 series relay on behalf
of the ED2 and the EF2 series relays, because they are designed with common specifications. The data shown in
this chapter are sampled from a certain production lot, and do not necessarily guarantee the characteristics of any
particular lot that is shipped. The number of samples is 40 relays for each test.
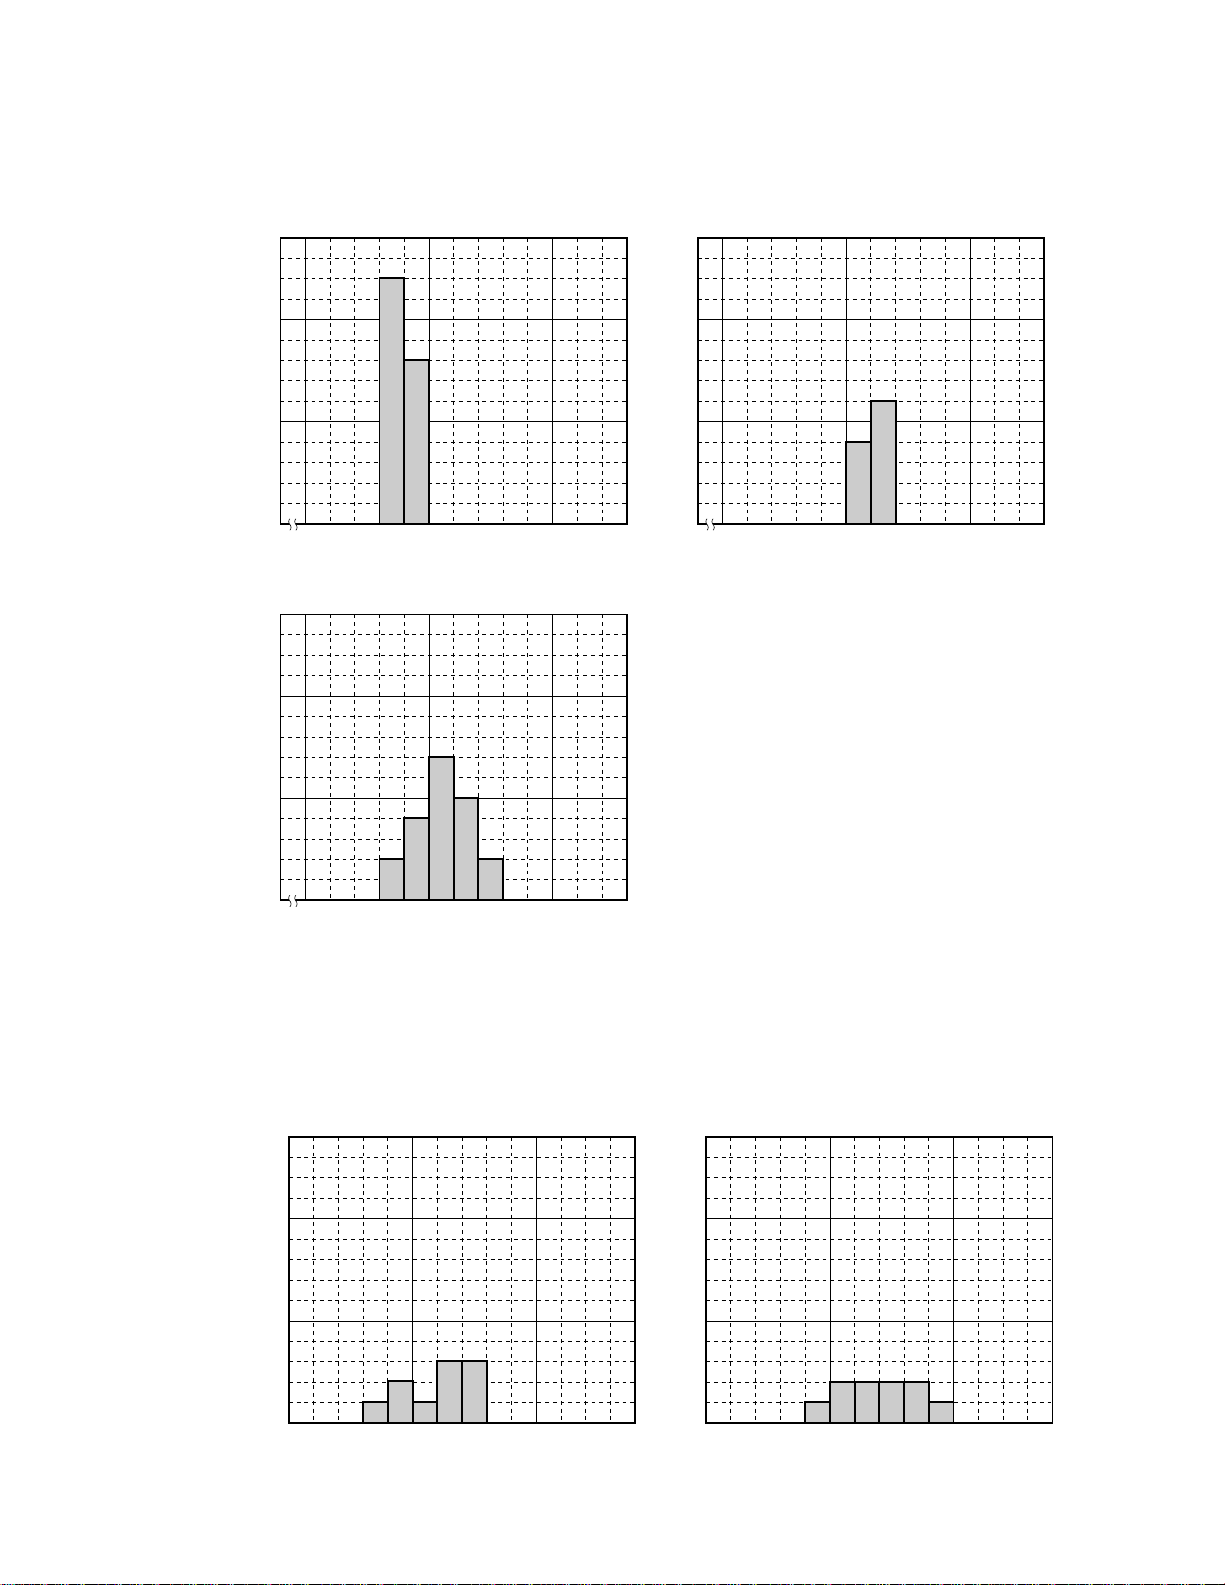
4.1 Operate & release voltages (set & reset voltages)
This section shows the distribution of the voltage at which the relay operates.
(1) Non-latching, 5-V type (ED2-5)
10
5
Number of Samples
0
2.5 3.0
Operate Voltage (V)
(2) Non-latching, 12-V type (ED2-12)
10
5
Number of Samples
45678910 234568
0
Operate Voltage (V)
10
5
Number of Samples
0
10
5
Number of Samples
0
1.0 2.0
Release Voltage (V)
Release Voltage (V)
(3) Latching of single-wound coil, 5-V type (ED2-5S)
10
5
Number of Samples
0
2.5 3.0 3.5 1.5 2.0 2.5
Set Voltage (V)
Figure 4.1 Operate & Release Voltages
10
5
Number of Samples
0
Reset Voltage (V)
19
Page 20

4.2 Operate & release times (set & reset times)
This section shows the operate time that elapses from the time when the relay coil is energized until the relay
contacts close, and the release time that elapses from the time when the relay coil is deenergized until the closed
contacts open.
The number of samples used for each measurement is 40.
(1) Non-latching, 5-V type (ED2-5)
20
10
Number of Samples
0
2.5 3.0
Operate Time (ms)
(2) Non-latching, 12-V type (ED2-12)
20
10
Number of Samples
0
2.0 2.5
Operate Time (ms)
20
10
Number of Samples
0
20
10
Number of Samples
0
2.0 2.5
Release Time (ms)
2.0 2.5
Release Time (ms)
(3) Latching of single-wound coil, 5-V type (ED2-5S)
20
10
Number of Samples
0
Set Time (ms)
3.02.5
Figure 4.2 Operate & Release Times
20
20
10
Number of Samples
0
2.5 3.0
Reset Time (ms)
Page 21

4.3 Transfer time
This section gives data on the transfer time, which is the total time between the breaking of one set of contacts
and the making of another. The number of samples used for each measurement of the transfer time is 40.
(1) Non-latching, 5-V type (ED2-5)
20
10
Number of Samples
0
0.5 1 1.5 0.5 1 1.5
Operate Transfer Time (ms)
(2) Non-latching, 12-V type (ED2-12)
20
10
Number of Samples
20
10
Number of Samples
0
Release Transfer Time (ms)
20
10
Number of Samples
0
0.5 1 1.5 0.5 1 1.5
Operate Transfer Time (ms)
(3) Latching of single-wound coil, 5-V type (ED2-5S)
20
10
Number of Samples
0
0.5 1 1.5 0.5 1 1.5
Set Transfer Time (ms)
Figure 4.3 Transfer Times
0
Release Transfer Time (ms)
(without diode)
20
10
Number of Samples
0
Reset Transfer Time (ms)
21
Page 22

4.4 Timing and details
The ED2 and the EF2 series relays have two sets of transfer contacts. This section shows the movements of each
contact, which are not included in the timing specifications, using the timing chart shown in Figure 4.4A.
Coil Voltage
Normally Open
Contact No. 1
Normally Close
Contact No. 1
Normally Open
Contact No. 2
ON
OFF
ON
OFF
ON
OFF
ON
OFF
TOB
Energized
Not Energized
1
TOM
1
TTO
1
TOM
2
THM
THM
1
2
TRM
TRB
TTR
1
1
1
TRM
THB
1
2
Normally Close
Contact No. 2
ON
OFF
TOB
TRB
TTR
2
2
2
TTO
2
THB
2
COR
COO
Figure 4.4A Timing Chart of Coil and Contacts
(Test results)
The timing specifications show the greater of the values of the two sets of contacts. The time difference between
the two contact sets, however, is almost negligible as shown in data (1) through (8) on the following pages. Practically,
therefore, the time difference can be ignored.
22
Page 23

The following charts show the distribution of timing. Twenty ED2-5’s are used as the samples.
(1) On times of make contacts at operation (TOM)
Contact #1
20
10
Number of Samples
0
2.5 3.0
TOM
1
(ms)
(2) Off times of break contacts at operation (TOB)
Contact #1
20
20
10
Number of Samples
0
2.5 3.0
20
Contact #2
TOM
2
(ms)
Contact #2
10
Number of Samples
0
1.5 2.0
TOB
1
(ms)
(3) Off times of make contacts at release (TRM)
Contact #1
20
10
Number of Samples
0
1.0 1.5
TRM
1
(ms)
10
Number of Samples
0
1.5 2.0
20
10
Number of Samples
0
TOB
2
(ms)
Contact #2
1.0 1.5
TRM
2
(ms)
Figure 4.4B Timing
23
Page 24

(4) On times of break contacts at release (TRB)
Contact #1
20
10
Number of samples
0
2.0 2.5
TRB
1 (ms)
(5) Bounce times of make contacts at operation (THM)
Contact #1
20
20
10
Number of samples
0
1.5 2.0 2.5
20
Contact #2
TRB
2 (ms)
Contact #2
10
Number of samples
0
0.5 1.0
THM
1
(ms)
(6) Bounce times of break contacts at release (THB)
Contact #1
20
10
Number of samples
0
0.5 1.0
THB
1
(ms)
10
Number of samples
0
20
10
Number of samples
0
0.5 1.0
THM
2
(ms)
Contact #2
0.5 1.0
THB
2
(ms)
24
Figure 4.4C Timing
Page 25

(7) Operate transfer times (TTO)
Contact #1
20
10
Number of Samples
0
1.00.5 1.5
TTO
1
(ms)
(8) Release transfer times (TTR)
Contact #1
20
20
10
Number of Samples
0
20
Contact #2
1.00.5 1.5
TTO
2
(ms)
Contact #2
10
Number of Samples
0
1.00.5 1.5
(9) Common open times
20
10
Number of Samples
0
1.00.5 1.5
TTR
1
(ms)
At operation
COO (ms)
10
Number of Samples
0
20
10
Number of Samples
0
1.00.5 1.5
TTR
2
(ms)
At release
1.00.5 1.5
COR (ms)
Figure 4.4D Timing
25
Page 26

4.5 Contact resistance
This section gives data on the resistance of the contacts when the contacts are closed. The number of sample
used for measurement of the contact resistance is 40 each.
(1) Non-latching, 5-V type (ED2-5)
20
10
Number of Samples
0
4035 45
Contact Resistance (mΩ)
(N.O. Contact)
(2) Non-latching, 12-V type (ED2-12)
20
10
Number of Samples
20
10
Number of Samples
0
Contact Resistance (mΩ)
20
10
Number of Samples
4035 45
(N.C. Contact)
0
4035 45
Contact Resistance (mΩ)
(N.O. Contact)
(3) Latching of single-wound coil, 5-V type (ED2-5S)
20
10
Number of Samples
0
4035 45
Contact Resistance (mΩ)
(N.O. Contact)
Figure 4.5 Contact Resistance
26
0
Contact Resistance (mΩ)
20
10
Number of Samples
0
Contact Resistance (mΩ)
4035 45
(N.C. Contact)
4035 45
(N.C. Contact)
Page 27
4.6 Breakdown voltage
This section gives data on the breakdown voltage between terminals of the ED2 series relay.
(Sample: ED2-5, n = 10 pcs.)
(a) Between open contacts (n = 20)
10
5
Number of Samples
0
Breakdown Voltage (kVac)
(c) Between coil and contacts (n = 20)
10
5
Number of Samples
1.51.0 2.0
(b) Between adjacent contacts (n = 10)
10
5
Number of Samples
0
Breakdown Voltage (kVac)
2.52.0 3.0
0
2.01.5 2.5
Breakdown Voltage (kVac)
Figure 4.6 Breakdown Voltage
4.7 Thermal Electromotive Force (EMF) (offset voltage between contacts)
This section gives data on the thermal EMF which is a voltage that appears when the contacts are closed.
(Sample: ED2-5, number of samples = 5 pcs., number of data = 10)
(a) N.C. contact (not energized)
10
5
Number of Samples
10
5
Number of Samples
0.50 1.0 0.50 1.0
Thermal EMF ( V) Thermal EMF ( V)
µµ
(b) N.O. contact (energized)
Figure 4.7 Thermal EMF
27
Page 28

5. Test Data
This chapter shows examples of the results of environmental tests (refer to 5.1 for details) and contact life tests
(refer to 5.2). The table below lists the types of tests, conditions, and data.
Table 5 Types of Tests, Conditions, and Data
Test Test Conditions Refer to Page:
Environ- High-temperature test Ambient temperature: +105˚C 27, 28
mental Duration: 800 hours
test
Contact Non-load test 25˚C 38
test
Low-temperature test Ambient temperature: –40˚C29
Duration: 800 hours
Moisture resistance test Ambient temperature: –10˚C to +65˚C30
Humidity: 90 to 95% RH, test cycles: 10
Heat shock test Ambient temperature: –55˚C/+85˚C31
Test cycles: 100
Vibration test
Shock test Waveform: Half sine wave, 100 G max. 33
Resistance to solder Solder temperature: 260 ± 10˚C34
heat test Immersion time: 10 seconds
Resistance to reflow Maximum temperature: 235 ˚C 35, 36
solder heat test Refer to Figure 5.8
Terminal strength Ambient temperature: 25˚C, Tensile strength: 1.36 kg 37
Resistive load test A 10 V.DC, 10 mA, 85°C39
Resistive load test B
Resistive load test C
Amplitude: 1.52 mm, Test time: 3 hours each in X, Y, and Z directions
Frequency: 10 Hz to 2000 Hz, Peak acceleration: 20 G
6 Times each in X, Y, and Z directions, totaling 36 times
Number of times of bending: 2
50 V.DC, 100 mA, 85°C
30 V.DC, 1 A, 25°C
32
39
40
28
Page 29

5.1 Environmental tests
This section shows the results of environmental tests to be conducted to evaluate the performance of the relay
under specific storage and operating environmental conditions. No abnormality was found after all the tests had been
conducted.
There is a difference between the shapes of the case and pins of the ED2 series and those of the EE2 series.
However, apart from these differences, they have a common internal structure and are made of the same materials.
The data indicated here is for the ED2 series. All values are the same for both the ED2 and EE2 series, except heat
resistance when soldering (heat resistance when reflow soldering).
* The operate and release voltages, contact resistance, operate and release times, and transfer time of the sample
before and after each test were compared, but no major change in these parameters was observed, and the sample
still satisfied the initial standard values of the parameters after the test. For details, refer to the graph for each
test.
9
* The initial standard value of the insulation resistance of 10
* The initial standard value of two breakdown voltages of 1500 Vac (between coil and contact), and of 1000 Vac
(between opening contacts, and between adjacent contacts) were satisfied for 1 minute after the test.
* After each test, no abnormality was found in the appearance. The cover of the relay was removed and the internal
mechanism was also inspected visually for dirt, deformation, and other abnormalities, but no such abnormalities
was found.
* After each test, a sealability test was conducted to examine the sealability of the relay by immersing the relay into
a fluorocarbon solution and checking to see if the internal gas of the relay leaked out. No abnormality was observed
as a result of this sealability test.
Ω or higher was still satisfied after the test.
29
Page 30

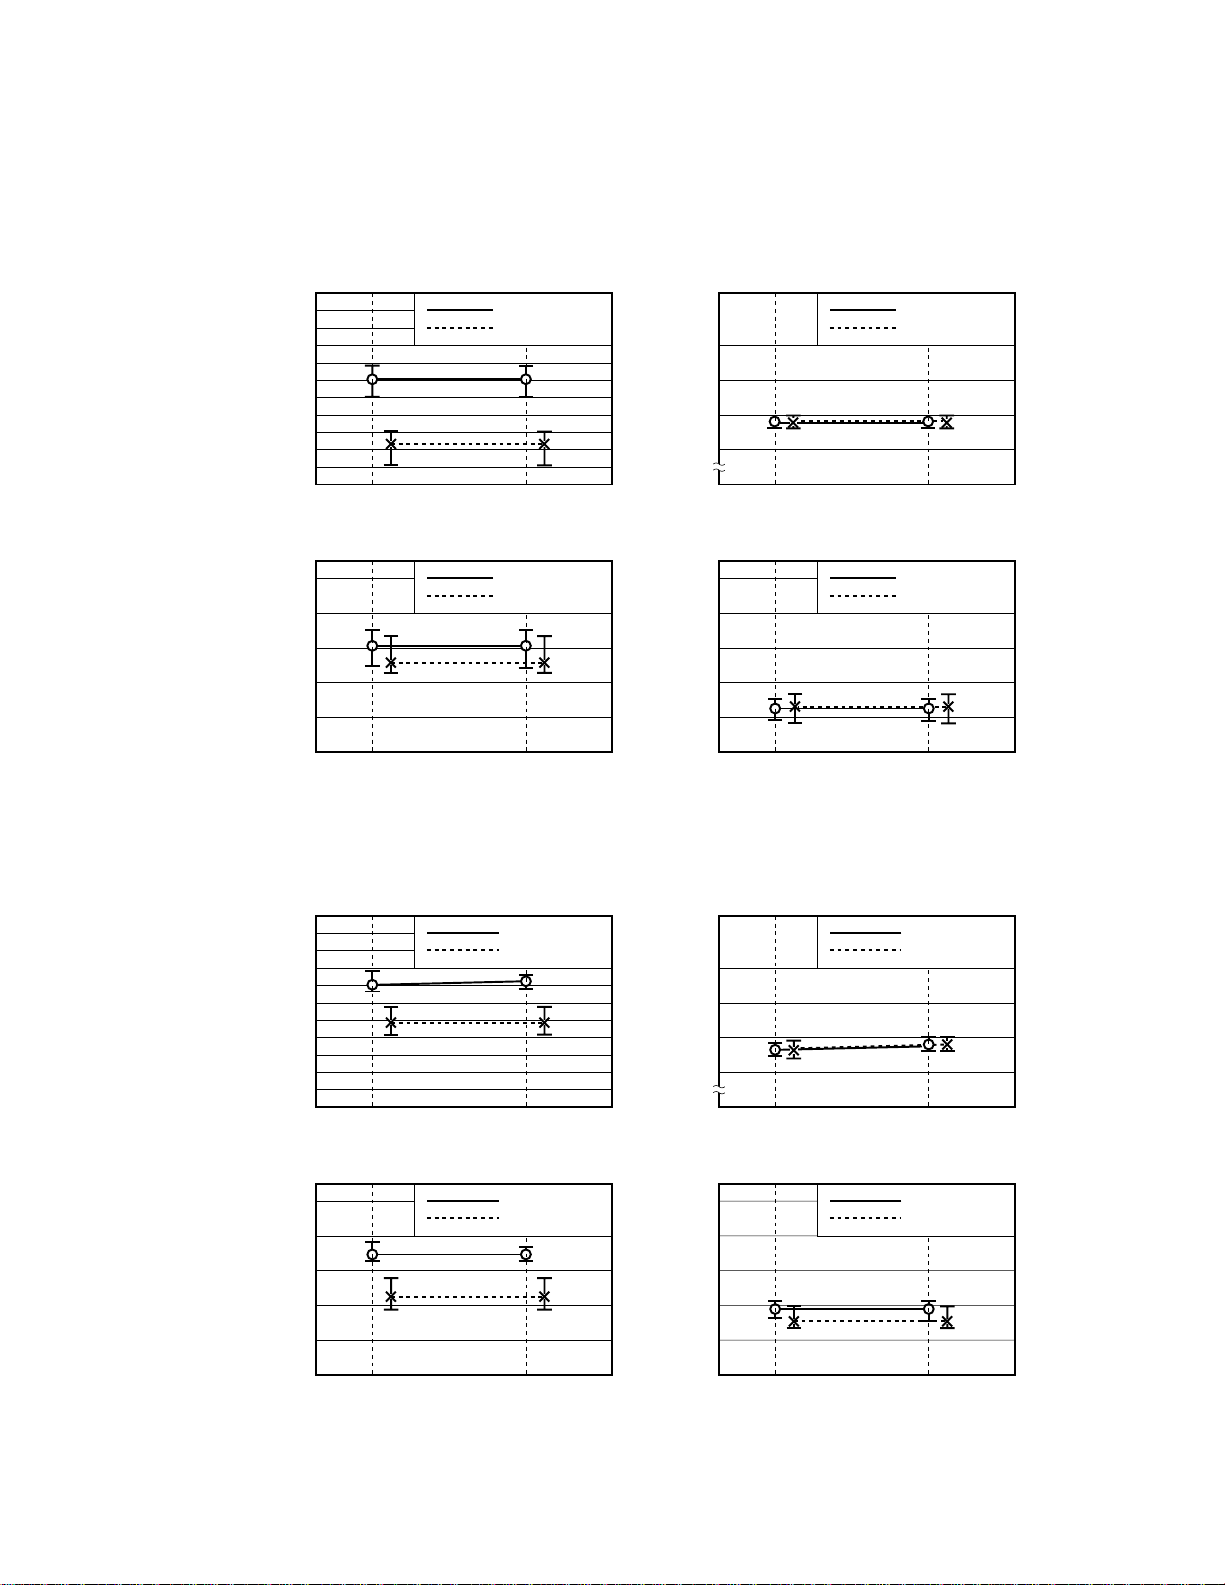
5.1.1 High-temperature test (test conditions: temperature: +105˚C, duration: 800 hours, sample: 20 pcs. each)
This test was conducted to check whether the performance of the relay is degraded after the relay has been left
at the upper-limit value of the rated ambient temperature for the specified duration.
(1) Non-latching, 5-V type
(a) Operate & release voltages
5
4
3
2
1
0
Operate & Release Voltages (V)
Before Test After Test
(c) Operate & release times
4
3
2
1
0
Operate & Release Times (ms)
Before Test After Test
Operate Voltage
Release Voltage
Operate Time
Release Time
Figure 5.1 (1) High-temperature Test
(b) Contact resistances
200
100
50
20
Contact Resistance (mΩ)
Before Test After Test
(d) Transfer times
4
3
2
Transfer Time (ms)
1
0
Before Test After Test
Normally Open (N.O.) Contact
Normally Close (N.C.) Contact
At Operation
At Release
(2) Latching of double-wound coil, 5-V type
(a) Set & reset voltages
5
4
3
2
1
Set & Reset Voltages (V)
0
Before Test After Test
(c) Set & reset times
4
3
2
1
Set & Reset Times (ms)
0
Before Test After Test
Set Voltage
Reset Voltage
Set Time
Reset Time
(b) Contact resistances
200
100
50
20
Contact Resistance (mΩ)
Before Test After Test
(d) Transfer times
4
3
2
Transfer Time (ms)
1
0
Before Test After Test
N.O. Contact
N.C. Contact
At Set
At Reset
30
Figure 5.1 (2) High-temperature Test
Page 31
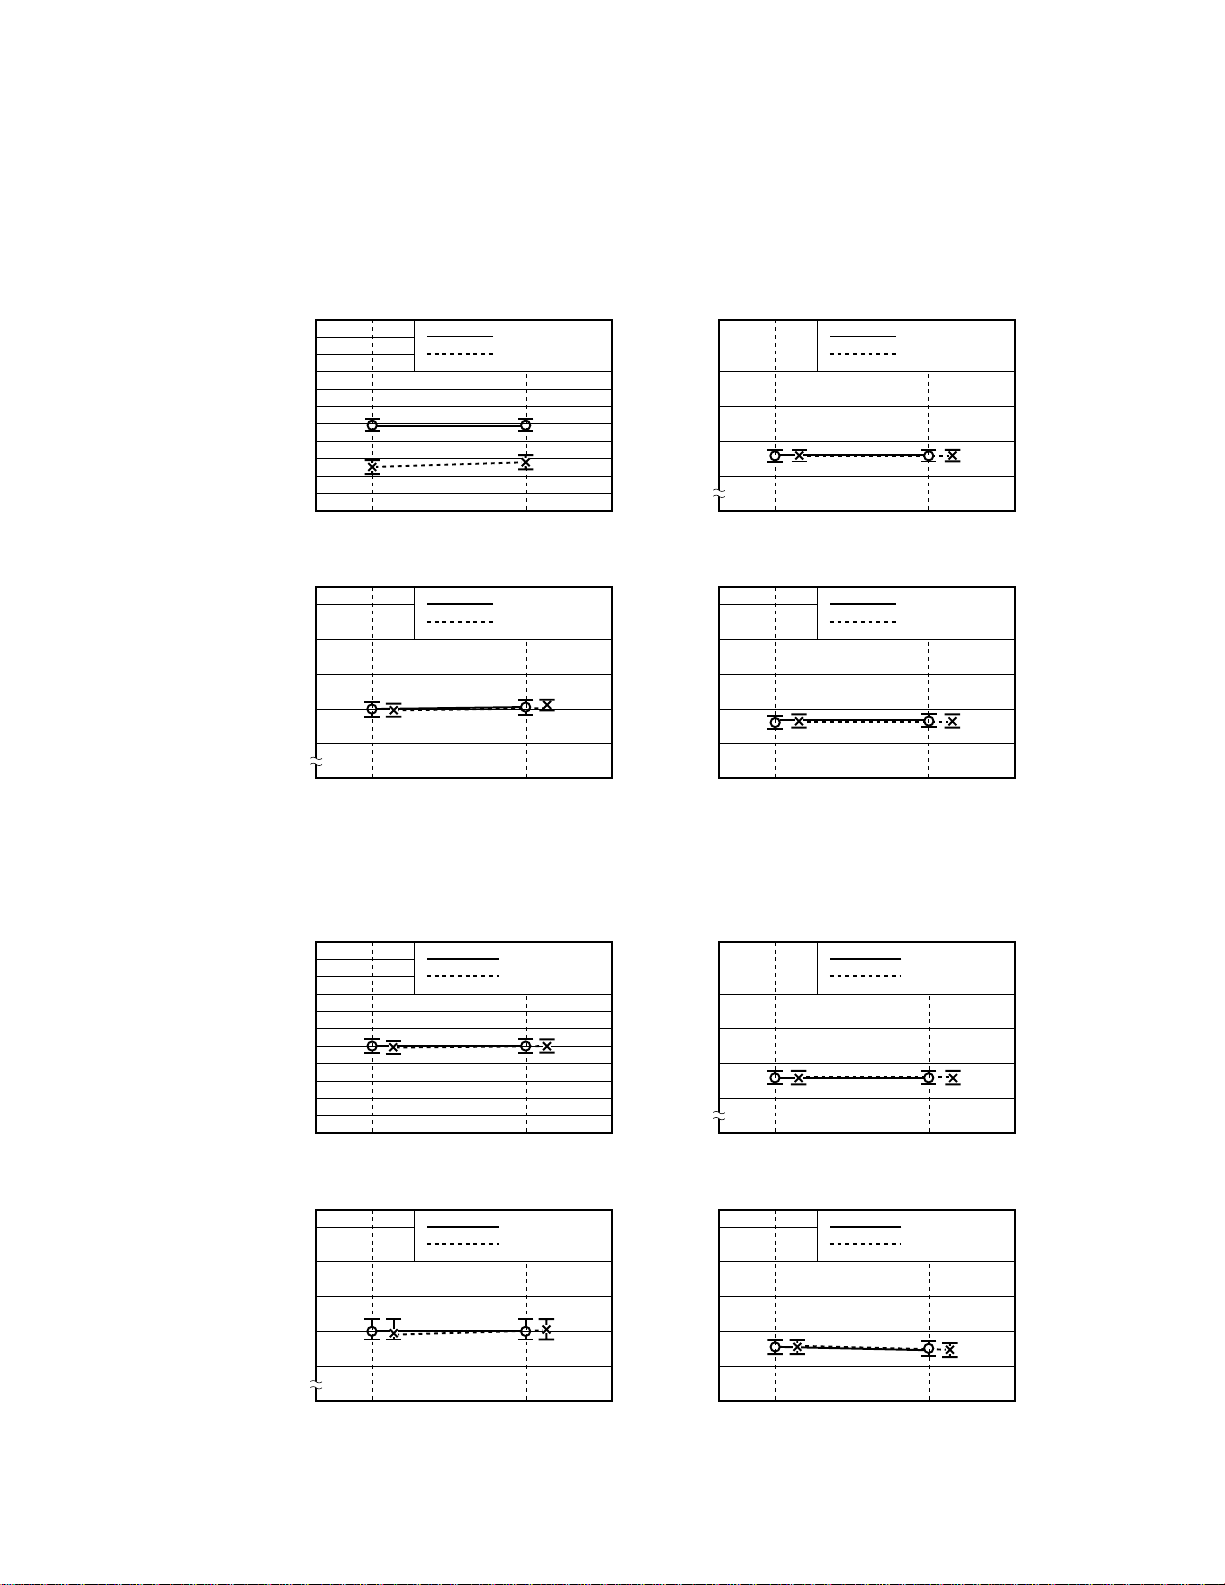
5.1.2 Low-temperature test (test conditions: temperature: –40˚C, duration: 800 hours, sample: 20 pcs. each)
This test is conducted to check whether the performance of the relay is degraded after the relay has been left at
the lower-limit value of the rated ambient temperature for the specified duration.
(1) Non-latching, 5-V type
(a) Operate & release voltages
5
4
3
2
1
0
Operate & Release Voltages (V)
Before Test After Test
(c) Operate & release times
4
3
2
1
0
Operate & Release Times (ms)
Before Test After Test
Figure 5.2 (1) Low-temperature Test
Operate Voltage
Release Voltage
Operate Time
Release Voltage
(b) Contact resistances
200
100
50
20
Contact Resistance (mΩ)
Before Test After Test
(d) Transfer times
4
3
2
Transfer Time (ms)
1
0
Before Test After Test
N.O. Contact
N.C. Contact
At Operation
At Release
(2) Latching of double-wound coil, 5-V type
(a) Set & reset voltages
5
4
3
2
1
Set & Reset Voltages (V)
0
Before Test After Test
(c) Set & reset times
4
3
2
1
Set & Reset Times (ms)
0
Before Test After Test
Set Voltage
Reset Voltage
Set Time
Reset Time
Figure 5.2 (2) Low-temperature Test
(b) Contact resistances
200
100
50
20
Contact Resistance (mΩ)
Before Test After Test
(d) Transfer times
4
3
2
Transfer Time (ms)
1
0
Before Test After Test
N.O. Contact
N.C. Contact
At Set
At Reset
31
Page 32

5.1.3 Moisture resistance test (test conditions: temperature: –10 ˚C to 65˚C, humidity: 90 to 95% RH, test cycles:
10, sample: 20 pcs. each)
This test is conducted to check whether the performance of the relay is degraded after the relay has been left in
a highly humid atmosphere for the specified duration.
(1) Non-latching, 5-V type
(a) Operate & release voltages
5
4
3
2
1
0
Operate & Release Voltages (V)
Before Test After Test
(c) Operate & release times
4
3
2
1
0
Operate & Release Times (ms)
Before Test After Test
Figure 5.3 (1) Moisture Resistance Test
Operate Voltage
Release Voltage
Operate Time
Release Time
(b) Contact resistances
200
100
50
20
Contact Resistance (mΩ)
Before Test After Test
(d) Transfer times
4
3
2
Transfer Time (ms)
1
0
Before Test After Test
N.O. Contact
N.C. Contact
At Operation
At Release
(2) Latching of single-wound coil, 5-V type
(a) Set & reset voltages
5
4
3
2
1
Set & Reset Voltages (V)
0
Before Test After Test
(c) Set & reset times
4
3
2
1
Set & Reset Times (ms)
0
Before Test After Test
Set Voltage
Reset Voltage
Set Time
Reset Time
Figure 5.3 (2) Moisture Resistance Test
(b) Contact resistances
200
100
50
20
Contact Resistance (mΩ)
Before Test After Test
(d) Transfer times
4
3
2
Transfer Time (ms)
1
0
Before Test After Test
N.O. Contact
N.C. Contact
At Set
At Reset
32
Page 33

5.1.4 Heat shock test (test conditions: temperature: –55˚C to 85˚C, test cycles: 100, sample: 20 pcs, each)
This test is to check whether the performance of the relay is degraded if the ambient temperature abruptly changes.
(1) Non-latching, 5-V type
(a) Operate & release voltages
5
4
3
2
1
0
Operate & Release Voltages (V)
Before Test After Test
(c) Operate & release times
4
3
2
1
0
Operate & Release Times (ms)
Before Test After Test
Operate Voltage
Release Voltage
Operate Time
Release Time
200
100
50
20
Contact Resistance (mΩ)
Before Test After Test
4
3
2
Transfer Time (ms)
1
0
Before Test After Test
Figure 5.4 (1) Heat Shock Test
(b) Contact resistances
N.O. Contact
N.C. Contact
(d) Transfer times
At Operation
At Release
(2) Latching of double-wound coil, 24-V type
(a) Set & reset voltages
Set Voltage
20
15
10
5
Set & Reset Voltages (V)
0
Before Test After Test
(c) Set & reset times
4
3
2
1
Set & Reset Times (ms)
0
Before Test After Test
Reset Voltage
Set Time
Reset Time
Figure 5.4 (2) Heat Shock Test
(b) Contact resistances
200
100
50
20
Contact Resistance (mΩ)
Before Test After Test
(d) Transfer times
4
3
2
Transfer Time (ms)
1
0
Before Test After Test
N.O. Contact
N.C. Contact
At Set
At Reset
33
Page 34

5.1.5 Vibration test (test conditions: amplitude: 1.52 mm, frequency: 10 Hz to 2000 Hz, 20 G peak, test time:
3 hours each in X, Y, and Z directions, totaling 9 hours, sample: 20 pcs. each)
This test is conducted to check whether the performance of the relay is degraded after vibration is continuously
applied to the relay while the relay is being transported.
(1) Non-latching, 5-V type
(a) Operate & release voltages
5
4
3
2
1
0
Operate & Release Voltages (V)
Before Test After Test
(c) Operate & release times
4
3
2
1
0
Operate & Release Times (ms)
Before Test After Test
Operate Voltage
Release Voltage
Operate Time
Release Time
200
100
50
20
Contact Resistance (mΩ)
4
3
2
Transfer Time (ms)
1
0
Figure 5.5 (1) Vibration Test
(b) Contact resistances
N.O. Contact
N.C. Contact
Before Test After Test
(d) Transfer times
At Operation
At Release
Before Test After Test
(2) Latching of single-wound coil, 5-V
(a) Set & reset voltages
5
4
3
2
1
Set & Reset Voltages (V)
0
Before Test After Test
(c) Set & reset times
4
3
2
1
Set & Reset Times (ms)
0
Before Test After Test
Set Voltage
Reset Voltage
Set Time
Reset Time
200
100
50
20
Contact Resistance (mΩ)
4
3
2
Transfer Time (ms)
1
0
Figure 5.5 (2) Vibration Test
(b) Contact resistances
N.O. Contact
N.C. Contact
Before Test After Test
(d) Transfer times
At Set
At Reset
Before Test After Test
34
Page 35

5.1.6 Shock test (test conditions: waveform: half sine wave, peak acceleration: 100 G, 6 times each in X, Y, and
Z directions, totaling 36 times, sample: 20 pcs. each)
This test is conducted to check whether the performance of the relay is degraded after an abrupt shock is applied
to the relay while the relay is being transported.
(1) Non-latching, 5-V type
(a) Operate & release voltages
5
4
3
2
1
0
Operate & Release Voltages (V)
Before Test After Test
(c) Operate & release times
4
3
2
1
0
Operate & Release Times (ms)
Before Test After Test
Operate Voltage
Release Voltage
200
100
Contact Resistance (mΩ)
Operate Time
Release Time
Transfer Time (ms)
Figure 5.6 (1) Shock Test
(b) Contact resistances
N.O. Contact
N.C. Contact
50
20
Before Test After Test
(d) Transfer times
At Operation
At Release
4
3
2
1
0
Before Test After Test
(2) Latching of single-wound coil, 5-V type
(a) Set & reset voltages
5
4
3
2
1
Set & Reset Voltages (V)
0
Before Test After Test
(c) Set & reset times
4
3
2
1
Set & Reset Times (ms)
0
Before Test After Test
Set Voltage
Reset Voltage
Set Time
Reset Time
Figure 5.6 (2) Shock Test
(b) Contact resistances
200
100
50
20
Contact Resistance (mΩ)
Before Test After Test
(d) Transfer times
4
3
2
Transfer Time (ms)
1
0
Before Test After Test
N.O. Contact
N.C. Contact
At Set
At Reset
35
Page 36

5.1.7 Resistance to solder heat test (test conditions: solder temperature = 260 ± 10˚C, immersion time: 10
seconds, sample: 20 pcs. each)
This test is conducted to check whether the performance of the relay is degraded after the relay has been exposed
to heat when it is soldered to a printed circuit board (PCB).
(1) Non-latching, 5-V type
(a) Operate & release voltages
5
4
3
2
1
0
Operate & Release Voltages (V)
Before Test After Test
(c) Operate & release times
4
3
2
1
0
Operate & Release Times (ms)
Before Test After Test
Figure 5.7 (1) Resistance to Solder Heat Test
Operate Voltage
Release Voltage
Operate Time
Release Time
(b) Contact resistances
200
100
50
20
Contact Resistance (mΩ)
Before Test After Test
(d) Transfer times
4
3
2
Transfer Time (ms)
1
0
Before Test After Test
N.O. Contact
N.C. Contact
At Operation
At Release
(2) Latching of single-wound coil, 12-V type
(a) Set & reset voltages
10
8
6
4
2
Set & Reset Voltages (V)
0
Before Test After Test
(c) Set & reset times
4
3
2
1
Set & Reset Times (ms)
0
Before Test After Test
Set Voltage
Reset Voltage
Set Time
Reset Time
Figure 5.7 (2) Resistance to Solder Heat Test
(b) Contact resistances
200
100
50
20
Contact Resistance (mΩ)
Before Test After Test
(d) Transfer times
4
3
2
Transfer Time (ms)
1
0
Before Test After Test
N.O. Contact
N.C. Contact
At Set
At Reset
36
Page 37

5.1.8 Resistance to reflow solder heat test
This test is conducted to check whether the performance of the relay is degraded after the relay has been exposed
to heat when it is soldered to a printed circuit board (PCB).
Test condition:
<1> Soldering method: IRS (Infrared Ray Soldering)
<2> PCB: Material epoxy-glass
Thickness 1.6 mm
Size 25 × 30 cm
<3> Temperature measurement point: Printed circuit board surface near the relay terminals
<4> Temperature profile: Refer to Figure 5.8
Tmax.: 235
200
175
150
Temperature (°C)
30 sec.
200 sec.
80 sec.
Figure 5.8 Temperature Profiles
37
Page 38

[EF2 series]
(1) Non-latching, 5-V type
(a) Operate & release voltages
5
4
3
2
1
0
Operate & Release Voltages (V)
Before Test After Test
(c) Operate & release times
4
3
2
1
0
Operate & Release Times (ms)
Before Test After Test
Figure 5.8 (1) Resistance to Reflow Solder Heat
Operate Voltage
Release Voltage
Operate Time
Release Time
(b) Contact resistances
100
50
20
10
Contact Resistance (mΩ)
Before Test After Test
(d) Transfer times
4
3
2
Transfer Time (ms)
1
0
Before Test After Test
N.O. Contact
N.C. Contact
At Operation
At Release
(2) Latching of single-wound coil, 12-V type
(a) Set & reset voltages
20
16
12
8
4
Set & Reset Voltages (V)
0
Before Test After Test
(c) Set & reset times
4
3
2
1
Set & Reset Times (ms)
0
Before Test After Test
Set Voltage
Reset Voltage
Set Time
Reset Time
(b) Contact resistances
N.O. Contact
N.C. Contact
100
50
20
10
Contact Resistance (mΩ)
Before Test After Test
(d) Transfer times
At Set
At Reset
2
1
Transfer Time (ms)
0
Before Test After Test
38
Figure 5.8 (2) Resistance to Reflow Solder Heat
Page 39
5.1.9 Terminal strength test (test conditions: ambient temperature: 25˚C, tensile strength: 1.36 kg, number of
times of bending: 2, sample: 10 pcs. each)
The purpose of this test is to check whether the performance of the relay is degraded after an excessive force
is applied to the terminals of the relay when the relay is mounted on a PCB.
(1) Non-latching, 5-V type
(a) Operate & release voltages
5
4
3
2
1
0
Operate & Release Voltages (V)
Before Test After Test
(c) Operate & release times
3
2.5
2
1.5
0
Operate & Release Times (ms)
Before Test After Test
Operate Voltage
Release Voltage
Operate Time
Release Time
200
100
50
20
Contact Resistance (mΩ)
Before Test After Test
2
1.5
1
Transfer Time (ms)
0.5
0
Before Test After Test
Figure 5.9 (1) Terminal Strength
(b) Contact resistances
N. O. Contact
N. C. Contact
(d) Transfer times
At Operation
At Release
(2) Latching of single-wound coil, 5-V type
(a) Set & reset voltages
5
4
3
2
1
Set & Reset Voltages (V)
0
Before Test After Test
(c) Set & reset times
3
2.5
2
1.5
Set & Reset Times (ms)
0
Before Test After Test
Set Voltage
Reset Voltage
Set Time
Reset Time
Figure 5.9 (2) Terminal Strength
(b) Contact resistances
200
100
50
20
Contact Resistance (mΩ)
Before Test After Test
(d) Transfer times
2
1.5
1
Transfer Time (ms)
0.5
0
Before Test After Test
N.O. Contact
N.C. Contact
At Set
At Reset
39
Page 40

5.2 Contact life tests
This section shows the results of tests conducted to examine the service life of the contacts, which has a significant
influence on the life of the relay.
To test the service life of the contacts, the operate and release voltages, contact resistance, operate and release
times, and transfer time of each relay is measured each time the relay has performed the specified number of
operations under the specified conditions.
The service life of contacts of the ED2 series relay is equal to the one of the EF2 series relay, because they have
common structure.
For changes in the characteristics, refer to the graphs shown below.
5.2.1 Non-load test (driving frequency: 50 Hz, ambient temperature: +25˚C, sample: 10 non-latching types (rated
at 5 V))
The cleanness of the contact surfaces influences the result of this test because no electric load is applied to the
relay.
(a) Operate & release voltages
5
4
3
2
1
0
Operate & Release Voltages (V)
Before Test
Number of Operations (×10
(c) Operate & release times
4
3
2
1
0
Operate & Release Times (ms)
Before Test
Number of Operations (×10
510 Before Test 510
510 Before Test 510
(b) Contact resistances
Operate Voltage
Release Voltage
6
Times) Number of Operations (×106 Times)
Operate Time
Release Time
6
Times) Number of Operations (×106 Times)
200
100
50
20
Contact Resistance (mΩ)
4
3
2
Transfer Time (ms)
1
0
(d) Transfer times
N.O. Contact
N.C. Contact
At Operation
At Release
40
Figure 5.10 Non-load Test A
Page 41

5.2.2 Resistive load test A (contact load: 10 Vdc, 10 mA, resistive, driving frequency: 2 Hz, ambient temperature:
+85˚C, sample: 10 non-latching types (rated at 5 V))
This test is conducted with a load equivalent to the signal level of an IC applied to the relay.
(a) Operate & release voltages
5
4
3
2
1
0
Operate & Release Voltages (V)
Before Test
Number of Operations (×105 Times)
510
(c) Operate & release times
4
3
2
1
0
Operate & Release Times (ms)
Before Test
Number of Operations (×105 Times)
5
Figure 5.11 Resistive Load Test B
Operate Voltage
Release Voltage
Operate Time
Release Time
10
(b) Contact resistances
1
0.5
Contact Resistance (mΩ)
Before Test
Number of Operations (×105 Times)
(d) Transfer times
4
3
2
Transfer Time (ms)
1
0
Before Test
Number of Operations (×105 Times)
N.O. Contact
N.C. Contact
510
At Operation
At Release
510
5.2.3 Resistive load test B(contact load: 50 Vdc, 100 mA, resistive, driving frequency: 5 Hz, ambient temperature:
+85˚C, sample: 10 non-latching types (rated at 5 V))
The load conditions of this test are equivalent to the voltage and current levels of a public telephone circuit.
(a) Operate & release voltages
5
4
3
2
1
0
Operate & Release Voltages (V)
Before Test
Number of Operations (×105 Times)
510
(c) Operate & release times
4
3
2
1
0
Operate & Release Times (ms)
Before Test
Number of Operations (×105 Times)
5
Operate Voltage
Release Voltage
Operate Time
Release Time
10
200
100
50
20
Contact Resistance (mΩ)
4
3
2
Transfer Time (ms)
1
0
(b) Contact resistances
N.O. Contact
N.C. Contact
Before Test
Number of Operations (×105 Times)
510
(d) Transfer times
At Operation
At Release
Before Test
Number of Operations (×105 Times)
510
Figure 5.16 Resistive Load Test E
41
Page 42

5.2.4 Resistive load test C (contact load: 30 Vdc, 1 A, resistive, driving frequency: 1 Hz, ambient temperature:
+25˚C, sample: 10 non-latching types (rated at 5 V))
The load conditions of this test are at the maximum switching current and maximum switching power with the
contacts switching a DC load.
(a) Operate & release voltages
5
4
3
2
1
0
Operate & Release Voltages (V)
Before Test
Number of Operations (×105 Times)
(c) Operate & release times
4
3
2
1
0
Operate & Release Times (ms)
Before Test
Number of Operations (×10
Figure 5.13 Resistive Load Test H
Operate Voltage
Release Voltage
1
Operate Time
Release Time
1
5
Times)
(b) Contact resistances
200
100
50
20
Contact Resistance (mΩ)
Before Test
Before Testof Operations (×105 Times)
(d) Transfer times
4
3
2
Transfer Time (ms)
1
0
Before Test
Number of Operations (×105 Times)
N.O. Contact
N.C. Contact
1
At Operation
At Release
1
42
Page 43

[MEMO]
43
Page 44

[MEMO]
44
 Loading...