

@
Ol:lO.LOW
"::JNI"
Isal
ba
walsAS
"l::I3dO
01
d.
S,l::I
I a
suollBolunwwoo
JaZAIBU"
N"II\I
,,,n
III!'!
a iii
tI
...
f'-
tI
•
tlDDIl
.
IIII
.
. .
8-99V69018d89
_.
.,.."..
...
'
.....
....

MOTOROLA TEST
EQUIPMENT
PRODUCTS
LIMITED WARRANTY
e
"product")that
ape
'odofone
(EXCLUDES
(I)
yearfrom
EXPORT
are
SHIPMENTS)
manufactured or distributed by
Motorola
Communications
dateofshipment against defects in material and workmanship.
purchaser only.Inthe eventofa defect, malfunction, or failure during the periodofwarranty,
ep
ace
the product providing that
e productisreturned to
of
dateofshipment (packing listorinvoice) must accompany the returnofthe defective product.
Motorolaat1313
oduct to Purchaser shallbeprepaid by
Motorola
Motorola.
receives
written notice specifying
the
natureofthe defect
East Algonquin Road, Schaumburg,IL60196 transporta-
Group
Parts
(a)
T
Ib)
Ic)
In
the
event~l0 ola elecu
moduleorsuba5sem
remain in
PRESS OR
TY,
for
eo
IMPLlED.I~CLL:DI~G
ARE
EXCL
I e
DED.
~
to
.
it
a
ep
ace module
..e1,'i<=hle components or modules are broken;
a~..
epa'
a defecti-e product by replacing a module or subassembly,
or
econditioned replacement moduleorsubassembly. Only the unexpired warrantyofthe warranty product will
AS\'
accordance with the procedures described in the operating instruction;
51Be.
abuse, damage, accident, negligence, repairoralteration.
spe<'ial,
incidental, or consequential damages.
or
subassembly.
I~PLlED
EXCEPTASSPECIFICALL
WARRANTYOFFITNESS FOR A
SUPPORT SERVICES
For
'er,i,eonyour.
lotaro/a
test
eqUipment in the U.S. contact the
Test
Equipment Service Cenrer, Schaumburg,
Schaumburg. Illinois 601%orcall theTet Equipment Service Hotline: 800/323·6967
1-3J2-576-70~5.
Outside the
l'.S.
con
a;:-t
your
nearest
\10torola representative.
MODULE EXCHANGE PROGRAM
Modular
de1i\'ery. Outside the '.S. omact your nearest
,onslruclion
The
grams
for
Motorola
o!'
he
Motorola
products
storedinsemiconductor
certain
reproduceinany
grams
containedinthe
any
manner
shall
copyrights,
use
that
without
notbedeemed10grant
patentsoroatent
arisesbyoperallonoflawinthe
R_Iallow'
describedinthis
exclusive
form
the
copyrighted
Motorola
the
express
field replacementofindividual assemblies. Contact the
~10torola
memoriesorother
rights
products
written
either
applicationsofMotorola,
representative.
COMPUTER
SOFTWARE
instruction
manual
media.
for
copyrighted
computer
computer
program.
describedinthis
permissionofMotorola.
directlyorby
implicalion,
except
saleofa
product.
COPYRIGHTS
may
Lawsinthe
programs,
Accordingly,
instruction
Furthermore,
estoppel,orotherwise,
for
the
include
United
any
manual
normal
Motorola,atits option, may replace
Y SET
FORTH
PARTICULAR
HEREIN.
ALL
PURPOSE OR
1313E.Algonquin Rd.,
during
normal business hours. In Illinois call
Tesl
Equipment Service Center for pricing
copyrighted
States
including
copyrighted
may
the
non·exclusive,
and
the
Motorola
other
exclusive
Motorola
computer
countries
righttocopy
computer
notbecopiedorreproduced
purchaseofMotorola
any
license
royalty
free
such
WARRANTIES
MERCHANTABILI-
EPS·30828-0
pro-
preserve
or
pro·
in
products
under
the
license
to
EPS-34440·B
defective
EX-
and
Specifications
(~,
Motorola,
• Printed in U.S.A
Prlvste·Line,
subjecttochange
and
.•
Digital
;g'
1985 Motorola Inc.
without
Prlvate·Une
notice.
are
trademarksorMotorola,
Inc
.
MOTOROLA
Communications
Sector
maaa
lIaElEI
.allEl
?OWER
Ct.·
J •
OISPI.A'(
·'
...
·
',.
•
."
•
..
·
•
I,,;.
••
·
.....•
·
~
.....
F'\JNCTION
"'.
,.
"-
,
" •
iCMotorola, Inc.
All Rights Reserved
PrintedinU.S.A.
1985
COMMUNICATIONS
ANALYZER R·2001 D
Motorola
Equipment Products
1313E.Algonquin
Schaumburg,lL60196
Test
iii
SYSTEM
Rd.
63P81069A66-B
7/15/85
PHI

AI

MOTOROLA
Communications
Sector
INC.
SAFE
HANDLING
OF CMOS
INTEGRATED CIRCUIT DEVICES
Manyofthe integrated circuit devices used in communications equipment are
tary Metal Oxide Semiconductor) type. Because
high open circuit impedance, CMOS ICs
to
damage from static charges. Care must be taken in
handling, shipping,
assemblies in which they are used.
though
Even
IC
CMOS
overvoltage in the hundreds
encountered in an operating system.
elements distribute static charges
circuits, decreasing the chance
inputs, the protectioniseffective only against
CMOS circuits
of
the modules eveninasystem.
~
To
avoid damagetocircuits, observe the following
handling, shipping,
protection devices
canbedamaged by improper handling
and
of
the CMOS (Complemen-
are
and
servicing them
are
of
volts range such as are
In
a system, circuit
and
load the CMOS
of
damage. However,
servicing precautions.
of
their
vulnerable
and
the
provided in
2.
Whenever possible, avoid touching any electrically conductive parts
hands.
3.
Normally, circuit modules can be inserted
removed with power applied to the unit. However,
check the
tions
diagram to insure there are no objections
tice.
carpeted areas, dry environments,
clothing (silk, nylon, etc.) because they contribute to
static buildup.
be grounded.
equipment to the circuit module
INSTALLATION
of
the manual as well as the module schematic
4. When servlcmg a circuit module, avoid
5.
All electrically powered test equipment should
Apply
of
the circuit module with your
and
MAINTENANCE
to
and
certain types
the ground lead from the test
sec-
this prac-
before connecting the
or
of
test probe. Similarly, disconnect the test probe prior to
1.
Prior
to and while servicing a circuit module,
particularly after moving within the service area,
momentarily touch
grounded surface. This will discharge any static charge
which may have accumulated
servicing.
both hands to a bare metal earth
on
the person doing the
removing the
6.
it
is
desirabletolay itona conductive surface (such as a
sheet
of
through
groundlead.
If
a circuit moduleisremoved from the system,
aluminum foil) whichisconnectedtoground
lOOkofresistance.
NOTE
Wearing
(Motorola
static buildup during servicing.
When wearing Conductive Wrist Strap,
be careful near sources
The good
strap will also increase the danger
lethal shock from accidentally touching
high voltage sources.
©
Motorola,
All Rights Reserved
Printed in
Inc. 1982
U.S.A.
Conductive
No.
RSX-4015A) will minimize
WARNING
of
ground
providedbythe wrist
~t11rmfi@Ql11
Wrist
high voltage.
Strap
1301E.Algonquin
of
If
the aluminum foilisconnected directly
ground,
to
trical shock from contacting the foil
same time as
7.
When soldering, be sure the soldering iron
grounded.
Priortoconnecting jumpers, replacing circuit
8.
or
components,
necessary in the replacement
device), be sure to discharge any static buildup as
described in procedure
exist across the
ly
one
hand
CMOS
w«
n
ltJifi'il~
Road, Schaumburg, II. 60196
v
device
#@If\VIfi@@d
touching CMOS pins (if this becomes
human
be usedifitisnecessary to
and
WARNING
be cautiousofpossible elec-
at
other
electrical circuits.
of
an
integrated circuit
1.
Since voltage differences can
body, itisrecommended
touch
pinsonthe
associated
board
wiring.
68P81106E84-C
12/10/82-
the
that
PH!
is
on-

9.
When
device, leave
ductive
cuit module.
pulse generators, etc.) should be connectedtoCMOS
foam
10.
All low impedance test
replacing a
the
device in its metal rail
until it istobe inserted into
CMOS
equipment
integrated circuit
containerorcon-
the
printed cir-
(such as
device inputs
cuitry. Similarly, such low impedance
be disconnected
11.
the factory will be packaged in a conductive material.
Any modules being
another
(aluminum foil
CONDUCTIVE
modules.
after
powerisappliedtothe
before
poweristurned
Replacement modules shipped separately from
should be
may
MATERIAL
transported
wrapped
be used).
from
in a simlar material
NEVER
for packaging these
CMOS
equipment
off.
One
USE
should
area
NON-
cir-
to
J
~
vi

R·2001D
Specifications
Communications
System
Analyzer
Signal Generator Mode
OperatinglDisplay
Stabilization
SPECTRAL
Exlerna
Frequency
Externalllnternal
Frequency
DOUBLE
Carrier
SWEEP GENERATOR
Adjustable sweep width from
chronized
Modes:
FREQUENCY
Range:
Resolution:
Accuracy:
Time:
OUTPUT
Attenuator:
Range FM:
Range
AM:
Accuracy:
PURITY
Spurious:
Harmonics:
FREQUENCY
MODULATION
Deviation:
Residual
Residual
MODULATION
External
SIDEBAND
Suppression:
to
FM:
AM:
III
nterna
I
Range:
Modes:
AMPLITUDE
Range:
Range:
Input:
Modes:
SUPPRESSED CARRIER
Range:
MODE
internal scope display
Monitor Mode
Frequency
FREQUENCY
Input
to
999_9999
Spurious
Range: 1 MHz 10999.9999 MHz
Resolution:
Accuracy:
ERROR
Indicator:
Sensitivity:
(over
the4MHz
MHz
range)
Response:
Monitor Mode (Continued)
AMIFMICWfSSB Monllor
AMIFM/CWIDSBSC Generale
Signalling Simulator
Speclrum Analyzer
Duplex Generator
Memory Tables
Frequency Counter
Digital Vollmeler
Waltmeler
IF Display
Oscilloscope
Signal Sfrength Meter
SINAD/D,slortion Meier
10
kHz109999999
100
Hz
Refer10AccurAcy01master oscillator
.1
Sec
16
dB variable plus10dB steps over13ranges
1
I'V 101
1 I'V to .4 VRMS
± 3
dB
maximum
posilion.
- 40 dBc
-15dBc
0-75 kHz peak
20Hzmax @ 30010 3 kHz Irom f
1.0% max. @ 300to3 kHz from f
10
20 kHz. ± 3 dB
5 Hz
Internal, external, microphone or all
Simultaneously
01080%
5
Approx. 150 mV lor
Internal. external. microphone or all
slmullaneously
1 MHz to 500 MHz
100
Equal10that01masler oscillator
Autoran9ing
for Irequency error measurements on 1.0 kHz.
10.0 kHz and
resolution lor Irequency error less than 100
Special funcfion control will
quency readout to 1
15
(narrow band ± 6 kHz mod. acceptance)
70
OdB
Irom 1 to 500 MHz
Hz
1010kHz,
-15dB FREQUENCY COUNTER
10
kHz to10MHzata tixed sweep rale.
Hz
I'V
lor 10 dB
,.V lor10dB
± 100 kHz mod. acceptance)
- 40 dB typical
image al
10dBat
MHz
VRMS
with
slep
In
any other state
± 3 dB
80%
CRT
display. Resolution ±
1000
kH7
Hz
EtA
SINAD
EIA
SINAD
±21.4MHz
L.O harmonics
attenuatorin0
c
c
lime
base
10Hz
lull scale r:ln9"s. 1
allOW
+
(Wide
107
direcl fre-
band
MHz
resolution
dB
Syn-
Hz
Hz.
SIGNAL
General± 4 dB maXimum
SPECTRUM ANALYZER
DUPLEX GENERATOR
Frequency
Frequency
Frequency
Frequency
Normal
Period
Auto
DEVIATION
MEASUREMENT
AM
MEASUREMENTS
RF WATTMETER
Frequency Range: 1 MHz to 1 GHz
Dynamic
Frequency
Deviation Range: o
OSCILLOSCOPE
External
Synchronization:
Input
Counting
Tune (SCAN LOCK)
Acquisition
Scales:
Accuracy:
Peak
Deviation
Limit:
MODULATION
Range:
Accuracy:
STRENGTH
METER
Range:
Sensitivity:
Selectivity:
Range:
Scales:
Accuracy:
Protection:
Range:
Width:
Scan
Sensitivity:
Offset:
Resolution: 5 kHz
Accuracy:
Output
Level: - 35 dBm minimum
Response: 5Hz10
CRT Size: 8 em x
Response:
Vertical
Input
Ranges:
Sweep
Rates:
Range:
Display:
Sensitivity:
Frequency
Range:
Display:
Range:
Time:
Accuracy:
1.
10.
100
±5%01
Sel via keyboard10100Hzresolution(0kHz to
999kHz).
tion and will be aClive
oto 100%
±5%of reading
1 MHz
- 100 dBm to + 52 dBm. combined specilica-
lionofanlenna and transceiver ports
30 kHz Max @ 3 dB bandwidth
1
9.99.99.9,
± 10% Irom 1 Watt to 125 Watts
Over·temperalure
75
100 kHz per diVision to 1 MHzper division conIlnuously adjustable
- 95 dBm minimum
oMHz to
± .002%
DC
10
1
division
Internal. normal. and aulomatic mode Will; adjustable trigger level.
10Hzto 35 MHz
5 di9it autoranging
50 mV minimum
Determination
10Hz-100
4 digit auloranging
10100
In
to aUlomatically lind and Ihen tune
signal above - 30 dBm Operates from 1 MHz
to
5 sec typical10less than 1 sec.IFIimlled scan
is
+ 1
kHz full scale
reading
AUdible alarm Indicates limit condi
10
9999999
Walls
to 125 Watls
125 Watls
dB minimum
±
10
to±20
kHz peak
20 kHz. ± 3 dB
10
cm
105
MHz. 3 dB point
mV.
100
us.10us.
ulillzed.
mV.
1 ms. 1
kHz
kHz
the monitor mode. the unil has the capaollily
18Hz
Hz01aclual Inpul frequency
Specifications
in
all Monilor Modes.
MHz
MHz and fixed
inlO
50 ohm load
lV. 10V per div.
mS.Ol
103kHz.
conlinuedonnext
:±-
45
MHz
sec. .1 sec. per
3 digil auloranging
10
an ;!lPUI
page
vii

R·2001 D Communications System Analyzer
General (Continued)
DIGITAL VOLTMETER
ModesofOperation:
Readout:
DC
Accuracy: ± 1%01lull scale ± 1
AC Accuracy:
AC Bandwidth:
SIGNALLING
SIMULATOR
Frequency Range:
Resolution:
Output
Input Impedance:
Level:
SINADIDISTORTION
METER
Input Level:
SINAD Accuracy: ± 1dBal12dB
Distortion
Distortion
Range: 1%to20%
Accuracy:
ANALOG
SYNTHESIZER
TUNING (AST)
Step Size: Variable steps Irom 3200
Calibration:
TIME BASE
Standard TCXO:
Optional Ovenized
High
Stability:
Auloranging 3 digit display 1
fUll
± 5%
50Hzto20kHz
Encode
1
kHz
Single
Two-Tone
Universal10tone sequential
Digital sub·audlble squelch
Base Stallon
Mobile Telephone
516
SeleCI
5 Hz
Hz decode
0.1
Volts
3
10
05V10
0.5% distortion
2% distortionin10%1020% range
360°ofrolation.
32
Aging:
Temp
Aging:
Temp:
10.
10% range
Hz1032
100.300 vall
9999.9
GHz
per
scale
of
lull scale
and
Decode eapabilily for
fixed lone
Tone
Variable Frequency
sequential
Tone
IMTS
MTS
2805
Hz
lOne
paging
V Signalling
to
9999.99 Hz encode, 5.0Hzto
Hz. 5 Hzto9999.9 Hz
RMS
K ohms
into
minimum
10 Volts
paging
Remote
600 ohm
RMS
SINAD
LSD
in1%to
steps per 3600rotation (approximately)
± 1 x
10
- , per year
± 1 x
10-,maximum error over the
10
+55°C lemperature range
± 1 x
10-'
±
.05
0°to+ 55°C temperature range.
(Warmup
quency within
per year
x 10-,maximum error over the
10
± 5 x
10-,of
20
minules)
final Ire·
General (Continued)
Power and Environmental
AC,
100
VAG
10
130
VAG
or
200
VAC
10
260
VAG
Hz
baltery
option
cellular
cellular
I
Battery Option:
Dimensions:
Model
Nomenclature
R-200l D
Basic
R·200l OlHS
With
R·2002D
R·2002DIHS High
R·2004D
With
R-2004DIHS High
With
R·2005D
R-2005DIHS High
Weight:
Model
With
IEEE·488
Motorola
Motorola
swilch selectable47Hz
DC:
11.0to+.16
+
13.6
8.25
121emx
355
pack
high
stability
option
stability
oscillator
DES
option
stability
oscillator
SECURENET
stability
oscillator
ValiS.50minutes typical
In. higll x
pounds
39.~
1550
cm x 50.8
(basic
cover accessories
oscillator
and IEEE·4BB Bus
and
option
and
VDC
external Inpul
Ill.
model)
Motorola
Motorola
1063HZand 400
Wide
x 20.00 ill. deep
em}
excluding
(16.1
kg)
option
DES
SECURENET
option
R·200BD
With
cellular
option
R-20080lHS High
With
R-2009D
R·2009DIHS
option
R·20100
WithUKcellular
R·20l001HS High
R·20llDWith
R·2011DIHS High
option
R·202l0
With
R·2021
DIHS High
option
R·2045D
0°
I
With
R·2045DIHS High
and SECURENET
NOTE: Factory set 220
stability
oscillator
IEEE·4BB
With
high
Bus and
stability
option
stability
oscillator
IEEE-488 Bus and UK
stability
oscillator,
Motorola
Motorola
Trunked Radio
stability
DES
stability
oscillator
and SECURENET
oscillator
options
Voll
models
and
cellular
cellular
options
oscillator,
IEEE-48B Bus and
and UK
cellular
cellular
option
IEEE·488 Bus, and UK
option
and
Motorola
and
Motorola's
are
also
available. Add "/220"
option
option
Trunked Radio
options
DES
to model number.
Optional
RTp·l002A
Accessories
Baltery
Pack
RTL·4056B Protective Canvas Cover
RTL·4065A Transit Case
RTL-4075A
RTA-4000A
RF
Detector
Telescoping
Probe
Antenna
Vlll

OPERATOR'S MANUAL
COMMUNICATIONS SYSTEM ANALYZER R-200ID
TABLE
OF
CONTENTS
Limited Warranty
Safe Handling
Specifications
of
Table
List
List
List
Scope
Service
Test Equipment Service Centers
Replacement Parts Orders
Area
Installation
Packing
Initial Set-up
Battery Pack
Trace Rotation Adjustment
Accessories
Description
Front
Rear Panel
Bottom Panel
General
Power Section
Self-Test
Keypad
CRT
System Warnings
Function Section
Modulation Section
Fixed
Code Synthesizer
Modulation/Function
External Level
Display Section
Generate/Monitor
Generate
RF
RF
Generate Mode
RF
Analog Synthesizer Tuning (AST)
Contents
of
lllustrations
of
Tables
of
Abbreviations
of
Manual
Parts
Offices
Panel
Display Screen
I KHz Tone
Level
Output
Scan
Level
Control
Section 1
Section 2 - Description
Section
Metering
- Introduction
3 - Operation
Page
ii
v
VII Special Function Mode
ix
XI
xii
XIII
RF Sweep Generator
Monitor Mode
Special Function Control Codes
Auto
Tune
Mode
Scan Latch Mode
Monitor Section
Volume And Squelch Controls
Off-The-Air Monitor
Signal Strength Meter
I-I FM Demodulation
I-I Audio Filters
1-1
1-2
1-2
1-3
1-3
1-3
1-3
1-3
1-4
2-1
2-2
2-10
2-10
3-1
3-1
3-1
3-1
3-2 General Decode
3-2
3-2
3-3
3-3
3-3
3-3
3-4
3-4
3-4
3-4
3-4
3-4
3-5
3-5
3-5
AM Demodulation
Single Sideband Demodulation
Audio Monitor
Modulation
Spectrum Analyzer
Duplex Generator
RF Memory
Entry With Memory Table
Entry Without Memory Table
Preset Turn-On
Signaling Sequence
Signaling Sequence Menu
Decode Mode Screens
PL
Decode
DPL
Decode
A/B
Encode
Two-Tone Sequential Paging
5/6
Tone Encode
Cap
Codes
5/6
Tone Decode
Select V Encode
Select V Decode
General Encode
Mobile Telephone Signaling
IMTS Mobile Originated
IMTS Base Originated
MTS Mobile Telephone
2805 Base Originated
Tone Sequence
Tone Remote (Encode)
Tone
Remote (Decode)
Frequency Counter
(DVM/DlST)
External Wattmeter
Intermediate Frequency (IF) Mode
Oscilloscope Seclion
Scope
ACorScope
Addendum - Self Test Displays
Digital Voltmeter/Distortion Mode
DC
Page
3-5
3-5
3-6
3-7
3-8
3-8
3-8
3-8
3-8
3-8
3-8
3-9
3-9
3-9
3-9
3-9
3-9
3-10
3-10
3-11
3-11
3-11
3-11
3-11
3-11
3-12
3-13
3-13
3-13
3-13
3-14
3-14
3-14
3-15
3-15
3-15
3-15
3-
J6
3-16
3-16
3-17
3-17
3-17
3-17
3-18
3-18
3-19
3-19
3-20
3-20
3-21
ix
--
Section 4~Applications
Shop
Service
Receiver Sensitivity Test,
Audio
Receiver Sensitivity Test, 20 DB Quieting
Squelch Sensitivity Test
Audio
Audio
Modulation Acceptance Bandwidth
RF Preselector Shape
Receiver Frequency Adjustment
FM
Basic
& Deviation
"In-Line"
Audio Distortion
Audio Frequency Response
Setups
12
DB SINAD,
Distortion
Power
Frequency Response
Basic Terminated Measurements
Off-The-Air Measurements
Output
Transmitter Tests: Power, Frequency,
Power
Test
and
Bandwidth
Measurements
Page
4-1
4-3
4-5
4-7
4-7
4-9
4-9
4-11
4-13
4-15
4-15
4-15
4-16
4-19
4-21
Page
AM
Modulation Test 4-23
AM
Modulation Linearity Test 4-24
IF
Analyzer
Community Repeater Modulation 4-26
Wire Line Remote Base Modulation 4-28
Wire Line Remote Base;
Bandpass Cavity Tuning 4-36
Cavity
Desensitization Test: In-Service Duplexer 4-44
Ferrite Isolator Test 4-46
Service Request
DISPLAY
Phone
Phone
Transmit
Receive Line
Measuring Levels Across A Balanced
Generating Signals Across A Balanced Line 4-34
& Duplexer Tuning; Bandpass
Passband
AdjustmentofReject Notch
AdjustmentofReject NotchOnTransmit
Line Levels 4-30
Line
Input
Input
Adjustment
Form
Line Levels 4-30
Lin~
Adjustment
On
Receive Leg 4-40
4-25
4-30
4-30
4-32
4-38
4-38
Leg 4-42
4-49
x

LIST
OF
ILLUSTRATIONS
Figure
Communications System Analyzer R-2001D
I-I
Communications System Analyzer R-2001D
1-2
Typical Packaging - 3-37
Communications System Analyzer
2-1
Front
Panel Controls, Indicators,
and Connectors
2-2
Rear Panel
3-1
Power Controls
3-2 Keypad
3-3
Cathode
3-4
Function Section
3-5
CW
3-6
AM Display
3-7
SSB Display
3-8
SWP
3-9
Modulation Section
3-10 Display Modes
3-11
RF
3-12
Generate Mode Metering Display
3-13
RF Scan Control
3-14
Monitor Mode Metering Display
3-15
Monitor Section
3-16
Modulation Display
3-17 Spectrum Analyzer Display
3-18
Duplex Generator Section
3-19
Duplex Generator Display
3-20
RF Memory Display
3-21
Signaling Sequence Menu Display
3-22
Private Line Decode Display
3-23
DPL
3-24
Two Tone
3-25
5/6
3-26
5/6
3-27
Select V Encode Display
3-28
Select V Decode Display
3-29
General Encode Display
3-30 General Decode Display
3-31
IMTS Mobile Originated Display
3-32 IMTS Base Originated Display
3-33
MTS Mobile Telephone Display
3-34
2805 Base Originated Display
Ray Tube Display Screen
Display
Display
Section
Decode Display
(A/B)
Encode Display
Tone Encode Display
Tone Decode Display
Page
I-I
1-3
2-1
2-9
3-1
3-1
3-2
3-2
3-2
3-2
3-3
3-3
3-3
3-4
3-4
3-4
3-5
3-6
3-8
3-9
3-9
3-10
3-10
3-10
3-11
3-12
3-13
3-13
3-13
3-14
3-14
3-15
3-15
3-15
3-16
3-16
3-16
3-17
111
Figure
3-35
Frequency Counter Display
3-36 AC DVM Display
DC DVM Display
3-38
Distortion Analyzer Display
3-39
External Wattmeter Display
3-40
Oscilloscope Section
3-41
Destructive RAM Test
3-42
Non-volatile RAM
3-43
Checkerboard
3-44
Non Destructive RAM Test
3-45
Checksum
4-1
12
DB
SINAD Test Setup and Display
4-2
20
DB Quieting
4-3
Squelch Sensitivity Test Setup
4-4
Audio Frequency Response;
EIA Standard RS-204C
4-5
Probe
Setup
4-6
Frequency Adjustment Setup
4-7
Transmitter Tests Setup
4-8
Transmitter Test Setup;
Power Measurements
4-9
Audio Distortion Setup
4-10
Audio Frequency Response Setup
4-11
Audio Frequency Response;
EIA Standard RS-152B
4-12
AM Modulation Test Setup
4-13
AM Modulation Linearity Test Setup
4-14
Analyzer IF DISPLAY
4-15
Community Repeater Modulation Setup
4-16
Modulation Setup; Remote Base
4-17
Phone
4-18
BALUN Setup; Measuring Levels
4-19
BALUN Setup; Generating Signals
4-20
Bandpass Cavities Setup
4-21
Duplexer Passband Adjustment Setup
4-22
Duplexer Adjustment Setup;
4-23
Duplexer Adjustment Setup;
4-24
Desensitization Test Setup 4-45
4-25
Ferrite Isolator Test Setup
Line Levels Setup
Reject Notch On Receive Leg
Reject Notch
Pattern
Error
On
Error
Error
Screen
Screen
Transmit Leg
Screen
Error
Page
3-17
3-18
3-18
3-19
3-19
3-20
3-21
3-21
3-21
3-22
3-22
4-2
4-4
4-6
4-8
4-10
4-12
4-14
4-17
4-18
4-20
4-21
4-22
4-24
4-25
4-27
4-29
4-31
4-33
4-35
4-37
4-39
4-41
4-43
4-47
Xl

LIST OF TABLES
Table
2-1
3-1
3-2
3-3
3-4
3-5
3-6
Controls,
Modulation/Function
RF
Special
Audio
Valid
Valid
Output
Function
Filter
PL
DPL
indicators,
LevelAtAntenna
Control
Characteristics
Codes
Codes
and
Connectors
Availability
Port
Codes
Page
2-2
3-3 & 3-4
3-4
3-7
3-9
3-12
3-13
Table
3-7
Cap
Codes
3-8 Select V
3-9
iMTS
3-10
ToneBFunctions
3-11
Valid
Display
3-12
External
Sequence
Error
Input
Resolution
Wattmeter
Specification
Messages
Frequency
Versus
Elements
Page
3-14
3-14
3-16
3-17
3-18
3-19
--./
xii
'----'"

LIST OF ABBREVIATIONS
A
AC
AM
ANT
AST
ATTEN
AUTO
BALUN
BATorBatt
BFa
BNC
B.O.
B.O.S.
BW
C
Cal
CCIR
C&E
cm
CMOS
CONN
Cont
CRT
CW
dB
dBc
dBm
DC
Demod
DEV
DISC
Dispr
DIST
Div
DIy
DPL
Dplx
DSBSC
DVM
E/D
EEA
EIA
Ext
FM
FREQ
FWD
Ampere
Alternating
Amplitude
Antenna
Analog Synthesizer Tuning
Attenuation
Automatic
Balanced-to-unbalanced
Battery
Beat Frequency Oscillator
Bayonnet Type
Base Originated
Behorden Organisationen mit Sicherheitsaufgaben, (a
tion)
Bandwidth
Celsius
Calibrate
International
mittee
Communications
Motorola)
Centimeters
Complementary Metal Oxide Semiconductor
Connect
Continuous
Cathode
Continuous
Decibel
Decibel (referred
Decibel (referred to
Direct
Demodulation
Deviation
Disconnect
Dispersion
Distortion
Division
Delay
Digital Private Line, (a
tered
Duplex
Double
Digital Voltmeter
Encode/
Electronic Engineering Association
Electronics Industry Association
External
Frequency
Frequency
Forward
Current
Modulation
Connector
German
Radio Consultative Com-
Ray
Tube
Wave
Current
trademark)
Sideband Suppressed Carrier
Decode
Modulation
and
Electronics
to
carrier)
ImW
Standards
into 50 ohms)
Motorola
Associa-
(part
of
regis-
GEN
GHz
Horiz
HPFL
HS
Hz
IC
ID
IDC
IEEE
IF
1M
IMTS
in.
I/O
Kohm
kg
KHz
LED
LPFL
Lvi
MAX
MHz
MICormic
MIN
M.a.
MOD
MOD.
MONorMon
us
ms
MSEC
Mtr
MTS
MV
uV
mW
NAorN/A
NB
NEG
No.
#
ORIG
peT
PL
PN
pas
xiii
or
mV
Generate
Gigahertz
Horizontal
High Pass Filter
High Stability
Hertz
Integrated Circuit
Identification
Instantaneous
Institute
Engineers
Intermediate Frequency
Intermod
Improved Mobile Telephone System
Inches
Input/Output
Kilohm
Kilograms
Kilohertz
Light-Emitting Diode
Low Pass Filter
Level
Maximum
Megahertz
Microphone
Minimum
Mobile Originated
Modulation
Modified
Monitor
Microsecond
Millisecond
Millisecond
Metering
Mobile Telephone System
Millivolts
Microvolts
Milliwatt
Not
Applicable
Narrow
Negative
Number
Number
Originated
Percent
Private
mark
Part
Number
Position
Number
Deviation
of
Electrical
ulation
Bandwidth
Line, a
Motorola
Control
and
Electronics
registered trade-

pos
+/-
R
REF
REV
RF
RMSorrms
Rptr
RS
Positive
Plusorminus
Resistor
Reference
Reverse
Radio Frequency
Root-Mean-Square
Repeater
Receiver Specification
TCXO
I
TEL
Temp
TN
Trig
TX
UHF
UUT
Temperature
lator
Telephone
Temperature
Tone
Trigger
Transmitter
Ultra High Frequency
Unit
Under Test
Compensated Crystal Oscil-
SEC
or
sec
SEL
SENS
SEQorseq
Sig Signal
SINAD
SSB
STD
SW Switch
SWP
syncs
Second
Select
Sensitivity
Sequence
Ratio
Single Sideband
Standard
Sweep
Synchronizes
of
+Noise +Distortion
Signal
Noise +Distortion
V
VAC Volts Alternating
VCE Voice
VDC
Vert Vertical
VRMS Volts (root-mean-square)
VSWR Voltage Standing Wave Ratio
W
WB
I
XY
I
ZVEI
Volts
Volts Direct
Watts
Wide Bandwidth
(Select Any Valid Number)
Zentral-Verband der Elektro-Industrie, (a
German
Current
Electronics Industry Association)
Current
'----""
xiv

SECTION 1
INTRODUCTION
1.1
SCOPEOFMANUAL
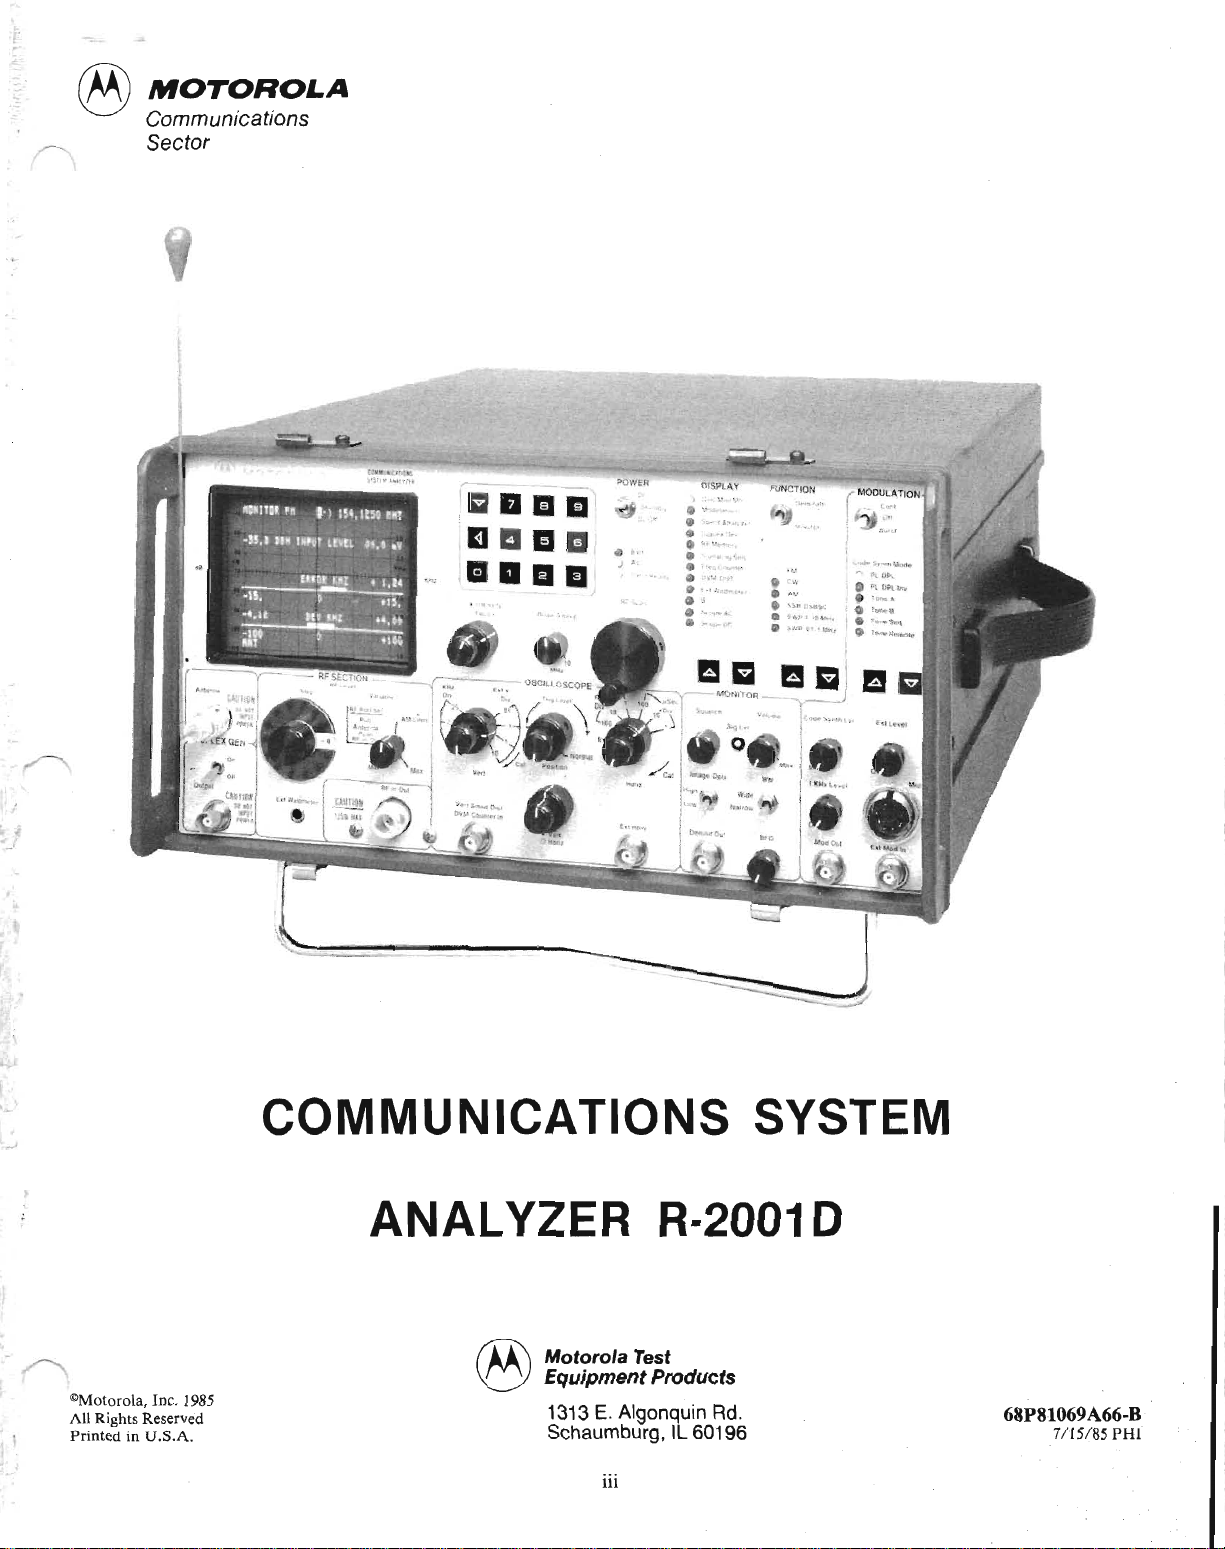
This manual contains information for using the portable Communications System Analyzer R-2001D shown
in figure
and functions for the technician to completely monitor
and service radio communications equipment in the
shop and in the field.
1.2 SERVICE
Motorola Test Equipment Service Centers service all
test equipment supplied by the Motorola Communications Sector. The Center maintains a stock
equipment replacement parts and a complete library
service information. The Center performs most inwarranty repairs.
tured by Motorola, the original supplier performs
repairs under the Center's direction. The Center performs out-of-warranty repairs on a time and materials
basis
Equipment Service Center, toll free at (800) 323-6967 or
at (312) 576-7025 in Illinois. Frequently, under the
direction
troubleshoots equipment to isolate a defective module. I
The Center then ships an exchange module immediat
1-1.
The Analyzer incorporates many devices
of
For
some equipment, not manufac-
at
competitive rates. Contact the Motorola Test
of
the Center via telephone, a technician
,
),;~
I
'\
L;I'~
¥
fO
/11
original
tc,'
;)1/6
1
'
)y.
£
of
I'
MOTOROLA TEST
MOTOROLA
Test Equipment Service Center
1313
Schaumburg,
Phone: 800-323-6967
Phone: 312-576-7025 (Illinois)
MAMS: NAGOU
TTY:
MOTOROLA
Test Equipment Service Center
2333 B. Utah Ave.
El Segundo, CA 90245
Phone: 213-536-0784
MOTOROLA
Hawaii Service Center
99-1180 Iwaena St.
Aiea,
Phone: 800-487-0033
TTY:
Ii
6{~
~
EQUIPMENT
C & E
E. Algonquin Rd. /
IL
910-693-0869
WEST COAST
C & E, INC.
HI
96701
63212
PARTS
60196 / I
,/"r::'
SERVICE CENTERS
I
COMMUNICATIONS
(a
a
III
II
1.11
•
FIGURE
SYSTEM
1-1
II
El1
II II
II
II
1-1.
ANALYZER
0-
v"
---=---
e«--I{oo
.-
~
:'::.-'-
...
-.,
•
i-.
·
'-'--'"
•
110'.."""
.,
....
..
..
"-_'
•
,,"_DC
'"
\
.,c...
-
.-
·
•
·
R·2001D
..
...
""""
,,"'L"_
--"'-'
..
c
-~
O"l.llPI._
•1_...
•
'_I
•
1_-
·
'-"'-"

MOTOROLA TEST EQUIPMENT SERVICE CENTERS
MOTOROLA AUSTRALIA PTY. LTD.
Test Equipment Service Center
666 Wellington Rd.
Mulgrave, VIC 3170
Melbourne
Phone: 3-561-3555
Telex: 32516 MOTOCOMA AA
Cable: MOTOCOM MELBOURNE
MAMS: FEMEL
MOTOROLA CANADA, LTD.
Test Equipment Service Center
3420 Pharmacy Ave.
Unit
11
Scarborough, Ontario MIW 2P7
Phone: 416-499-1441
TTY: 610-492-2713
MAMS: NAWIL
MOTOROLA FRANCE S.A.
Test Equipment Service Center
Zone Industrielle de la Petite
Montagne Sud
14
Allee du Cantal
CE
1455
F-91020 Evry Cedex
(6)
Phone:
07779025
Telex: 600434F MOTEV
MAMS: FAFEV
MOTOROLA
GmbH
F andV.ABT. Frachtzentrum FZF
6000 Frankfurt Main/Flughafen
West Germany
Attn: METEC
(0)
Phone:
Telex:
6128-702130
(0)
4182761 MOT D
MOTOROLA SOUTH AFRICA (PTY.) LTD.
Motorola House
5th St.
P.O.
Box 39586
Wynberg
Phone: 011-786-6165
Telex: 422-070-SA
Cable: MOTOROLA JOHANNESBURG
MAMS: FESAF
1.3 REPLACEMENT PARTS ORDERS
Send orders for replacement parts to the nearest
Motorola Area Parts Office or Test Equipment Service
Center.
Be
sure to include the complete identification
number located on the equipment. Direct inquiries to
the Area Parts Office including requests for part number identification and test equipment calibration or
repair.
MOTOROLA AREA PARTS OFFICES
MOTOROLA C
& E PARTS
1313E.Algonquin Rd.
Schaumburg, IL 60196
Phone: 800-323-6967
312-576-3900
MOTOROLA AREA PARTS OFFICES
EASTERN AREA PARTS
85
Harristown Rd.
Glenrock, NJ 07452
Phone: 201-444-9662
TWX: 710-955-5602
EAST CENTRAL AREA PARTS
12995
Snow Rd.
Parma,
OH
44130
Phone: 216-433-1560
TWX: 810-421-8845
GULF STATES AREA PARTS
1140
Cypress Station
P.O. Box 73115
TX
Houston,
77090
Phone: 713-537-3636
TWX: 910-881-6392
MID-ATLANTIC AREA PARTS
7230 Parkway Drive
Hanover, Maryland 20176
Phone: 301-796-8763
TWX: 710-862-1941
MIDWEST AREA PARTS
1313
E. Algonquin Rd.
Schaumburg, IL 60196
Phone: 312-576-7430
TWX: 910-693-0869
PACIFIC
P.O.
SOUTHWESTERN AREA PARTS
Box 85036
San Diego, CA 92138
Phone: 714-578-8030
TWX: 910-335-1516
SOUTHEASTERN AREA PARTS
P.O.
Box
368
Decatur, GA
30031
Phone: 504-987-2232
TWX: 810-766-0876
SOUTHWESTERN AREA PARTS
P.O.
Box 34290
3320 Belt Line Rd.
TX
Dallas,
75234
Phone: 214-620-8511
TWX: 910-860-5505
WESTERN AREA PARTS
1170 Chess Drive, Foster City
San Mateo,
CA
94404
Phone: 415-349-8621
TWX: 910-375-3877
MOTOROLA CANADA LTD.
National Parts Department
3125
Steeles Ave., East
Willowdale, Ontario M2H 2H6
Phone: 416-499-1441
TWX: 610-491-1032
Telex: 06-526258
...
1-2

ALL
OTHER
COUNTRIES:
MOTOROLA INC.
International Parts Dept.
Schaumburg,
IL
60196
Phone; 312-576-6482
TWX:
Telex:
910-693-0869
722443
Cable: MOTOL PARTS
1.4 INSTALLATION
U.S.A.
propriate connector on the Analyzer's rear panel. Connect the cord's other end to the power source.
For
AC,
use a grounded 3-wire 100-130 VAC or 200-260 VAC
power source. On the back
switch, select either 110 or 220 position.
the
LINE
R-2001D/220 or R-2002D1220
switch, as ordered.
panel's
will
two-position
The
Units
be pre-set for 220
LINE
factory sets
ordered as
VAC and will have a 3.0A fuse installed. Install a 3A
fuse for
110VAC
operation and a
lOA
fuse for DC
operation.
• PACKING
Foam pieces protect the Communications System
Analyzer packed inside a fiberboard carton.
figure 1-2, the unit
is
then packed in a larger container
As
shown in
for additional protection. Save the packing containers
and materials for future use.
OPERATION
1101220
12
VAC
VDC
Remove accessories from the cover
FUSE
3A
lOA
PART
as
NUMBER
65-20404
65-10266
needed. Insert the
whip antenna into the Antenna port located in the
Duplex Generator section
of
the front panel. Pull the
Antenna control located in the RF SECTION.
POWER switch, located on the front panel, to the On
position. When the Oven Ready indicator illuminates,
the frequency standard stabilizes and the Analyzer
ready for use instantaneously (with standard TCXO).
Before operating the Analyzer, carefully study the func-
of
tion and purpose
each control and feature. Become
familiar with the operating procedures described in this
manual.
CAUTION
When installing the Analyzer in a vehicle, fuse the DC
supply line close to the vehicle's battery. The DC-lOA
on
fuse, located
the Analyzer's rear pane!, protects it
against overload but does not protect the vehicle.
• BATTERY PACK
Attach the battery pack
to
the Analyzer's rear panel
with 2 clips and 2 screws. Align and slide the pack's
mounting clips into the slots on the mounting brackets
On
the left side. Align the captive screws with the
mounting holes
nect the power plug to the connector at the
on
the right side
and
tighten them. Con-
top
right
the rear panel.
Turn
is
of
FIGURE
1-2.
TYPICAL
PACKAGING-
COMMUNICATIONS SYSTEM ANALYZER
INITIAL
•
SET
-UP
Place the Analyzer on a workbench in the shop
mobile repair unit. Lower the bail underneath to raise
the Analyzer for easier viewing. Open the two latches
the bottomofthe cover, lift and slide the covertothe
to
side
Take the power cord (AC
separate the hinges. Remove the front cover.
or
DC)
thatisstored in the
cover. Attach the cord's female connector to the ap-
or
on
1-3
•
TRACE
Set DISPLAY to
ROTATION ADJUSTMENT
Gen/Mon
Mtr. Adjust intensity and
focus control to obtain a comfortable viewing
brightness. Remove the fine screws from the Analyzer's
rear panel and remove the top panel. To re-align a
tilting display screen, locate R-88 the third potentiometer located
on
the
A-2
module behind the front
panel. Insert the tuning tool in the resistor and slowly
rotate it while observing the front
the tool until the bargraph line
horizontal graticule line. Replace the panels
of
the screen. Rotate
is
parallel with the center
and
the screws.
tighten

• ACCESSORIES
SUPPLIED
FRONT COVER - The front cover protects the front
panel and its components during transit or while the
Analyzer is not in use.
The
front cover stun:s
the
cord, antenna, cables. and other equipment needed for
on-site servicing. PN #15·80335A70.
ANTENNA - The fused BNC connected antenna re-
PN
ceives off-the-air signals.
BNC to Type N Adapter.
DC POWER CONNECTOR KIT.
In-Line Wattmeter Adapter.
#TEKA-24A.
PN
#58-84300A98.
PN
#RTL-4055B.
PN
#RPX-4097A.
power
• MODEL OPTIONS
• Cellular Test Functions - Model R-2008D provides
capability in one test instrument for servicing traditional
PM
eommunje~tjons
~nd.
with
the
cellular option, the
new cellular radio systems:
•
CELL-TO-MOBILE
SIGNALING
ACCEP-
TANCE TESTS
• MOBILE-TO
CELL
SIGNALING
ACCEP-
TANCE TESTS
• AUTOMATIC RF TESTS
• MANUALLY SELECTED RF TESTS.
MANUAL - The Operator's Manual contains descriptions and instructions for properly using the Analyzer.
PN
#68P81069A66-0.
Oscilloscope
& Meter Probe - A probe
(xl),
attachments, provides general servicing needs.
PN
#RTL-4058A.
POWER
CORD - The three-conductor cord powers
the Analyzer by AC and charges the optional battery
pack. Its right-angle design allows the Analyzer to stand
on end. PN
#30-80336A36.
SUN SHADE - Snap the Sun Shade over the CRT
screen to observe displays even in bright sunlight.
PN
#15-80335A55.
TEST MICROPHONE.
12
VDC POWER CONNECTOR KIT.
OPTIONAL
•
ACCESSORIES
BATTERY PACK - A
rectly to the back
of
continuous operation. Built-in circuitry charges the
of
battery when the power switch
tion.
If
battery power falls below11volts, a warning ap-
PN
#RTM-4000B.
PN
#RPX-4097A.
13.6 volt battery attaches di-
the Analyzer to provide50minutes
isinOff
or Standby posi-
pears on the CRT. The battery can be installed in the
field
but
it cannot be used in conjunction with IEEE-448
Interface Bus or Blower.
DELUXE TELESCOPING ANTENNA.
PN
#RTP-1002A.
PN
#RTA-
4000A.
600
OHM
Use for
LINE
MATCHING
600
ohm balanced lines.
TRANSFORMER
PN
#RTL-1003A.
PROTECTIVE CANVAS COVER - A rugged, padded
fabric cover protects the Analyzer from excessive field
wear.
PN
#RTL-4056B.
with
• High Stability (HS) Oscillator - Use this oscillator
to improve stability over the standard TCXO time
base to
+/-5 X 10-
temperature range
8
maximum error, over the
of
0 to 55°C. A front panel LED
(Oven Ready) indicates when the ovenized crystal has
stabilized.
MODELS (See Specifications)
R-200ID Basic Model
R-200ID/HS
R-200lD/HSI220
R-2002D/HS
R-2002D/HSI220
R-2008D/HS
R-2008D/HSI220
R-2009D/HS
R-2009D/HSI220
• IEEE-488 STANDARD INTERFACE BUS
This option enables using the Analyzer
as
a programmable measurement instrument. For example, Analyzer Model R-2002D when combined with the suitable programmable controller and applications soft-
of
ware becomes the heart
tem. Control or monitor all
an automated RF test sys-
of
the Analyzer's functions via the IEEE Bus. Perform full sequential test
routines, quickly and repetitively, with little operator
interaction.
• MODULE SERVICE KIT
The Extender Board Kit aids servicing the Analyzer's
modules with printed circuit board edges. Use with
A2, A3, A4, A5, A6, A
PN
#RPX-4379A.
7,
A9, and A12 modules.
RF DETECTOR PROBE.
TRANSIT CASE.
PN
#RTL-4065A.
PN
#RTL-4075A.
1
1-4

SECTION 2
DESCRIPTION
POWER
On
.BElIl
Dc
011
lIaElEI
dB
~~~~--,--:;:::----:~-
-
m.IIEI
•
ltlll!!"!III)
fo(v-
"HI
0""
J 5 I - +
(
.15
Vert
OSCILLOSCOPE
e.,
v
§O~~
(:o,e."",
I
o /
/c.,
Aulo
/C
PaS'llon
Norm;ll
mSec
t~:
'
E"
Hom
eltl!10••l
-
DISPLAV
• Gcn
•
Modl,I.llfo"
Spt;l(;t
OUpl~)
•
SI,ll,IIl!l9
•
Fr£l'(J
DVM
E~t
"
ScoppAC
Scop~
.......
,_-MONITOR
Squelch
011
11I1"9~
low
DotlruodOl,lt
MonMh
An.ttVltlf
MemOtt
Gaumer
Olsr
\"hmtTlewr
Opl.
oc
Gen
s.g
eQ
L'I'
•
WIde
Narrow
FUNCTION
•
•
•
o
SWP.Ol·lMt-h.
----..
VoluMe
8W
BFO
FM
CW
AM
sse
S'NP
MomlOI
OSB$C
'·IQMH7
__
Code
Mm
ll<Hz
Oll
--
Mod
SYnlh
LCIlt;1
Out
MODULATION
lvl
FIGURE 2-1. FRONT
PANEL
CONTROLS, INDICATORS, AND CONNECTORS.
2.0 DESCRIPTION
The
R-2001D Communication System Analyzer shown in figure 2-1,isa portable test instrument designedtomonitor
service radio communications equipment over the frequency rangeofI
trols, indicators, connectors
errors,
and
performs a varietyoftests normally associated with the following devices:
and
their functions.
The
Analyzer generates signals, measures modulation
Spectrum analyzer
Duplex offset generator
Modulation oscilloscope
Frequency counter
AC/DC
RF
digital-analog voltmeter
wattmeter
General purpose oscilloscope
Multimode code synthesizer
Sweep generator
Signaling encoder I decoder
Signal strength meter
Automatic scan latch counter.
MHz
to 1
GHz.
Table
2-1
lists the Analyzer's con-
and
frequency
and
2-1

TABLE 2-1. CONTROLS, INDICATORS,
AND
CONNECTORS
ITEM DESCRIPTION
Power
Batt indicator
AC
indicator
Oven Ready indicator
KEYPAD
FRONT
Three-position toggle
switch
LED (red)
LED (red)
LED (red)
Twelve-key pushbutton
keypad
FUNCTION
PANEL
(figure 2-1)
On position energizes all circuitry.
Standby position removes DC from all circuitry except the
frequency standard
and
battery charger.
At off, the battery chargesifequipment is connected to
AC
power source.
Illuminates when equipment uses DC power.
Illuminates when equipmentisconnected to an
source. PositionofPOWER
switch has no effect
dicator. Equipment automatically switches to
source when connected to AC line voltage.
Illuminates when optional frequency standard oven has
stabilized. Continuously illuminated with the
TCXO
quency standard.
Enters variables into microprocessor memory and onto
CRT
screen, selects variables from the memory for display,
changes previous entries.
AC
AC
an
power
on
in-
power
fre-
~
~
othrough 9
CRT
• Intensity
o Focus
Dispr/Sweep Control
Line cursor key
Horizontal cursor key
Numerical keys
Cathode Ray Tube
Stacked concentric
potentiometers:
Small center knob
Large outside knob
Potentiometer
Moves the cursor down only to the next available line on the
screen, skips preset permanent entries, from the last line it
returns to the top line.
Moves the horizontal cursor left to the next available position
that
may be changed. From the last left position, the
cursor moves to the far right with the next entry.
Enter a value directly
or
select a value stored in the
memory.
8 cm x10cm screen displays all functions, generated
monitored, in both analog and digital form. Also displays
all control settings and numerical values, enteredorpreset.
Controls display intensity.
Controls display focus.
Controls the frequency span (1-10 MHz) during Spectrum
Analyzer
SWP
DlSPLAY.Provides sweep width control during
FUNCTION (0.01-1
MHzor1-10 MHz).
~
or
RF
Scan Control
Analog Synthesizer Tuning
(AST)
Manually scan any displayed frequency by rotating this
control clockwiseorcounterclockwiseatthe rateof32 frequency steps per revolution. Positionofdisplay cursor determines step size.
2-2
'---'"

TABLE 2-1. CONTROLS, INDICATORS, AND CONNECTORS
DISPLA
ITEM
Y indicators Twelve LED's
DESCRIPTION
FRONT
FUNCTION
PANEL
(figure 2-1)
Illuminate one
operation the equipmentisperforming
the CRT. Select by pressing
DISPLAY
1.
Gen/Mon
plays center frequency,
put
displays center frequency,
error,
2. Modulation - The
in generate mode
mode.
3.
Spectrum Analyzer trum
trum
IF signals, measure transmitter harmonics, check
spurious response
tion.
at
a time to indicate the functionortype
section.
Mtr
- In generate mode, the
modulation depth. In
and
received carrier modulation depth.
or
and
operating center frequency. Use the Spec-
Analyzer to identify interference, trace RF and
and
and
displaying
oneofthe arrow keys under the
CRT
output
CRT
demodulated audio in monitor
CRT
receiver local oscillator radia-
power,
monitor
input
displays modulation audio
displays the
and
RF
mode, the
power, frequency
RF
CRT
spec-
of
on
dis-
out-
CRT
4. Duplex Gen -
and
quency
putormonitor
the received carrier.
selects the reading. In this mode, the Analyzer
simultaneously generates
duplex radio servicing.
vides enhanced capability to service equipment such
as repeaters, car telephones
telemetry portables.
5.
RF Memory - Stores
frequencies
6.
Signaling Sequence - Simulates encode
tone sequence for all code synthesizer modes. Press
an
arrow key in the Modulation sectiontoselect one
of
the six modes. Encode in generate function
decode in monitor function.
7. Frequency
puts
monitor
quency
frequency counter
tors, pager IF's,
input
modulation depth on the generator out-
and
Counter
in
either generate
function, measure transmitted carrier fre-
and
other signals less
signals.
displays duplex generate fre-
frequency
codes uptoa totalof32 entries.
to
PL
and
modulation depth
FUNCTION
and
The
Duplex
and
and
displays programmable
- Measures10Hzto35
or
monitor
than35MHz.
measure
frequencies,
switch position
receives signals for
Generator
emergency medical
and
function. In
and
set offset oscilla-
and
other external
MHz
on
pro-
decode
and
in-
Use the
2-3

TABLE 2-1. CONTROLS, INDICATORS,
AND
CONNECTORS
ITEM DESCRIPTION
FRONT
PANEL
FUNCTION
(figure 2-1)
8.
DVM/DIST
a. DVM - The digital voltmeter displays
AC/DC
voltage readings (digital and analog) with the
CRT
corresponding dBm value on the
either generate
or
monitor function. Select AC
screen, in
DC with the display cursor and keypad. The
screen displays battery voltage and a signal's true
RMS at the front panel DVM jack. Use the meter
to check and set power supply voltage, bias level,
and audio level.
b. DISTORTION - This mode automatically meas-
ures fixed frequency
EIA
Sinad/Distortion
(signal
to noise and distortion ratio). The Analyzer
generates a
1 KHz tone
Measure distortion
of
AM
of
known quality.
or
PM transmitter
modulation. Use the distortion meter for a comprehensive checkofa receiver's performance.
9. Ext Wattmeter - Select the element and the screen
displays the forward and reflected power passed
that
through
element mounted in the RTL-4055 watt-
meter adapter.
or
FUNCTION
PUNcnON
switch
indicators
Two-position toggle
switch
Six LED's (red)
10.IF- The screen displays the 700 KHzIFsignal from
the monitor receiver for
AM
and SSB receiver servic-
ing.
11. Scope
AC-The
screen displays the voltage wave-
form applied to the vertical input (AC coupled).
12.
Scope
DC
- The screen displays the voltage wave-
form applied to the vertical input (DC coupled).
or
Select either generate
monitor function.
I. Generate - The equipment generates and outputs an
RF
signal.
2.
Monitor - The equipment monitors input signals
with the input terminated into the receive mixer. Use
this position for off-the-air monitoring.
Indicates the modeofsignal the equipmentisset up to gen-
or
erate
under the
monitor. Select by pressing oneofthe arrow keys
I.
FM
FUNCTION
- Equipment generates or monitors frequency
section.
modulated signals.
'-.--
2-4
CW
2.
- Equipment generates
an
unmodulated RF
signal (continuous wave). Monitor position provides
only frequency error measurement.

TABLE 2-1. CONTROLS, INDICATORS,
AND
CONNECTORS
MODULA
ITEM
nON
switch
DESCRIPTION
Three-position
switch
FRONT
toggle
PANEL
Controls
FUNCTION
(figure 2-1)
AM~Equipment
3.
modulated
4.
SSB/DSBSC
Suppressed
signalisnot
urements.
with the use
5.
SWP
signal having a sweep width
trolled by
tion
mode.
6.
SWP
above
MHz.
the
1.
Cont-Continuous
erates repetitive cycles.
signals.
Carrier
calibrated.
Monitor
1-10
MHz-Equipment
the
has
no
0.01-1
except sweep
Code
generatesormonitors
- Single Side
signal.
SSB
of
the
BFO.
Dispr
/Sweep
effect,
MHz-Equipment
Synthesizer
equipment
width
Band/Double
The
Use it
only
mode
of1to10MHz,
control.
limits are 0.01
modulation
modulation
amplitude
Side
Band
levelofthe
for relative meas-
receives SSB signals
generates a swept
remainsingenerate
performs
signal
Monitor
source.
output,
generated
con-
posi-
as in 5.
MHzto1
gen-
RF
2.
Off-No
sequences.
3.
Burst
returnstoOff.
a.
PL,
b.
DPL,
Tone
c.
d.
Tone
modulation
-
Generates
ToneA,ToneBOutputispresent as long as
DPL
Inv
Sequence
Remote
generated.
a single cycle,
switchisheld in Burst.
DPL
as switch
DPL
switchismoved
position.
turn-off
when switchismoved
ConttoOff.
Outputisa single signaling
sequence.
Outputisa
cess sequence; leaves
Aata low level
mit-type
the
Off.
Terminates
spring
turn-off
code
switchisreturned
codeaslong
is
held
output
Burst
code
is
tone
remote
commands
loaded,
down.
to
of
output
for
code
when
Cont
DPL
from
Tone
trans-
until
ac-
to
2-5

TABLE 2-1. CONTROLS, INDICATORS, AND CONNECTORS
Code
Synth
indicators
ITEM
Mode
DESCRIPTION
LED's
Six
(red)
FRONT
PANEL
(figure 2-1)
When
illuminated, it indicates the
selected_Select by pressing
MODULATION
code
from the keypad
select from theRFMemory
1.
PLlDPL
PL
- Selected
KHz
DPL
- Selected Digital
Maximum
7.
2.
PLlDPL
PL
- same as
DPL
- Inverted
Line code.
may
exceed 7.
ToneAindicator
3.
for
output.
keypad
on
FUNCTION
section.
indicator
Private
code
numberis777.
Inv
indicator
above
Maximum
Enter
the
Tone
code
synthesizer
oneofthe
Enter
on
the
display.
outputofselected Digital
code
illuminates when
Tone
A & B frequencies from the
Memory
arrow
the
PL
frequencyorDPL
Oen/Mon
Line frequency
Private
numberis777.
display.
Line
No
digit
ToneAis
Mtr
keys
outputtoI
code
under
display
output.
may
No
selected
mode
the
or
exceed
Private
digit
DlSPLA
switches
FUNCTION
switches
Code
switches
Y select
Synth
select
Mode
select
Two-pushbutton
....
T
Two-pushbutton
Two-pushbutton
switches
switches
switches
4.
ToneBindicator
for
output.
5.
Tone
Sequence
isatone
the
Tone
6.
Tone
Remote
is
the sequence for a
set B for
Selects
dicated by the
Selects the type
ate
Operates
Selects the
the
DlSPLA
the
function tobedisplayed by the
1.
- moves the selectionupone
2.
- moves the selection
or
monitor
the
Code
Code
Synth
Y select switches.
illuminates when
indicator
signaling sequence. Select the sequence
Memory
indicator
command
DISPLAY
or
modeofsignal
as indicated by the
same
way as the
Synthesizer
Mode
LED's.
illuminates when the
display.
illuminates when the
remote
toneonTone
LED's
station.
.
down
the
DISPLAY
output
Operates
ToneBis
Set A for
memory
equipment,
stepata time.
one
stepata time.
equipment
FUNCTION
select switches.
mode
as indicated by
the
same
selected
----..-'
output
on
output
guard;
display.
as in-
will gener-
LED's.
way as the
Code
Synth
Lvi
control
Potentiometer
Controls
MOD
2-6
the levelofCode
Output.
Synthesizer
for
modulation
or
'--------
TABLE
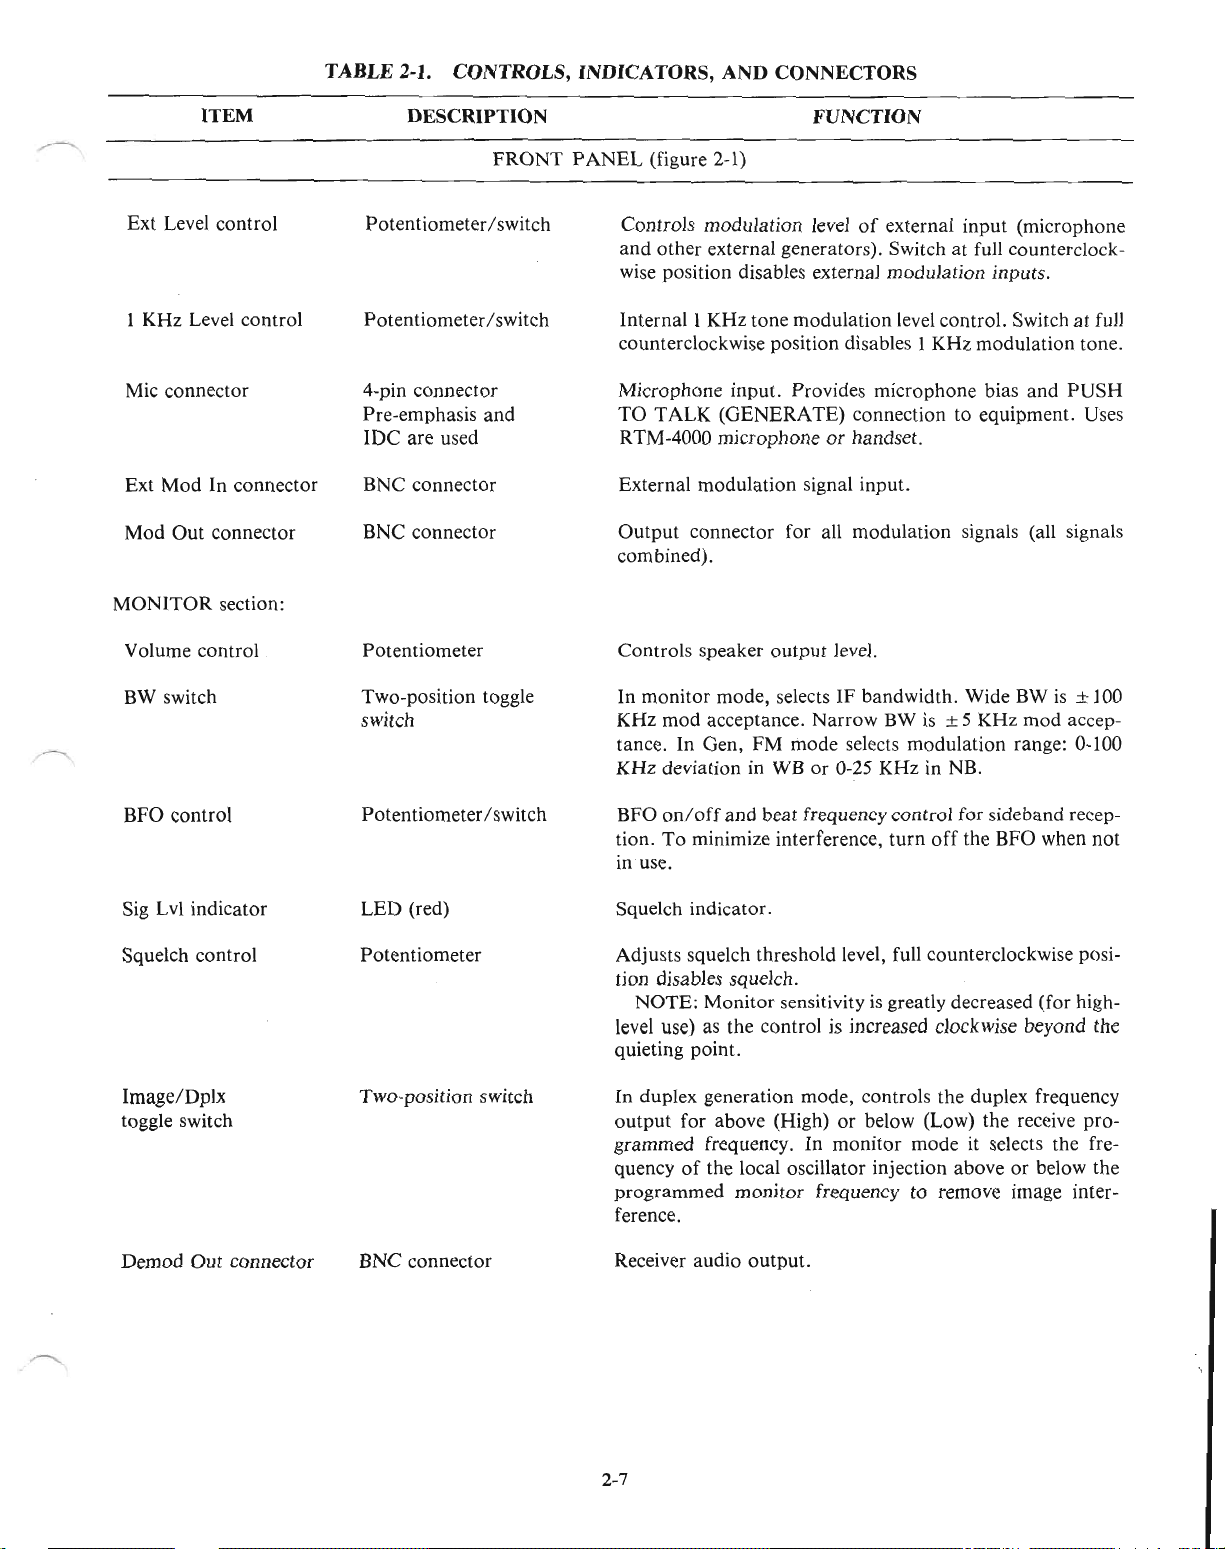
2-1. CONTROLS, INDICATORS, AND CONNECTORS
ITEM
Ext Level control
1 KHz Level control
Mic connector
Ext
Mod
In connector
Out
Mod
MONITOR
Volume control
connector
section:
DESCRIPTION
FRONT
Potentiometer
PotentiometerIswitch
4-pin connector
Pre-emphasis and
IDC
are used
BNC connector
BNC connector
Potentiometer
Iswitch
FUNCTION
PANEL
(figure 2-1)
Controls modulation level
and
other
external generators). SwitchatfulJ
wise position disables external modulation inputs.
Internal I KHz tone modulation level control. Switch
counterclockwise position disables I KHz modulation tone.
Microphone input. Provides microphone bias
TO
TALK
RTM-4000 microphoneorhandset.
External modulation signal input.
Output
combined).
Controls speaker
(GENERATE) connection to equipment. Uses
connector for all modulation signals (all signals
output
of
external input (microphone
level.
counterclock-
and
at
full
PUSH
BW switch
BFO control
Sig Lvi indicator
Squelch control
Image/Dplx
toggle switch
Out
Demod
connector
Two-position toggle
switch
PotentiometerIswitch
LED
(red)
Potentiometer
Two-position switch
BNC connector
IF
In monitor mode, selects
mod
KHz
tance. In Gen, FM mode selects modulation range: 0-100
KHz deviation in WB or 0-25 KHz in NB.
BFO
tion.
in use.
Squelch indicator.
Adjusts squelch threshold level, full counterclockwise posi-
tion disables squelch.
NOTE; Monitor sensitivity
level use) as the control
quieting point.
In duplex generation mode, controls the duplex frequency
output
grammed frequency. In
quency
programmed monitor frequency to remove image interference.
Receiver audio
acceptance. Narrow BW
on/off
To
and
beat frequency control for sideband recep-
minimize interference,
for above (High)orbelow (Low) the receive pro-
of
the local oscillator injection aboveorbelow the
output.
bandwidth. Wide BW
is
± 5 KHz
turn
off
the BFO when not
is
greatly decreased (for high-
is
increased clockwise beyond the
monitor
mode it selects the fre-
mod
is
accep-
± 100
2-7

TABLE
2-1.
CONTROLS,
INDICATORS,
AND
CONNECTORS
ITEM
OSCILLOSCOPE section:
Horiz switch
Horiz vernier control
Ext Horiz
Trig Level
DESCRIPTION
FRONT
Seven-position rotary
switch
Potentiometer
BNC connector
Stacked concentric
potentiometer and switch
FUNCTION
PANEL
(figure 2-1)
When in the oscilloscope mode, selects the horizontal
sweep rate or external horizontal input.
Horizontal sweep rate vernierorexternal horizontal input
gain vernier. Calibrated positionisfully clockwise.
Allows external horizontal inputs for oscilloscope. High input impedance.
Selects oscilloscope trigger level and trigger mode. Center
knob selects the leveloftrigger. Outside (largest) knob controls the trigger mode. In Auto position, continuous sweep
with no vertical input signal, syncsonvertical input. Normal position, no sweep unless vertical inputispresent,
syncsonvertical input.
CAUTION
During Tone Sequence mode, entering a scope trigger delay
prevents normal operationofscope triggering.
'----,
Position controls
• Vert
o Horiz
Vert switch
Vert Vernier control
VertiSinad/Dist
DVM/Counter
In
connector
Concentric
potentiometers
Center (small) control knob Controls the vertical positionofthe
Outside (large) control Controls the horizontal positionofthe
Controls the posItIOn
oscilloscope mode.
of
the CRT display, when in the
CRT
display
CRT
display
knob
Four-position rotary switch Oscilloscope operation uses values marked to the right
the switch, indicating volts per divisiononthe CRT. Modulation display mode uses values marked to the leftofthe
switch, indicating range for calibrated FM deviation. This
switch also controls Frequency Counter sensitivity.
Potentiometer Vernier gain control for vertical inputs to the
the oscilloscope mode. Calibrated position
CRT
when in
is
fully
clockwise.
BNC connector Signal input to the equipment for the following operations
(one megohm input impedance):
1.
External vertical for oscilloscope operation
2.
SINAD/Distortion Meter
'--.......-
of
3.
Digital Voltmeter
4. Frequency Counter
2-8
'--..-/

TABLE 2-1. CONTROLS, INDICATORS, AND CONNECTORS
ITEM
RF SECTION:
RFIn/Out
RF Level Variable
control
RF Level Step
attenuator
Ext Wattmeter
DUPLEX
Output
connector
GEN
connector
switch
DESCRIPTION
FRONT
Type N connector
Potentiometer
14-position ganged atten-
uator
and switch
Connector
Two-position toggle switch
BNC connector
PANEL
FUNCTION
(figure 2-1)
RF input in monitor mode, RF
Vernier control
Push for
in
Ten dB per step control
mode. Also serves as RF input level step
monitor and spectrum analyzer modes.
Allows input from Motorola ST-1200 series inline wattmeter elements for measurement and
ward and reflected transmitted power.
Select either
is
enabled with switch On.
Output
RF
AM
generate mode may result in distorted output.
connector for duplex generator
ofRFoutput
In/Out
OnorOff. Duplex
port. Exceeding the Am Limit marking
output
level. Pull for antenna port.
of
RF
output
in generate mode.
output
level in generate
CRT
displayoffor-
from
DUPLEX
output.
attenuator
port
in
Antenna
Port
Fused BNC connector
PN
#09-80378A51
Connector for the whip antenna.
FUSE REPLACEMENT PROCEDURE:
Place a male BNC connectoronthe
of
pair
the male BNC connector.
Unscrew the connector all the way,
fuse
pliers to remove the defective fuse and replace it with a 0.10
A mini-fuse,
slip-joint pliers to grab onto the knurled portion
Turn
is
plugged into the female center pin. Use a needle-nose
PN
#65-80377A61.
antenna
counterclockwise to loosen.
off
the front panel. The
port. Use a
of
FIGURE 2-2. REAR
2-9
PANEL

TABLE 2-1. CONTROLS, INDICATORS,
AND
CONNECTORS
LINE
AC
DC
10
MHz
AC3A
DC
FAN
CELL
POWER
POWER
lOA
ITEM
power control
STD
POWER
BUS
DESCRIPTION
Recessed switch
Connector
Connector
BNC
Connector
Line fuseholders
Connector
Bus connector
REAR
PANEL
(figure 2-2)
Select
Primary
Primary
Input/Output
panel.
AC
and
OPERATION
1101220 VAC
Power
Placement
installed (R-2008D).
FUNCTION
primary
AC
AC
power input.
DC
power
for10MHz
voltage, either 110 Vor220 V line.
input
port
and
reference frequency. See
DC line fuses:
FUSE
~
12
VDC
lOA
connector for the cooling fan.
of
I/O
connector when cellular service
battery charger
PART NUMBER
65-20404
65-10266
output.
bottom
option
-------
is
Frequency
10
MHz
Standard
control
Recessed switch
BOTTOM
PANEL
Select either the internal10MHz
external10MHz
source applied to the
frequency
panel connector. This switch makes the
portanoutput
orasan
when operating
input
otherwise.
from
standardoran
appropriate
rear
panel10MHz
the internal
rear
standard
2-10
'---

3.0
OPERATION
• GENERAL
The Communications System Analyzeriseasy to use.
Connectors, controls, and indicators are conveniently
and logically arranged in functional groups outlined in
on
the front panel.
red
useful applications
the front panel.
clearly explains these applications and how to access
them by manipulating the keypad.
organized presentationofmeasurement results. A nonvolatile memory conveniently stores the
into the system by the operator.
warning messages and audible alarms to ease operation
and minimize errors.
3.1
POWER
•
POWER
The Analyzer operates on
100to130
capable
the rear panel to select either
input from
convenient external battery source operates from
to +
16
Watts
installation instructions for the Motorola battery pack
that
attaches to the rear panel and provides approximately
shows a three-position toggle switch located to the right
of
the keypad on the front panel and used to control the
Analyzer's power supply.
• ON
The
On,
energizes all circuitry except the battery charger.
• SELF-TEST
When the power switchisfirst turned on, the Analyzer
performs an internal check
possible trouble.
the course
screen to indicate the nature
some guidance for troubleshooting
operation.
SECTION
FIGURE
VACor200to260 VAC,47Hz to 400 Hz
of
115 Watts. Use the recessed LINE switch on
Motorola
V, 6.5 amps maximum, with not more than 90
DC
input. Refer to Section Iofthis manual for
50 minutes continuous operation. Figure
or
full-up, posItIOn
of
this self-test, a message displays on the
The
Analyzer incorporates many
that
are not evident
The
appropriate sectionofthis manual
The
The
On
Slnnnhy
OcOfl
B.ll1
AC
3-1.
POWER
battery pack RTP-1002Aorany
If
the system detects an error, during
CONTROLS
ACorDC. AC canbeeither
110or220 voltage. DC
of
of
its own circuits to detect
of
the trouble and provide
by
examining
CRT
displays
data
system provides
the toggle switch
and/or
continued
SECTION 3
OPERATION
• SELF-TEST DISPLAY EXAMPLES:
an
entered
+
11
3-1
V
3-1
• STANDBY
In Standby
nected to AC power, the battery charger continues to
operate and power
standard.
DC
•
In the full-down position DC
nected to
operates.
• LED INDICATORS
AC LED indicator illuminates whenever AC power
connected to the three-pin power connector on the rear
panel. Batt (battery) LED indicator illuminates when-
ever
nector on the rear panel. AC and DC indicators never
illuminate together. The system switches automatically
between AC and DC, with preference for
present. Oven Ready LED indicator illuminates automatically when the internal frequency standard has
stabilized and the system
• KEYPAD
The
keypad shown in figure 3-2 has a down arrow key to
move the cursor vertically on the
to move the cursor horizontally,
number 0[09.
to the first allowable position to the left
lower
allowable line when the down key
will wrap
the left key to move the cursor left to the next allowable
position.
the left key
REFER
ADDENDUM
AT
OF
THIS
PAGE
or
center position, if the line cordiscon-
is
applied to the internal frequency
OFF
AC
power, only the battery charging circuit
DC
powerisconnected to the DC
allmll
TO
THE
END
SECTION
3-21
Off,
if the line cordiscon-
is
ready to operate accurately.
,
IIIIElEI
11111111
FIGURE
Wllt:1l moved down, the cursor will move
data
entry area.Ifthe cursorisat the lowest
around
If
the cursorisat the most left position when
is
pressed, the cursor will wrap
3-2. KEYPAD
CRT,
a left
and
a key for each
is
pressed, the cursor
to the uppermost allowable line. Press
POWER
ACifboth are
on
around
arrow
the next
to the
con-
key
is
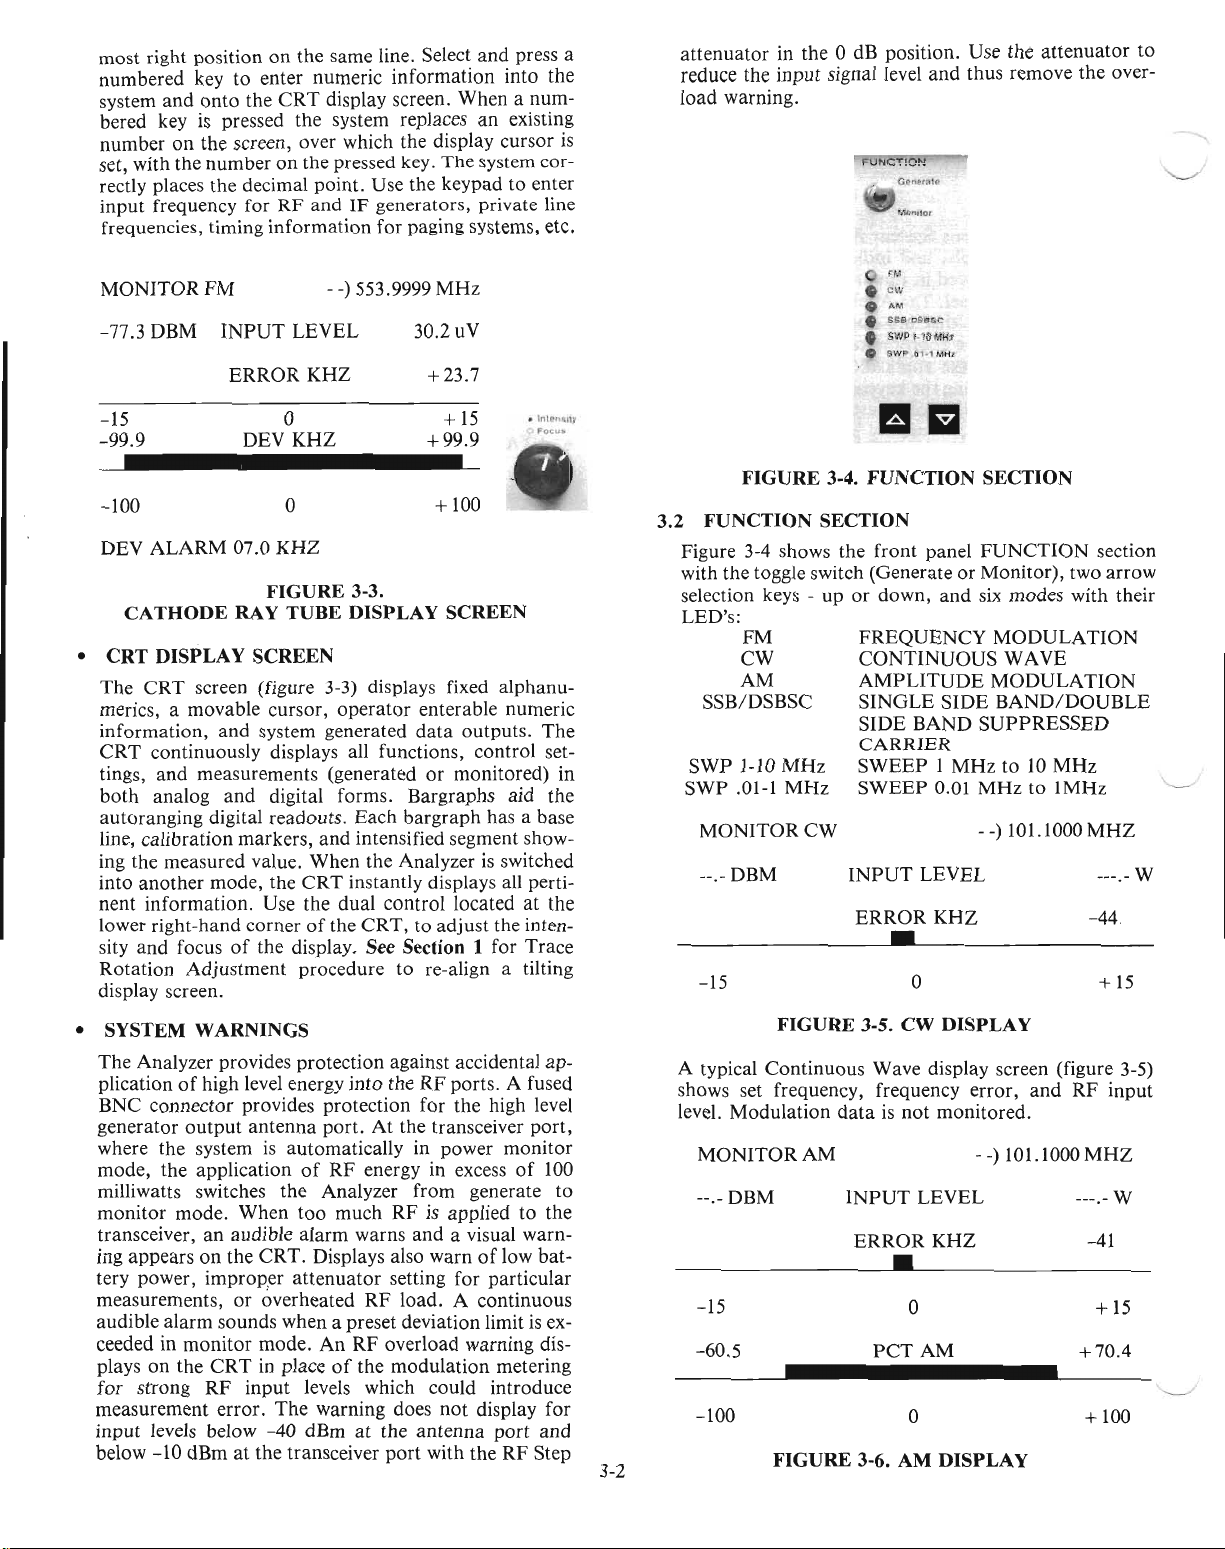
most
right
positiononthe
numbered
system
bered key is pressed the system replaces
numberonthe
set, with
rectly places the decimal
input
frequencies, timing
MONITORFM
-77.3
keytoenter
and
onto
the
screen, over which the display
the
numberonthe pressed key.
frequency for
information
DBM
INPUT
ERROR
same
line. Select
numeric
CRT
display screen.
point.
Use
RF
andIFgenerators,
for
--)553.9999
LEVEL
KHZ
information
The
the
keypadtoenter
paging systems, etc.
MHz
30.2 uV
+23.7
and
press a
into
the
Whenanum-
an
existing
cursor
system
private line
cor-
attenuatorinthe
reduce
load
is
the
input
warning.
0 dB position.
signal level
ro"'CTION
G<"n(!r;thl
MonltOf
FM
_
cw
e
AM
•
Ste
osase
SWP
'.10
SWP
01.,
and
I~H,
MHz
Use
thus
the
attenuator
remove
the
to
over-
-15
-99.9
-100
DEV
ALARM
CATHODE
•
CRT
DISPLAY
The
CRT
merics, a
information,
CRT
continuously
tings,
and
both
analog
autoranging
calibration
line,
ing the
into
another
nent
information.
right-hand
lower
sity
and
Rotation
display screen.
o
DEV
KHZ
o
07.0
KHZ
FIGURE
RAY
TUBE
SCREEN
screen (figure 3-3) displays fixed
movable
measurements
measured
focusofthe
Adjustment
and
system
and
digital
markers,
value.
mode,
Use the
cornerofthe
cursor,
displays all functions,
digital forms.
readouts.
the
display. See Section 1
3-3.
DISPLAY
operator
generated
(generatedormonitored)
Bargraphs
Each
bargraph
and
intensified segment show-
When
the Analyzerisswitched
CRT
instantly displays all perti-
dual
control
CRT,toadjust
procedure
to
+
15
+99.9
.1"Ie-nilU'"
Focu"
+100
SCREEN
alphanu-
enterable
data
re-align a tilting
numeric
outputs.
control
aid the
has a base
locatedatthe
the inten-
for
Trace
The
set-
in
FIGURE
3.2
FUNCTION
Figure 3-4 shows
with the toggle switch
selection keys -upor
LED's:
FM
CW
AM
SSB/DSBSC
SWP
1-10
MHz
SWP
.01-1
MHz
MONITORCW
--.-
DBM
-15
mm
3-4.
FUNCTION
SECTION
the
front
panel
(GenerateorMonitor),
down,
FREQUENCY
CONTINUOUS
AMPLITUDE
SINGLE
SIDE
CARRIER
SWEEP1MHzto10
SWEEP
INPUT
ERROR
and
SIDE
BAND
0.01
LEVEL
KHZ
•
o
SECTION
FUNCTION
two
six
modes
MODULATION
WAVE
MODULATION
BAND/DOUBLE
SUPPRESSED
MHz
--)101.1000
with their
MHz
to1MHz
MHZ
-44
section
arrow
---.- W
+
15
• SYSTEM
The
plicationofhigh level energy
BNC
generator
where the systemisautomaticallyinpower
mode,
milliwatts switches
monitor
transceiver,anaudible
ing
appearsonthe
tery power, improp.er
measurements,oroverheated
audible
ceeded in
plays
for
measurement
input
below
WARNINGS
Analyzer provides
connector
the
mode.
alarm
on
the
strong
levels below
-10
provides
output
monitor
dBmatthe
antenna
applicationofRF
When
CRT.
sounds
mode.
CRT
in placeofthe
RF
input
error.
-40
protection
protection
port.Atthe transceiver
the
Analyzer
too
alarm
Displays also
attenuator
when
An
levels which
The
warning
dBmatthe
transceiver
against accidental
into
theRFports.
for
energy in excess
from
much
RFisappliedtothe
warns
and
setting
RF
load.Acontinuous
a preset deviation limitisex-
RF
overload
modulation
does
antenna
port
with
A fused
the
high level
monitor
generate
a visual
warnoflow
for
particular
warning
metering
could
introduce
not
display
port
theRFStep
port,
of
warn-
bat-
and
ap-
100
dis-
for
to
3-2
FIGURE
A typical
shows set frequency, frequency
level.
MONITOR
--.-
Continuous
Modulation
DBM
dataisnot
AM
3-5.
Wave
INPUT
ERROR
CW
DISPLAY
display screen (figure 3-5)
monitored.
LEVEL
KHZ
•
-15
-60.5
-100
FIGURE
PCTAM
3-6.
o
o
AM
DISPLAY
error,
and
--)101.1000
RF
input
MHZ
---.- W
-41
+
+70.4
+100
15
"---/

A typical
3-6) shows set frequency,
modulation,
MONITORSSB
--.-
Amplitude
DBM
BFO
and
Modulation
RF
input
INPUT
ERROR
display
frequency
level.
LEVEL
KHZ
screen (figure
error,
percent
- -) 101.1000
MHZ
--.- W
+3.62
-15
°
FIGURE
A typical Single Side
shows set frequency,
error.
Modulation
GENSWP
419mV
FIGURE
A typical Sweep display screen (figure 3-9) shows
set
frequency
not
monitored.
MHzor1-10
control
to
fully
counterclockwise
and
MHz
the sweep
fully clockwise.
3-7. SSB DISPLAY
Band
display screen (figure 3-7)
RF
input
dataisnot
RF
LEVEL
3-8.
SWe
RF
output
In sweep
range.
function,
Use
width.
and
the
level,
and
monitored.
- -) 101.1000
DISPLAY
level.
Modulation
select either 0.01-1
the
Dispr/Sweep
The
minimum
maximum
BFO
+5.4
frequency
MHZ
DBM
position
position
AM
+
15
only
data
vernier
3.3 MODULATION SECTION
Figure 3-9
tors
The
with
frequency,
lating signal
fixed 1
sizer,
source
ableatthe
• FIXED 1 KHz
A I
source
TORTION
Adjust
position
•
CODE
The
multitone
front
TION
is
PLlDPL
is
is
Tone
Tone
shows
locatedinthe
modulation
the
modulating
the
connectors,
front
panel
generator
signal
MODULATION
provides
internally
amplitude,orsideband
sums
the
inputsofthree
KHz
test
tone,
multimode
and
external
independently.
Mod
Out
inputs.
The
BNC
Adjust
modulating
connector.
TONE
KHz
test
tone
providesaconvenient
for
general troubleshooting,.
measurement,
the level with the 1
turns
off
the1KHz
and
KHz
tone.
distortion
Level
SYNTHESIZER
code
synthesizer generates either a single
sequence,ora
panel
arrow
PLlDPL
Tone
A
Tone
Seq
Remote
and
CRT
keytoselect
Inv
B
DPL
sequenceinresponse
display
inputs.
oneofthe
Private
Private
Private
Line/Digital
Line/Inverted
Line
ToneAfrequency
Tone
B frequency
Signaling Sequence
Remote
Base
controls,
and
indica-
section.
the
RF
generator
connectedtoeither
function.
audio
the
The
sources:
code
level
modu-
Internal
synthe-
of
signal is avail-
modulation
SINAD
and
measurement.
control.
The
tone,
PressaMODULA-
six
modes:
Private
Digital
only
only
Control
Sequence.
each
DIS-
Off
a
to
Line
Cqde
S~'nlh
Use
the
keypadtoselect frequenciesinthe5Hzto1,000
Hz
range
for
20,000
crements).
the
Hz
range
The
programmed
Cont-Continuous
PLorDPL
for
MODULA
tone
modes
the
other
nON
sequence:
position
andinthe5Hz
modes
(0.1
Hz
in-
toggle switch initiates
generates repetitive
to
cycles
Off
-
Position
Burst-Position
Table
3-1,
Tone
Seq
•
Tone
At"nlote
when.
Modulation/Function,
MODULATION
Code
Synth
Mode
Lvi
Eli!L1101
°PL/DPL
°Tone
Inv
A
terminates
generates
Available
FM
Available
FM
Available
onlyinFM
Duplex
onlyinFM
Duplex
as
AM,orSSB
Generate
Mod
selected,
Monitor
position.
Out
in
positions.
modulation
a single
tone
tabulates
FUNCTION
Gen.
Gen.
Modulalion
FUNCTION
Available
jack,
at
both
Generate
sequence.
what
works
Generate
Generate
jn
only
all times
or
or
FM,
in
at
if
and
FIGURE
3-9. MODULATION SECTION
3-3
°Tone
B
SameasTone
A.

°Tone Seq
Available in FM, AM,
or
SSB
FUNCTION only in Generate
position.
°Tone Remote
Same as Tone A.
Note: All modulation sources are available at Mod Out
jack while in use as generator modulation. Code Synthe-
sizer Level control simultaneously sets both the
output
level and the modulation level.
the keypad to select any frequency
from10KHz to 1,000 MHz in
output
port
range at the antenna
port
provides sufficient amplitude to get through mis-
aligned tuners and receivers.Itis
of
the generator
100Hzincrements. The
and the transceiver
especially effective to
change a receiver's frequency. ----./
, RF
SU;'p
SECTION
RF'LP,,;,j
'-
Vanable
MODULA
•
EXTERNAL
TABLE
TION/FUNCTION
LEVEL
3-1.
AVAILABILITY
External Modulation Inputs from a microphone
(Motorola RTM-4000B) plugged into the front panel
and a signal applied to the Ext Mod In sum together to
provide a single external modulating signal. The
microphone input provides standard mobile radio preemphasis, clipping,
and
frequency roll-off. The
microphone push-to talk switch switches the system
from monitor to generate mode. Adjust the external input sensitivityorimpedance with the External Level
control, for analyses with external instruments. The
position turns
off
the composite external modulation
signal path.
• The Mod
Out
connector provides external access to the
composite modulation signals. Output impedanceis600
ohms.
OISPLAV
_
C"n
MooMIr
.•
Modulnhon
e
Speci
A,ni1IVI.t~,
OuplC'k
Ceo
RF
Memory
• Stg"i1lmg
• F(eq Couniel
• OVM DIST
8 E
•
'"
•
..IWaltmtl'ler
IF
SCOUt'
Scope
Scq
AC
DC
1111
FIGURE
3.4
DlSPLA
To
select oneofthe twelve DISPLAY modes shown in
figure 3-10, pressanarrow key located under the DISPLA
Y list to activate upordown movementofthe adjacent LED indicator.Ifa DISPLAY modeislocated at
the toporbottomofthe list when a keyispressed, the
DISPLAY mode will wrap around. Confirm the
selected configuration by the appropriate displayonthe
CRT.
•
GENERATE/MONITOR
•
GENERATE
In
Generate FUNCTION the Analyzer generatesanRF
signalata controllable
testing. Many formsofinternal and external modulation can be simultaneously impressedonthe carrier frequencytogenerate composite signals for servicing. Use
3-10. DISPLAY MODES
Y SECTION
METERING
output
level useful for receiver
Off
3-4
Mo
•
Erl
\V~llmme'
•
RF
In the
FIGURE
LEVEL
RF
SECTIONofthe front panel (figure 3-11) a
3-11.
RF
SECTION
push-pull switch associated with the Variable level control selects either the antenna
portorthe transceiver
port. The out-position (Pull) selects the antenna port.
Control the
RF
Level control and the attenuation with the14Step
attenuatorat10
output
over a16dB range with the Variable
dB per step. Use the attenuator to
tend the range to the maximum antenna input level
+10dBm.
FUNCTION
FM and CW
AM
RF
OUTPUT
•
RF
OUTPUT
Table 3-2 shows RF
na
port.Atthe in-position (Push) transceiver port (RF
In/Out)
the
VOLTS RMS
0.1 uV to 1 V
0.1 uV to 0.4 V
TABLE
3-2.
LEVEL AT ANTENNA
LEVEL
output
output
levelisattenuated by a nominal 30
levels available at the anten-
DBM
-127 to +
-127 to
PORT
dB below the levelatthe antenna port.
GENERATEFM
PL) 150.0
0.61 uV
12.4PCT
RF
LEVEL
DIST SINAD -18.1
- - ) 154.1250
DPL) ---
-111.4DBM
MHZ
-60
-4.74 DEV KHZ
-100 0
GENERATE
FIGURE
MODE
3-12.
METERING
DISPLAY
+4.75
+100
ex-
of
'-.....-/
13
+5
DB
0
,-----.

•
GENERATE
MODE
Figure 3-12 defines a generate mode metering display.
To
operate, place
tion. Press a
--PM for example.
frequency. The
luminate
and
FUNCTION
FUNCTION
From
Gen/Mon
the
CRT
switch in Generate posi-
arrow key to select a signal,
the keypad, enter the desired
Mtr and FM LED's
displays GENERATE FM
the carrier frequency. Use RF Scan control to tune up
down. Adjust deviation using the 1 KHz Level control.
The CRT displays a complete summary
parameters including carrier frequency, selected code,
RF
level in volts and dBm (analog and digital), deviation or percent modulation. The displayisexplained
here line-by-line.
of
il-
and
or
all
I) GENERATE FM
••) 154.1250
Line 1 displays the mode, function,
and
MHZ
current oper-
ating frequency.
2)
PL)
150.0
Line 2 displays thePLor
DPL)
DPL
code associated with the
•••
generate frequency. The system does not allow simul-
taneous
code, the
the
programmed
DPL
PL
and DPL.Ifthe operator enters the
DPL
display changes to dashes.Ifhe enters
code, the
PL
display changes to dashes. The
PLorDPL
applies to the carrier auto-
PL
matically. Control its level with the Code Synthesizer
Level knob. .
RF
output
LEVEL
-111.4 DBM
level in volts rms and in dBm.
4)
5) 0.61
Line 5 displays RF
uV
The voltage reading autoranges in three digits with the
symbols uV for microvolts
dBm reading appearsinfour digits with
and
MV
for millivolts. The
0.1
dB resolu-
tion.
-18.1 DB
o
9)
10)
8)
12.4
PCT
DIST/SINAD
-60
The distortionofan input signal applied to the multipurpose input jack displays in percent with 0.1 % resolution. SINAD displays in dB with 0.1 dB resolution. The
bargraph responds linearly to the SINAD reading,
originating at the left side at
-60
dB SINAD
and
exten-
ding to the right side for SINAD valuesto0 dB.
13)
12)
-4.74
14)
-100
Lines 12,
13,&14
DEV KHZ
o
display the leveloffrequency modu-
_
+4.74
+100
lation applied to the system RF output. Positive and
negative readings autorange in 3 digits. The zerocentered bargraph extends to the right
corresponding
to
the modulation level. The graph
responds in a modified logarithmic manner
and
leftofcenter
that
provides a smooth nonranging analog display with a full
scale
of
± 100 KHz FM.
•
ANALOG
Figure
FIGURE
3-13
3-13.
RF
SYNTHESIZER
shows
RF
Scan control for Analog Syn-
SCAN
TUNING
CONTROL
(AST)
thesizer Tuning (AST). Manually scan through any frequency by
rotating
the
control
clockwise
counterclockwiseatthe rateof32 frequency steps per
revolution. The positionofthe display cursor in the frequency reading determines the sizeofthe step.Ifthe
cursorisover the
100
Hz position, the step sizeis100
Hz.Ifthe cursorisover the 1 KHz position, the step size
is
1 KHz. All seven possible cursor positions provide a
scan range from 0.01 MHz to 999.9999 MHz. Use the
RF Scan control to perform a linear sweep to scan the
center frequency upordown. Switch to AMorFM
Monitor FUNCTION to aid in positive identification
and analysis
demodulated
of
output
an
input signal. Listen to the
via the built-in audio amplifier and
speaker.
• RF SWEEP GENERATOR
Use the SWEEP FUNCTION modes to continuously
sweep the RF generator
and cavity response,
output,
and
to identify defective filter net-
display bandpass filter
works. In SWP FUNCTION, select sweep width in the
0.01-1 MHz
or
1-10
MHz range. The Dispr/Sweep
vernier controls the sweep width within either range. Attach a demodulator probe (RTL-4075A) to the Vert!
Sinad/Dist general purpose input port and select Scope
mode. The scope's horizontal sweep tracks the sweep
the
output
frequency, thus allowing a frequency domain
analysisoffilters, RF front ends, and duplexers, etc.
•
MONITOR
The Analyzer monitors
MODE
RF
input energy from an antennaora transmitter to accurately determine the frequency, power level, and modulation characteristics.
monitors signals from 0.01
MHz
to 999.9999 MHz with
a center frequency settable in 100Hzincrements.
CAUTION
or
of
It
15)
The w'ord
ANT
appears only when the antenna in-
put on the front panelisenabled.
3-5
Even when itisnot selected, the antenna
to the transceiver
port
with a nominal 30 dB isolation.
portiscoupled

When using the transceiver
antenna
the
MONITORFM
from its
port.
INPUT
o
port
(RF
WATTS
In/Out)
--) 466.9750
disconnect
MHZ
2.05
125
A frequency
ates simultaneously with
SSB mode, the display shows either the
quency
BFO.
Monitor
useofthe
rangeof± 3
12)
-4.72
13)
errororactual frequency displays oper-
FMorAMto80%.
or
the actual frequency
SSB
mode
receives SSB signals with
BFO.
Adjust
KHz
the
from the
DEV
KHZ
BFO
monitor
l--
of
the
frequency
center frequency.
For
the
error
fre-
MONITOR
t-!tt',
over
the
+4.75
_
-
J
0.50
+
+5.23
+ 100
15
-15
-5.13
-100
DEV
ALARM
ERROR
DEV
07.0
FIGURE
KHZ
o
KHZ
o
KHZ
3-14.
MONITOR MODE METERING DISPLAY
Figure 3-14 defines a
Set the toggle switch to
FM,
and
the
DISPLAYtoGen/Mon
1ine-by-line description
I)
MONITOR
On
line I the
operator
t:nter a preset channel number, between01and
CRT
displays the
Memory table
changes as required.
quency, dashes replace the channel
frequency changes as required.
4)
-62.4 DBM
Line 4 displays the
connector from
volts (use
switches to watts. The three-digit watts reading
autoranges between 10, 100,
If
front panel settingsorinput conditionsdonot
accurate determination
dashes replace the reading.
9)
10)
11)
-IS
The
zero centered
error.
display, moves to the left
negative
positive
logarithmic
ing analog display
row
BW
enables direct frequency
graph.
the
CRT
uses the keypad
attenuator).
The
graph originates
error,
error.
manner
and±15
monitor
of
FM
displays
appropriate
and
the system
If
the
INPUT
input
-70
dBm to 3 dBm with indication in
ERROR
bargraph
andtothe righttoindicate increasing
The
graph
that
on
a full scale
KHz
readout
mode
metering display.
Monitor,
this display:
MONITOR
and
operator
LEVEL
signal levelatthe
Above 30 dBm, indication
of
•
o
provides a
in wide BW.Ifthe
the
FUNCTION
Mtr. Hereisa
•• ) 454.1252
FM.
the display cursor
frequency from the
operating
enters a new fre-
number
and
125
watts full scale.
dBm
or
volt readings,
KHZ
reflects the frequency
at
the center
to
indicate increasing
responds in a modified
smooth
of±15
mode, the
MHz
When the
frequency
and
170.0 uV
RF
-1.05
of
nonrang-
KHz in
operator
CRT
32, the
the
In/Out
allow
+
IS
the
nar-
omits
RF
to
to
3-6
14)
-100
The
display shows posItIve
levelofrecovered
The
reading in peak KHz autoranges full scale between
10
KHz
and
CRT
omits the
replaces the
INCREASE
The
warning will
at
the
antenna
ceiver
position. Use the
level
A continuous audible
deviation limit
sor
display. Use the keypad to enter code #78XYZ to program the deviation
with
#78000 to disable the alarm.
15)
front panel
the
dB position
•
SPECIAL
Use the special function modetoexpand the Analyzer's
capability
the keypad to enter control
and
a specific
any
and
function
screen under the words:
Use the keypadtoenter the two-digit special function
code selected from table 3-3. Entering the code's last
digit activates the selected function.
quired,
ditional data.
mal screen either shortly after
10to15
for each code
port
and
remove the overload warning.
keys simultaneously to invoke the Special Function
100
Hz
ANT
displays only when the
RF
Step
FUNCTION
into
to customize for user preference without the use
CRT
time
and
SIMULTANEOUSLYDEPRESS
then release.
command
SPECIAL
more
secondsofno
FM
100 KHz. During overload conditions the
bargraph
normal
not
portorbelow
with the
attenuator
is
exceeded. Depress
alarm
resolution.
is
enabled.
attenuatorisat
and
the
areas
display.Toenable a special function,
during
CURSOR
The
display.
dashes
The
system revertstothe previous nor-
to
activate multiple special functions.
o
and
negative
in digital
modulation
INPUT
appear
RF
Step
alarm
Enter
ATTEN)
monitor
MODE
not
required for general use. Use
any
mode:
screen changestoshow a special
FUNCTION
appearonthe screen.
data
and
analog readouts.
and
a warning message
display:
ATTENUATION
for inputs below
-10
dBmatthe trans-
attenuator
to reduce the
sounds when a preset
both
from 0.1 KHz to
special function code
antenna
0 displays whenever
a setting
modeisin use.
information
KEYS
Two
dataisenteredorafter
entry. Repeat the sequence
other
into the system
BOTH
dashes
ENTRY.
If
more
+ 100
modulation
-40
in the 0
input
keypad cur-
99.9
inputonthe
than
KEYPAD
appearonthe
dataisre-
Enter
the.ad-
dBm
dB
signal
KHz
'---.-/
the 0
of
at
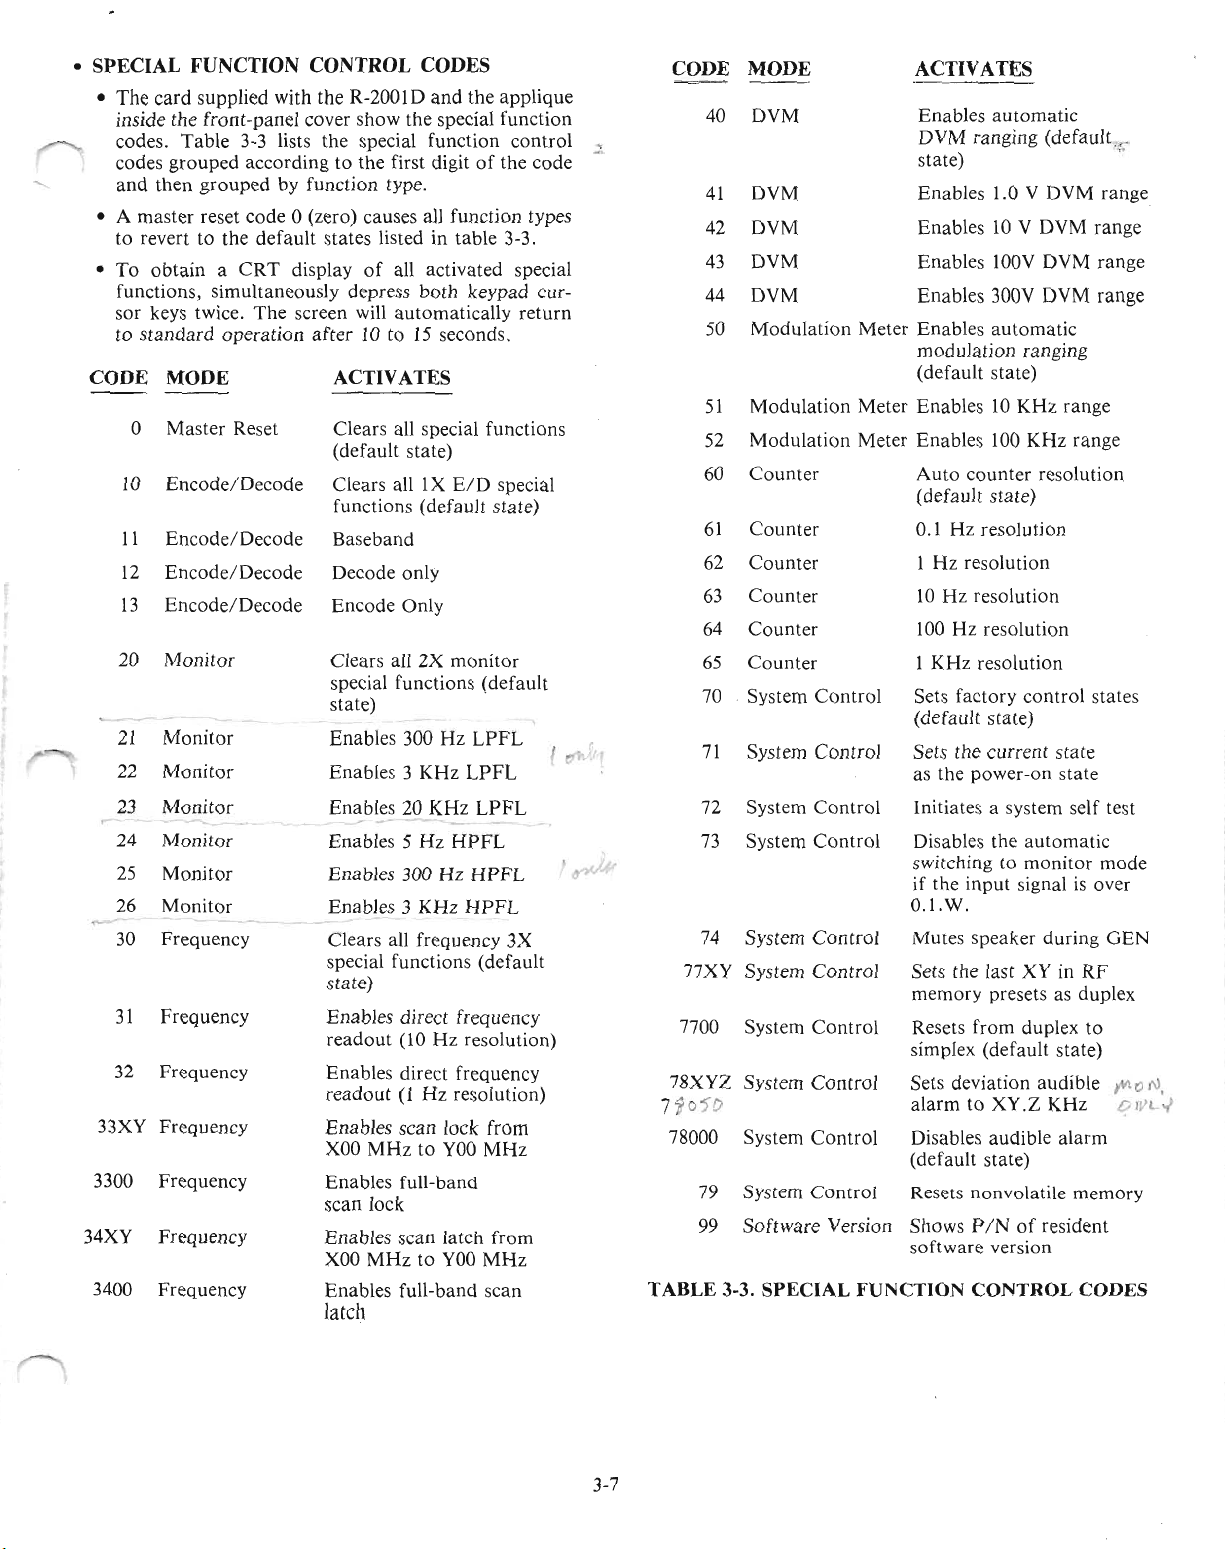
• SPECIAL FUNCTION CONTROL CODES
•
The
card
supplied with
inside the
codes.
codes
and
• A
master
to reverttothe
•
To
functions, simultaneously depress
sor
to
standard
front-panel
Table
grouped
then
obtainaCRT
keys twice.
3-3 lists
accordingtothe first digitofthe
groupedbyfunction
reset
code
default
The
operation
the
R-2001D
cover
show
the
special function
and
the
the special function
type.
a(zero) causes all function types
states listed in table 3-3.
display
screen will
of
all activated special
both
keypad cur-
automatically
after10to15seconds.
CODE MODE ACTIVATES
0
Master
10
Encode/
11
Encode/Decode
12
Encode/
13
Encode/Decode
Monitor
20
21
Monitor
22
Monitor
23
Monitor
24
Monitor
25
Monitor
26
Monitor
Frequency
30
31
Frequency
32 Frequency
33XY
3300 Frequency
34XY
3400
Frequency
Frequency
Frequency
Reset Clears all special functions
Decode
Decode
(default
Clears all
functions (default state)
Baseband
Decode
Encode
Clears all2Xmonitor
special functions
state)
Enables 300HzLPFL
Enables3KHz
Enables 20
Enables 5HzHPFL
Enables 300HzHPFL
Enables 3
Clears all frequency
special
state)
Enables
readout
Enables direct frequency
readout(lHz
Enables scan lock from
XOO
Enables full-band
scan
Enables
XOO
Enables
state)
IX
E/D
only
Only
LPFL
KHz
KHz
HPFL
functions
direct frequency
(10
Hz
resolution)
resolution)
MHztoYOO
lock
scan latch
MHztoYOO
full-band scan
latch
applique
control
return
special
(default
LPFL
3X
(default
MHz
from
MHz
code
CODE
.::.
77XY System
7700
78XYZ
7'i
78000 System
MODE ACTIVATES
40
DVM
state)
41
DVM
DVM
42
43
DVM
44
DVM
Modulation
50
Modulation
51
Modulation
52
Counter
60
Counter
61
62
Counter
Counter
63
Counter
64
65
Counter
70 . System
71
System
System
72
System
73
74
System
System
System
50
79
System
Software
99
Control
Control
Control
Control
Control
Control
Control
Control
Control
Control
Version
Enables
Enables10V
Enables
Enables
Meter
Enables
modulation
(default state)
Meter
Enables10KHz
Meter
Enables
Auto
(default state)
0.1
1Hzresolution
10Hzresolution
100Hzresolution
1
Sets
(default state)
Sets the
as the
Initiates a system self test
Disables the
switching to
if
O.l.W.
Mutes
Sets the last XY in
memory
Resets
simplex (default state)
Sets deviation
alarmtoXY.Z
Disables
(default state)
Resets nonvolatile
Shows P
software
Enables
DVM
counter
Hz
KHz
factory
the
input
automatic
ranging
1.0 V DVM range
100V
300V DVM
automatic
100
resolution
resolution
current
power-on
signalisover
speaker
presets as duplex
from
duplex
audible
/Nofresident
version
TABLE 3-3. SPECIAL FUNCTION CONTROL CODES
(default~._
DVM
range
DVM
range
range
ranging
range
KHz
range
resolution
control
automatic
monitor
state
state
during
RF
audible
KHz
alarm
memory
states
mode
GEN
to
tAo N,
c
1:1
-I
3-7

•
AUTO
Enable
code
TUN"~
MODE
full-band scan lock with special function control
#3300 (table 3-3).
The
monitor
scans its specified
frequency range to automatically acquire and tune
strong
input
signal
within
fjve
seconds.
For
faster
quisition, use special function control code #33XY to
limit the scan range to
minimum
quisition
the transceiver port.
programmed
input
signal level for
is
-30
dBm at the
The
frequency display. Line 8 displays the actual input frequency
in figure 3-10. When tuned, dashes replace the
ING
display
and
a dash in the cursor replaces the chan-
nel number. When the
100
MHz
increments.
automatic
antenna
word
SCANNING
± I KHz as shown in the example
frequency ac-
port
and
0 dBM
replaces the
SCANN-
input
signalisremoved, scanning
resumes.
SCAN
•
Select this variationofthe
function control code #3400
latchanauto
signal is acquired
auto
LATCH
MODE
tune
frequency. In this mode, the
and
tune. However, the
auto
tune mode, using special
or
34XYtoprogram
tuned in the same
programmed
frequency display
manner
shows the word:
•
LATCHED
and
a dash under the cursor instead
of
the preset
number.
The
second lineonthe metering display reads
PRESS0TO
•
If
the input signal is removed, the system remains programmed
operator
word
display.
Also, the
to
the last frequency tuned. When the
activates the 0 key, scanning resumes
SCANNING
The
CRT
replaces the word
preset
number0appears
omits the second lineonthe display as
RESCAN
LATCHEDonthe
under
and
the cursor.
scanning resumes.
The
scan latch
frequency
modeisuseful
of
trunked
radios.
for
locating the transmit
ac-
The
and
input
as for
the
•
VOLUME
The
The
a
control
AND
Volume
SQUELCH
control
adjusts the speaker
CONTROLS
output
level.
Squelch control locatedtothe leftofthe Volume
(figure 3-15)iscontinuously variable
from
Off
position (disabled squelch) to a maximum squelch lev(
of
-25
dRm ±
Signal Level
tion
(unsquelched).
at
indicates a closed position
10dBat
LED
illuminates, it indicatesanopen posi-
When
the
antenna
the
LEDisnot
(from
port.
illuminated, it
threshold to tight
When
the
squelch).
OFF-THE-AIR
•
Use the Analyzer's
MONITOR
antenna
port
for off-the-air
monitoring. The Analyzer receiver's 1.5 uV sensitivity allows
off-the-air monitoring
error
and
deviationto1000
to
measure transmitter frequency
MHz.
Monitor
weak signals
with the variable squelch. But for accurate measurement, set them higher to ensure
proper
signal-to-noise
ratio. More accurate measurements result from using a
The
higher signal level.
enables frequent
dation
early
parameter
and
reduce service costs. Set Wide
off-the-air
checkstospot
width for off-channel signal locationorwide
Set Narrow bandwidth for
maximum
monitor
system degra-
sensitivity
function
band-
band
FM.
and
selectivity.
SIGNAL
•
Place the
STRENGTH
FUNCTION
METER
switch in
Monitor
mode.
The
frequency selective signal strength indicator, operates
simultaneously with
input
full
frequency rangeofthe
imum 30 KHz bandwidth
quency.
At
the
dicator operates for
dBm with the Step
non-zero
attenuate
amountofthe
by inserting loss, using the
other
antenna
input
attenuator
both
attenuation.
monitor
functions over the
monitor.Ituses a max-
around
the
monitor
port,
the signal strength in-
levels from
-99.9
center fre
dBmto-30
in the 0 dB position.
limits
are
increased by the
Measure higher level signals
rotary
attenuator.
For
The
a
displayed measurement compensates for the attenuation.
3.6
MONITOR
FIGURE
SECTION
SquelCh
0"
....
Image
Opht
HI9h~.
LOIN
w
Delima
OuI
3-15.
MONITOR
MONITOR
~19l
...
,
•
Wide
N;wow
Volume
'PM"
OW
BFO
SECTION
3-8
FM
DEMODULATION
•
The
monitor
in the wide
band
demodulates
band
position
FMto75
and
to 5 KHz in the
position. Selectable highpass
KHz
peak deviation
and
lowpass filter
narrow
sections determine the monitor's frequency response
with characteristics as shown in table 3-4. Select
width via BW switchorspecial function control.
wide
band
KHz
lowpass filters.
the 5
Hz
position enables the 5
The
narrow
highpass
and3KHz
Hz
high pass
band
position enables
lowpass filters. Special
Function overrides the BW switch to enable selection
any combinationofhigh
and
low pass filtering as de-
fined in table 3-3.
band-
and
The
20
of

•
AUDIO
Table
Highpass:
Lowpass:
Filter
Character-
istic
FILTERS
3-4 lists
audio
Filter
Mode (Not More
Than
Hz
5
300
Hz
3
KHz
20
KHz
3
KHz
300
Hz
filter characteristics.
Frequency
0.5
5
Hz
20
KHz
dB)
Frequency
(Not
Than3dB)
300
3
3
300
More
Hz
KHz
KHz
Hz
Frequency
(At Least
dB)
20
170
Hz
1.7
KHz
40
KHz
5.4
KHz
540
Hz
•
MODULATION
In the frequency
3-16), view the
in generate
mode.
modeorthe demodulated
Analyze waveforms
deviation graphically. Use the
select wideornarrow
adjust
frequency
peak deviation. In
fromato
20 KHz.
calibrated for
MODULATION
composite
bandwidth.
modulation
the
narrow
The
display's vertical deflection is
FM,
generate
modulation
on
MONITOR
level
position,
and
three ranges with 0.25 KHz, 2.5 KHz,
graticule division. Use the
tion
controls
level, vertical
the Vert
modulating
MODULATION
this
manual.
shown in figure 3-41toselect deviation
and
horizontal.
control
signal is generated internally by the
SECTION.
OSCILLOSCOPE
to
the
Refertoparagraph
To
proper
DISPLAY
audio
(figure
waveform
audioinmonitor
the scopetomeasure
BW switch
to
In the wide position,
from
a to 75
adjust
monitor
and25KHz
KHz
the range
modes, in
per
modula-
set the range,
KHz/Div.
adjust
The
3.3 in
TABLE
•
AM
The
level.
cept
3-4.
AUDIO
DEMODULATION
monitor
The
that
demodulates
frequency response is the
the
lowest allowable highpass filter
300Hz.
•
SINGLE
The
the
as for
•
AUDIO
A speaker
mode
The
audio
SIDEBAND
monitor
sideband
has a
mode.
FM.
MONITOR
monitors
and
the
modulating
speaker drive signalisalso appliedtothe receive
pinofthe
special function
maintaining the headset
trol.
The
audio
signal frequency response ranges
300Hzto20KHz
3
KHz
in the
narrow
FIGURE
3-16.
FILTER
CHARACTERISTICS
AMtoa
100070
same
as for
modulation
FM
ex-
cutoff
DEMODULATION
minimum
The
the
microphone/headset
dynamic
range
of
frequency responseisthe
recovered signal in
the
signal in the generate
connector.
30
dB in
same
monitor
mode.
Use
controltodisable the speaker while
audio
signal with volume con-
from
in the wide
band
and
from 300Hzto
band.
MODULATION
DISPLAY
CENTERFREQ
is
dB
FIGURE
•
SPECTRUM
The
Spectrum Analyzer display, figure 3-17, shows
3-17.
ANALYZER
SPECTRUM
center frequency, channel
quency. Use
from01to32or
the
Spectrum
andIFsignals, measure
spurious response
The
CRT
RF
Memory
the
keypadtoenter
enter a center frequency directly. Use
Analyzertoidentify interference, trace
transmitter
and
receiver local oscillator
displays
table
the
appropriate
and
changes the system
07) 156.2800
ANALYZER
number,
the
frequency
MHz
KHz
DISPLAY
and
operating
channel
number,
harmonics, check
radiation.
from
operating
fre-
RF
the
fre-
quency as required. Entering a new frequency changes
the channel
operating
windowofthe
transceiver
MHz
served window for
the
Dispr/Sweep
Analyzer has a dynamic rangeofat
Step
tenuator,
maximum
tenuator,
dB readingonthe
-95
dBmatthe
transceiver
numbertoa dash
frequency as required.
RF
spectrumateither
port
in a range selected
programmable
the
and
attenuator
in the 0 dB position.
the usable range
allowable
add
10 dB
input
per
scope.
antenna
port.
in 100
Hz
Analyzer
RF
Scan controls.
can
levels.
step
attenuationtothe actual
The
usable sensitivityisat
port
and
changes the system
The
CRT
displays a
the
antenna
from1MHzto1,000
increments.
can
be controlled with
The
The
Spectrum
least75dB with the
With
be
extendedupto
When
and
using the at-
-65
dBm
or
ob-
the at-
the
least
at
the
3-9

Antenna
CAUTION
10.0'
L:.
l.rUI
'0
DUPLEX GEN
On
011
Oulput
CAUTION
80.01
"PUT
'OWl'
FIGURE
DPLX
DPLX
DPLX
-2.06
-100
3-18.
Monitor
Offset
Generate
PL)
- - -
DUPLEX
DUPLEX
DEV
GENERATOR
06)
029.7750
074.7750
DPL)
GEN
KHz
o
ANT
FIGURE 3-19.· DUPLEX GENERATOR
SECTION
+45.00
137
ATTEN)
DISPLAY
MHz
MHz
MHz
+2.06
+ 100
also changestomaintain
whenever a new
grammable
+ / - the
The
monitor
MONITOR
monitor
duplex
offset
frequency.
Image/Duplex
positiveornegative signalofthe offset. As
changes, the generate frequency changestoreflect
new offseLOnlineI,enter
a frequency from the
GEN
switch
mode,
controls
the
Image/Duplex
the
duplex frequency
(High)orbelow (Low) the receive
cy. In
monitor
mode,
the local oscillator injection
grammed
terference.
monitor
Enter
frequency
either the
duplex generate frequency.
PL
location, the
entryismade
changes
toadash.
FUNCTION
mines the
analysis.
recovered
It
from
negative readings
from
0
scale
modulation
analog
displayona full scaleof20
DPL
into the
Line I I indicates the
switch.
sourceofmodulation
is
either appliedtothe duplex
the
monitor
autorange
10KHzto100 KHz.
levels
and
the
displayed offset value
frequencyisentered.
equals the generate frequency
RF
memory
switch
the channel
controls
numbertoselect
table. In
two-position toggle
output
programmed
this switch selects
the
frequency
aboveorbelow the
to
remove image in-
PL
or
DPL
codeofthe
If
an
entryismade
display changestoa
DPL
location,
dash.Ifan
the
PL
positionofthe
GenerateorMonitor
mode
available for system
generator
receiver. Both positive
in
three
digits with full
The
bargraph
provides a
smooth
KHz
nonranging
FM.
The
pro-
th
the
offset
the
DUPLEX
for
above
frequen-
of
pro-
into
the
display
deter-
or
and
represents
•
DUPLEX
The
quency
GENERATOR
Analyzer providesanRF
from
the
Monitor
output
center frequency
hances capability to service duplex
such
as repeaters,
medical telemetry portables.
put
becomes the
or
transceiver
antenna
Figure 3-18 shows
On/Off
toggle switch,
located in the lower
The
duplex
quency
MHz
range
to±10
generator
MHz
the single fixed
generator
has full
capability, including voice
and
subaudible
RF
coming
a
separate
off
-35
Figure 3-19 shows
erate) display, channel
quency.
the
The
the channel
generate
shows the
exceeds ± 45
quency
before
number
quency
Enter
appropriate
system
operating
number
frequencyofthat
corresponding
MHz
changestoreflect the
channel selection.
changestoa
changes as
car
telephones,
The
generate
port
port
the
becomes the
DUPLEX
Antenna
left-hand
operates
and
provides frequency offsets from 0
programmable
offset
internal
of±45
and
simultaneous
tones.
This
modulation
the
DUPLEX
dBm
the
(4 mV)RF
DUPLEX
GEN
number,
the
channel
frequency
number.
from
frequency changes as required.
defines a
duplex
pair
calculated offset.Ifthe
or
0 ±10MHz,
For
dash
and
required.
thatisoffset
DUPLEX
for
this
radio
and
mode
monitor
in fre-
and
enequipment
emergency
GEN
Out-
while the
port.
GENERATOR
and
Output
cornerofthe
over the full
in 5
MHz.
external
connectors,
front
monitor
KHz
The
FM
modulation
steps
duplex
panel.
fre-
and
with audible
appearsonthe
Output
port
which
output.
(Monitor,
and
theRFMemory
Offset,
system
The
CRT
frequency
monitor
displays
pair,
Gen-
fre-
table.
the
displaysonline 5. Line 3
offset
the
generate fre-
offset
that
was displayed
a new entry, the channel
the
system
The
operating
fre-
generate frequency
-
-)
RF
MEMORY
PL)
- - -
267.5673
DPL)
PAGE
RF(MHz)
09) 150.5200
11)
12)
13)
14)
•
RF
is
MEMORY
An
internal
grammable
or
DPL
823.7320
154.0000
164.0000
145.0000
164.5500
174.5500
FIGURE
codes. Use
TX
TX
TX
TX
3-20. RF MEMORY
nonvolatile
RF
frequencies
memory
the
enteror,change a frequency in the
quency
programmed,
If
set
quency. Figure 3-20 shows a typical
page.
When
to
all
remains in
the
operating
The
the
reflect
numeric
the
the
memory
frequency
display allows
page
numberischanged,
the
information
values, except
table
a totalof32 entries..Preset
or
duplex. Select 0to16
function
control
duplex channels
code 77XY (table 3-3). Duplex
PL
(Hz)
-'-
-'-
063.0
075.0
003.2
DISPLAY
stores
and
their
corresponding
keypad
and
display
memory
until itischanged.
provides
and
code
one
for
RF
page
numbers
the display changes
storedonthe
preset
channel
channels
are
and
button
the preset freMemory
from1to
new page.
numbers,upto
either
through
MHz
132
SEL) 2
DPL
131
226
displays
pro-
PL
cursor
table. A fre-
Once
recall
table
Enter
simplex
special
chan-
"----./
to
to
4.
3-10

nels display a pair
of
frequencies for each channel
number, one for generate and one for monitor. Identify
or
generate
monitor frequencies by the letters RX
TX. The system changes automatically from transmit to
receive frequencies with the Generate/Monitor switch
or
the MIC push-to-talk switch. Each simplex channel
and
each generate frequencyofa duplex channel has
either a
code. When
DPL
PLorDPL
a preset
code
is
generator.
• ENTRY WITH MEMORY TABLE
To
enter a frequencyorcode into the memory table,
proceed as follows:
1.
Select RF Memory DISPLAY position.
2. Use the keypad cursor keys to select the line and lo-
cation to be changed.
3. Use the keypad numeric keys to enter the new fre-
quency,
4. Make other changes or corrections for each line
PL,orDPL
the memory table.
5.
Turn
the
POWER
Turn
onds.
to verify
• ENTRY WITHOUT MEMORY TABLE
To
enter a frequencyorcode without using the memory
the switch
that
all informationiscorrect.
table, proceed as follows:
1.
Select
Gen/Mon/Mtr
2. Use the keypad cursor keys to locate the cursor over
the first digit in the frequency.
3. Use the numeric keys to enter a new frequency. The
new frequency displays automatically when the power
turned on.
4.Ifa frequencyisselected from the memory table,
after a new frequency was entered directly, the frequency
from the memory table takes precedence and it will
appear when the Analyzer
5.
To
changeoradd
mode, use the same procedure but move the cursor to
the second line.
• PRESET TURN-ON
The Analyzer's normal internal configuration turns-on
Gen/Mon
at
Mtr, FM, and
system to turn-on
follows:
1.
Pressanarrow key to select the desired DISPLAY.
an
2. Press
3. Press a
arrow key to select the desired
MODULATION
Code Synthesizer Mode.
4. Simultaneously depress both keypad cursor keys to
obtain the special function display. Enter code number
code. A dash replaces an unused
is
selected, the appropriate
also programmed into the signaling
code.
switch to Standby for five sec-
On
and check the memory table
DISPLAY position.
is
turned
PLorDPL
PLiDPL.
at
any other configuration, proceed
off
and one again.
codes in the generate
To
program the
FUNCTION.
key to select the desired
PL
or
or
of
as
71
to enter the new configuration into the nonvolatile
memory.
5.
Turn
the
POWER
switch
off
and then on again.
Check the display's accuracy.
6.
To
restore the system to normal turn-on configura-
tion, follow steps
• SIGNALING SEQUENCE
1 through 4 above.
The complete signaling simulator in the system includes
both encode and decode tone sequence synthesizer
capability for the following
Fixed
1 KHz tone
MODULATION
modes:
Single tone variable
Private Line (PL)
or
Tone A
Tone B
Digital Private Line (DPL) sub-audible squelch
Two-tone sequential paging
5/6
tone paging
V signaling
Select
General sequential, ten-tone
Mobile telephone signaling
(lMTS) improved mobile telephone system
(MTS) mobile telephone system
2805
Hz
Tone Remote, base station
SIGNALING SEQUENCE
ENTER0FOR
1)
A/B
ENCODE
2)
5/6
TN
ENCODE/DECODE
3)
SELECTVENCODE/DECODE
4)
PL
DECODE
5)
DPL
DECODE
6)
GENERAL
7)
MOBILE
SEQ
TELEPHONE
MENU
ENCODE/DECODE
MODE
SEL) 0
is
MON/GEN
SIGNALING SEQUENCE MENU DISPLAY
• SIGNALING SEQUENCE MENU
Figure
3-21
page 0 showing the set
one for each family
quences. During the menu display no sequence
SW
FOR
DECODE/ENCODE
FIGURE
3-2l.
defines the Signaling Sequence menu for
of
seven sub-displaysorpages,
of
encode and decode tone
se-
output
is
possible. To select a page, place the cursor over 0online
I and enter a number from I to 7. The system generates
the selected family's sequence. .
NOTE:
The sensitivityofthe decode circuits is controlled by the
OSCILLOSCOPE
results, set the control for a 90%
tion in the oscilloscope mode.
NO
INPUT
SIGNAL indicationonthe screen; too high
causes wandering
Vert switch and vernier.
of
full-screen deflec-
Too
little signal causes a
or
erroneous readings.
For
best
3-11

•
DECODE
MODE
SCREENS
All decode screens have a "start" decode select. This will
start the specified decode and put the software into a
tight loop. This assures the best accuracy possible, but
todoso, the analyzer ignores all switch selections and
key
entries except to gotothe "menu"orto "end" the
decode loop. During the decode loop, a
message
"0"
a "1" entry starts a decodeorwill
ess, and a "2"
appears
near
the
entry on the 2nd line
will
end the decode.
topofthe
will
screen.
return the screen to menu,
reset a decodeinproc-
"DECODE"
In
general,
PL
PL
CODE
XZ
WZ
XA
a
WA
XB
FREQ.HZ
67.0
69.3 4A
71.9
74.4
77.0
CODE
4Z
4B
5Z
5A
FREQ.HZ
136.5
141.3
146.2
151.4
156.7
'----
PL
DECODE
SIGNALING
0)
MENU I) START
SEQUENCE
MODE SEL) 4
2)
END
FREQ: 076.3
CODE: -
FIGURE
•
PL
3-22.
DECODE
PRIVATE
LINE
DECODE
DISPLAY
Select Signaling Sequence DISPLAY. Monitor FUNCTION,
and
PL
Mode. Use special function control to
select the signal source for the decoder. The decoder accepts signal inputs from either the internal monitor
demodulator
Analyzer decodes tone sequence,
outputorfrom the Ext Mod In port. The
PL
and
DPL
signals,
to determine the generating code. Figure 3-22 shows a
page 4 displayofa decoded
PL
frequency and code.
Frequencies readout to a maximum 300Hzwith
resolution. The codeofthe nearest valid frequency will
be displayed. Dashes displayifthe frequency exceeds
the limit. Table
3-5
lists all validPLcodes and their fre-
quencies.
0.1
Hz
WB
79.7
YZ 82.5
YA
YB
ZZ
85.4
88.5
91.5
ZA 94.8
ZB
lZ
1A
IB
2Z
2A
2B
3Z
97.4
100.0
103.5 M2
107.2
110.9 M4
114.8
118.8
123.0
5B
6Z
6A
6B
7Z
7A
M1
82
M3
9Z
M5
M6
162.2
167.9
173.8
179.9
186.2
192.8
203.5
206.5
210.7
218.1
225.7
229.1
233.6
241.8
'---
3-12
3A
3B
TABLE
127.3
131.8
3-5. VALID
M7
PL
250.3
CODES
'--....---'

023071
025
026
031
032
043
134223306411
072
143
073
152
074
155
114 156
115 162
226
243
244
245
251
311
412
315
413
331
423 532 662
343
431
346
432
503631
506
516 654 754
546 664
565
047116165261351445606712
051
125
172
263
364 464 612
054
131
174
265
365
465
624
065
132
205
271
371
466
627
DPL
•
DPL
Figure
page5.If
TABLE
SIGNALING SEQUENCE
0)
MENU
DECODE
FIGURE
DECODE
3-23
3-6. VALID
DPL
CODES
MODE
1)
- NO
3-23.
DPL
INPUT
CODE:
DPL
START
321
SIGNAL -
DECODE
2)
DISPLAY
shows a displayofa detected valid code on
the system detectsaninvalid code, dashes replace the code number. Table 3-6 lists the valid
codes.
632 743
703
723
731
732
SEL) 5
END
734
DPL
•
AlB
ENCODE
Figure 3-24 shows a display for page Iofthe menu.
select sequence input, enter a number from I to 4. Enter
Tone A and Tone B frequencies. Each frequency has a
maximum valueof20,000 Hz with a resolutionof0.1
Hz. The system responds to changes in the tone frequency to allow the next complete signaling sequence to
be executed with the new tone frequency. The majority
of
two-tone pagers use the first two fixed sequences
listed in the tone sequence table. The operator cannot
change the first two sequences but he can change the last
two. Each delay entry has a maximum value
seconds. The system responds to new entries during an
active sequence to allow the next complete signaling se-
quence to be executed with the new timing mformation.
For
triggered sweep on the oscilloscope program the
scope trigger delay to a maximum 10 seconds (0.001
second resolution).Iftime entered exceeds Tone Sequence time, the oscilloscope
will
not trigger. Enter
000.0 to disable trigger delay.
•
TWO-TONE
SEQUENTIAL
PAGING
Program a two-tone pager access sequence with Tone A
and Tone B frequencies, tone durations, and time between tones as defined in figure 3-24. Select Tone Sequence mode for the code synthesizer,
AlB
sequence
the Signaling Sequence DISPLAY, and Generate
FUNCTION. The timing format for this mode consists
of
Tone A for the programmed time, followed by the
programmed delay, followed, by Tone B for the programmed time, followed by the second programmed
delay. This sequence will repeat in continuous position
but
generate only a single sequenceinburst position.
SIGNALING SEQUENCE
ENTER 0
5/6
TONE
1)
5-TONE SEQ
ENCODE
FOR
MODE
MENU
2)
SEL) 2
SEQ SEL) 2
6-TONE SEQ
of
To
10
all
SIGNALING SEQUENCE MODE SEL) 1
AlB
ENCODE
A) 01200.0
A
1)
0040
2)
1.00
3)
0.10
4)
0.20
FIGURE
ENTER0FOR
Hz
DLY
0.00
0.00
0.10
0.20
SCOPE
3-24.
TRIG DLY)0.000 SEC
TWO
0.20
B
0.20
3.00
0.10
TONE
MENU
(AlB)
DISPLAY
SEQ SEL) 1
B) 00300.0
DLY
1.00
1.30
0.10
0.20
ENCODE
Hz
(SEC)
TONE
TN&VCE
3-13
CAP
CODE) 2-13340X
SCOPE
5/6
•
5/6
TONE
ENCODE
FIGURE
TONE
TRIGDLY)
3-25.
ENCODE
0.000 SEC
DISPLAY
Figure 3-25 shows an encode display for page 2ofthe
menu. Select either 5-toneor6-tone paging. Table
lists the cap code digits and their frequencies. Enter the
cap code digit for the desired
output
sequence. The code
has a preamble tone number followed by a 5-digit sequence number. An X automatically appears at the end
of
the cap code. The system responds to changes in the
cap code to allow the next complete signaling sequence
to
be executed with the new code information. The sixth
or
X tone may not be transmitted by selecting the 5-tone
sequence.Ifthe toneisnot transmitted, a delay equal to
the normal tone X timeisinserted. With the MODULATION switch in continuous position, the
of
the preamble tone followed by a continuous cycling 5
or
6 tone sequence. Cycling terminates only when the
switchismoved to the
off
position
output
or
the mode
consists
3-7
is
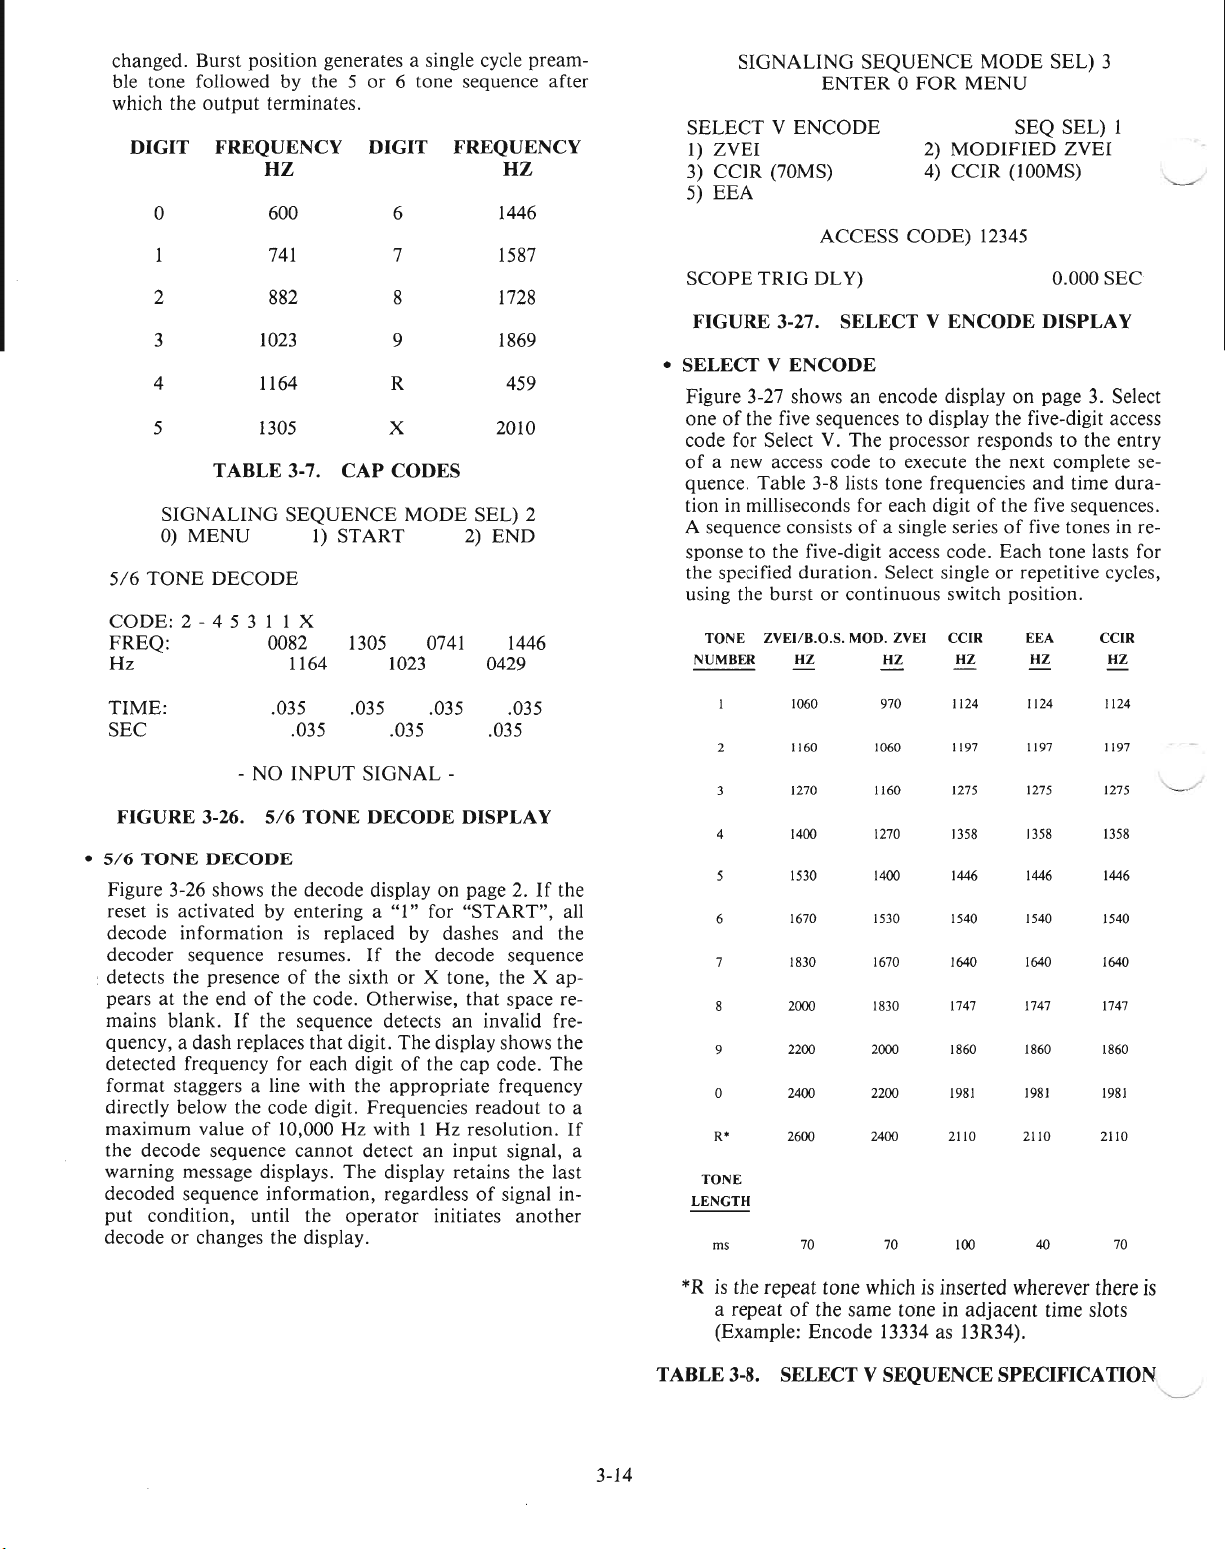
changed. Burst position generates a single cycle pream-
ble tone followed by the 5
which the
DIGIT
output
terminates.
FREQUENCY
HZ
0 600 6
741
2 882
3
4 1164 R
5
SIGNALING
0)
MENU
5/6
TONE
1023
1305
TABLE
DECODE
3-7.
SEQUENCE
1)
START
or
6 tone sequence after
DIGIT
FREQUENCY
7
8
9
X 2010
CAP
CODES
MODE
1446
1587
1728
1869
SEL) 2
2)
END
HZ
459
CODE: 2 - 4 5 3 1 1 X
FREQ: 0082
Hz
1164
1305
1023
0741
1446
0429
SIGNALING
SELECTVENCODE
1)
ZVEI
3) CCIR (70MS)
5)
EEA
SEQUENCE
ENTER0FOR
2)
4) CCIR
MODE
MENU
SEQ SEL) 1
MODIFIED
(lOOMS)
SEL) 3
ZVEI
ACCESS CODE) 12345
SCOPE
FIGURE
SELECTVENCODE
•
TRIGDLY)
3-27.
SELECTVENCODE
0.000 SEC
DISPLAY
Figure 3-27 shows an encode display on page 3. Select
one
of
the five sequences to display the five-digit access
V.
code for Select
of
a new access code to execute the next complete sequence. Table 3-8 lists tone frequencies
tion in milliseconds for each digit
A sequence consists
The processor responds to the entry
and
time dura-
of
the five sequences.
of
a single seriesoffive tones in re-
sponse to the five-digit access code. Each tone lasts for
or
the specified duration. Select single
or
using the burst
TONE
ZVEI/B.O.S. MOD. ZVEI CCIR
NUMBER HZ
continuous switch position.
HZ
HZ
repetitive cycles,
EEA
HZ
CCiR
'--../
HZ
TIME:
SEC .035 .035
•
5/6
FIGURE
TONE
3-26.
DECODE
.035 .035
- NO
INPUT
5/6
TONE
.035 .035
SIGNAL -
DECODE
.035
DISPLAY
Figure 3-26 shows the decode display on page 2.Ifthe
is
reset
decode information
decoder sequence resumes.
: detects the presence
pears at the end
mains blank.
activated by entering a "1" for "START", all
is
replaced by dashes and the
If
the decode sequence
of
the sixth or X tone, the X ap-
of
the code. Otherwise,
If
the sequence detects an invalid fre-
that
space re-
quency, a dash replaces that digit. The display shows the
of
detected frequency for each digit
the cap code.
format staggers a line with the appropriate frequency
directly below the code digit. Frequencies readout to a
of
maximum value
10,000 Hz with I
the decode sequence cannot detect
Hz
resolution.
an
input signal, a
warning message displays. The display retains the last
of
decoded sequence information, regardless
put
condition, until the
or
decode
changes the display.
operator
initiates another
signal in-
The
If
1060
2
4 1400 1270
6
9
o
R*
TONE
LENGTH
illS
1160
1270
1530
1670
1830
2000
2200
2400
2600
70
970
1060
1160
1400
1530
1670
1830
2000
2200
2400
70
1124
1197
1275
1358
1446
1540
1640
1747
1860
1981
2110
100
1124
1197
1275
1358 1358
1446
1540
1640
J747
1860
1981
2110
40
1124
1197
1275
1446
1540
1640
1747
1860
1981
2110
'----
....
70
3-14
*Risthe repeat tone whichisinserted wherever there
a repeatofthe same tone in adjacent time slots
(Example: Encode 13334 as 13R34).
TABLE 3-8.
SELECT
V SEQUENCE
SPECIFICATION
is
'-----'

SIGNALING
0)
MENU
SELECTVDECODE
1)
ZVEI
3)
CCIR
(70MS)
5)
EEA
CODE:
FREQ:
HZ
TIME:
SEC
1080
.070
SEQUENCE
1)
START
2)
4)
2
1160
.070
2600
.070
MODE
MODIFIED
CCIR
SEL)
2)
SEQ
(lOOMS)
2 5 3
1530
.070
FIGURE 3-28. SELECT V DECODE DISPLAY
• SELECT V DECODE
Figure 3-28
of
the
for
Select V.Ifan
the
sequence, a
shows
maximum
shows
present,
resolution.
GENERAL
FREQ
I)
10531.0 0030 2) 02000.0
3) 03561.0
5) 11532.0
7) 00000.0
9)
00000.0 0000
showsadecode
five sequencestodisplay
invalid
dash
decoded
the
SIGNALING
HZ
tone
frequencies for each
10,000Hzwith 1Hzresolution.
time
duration
to
a 1 second
ENTER0FOR
SEQ
ENCODE
TIME
MSEC
0030
0030
0000
SCOPE
TRIGDLY)
displayonpage
frequency
replaces
that
the
maximum
SEQUENCE
4)
6) 08471.0
8) 00000.0
to)
3. Select
the
decoded
is detected within
that
digit.
The
code
The
tone
for each digit was
with I millisecond
MODE
MENU
FREQ
HZ
01876.0 0030
00000.0
0.000
SEL) 6
SEC
FIGURE 3-29. GENERAL ENCODE DISPLAY
3
END
SEL)
ZVEI
1270
.070
access
display
digit, to a
display
TIME
MSEC
0030
0030
0000
0000
I
one
code
• GENERAL ENCODE
Figure
grammable
code
GENERAL
3-29
shows
the
general
oneofthe ten
Select
tone
time
duration
synthesizer keytoselect
Place
the
MODULATION
ous
positiontoinitiate
tone
frequencies willbegeneratedinsequence for its
duration
before
SIGNALING
0)
MENU
FREQ
HZ
1)----
SEQ
possible sequences.
frequency
from
0 to 10,000 milliseconds.
the
generator
SEQUENCE
DECODE
TIME
MSEC
3) - - - -
5) - - - -
7) - - - -
9) - - - -
-
NO
INPUT
encode
from0to
switchinburstorcontinu-
the
sequence.
proceedstothe
I)
START
displayonpage
20,000Hzand
Tone
MODE
FREQ
HZ
2) - - - -
Enter
Sequence
Eachofthe
SEL)
2)
4) - - - -
6) - - - -
8) - - - -
to)
- - - -
SIGNAL
-
FIGURE 3-30. GENERAL DECODE DISPLAY
• GENERAL DECODE
Figure
quence
durations
is
resolution).
duration
curred
ing
valueof9999 milliseconds(Ims resolution).
• MOBILE
The
base sequences. It generates
sequence, verifies
codes
bers.
radio
initiate a new sequence,
3-30
shows
a display
decode
displayeduptoamaximum
between
tone
are
No
in the
burst.
table
derived
display
TIME
the
preceding
Timeisdisplayed
TELEPHONE
Analyzer
and
An
failure.Toreset
simulates
displays
error
mobile
tone
message
for
on
page
from
the
in a
field indicates
SIGNALING
basetomobile
radiotelephone
frequencies
during
the
mobile
press"I"for
the
general
6. Frequencies
input
signal.
valueof9999Hz(I
FREQ
tone
the
field with a time
thataspace
burst
and
uptoa
and
appropriate
response, de-
and
telephone
a sequence indicates
telephone
"START"
the
Press
Mode.
next tone.
6
END
TIME
MSEC
ten-tone
and
Frequency
the
follow-
maximum
mobile
signaling
decoder
again.
6.
pro-
the
a
ten-
se-
time
Hz
oc-
to
num-
and
3-15

SIGNALING SEQUENCE
0)
MENU
MOBILE
1)
1)
MOBILE
TONE1)2000
TEL
IMTS 2) MTS
ORIG
Hz
1)
START
3)
2805
MODE
TEST SEQ SEL) 1
TONE2)1800
SEL) 7
2)
END
SEQ SEL)1
2)
BASE ORIG
Hz
ERROR
06 Illegal tone transition (M.O.). Mobile ID
or
phone number sequence is incorrect.
For example, guard tone space, guard
tone,orconnect tone-space-connect tone
would generateanerror.
TABLE 3-9. IMTS
MESSAGE
ERROR
MESSACES
'-----'
MOBILE ID
DIALED NO
GUARD FREQ
CONN FREQ
DISC
FREQ
FIGURE
IMTS MOBILE
• IMTS MOBILE ORIGINATED
Figure
three phone systems, by Sequence Select and either
mobile
Here the display shows a test sequence menu for IMTS
with the information decoded from the mobile radio for
a mobile originated sequence. The mobile ID and dialed
number vary up to a maximum numberofseven and ten
digits, respectively. The maximum decoded frequency
10,000 Hz with 1 Hz resolution.
under DISC FREQ (refer to the tone sequence diagrams
in your IMTS Manual).
3-31
shows a page 7 display. Select oneofthe
or
base originated, by Test Sequence Select.
B.a.
means base originated;
M.a.
01
Incorrect IMTS tone. M.O. tone was not
oneofthe three possible receive tones:
This error can happen only after the
guard tone has been received.
- - - - Hz
- - - -
Hz
- - - -
Hz
3-31.
ORIGINATED
MESSAGEERROR
means mobile originated.
Connect
Guard
Disconnect.
DISPLAY
Error
messages display
SIGNALING SEQUENCE MODE SEL) 7
0)
MENU
MOBILE
TEL
1)
IMTS 2) MTS
IMTS
1)
MOBILE ORIG
MOBILE ID
GUARD
CONN FREQ
DISC FREQ
is
• IMTS BASE
IMTS BASE
Figure 3-32 shows a page 7 display allowing the operator
to enter a 1 to 7 digit ID for the mobile being tested.
Enter a number in the most significant location. Dashes
replace the desired numberofdigits. Enter the desired
numberofdigits. The other digit locations remain as
dashes. The processor responds to changesinthe telephone number to allow the next complete dialing sequence to be executed with the new number. The display
shows decoded signaling tone frequencies for an IMTS
base originated sequence, with 10,000Hzmaximum frequency and 1 Hz resolution.
the line above SCOPE. The Analyzer encodes and decodes the information defined by figures
FREQ
SCOPE
ORIGINATED
1)
START
3)
2805
7635412
- - - - Hz
- - - - Hz
- - - - Hz
TRIGDLY)
FIGURE
ORIGINATED
3-32.
Error
2)
END
SEQ SEL) 1
TEST SEQ SEL) 2
2)
BASE
aRIa
0.000 SEC
DISPLAY
messages display
3-31
and 3-32.
on
02
03
04
05
Too
many digits decoded (IMTS - M.O.).
The mobile IDorphone number had too
many pulses (more than ten).
Time-out error (IMTS - M.O.orB.O.).
Tone
lasted longer than spec, in specified
state.
Improper sequence (M.O.). Sent mobile
ID before seize tone.
No guard tone
spond to seize tone.
(B.a.).
Mobile doesn't re-
SIGNALING SEQUENCE
MOBILE
TEL
1)
IMTS
MTS
TONE1)2000 Hz
FIGURE 3-33. MTS MOBILE
• MTS MOBILE
Figure 3-33 shows a page 7 displayoftone 1 & tone 2
frequencies used in generating mobile telephone MTS
3-16
2)
SCOPE
ENTER
BURST
MTS
MOBILEID7635412
TELEPHONE
°FOR MENU
TO
START
3)
2805
TRIG
DLY) 0.000 SEC
TELEPHONE
MODE
TONE2)1800
SEL) 7
SEQ SEL) 2
DISPLAY
Hz
'-----"

and
2805 sequences.
imum
10,000
responds to changes in tone frequencies to allow the
next completesequence
frequencies.
quence select
SIGNALING
MOBILE
TEL
I)
IMTS 2) MTS
2805
TONE
I) 0000
MOBILE
FIGURE
3-34. 2805 BASE
• 2805 BASE
Figure 3-34 shows a page 7 display for the mobile tele-
phone
2805 sequence, base originated. Figure 3-34
defines the encode
2805 sequence requires no test sequence select
no mobile
•
TONE
,-.., Select
SEQUENCE
Tone
code synthesizer.
in
monitor
encodeordecode in either generateormonitor
tion.
The
signaling systems.
and
time interval.
TONE
•
REMOTE
The
System can be usedtosimulate a
trol console,
circuitry in remote base station. These useful
are
availableatthe
so
that
they can be coupled
other
place they
by selecting
TION
sectionofthe
propriate
ming
ToneAand
paging sequence. Typical
A) is 2175
Select
ToneBfrom
Remote Instruction
Enter
frequencies
Hz
with 1Hzresolutions.
up
The
to be executed with the new tone
The
MTS sequence requires no test se-
and
hasnomobiletobase system.
SEQUENCE
ENTER0FOR
BURST
TO
MENU
START
MODE
SEL)7
SEQ
3)
2805
Hz
TONE
2) 2805
ID
ORIGINATED
ORIGINATED
to
base system.
Sequence
Encode
information
Mode
for 2805 sequences.
(memory display) for the
in generate function, decode
function,oruse special function
tone
memory
table displays details for all
Program
frequency, time
(ENCODE)
tone
remote con-
or
to troubleshoot tone
MOD
OUT
onto
control
jackonthe
phone
linesorany
maybeneeded. Activate the
TONE
REMOTE
front
mode
in the
MODULA-
panel. Select the two ap-
frequenciesofthe tone bursts by
Tone
B frequencies in the
guard
tone frequency
Hz.
Function tones (ToneB)vary by system.
table 3-10. Refer to your
Manual
for detailed
information.
to a max-
processor
SEL) 3
Hz
DISPLAY
The
and
has
control
func-
duration,
decoding
tone
bursts
front
panel
tone
bursts
program-
Two-Tone
(Tone
Tone
to
Control & Function 1 Freq. Systems
Fl
Transmit
F2 Transmit NIA
FI Transmit
PL Monitor 2050 Hz
R2
Off/R2
Off/Rptr
Rptr
On/PL
PL
Wild Card I
Wild Card
TABLE
Unlike the
provides
REMOTE
switch
issues
ms
to
TONE
at
a level 10 dB below
follows
for as long as the
either the BURST
1950
Hz
wlo
PL
NI A
On
NI
A
On
1550/1450 Hz
Off
1550/1450 Hz
1350/1250 Hz
II
J150/1050 Hz
3-10.
other
signaling sequences, this special
no
repetitive sequences. Institute the
sequence by moving the
BURST
at
a level 30 dB below
A for
or
115
MODULATION
or
2 Freq. Systems
1950
Hz
1850
Hz
N/A
2050
Hz
1750/1650
N/A
1550/1450 Hz
1350/1250
1150/1050 Hz
Hz
Hz
TONEBFUNCTIONS
CONTINUOUS.
ms followed by
thatofToneA.Tone
thatofthe initial
CONTINUOUS
levelofthese burstsisadjustable with the
control,
DISPLA
•
TONE
Connect
Tone Remote unit's
DISPLAY
and
maybeobserved with the
Y similar to any signaling sequence.
REMOTE
the Analyzer's
and
(DECODE)
output.
Monitor
VertiSinad/Dist
Select Signaling Sequence
FUNCTION.
Sequence Decode Mode, as shown in figure
enter Special
displays frequency
guard
tone
information
the
once to reset.
GENERATEFM
PL)
936.0
COUNT
MODE
1)
FREQUENCY
RESOLUTION
1)
0.1
Hz
3)
10
Hz
5)
1
KHz
-
RANGE
FIGURE
(A)
INPUT
3-35.
Function
and
time
and
function tone (B).
for
F-l,
Obtain
information
SEL) 2
SEL) 6
FREQUENCY
SW
NOT
FREQUENCY
control
code #11.
duration
press either keypad cursor key
for F-2
04) 285.7750
*
10.723
AT
MAX
COUNTER
Paging Systems
1950
Hz
N/A
1850
Hz
2050
Hz
N/A
155011450
1550/1450 Hz
1350/1250 Hz
1150/1050 Hz
Hz
mode
TONE
MODULATION
The
sequence
TONE
B for 40
Tone
Switchisheld in
position.
MOD
LEVEL
MODULATION
input
to the
Select General
3-30,
The
screen
for
both
high level
After
obtaining
and
reset, etc.
MHz
DPL)---
2)
PERIOD
2) 1.0
Hz
4) 100
6)
Hz
AUTO
MHz
SENS
POS
-
DISPLAY
A
A
The
and
3-17
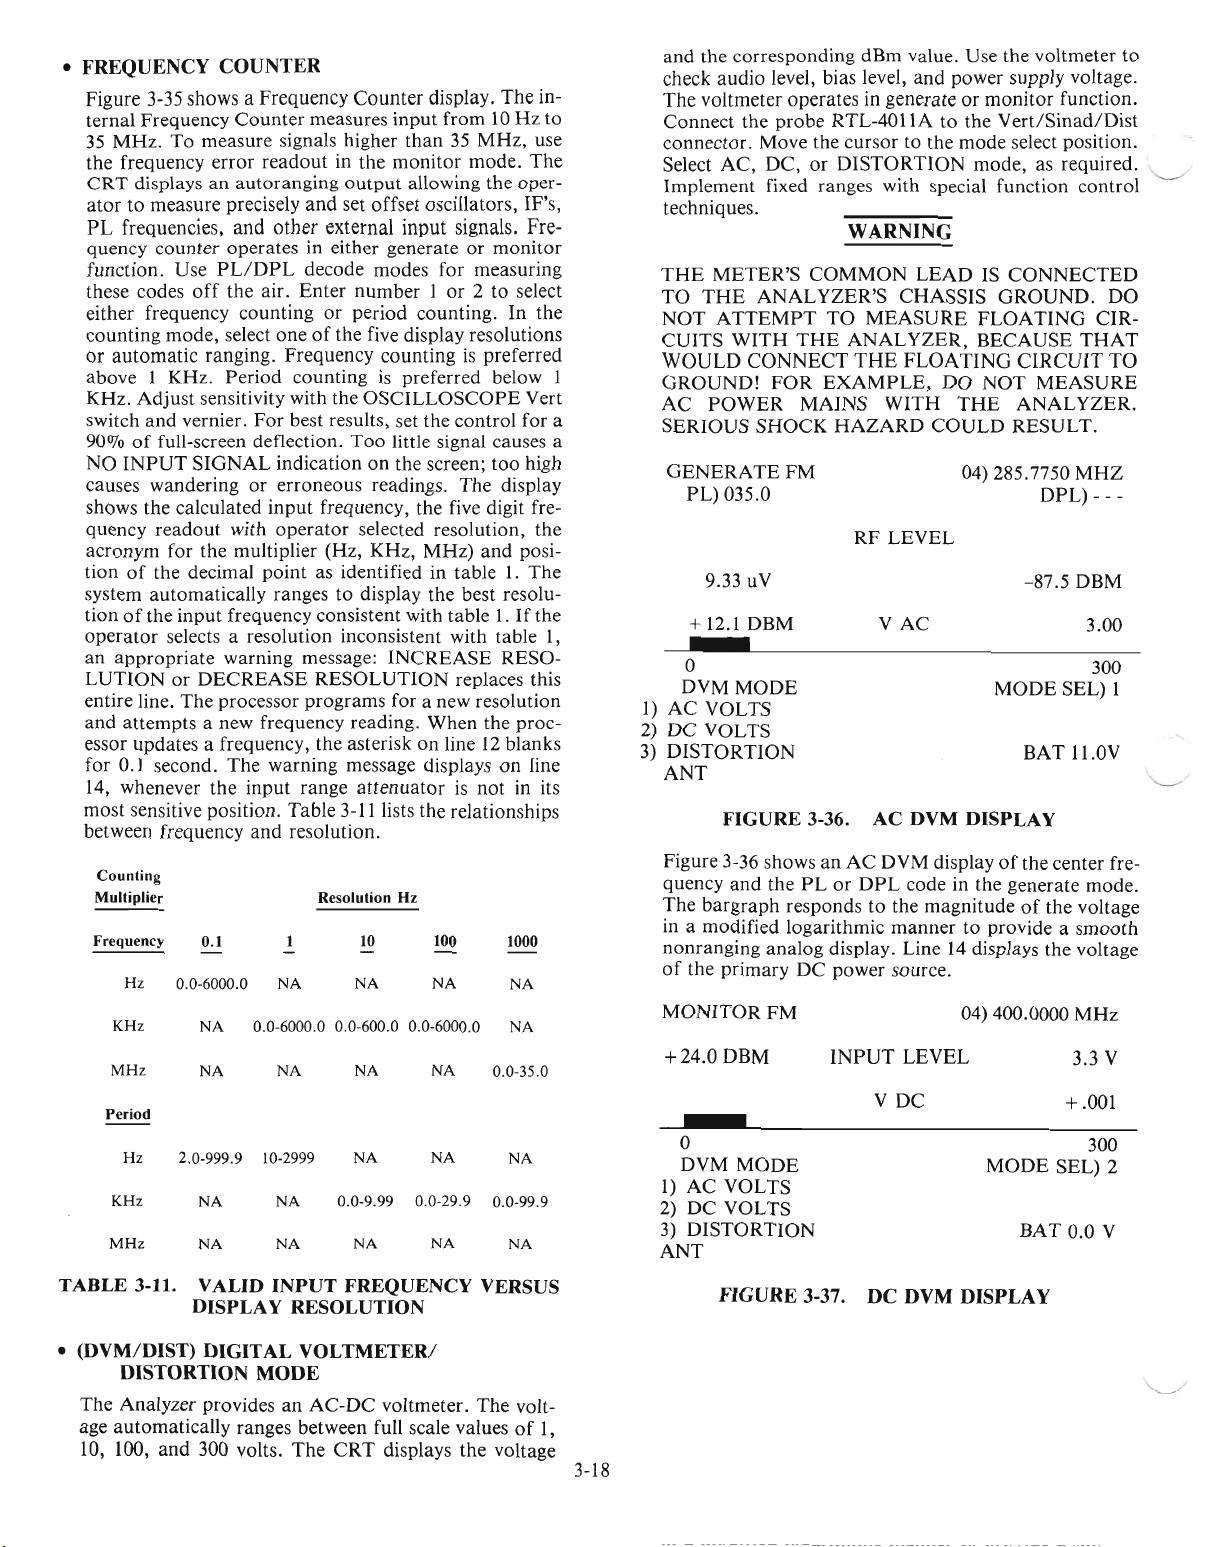
• FREQUENCY
COUNTER
Figure 3-35 shows a Frequency Counter display. The internal Frequency Counter measures input from
35 MHz.
To
measure signals higher than35MHz,
10Hzto
the frequency error readout in the monitor mode.
CRT
displays an autoranging
ator
to measure precisely and set offset oscillators, IF's,
PL
frequencies, and other external input signals. Fre-
output
allowing the oper-
quency counter operates in either generate or monitor
function. Use
these codes
PL/DPL
off
the air. Enter number 1or2 to select
decode modes for measuring
either frequency counting or period counting. In the
counting mode, select one
or
automatic ranging. Frequency countingispreferred
above 1 KHz. Period counting
KHz. Adjust sensitivity with the
switch and vernier.
90070offull-screen deflection.
NO
INPUT
SIGNAL indication on the screen; too high
of
the five display resolutions
is
preferred below 1
OSCILLOSCOPE
For
best results, set the control for a
Too
little signal causes a
causes wandering or erroneous readings. The display
shows the calculated input frequency, the five digit frequency readout with operator selected resolution, the
acronym for the multiplier (Hz, KHz, MHz) and posi-
of
tion
the decimal point as identified in table1.The
system automatically ranges to display the best resolu-
of
tion
operator
the input frequency consistent with table
selects a resolution inconsistent with table
l.
an appropriate warning message: INCREASE RESO-
or
LUTION
entire line.
DECREASE RESOLUTION replaces this
The
processor programs for a new resolution
and attempts a new frequency reading. When the proc-
on
essor updates a frequency, the asterisk
for 0.1 second. The warning message displays
14, whenever the input range
most sensitive position. Table
attenuatorisnotinits
3-11
lists the relationships
line12blanks
on
between frequency and resolution.
Counting
Multiplier
Frequency
Hz
KHz
MHz
Period
Hz
KHz
MHz
0.1 1
0.0-6000.0
NA
0.0-6000.0 0.0-600.0 0.0-6000.0
NA
2.0-999.9 10-2999
NA NA
NA NA
Resolution Hz
-
NA
NA
10
NA
NA
NA
0.0-9.99 0.0-29.9
NA
100
NA
NA
NA
NA NA
0.0-35.0
0.0-99.9
If
1000
NA
NA
NA
use
The
Vert
the
1,
line
and the corresponding dBm value. Use the voltmeter to
check audio level, bias level, and power supply voltage.
The voltmeter operates in generate
Connect the probe RTL-4011A to the
or
monitor function.
Vert/Sinad/Dist
connector. Move the cursor to the mode select position.
Select AC, DC,
or
DISTORTION mode, as required.
Implement fixed ranges with special function control
techniques.
WARNING
THE
METER'S
TO
THE
NOT
ATTEMPT
CUITS
WOULD
WITH
CONNECT
GROUNDl
AC
POWER
SERIOUS
GENERATE
PL) 035.0
9.33
uV
+ 12.1 DBM
COMMON
LEAD IS
CONNECTED
ANALYZER'S CHASSIS GROUND. DO
TO
THE
FOR
MAINS
SHOCK
FM
MEASURE
ANALYZER, BECAUSE
THE
FLOATING
EXAMPLE,
WITH
HAZARD
FLOATING
DO
NOT
THE
COULD
04) 285.7750
CIRCUIT
MEASURE
ANALYZER.
RESULT.
MHZ
DPL) -
RF
LEVEL
-87.5DBM
V
AC
0
DVM MODE
1)
AC
VOLTS
2)
DC
VOLTS
3)
DISTORTION
MODE
BAT 11.0V
SEL) 1
ANT
FIGURE
Figure 3-36 shows an
quency and the
The bargraph responds to the magnitude
3-36.
AC
AC
DVM displayofthe center fre-
PLorDPL
DVM DISPLAY
code in the generate mode.
of
the voltage
in a modified logarithmic manner to provide a smooth
nonranging analog display. Line
of
the primary
DC
power source.
MONITORFM
+24.0DBM
INPUT
V DC
0
----
DVM MODE
1)
AC
VOLTS
2) DC VOLTS
3) DISTORTION
14
displays the voltage
04) 400.0000 MHz
LEVEL
MODE
BAT 0.0 V
3.3 V
+.001
SEL) 2
ANT
'----'"
CIR-
THAT
TO
--
3.00
300
',---",
300
TABLE
• (DVM/DIST)
3-11. VALID
DlSPLA
DIGITAL
DISTORTION
INPUT
FREQUENCY
Y RESOLUTION
VOLTMETERI
MODE
VERSUS
The Analyzer providesanAC-DC voltmeter. The volt-
age automatically ranges between full scale values
la, 100, and 300 volts. The
CRT
displays the voltage
of
FIGURE
3-37.
DC
DVM
DISPLAY
"--../
1,
3-18
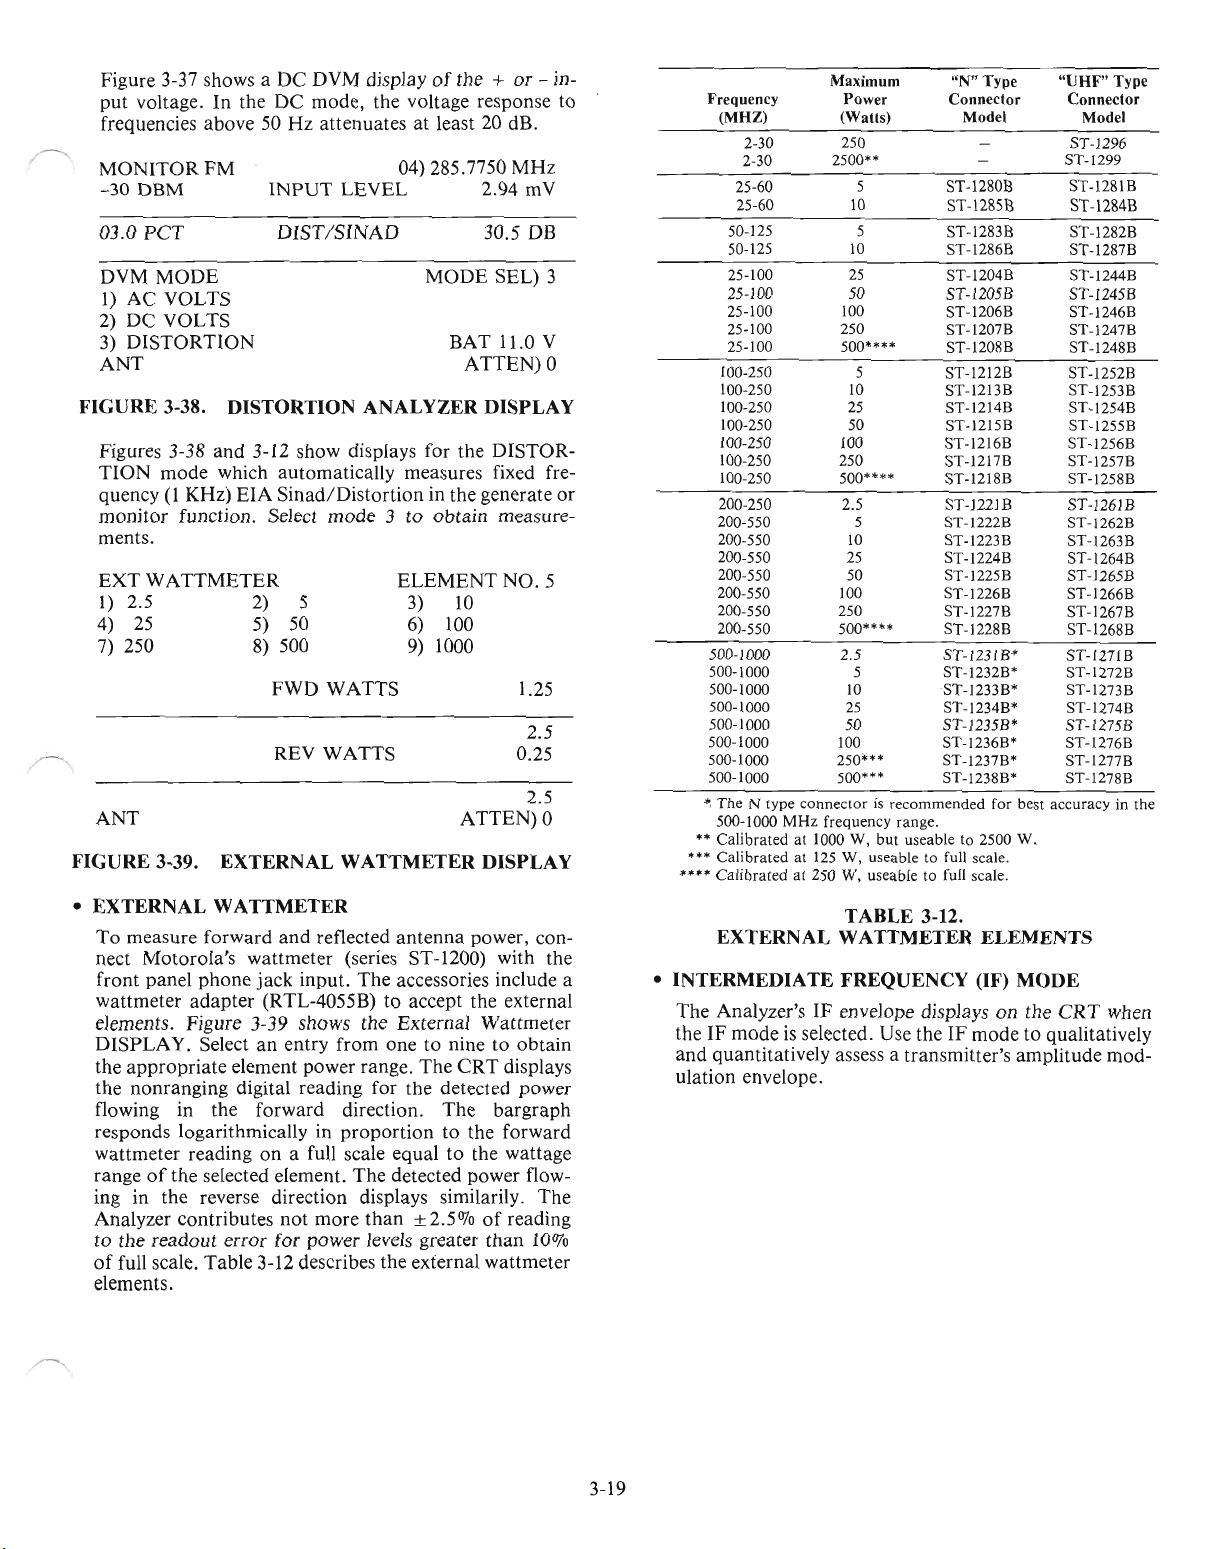
Figure 3-37 shows a
put
voltage.Inthe
frequencies
above50Hz
MONITORFM
-30
DBM
03.0
PCT
DVM
MODE
I)
AC
VOLTS
2)
DC
VOLTS
3)
DISTORTION
ANT
DC
DVM display
DC
mode,
the voltage response to
attenuates at least 20 dB.
04) 285.7750
INPUT
LEVEL
DIST/SINAD
of
the +
MODE
BAT
ATTEN)0
or
- in-
MHz
2.94 mV
30.5 DB
SEL)
11.0 V
3
FIGURE 3-38. DISTORTION ANALYZER DISPLAY
Figures 3-38
TION
quency(lKHz)
monitor
and
3-12 show displays for the
mode
which
EIA
function. Select
automatically
measures fixed fre-
Sinad/Distortioninthe
mode3to
obtain
DISTOR-
generate
measure-
ments.
EXT
WATTMETER
1)
2.5 2) 5
4)
25
5) 50
7) 250 8) 500
FWD
WATTS
ELEMENT
3)
10
6) 100
9)
1000
NO.5
1.25
2.5
REV
WATTS
0.25
2.5
ANT
ATTEN)0
FIGURE 3-39. EXTERNAL WATTMETER DISPLAY
• EXTERNAL WATTMETER
To
measure
nect
Motorola's
front
wattmeter
elements. Figure 3-39 shows
D1SPLAY.Selectanentry
the
appropriate
the
nonranging
flowing in the
responds logarithmically in
wattmeter
rangeofthe selected element.
ing in
Analyzer
to
the
of
full scale.
panel
forward
phone
adapter
and
reflected
wattmeter
jack
input.
antenna
(series ST-1200) with the
The
accessories include a
(RTL-4055B)toaccept the external
the
External
from
onetoninetoobtain
element
power
range.
digital reading for
forward
direction.
proportiontothe
readingona full scale
the
reverse direction displays similarily.
contributes
readout
Table
not
error
for
3-12 describes
more
power
equaltothe
The
detected power flow-
than
levels greater
the
power, con-
Wattmeter
The
CRT
the
detected power
The
±2.5OJo
of
than
external
wattmeter
displays
bargraph
forward
wattage
The
reading
10%
elements.
or
Frequency
(MHZ) (Walls)
2-30 250
2-30 2500"
25-60
25-60
50-125
50-125
25-100
25-100
25-100
25-100
25-100
100-250
100-250
100-250
100-250
100-250
100-250 250 ST-1217B
100-250
200-250
200-550
200-550
200-550
200-550
200-550
200-550
200-550
500-1000
500-1000
500-1000
500-1000
500-1000 50
500-1000
500-1000
500-1000
" The N type connector
500-1000
••
Calibraledat1000 W, but useable to 2500 W.
...
Calibrated at
••••
Calibratedat250 W, useable to full scale.
Maximum
Power Connector Connector
5
10
5 ST-1283B
10
25
50 S1-1205B ST-1245B
100
250 ST-1207B
500····
5 ST-1212B
10
25
50 ST-1215B ST-1255B
100 ST-1216B ST-1256B
500····
2.5 ST-1221B S1-1261B
5 ST-1222B
10
25
50 ST-1225B ST-1265B
100
250
500""
2.5
5 ST-1232B' ST-1272B
10
25
100
250"" ST-1237B' ST-1277B
500'"
is
MHz
frequency range.
125
recommended for best accuracy in the
W, useable to full scale.
"N"
Type
Model
ST-1280B
ST-1285B
ST-1286B ST-1287B
ST-1204B
ST-1206B
ST-1208B
ST-1213B
ST-1214B
ST-1218B ST-1258B
ST-1223B
ST-I224B ST-1264B
ST-1226B ST-1266B
ST-1227B
ST-I228B
ST-I231B'
ST-J233B'
ST-1234B' ST-1274B
ST-1235B' ST-1275B
ST-1236B' ST-1276B
ST-1238B' ST-1278B
"UHF"
Model
ST-1296
ST-1299
ST-1281B
S1-1284B
ST-1282B
ST-1244B
ST·1246B
ST-1247B
ST-1248B
ST-1252B
ST-1253B
ST-1254B
ST-1257B
ST-1262B
ST-1263B
ST-1267B
ST-1268B
ST-1271B
ST-1273B
TABLE 3-12.
EXTERNAL WATTMETER ELEMENTS
• INTERMEDIATE FREQUENCY (IF) MODE
The
Analyzer'sIFenvelope displaysonthe
CRT
theIFmodeisselected. Use theIFmodetoqualitatively
and
quantitatively assess a
transmitter's
amplitude
ulation envelope.
Type
when
mod-
3-19

3.7
OSCILLOSCOPE
r
KHz
FIGURE
•
SCOPE
AC
Veri
3-40.
OR
SECTION
DIS
pI Sweep
I~O
M~'
OSCILLOSCOPE
Position
OSCILLOSCOPE
SCOPE
DC
liOtll
Ell.IHonl
SECTION
The Analyzer provides a general purpose 500 KHz oscilloscope with calibrated vertical input sensitivities and
automatic
or
triggered horizontal sweep rates (figure
3-40). Both vertical and horizontal inputs may be
switched between internal and external sources. Use the
scope to analyze waveforms, view modulation signals
(generated internally or externally), detect asymmetric
modulation or audio distortion, trace signals, and
troubleshoot. The vertical input
is
combined with the
BNC port that also serves as the input for DVM,
Sinad/Dist meter, and Frequency Counter. The Cover's
accessories include probe #RTL-4011A for vertical and
horizontal inputs.
The horizontal time base generator provides a linear
horizontal sweep from a minimum rate
division to a maximum rate
of1us
of
100msper
per division in six
decade ranges selectable with the Horizontal control.
Use the oscillator Trigger Level switch in automatic or
normal position to synchronize the horizontal time base
to the vertical input signal. In automatic mode, the
scope will trigger continuously. In normal mode, the
scope will trigger when the vertical signal exceeds the
level set by the control. The smaller trigger level control
adjusts the level
the time base. A separate front panel BNC
for the External Horizontal input enabled
at
which a positive going signal triggers
port
provides
by
a seventh
position on the time base control switch. The input sen-
sitivity varies continuously over the mlmmum range
from 0.1 volt per division to
10
volts per division. Ad-
just sensitivity with the Vert switch and control.
is
The time base
calibrated with the vernier control fully
clockwise. Normal operation does not include a char- '-.--/
or
acter display in either Scope AC
Scope DC mode.
However, if the operator also selects a SWEEP FUNC-
TION, then the first character line on the CRT identifies
the operating center frequency. The synchronized scope
displays the swept response symmetrically about the
selected carrier center frequency. When Scope AC or
is
Scope DC DISPLAY
selected in conjunction with
sweep function, the oscilloscope horizontal input
coupled to the sweep signal. When the scope traceisat
the center
taneous RF output frequency will be equal
of
the screen(±1 minor division) the instan-
to
the pro-
grammed frequency.
NOTE
In all cases the bargraph aids the autoranging digital
scale. The bargraph responds in a modified logarithmic
manner that provides a smooth nonranging analog display. In other words, the analog display
same amount for a 1 volt change
will
change the
at10volts as for a
25
volt change at 250 volts.
Function
Power Monitor (above 1
Frequency Error
FM Modulation
AM Modulation
DVM (AC
or
DC)
DIST/SINAD
Ext Wattmeter
Analog
Full Scale Range
w)
0·125w
0-15KHz
0-100KHz
0-100070
0-300V
oto 100% (Dist)
-60db to
Wattmeter Element
Bargraph
Odb
(SINAD)
dependent
0-2.5w to l000w
SPECTRUM ANALYZER USAGE
The indicated
is
30db less than actual input at the RF
rf
signal level in the spectrum analyzer mode
In/Out
port.
When using the spectrum analyzer for measuring harmonicsoftherfcarrier, itisnecessary to limit the levelofthe
carrier to less than -20dbm (RF
In/Out
port) or less than
-50 dbm (Antenna port) with an external attenuator in
order to maintain the correct harmonic relationship to the
rf
carrier.
is
---./
rf
3-20
'--/

ADDENDUM
• SELF-TEST DISPLAYS
The self-test check may be executedatanytime during
system operation by executing special function 72.
The screens for the different self tests are outlined
below.
destructive RAM test
volatile memory, then stores sequential numbers into
RAM to check for any addressing problems
RAM.
displayed, see Figure 3-41. The operator may enter a "0"
if
operator does not respond in a minute, the testing will
proceed even without an entry.
If
the self testisinitiated by a power up, the
is
performed first.
If
an errorisdetected, the following screen
he
wishes to proceed even if an error exists.Ifthe
It
erases
in
the
A NON-VOLATILE MEMORY FAULT
HAS BEEN DETECTED.
CONSULT
TROUBLESHOOTING INSTRUCTIONS
FOR CONTINUED OPERATION:
is
PRESS 0
PRESS I
THE
OPERATOR'S MANUAL
(PN68P81069A66)
FOR
TO
CONTINUE
TO
RE-INITIALIZE
WITH FACTORY PRESETS
The Test Equipment Service Center should be consulted
to remedy the error.
SELF TEST
*ERROR
DESTRUCTIVE RAM TEST ERROR SCREEN
After the destructive RAM testisperformed on volatile
memory, then a non-volatile memory check
formed to check to see that a bit pattern stored there has
not been corrupted.
displayed, see Figure 3-42.Ifthe operator wants to
reinitialize the non-volatile RAM, a "1"
existing non-volatile memory
error has been detected, a "0"
sists, the battery on the microprocessor board should be
checked. After a minute, the test will proceed
had been entered.
IN
VOLATILE
PUSH 0 TO CONTINUE
FIGURE 3-41.
If
it has, the following screen
RAM*
is
desired, even though an
is
entered.Ifthe error per-
is
is
entered.Ifthe
as
if a "0"
per-
FIGURE 3-42.
NON-VOLATILE RAM ERROR SCREEN
After the non-volatile RAM test on power up, or if the
operator initiates a self test with a special function 72, a
is
checkerboard pattern
3-43. This serves as a visual check
verify proper alignment
xx xx
XX
xx
xx xx
XX
xx xx
XX
XX XX
xx
XX
XX
xx
XX
XX XX
XX
XX
XX
xx
XX
XX XX
XX
is
XX
FIGURE 3-43. CHECKERBOARD PATTERN
XX
displayed on the screen, see Fig.
of
of
the CRT.
xx
XX
XX
XX
XX
XX
XX
XX
XX
XX
XX
XX
XX XX
XX
SELF TEST
XX XX
XX XX XX
xx
XX XX XX
XX
XX
XX XX
XX XX
XX
XX XX
XX XX
XX
the display to
XX
XX
XX
XX
XX
XX
XX
XX XX
XX
XX
3-21

A non destructive RAM testisperformed that stores
known characters to each RAM location. The value
read back and verified. The original valueisfinally
If
replaced.
shown; see Fig. 3-44. The
an errorisdetected, the following display
operator
may enter a "0" to
continue the self test. Otherwise, the test resumes
automatically after about a minute.
is
SELF
TEST
is
*CHECKSUM
COMPLETE
ERROR
IN ROM*
ROM NUMBER
Ml
M2
M3
M4
M5
SELF
TEST
COMPLETE
*ERROR IN VOLATILE RAM*
PUSH0TO
NON-DESTRUCTIVE RAM TEST ERROR
CONTINUE
FIGURE 3-44.
Next, a checksum checkisperformed to verify that the
PROM
this type
ror
program has not changed. The error screen for
of
errorisshown in Fig. 3-45.Ifa checksum er-
is
detected
in
an
PROM
device, then
an
alphanumeric specifier identifies the socket itisin. M1
identifies the
PROM
microprocessor board, M2 the 2nd from the left,
3rd from the left, and
"0" to allow testing to proceed.
device in the leftmost socket on the
M3
the
so
on.
The
operator can enter a
If
no entryismade in a
minute, the test will proceed automatically.
PUSH0TO
FIGURE 3-45. CHECKSUM ERROR SCREEN
If
a non-destructive RAM error
CONTINUE
NOTE
and
checksum error are
both detected, then they appear on the same screen.
is
The testing
tern with a "SELF
completed with a final checkerboard pat-
TEST
COMPLETED"
message.
3-22

4.0
SERVICE
This sectionofthe
from pocket pagers to repeaters.
Analyzer
of
log
These
are
responsibility for their accuracy, applicability,
recommended test methods
SHOP
and
how to set controls
all measurements
typical applications
SETUPS
manual
guides troubleshooting, diagnosing,
It
contains
and
indicators to
and
information
and
are
not
and
specifications.
SECTION 4
APPLICATIONS
and
adjusting communications
informationonhow to connect equipment under test to the R-2001 D
obtain
importanttoyour
all-inclusive.
or
safety. Always refer to your
the anticipated
operation.
CAUTION
Not
every test works with every transceiver.
CRT
display. Maintain a permanent written
own
transceiver's service
equipment
Motorola
ranging
takes no
manual
for
The Analyzer's DVM input
cuits, such as certain receiver audio
is
unbalanced (ground referenced). Useanappropriate
interface to measure balanced cir-
outputsortelephone lines.
4-1

RECEIVER SENSITIVITY TEST
12 DB SINAD
AUDIO DISTORTION
®
MOTOROLA
CO"IIlUlfICl1l0IiS
sysnlllUllYlU
~
R~lnJOut
..
I,'ONH.
.01-1
MHt
MODULATION
..a. Co",
~Oll
BUIst
Code
Synlh
Mode
o
~",'OPL
o
PL,DPLtnv
o rone
...
o
ToneS
o
,_.SeQ
o
Tone
Remole
~@]
'---.....---
POWER
fiO:,....,
v::::!J
i
8
'"
AC
O
HOflz
EJ.tHo,,,
©
OtOI1
..
enA.~d~
@10mm
@]~00
0000
@
Yo.
•
.....",$,".d/DlII
(+)
I
DVM/COunl,'
~
,.
In
"g'
@
•
'len
oHoril
DISPLAY
o G
...
o
M.~.,
o
SIl!c:IAft!lI~ltr
0llPlUG,n
RFMlmOfy
8
o
Sigl'lllJng
o
F,ltqCounllt.
o
OVM.'Oisr
o
ExtWllIrnelt.
0'"
o
~op.eAC
o
Sc:opeOC
@]@]
·Mo"MI.
••
FUNCTION
Gene.".
~IrAOnltol
Seq
o
oM
o CW
o
AM
o
SSBIOS8SC
o
SWP
o
SWP
g]@]
FUNCTION
DIGITAL
ANALOG
INDICATOR
NEG
DEVIATION
DIST
READING
SINAD
FIGURE 4-1.
ANT
n
MOBILE
RECEIVER
GENERATEFM..)
PL)
100.0
RF
LEVEL
lOOOuV
5.0
PCT
DIST/SINAD
-60
DEV
-3.0
-100
12 DB SINAD TEST SETUP
KHZ
4-2
SPEAKER
50000
MHZ
DPL) .
-47.0DBM
26.0 DB
+3.0
+100o
AND
FREQUENCY
..
DPL
RF
LEVEL
DIGITAL
DISTORTION
READING
o
POS
ANALOG
DEVIATION
INDICATOR
DISPLAY
CODE
OUTPUT
SINAD
DEVIATION
OR

Use
the
R-2001D
signal
generator
and
RECEIVER SENSITIVITY TEST
12 DB
SINAD
AUDIO DISTORTION
SINAD
metertomeasure a receiver's
performance
by the following procedure:
1. As shown in figure 4-1,
nect the Analyzer's
2. Set
DISPLAYtoGen/Mon
3. Select
4.
5. Set
6.
the
RF
Adjust
tion, set
a. With a
b. Read %
about
the
From
1KHz Level
MODULATION
lOOOuVRFinput
the receiver be set to
RF
Step
2uV.
display.
the
RF
distortion
attenuatorto-llOdB
Adjust
Vert/Sinad/Disttothe receiver's
carrier frequency fromanRF
control
the
LEVELonthe display, read the receiver's 12dB
connect
Mtr
for
switch to
level,
produce
directly
attenuator
the
Analyzer'sRFIn/Outtothe
mode. Select a
60070
of
rated
Off
adjust
the volume
rated
audio
from
the
DlST
and
the variable
(lOdB steps)
and
FUNCTION
Memory
deviation as indicatedonthe
Ext Level controltoOff.
controltorated audio power
power before measuring 12dB
/SINAD
and
the variableRFcontrol
audio
output.
table channel
scale.
control
to mid-range.
antenna
and
set the
SINAD
connectorofthe
Disable all
numberorenter directly from the keypad.
sensitivity in uV
PL's
FUNCTION
CRT.Toprevent spurious noise
output.
SINAD.
The
display's
until a 12dB
receiver
and
open
the
switch to Generate.
EIA
RS-204-C specifies
RF
LEVEL
SINAD
and
reading
dBM.
under
Squelch.
should
appears
test.
modula-
indicate
Con-
that
on
4-3

RECEIVER SENSITIVITY TEST
20
DB
QUIETING
@ItIfOTOROLA
..
r----~..r----
'"o'MO'
CA~,T~~~
o",p
'A'Ul 2.S
paWlA
©
DUPLEX GEN 0
On
e:
011
~
O",P"'
@DOllor
•
CAUTIO.
I.'UT
,1lWUI
I
h'
W."m
<@
RF
SECTION OSCILLOSCOPE
AFl".,,1
.,po::::'"
'
...
, I
CAUTIO.
"'"0
CO••UIIUTrdl$
srsrr
....
'lUU
-_.
~
~.
@[ilw[!1
@]0~GJ
0[Q0~
'H,
@
I(HI'
(o
..
,,@§O;~
2S 1
MI.
0
I
V,,,,
Yen/S,n,ClIDI"
DVM/Counle,l"
@
"g'
EIIV/
(;©To"'l""~
.1
- + 0
10
/ / .....
to
"/C.,
Potlllon
©
•
....
11
o
HOIII
POWER
00
fi
SI.mrO,
'&J
De
011
""
AC
O~...,
R.'Clr
i
RFSc.&n
o
"'S<rc''''\
~
(~~©'
".
'o'~~'
hI
Nom••, /
HOIII
eatHo...
~
./
e.l
DISPLAY FUNCTION
o
C",.'MonMI.
o
ModllllllQ(\
o
Sp.(I"'n.l~u,
8
Ouple.C,n
IIFMemOfy
o
S'gn
.......lIS.. q
o
F,.q
Counter
o
UVI'l'I,DIST
o
e.'w.u
....t
0"
o
o
H'"
low
••
SCO~"'C
5c:0Jl"OC
@]
~
MONITOR
Squelch
0"0'0
011
Im,,,,.,Oph
fi
W;"
~
N."o_
OemodO
...
,
~
Vol
ew
Iffi
'tJ'
8FO
0
...
rMODULATlON
ijO'"''''
"'0""01
0,.
Ocw
o
A.
o SSBIOSBSC
o
SWP
o
SWP.OI.IMHI
~c.o.
0"
BUISt
CoOlSy.."...._..
a
PltOPl
o
Pt.,DPl-ln",
o
T_
....
o
'·10
T"".8
Wil
o
TOr>llSeQ
o
T~AemOI'
~@]I~@]
me
M.l
CodeSynlhl,,1
P 0
Min
'"0
ou
MoClO,,1
Ealle",'
011
fl'
~
EaIMod't'l
© ©
ANT
n
MOBILE
RECEIVER
GENERATE FM
PL
...
0.50uV
o
DVM MODE
I
AC
VOLTS
2 DC VOLTS
3 DISTORTION
RF LEVEL
VAC
00) 150.000
DPL
-117.0
MODE SEL)l
SPEAKER
MHZ
...
DBM
300
FIGURE
4-2.
20
DB
QUIETING TEST
4-4
SETUP
AND DISPLAY

RECEIVER SENSITIVITY TEST
20 DB QUIETING
1.
Connect the Analyzer to the receiver under
switch to Monitor and select FM or
2.
Turn
on the receiver (unsquelched)
rated audio power). Read the audio noise voltage fed to the Analyzer. Note the noise reading (REF) in dBm.
and
CW
FUNCTION.
turn
test,
as shown in Figure 4-2. Set
up the receiver audio gaintofeed audio noise to the Analyzer (at least
DISPLAYtoDVM/DIST,
FUNCTION
1/4
3. Set
4. Read the
FUNCTION
REF
above (0.
screen.
switch to Generate. With all modulation off, adjustRFLEVEL
!OX
the
REF
Voltage).
RF
LEVEL reading required to produce 20 dB quieting in uV (left side)
until display reads 20 dB less than
and
dBm (right side) on the
CRT
4-5
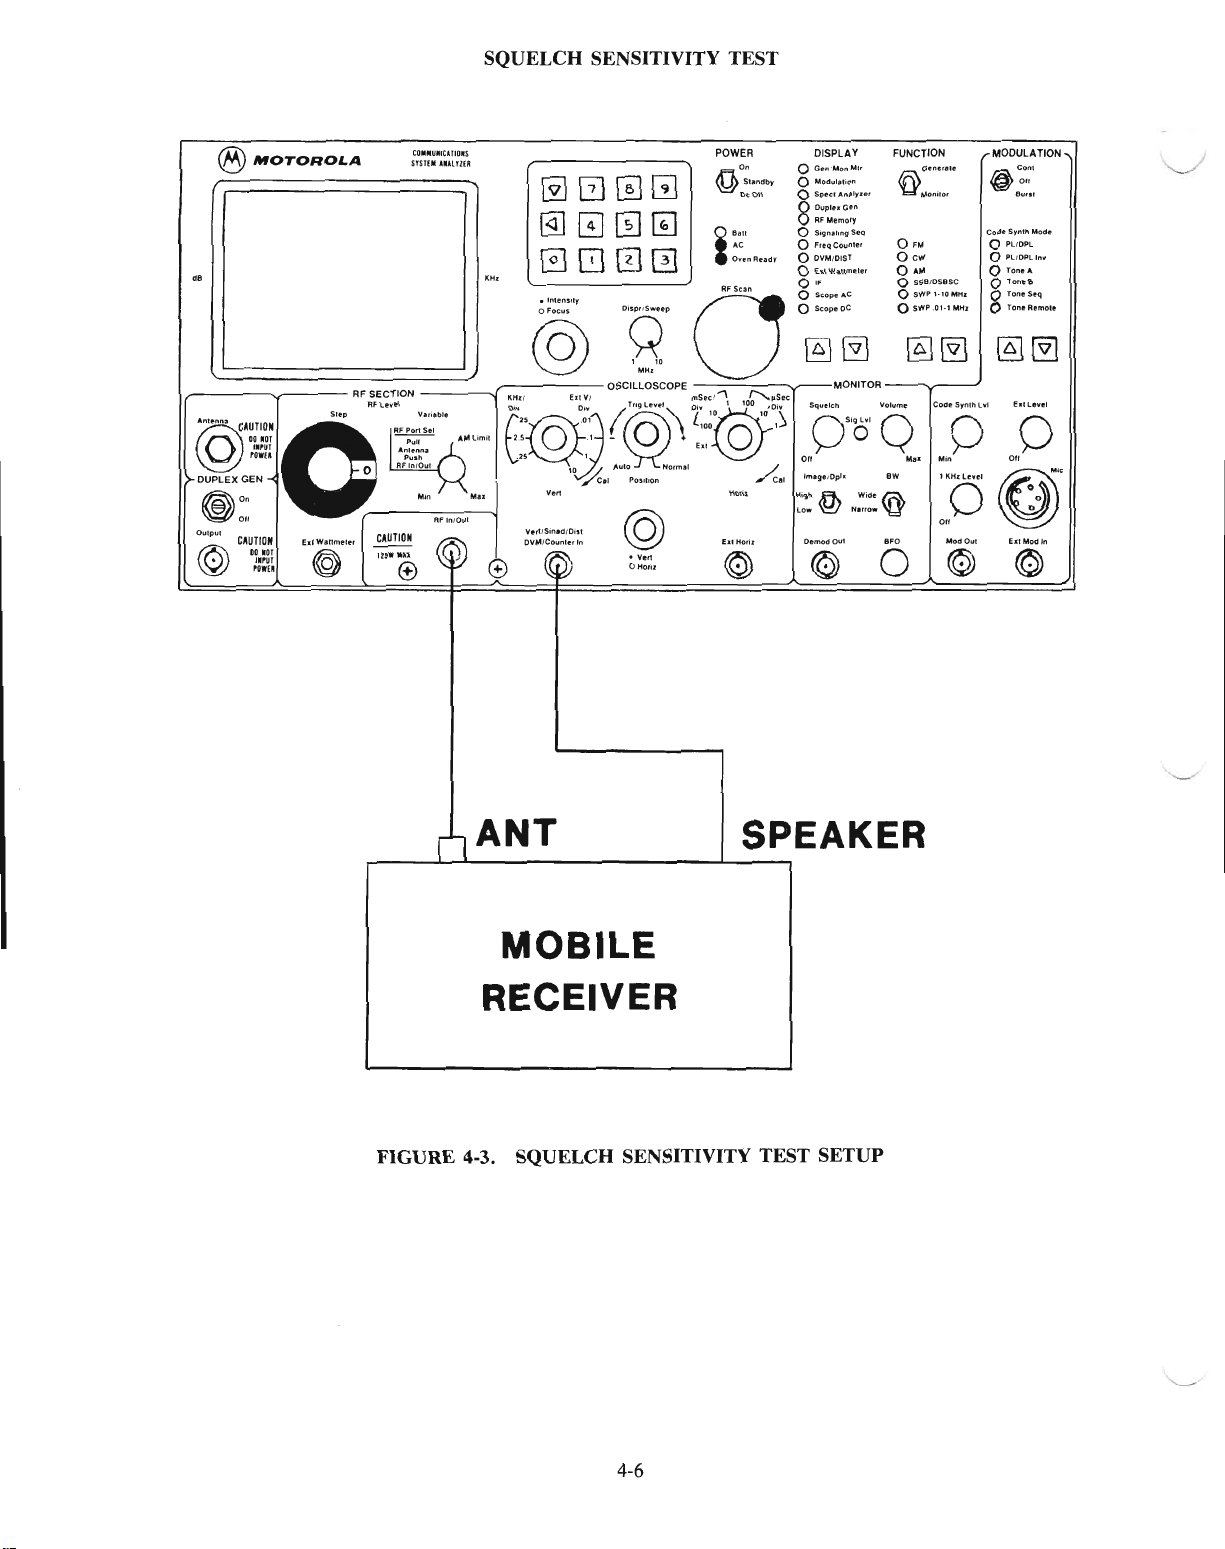
SQUELCH SENSITIVITY TEST
®
MOTOROLA
dO
I RF
@:i5i
DUPLEX
GEN 0
~
0,
~
all
Output
CAUTION
DO
rOT
1.",1
@
rOWER
'"
EIIWanmele.
~
SECTION
RFL~...
(
CAUTION
IlS••'"
COMIIIUlfIClTIOJl$
srSTUIAlUlUUl
el
"-
M~
e
Af
M"
11'110111
~[2]~GJ
@]~G]G]
0800
KH,
.Inten"l,
@
K~rr
c@,
I
e
Ell
VI
,§
""Cel
Vert
Ver1ISIn~,Di,1
DVM/Counlerln
(@
POWER
00
ft
Standby
~oco,/
,
..
e
.e
OY~nRndr
i
AFScan
"8"
OSCILLOSCOPE
(,'o~
"~_.
POSllion
©
• Veri
oHori,
o
mS1'CI""
~
~:~©~1
~al
Ho,il
l!lIlHorll
~
OISPLAY FUNCTION
o Ge-n"Mon "II'
o
Modulation
o
SpeCIA
....
o
"'Ple.cen
8
RF
Memory
o
Si;n.l,ng
o FreQCOllnltl
o
DVM/DIST
o
e.tWatlmlt"
0"
o
SUlpe
....
C
o S<:opeOC
@]
@]
MONITOR
Squelch
O"OSi
Im·9·,Opt~
High.a.
La"~Nlno_Y
OemodO..,
®
,yle'
SeQ
O
'
WIClr
@o'",
Mon,to.
O'M
Oew
O'M
o
SSBrOS8SC
o
SWP
o SWP
~@J
....
olume
Q"
ow
~
e'o
o
rMODULATION
....
Code
\·10
MHI
.Ot-I
MH.
COClf
S,n\h
Lvi
O
I
MIO
"0
011
ModO
..,
@ ©
@conl
0"
&v
..
l
S.,.flU'l
Modll
o PLtDPL
a PL,.IOPlln
o
TOMA
o
ToneB
o
ToneSeq
o foneRemole
~@]
e-.tL
....el
0
011
f)'
~
e.l
Mod
...
In
n
ANT
SPEAKER
MOBILE
RECEIVER
FIGURE 4-3. SQUELCH SENSITIVITY TEST SETUP
~
4-6
'-----
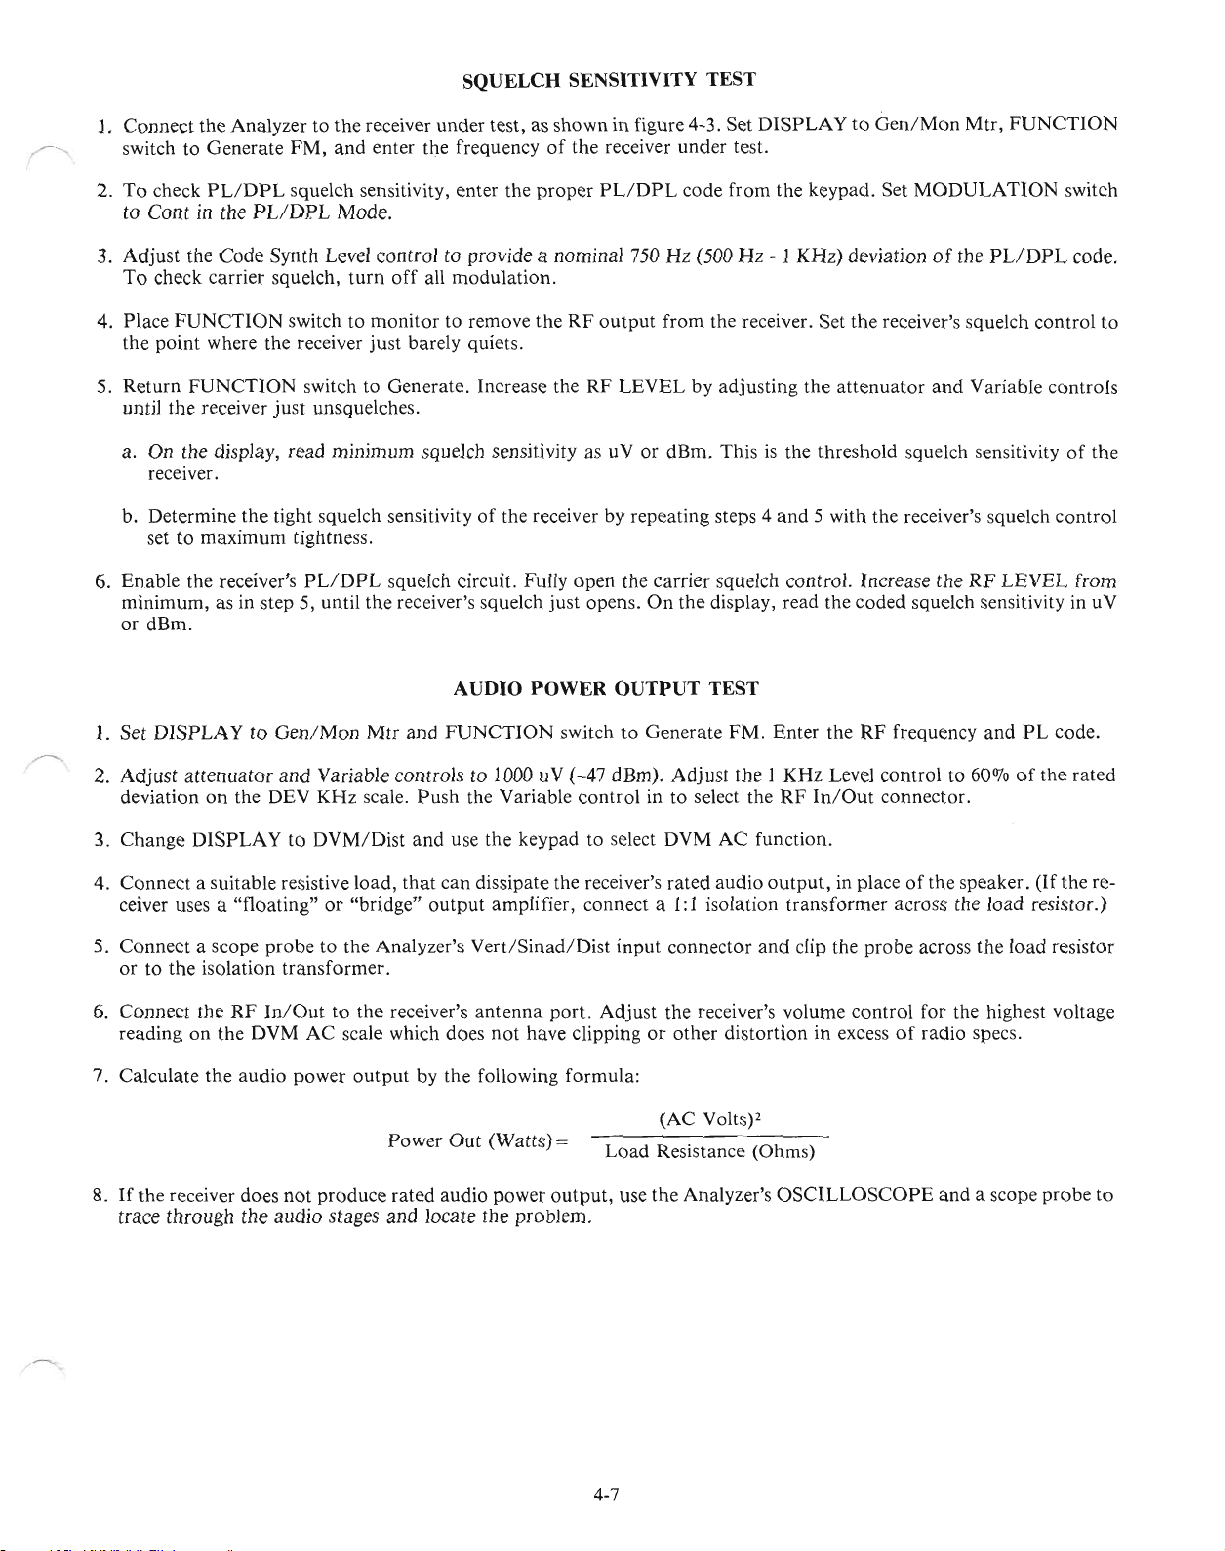
1.
Connect
switchtoGenerate
2.
To
to
3.
Adjust
To
4.
Place
the
5.
Return
until the receiver
a.
the
check
Cont
in the
the
check
FUNCTION
point
FUNCTION
On
the
receiver.
PLlDPL
carrier
where
Analyzertothe
FM,
squelch
PLlDPL
Code
Synth
squelch,
switchtomonitortoremove
the
receiver
switchtoGenerate.
just
display,
read
receiver
and
enter
sensitivity,
Mode.
Level
controltoprovideanominal
turn
off
just
unsquelches.
minimum
SQUELCH SENSITIVITY TEST
under
test,asshowninfigure 4-3. Set
the
frequencyofthe receiver
enter
the
proper
all
modulation.
theRFoutput
barely
quiets.
Increase
squelch sensitivity as
the
PLlDPL
750Hz(500Hz- 1
RF
LEVELbyadjusting
uVordBm.
under
code
from
DISPLAYtoOen/Mon
test.
from
the
keypad.
KHz)
the
receiver. Set
the
attenuator
Thisisthe
threshold
Mtr,
Set
MODULATION
deviationofthe
the
receiver's
squelch
squelch
and
FUNCTION
switch
PLlDPL
Variable
sensitivityofthe
code.
control
controls
to
---
Determine
b.
settomaximum
6.
Enable
minimum,
or
Set
1.
Adjust
2.
deviationonthe
Change
3.
Connectasuitable
4.
ceiver uses a
5.
Connectascope
ortothe
6.
Connect
readingonthe
7.
Calculate
the receiver's
dBm.
DISPLAYtoGen/Mon
attenuator
DISPLAYtoDVM/Dist
isolation
the
the
tight
squelch
tightness.
PL/DPL
as in
step
5, until
and
Variable
DEV
KHz
resistive
"floating"or"bridge"
probetothe
transformer.
RF
In/Outtothe
DVM
AC
scale which
the
audio
power
sensitivityofthe
squelch circuit.
the
receiver's
AUDIO
Mtr
and
FUNCTION
controlsto1000 uV
scale.
Push
and
use the
load,
that
can
output
Analyzer's
receiver's
does
output
by the following
receiver by
Fully
open
the
squelch
the
dissipate the receiver's
Vert/Sinad/Dist
antenna
just
POWER
switchtoGenerate
(-47
Variable
amplifier,
not
controlinto
keypadtoselect
connect
port.
have
clippingorother
formula:
opens.Onthe
OUTPUT
dBm).
input
Adjust
repeating
carrier
Adjust
DVM
rated
a I: 1
connector
the
steps 4
squelch
display,
and
5 with
control.
read
the
TEST
FM.
Enter
the
theIKHz
select theRFIn/Out
AC
function.
audio
output,
isolation
and
receiver's
distortion
Level
in placeofthe
transformer
clip
the
volume
control
in excessofradio
the
receiver's
Increase
coded
squelch
RF
frequency
controlto60010ofthe
connector.
across
probe
across
for
squelch
theRFLEVEL
sensitivity in uV
and
speaker.
the
load
the
the highest voltage
specs.
PL
(If
resistor.)
load
control
from
code.
rated
the
re-
resistor
8.Ifthe
trace
receiver
through
does
the
not
audio
produce
stages
Power
rated
and
Out
audio
locate
(Watts)
power
the
problem.
=
output,
Load
4-7
use
the
(AC
Voltsp
Resistance
Analyzer's
(Ohms)
OSCILLOSCOPE
andascope
probe
to

AUDIO FREQUENCY RESPONSE
--------
(1'''-
LIMITS
LOUDSPEAKER
USAGE
FOR
300
I...........
HZ
"
.........
'--....
'-......
'-......
---........
~.,.
-I.,
..
(J
tlb
................
.............
.............
<
~
~
8,
til}
~
~
°Cl'
..
~IJ
1
,,~
~
KHZ
'--....
..........
.............
>-<
.............
.............
---------
>-<
.............
.............
..........
...........
3
I
KHZ
OdB
REFERENCE
FIGURE
LIMITS
HEADPHONE
LINE
4-4. AUDIO FREQUENCY RESPONSE; EIA STANDARD RS-204C
FOR
OR
USAGE
4-8

1.
Use the keypad to enter the frequency
AUDIO FREQUENCY RESPONSE
and
PL/DPL
code (if any)ofthe
receiver under test.
FUNCTIONtoGenerate
2. Set
3. Select tone memory display
to
Tone A,
Adjust
4.
5KHz system. Change
5. Connect the Analyzer's
In/Out
probe.
6.
Adjust the receiver's volume controltoobtain a reference level reading on theACvolts scale whichisfreeofclipping
at
any frequency within the 300 to 3,000
7.
Refertothe audio response curve in the receiver's Service Manual.
memory screen to the value for each point on the curve to be measured.
8. Maintain FM deviation
audio level
9.
EIA
RS-204C specifies the frequency response for NBFM receivers over the rangeof300 to 3000Hzas follows:
a.
Audio
per octave curve, with reference taken as 1000 Hz.
Audio
b.
from a
and
change
the Code Synth Level control for 20%ofrated deviationonthe DEV
connector. Connect the
If
the speakeris"floating", use an isolation transformer to avoid shorting the
at
this frequency. Note this audio level. Repeat this step for each frequency tested.
response for receivers using loud-speakers shall not vary more than +2 dBor-8
response for receivers using either headphonesortelephones lines shall
standard
6 dB per octave curve, with reference takenat1000 Hz.
FM,
attenuator
and
set
Tone
DISPLAYtoGen/Mon
DISPLAYtoDVM/Dist
RF
In/Out
at
20%ofthe rated deviation, as set in step 4.
out
Vert/Sinad/Dist
and
Variable level controls to 1000 uV (-47 dBm).
A to 1000 Hz. Set
Mtr.
and select DVM
to the receiver's
input connectortothe receiver's speaker
Hz
band. Note this reading in dBm as the reference value.
MODULATION
antenna
AC
port.
switchtoCont,
KHZ
scale, for example: 1 KHz in a
function.
Push
the Variable control in to select
Change
Change
the Tone A frequency on the
DISPLAY
not
vary
Code
output,
output
to DVM
dB from a
more
Synthesizer
stage.
AC
than
+1dB
using a scope
and
standard
or-3dB
Mode
the
RF
tone
read the
6 dB
10.
Addorsubtract the 1 KHz reference value from each reading taken in step 7. Plot the resulting values on a curve
compare them with the 6 dB per octave curve in your receiver's Service Manual or with the
tion RS-204C, as
shown
in figure 4-4.
standard
MODULATION ACCEPTANCE BANDWIDTH
1.
Perform
necessary to perform this test with the volume control setto10%ofrated audio
2. Increase theRFoutput
creased 6
3.
Turn
amountofdeviationonthe display as the modulation acceptance bandwidthofthe receiver.
4. A typical modulation acceptance value for a receiver
under test. Any loss
receiver's
the12dB
dB=0.7
the 1 KHz Level control clockwisetoincrease the deviation until the
IF
circuit.
SINAD
uV.
of
Sensitivity Test with the Analyzer in the same setup as shown in figure 4-1. Note:Itis
level 6 dB above the12dB
modulation acceptance bandwidth indicates improper alignmentora component failure in a
SINAD
level, to double the voltage.
is
7 KHz. Refertothe specification for the specific receiver
SINAD
output.
For
example, 0.35 uV in-
level returns to12dB. Read the
EIA
and
specifica-
4-9
RF PRESELECTOR SHAPE & BANDWIDTH
CO••UlllCAlI0IlS
@MOTOROLA
srSTUI AIl,\lYW!
[YJ[2J0GJ
@]GJ00
• B
0000
_lnlens,ly
o FocU$
Dlsptl$weep
@8
"'
"".,
RF
level
(QJ:~~~~:
DUPLEX GEN
e
~
Output
©
O'~.
00
0,"
CAUTION
DO
lOT
l.rUT
PIlWU
EIIW.flmtlt,
@)
;-
CAUTION
125
••
,.....
Min
@e
1.1
~
e
KHI'
E::@~
Vort
;::,~:
~,m'w"
Ell
~'
(@\
,~,u,.
ye.1
Pasillon
@
• Vert
OHOIr!
POWER
0"
ft.
Su,ndby
~OCOII
B
'"
'c
O~en
i
RF
Scan
a
mSrc
...,
~I'Set~
~:~(QP
N.,m"
HOIU
fllHOll1
©
DISPLAV FUNCTION
o
Orn
o
Modl.llal,(In
o
SpecIAn.l~lfl
8
Oup~IGen
R~UemO'r
oS'on,hngSeq
o FfeqCoo,,"ler
o DVM,OIST o CW
ReAdy
o
[Jr,W'III"ele
0"
o
ScopeA,C
o
StOptoe
~
0"0'0
011
/
1.....
/CC
g.Opla
I
Hl9h
ft
•
Lo_
W H
Demod
© 0
MonMtf
@]
MONITOR
Wlde~
•••o..
QUI
•
8W
'Y'
BFO
®,Gtnf,.tt
OFM
O'M
o
o
o SWP
g]@]
UU
Mon,lo,
SSB,OS8SC
SWP','OMI11
.0\-1
MHzoToneRt'mOle
COde
S~"lh
o 0
M,n
"0
011
Mod
Oul
© ©
rMODULATlON
@conl
0"
Sun.l
Code Sy,."h
Mode
o Pl.,OPL
o
PL'OPLJn
o
To"eA
o
ToneS
o TOl'lrSeq
~~
eillo'voel
LviSquelch Volume
011
(j
({j)
el'
Mod
'-----"
..
<
In
C
&0
r - - - - - - - - - ---- -
,
I
,
I
I
I
I
I
I
I
I
I
I
,
I
I
I
I
L _
l't.t(e;,...
~..
n.TOt
-------------
LOI
to
Lloe
JIOl
""'-C.
--t---
P
--------1
INJECTION FREQ SIGNAL :
CARR,,.,,
!'G"'A~5
HE
-EO
_/TN
"uEer/ON
'0
fItOO,.",-o
FffEOUlNCr
lelH
r"'''
SIGNA'
C14!
"
'"""
I
,
!I¢
o
"""
..
...J
t-
o:
w
CD
I-F
SIGNAL
o
~
0..
..
~
)
\
,/
FIGURE 4-5. PROBE SETUP
4-10
---------
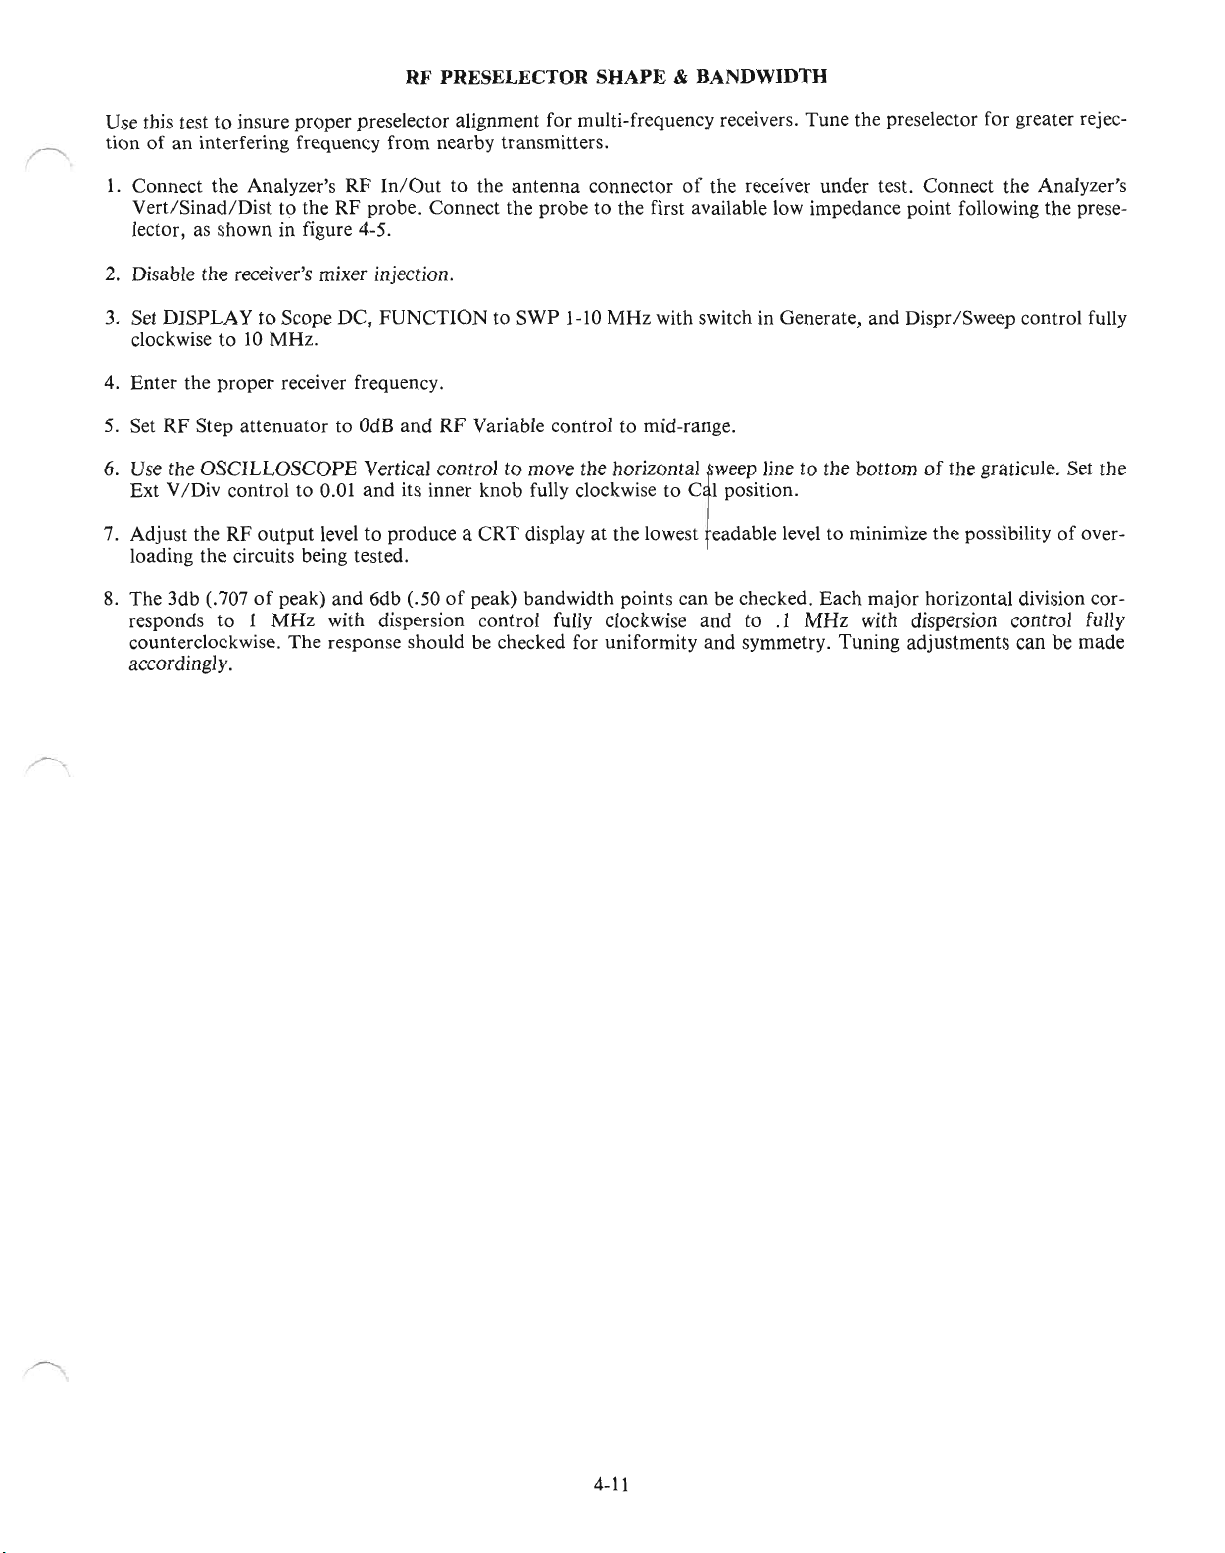
RF PRESELECTOR SHAPE & BANDWIDTH
Use this test to insure proper preselector alignment for multi-frequency receivers. Tune the preselector for greater rejection
of
an interfering frequency from nearby transmitters.
1.
Connect the Analyzer's
RF
In/Out
to the antenna connectorofthe receiver under test. Connect the Analyzer's
Vert/Sinad/Disttothe RF probe. Connect the probe to the first available low impedance point foHowing the preselector, as shown in figure 4-5.
2. Disable the receiver's mixer injection.
3.
Set DISPLAY to Scope DC,
10
clockwise to
MHz.
FUNCTIONtoSWP
1-10
MHz
with switch in Generate, and Dispr/Sweep control fully
4. Enter the proper receiver frequency.
5.
Set RF Step
attenuatortoOdB
and
RF Variable control to mid-range.
6. Use the
Ext V
OSCILLOSCOPE
/Div
control to 0.01 and its inner knob fully clockwise to C I position.
7. Adjust the RF
output
Vertical control to move the
level to produce a
CRT
horizontaljwee
displayatthe lowest eadable level to minimize the possibilityofover-
p
line to the bottom
of
the graticule. Set the
loading the circuits being tested.
8.
The 3db (.707ofpeak) and 6db (.50ofpeak) bandwidth points can be checked. Each
responds to 1
MHz
with dispersion control fully clockwise and to
.1
MHz
major
horizontal division cor-
with dispersion control fully
counterclockwise. The response should be checked for uniformity and symmetry. Tuning adjustments can be made
accordingly.
4-11

RECEIVER FREQUENCY
ADJUSTMENT
®
..
Anltnn,
>-
DUPLEX GEN
@o,
Oulpu'
©
o lICICT
• II'UT
MOTOROLA
CAUTION
00101
'I'UT
'OWfIl
orr
CAUTION
,owu
Sltp
0
E.l1
Wltl"'~lt'
®)
RF SECTION
RFL.Ye'
~
"'nltn~
Rl'ln,Oul
CAUTION
Il~W
In
e
CO••UI,UTlOlS
usn_
V.f.,bl,
Pull
Pu,h
Min
RFlnlOul
...
nTHl
@
POWER
0,
4:1>
Standby
DtOfI
i8
...
AC
O.enAf!~dy
"'
...Sc....
0
mStcl'1
['-...ItSec
~~~
Harl,
E.ltHoIII
@
AML,m,1
@]
@]
G
KH,
.Inltn"ly
O~oc
@
It""
0
0
0
..
,
£II
0G
00
00
0"1>"$*"1>
OSCILLOSCOPE
v,
Q
,
MH,
"
E:~.,C@~
8
Von
Vert/SIn.dIO,,1
DVMlCOUrllef
©
@
In
•
Ver1
o
Ho,u
M"
DISPLAY FUNCTION
o Gen.MonMtr
o Modulation
o Spec,
...
8
Oup~.Gr~
AFMttnOf,
o S'9nallng
o
Fr.-qCounl
o
DVM'DISf
o
El1W,llmel,r
0"
o
ScopeAC
o
Sco~DC
~@]
MONITOR
Squtkh
",1y,r,
Seq
...
@Gene,ate
MoNlOf
OfM
o
cw
o AM o
o
SS-lllO$BSe
o
SWP
o
SWP.Ol·IMHl
g]@J
Volum,
OS'O'O
orr
Im.otiOpl.
H19h@
Low
DemodOut
®
8'0'1'
W1dt@
"1'''0''
.'0
0
IMu
1-10 MHl
COClt
0
Min
JIIl"',Lt...
0
orr
ModOUI
®
Synlhl,,'
MODULATION
@Conl
Ofl
Bur,t
Coda Sri'll"
o
PllOPL
o
PlfOPLI""
Ton.A
o
Ton
••
o
Ton,Stq
o
Ton,R'tnOl'
~@J
EIIL
0
orr
el
(Q)'
E.lModln
@
Moele
.....
l
COAX
CABLE
I'
"
FIGURE
iQ'
PICK
UP
UNIT UNDER
4-6. FREQUENCY
ADJUSTMENT
LOOP
TEST
SETUP
4-12

RECEIVER FREQUENCY ADJUSTMENT
Connect the Analyzer to the receiver under test, as shown in figure 4-6.
1.
~
Set DISPLAY to Spectrum Analyzer (1.5 uV sensitivity).
2.
receiver's local oscillator for approximiate frequency
Enter
and
spectral purity.
the proper local oscillator frequency. Check the
3.
Change DISPLAY to
receiver so that the local oscillator signal
Change
4.
FUNCTION
Gen/Mon
to Generate
Mtr
and
FUNCTION
is
coupled to the Monitor input.
and
enter the proper carrier frequency. Introduce sufficient signal level into the
to Monitor. Place pick up loop in close proximity to the
RF
input to fully quiet the receiver and adjust discriminator to zero volts DC for receivers requiring such an adjustment.
For
receivers with
quency for minimum distortion
quadratureormore critical detectors, adjust detector tuning control or local oscillator injection fre-
or
best SINAD performance.
5. For pagers with the battery saver feature, check the local oscillator for pulse operation without removing the unit
from its housing.
4-13

TEKA24A
I
®
'""'PO
MOTOROLA
."
POWER, FREQUENCY, AND DEVIATION
~
~
..
~_
OW".
~
BASIC FM TRANSMITTER TESTS
co
••
u.,c~nD.S
nSUIlllAlun
[y]00G
@]~~0
0000
'HI
~
InienSlty
----
",'
e
,--@"Q"O''''''
11,10(11
o".'@"§~7:
'0
00',!.I@;\t:.o@ol
15 I • 0 1..1
~
E
~
~
.
10//
V,"
~;"S1"'IO'"
~-_..
t?:\I
~
MH,
OSCILLO
/T';'l.~~OPE
AulO
""/
e.,
po",,,"
mS"'-'
._
Nalmal
@
•v,n ,
OH,,;,
,,,
POWER
ft
'&J
i
"".
..
©
0,
o
8'6n(ll)y
o
(kOIl
§
"U
.c
O
o
o
o OVM/DIST
...
en~e.C1¥
o
0"
o
o
"'.
y--
100,..
~~~'I
~
H',h@Wid.
."
H""
'.
DISPLAY FUNCTION
Gen:MonMlr
Modulation
S.«""~,,,
DuplexGltt
RFMernOl'Y
$lgnaling5tq
FreqCounlet
E.IWaltmfl.t
$<;0pIAC
!kopeOc
@]
MONITOR
.,,,,,h
0"0'0
011
Im.gefC)pl.
°i"'
@]
-V
®Ge-ntr.lf
o
o
O'M
o
o
o
Volume
BW
"'"
0
Monolor
FM
CW
SSB,OS8SC
SWP
1'10
SWP.Ol·'
g]@]
Code
Min
Mu
"0
011
Mod
rMOCULA
~
ConI
OU
Bursl
COde
S,olh
o PLIDPl
o
PlfOPllnv
o
TonIA
o
Tone8
MH,
o Tone Seq
MHz
o
Ton.RemOle
~@]
Sy"lhL.vr
Ell
level
o 0
all
fj'
~
QIII
£'1
Mod
~
'---.-/
nON
Mod.
In
I
RF
LOAD
I
OR
"oRO,
"\1
BNC
RF
OUTPUT
TRANSMITTER
T
MIC
AUDIO
IN
FIGURE 4-7. TRANSMITTER TESTS SETUP
4-14
'-----

BASIC FM TRANSMITTER TESTS
POWER, FREQUENCY,
AND
DEVIATION
A. Basic Terminated Measurements
1.
Connect the Analyzer's RF
In/Out
to the RF
outputofthe unit under test and make the other connections as
shown in figure 4-7.
CAUTION
For
power
output
measurements, connect a transmitter only to the Analyzer'sRFIn/Out.
Do
not connect it to the
Analyzer's antenna port.
The
built-in RF load dissipatesupto 50 W for three minutes and up to
125
W for one minute.Ifa technician keys
a high-power transmitter into the Analyzer for a time long enough to threaten overheating the power-measuring
RF
circuitry, the system's audible alarm sounds and the display changes to read the
LOAD OVER-TEMP warning
to un-key.
2.
Set DISPLAY to
old. Enter the correct transmitter carrier frequency via the keypad
Gen/Mon
Mtr,
FUNCTION
switch to Monitor FM, and
or
RF Memory table.
MONITOR
Squelch control to thresh-
3. Set the
unsquelch the monitor.
attenuator
to
-30
dB.
For
low-power transmitters, it may be necessary to reduce the attenuator setting to
Too
highanattenuator
settingortoo
tight a squelch setting inhibits the frequency error
display. Accurate measurements require sufficient signal level from the radio to fully quiet the Analyzer's Monitor
receiver.
4. Use good quality cables
ment, especially at
5.
Read any transmitter frequency error indicatedonthe display.
6. Refer to the radio's service manual to determine
if
termine
any adjustments are required.
7. Proceed to check
Turn
off
a.
all modulation sourcesatthe Mod
of
minimum length because cable-loss can be a significant factor in RF power measure-
UHF
and above. Key the transmitter
MODULATION
as follows:
and
read the power indicatedonthe display.
if
POWER
and FREQUENCY are within spec limits and de-
Outofthe Analyzer in order to check the levelofPLorDPL
deviation from the transmitter.
b. Key up transmitter with appropriate
PLorDPL
enabled and read
DEVIATION
from the
GEN/MON
DISPLAY. Refer to radio service manual to determineifadjustmentisnecessary.
c.
With
PLorDPL
modulation properly set, introduce 1 KHz modulation to transmitter audio input by ad-
justing the 1 KHz LEVEL control. Check service manual to determine the minimum level required for proper
MOD
MIC sensitivity as well as the maximum level required to insure proper IDC function. Read
on the DVM by temporarily switching the DISPLAY to
d. At the maximum audio input level, read DEVIA
DVM/DIST,
nON
on the display and verify
ACVM.
that
it falls within the maxi-
OUT
mum rated system deviation specified in the radio's service manual. Make adjustments as required.
MTR
levels
e. Verify proper MIC sensitivity by setting Mod
and reading corresponding DEVIATION
B. Off-The-Air Measurements.
1.
Connect the TEKA-24A pick up antenna to the Analyzer's antenna connector. Pull the Variable control
Out
on
the display.
Level to the minimum threshold level per the service manual
able the antenna port.
2. Operate the transmitter under test either into its own antenna
3. Set DISPLAY to
Gen/Mon
Mtr,
FUNCTION
SWITCH
or
into a dummyRFload, as shown in figure 4-7.
to Monitor FM,
MONITOR
Squelch control to thresh-
old, and enter the correct carrier frequency.
4-15
out
to en-

BASIC
POWER, FREQUENCY,
4. Adjust the attenuator as in step A-3 above, to produce an adequate signal level to the Analyzer's Monitor receiver.
FM
TRANSMITTER
AND
TESTS
DEVIA
nON
5. Adjust the transmitter and follow the same procedure outlined
quency and deviation.
6.
This same method may be used to verify frequency and deviationofa remotely located transmitter by reducing the
attenuator setting to fully realize the 1.5uV for lOdb SINAD sensitivityofthe Analyzer's "of-the-air" monitor
function.Toinsure sufficient measurement accuracy however, make sure the Monitor receiver is fully quieted as
in step A-3 above.
C. "In-Line" Power Measurements
1.
Referringtofigure
ment in the50ohm antenna line with the arrow pointing towards the antenna. Plug the adapter's cable into the
Analyzer's Ext Wattmeter jack. Refer to table 3-12 in this Manual for further descriptionofelements.
2.
Set DISPLAY to Ext Wattmeter, FUNCTION switch to Monitor FM,
FUNCTION switch and attenuator do not function but should be set in case RF powerisinadvertently applied to
the RF
3.
Use the keypad to select the scale that corresponds to the ST-1200 element
4.
Key
In/Out
the transmitter. Read forward and reflected poweronthe display.
4-8,
connect
connector.
the
RTL·4055B
in·line
wattmeter
in
steps A-5 through A-7 above, to measure fre-
adapter
with
the
and
the attenuator to
in
use.
appropriate
~T-l200
-30
dB. In this step,
series
'-----....-
ele-
'-../
4-16
"--'"

BASIC FM TRANSMITTER TESTS
POWER, FREQUENCY, AND DEVIATION
dB
Ouipul
®
CAUTION
MOTOROl..A
UUT
l.rUT
'own
EllWanmeler
~~
CAUTION
125.'UX
e
CO••UIlICATIOlS
SYSlUIAll.l.lUU
~00~
@]GJ[f]~
G800
_lnlens,ly
@
"g'
@
•
v""
OHo'ir
POWER
0"
@Sl~ndb"
Dc
011
B
'"
AC
OveonRe4ldy
i
DISPLAY FUNCTION MODULATION
o
Ge..MonMI,
o
Modlll.bon
o
SpeclAn,lyle,
ouP
8
,..Ctn
RFMrmory
o
S'g"./,ngSrq
o FrtqCO\,ln'e,
o DVM/DIST o Cw
o
EJ.IW.tlmete.
0"
o S<:op"AC
o
SeOPtOe
~
Horir
Eat
Hon,
©
@]
MONITOR
®Grnellll'
MOOlIOr
O'M
o
AM
o
SS81DSBSC
o
S'NP
"10MH.
o
SWP.O'·'
~@)
loll'll
@conl
em
8u••l
Code
S,nlh
Mod.
o PLrOPL
o PLIOPl...lnv
o
ToniA
o
Tonl8
o Tone Seq
o Tone Remotl
@]
~
AN
1
RTL
40568
W/ST1200
SERIES
IN-LINE
ELEMENT
rl
ANT
CONN
TRANSMITTER
FIGURE 4-8. TRANSMITTER TEST SETUP;
4-17
POWER
MEASUREMENTS

AUDIO DISTORTION
@MOTORO&.A
dO
I,
A,,,,",
@
>--
DUPLEX GEN 0
~""
~
Output
@
v
~
CA~;'~j
0
'OWEll
011
00101
'l'Ilf
'OW(l
E.IW.llme-le,
<@
..
CAUTIO.
CO••UIIOIIOIS
snU.'.llun
@]I2J0G
@]~00
0000
';'
©
AFA~~~:':ON
'''p
(
--
V."
....
I"::;'"
Anlenn.
Puah
RF
1"'Oul
Mo,·
RF
In/Ovl
CAUIIO.
~
m.ln
® e
{AH"
AML,mO,
E:0j2C~~
Mu
..
.
V.rt/Sin.dIDlll
DVM/Counl" III
,,,"
~'l
@J
llion
Seq
cDC
@]
MONITOR
Nanowy
FUNCTION
®c"'
MonitOt
o
FM
Ocw
o
AM
o
SS81CS8SC
o SWP
'-10
Osw
...o•.•
gJ@]
Voh
....eIC041t
Qui
fro
OFO
o
POWER
""
~Slfn<lD'
D<O"
B
'"
AC
O~tn
i
"Q'
,
OSCIL:~'SCOPE
oRFS'"
,.
---'---
~:W1
Poslt.On /
©
If
v.rt
o
Hori.
Hg,oz
btHori'
©
DISPLAY
o
Oel'l"MonM\.
o
MoO
o
SPfoCIA,"I,le,
8OUplelGlfn
RfMIIl'lOI,
o SIgnaling
o
F'toQCo..nle,
o O.....
R",)d,
o
ElIWllum.,,,
0"
o
ScopeAC
o
Sc
@]
Squelc.h
0,,0"0'
Im.~/Opl.
/c
..
H,.'
A7\ w.o.
Low
~
De",odOul
@)
.....
'DIST
....
rMODULATION
@co"
....
MHI
_~
$,,'0111
~,O
"oQ'
01'
Mod
(@
0"
Bu.sl
Code Synlh
o
PlJDPl
o PLIOPlln'l
o
To"."
OTOM8
o
Ton,Seq
o
._A._o,.
~@]
I
l,,1
E.ll."cl
0,,0
~
Oul e Itl Mod
©
Modt
In
RF
OUTPUT
nMIC
n
TRANSMITTER
FIGURE 4-9. AUDIO DISTORTION SETUP
4-18
AUDIO
INPUT
',-

AUDIO DISTORTION
1.
Before starting this test, adjust the transmitter's
2. Connect the Analyzer to the transmitter, as shown in figure 4-9.
Turn
off
the
3.
4.
Key
the transmitter and adjust the 1 KHz MOD Level control for
Gen/Mon
5.
Select
Unkey the transmitter.
MODULATION
Mtr DISPLAY.
DVM/Dist
DISPLAY and mode 3, DIST
switch. DisablePLor
IDe
to specification.
DPL.
/SINAD.
Read transmitter % DISTORTION from the display.
60070offull-rated transmitter deviation on the
4-19
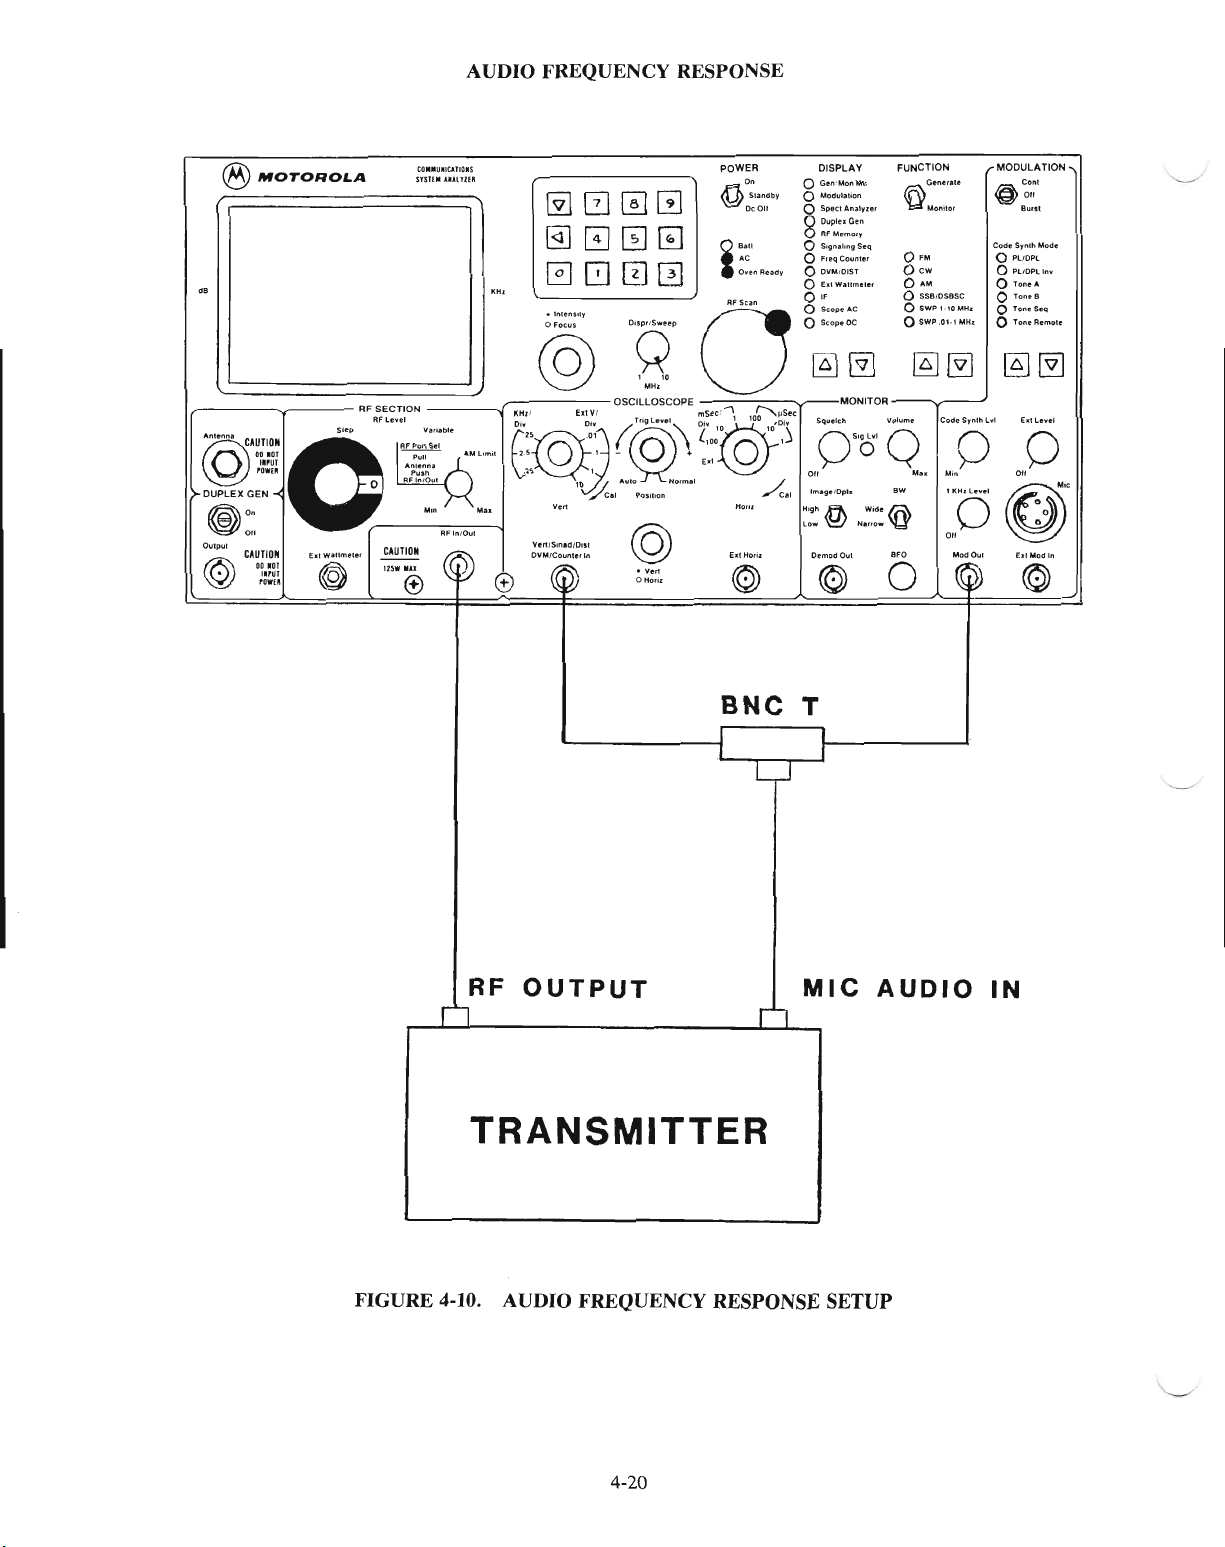
AUDIO FREQUENCY RESPONSE
®
MOTOROI.A
CO••UIIClllGIS
SlSHM
UAlYHR
@]12J0G
@]GJG~
0800
•
lnl~n$IlY
o
Focu$
DlSPrlSWIlP
POWER
o.
ft
StanObv
~DCOII
e",
AC
Ow!",Fl~ady
i
RFSC/ln
@8
r-----~----
(Q)~'::
DUPLEX
G~:~:
011
CIUTION
Do_or
"OW[II
0
~
~O.
Oulput
• l.rl,/1
O
©
fIt
Wllllmel.,
©
".
""
••",-
RFL.h,1
(
I
CAUTION
"'W®
KHll
...-
E~@i
':
M..
RFlnlOul
@ I Ver1/51naOIOltt
f G
OV.'~'"
V,"
."'~".,,.
EIIVI
(,'o'~
,§
..
~.:.
/,c
..
PO',I,O'
@
•
o
0
.
mSeC!-"\
~IJSeC~
Z~@::i
,.
11011'
Ven
Hori,
EIIHD/"
©
BNC
I
I
DISPLAY FUNCTION
o
Gen:MonMh
o
Modulalion
o
SpeC1Anal,zer
8
DupluGen
f'lF
o Sig"1!IlmgStCl
o FIl!'qCounlel
o OVMIDIST o
o
E>tIWlumeler
0"
o
scop.lle
o Scopt>OC
@]@]
Squeltll
O"OS'o'
,
Im39fl'IOp'.
/c"
Hlghfl
low
~
D~mDdOul
©
T
I
f
Me",o,~
MONITOR
Narrow 'I:f'
Volume
Q
WiOe~
.FO
o
®Genelllte
Moo,tor
OFM
CW
o
AM
o
SSBIDS6SC
o
s;wp
1-10
oSWP ,01.'
~@]
ICodeSrnlhlYI
..
I
MH~
MH~
I
...
O
'"0
0"
Mod
Oul
(@
rMODULATION
COli'
@Oll
BUll'
Code
S,nthMode
o
PlfOPl
o
PL/OPlln"
A
OTone
o
TOM'6
o
To"eSeq
o
ToneRemote
@]@]
E.tle"el
~IO
oo
(;)
g
e.,Mod
In
©
II
'-..-/.
w
RF
OUTPUT
n
MIC
r'l
TRANSMITTER
FIGURE 4-10. AUDIO FREQUENCY RESPONSE SETUP
4-20
AUDIO
IN
"-../
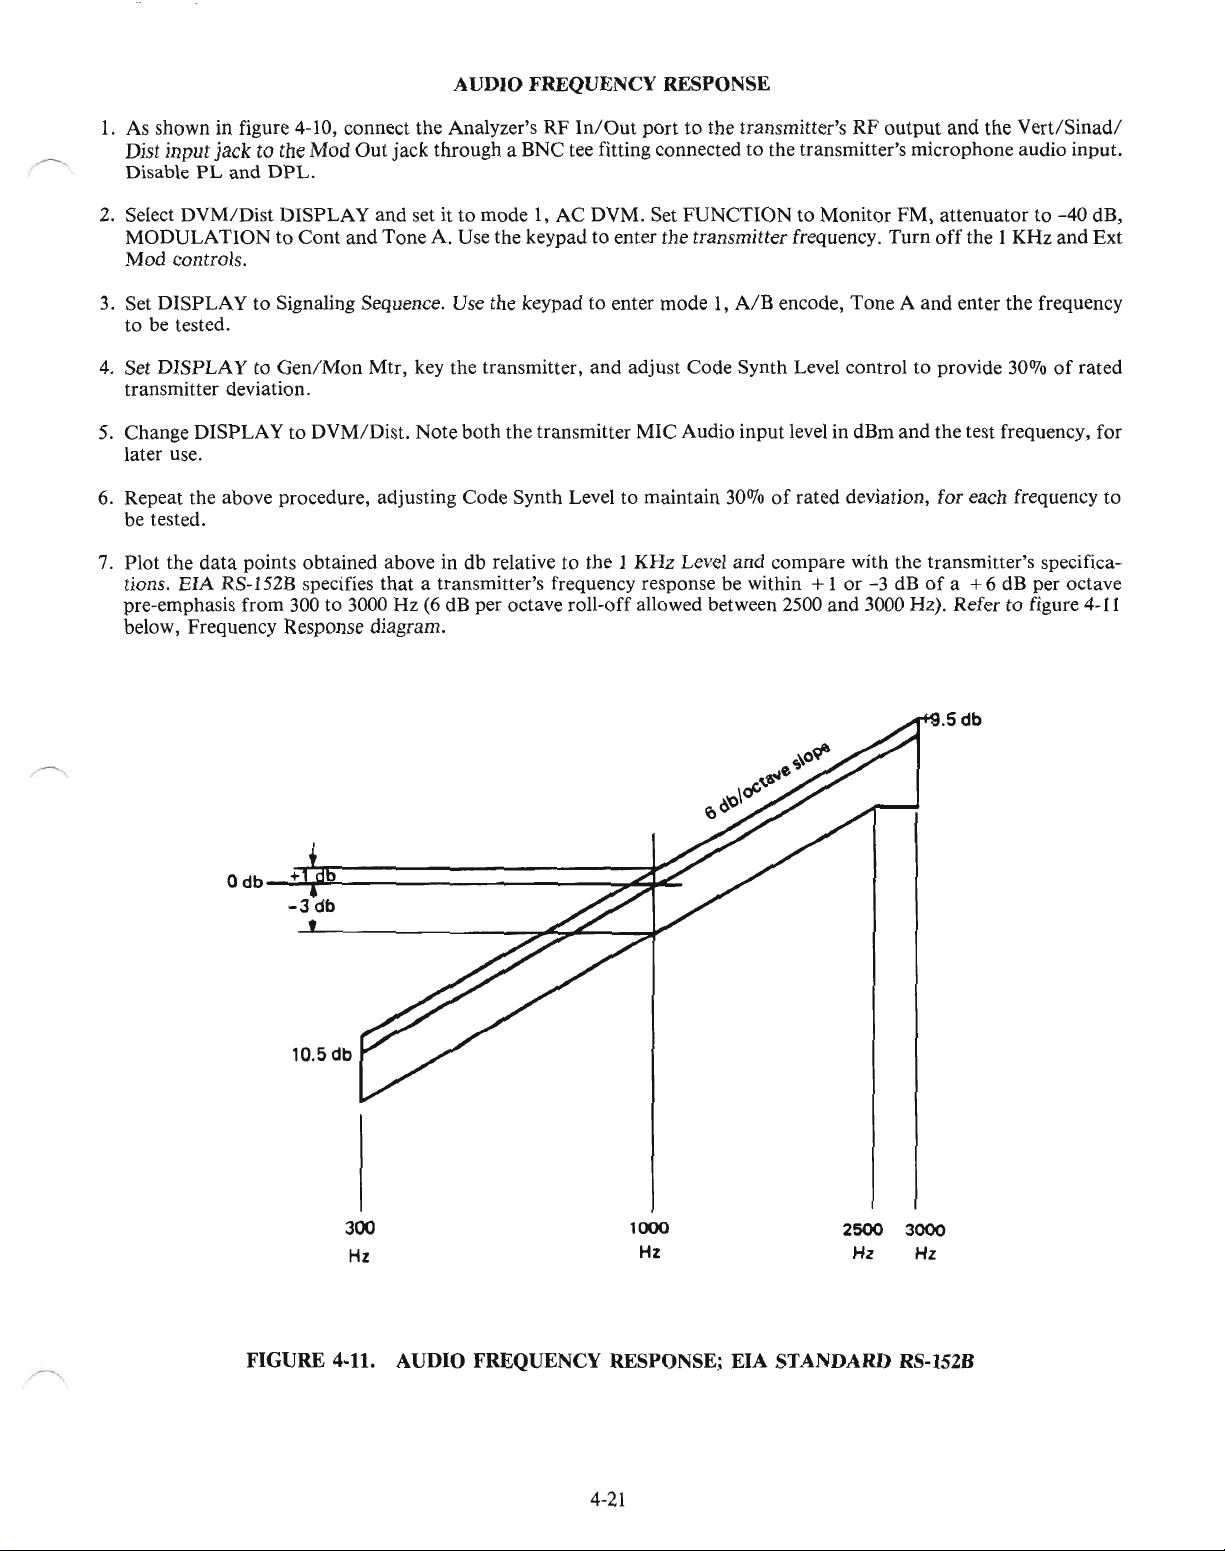
AUDIO FREQUENCY RESPONSE
1.
As shown in figure 4-10, connect the Analyzer's RF
In/Out
porttothe transmitter's RF output and the
VertiSinad/
Dist input jacktothe Mod Out jack through a BNC tee fitting connected to the transmitter's microphone audio input.
Disable
2.
Select DVM/Dist DISPLAY and set it to mode1,AC DVM. Set FUNCTION to Monitor FM, attenuator to -40 dB,
MODULATION to Cont and Tone A. Use the keypad to enter the transmitter frequency. Turn
PL
and
DPL.
off
the 1 KHz and Ext
Mod controls.
3.
Set DISPLAY to Signaling Sequence. Use the keypad to enter mode
1,
AlB
encode, Tone A and enter the frequency
to be tested.
4. Set DISPLAY to
Gen/Mon
Mtr, key the transmitter, and adjust Code Synth Level control to provide
300/0ofrated
transmitter deviation.
5. Change DISPLAY
to
DVM/Dist. Note both the transmitter MIC Audio input level in dBm and the test frequency, for
later use.
6. Repeat the above procedure, adjusting Code Synth Level to maintain 30%
of
rated deviation, for each frequency to
be tested.
7.
Plot the
tions. EIA RS-152B specifies that a transmitter's frequency response be within
data
points obtained above in db relative to the 1 KHz Level and compare with the transmitter's specifica-
+1 or -3 dB
of
a +6 dB per octave
pre-emphasis from 300 to 3000 Hz (6 dB per octave roll-off allowed between 2500 and 3000 Hz). Refer to figure
below, Frequency Response diagram.
.5db
o
db-';"+¥~-----------.,..r;;.'-
-3
db
4-11
10.5 db
300
Hz
1000
Hz
FIGURE 4-11. AUDIO FREQUENCY RESPONSE;
4-21
2500
Hz
EIA
STANDARD RS-152B
3000
Hz

AM MODULATION TEST
®
MOTOROLA
dB
I
r-----v----
(Q)"'"
U~~i
0-
>-
DUPLEX ':lEN 0
(J';f5&
0"
~
011 ( AF
Oulpul
CAUTION
00101
••
rUT
'0*(11
©
~
CO••UIlCAllOIS
SfSTE
....
HlEII
RF SECTION
---
-_.
.....
-
UUTION
115
tn/Oul
....
®
@][2]00
@]~~~
0000
';'"Q'O
@
(~-----
E~@!4
.0
~
e
I
V,"
VeftlSlnldlDISl
DVM/Counle,
~
I
I
l'
M..
LEVEL
SETUP
•
MH.
OSCILLOSCOPE
(@\
."x,~"
;.rc.,
.""""
@
In
•
Vert
o
Horir
...
I
I
l'
POWER
0"
ft
Sh'l'ldby
"&J
DeDf!
B
'"
.c
O..
~nRC'lIlfy
i
AF$clIr>
I.
---'----
DISPLAY FUNCTION
o
Gl!'nMonMlr
o
Modul.lion
o
SpectAn"yrCOf
8
DuplnG,n
RFMe-mOlv
o $,gn.IIIIlISeq
o
Ftf'qCounle.
o DVM/DIST
o
E.ltW.tlm,ltl
0"
o
~oo.
AC
o
ScoprDC
@]
@1
MONITOR
Squelch
Volum~
~:@?;'
HOII!
Ell
HOrIJ:
©
DISTORTION
0,,0"0'
Im·g
/c
H,."..f'f\
~~
lO_~N."OW'{J'
DlmodOul
~
Q
e · D
pl.
W,,,
IN.
OFO
o
~Genet'le
Monllor
o FM
OCW
o
'M
o SSOlOSBSC
o
sWP'·\OaAH.
oSWP .01·1 MHz
~~
'COO~Sl'nIIlL
..
I
M"'O
"0
010
Mod Oul
(@
rMODULATION
@c""
010
BU'"I
Code
S,nlh
Mode
o
PL,DPL
o
Pl.,OPlinv
o Tone A
o
ToneS
o
fo".SC'q
o
Tone
Remote
~@]
Ellll!
...
e-1
...
1
0,,0
<
~
CfJ
hi
Mod
In
©
II
.,----"
~
I I
BNCT
ANT
n
AM
TRANSMITTER
FIGURE 4-12. AM MODULATION TEST SETUP
~IC
'-.-/
4-22
"'---'

AM
MODULA
1.
Connect the Analyzer'sRFIn/Out
FUNCTION
2.
Connect the Analyzer's Mod
phone input using a BNC tee connector.
3.
Set DISPLAY to
4. Adjust the I KHz Level control to provide the proper input signal level to the transmitter. Refer to the transmitter's
service manual to obtain the value for this level.
5.
Key
the transmitter. Read
6.
To
check the transmitter's distortion, connect the Analyzer's Demod
jack. Set DISPLAY to
to Monitor AM.
DYM/Dist
0J0
DYM/Dist
to the
output
Out
connector to its
and the
AM
AC
on the display. Change to IF DISPLAY to observe the RF envelope's distortion.
and Distortion. Read
connectorofthe transmitter under test, as shown in figure 4-12. Set
voltmeter function.
nON
Vert/Sinad/Dist
070
TEST
distortiononthe display.
input connector and to the transmitter's micro-
Out
connector to the
Yert/Sinad/Dist
input
4-23

AM MODULATION LINEARITY TEST
1.
Connect the Analyzer's RF
In/Out
to the
outputofthe Transmitter under test, as shown in figure 4-13.
2. Connect the OSCILLOSCOPE Ext Horiz input connector to the scope probe. Set Horiz control to Ext, DISPLAY to
Gen/Mon
Mtr, and set to correct transmitter frequency.
3. Change
DlSPLAYto
IF and set FUNCTION switch to Monitor. Connect the Analyzer's Mod
Out
jack to the trans-
mitter's microphone audio input.
4.
Connect the scope probe to the secondaryofthe transmitter modulator stage
CAUTION
Do
not
exceed 300 volts maximum to the Analyzer's DVM input.
5.
Key the transmitter. Adjust the I KHz Level control to cause the displayed trapezoid figure to come tO'a point at one
end. This corresponds to
display
6.
Observe the resulting trapezoid figure. The top and bottom sidesofthe trapezoid should be straight. Any curvature
just
fill the screen,
100070
AM modulation.Ifnecessary, adjust the horizontal vernier control to make the
output
transformer.
indicates non-linearity in the transmitter final amplifier stages.
®MOTORO&;A
•
I AF
--ClUTlO.·
o
'EI
@
DUPLEX GEN
@Oo
~
...'00
@
CA~1
..• ,..:".:::-
Q
..
~,
..
CO_UllI""01S
Inn.'lLllun
_ @
II~ECT:ON
~~.
o
CAUTIDI
-","®
~"l_1
",
In
0\11
-
...
,,~....
~
@][2]0w
@]000
0800
.l"~n~b
11"'
h....
OSCillOSCOPE
["@~~
(:,
""
$
".©''"
(,@'o"~
§.
- +
10 "',,10 H
-j'..,
""
_~"
,ft""
~
s,.",,".,
Dc
011 0
e.u
AC 0 F
O.onlluCl,
i
A'k_"
'g'
Oo~~
",S.u
..,
~~s.~
l:':~o"O
,<')
fo!~
.......
l
...
',-
~"
_..
"6'
~
© °i' 6
"
..
""""
"',,.,,
...
,
"'.,
•.
MONITOR
~O'
'0·"-
0".
FUNCTIONDISPLAYPOWER
1m
Y'"'....
0 ••
Oew
°
OSSIIOSllSC
OSWP
OSWP'Ol.IMHI
@~
--V---
......."
ow
..
o e
.......
0 "0<1
S"~,
8
~;:..:.~~
OS,,""hn,S.q
...qC....
OOVIIIlOtST
Of.,won_,
g~~~
"0"'"
OIl
,~
...
."'@ ._@ 0
,..
.."..
........
I "
n.'
•. 10MHl
J
en"
Y
"".
,....
""
~
MODULATION
..
@
011
......
C.d.S'..I1
....
o
Pl
OP~
o
PlO~I".
Olo
...
",
10
0
..
'1
Olo
s...q
OlO"....
~~
"0"''''
all
©5~'
~
0
'©'
_
ol.
'--
PROBE
MODULATION
ANT
TRANSFORMER
n
AM
TRANSMITTER
FIGURE 4-13. AM MODULATION LINEARITY TEST SETUP
TO
MIC
n
4-24
'-----"'

ANALYZERIFDISPLAY
INCIDENTAL
UNMODULATED
AM
MODULATION
AM
FM
CARRIER
MODULATED
WITH
x =
INCIDENTAL
PE
A K
FM
CARRIER
AMPLITUDE
AM
Figure 4-14 shows a typical
AM. Use the IF mode
modes),
and
to check
IF
DISPLAY, its modulated FM carrier with incidental AM, and a formula for calculating %
to
view the modulation envelopeoftheRFsignal, to detect
AM
depthofmodulation. Because theIFDISPLAY provides only a qualitative indication, use the
Monitor DISPLAY with AM Monitor
Y =
VALLEY
AMPLITUDE
X-V
%
AM
=-
FIGURE 4·14. ANALYZERIFDISPLAY
FUNCTIONtodetermine precise AM measurements.
X+Y
X100
and
examine incidental
AM
(in
FM
4-25

COMMUNITY REPEATER MODULATION
1.
Connect the Analyzertothe repeater under test as shown in figure 4-15.
nity Repeater. Disable the receiverPLand
2.
Set
DISPLAY
MONITOR
to DVM,
FUNCTION
BW switchtonarrow, Squelch control to threshold,
set the squelch to threshold.
switch to
Monitor
FM,
The
diagram illustrates a
and
MODULATION
and
Duplex Gen switch to off.
switch in
MICOR
off
position. Set
Commu-
~
3. Set the
attenuatorto-30
squelch the monitor.
Too
dB.
For
high an
low-power transmitters, it may be necessarytoreduce the
attenuator
display.
4. Enter the
proper
5. Move the display cursor down
dicated
6. Set
on
DISPLAYtoOen/Mon
transmitter frequency.
the display, to
to
DVM
put
1 voltof1 KHz test tone into the transmitter modulation limiter.
Mtr.
Key the transmitter.
on the display. Un-key the transmitter.
7. Disconnect the cable from the Duplex Gen
on repeat.
Mod
8. Disconnect the cable from the
DISPLAYtoDuplex Gen,
9. Set
TOR
Image/Duplex switchtoHighorLow as required.
10. Move the display cursor down
Turn
off
the 1
KHz
11.
Level control. Set
control for 0.75 KHz DEV indicated
12. Set
nector.
FUNCTION
The
switchtoMonitor. Reconnect the cable from the Duplex Gen
transmitter should now key-up.
Out
FUNCTION
toPLor
on
settingortoo
and
enter 1 for
AC
Adjust
output
to the receiver
connector, leaving
switch to Generate FM,
DPL
and
enter a
MODULATION
the display.
attenuator
setting to un-
tight a squelch setting inhibits the modulation deviation
mode.
Adjust
the transmitter
the 1
KHz
Level control for 1 VAC, in-
IDC
control for 4 KHz DEV indicated
antennatoprevent the transmitter from keying up
SINAD
Enter
PL/DPL
switch in
IN connectedtotest
and
Duplex Gen switch to On. Set the MONI-
the
proper
offset frequency.
code used in the repeater.
the
Cont
position
Outputtothe receiver
pointatthe repeater level.
and
adjust
Code
Synth Level
antenna
con-
'----'
13.
Adjust
the
PL
deviation control in the repeater controller for 0.75 KHz repeated
display.
14. Set
15. Set
FUNCTION
(0.75
KHz
DISPLAY
repeat level control until the
16. Change
DISPLAYtoGen/Mon
17. Disconnect the cable from the Duplex Gen
18.
Radiate a weak signal from the Duplex Gen
switch to Generate
PLlDPL
+ 4 KHz test tone = 4.75 KHz).
to DVM,
FUNCTION
proper
Mtr.
and
adjust the 1 KHz Level control for 4.75 KHz DEV indicatedonthe display
switchtomonitor,
voltageisindicatedonthe display.
Confirm
Outputtothe receiver
squelch key controlonthe squelch gate moduletothe
and
turn
the repeat leveltominimum. Slowly increase the
that
the repeated modulationis4.75 KHz.
antenna.
The
repeater should un-key.
Outputtosimulate the weakest signal
point
that
the transmitter
just
PL/DPL
that
will be repeated.
keys-up.
code indicatedonthe
Adjust
"-----',
4-26
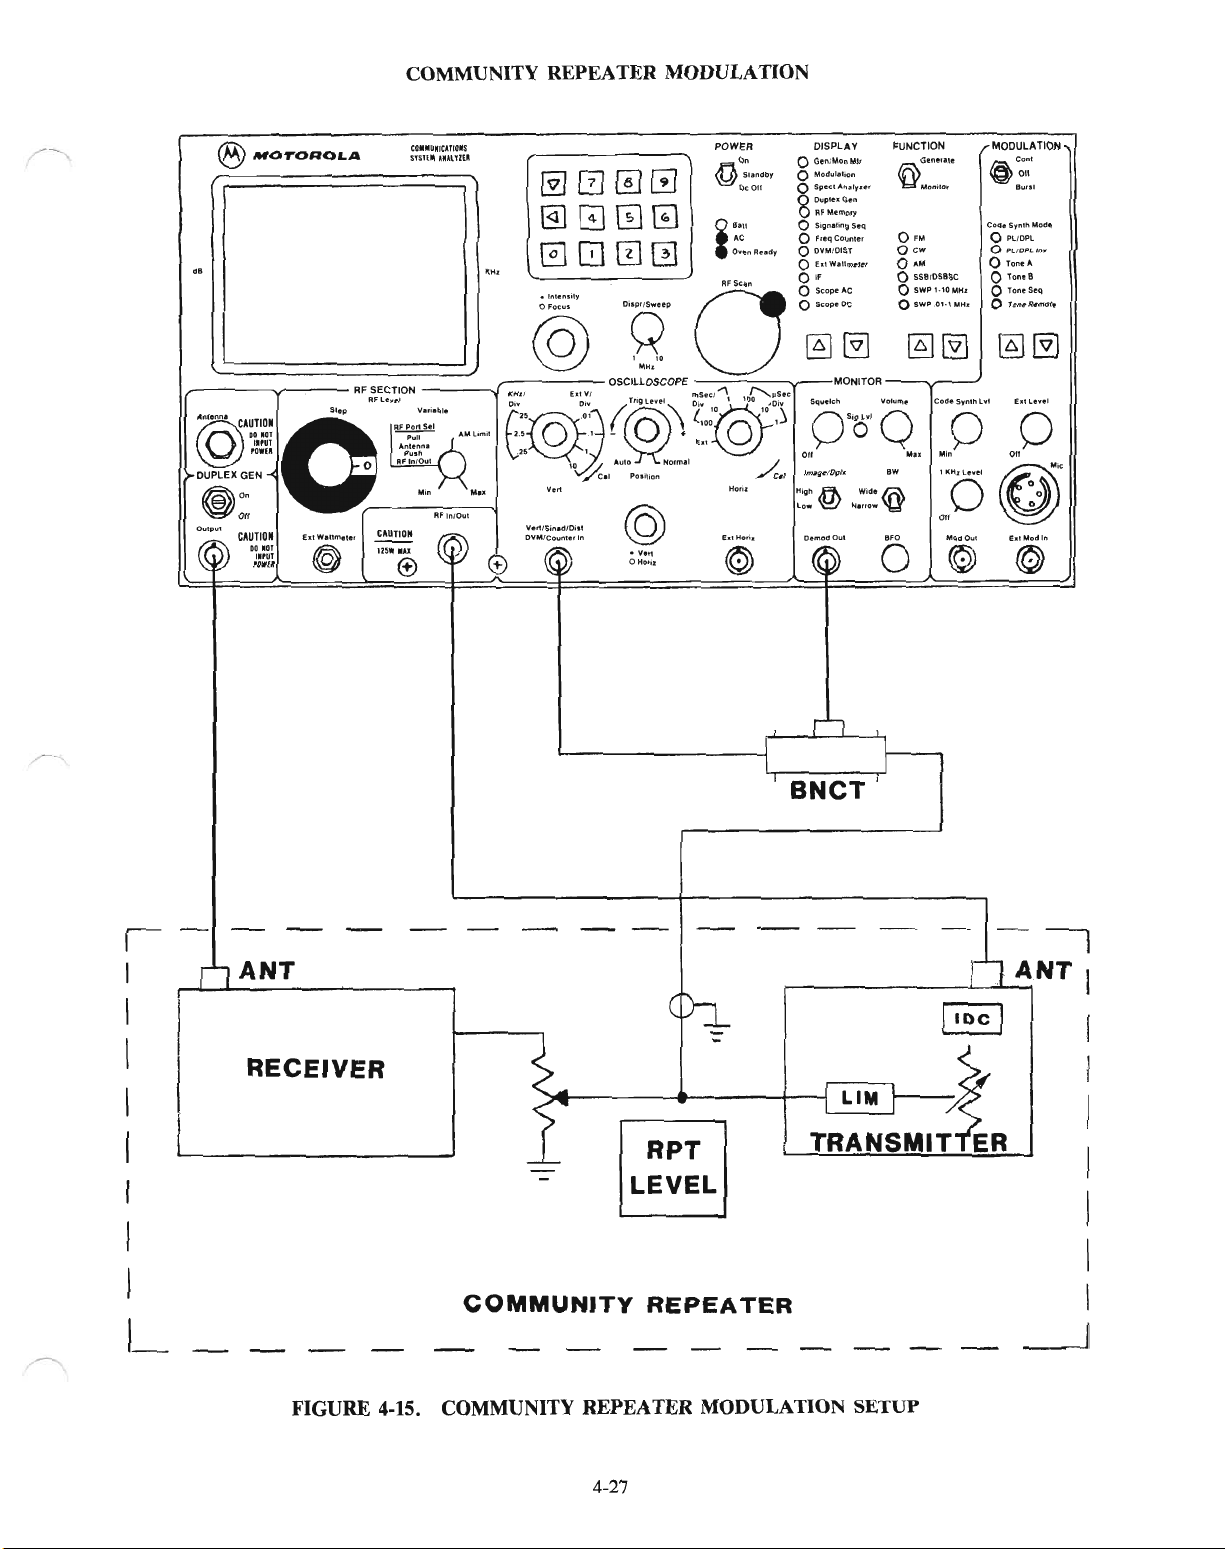
COMMUNITY REPEATER MODULATION
®
MOTOROLA
CO..UIlCAIfCf$
snTt
•••
.I.lUU
POWER
[Y][2]0[!]
@]G00
.s
"H,
0000
.'tI'."I'()I
o
foe""
O;lptISw.ep
MODULATION
aC~'
~OI\
8l.11t'
Code
SJ'nlh
MOeM
o PUDPL
O'l./DP'
.....
o
Ton.A
oToneS
OTontS~
o T""eAtl\1Ote
@8
CAUTION
DO'"
I"UT
rown
I--------~il,--
~l-
BNCT
I
fl
I
ANT
--,
rl
ANT
I
I
I
I
I
RECEIVER
I
I
I
I
LEVEL
I
I
I
I
I
COMMUNITY
REPEATER
I
1-
FIGURE 4-15. COMMUNITY REPEATER MODULATION
4-27
_~J
SETUP

1.
Set-up this station in two steps:
2. Connect the Analyzer
3. Set
DISPLAY
switch to
to DVM,
narrow
to
and
squelch controltothreshold.
WIRE LINE REMOTE BASE MODULA
Transmitter
modulation
and
phone
line levels.
the transmitter under test as shown in figure 4-16.
FUNCTION
switch to
Monitor,
and
MODULATION
nON
switch to
off.
Set
MONITOR
BW
'--./
4. Set the
squelch the
display.
Enter
5.
1
KHz
tion limiter.
6. Set
DISPLAYtoOen/Mon
dicated
7. Follow
attenuator
the
proper
to
monitor.
transmitter
-30
dB.
For
Too
highanattenuator
frequency. Move the display
low-power transmitters, it may be necessary to reduce the
settingortoo
cursor
Level control for 1 VAC indicatedonthe display,toput
Mtr. Key the transmitter
on
the display. Un-key the transmitter.
the
base station
phone
level setting outlined in
and
the
next procedure.
tight a squelch setting inhibits the
downtoDVM
1 voltof1
adjust
the transmitter.
KHz
and
test
enter 1 for
tone
into the transmitter modula-
IDC
control for 5
attenuator
modulation
AC
mode.
settingtoun-
deviation
Adjust
KHz
DEV in-
the
~
4-28

WIRE
LINE
REMOTE
BASE MODULATION
@IIIJOTOROLA
d'
OUlpul
CAUTION
"
O
©
oo.or
IIPUT
'0\11'(1
Ell
Wattmeter
SfSlllllAlAllWI
CAUTION
125WIilU
e
COlllllttJlltCAtlO.S
POWER
@]00G
@]GJ0~
0800
,",
elntt"••I,
@
e
V,"
Vertl$,n.d/Oi.,
OVM/Counte.
®
M
..
In
'8'
@
• Vert
o
Horil
.
__
-i
l
I I
III
'--
B•
Dun
i
HOfll
Ell
~
~
1I
.C
HO';l
.
•
DISPLAY FUNCTION MODULATION
o
Re,dy
Ci.n"Mo""."
o
MO()ut"',on
o
Sp
..
cl"'n~lyl'"
8ouP,e.Grt'l
RFMemOfY
o
S'gnallngStq
o
",eqeo"nl
o DVM,OIST
o
E.IWallmtler
0"
o
SeopeAC
o SeopeOe
~
MONITOR
DemodO
..,
@]
...
1 BFO
~G'"'"''
Mon,IOI
OFM
OCW
O'M
o
SSBIOSeSC
o
$WP
o
SWP.111·IMH,
g]@]
© 0
II---_~
@conl
Code
o
o
o
o
1·10MHJ
o
o
Code
S'I'nltllvl
o 0
M,n
"0
011
Mo<lOul
011
BUISt
Sy'llhMO<fe
Pl'OPl
PlIOPLlft
Tone'"
TontS
TontSeC)
ToneR.mole
@]
E..
level
OU
{j'
~
fll
Mod
©
...
@l
I"
BNCT
WIRE
LINE
I
INPUT
I
I
I
I
L
-
-
...
-
--
- -
--
---
LINE
DRIVER
CIRCUITRY
FIGURE
4-16. MODULATION SETUP; REMOTE BASE
- -
WIRE
-
(
LINE
- - -
~
BASE
I
--
LIM
-
-
-I
~ANT
I
I
IDe
I
I
{
-
-
- -
I
I
_I
4-29

WIRE
A.
Phone
Line Levels
1.
Perform the Transmitter Modulation procedure, outlinedinthe previous method, before proceeding with the
LINE
PHONE
REMOTE
LINE
LEVELS
BASE
phone line level adjustments.
2.
Connect the Analyzertothe base station under test as shown in figure 4-17. ConnectRFIn/Out
connector and Mod
Out-DVM/Counter
In connector to the station phone line input.
CAUTION
'------/
to the antenna
Disconnect the telephone line from the base station
will introduce hum
and
noise that will cause erroneous readings.
and
connect a 600
ohm
load across the input. Failuretodo so
3.Tomeasure levels across a balanced phone line, refer to paragraph D.Togenerate signals across a balanced phone
line, refer to paragraph E.
B.
TRANSMIT Line
1.
Set DISPLAY to DVM, FUNCTION switch to Monitor FM, and MODULATION switch to off. Set
BW switch to narrow
2.
Set attenuator to
squelch the monitor.
Input
and
squelch control to threshold.
-30
dB. For low-power transmitters, it maybenecessary to reduce the attenuator setting to un-
Too
high an attenuator settingortoo tight a squelch setting inhibits the modulation devia-
MONITOR
tion display.
3. Enter the proper transmitter frequency. Move the display cursor down to DVM and enter 1 for
AC
mode.
4. Adjust the 1 KHz Level control for the DBM level expected from the remote control console. The typical value
-16 dBm will be
5.
Remove the cable from the
the line driver
+/-4
dBofmost actual levels.
DVM/Counter
outputtoDVM/Counter
In connector coming from Mod Out. Connect the cable coming from
In.
6. Adjust the exciter level controlonthe station control module for the value stampedonthe exciter, as indicated
the display.
7. Set DISPLAYtoOen/Mon
Mtr. Make a line push-to-talk by applying the proper control signal to the input line.
Verify that modulationis5 KHz.
of
'----'"
on
C. RECEIVE Line
1.
Disconnect the cable from the Mod
line driver
2.
Set DISPLAY to
3. Adjust the 1 KHz Level control for 5 KHz DEV indicated on the display. Set the attenuator to
Output
output
to the
DVM/Counter
Oen/Mon
Out
and
DVM/Counter
In connectors. Connect the cable from the receiver
In.
Mtr, FUNCTION switch to Generate FM,
and
MODULATION switchtooff.
-30
dB and the
Variable control to mid-range.
4. Set DISPLAYtoDVM. Enter the proper receiver frequency. Move the display cursor down to DVM
for
AC
mode.
and
5. Adjust the line level controlonthe line driver module for the desired levelonthe phone line. A typical value for
carrier - type linesis0 dBm.
4-30
enter 1
'-...---'

WIRE LINE REMOTE BASE
PHONE LINE LEVELS
@""OTOROLA
r--
SYSI(lIlUAlfl(ll
,-------
I
I
I
I
C'}---..---l
LINE DRIVER
I
600n.
CIRCUITRY
COlllMlIIlIC,I,lI011S
+-_~J
f.YJ[2]~[!]
@]0ill0
G[i]00
'H,
.
rl
.
......
---..W,J
BNCT
1----
1
I
I
I
-I
I
I
I
I
I
I
.....
I
I
I
-.J
--+---1
STATION
LIM
1
DISPLAYPOWER
FUNCTION
-
MOOULATION
~CO"'
~Ofl
Code
Sy"lhMocie
o PllDPL
o
PLJOPlln't'
o
ToneA
o
Tane8
o
Ton~Stq
o Tone Remote
--I
RCVR
BUill
I
I
I
RF
CONNr-
IDC
ANT!
I
L~_E~~
I
I
I
I
I
I---
I
I
I
WIRE
LINE
TRANSMITTER
BASE
t
I
FIGURE
4-1'7.
PHONE
4-31
LINE LEVELS SETUP
I
I
I
-l

WIRE LINE REMOTE BASE
PHONE
LINE
LEVELS
D. MEASURING LEVELS ACROSS A BALANCED
I. Use a BALUN (balanced-to-unbalanced) device becauseofthe unbalanced natureofthe
(6K
The BALUN must be high impedance
ohmormore) to make bridging measurements without upsetting levels.
LINE
DVM/CounterInjack.
2. Connect the BALUN's balanced side (high impedance) across the phone line. Connect the BALUN's unbalanced
side to the
DVM/Counter
3. Set DISPLAY to DVM
DBM scale
4.
Set DISPLAY to Scope AC. Analyze waveform
on
the display.
In jack, as shown in figure 4-18. Set the BALUN switch in the
AC
mode. Measure the test tone level on the phone line by interpolating the AC VOLTS-
and
measureACvolts peak-to-peak by interpolating the volts per
OPEN
position.
division.
5.
With the BALUN switch in the
balanced side to the unbalanced side.
OPEN
position, the BALUN represents a nominal lOdb insertion loss from the
For
example, an actual line levelofOdbm will indicate -10 dbm at the DVM
input. Characterize your unit before use.
4-32
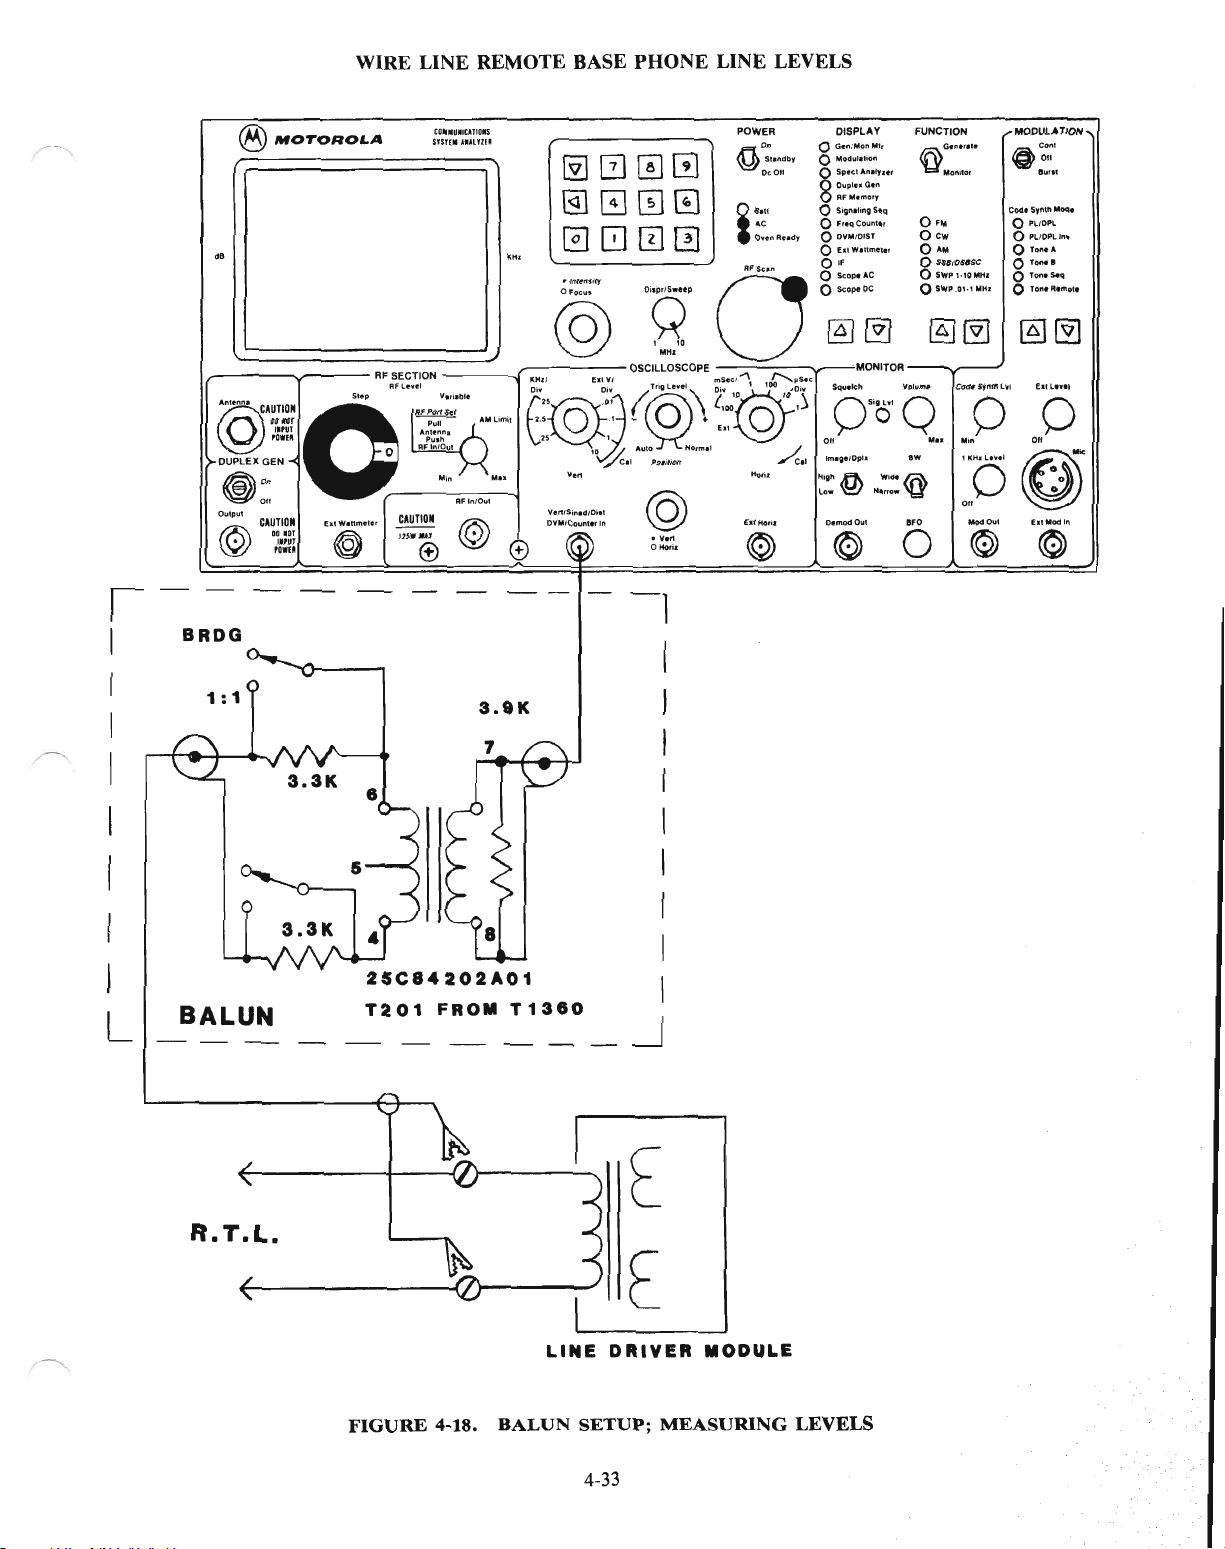
WIRE LINE REMOTE BASE PHONE LINE LEVELS
"'••U_lo.11011$
SJST£
@IfIfOTOROLA
• .lIU'i'l(1I
~[2]0[!J
@]00~
dB
I
I
BRDG
0800
-1
POWER
@Stlndb
i
On
Dc
011
·",
AC
O....
nt'leld'
DISPLAY FUNCTION MODULATION
o
(ien:iIllonMlr
o
Moduillion
Y
8
..."..~,..
Duplc1l0en
RFMlmory
o SiQn.tinllSltq
o
FleqCollntlr
o
DVM/DIST
o
Elt
0"
o
ScolMAC
o
SCope
~
0"0'0
0"
Willlmell'
MONITOR
OC
@]
~a.n.,.,.
,
0 ...
o
o
o
oSWP 1·10MH.
oSWP
~1Yl
Voh.tm.
M..
.'0
o
Mon,lor
CW
A"
SSltOSB$.C
.01.'
"HI
0 0
Min
'·otf
Olt
MCKlI
~
@COnl
Cocl.ltSynttlMoclI
o PllOPL
o
o TOfl."
o'OM I
o
C
0111
011
8111'.(
PLfOPlln.
TonlS.q
10".R~ot.
~@J
0"
~
hI
Mod
In
©
I
I
I
I
I
I
I
I
I
,
I
L
BALUN
R.T.L.
25C84202A01
T201
FROM
T1380
LINEDRIYER
I
I
I
I
I
~
MODULE
FIGURE
4-18.
BALUN
SETUP;
4-33
MEASURING
LEVELS

WIRE LINE REMOTE BASE
PHONE
LINE
LEVELS
E. GENERATING SIGNALS ACROSS A BALANCED LINE
1. Connect the BALUN's balanced side (600 ohm) to the phone line,
equiment (consoles, etc.) connected to the line. Connect the BALUN's unbalanced side
as
shown in figure 4-19. Disconnect any other
to the Mod Out -
CounterInjack.
2.
Set DISPLAY to DVM
desired on the line,
3. Set DISPLAY
to
AC
mode and FUNCTION switch to Generate. Adjust the 1KHz Level control to the level
as
interpolated from the
DVM
AC
mode, FUNCTION switch to Generate, and 1KHz Level control to
DBM
scale. A typical value for carrier-type lines
is
0 dBm.
off
position to
generate tone remote control commands.
4.
Set MODULATION switch to Cont Tone Remote. High-level guard tone, function tone, and then the continuous
low-level guard tone will go out. Adjust Code Synth Level control for -30 dBm level
phone line,
5.
Switch to Burst position each time that a tone remote control command sequenceisdesired.
6.
Connect the service microphone into the Analyzer's MIC jack. Adjust the Ext. Level control for voice peaks about
6
dB
as
interpolated from the DBM scale. Thisisequivalent to 0 dBm speech test tone level.
higher than the desired test tone level.
7. With the BALUN switch in the CLOSED position, the BALUN represents a nominal
unbalanced side to the balanced side. For example, a modulation output
of
Odbm
of
low-level guard tone on the
Odb
insertion loss from the
will be a
Odbm
input into the
ohm line. Characterize your unit before use.
DVMI
600
'---'
'-
4-34

WIRE LINE REMOTE BASE
PHONE
LINE LEVELS
de
1
---"""'"---
@
DUPLEX
@
1M
~
©
®
MOTOROLA
CAUTION
0"'·
D~.:Ji
~.
O
GeN 0 RF ,,,,fOul 10
On
0:
OU
...
CAUTION
•
00
lOT
II.ar
......
EatW.ttmetltr
CI)IIIUIICAnUIS
nsn
....
lm.
RF
SECTION
R'L":',p:':~:bI'
Pull
A=,
M~....
~f0\
mwau
..J=--:-.::-OSCILLOSCOPE
flFln/Ovl
~
® e
POWER
On
@SI.l\db
~[2]0[!]
DcOIf
@]G00
0800
.lnl,"s'l,
0'0'"'
"'
•••"....
RFSun
0
@8
----==-----...--
E~~.:,@f§'~\
2$ 1
Yo"
V.n/S,n_dIOi.,
DVM,ColHtl.r
0~fo~L""~
~'I
AUIOpO~IJOn
@
'"
•
CHonz
2::@~""o'~~S'
ell
NOlm,'
Yen
~'I
Horil
fat
Hor;t
©
DISPLAY
o
Gen:Mon
o
MOdl,llillton
Y
o S.,cclA".,yz.,
8Dupl
RFMtmory
o
$ign.I"'gSeq
o
F'eqCounler
o
DVM/OIST
o
EIIW.lImelc.
0"
o
$cop*AC
o SCOp4'
~
S<lUelch
0"0'0
011
'mlgeIOp"
H,g!>
low
Oemod Oul
© 0
••
ft
~
MI.
Ce"
DC
@]
MONITOR
W'O<
N.rrow y
FUNCTION
~G~ne"l.
Mon,lor
O'M
Ocw o
O'M
o SSS,DS8SC
o
SWP
1·10MH,
o
SWP.Ol·1
@]
~
Co«l,SWn1hlvf
Volumt
o 0
Min
M
••
{ffi
~o
BfD
ModOul
MHz
MODULATION
@c,.,
001
B""I
Code
Synlh
Mode
o PLlOPL
P,-,OPl."'v
o
TOM-A
o
TontH
OToncS~
o TOIlI!'Rernoli!'
@]
~
EI.IL....
'I
011
({W
Eu
Mod
t1
©
R.T.L.
I-
I
I
I
I
I
SROO
o
1:
1
o
BALUN
25C84202A01
T201
FROM
3.8K
T1380
L
FIGURE 4-19. BALUN SETUP; GENERATING SIGNALS
I
I
I
I
I
I
I
I
I
I
~
4-35

BANDP
ASS CAVITY
TUNING
Use this procedure to peak-tune bandpass cavities, duplexers, crystal filters and other bandpass devices. Tune the bandpass to center frequency. After tuning, use normal gain or loss measuring techniques to measure insertion loss.
1.
Connect
In/Out
the
Analyzertothe
device
under
test,asshown in figure 4-20. When tuning a single cavity, connect the RF
to the cavity's output connector. When tuning a bandpass duplexer, connect the RF
In/Out
to the duplexer's
antenna port.
2.
Set DISPLAY to Duplex Gen, FUNCTION switch to Generate, and attenuator to -lOdb.
3. Change the FUNCTION switch to Monitor. Enter pass frequency on the display. Set the offset to 0 MHz.
4. Change DISPLAY to Spectrum Analyzer. Set Dispr/Sweep control fully clockwise to
Generator
on.
10
MHz. Turn the Duplex
5. Tune the cavity, or both cavities in the duplexer leg, to a peak indication on the display's center graticule. The single
cavity
is
ready for service.
6.
For duplexer tuning, move the output cable from the Duplex Oen Output connector to the duplexer's other end.
Repeat steps 2 through 4.
Put
the duplexer into service. Check the duplexer for insertion loss according to its
specifications.
4-36
"----"
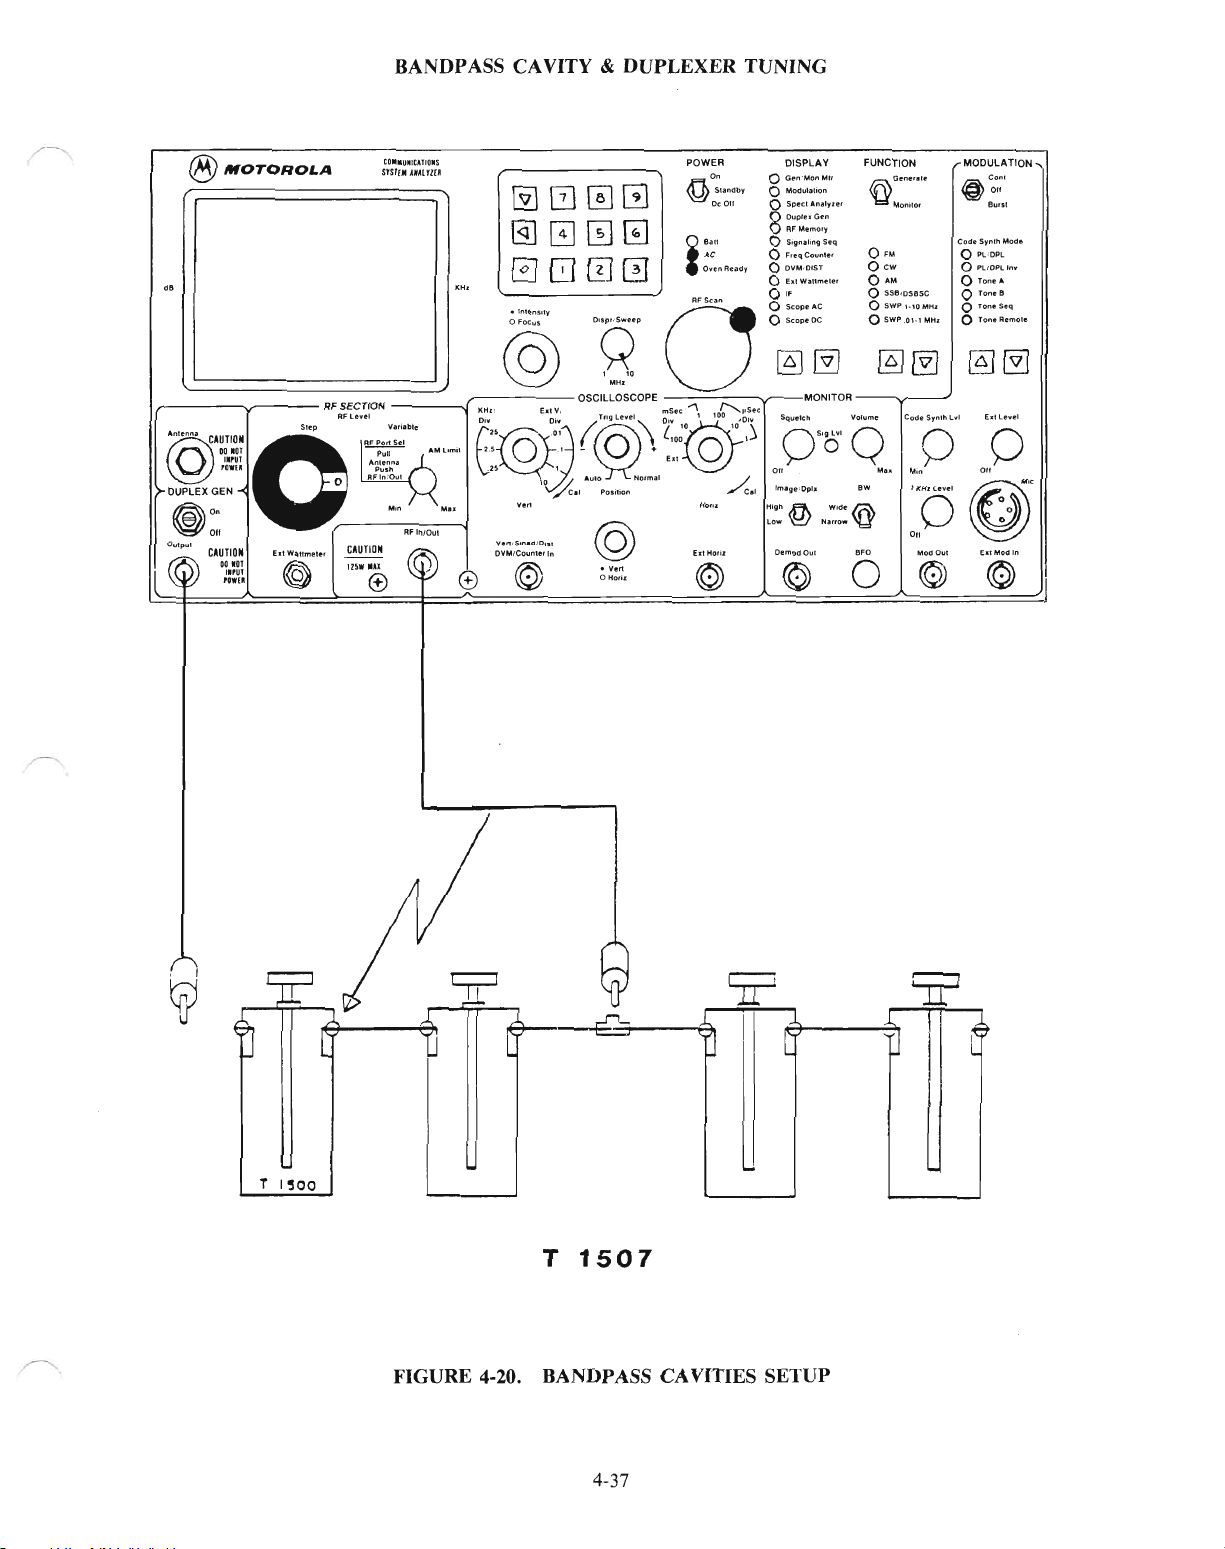
BANDPASS CAVITY & DUPLEXER TUNING
(f!yMOTOROLA
o.
,.-
A'
'''"'
CA::~~~
@
O
DUPLEX GEN
~O"
~Oll
Outpul
CAUTION
"""",.-
IIVUl
rown
O
DO.IIT
tl'UT
,.wn
COILUIUllltAllOIlS
srsrUIAW,(trm
@)[2J0G
@]GJ00
0000
_'''"ens,lv
o
Focus
©8
RF SECTION -----Jr::::-----:--=-OSCILLOSCOPE
OF
~.
CAUTION
11UtiU
,""
.-
0"010",
®
E"·'~§·~o:,·
(.0-.!
"10
/@To"·,,,,,,,ms,,...,IO';'-""
I \ \
~.,
A""p.",,~
@
DVM/Counter!n
POWER
0 ..
@Standb
OcOIl
11
AC
··
Oven
Reildy
i
o
-_""':'---,---V--
~::.@f)
N,'m,1
Iion&
hi
Morir
DISPLAY
o
Gen"MOflMI,
o Modulation
Y
o
SpeCI,",lyu"
80uPIUGen
Rf
""emory
o
SillnlllnllSeq
o
FaqCountl'
o
OYM·OIST
o
E~IWa\lmeltf
0"
o
Scop.AC
o
Scope
DC
@]
@]
I
MONITOR
Squelch
O~o'Q
0"
~.'
H'."
ft
LOw
~
Oemod
01,11
FUNCTION
~G''''''''
OFM
Ocw o
o AM
o
SS81DSeSC
o
SWP1·\OMI1,
oSWP
§]
Volume
M..
~
w
•••
fi\\
Nlrrow
't:f
.FO
o
MOOUlA.
@c,..,
Cod,
o
o Tone
o
o
g]
Oil
SynlhMode
PL·DPl
PllOPLlnv
Ton,I'
Ton,
MonilO' Burst
.0\-1
MHIoTonlR.mOle
@]
Code
S.,nlhLvl
0 0
"'I,,.
"of}'
011
~
ModOul
(_IModln
© ©
rlON
A.
Seq
@]
""
T
1507
FIGURE 4-20. BANDPASS CAVITIES SETUP
4-37

A.
Passband
Adjustment
CA
VITY &
BANDPASS
DUPLEXER
ADJUSTMENT
TUNING
I. Connect the Analyzer's
DISPLAYtoGenlMon
2. Set
RF
InlOut
Mtr,
to the in-service duplexer
FUNCTION
switchtoGenerate
tion.
Enter
3.
4. Set the
the receiver frequency.
RF
Step
attenuator
to -30 dB
and
the Variable controltomid-range,toallow
through a mistuned duplexer and quiet the receiver. Reduce
receiver limiter meter reading below saturation.
of
5. Tuqe the pass-band knobs
meter. Reduce the signal generator
tion. This completes the pass-band
6. Set the
necessary
squelch setting will inhibit
Enter
7.
FUNCTION
to
reduce the
switchtoMonitor
attenuator
the
the transmitter frequency. Key the transmitter
transmit leg for maximum power
the cavities in
output,
adjustment
settingtounsquelch the monitor.
displayoffrequency
output.
the
duplexer receive leg,
as necessary,tokeep
for
FM
and
the
This completes pass-band adjustments.
~ntenna
FM,
the
signal generator
the
the
receiver leg.
attenuator
and
and
to
-30 dB.
deviation information.
tune
the pass-band knobsofthe cavities in the duplexer
port
as shown in figure 4-21.
and
MODULATION
output,
for
a peak readingonthe receiver limiter
switchtooff
adequate
signaltoget
posi-
as necessary,tokeep the
receiver limiter meter reading below satura-
For
low-power transmitters, it may be
Too
highanattenuator
settingortoo
tight a
4-38
'-..-../
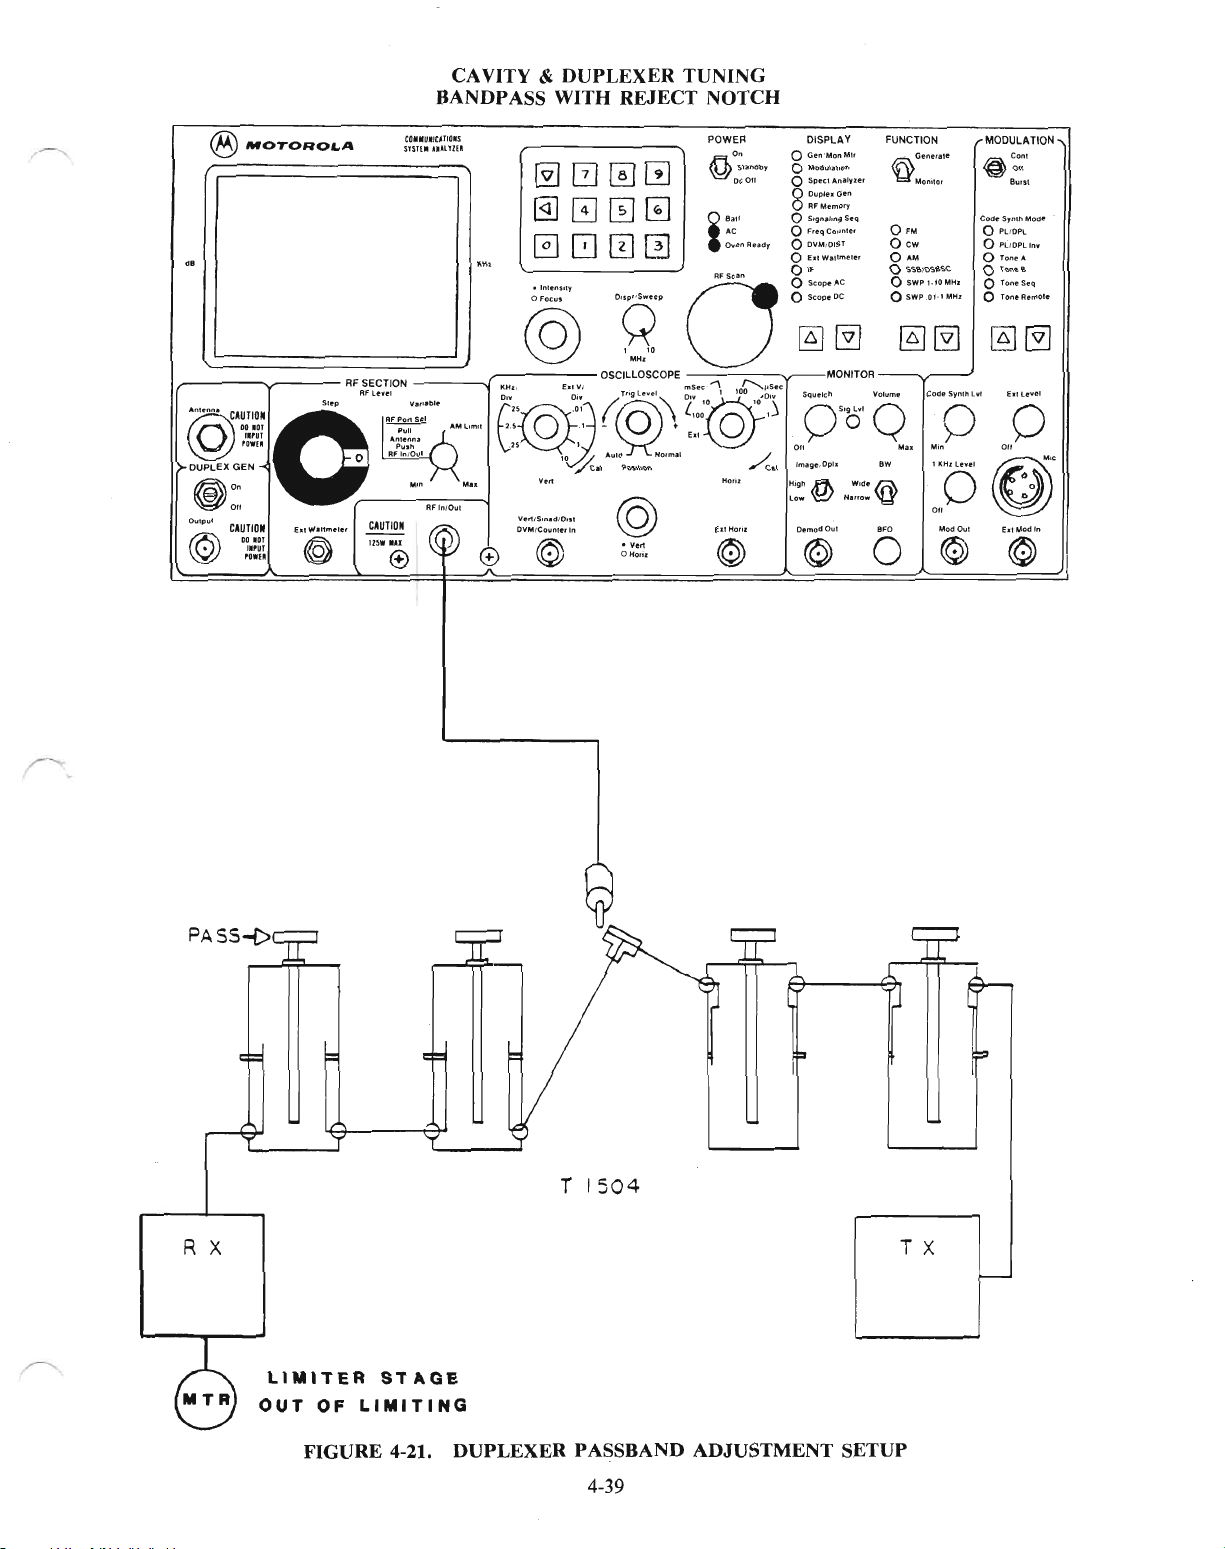
CAVITY & DUPLEXER TUNING
BANDPASS WITH REJECT NOTCH
®
MOTORO&.A
r-----,,----
o.,~..
CAUTION
DOIOJ
I.,ur
,aW(1(
O
©
DUPLEX
GEN
~o.
~Oll
Oulp
...
@
CAUTION
00
lOT
11'1l1
,own
O
AF SECTION
'.
""".
CAUTION
Il~W
conu.,unaIS
snnM.Ul'llll
©8
-=-----.f":'::H:-.,---=-..::-,
E:@~t~\
M
..
RFln/OUI
In
e
e
v.",S'''.d'O'SI
OVMICou"leorl"
POWER
@]00[!]
@SI.tMb
@]00~
0800
_lnlenSlly
o
'oc.,
:y,-
O",,,S
•••
OSCILLOSCOPE
i
RF
0
,
",-,-"-,-",--='-,,,--,,-,.-,..----
~~@P
,o~"
'·"po""o.
@
" Vu'!
o HoriJ
""m"
EJllolot'J
v'"
©
0.
0,011
B
'"
,c
o-.enRud,
SCI"
~.'
HoriJ
DISPLAY
o
Gen'MonM,r
o
Modul.hon
Y
o SpeclAnalyzer
8ouple.Gen
RFMernory
o
S'9n~"n9
o
r,eqCounltl
o 0..,M/015T
o
EolWlIllmeter
0"
o
$copeAC
o
Scope
DC
~
~
MONITOR
Squel,h
OS'o'O
011
O.modOul
©
Seq
FUNCTION
®Genera,e
Monllar
a'M
a
cw
o
OM
o SSB/OSBSC
o
$WP
o
$WP
~
Moll.
ow
MODULATION
@con,
Code
o
o
o
o ToneB
I.IOMHI
o
01.1
MHI
o
@]
~
0 0
Min
~'
~~o~
B'O
o
ModOt.ll
© ©
0"
Burst
S,nl"
MOd.,
PLrOPl,.
Pl/OPLln'f
Ton'A
To~Seq
ToneAtrnol.
@]
E.llev!l
0"
E.!
Mad
'"
PASS-{>
T
1504
R X T X
LIMITER
OUT
OF
STAGE
LIMITING
FIGURE 4-21. DUPLEXER PASSBAND ADJUSTMENT SETUP
4-39

CAVITY & DUPLEXER TUNING
BANDPASS WITH REJECT NOTCH
B.
AdjustmentofReject Notch on Receive Leg
1.
Connect the Analyzer's RF
duplexer receiver port that comes from the receiver. Move the Analyzer's RF
antenna port to the duplexer receiver port. Connect a power-rated dummy load to the duplexer antenna port.
4.
Set DISPLAYtoSpectrum Analyzer, FUNCTION switch to Monitor, and attenuator
display's center frequency reads the same
Key
3.
4. Loosen the cavity reject adjustment nut and slide it within its slot while watching the display. Tighten the adjust-
the transmitter and adjust the reject notch adjustments on the duplexer receive leg cavities for minimum
signal
on
the display. Change the attenuator,asnecessary, to keep the signal on the display.
Be
ment nut.
bandpass knob a maximum
careful not to mistune the rejection adjustment. Fine-tune the rejection adjustmentbyturning the
In/Out
+/-15°.
to the in-service duplexerasshown in figure 4-22. Disconnect the cable at the
as
the transmit frequency in step A-7 above.
This completes the duplexer receiver
In/Out
leg
reject notch adjustment.
cable from the duplexer
to
-30
dB. Verify that the
.----../
4-40

CAVITY &
BANDP
ASS
DUPLEXER
WITH
REJECT
TUNING
NOTCH
@MOTOROLA
dB
(QjAUTION
o
DUPLEX GEN
~o.
0"
OulPUI
CAUTION
©
DO
IIPUT
,owu
00
1.,.,1
'own
lOT
lOT
Step
0
f:uWlllmelfl
~
RF SECTION
RFLe....'
CAUTION
'l~W
In
®
CD.IUlur,DlS
S'ST£.UIUrlU
Min
RFlnfO\l1
[2]
~
@]
GJ
0
8
.Intensol,
oFocus
@
-----
Kff,-
Ed
E:.@i'
·S,'-...--_.
e
V,"
Vert/S,n.dID,,1
DIJMICounl,H
©
In
Mn
0GJ
00
00
O,sp"5weep
Q
,
MH,
"
OSCillOSCOPE
VI
~©\
0
_
mSec'
~~(QY\
@
•
Vert
o HOt;,
POWER
0.
~sll"dbr
Dc
011
B
.e o
a
'"
Oven
Read.,.
AFS,an
DISPLAY
o GeroMonMl,
o
Modulilloon
o
Specr"n,)'"
8
DupinG,,"
RFMemo,y
o
SI~n.JIhng
F.eqCounU,
o
OVMrOiSl
o
EllWaltmele,
0"
o
ScopeAC
o
5(,opeOC
~
""\
f'...~Sec
--<.
HOII'
£.II-Ion!
MONITOR
Squelch
0"0'0
0"
Im"g~,Dph
H"'~
Lo....
DtmodO
© ©
@]
...
1
...
,
Seq
w~,@
Nllrrow
FUNCTION
®Gt!~rillit
Mon,lo'
0,.
Oew
o
.M
o
SS810SBSC
o
SWP
1·10
MHr
o
SWP,OI.lMH,
~@]
Code
S,"lhl"t
0
....
Min
BW I
KHrLevtl
0
0"
B'O
ModOul
0 ©
MODULATION
@conl
0"
Bun'
Code
Svnth
Mode
a
Pl,OPL
o
PliDPlln"
o
ToneA
o
Tone8
o Tone
Seq
o
Ton.
Aemol.
~@]
E.llevel
0
0"
({W<
E.I
MOd In
©
r
-R::~ECT
I \
I \
I \
I \
I \
I~
\
~
FIGURE
4-22.
REJECT
DUPLEXER
NOTCH
ON
ADJUSTMENT
RECEIVE
LEG
[J
SETUP;
4-41
CAVITY &
BANDP
ASS
DUPLEXER
WITH
REJECT
TUNING
NOTCH
C. Adjustment
1.
Connect the Analyzer's RF
duplexer transmitter
plexer receiver
plexer receiver port. Disable the receiver
2. Set DISPLAY to
3.
Set the attenuator to -30 dB and the Variable control to mid-range, to allow adequate signal to get through the
of
Reject NotchonTransmit Leg
In/Out
port
that comes from the transmitter. Move the Analyzer's RF
port
to the duplexer transmission port. Reconnect the cable coming from the receiver to the du-
Gen/Mon
to the in-service duplexer as shown in figure 4-23. Disconnect the cable at the
Mtr, FUNCTION switch to Generate FM.
PL.
In/Out
and
enter the receiver frequency.
cable from the du-
duplexer and quiet the receiver. Reduce the signal generator output, as necessary, to keep the receiver limiter
meter below saturation.
4. Adjust the reject notch adjustments on the duplexer transmit leg cavities for minimum signal levelonthe receiver
limiter meter. Change the signal generator
output,
as necessary, to keep the received signal up
outofthe noise
below saturation.
5. Loosen the cavity reject adjustment nut and slide it within its slot while watching the meter. Tighten the adjustment nut.Becareful not to mistune the rejection adjustment. Fine-tune the reject notch adjustment by turning the
bandpass knob a maximumof+/-15°.
6. Remove the test equipment and connect the duplexer back to the repeater. Check the duplexer for insertion loss
according to its specifications.
and
4-42
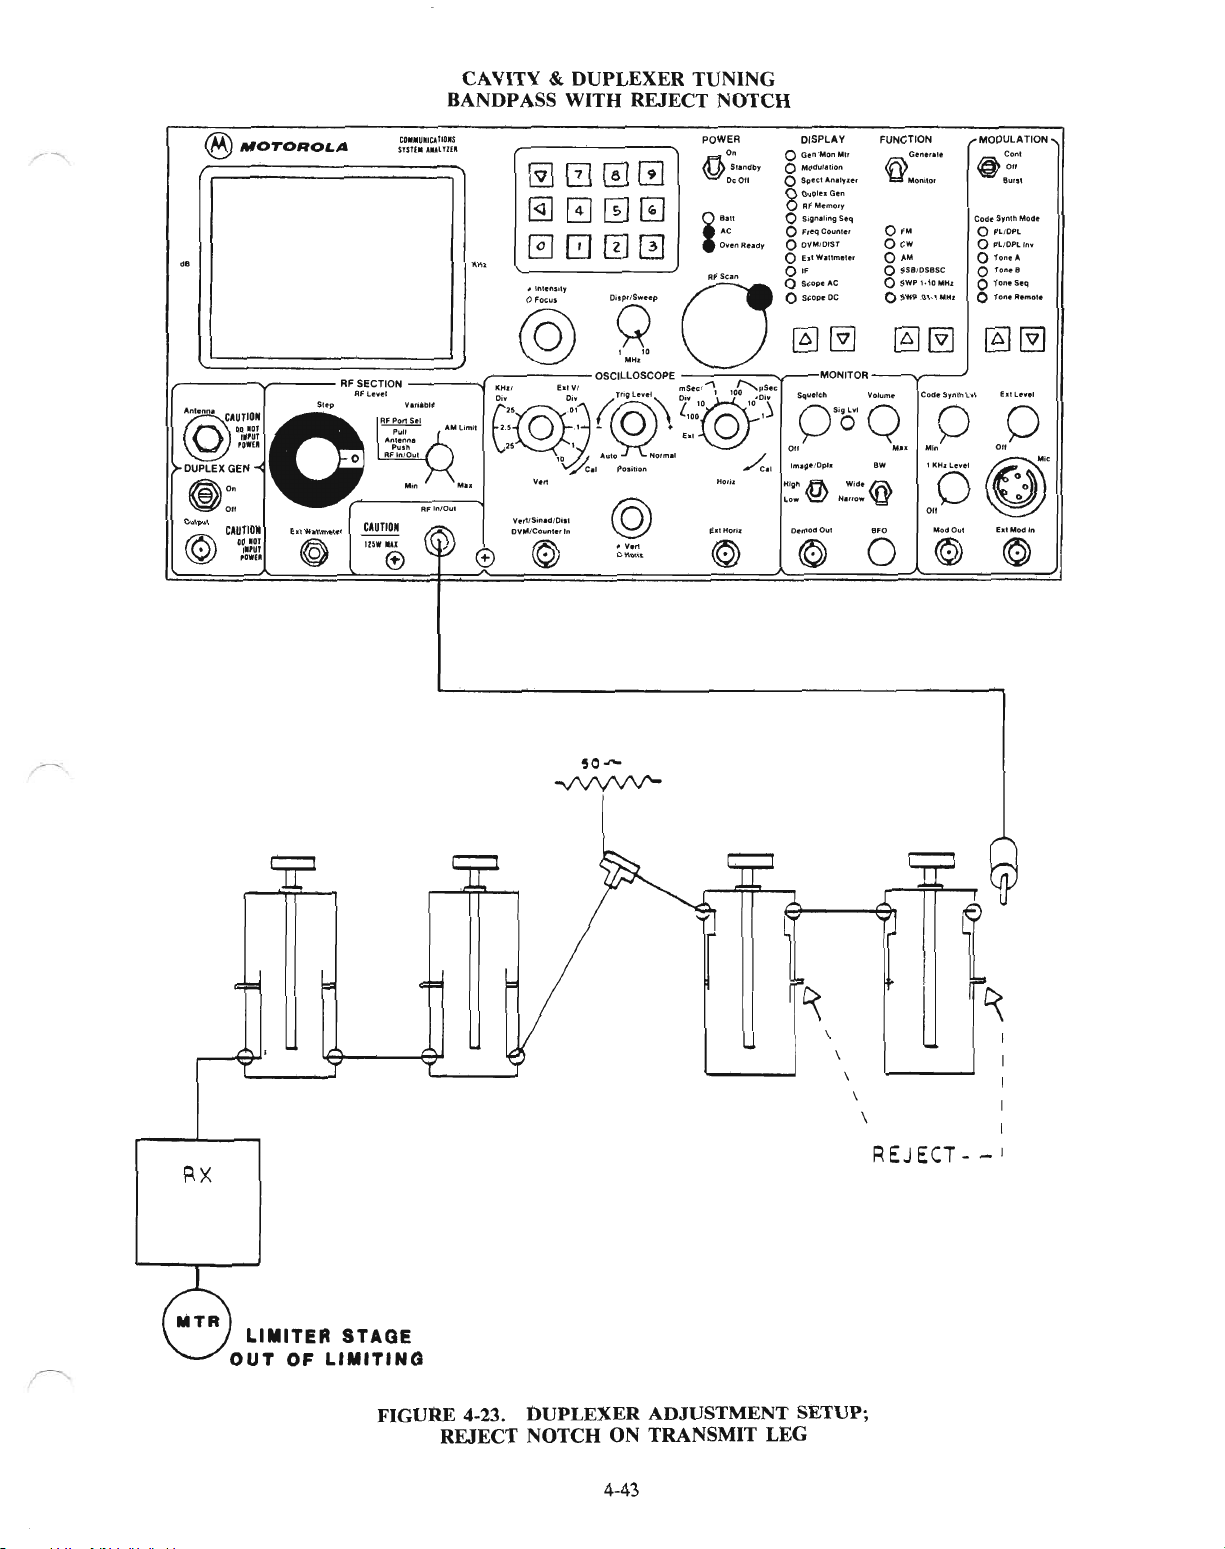
CAVITY & DUPLEXER TUNING
BANDPASS WITH REJECT NOTCH
@1IIIOTOROLA
dO
I
~
nOlcn.
©
DUPLEX GEN 0
~on
~
Oulp
@
O
"
CA~:~~~
0'''·
,r:;:~
0..
..1
CAUTION
011
lOT
•
I.PUl
rawul
CD/llIllUIJCA1IDJlS
SUU/ll""UnU
RF
SECTION
---
.n....
.F;:;:::""
Ap::,n~.
Rf
'nIOu'
M,n
---.-"-n/O-"'--..I
CAUTION
lZ5W
lUX
®
@]12J00
@]GJ00
0800
'H,
.ltIlCtlS,t,
@
........
.r.=---::-::::-
KHII
ED,"",""
0
Yr\(..
j~'
Vort
Vct1t5tnadtDitt
OVMfCoufll,rlfl
POWER
On
@SlanO't;lY
OtOlI
O
...
AC
OvenR.,oy
i
RF
Scan
OISPLAY
o
Gen'Mon
o MoctuliliOn
o
Spect
I!IGen
0UP'
Rf
Memory
8
o
S,vnllingSeq
o
F,eq
Counte,
o O\'MIDIST
o
Ell
W.ltm.l.,
0"
o
ScopcAC
o
ScopcDC
An.lynr
"g'
OSCillOSCOPE
Eu
VI
§D;,,~,
0_
~TO""·"'~.
10
~'l
AUIOpOlilion
@
• V.t1
Ol'lorit
o
------v---MONITOR
ms.t;:I"'"
{.':,',:@jo'
No"".'
t:"--..IlS'C
".
,,,~'~
0"0'0
011
.......<.1
(Q)
FUNCTION
Mt,
OFM
o cw
o
AM
o SSBIDSBSC
o
SWP1.iOMKt
o
SWP.01.,MHt
--,~----'
M
..
0
MOOUlATION
...a.
Cont
'Sf'
011
Burst
Code
Synth Mode
o
PL/Ofl
o
Pt.tOPLln"
o
ToneA
o
TOll,8
o
TOMSeq
o
Ton,R,"'ol,
Cod.
Srn1h
lvl
e.-tLe.,'
o 0
MIn
"oQ'
~,
~
MadOu!
ealMCKlIn
© ©
RX
LIMITER
OUT
OF
LIMITING
STAGE
FIGURE
4-23.
DUPLEXER
ADJUSTMENT
REJECT NOTCH ON TRANSMIT LEG
4-43
\
\
\
\
\
REJECT-
SETUP;

DESENSITIZATION TEST
IN-SERVICE
DUPLEXER
Perform this test after retuning a duplexer or after detecting inadequate isolation between transmitter and receiver. The
following conditions may make a duplexer appear mistuned:
• High VSWR antenna
1M
between the repeater's transmitter and an external signal
•
• Faulty cables or connectors
• Improper cable length or configuration
'-......--'
Normally, repairing or replacing cables solves the problem without retuning. Check the duplexer manufacturer's
data
sheets to determine proper installation.
1.
Connect the Analyzer to the repeater/duplexer under test,asshown in figure 4-24. Connect the RF
an
duplexer's antenna port through
To
prevent RF overload into the generate, provide sufficient isolation between the tap-off and the straight-through
feed. For example a 1000 W transmitter requires
2. Connect the DVM input to the receiver speaker connection. Disconnect the cable from the RF
RF tap-off isolating device.
CAUTION
50
dB isolation.
In/Out
In/Outtothe
to prevent the
transmitter from keying up on repeat.
3. Set DISPLAY to
4.
Set the attenuator to
5.
Adjust the I KHz Level control for 3.0 KHz
6.
Reconnect the cable from RF
Oen/Mon
necessary to provide 0.75 KHz
Mtr, FUNCTION to Generate FM, and enter the receiver frequency.
-60
dB and the Variable control to mid-range.
In/Out
PL/DPL
DEVon
to the RF tap-off and enable the transmitter to key-up.
deviation for a
the screen.
PL/DPL
accessed repeater.
For
example, it may be
7. With this generated signal introduced to the RF tap-off, adjust the signal generator level Step attenuator and the
Variable control to the
8.
Disable the transmitter from key-up. Readjust the signal generator to obtain12dB SINAD again. Note the generator
12
dB SINAD levelasindicated on the display. Note the generator RF LEVEL.
RF LEVEL.
9.
The difference between the RF LEVEL for12dB
is
(step 7),
10.
More than 2dBdesensitization may indicate:
the amountofsystem desensitization.
• defective antenna system
• loose shields
• transmitter spurs
• improper or defective duplexer cable.
Check them all, before attempting to retune the duplexer.
SINAD with the transmitter
4-44
off
(step8)and with the transmitter on

DESENSITIZATION
IN-SERVICE
DUPLEXER
TEST
®
/MOTOROLA
CO••UllCA'JOIJS
Sfsn_AllllHU
@]00G
@]00~
0000
POWER
@Slandb
8
AC
Oven
i
RF$l:an
00
Dc
Oil
...
RUdy
DISPLAV
o
Gtnll.lanMlf
o
ModulatIon
Y
o
Spl!cl"'naly~er
DUPl
8
RF
o
$llInallng$eq
o
F.eqCounlCf
o
OVM
o
E.IW.llmele,
0"
o
StopeAC
o
StOptOe
Memory
~
Squelch VOlume
0"0'0
Oil Ma.
FUNCTION MODULATION
~G'o"",
l!KGen
OfST
@]
MONITOR
Man;IO,
o
FM
Ocw
o
AM
o SSS,O$BSC
o
SWP
o
SWP.Ol·1MHI
~
@COO'
Code
o PLlOPL
o
o Tone
o
1·10
MHz
o Ton"
o ToneRemole
@]
@]
COdeSyn!tI
Lvi
0 0
Min
Oil
8u,sl
Synlh
PL;OPLII'I.
A.
Tont'S
SeQ
E.lle"eJ
~f
Mode
~
"of}'
011
~
Mod
Oute••
MOd In
© ©
TX
VNTEHNA
Y
CuPL£XER
OP.
OU).4)otYLOAO
58-80313837
OR
SLN
RF
TAP-OFF
63218
RX
FIGURE
4-24. DESENSITIZA
4-45
TlON
TEST
SETUP

FERRITE ISOLA
1.
Use the Analyzer to test isolators for insertion loss and isolation. Connect the Analyzer to the isolator under test, as
TOR
TEST
shown in figure 4-25.
2.
Set DISPLAY to Duplex Oen and FUNCTION switch to Monitor FM. Enter the transmitter frequency andanoffset
of
0 MHz.
3.
Use an RF adapter (bullet) to temporarily connect together the cables to the isolator. Turn on the Duplex Oen switch.
Set DISPLAY to
Gen/Mon
Mtr and attenuator to 0 dB.
'-----'
4. Note the
RF
LEVEL input value in dB, on the display. Use this value as the reference level to determine insertion loss
and isolation values.
5. Reconnect the cables to the isolator; Duplex Gen to isolator input and RF
6.
Note the RF LEVEL input value in dB, on the display. Subtract this value from the value found in step 4, to obtain
In/Out
to isolator output.
the insertion loss in dB.
7.
Reverse the connections to the isolator and again note the RF LEVEL input value in dB. Subtract this value from the
value found in step 4, to obtain the isolation value in dB for the isolator under test.
8. Test dual isolators (connected in series) by the same procedure.
4-46

@MOTOROLA
n
••
U_IUTK»lS
S1'1U.AUIYlUl
FERRITE ISOLATOR TEST
POWER
[YJ000
~
@]GJ00
0800
'H.
'
0,
Sllndby
Dc
011
B'"
.c
OorrnRudy
OISPLAV FUNCTION MODULATION
o
GeIlMonM"
o MQdul,loon
o
SprcIAnlly~"
g
DuptuG."
RFMrmo<y
o
Sog",Il"vSrq
o
F",rqCounlrr
o DVM
OI$T
o
E~I
W.nmrtrr
0"
o Scop."-C
o
StOp.OC
®Ctnt'll.
1III01M10<
0,
...
o
cW
0
....
o
sse,oses<;
o
SWP,·IOMH,
o
SWP.OHMH,
@c.n,
Codr
S,Mh
o PL'DCl'l
o
Pl'OPlltI.,
o
To"~.
o
ToneS
o
Ton.s.q
o
Tone
BUill
0"
Mod.
R.tJlOlt
Output
CAUTION
DOlor
l.rUT
'DWflt
CAUTION
ItsW
M,u
e
+
v
VeniSin,dlCial
OVM/Counlt'
©
.....
AFh,'Oul
ISOLATOR
@]
~
MONITOR
Squel(:h
0"0'0
011
••
@
In
..
v."
0"0111
Helll
e.uMo."
©
H',"
La_
ft
~
W,,,
N.trow
Volume
ow
IN.
'Y'
B'O
o
M..
~@]
J,ll"
0"
@]
0 0
011
"0
Mod
01/1E_\
~
~
© ©
Mod
~
~
In
I
I
I
I
I
L
--1_1-
RF
ADAPTOR
(BULLET)
FIGURE 4-25. FERRITE ISOLATOR TEST SETUP
4-47

8v-v

MOTOROLA, INC.
COMMUNICATIONS SECTOR
TEST
EQUIPMENT
1308 PLUM GROVE ROAD
SCHAUMBURG,
SERVICE
ILUNOIS
60173
TEST EQUIPMENT SERVICE REQUEST FORM
This
for
DEPOT
completed
service.
form
must
accompany
TEST
equipment
MOTOROLA, INC.
COMMUNICATIONS SECTOR
EQUIPMENT
2333B.UTAH AVENUE EL SEGUNDO. CA
returned
SERVICE
CENTER
CUSTOMER'S
MODEL
DESCRIPTION
REQUESTED
NUMBER
PURCHASE
I
OF
PROBLEM:
SERVICE:
ORDER
I
NO.
I
SERIAL
NUMBER
DATE
I
I
I
SHIPTOADDRESS:
SHIP
VIA:
I
Providing
Equipment
MOTOROLA
the
Service.
CUSTOMER
information
NUMBER
I
below
will
reduce
BILL
TAG
the
turnaround
4-49
SHIP
timeonyour
TAG
Test
INTERNAL
SIGNED:
MOTOROLA
ACCOUNT
NO.
I
_

 Loading...