

Page 1

TASKE Reports TASKE Call Center Management Tools Version 7.0
Table of Contents
TASKE REPORTS............................................................................................... 2
THE TASKE REPORTS INTERFACE................................................................. 5
Overview of the Reports Window....................................................................................5
Main Control panel............................................................................................ 6
Report Templates panel.................................................................................... 6
Publication Viewer panel................................................................................... 7
REPORT TEMPLATE PROPERTIES.................................................................. 8
General Properties..........................................................................................................8
Report Template Contents..............................................................................................9
Report Template Export Properties...............................................................................11
GENERATING REPORTS................................................................................. 13
Creating a Report template...........................................................................................13
Generating a report from an existing template ..............................................................14
Exporting a Report........................................................................................................15
Creating a Forecast Report template ............................................................................16
Scheduling Reports for Printing.....................................................................................20
Scheduling Reports for Exporting..................................................................................22
ANALYZING REPORTS.................................................................................... 24
Reports by Reporting Period.........................................................................................24
Report by Resource......................................................................................................26
Reports by Load Activity ...............................................................................................28
Reports by Queue Activity.............................................................................................29
FORECASTING REPORTS ............................................................................... 30
HELP ON TASKE REPORTS............................................................................ 30
- 1-
Page 2

TASKE Reports TASKE Call Center Management Tools Version 7.0
TASKE Reports
The TASKE Reports program is used to generate reports for customization. The
Reports program uses the data collected in the TASKE Database from the
telephone switch to generate reports. The data is used to manage a balance
between the call load presented to the Call Center, and the capacity of the Call
Center to process calls.
The future call demand can be forecast with reasonable reliability by studying
calling patterns derived from historical data. Supervisors can use this information
in estimating the call load over a specified interval (such as a work shift, a
business day, or a business week) and for scheduling staffing and other resource
requirements. Scheduling involves an assessment of the number of Trunks and
the number (and skill level) of Agents required.
The Reports program allows generation and customization of different report
types. Reports are presented in the main interface in text format.
TASKE call center reports may be categorized in three ways.
• the requirement for Call Center resources such as Trunks, Pilots, Extensions
and Agents.
• the reporting period such as by day, week, and month.
• the specified interval such as by quarter-hour, half-hour, hour, day, week or
month.
For a particular time period, reports can be generated for a specified resource.
The data is collated across several time intervals, and describes the performance
of individual resources, or a group of resources. The statistics for a report are
totaled or averaged by time interval over the reporting period.
The report options are outlined below; the terms presented are summarized
below.
• The report interval is by: quarter-hour, half-hour, hour, day of the week, day of
the month, week, or month. The report includes a one-line total for the
interval.
• The resource settings are divided by: Trunk, Agent, Extension and Pilot.
Each Resource setting represents the resource that statistics are being
captured for in the TASKE Database. Choosing a resource setting determines
the resource content of your report.
• The reporting period is by: day, week, month, Year to Date by week or Year
to Date by month. The report period chosen for a report determines the time
period the content of the report covers.
- 2-
Page 3

TASKE Reports TASKE Call Center Management Tools Version 7.0
Report Options
Reporting
Resource Report Intervals
Period
Daily Trunk Quarter hour, half hour, hour
Weekly Trunk Quarter hour, half hour, hour, day of week
Monthly Trunk Quarter hour, half hour, hour, day of month
Year by Week Trunk Half hour, hour, day of week, week
Year by Month Trunk Half hour, hour, day of month, month
Daily Extension Quarter hour, half hour, hour
Weekly Extension Quarter hour, half hour, hour, day of week
Monthly Extension Quarter hour, half hour, hour, day of month
Year by Week Extension Half hour, hour, day of week, week
Year by Month Extension Half hour, hour, day of month, month
Daily Extension Group By Extension
Weekly Extension Group By Extension
Monthly Extension Group By Extension
Year by Week Extension Group By Extension
Year by Month Extension Group By Extension
Daily Agent Quarter hour, half hour, hour, agent group, pilot
Weekly Agent Quarter hour, half hour, hour, day of week, agent group, pilot
Monthly Agent Quarter hour, half hour, hour, day of month, agent group, pilot
Year by Week Agent Half hour, hour, day of week, week, agent group, pilot
Year by Month Agent Half hour, hour, day of month, month, agent group, pilot
Daily Agent Group Quarter hour, half hour, hour, agent, pilot
Weekly Agent Group Quarter hour, half hour, hour, day of week, agent, pilot
Monthly Agent Group Quarter hour, half hour, hour, day of month, agent, pilot
Year by Week Agent Group Half hour, hour, day of week, week, agent, pilot
Year by Month Agent Group Half hour, hour, day of month, month, agent, pilot
Daily Pilot Quarter hour, half hour, hour, DNIS, area code, area code & city,
state
Weekly Pilot Quarter hour, half hour, hour, day of week, DNIS, area code, area
code & city, state
Monthly Pilot Quarter hour, half hour, hour, day of month, DNIS, area code, area
code & city, state
Year by Week Pilot Half hour, hour, day of week, week, DNIS, area code, area code &
city, state
Year by Month Pilot Half hour, hour, day of month, month, DNIS, area code, area code &
city, state
Daily Pilot Answer Spectrum Quarter hour, half hour, hour
Weekly Pilot Answer Spectrum Quarter hour, half hour, hour, day of week
Monthly Pilot Answer Spectrum Quarter hour, half hour, hour, day of month
Year by Week Pilot Answer Spectrum Half hour, hour, day of week, week
Year by Month Pilot Answer Spectrum Half hour, hour, day of month, month
Daily Pilot Abandon
Spectrum
Weekly Pilot Abandon
Spectrum
Monthly Pilot Abandon
Spectrum
Year by Week Pilot Abandon
Spectrum
Year by Month Pilot Abandon
Spectrum
Daily Pilot Interflow
Spectrum
Weekly Pilot Interflow
Spectrum
Quarter hour, half hour, hour
Quarter hour, half hour, hour, day of week
Quarter hour, half hour, hour, day of month
Half hour, hour, day of week, week
Half hour, hour, day of month, month
Quarter hour, half hour, hour
Quarter hour, half hour, hour, day of week
- 3-
Page 4

TASKE Reports TASKE Call Center Management Tools Version 7.0
Monthly Pilot Interflow
Spectrum
Year by Week Pilot Interflow
Spectrum
Year by Month Pilot Interflow
Spectrum
Daily Pilot Activity Quarter hour, half hour, hour, pairs of acct codes
Weekly Pilot Activity Quarter hour, half hour, hour, day of week, pairs of acct codes
Monthly Pilot Activity Quarter hour, half hour, hour, day of month, pairs of acct codes
Year by Week Pilot Activity Half hour, hour, day of week, week, pairs of acct codes
Year by Month Pilot Activity Half hour, hour, day of month, month, pairs of acct codes
Daily Pilot Group Quarter hour, half hour, hour, pilot, DNIS, area code, area code &
Weekly Pilot Group Quarter hour, half hour, hour, day of week, pilot, DNIS, area code,
Monthly Pilot Group Quarter hour, half hour, hour, day of month, pilot, DNIS, area code,
Year by Week Pilot Group Half hour, hour, day of week, week, pilot, DNIS, area code, area
Year by Month Pilot Group Half hour, hour, day of month, month, pilot, DNIS, area code, area
Monthly Pilot Peaks Peak offered, peak answered, peak abandoned, peak interflowed
Daily Pilot Group Answer
Spectrum
Weekly Pilot Group Answer
Spectrum
Monthly Pilot Group Answer
Spectrum
Year by Week Pilot Group Answer
Spectrum
Year by Month Pilot Group Answer
Spectrum
Daily Pilot Group Abandon
Spectrum
Weekly Pilot Group Abandon
Spectrum
Monthly Pilot Group Abandon
Spectrum
Year by Week Pilot Group Abandon
Spectrum
Year by Month Pilot Group Abandon
Spectrum
Daily Pilot Group Interflow
Spectrum
Weekly Pilot Group Interflow
Spectrum
Monthly Pilot Group Interflow
Spectrum
Year by Week Pilot Group Interflow
Spectrum
Year by Month Pilot Group Interflow
Spectrum
Daily Pilot Group Activity Quarter hour, half hour, hour, pilot, pairs of acct codes
Weekly Pilot Group Activity Quarter hour, half hour, hour, day of week, pilot, pairs of acct codes
Monthly Pilot Group Activity Quarter hour, half hour, hour, day of month, pilot, pairs of acct codes
Year by Week Pilot Group Activity Half hour, hour, day of week, pilot, pairs of acct codes
Year by Month Pilot Group Activity Half hour, hour, day of month, month, pilot, pairs of acct codes
Monthly Pilot Group Peaks Peak offered, peak answered, peak abandoned, peak interflowed
Quarter hour, half hour, hour, day of month
Half hour, hour, day of week, week
Half hour, hour, day of month, month
city, state
area code & city, state
area code & city, state
code & city, state
code & city, state
Quarter hour, half hour, hour, pilot
Quarter hour, half hour, hour, day of week, pilot
Quarter hour, half hour, hour, day of month, pilot
Half hour, hour, day of week, week, pilot
Half hour, hour, day of month, month, pilot
Quarter hour, half hour, hour, pilot
Quarter hour, half hour, hour, day of week, pilot
Quarter hour, half hour, hour, day of month, pilot
Half hour, hour, day of week, week, pilot
Half hour, hour, day of month, month, pilot
Quarter hour, half hour, hour, pilot
Quarter hour, half hour, hour, day of week, pilot
Quarter hour, half hour, hour, day of month, pilot
Half hour, hour, day of week, week, pilot
Half hour, hour, day of month, month, pilot
- 4-
Page 5
TASKE Reports TASKE Call Center Management Tools Version 7.0
The TASKE Reports Interface
Overview of the Reports Window
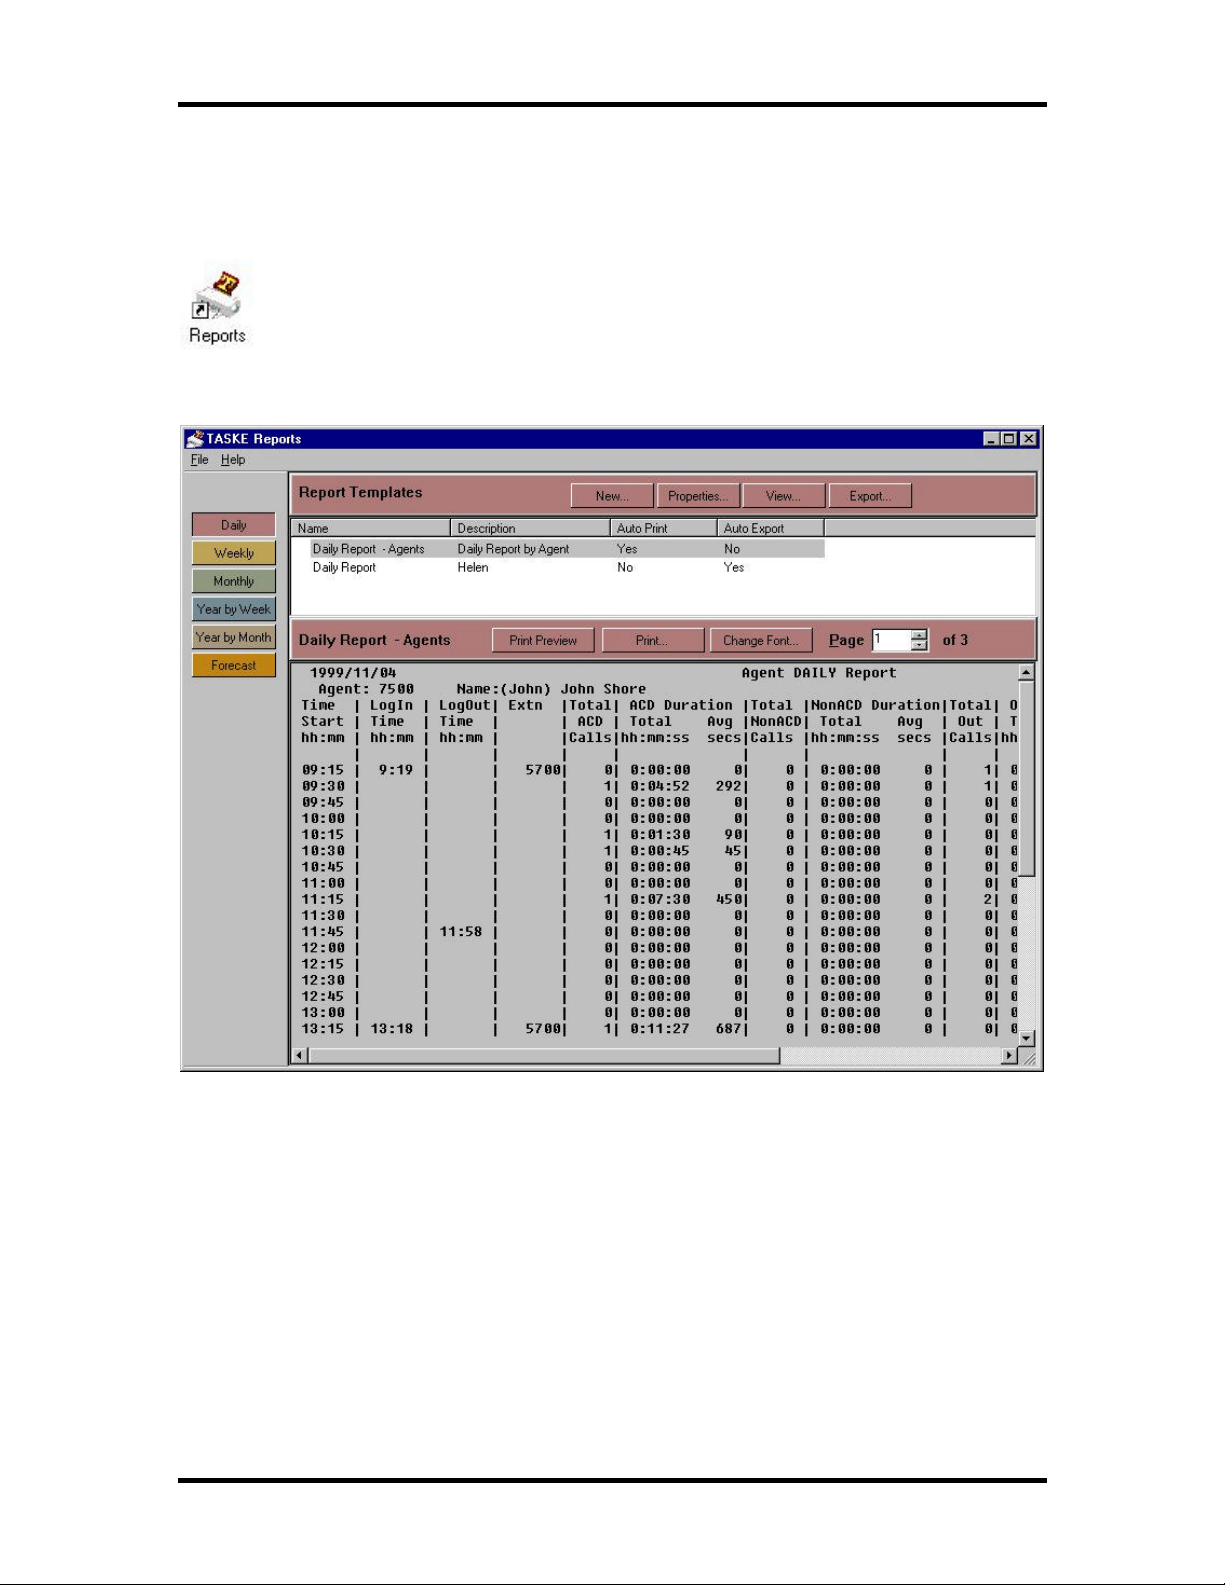
To use the TASKE Reports program, click on the Reports icon in the
TASKE ToolBox. Once the TASKE Reports program opens, three panels
are displayed: the Main Control Panel, Report Templates panel and the
Publication Viewer.
- 5-
Page 6
TASKE Reports TASKE Call Center Management Tools Version 7.0
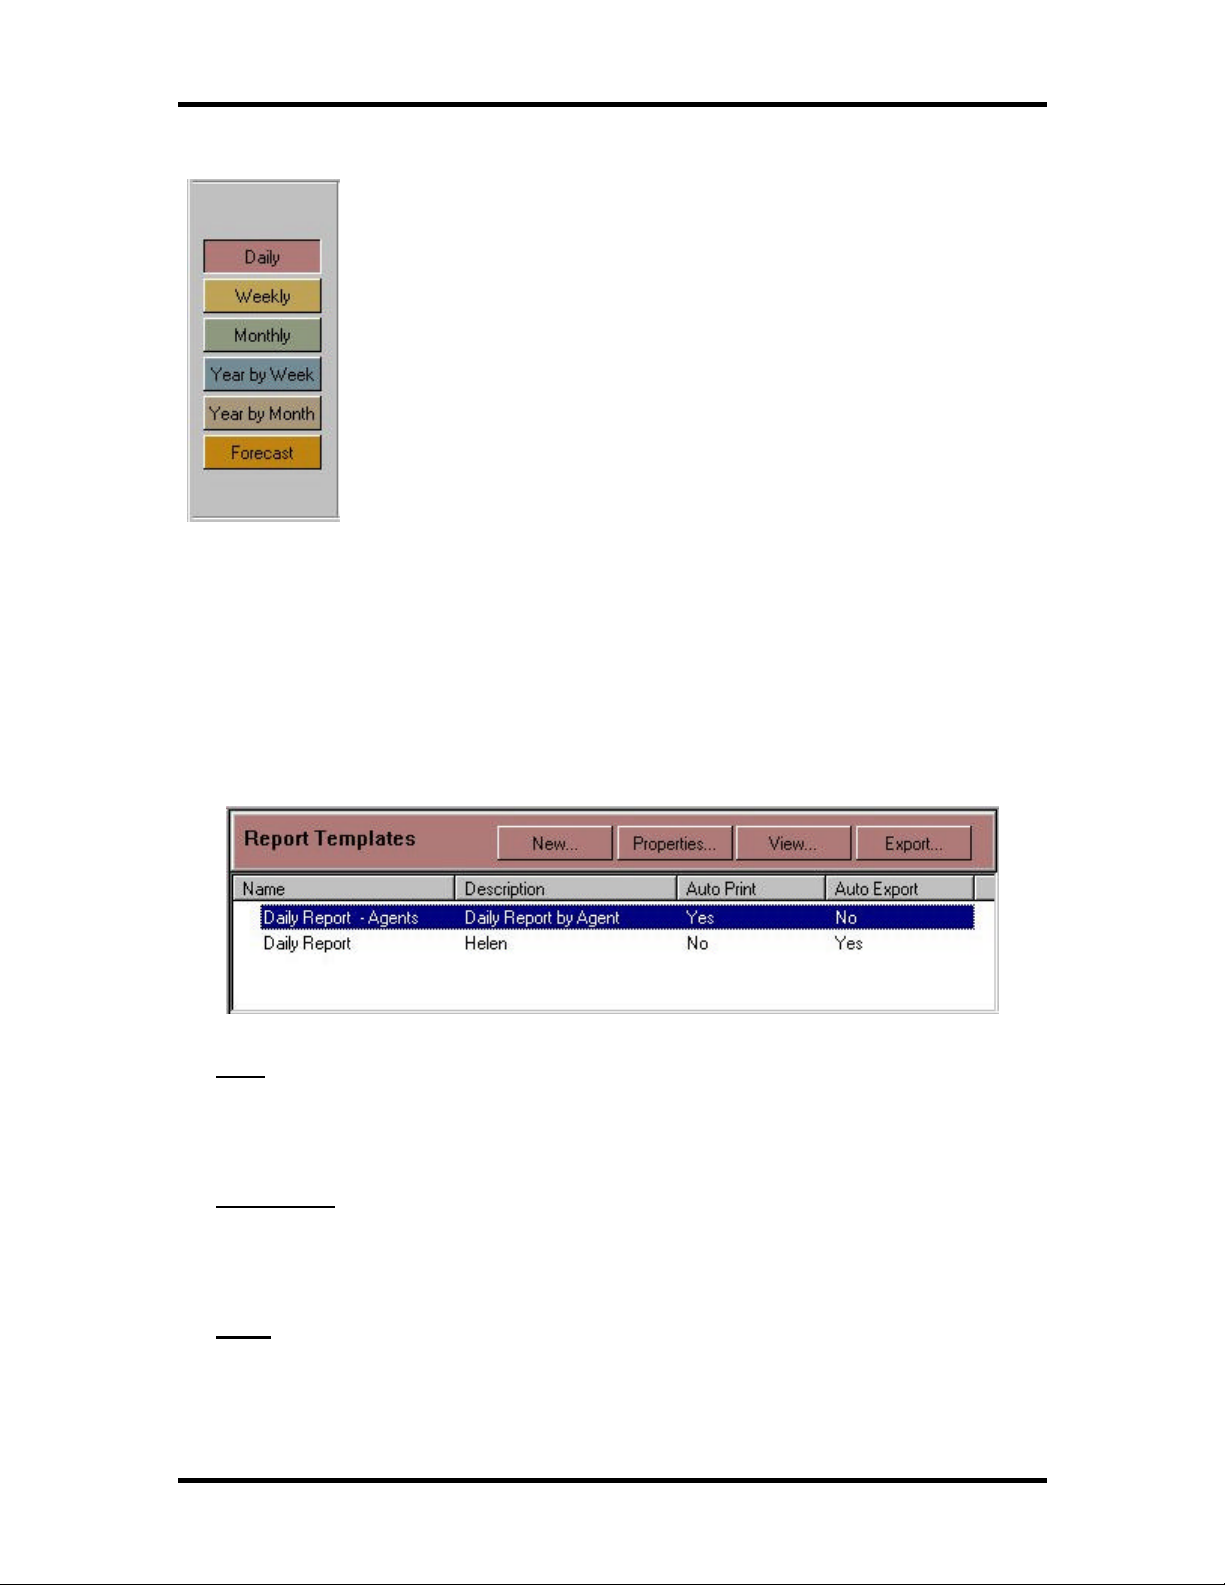
Main Control panel
In the TASKE Main Control panel of the TASKE Report
Manager, a set of buttons is displayed. The first five buttons are
for selecting a Reporting Period and include: Daily, Weekly,
Monthly, Year by Week and Year by Month. Reports can be
created for the all reporting periods. In order to create a report,
one of the reporting periods must be selected.
A report can also be created by using the Forecast button to
project future call loads. Forecasting is to ensure sufficient
resources are provided to respond to the expected call load,
within acceptable service levels.
Report Templates panel
In the Report Templates panel the Name, Description, AutoPrint and AutoExport
Settings for any saved report templates are displayed. To choose which report
templates should be displayed, first click on one of the reporting period buttons in
the Main Control panel (Daily, Weekly, Monthly, Year by Week and Year by
Month). In the Report Templates panel, you may choose to create a new
template, modify properties for existing templates or view the report results of a
template. Reports may also be set to Export for viewing in another program.
New
The New button creates a new template in the Reporting Period selected in
the Main Control panel.
Properties
The Properties button displays the Properties for a selected template in the
Report Templates panel.
View
The View button generates a report based on the selected template in the
Report Templates panel, and displays the report in the Publication Viewer
panel of the TASKE Report Manager.
- 6-
Page 7
TASKE Reports TASKE Call Center Management Tools Version 7.0
Export
The Export function generates a copy of the selected report in various data
file types. The file type is selected in the template’s Export properties. Once
a report is exported to an external file, it may be manipulated using another
tool (for example Windows Excel).
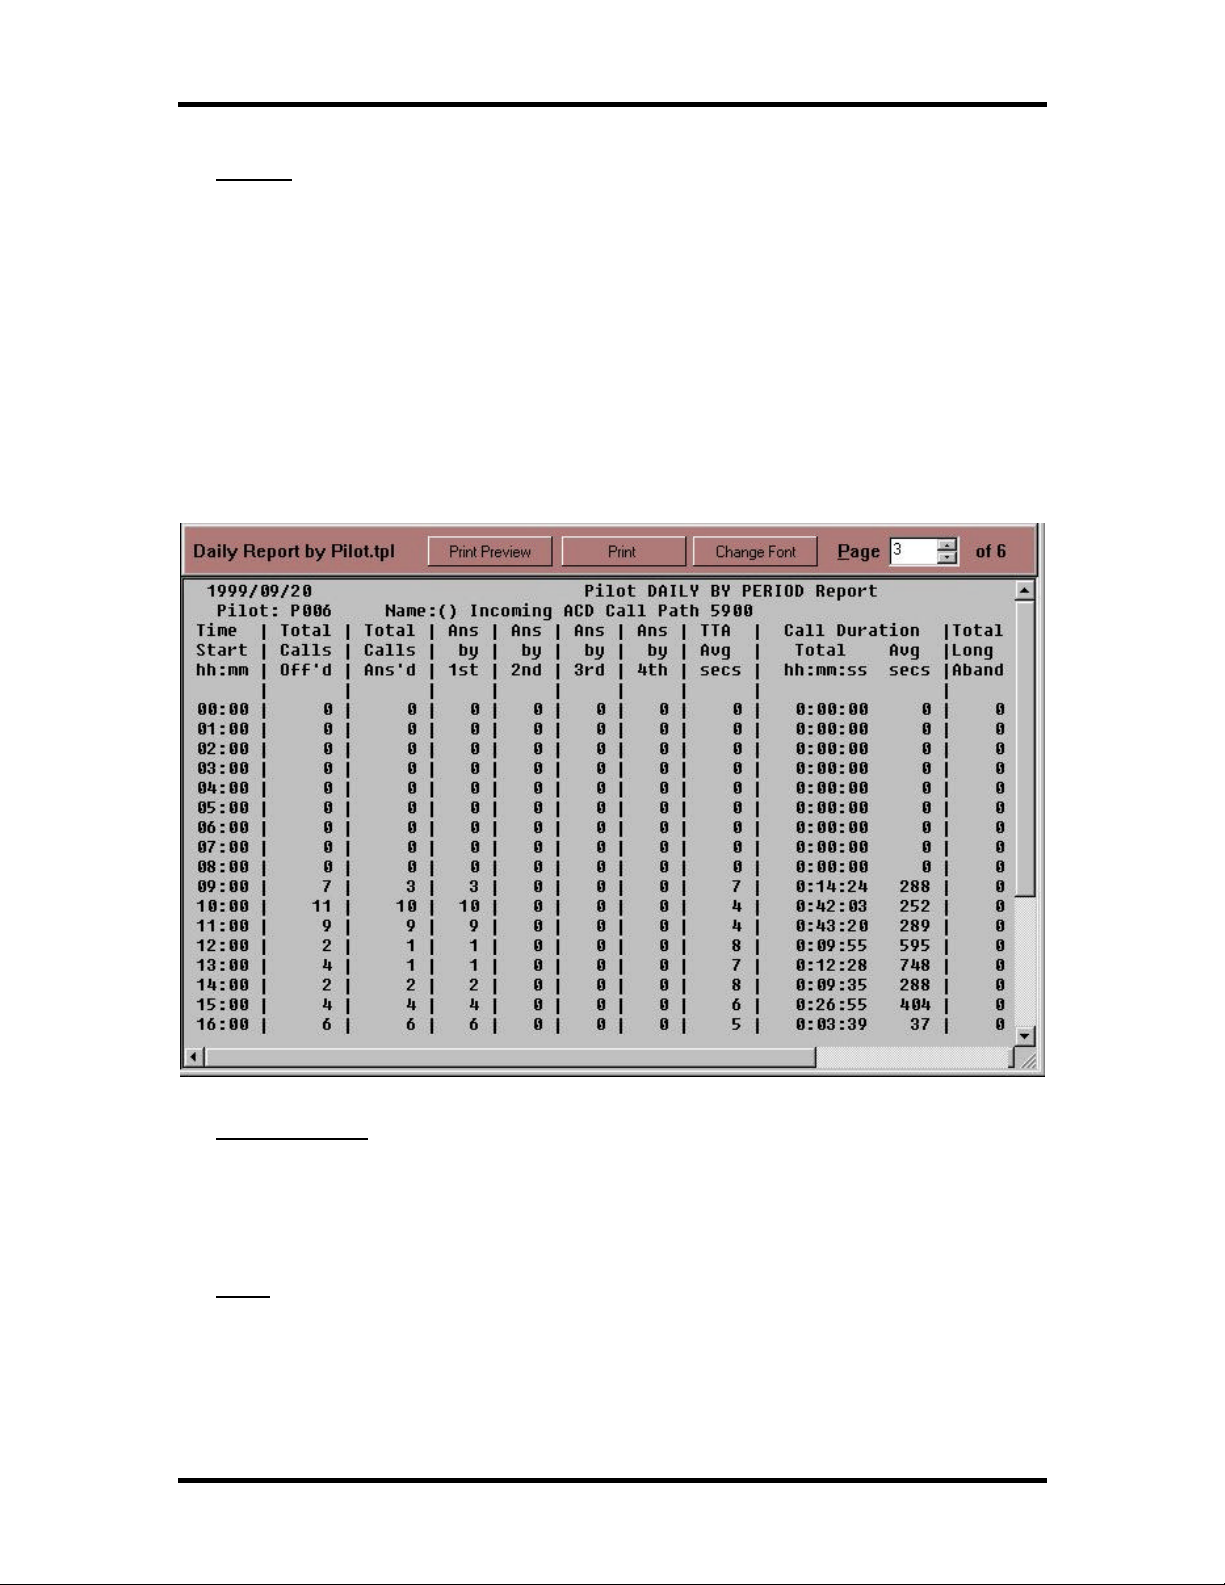
Publication Viewer panel
The Publication Viewer panel displays any report selected for viewing. To view a
report, a template must be chosen from the Report Templates panel and the
View button must be clicked. From the Publication Viewer panel, the report can
then be displayed in Print Preview, Printed, the font can be changed and the
pages can be scrolled through.
Print Preview
The Print Preview button displays the report in Windows Print Preview mode
to view how it will display when printed, and if need be, change any printer
settings to accommodate the report.
The Print button launches the Windows Print process for the report displayed
in the Publication Viewer.
- 7-
Page 8
TASKE Reports TASKE Call Center Management Tools Version 7.0
Change Font
The Change Font button allows modification of the typeface, type size and
type style of the report for better display, or for printing purposes.
Page Counter
The Page Counter permits scrolling through the pages of the generated report
and looking at the results before printing.
Note All fonts used by the Reports program are provided by the Default printer
installed on your computer, through the control panel for Windows. If a message
results that indicates no fonts are installed, this indicates that there is no default
printer installed in your Windows session.
Report Template Properties
To view the Properties of a Report Template, choose a report template in the
Report Templates panel, then click the Properties button.
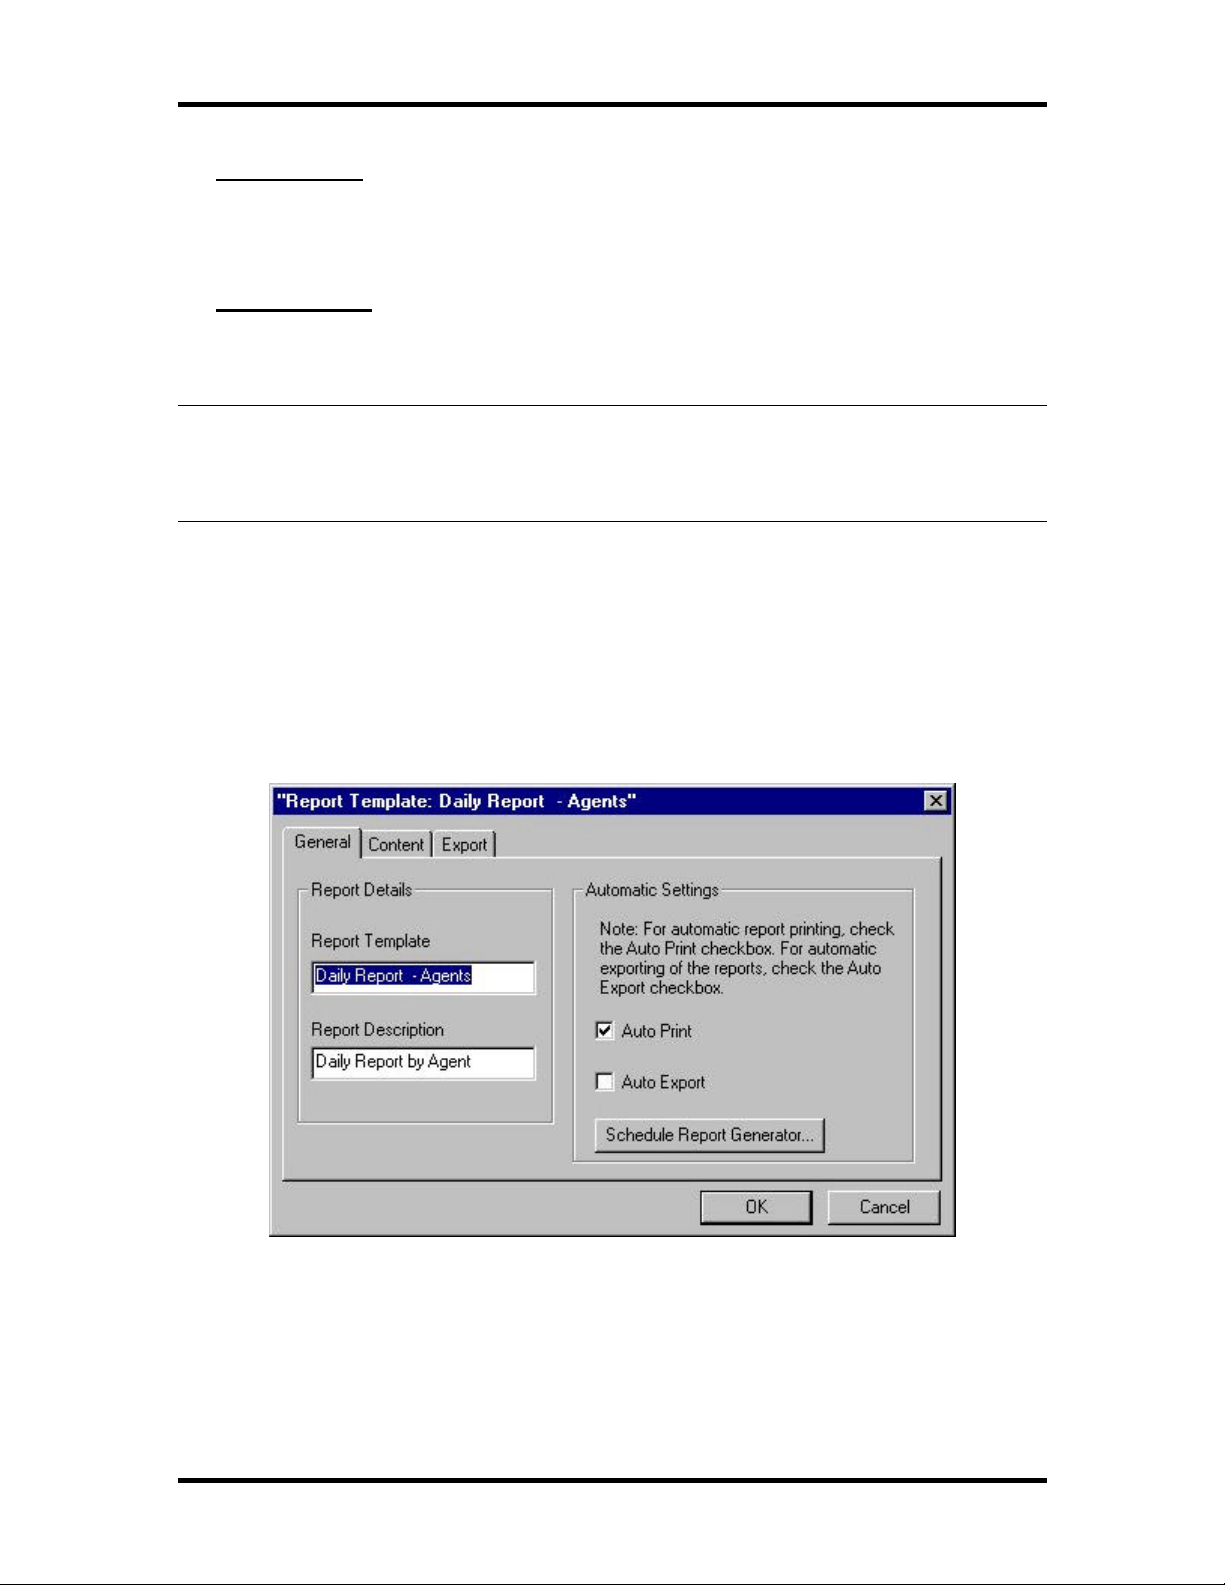
General Properties
The General tab of the Properties dialog box displays the general properties of a
selected report template. These Properties include:
- 8-
Page 9

TASKE Reports TASKE Call Center Management Tools Version 7.0
Report Template
A name given to the report template for reference purposes. The name is
mandatory, and is displayed in the list of templates.
Report Description
A description given to the report template for reference purposes. The
description is not mandatory, and is used for reference purposes only.
Auto Print
The Auto Print option is used to designate the report be generated and
automatically printed at the scheduled date and time, rather than generated
and then displayed for approval.
Auto Export
The Auto Export option is used to designate the report be generated and
automatically exported to a file at the scheduled date and time, rather than
generated and then displayed for approval.
Time Period
The Time Period function is only enabled for year long reports (Year by Week
and Year by Month) that might require a variable time period.
Tip To examine the Properties of a report template, double-click on the report
template in the Report Templates panel.
Report Template Contents
To view the Contents Properties of a report template, choose a report template in
the Report Templates panel, then click the Report Template button Properties.
Choose the Contents tab of the Properties dialog box, and the content properties
of the selected report template are displayed.
- 9-
Page 10

TASKE Reports TASKE Call Center Management Tools Version 7.0
These Properties include:
Resource
There are 17 different Resource Settings. Each Resource setting in the drop
down list represents one of the resources that statistics are being captured for
in the TASKE Database. Choosing a resource setting determines the
resource content of your report.
The different resources available for reports are listed below.
Trunk Extension
Extension Group Agent
Agent Group Pilot
Pilot Answer Spectrum Pilot Abandon Spectrum
Pilot Interflow Spectrum Pilot Activity
Pilot Group Pilot Peaks
Pilot Group Answer Spectrum Pilot Group Abandon Spectrum
Pilot Group Interflow Spectrum Pilot Group Activity
Pilot Group Peaks
Report Options
Different options for the interval(s) criteria of the report are displayed once a
resource is chosen. Each resource has from 1-7 options for the interval the
report represents. The options are listed below.
Quarter-Hour Half-Hour
Hour Day of Week
Week Day of Month
Month By Extension
- 10-
Page 11

TASKE Reports TASKE Call Center Management Tools Version 7.0
By Group By Agent
By Pilot DNIS
Area Code Area Code & City
State Account Codes
Display area
The Display Area of the Contents tab shows any resources available for a
report, and all of the available Interval Options. If any of the options have
been selected for the current template, they appear with a red checkmark
beside them in the Display Area. To select an interval option, (i.e. report by
half-hour intervals) click in the interval column beside the desired resource.
Tip To select Interval Options for any specific resource ID, you can select the ID,
and then click on the Interval Buttons above the Display Area to select Interval
settings for the report.
Report Template Export Properties
To view the Export Properties of a report template, choose a report template in
the Report Templates panel, then click the Report Template button Properties.
Choose the Export tab of the Properties dialog box, and the export properties of
the selected report template is displayed.
- 11-
Page 12

TASKE Reports TASKE Call Center Management Tools Version 7.0
These Properties include:
Export Format
A report may be exported from the TASKE Reports program to any of 22
different file types. A file type must be chosen to determine the format of your
report.
The different file types available for export are:
Print Image Ascii
Lotus 123 1A Lotus 123 2.0
Symphony 1.0 Symphony 1.1
Quattro dBase II
dBase III Microsoft Excel 2.1
Comma Separated Variable dBase IV
Tab Separated Variable Quattro Pro
Clarion Lotus 123 3.0
Word processing text Microsoft Excel 3.0
Microsoft Excel 4.0 Lotus 123 4.0
Quattro Pro 5.0 for Windows HTML Table
Time Format
The different options for the Time Format criteria of the report determine the
display of data in the selected report.
Export Path
The Export Path determines the location of the output file that the Reports
program generates for the selected template. Clicking on the Browse button
allows the choice of a directory for files to be exported to, or the export
directory location may be entered directly in the Export Path field.
- 12-
Page 13

TASKE Reports TASKE Call Center Management Tools Version 7.0
Generating Reports
Creating a Report template
A report template can be created and saved for any type of report the TASKE
Reports program generates to extract data collected in the TASKE Database.
The template specifies the Time Period (Daily, Weekly, Monthly, Year by Week,
and Year by Month) the report is to cover, Interval criteria (quarter hour, half
hour, hour, day of week, week, day of month, month) and specific resource(s) for
the report data to reflect.
In the TASKE Main Control panel:
1. Click the button corresponding to the desired report period. Options are for
Daily, Weekly, Monthly, Year by Week, and Year by Month reports.
In the Report Templates panel:
2. Click the New button and select the blank report template that appears in
the Reports Templates list.
3. Click Properties.
On the General tab:
4. Enter a Report Description if appropriate.
5. Enable the Auto Print check box to print the report automatically when it is
generated. Enable the Auto Export check box to export the report to a file
automatically when it is generated.
6. If it is a Year by Week or a Year by Month report, select the number of
weeks or months for the Time Period.
On the Content tab:
7. Select a resource from the drop down resource list.
In the Display area:
8. Select each of the listed resources for the report to use and enable one or
more Report Options for that resource.
For example:
• A Daily Trunk report can report by quarter hour, half hour or hour.
• A Weekly Trunk report can report by quarter hour, half hour, hour or
day of week.
- 13-
Page 14

TASKE Reports TASKE Call Center Management Tools Version 7.0
• A Monthly Trunk report can report by quarter hour, half hour, hour
or day of month.
• A Year by Week Trunk report can report by half-hour, hour, day of
week or week.
• A Year by Month Trunk report can report by half-hour, hour, day of
month or month.
9. Choose OK to close the Properties dialog box when all settings are made.
10. Ensure the report template is highlighted in the list of Templates, and then
click the View button in the Report Templates panel.
11. Choose the day, week or month the data in the report should reflect from
the dialog box that pops up. The report appears in the Publication Viewer.
The report may now be looked at in the viewer and/or printed.
Tip: To name the report template, right-click on the template listing in the Report
Templates list, and select Rename.
Generating a report from an existing template
If a report template has already been created specifying the characteristics of a
desired report, the following steps must be followed to generate a report:
1. Choose the appropriate Reporting Period button from the list of buttons in
the Main Control panel of the Report Manager.
2. Choose the report template desired from the list of available templates.
3. Click the View button to see the report in the Publication Viewer.
4. A calendar is displayed, confirming the reporting period for the report.
Click OK to select the default time period, or use the <<, <, >,>> buttons to
change the reporting period. In some cases click on the desired date(s).
5. Once the time period for the report is selected, click the OK button.
6. Once the report has been generated, optionally change the font for the
report by choosing the Change Font button. The Change Font button
allows changing the typeface, type size and type style of the report for
better display, or for printing purposes.
- 14-
Page 15

TASKE Reports TASKE Call Center Management Tools Version 7.0
7. Scroll through the different pages of the report on screen by changing the
page number in the Page Selector in the Publication Viewer panel.
8. To print the report, choose the Print button from the Publication Viewer
panel. To preview the printing, choose the Print Preview button.
Note If the option Auto Print is selected in the Properties of the selected report
template, the report automatically prints when it is generated, without waiting for
any user input.
Exporting a Report
If a report template has already been created specifying the characteristics of a
desired report, the following steps must be followed to export a report:
In the Main Control panel:
1. Click the button corresponding to the desired report period.
In the Report Templates panel:
2. Select the report template that appears in the Reports Templates list to
export.
3. Click Properties.
On the Export tab:
4. Choose an Export Format (file type) for the report.
5. Choose a Time Format to determine the display of data in the selected
report.
6. Enter an Export Path to determine the location of the output file the
Reports program generates for the selected template. Clicking on the
Browse button allows choosing a directory for files to be exported to, or
the export directory location may be entered directly in the Export Path
field.
7. Choose OK to close the Properties dialog box when all of the export
settings are completed.
8. Ensure the report template is highlighted in the list of templates, and then
click the Export button in the Report Templates panel to generate a report
based on the selected template.
9. Choose the day, week or month the data in the report should reflect from
the dialog box that pops up. The exported report file is available in the
- 15-
Page 16

TASKE Reports TASKE Call Center Management Tools Version 7.0
directory specified in the Export Path property for the selected report
Template.
Note Once the export properties are set for a template, they do not have to be
redone every time the report is exported. They are saved with the Export
Properties and may be changed as needed.
Creating a Forecast Report template
A Forecast report is a report the TASKE Reports program generates using a
template to pull data collected in the TASKE Database. The process of
estimating projected traffic levels, or call loads on the Queue is termed
Forecasting. Forecasted data can then be used to estimate the number of Agents
and other resources (such as Pilots) needed to meet the forecast call load, and
identify which specific Agents will work which shifts (i.e. scheduling).
The template specifies if the report is to reflect data about Pilots or Pilot Groups,
Forecasting Parameters (Resolution, Size, From Time, To Time, TSF %, TSF
Time (secs) and Wrapup Time (secs) ) and the specific date(s) for the report data
to reflect.
In the Main Control panel:
1. Click the Forecast button.
In the Report Templates panel:
2. Click the New button and select the blank report template that appears in
the Reports Templates list.
3. Click the Properties button.
On the General tab:
- 16-
Page 17

TASKE Reports TASKE Call Center Management Tools Version 7.0
4. Enter a name and description for the Forecast Template.
On the Pilot/Pilot Groups tab:
5. Click the button for Pilot or Pilot Group.
6. In the Display area, select each of the listed Pilots or Pilot Groups to be
included in the report and enable one or more Report Options for that
Agent.
7. The Selection option marks the Pilot or Pilot Group for inclusion in the
Forecast report. If the Selection option is not checked, the Pilot is not
included in the report. Mark the Pilot(s) or Pilot Group(s) to be selected
for the Forecast report by clicking their Selection checkboxes.
The Interflows option designates that any interflowed calls be counted as
1 call, rather than multiple calls for multiple Pilots.
For example, with the Interflows option unchecked, when a forecast report
is generated, if 10 calls entered a telephone queue and 8 were answered
immediately by the selected Agent Group and 2 were interflowed to
another queue, eventually getting returning to and getting answered by the
first Agent Group, the 10 calls would be counted when they entered the
system, plus the 2 calls would be counted when they were answered after
being Interflowed. This creates a total of 12 calls counted in the Forecast
report.
If the Interflow option is selected, the Forecast report would count the 8
calls answered on their first attempt and the 2 interflowed calls as
- 17-
Page 18

TASKE Reports TASKE Call Center Management Tools Version 7.0
answered on their second attempt, making a total of 10 calls counted in
the Forecast report.
8. Mark which Pilot(s) or Pilot Group(s) are to have interflowed calls counted
by choosing their Interflows checkboxes.
On the Forecasting Parameters tab:
9. Set the Forecasting Parameters that the TASKE Reports program applies
to the selected data to create a forecast.
The Resolution option is to select a quarter hour, half hour or one
hour as the interval to be used by the Forecast report in calculating
and reporting the results for the numbers of calls, the numbers of
Agents and the average Talk Time. The default is Half-Hour.
The Size option is to specify whether the Forecast report is to be
run for one (or more) days or one (or more) weeks. The default is
One Day.
The Forecasting report is divided into quarter hour, half-hour or one
hour intervals for each day. To avoid cluttering the reports with
entries that correspond to after business hours, the times of the day
can be set to be included in the Forecast reports. The From Time
option determines the start time for intervals to be included in the
reports. The default for the From Time is 9:00. The To Time option
determines the end time for intervals included in the reports. The
default for the To Time option is 17:00.
- 18-
Page 19

TASKE Reports TASKE Call Center Management Tools Version 7.0
The TSF (%) option is to set the TSF % factor to be used for
Forecast report calculations. The default is 80%, but is adjustable in
1% increments from 1% to 100%. The Telephone Service Factor
(or TSF) is the ratio of calls either Answered or Abandoned before
a threshold time, to (divided by) the total number of calls offered.
The TSF Time (secs) option is to set the threshold time for the TSF
factor to be used for Forecast report calculations. The default is 20
seconds, but can be increased up to 100 seconds in one second
increments.
The Wrapup Time (secs) option is to set up a Wrap Up Time, or
Work Time. This is a factor added to the call time for Agents to
complete paperwork after the Caller disconnects. The default is 0
seconds, but can be adjusted up to 100 seconds in one-second
increments.
On the Selected Dates tab:
10. Set the dates that the TASKE Reports program will use for Forecast
reports. If One Day is the Forecast size in the Forecasting Parameters tab,
then there is the option to choose individual days for the Forecast report. If
- 19-
Page 20

TASKE Reports TASKE Call Center Management Tools Version 7.0
One Week is the Forecast size in the Forecasting Parameters tab, then
there is the option to choose weeks for the Forecast report.
11. Choose OK to close the Properties dialog box when all settings are
completed.
12. Ensure the Forecast report template is highlighted in the list of templates,
and then click the View button in the Report Templates panel. The
Forecast report is displayed in the Publication Viewer. The report may now
be looked at in the viewer or printed.
Scheduling Reports for Printing
Daily, Weekly, and Monthly, Year by Week and Year by Month Reports may be
scheduled for automated printing at specified dates and times in the Reports
program.
In the Main Control panel:
1. Click the button corresponding to the desired report period.
In the Report Templates panel:
2. Select the report template that appears in the Reports Templates list to set
scheduled printing for.
3. Click the Properties button.
On the General tab:
4. Click the Auto Print button to mark the report as selected for Auto Printing.
5. Click the Schedule Report Generator … button.
- 20-
Page 21

TASKE Reports TASKE Call Center Management Tools Version 7.0
On the Schedule Report Generator window
6. Click on the Automatically run Report Generator checkbox.
7. Click on the checkboxes beside the days of the week that reports are to
be generated and printed for automatically. Any checkboxes with ‘x’’s are
selected and reports will be generated on those days.
8. Choose the time of day for the report to be generated and printed from the
drop down list of times at the top right of the window.
9. If you are using Windows NT, click on the Set password button at the
bottom of the window. If you are not using Windows NT, you will not see
this option.
On the Set Password Window
Set the password for network login. This is so that a computer not logged
in to the network at night, may still print the scheduled reports at the
selected times by logging itself into the network. The User Account and
Password must be correct in order for this to work properly.
10. When all of your Report Generator settings are complete, click on the OK
button.
- 21-
Page 22

TASKE Reports TASKE Call Center Management Tools Version 7.0
Scheduling Reports for Exporting
Daily, Weekly, and Monthly, Year by Week and Year by Month Reports may be
scheduled for automated exporting at specified dates and times in the Reports
program.
In the Main Control panel:
1. Click the button corresponding to the desired report period.
In the Report Templates panel:
2. Select the report template that appears in the Reports Templates list to set
scheduled exporting for.
3. Click the Properties button.
On the General tab:
4. Click the Auto Export button to mark the report as selected for Auto
Exporting.
5. Click the Schedule Report Generator … button.
On the Schedule Report Generator window
6. Click on the Automatically run Report Generator checkbox.
7. Click on the checkboxes beside the days of the week that reports are to
be generated and exported automatically. Any checkboxes with ‘x’’s are
selected and reports will be generated on those days.
- 22-
Page 23

TASKE Reports TASKE Call Center Management Tools Version 7.0
8. Choose the time of day for the report to be generated and exported from
the drop down list of times at the top right of the window.
9. If you are using Windows NT, click on the Set password button at the
bottom of the window. If you are not using Windows NT, you will not see
this option.
On the Set Password Window
Set the password for network login. This is so that a computer not logged
in to the network at night, may still export the scheduled reports at the
selected times by logging itself into the network. The User Account and
Password must be correct in order for this to work properly.
10. When all of your Report Generator settings are complete, click on the OK
button.
- 23-
Page 24

TASKE Reports TASKE Call Center Management Tools Version 7.0
Analyzing Reports
Reports by Reporting Period
Daily
Daily reports are used to monitor the operations of a Call Center on a daily
basis. The Load Activity data from the Daily reports of previous months or
years might be used to forecast the call demand expected on a specific day of
the year, such as Boxing day. For example, the level of Load Activity shown
in last year's Daily report for September 9th might be a good indication of the
level of Load Activity expected on September 9th of the current year.
The statistics for each day typically cover an entire 24-hour time span, but
may be truncated if the report option to limit the reporting hours of the day to
the preferred definition of a Business Day is activated. This can be set in the
TTBXSRVR.INI file (with any text editor) with the settings of StartPeriod and
EndPeriod.
Daily reports have three (3) report interval options: 15 minutes, half hour and
hour.
Weekly
Weekly reports are used to monitor the operations of a Call Center on a
weekly basis. If the Load Activity for a Call Center is not expected to vary
much between the days of the week but is expected to vary from week to
week, then use the Weekly reports for forecasting purposes. This is less time
consuming than viewing Daily reports since the data is reviewed a week at a
time rather than a day at a time.
Weekly reports represent a report period of seven (7) consecutive days. The
statistics for each day of the week typically cover an entire 24-hour time span
unless the daily reports have been truncated to fewer hours.
Weekly reports have four (4) report interval options: 15 minutes, half hour,
hour and day of the week.
- 24-
Page 25

TASKE Reports TASKE Call Center Management Tools Version 7.0
Monthly
Monthly reports may be used to compare this month's performance and call
handling productivity with a previous month's performance. Monthly reports
may also be used for budget planning purposes. For example, to examine the
seasonal Load Activity levels that pertain to term hiring, Monthly reports
provide the Load Activity data in a manageable number of reports, rather than
31 Daily reports or 4 Weekly reports.
Monthly reports represent a report period of up to 31 consecutive days,
representing an entire calendar month. The statistics for each day of the
month typically cover an entire 24-hour time span unless the daily reports
have been truncated to fewer hours.
Monthly reports have four (4) report interval options: 15 minutes, half hour,
hour and day of the month.
Year By Week
Year By Week reports may be used to compare this year's performance and
call handling productivity by week with a previous year. The Year By Week
reports enable performance and Load Activity for a relatively long period of
time to be reviewed in one report.
Year By Week reports can be generated for a minimum period of 1 week to a
maximum period of 52 consecutive weeks, representing an entire calendar
year, divided by week. The statistics for each day of the year that forms the
Weekly report that is used by the Year By Week report typically covers an
entire 24 hour time span unless the daily reports have been truncated to
fewer hours.
Year By Week reports have four (4) report interval options: half hour, hour,
day of the week and week.
Year By Month
Year By Month reports may be used to compare this year's performance and
call handling productivity by month with a previous year. The Year By Month
reports enable performance and Load Activity for a relatively long period of
time to be reviewed in one report.
Year By Month reports can be generated for a minimum period of 1 month to
a maximum period of 24 consecutive months, representing 2 entire calendar
years, divided by month. The statistics for each day of the year that forms the
Monthly report that is used by the Year By Month report typically covers an
entire 24 hour time span unless the daily reports have been truncated to
fewer hours.
- 25-
Page 26

TASKE Reports TASKE Call Center Management Tools Version 7.0
Year By Month reports have four (4) report interval options: half hour, hour,
day of the week and week.
Report by Resource
Reports are produced for the following elements of the ACD Call Center.
Trunks
The available reports include:
• Individual Trunk and Trunk Group Reports.
The information in Trunk Reports is used to assess the performance of
Trunks and Trunk Groups, and to answer questions such as: Are there
enough Trunks? Are there too many Trunks? Are there any faulty Trunks?
Trunk Reports show: the number of calls the Trunks carry; the percentage of
time the Trunks are engaged in calls or are idle; the highest number of Trunks
used in each interval; and the number of short calls the Trunks receive in a
given reporting period. The pattern of Trunk utilization indicates if there are
too few or too many Trunks. If there are too many Trunks, the Call Center's
costs are unnecessarily high. If there are too few Trunks, the Call Center
loses calls because Callers may be blocked and given a busy signal.
Trunk Group Reports indicate the highest number of Trunks in use during an
interval. If all of the available Trunks are frequently in use, then there may be
too few Trunks for the load. If the data indicates the highest number of
Trunks in use is a relatively small proportion of the total Trunks available, this
suggests there are too many Trunks.
Trunk Reports also indicate how many short calls occur; in short calls, the call
is dropped almost as soon as it is received by a Trunk. A large number of
short calls on a Trunk indicates the Trunk may be faulty.
Extensions
The available reports include:
• Individual Extension, and Extension Group Reports.
Extension Reports provide an indication of the call activity on a given
Extension or Extension Group over a given reporting period. In an ACD Call
Center, where a number of Agents use different Extensions across different
work shifts, these Reports provide a complete view of the call Answering
performance of the Center in one report. Extension Reports show the Load
Activity when there is no Agent logged in to the Extension. Agent Reports are
- 26-
Page 27

TASKE Reports TASKE Call Center Management Tools Version 7.0
produced for periods when there is an ACD Agent logged in. Additionally,
Extensions may support NonACD elements of the system, enabling their
performance and use to be monitored.
Extension Reports show the amount of time Extensions are engaged in: ACD
calls, inbound NonACD calls, and outbound calls. Extension Reports also
show the number of Abandoned and transferred calls, and cumulative
statistics on Extensions across work shifts. This kind of information helps the
Supervisor monitor and assess the productivity and performance of the
Agents who use a given Extension.
Agent Reports show the states of an Agent while they are logged in.
Extension Reports enable the Supervisor to monitor the Load Activity of
Agents. Additionally, Extension Reports indicate activity on NonACD
Extensions, and provide access ports to devices such as the Voice Mail
system. Extension Reports allow monitoring of the Voice Mail system; the
usage information is used to estimate the number of ports required for the
Voice Mail system.
This information provides a view of the activities and performance of the
Extensions serving various departments, such as the Sales Department, or
the Customer Service Department.
Agents
The available reports include:
• Individual Agent and Agent Group Reports.
Agent Reports indicate the call activity of Agents and Agent Groups. Agent
Reports show various parameters used to monitor activity and performance;
these Reports indicate the amount of time an Agent spends on ACD calls, on
inbound NonACD calls and on outgoing calls. The Reports also show how
much time an Agent spends in Do Not Disturb and Make Busy, and the
duration of time an Agent is logged in.
This kind of information helps the Supervisor monitor and assess Agent and
Agent Group productivity and performance, and to answer questions such as:
Are there enough Agents to meet the Call Load? Are there too many Agents?
Are Agents spending too long in Do Not Disturb or Make Busy?
Pilot and Pilot Groups
The following reports are available.
• Individual Pilot Performance Reports
• Pilot Group Performance Reports
• Pilot Time To Answer Reports
- 27-
Page 28

TASKE Reports TASKE Call Center Management Tools Version 7.0
• Pilot Time To Abandon Reports
• Pilot Time To Interflow Reports
• Pilot Call Activity Reports
• Pilot Peak Period Reports (for Monthly Reports only)
Pilot Performance Reports are the primary means of examining the Caller's
perception of service; Pilot Reports provide statistical information on
performance from the point at which the Call enters the system.
The Pilot Time-To-Answer, Time-To-Abandon and Time-To-Interflow Reports
provide a detailed spectrum analysis by time band (0 to 10 seconds, 10 to 20
seconds) of how long it takes for calls to be Answered, Abandoned or
Interflowed. Service targets may then be adjusted based on this information.
For example, an organization may be losing customers because many Callers
Abandon at about 40 seconds, while the current service target is 90% of calls
Answered within 60 seconds. The organization may decide it is worth the
additional cost of more Agents and Trunks to meet a performance target of
90% of calls Answered within 40 seconds.
The Pilot Peak Period Reports identify the periods of peak Load Activity, and
derive statistics on the activity that occurs during these periods. This
information may be used for forecasting and scheduling purposes.
Reports by Load Activity
The Reports by Load Activity indicate the Load Activity in a Call Center for
various types of calls. These Reports indicate for the reporting period: the
number of calls received or made, the percentage of total time the calls take, the
number of calls Answered, Abandoned, or Interflowed, and the time it takes for
calls to be Answered or Abandoned.
Abandoned Calls
The number of Abandoned calls compared to total calls is a key parameter. If
the number of Abandoned calls is high, the Call Center's service level targets
may need to be revised. To improve the service levels requires that the
number of Agents be increased; it is possible that additional training and/or
guidelines may also be appropriate. The Supervisor can review the
Abandoned call profile throughout a work shift to identify any time when the
number of Abandons is high. The Load and the number of Trunks and
Agents available during these windows can be reviewed.
Average Time to Answer
The average time to answer is also a key parameter in accessing Call Center
performance. The Supervisor can review the average time to answer (or
- 28-
Page 29

TASKE Reports TASKE Call Center Management Tools Version 7.0
average speed of answer). If the average time to answer value is consistently
large, this indicates that service levels are not being met.
Call Usage Statistics
Call usage statistics and the numbers of different types of calls, such as
inbound and outbound calls, are used to perform traffic engineering. These
statistics are used to estimate the number of Trunks and Agents required to
meet the Call Center's service level targets.
Interflows
The statistics for Interflows may be used by the Supervisor to identify the
number of calls re-directed out of the Queue. If the number of calls is large, it
is possible there are too few Agents to handle the Call Load.
Average Duration of Calls
The statistics for the average duration of calls can be used to determine how
much time an Agent requires to handle a call. This information may be an
indication to the Supervisor that additional training or guidelines are needed
to ensure Agents handle calls efficiently. Reducing the average call handling
time can significantly increase the throughput of calls handled by the Queue,
and thus reduce costs.
Reports by Queue Activity
Queue activity Reports (Pilot and Pilot Group Reports) primarily show the service
level experienced by Callers; they indicate the percentage of calls Answered or
Abandoned before the target threshold time. Where a Call Center is failing to
meet its targeted service levels, Queue Activity Reports assist in identifying the
problem.
- 29-
Page 30

TASKE Reports TASKE Call Center Management Tools Version 7.0
Forecasting Reports
Within a Call Center, if there are more Agents than calls needing to be answered
then the Agents are idle for part of the time and costs are increased. In most
cases, the Queue is designed so that the number of Agents available at any
given time is less than the number of incoming calls. This places an upper limit
on the number of Agents required for a Call Center.
If there are more calls than can be answered by the Agents, then Callers must be
kept waiting for an Agent to become free. The length of time a Caller waits
depends on how many calls there are compared to the number of available
Agents. Callers only wait so long before Abandoning a call; sufficient Agents
must be available for service to be acceptable.
In between these upper and lower limits there is a balance where a given number
of Agents provide satisfactory service at minimal cost. The objective of Call
Center management is to achieve a good balance.
The balance between economy and service is the crux of the operation of the
Call Center, and produces very significant problems. The first of these is to
predict how many calls can be expected over a given period of time (of an hour,
a work shift or a day, for example). As telephone traffic (or the total number of
calls made and the total duration of these) is highly variable in nature, it is very
difficult to predict. The only practical means of obtaining a reasonable estimate is
to perform a historical analysis of past experience and use this to predict future
traffic volumes and patterns.
The process of estimating projected traffic levels, or call loads on the Queue is
termed Forecasting. Forecasted data can then be used to estimate the number of
Agents and other resources (such as Pilots) needed to meet the forecast call
load, and identify which specific Agents will work which shifts (i.e. scheduling).
Help on TASKE Reports
Selecting the Help menu enables access to basic instruction on commands, and
on available on-line options.
1. Select Help:Contents to open the Help files for the Reports program. This
will display a list of subject areas for which online help is available.
2. Select Help:About TASKE Reports... to obtain information on the current
TASKE Reports software version.
- 30-
 Loading...