

Page 1

Intel Express 10/100
Stackable Hub
Management Module
User Guide
Page 2

This guide covers the following product:
Intel Express 10/100 Stackable Hub - Management Module. Product code EE110MM.
The Management Module supports the following products:
Intel Express 10/100 Stackable Hub - 12-port TX hub. Product code EE110TX12.
Intel Express 10/100 Stackable Hub - 24-port TX hub. Product code EE110TX24.
Copyright © 1997, Intel Corporation. All rights reserved.
Intel Corporation, 5200 NE Elam Young Parkway, Hillsboro OR 97124-6497
Intel Corporation assumes no responsibility for errors or omissions in this manual. Nor does Intel make any commitment to
update the information contained herein.
* Other product and corporate names may be trademarks of other companies and are used only for explanation and to the
owners’ benefit, without intent to infringe.
First edition July 1997 669884-001
Page 3

Quick Start
1. Turn off the power. Unscrew and remove the panel from an expansion slot
on the Express 10/100 Stackable Hub.
Expansion slots: Use either slot. They are
identical.
123
4
5
6
7
8
91011
12
Green (left)
Link = solid
Activity = blink
Amber (right)
Wrong speed = blink
Disabled = solid
Intel Express
10/100 Stackable Hub
Change hub speed
10BASE-T
100BASE-TX
Collision
Managed
Status
Power
2. Plug the Management Module into a slot, using the retaining screws to secure
the module to the hub.
123
4
5
6
7
8
91011
12
Green (left)
Link = solid
Activity = blink
Am
ber (right)
W
rong speed = blink
Disabled = solid
Intel Express
10/100 Stackable Hub
Change hub speed
10BASE-T
100BASE-TX
Collision
Managed
Management Module
Status
Power
Hub speed: Install in a hub running at 100
Mbps or at 10 Mbps. It will manage all hubs in
the stack, regardless of speed, if they’re
connected with Intel Cascade Cables.
Turn on the power after installing.
3. Set the IP configuration (none is assigned by default). You’re now ready to
manage hubs.
Management Module
Esc
Reset ➜
Use the LCD to quickly set the IP configuration.
1
Page 4

Contents
Chapter 1 Overview of Hub Management 5
Managing multiple hubs.................................................................................................................... 6
Hub numbering.................................................................................................................................. 6
Collision domain assignments........................................................................................................... 7
MIB identification .............................................................................................................................7
Chapter 2 Using the LCD 9
Navigating ......................................................................................................................................... 9
Changing the LCD contrast............................................................................................................. 10
Viewing statistics ............................................................................................................................10
Changing the IP configuration ........................................................................................................11
Setting the sleep mode .................................................................................................................... 11
Disabling a port ............................................................................................................................... 12
Setting the serial port baud.............................................................................................................. 12
Viewing trap messages.................................................................................................................... 12
Viewing About information ............................................................................................................ 12
Chapter 3 Using the Console Manager 13
Screen definitions
Accessing with the serial port ..................................................................................................13
Accessing with Telnet ..............................................................................................................14
Navigating ................................................................................................................................15
Top screen (main) ....................................................................................................................16
System Configuration screen ................................................................................................... 17
Local IP Configuration screen .................................................................................................19
Remote IP Configuration screen ..............................................................................................21
SNMP Configuration screen .................................................................................................... 23
Trap Receiving Stations screen................................................................................................ 24
Port Configuration screen ........................................................................................................26
Collision Domain Statistics screen ..........................................................................................28
Port Statistics screen (traffic)...................................................................................................31
Port Statistics screen (errors) ...................................................................................................33
Network Health Checks screen ................................................................................................36
Wrong Speed Device screen .................................................................................................... 37
Wrong Polarity Cabling screen ................................................................................................39
33
Page 5

Screen definitions (continued)
Top Traffic Generators screen .................................................................................................41
Utilization and Collision History screen.................................................................................. 43
Login, Security & Reset Options screen ..................................................................................45
About screen ............................................................................................................................ 47
Logout screen ...........................................................................................................................49
Chapter 4 Technical Information 51
Locating MIB files .......................................................................................................................... 51
Defaults ...........................................................................................................................................51
Limited Hardware Warranty ...........................................................................................................53
Index 56
Contacting Intel Customer Support Inside back cover
4
Page 6

Overvie w of Hub
1
Management
Hubs themselves are rarely the cause of problems on the network.
However, since hubs are the center point for many devices on the
network, it’s a good place to start looking for problems.
There are four categories of management tasks:
• Configuring the hub or stack of hubs. This includes setting the IP
configuration, naming the hubs, and disabling individual ports.
• Monitoring traffic. This helps to plan network expansion or make
segmenting decisions.
• Finding malfunctioning devices such as LAN adapters in PCs.
• Finding wiring problems between an attached device and the hub.
There are several methods for managing hubs. You can use any
combination.
• Manage with the onboard LCD or Console Manager. This method
works best for initial setup or when the network goes down and
you can’t access the hub with an SNMP application.
• Manage with Intel Device View for Web or LANDesk® Network
Manager. These SNMP applications are tailored for Intel products
and show a graphical representation of the hub.
• Manage with any other SNMP-compliant application. If you
already use an SNMP application, you can manage hubs by
compiling the hub’s MIB files into that application. File locations
are listed on page 51.
5
Page 7

g
Intel Cascade Cable
(product code EE110CC)
Managing multiple hubs
To manage multiple hubs, you must stack them using Intel Cascade
Cables.
100 Mbps
100 Mbps
10 Mbps
10 Mbps
Connecting hubs with Intel Cascade Cables
allows you to manage both 10 and 100 Mbps
hubs with a sin
le Management Module.
Hub numbering
Once connected with Intel Cascade Cables, the Management Module
numbers hubs from top to bottom, regardless of the placement of the
Management Module.
Intel Express
10/100 Stackable Hub
Change hub speed
Collision
Power10BASE-T
Managed
100BASE-TX
Status
Hub 1 of 4
Intel Express
10/100 Stackable Hub
Change hub speed
100BASE-TX
Intel Express
10/100 Stackable Hub
Change hub speed
100BASE-TX
Intel Express
10/100 Stackable Hub
Change hub speed
100BASE-TX
Collision
Managed
Status
Collision
Managed
Status
Collision
Managed
Status
Green (left)
Solid = Link
Blink = Activity
Amber (right)
Solid = Disabled
Blink = Wrong Speed
Green (left)
Solid = Link
Blink = Activity
Amber (right)
Solid = Disabled
Blink = Wrong Speed
Green (left)
Solid = Link
Blink = Activity
Amber (right)
Solid = Disabled
Blink = Wrong Speed
Power10BASE-T
Power10BASE-T
Power10BASE-T
Hub 2 of 4
Hub 3 of 4
Hub 4 of 4
12345678 910111213141516 17 18 19 20 21 22 23 24
Management Module
Esc
Main Menu:
Stats Config >
The placement of the
Management Module
12345678 9101112
12345678 910111213141516 17 18 19 20 21 22 23 24
Reset
Green (left)
Solid = Link
Blink = Activity
Amber (right)
Solid = Disabled
Blink = Wrong Speed
in the stack has no effect
on hub numbering.
12345678 910111213141516 17 18 19 20 21 22 23 24
6
Page 8

Collision domain assignments
All hubs running at the same speed in the stack belong to the same
collision domain. In the example below, all devices (PCs, print
servers, and so on) connected to hubs 1 and 2 share 100 Mbps of
bandwidth. All devices connected to hubs 3 and 4 share 10 Mbps of
bandwidth.
Intel Express
10/100 Stackable Hub
Change hub speed
Collision
Power10BASE-T
Managed
100BASE-TX
Status
100 Mbps
Intel Express
10/100 Stackable Hub
Change hub speed
100BASE-TX
Intel Express
10/100 Stackable Hub
Change hub speed
100BASE-TX
Intel Express
10/100 Stackable Hub
Change hub speed
100BASE-TX
Collision
Managed
Status
Collision
Managed
Status
Collision
Managed
Status
Green (left)
Solid = Link
Blink = Activity
Amber (right)
Solid = Disabled
Blink = Wrong Speed
Green (left)
Solid = Link
Blink = Activity
Amber (right)
Solid = Disabled
Blink = Wrong Speed
Green (left)
Solid = Link
Blink = Activity
Amber (right)
Solid = Disabled
Blink = Wrong Speed
Power10BASE-T
Power10BASE-T
Power10BASE-T
100 Mbps
10 Mbps
10 Mbps
12345678 910111213141516 17 18 19 20 21 22 23 24
100 Mbps
collision domain
Management Module
Esc
Main Menu:
Stats Config >
12345678 9101112
12345678 910111213141516 17 18 19 20 21 22 23 24
Reset
Green (left)
Solid = Link
Blink = Activity
Amber (right)
Solid = Disabled
Blink = Wrong Speed
10 Mbps
collision domain
12345678 910111213141516 17 18 19 20 21 22 23 24
The two collision domains don’t pass traffic to each other without
optional bridging equipment (see the Intel Express 10/100 Stackable
Hub User Guide that came with the hub for more information on
bridging options).
The entire hub is called
the chassis.
MIB identification
If you use a MIB browser, you can configure or view statistics for the
hub at three levels – by hub (chassis), module, or port. The MIB file
locations are listed on page 51.
Intel Express
Management Module
Main Menu:
Stats Config >
12345678 9 101112
Esc
Reset
The group of base ports on the
hubs are called modules. The
expansion slots are also modules.
Green (left)
Solid = Link
Blink = Activity
Amber (right)
Solid = Disabled
Blink = Wrong Speed
10/100 Stackable Hub
Change hub speed
Collision
Managed
100BASE-TX
Status
Power10BASE-T
7
Page 9
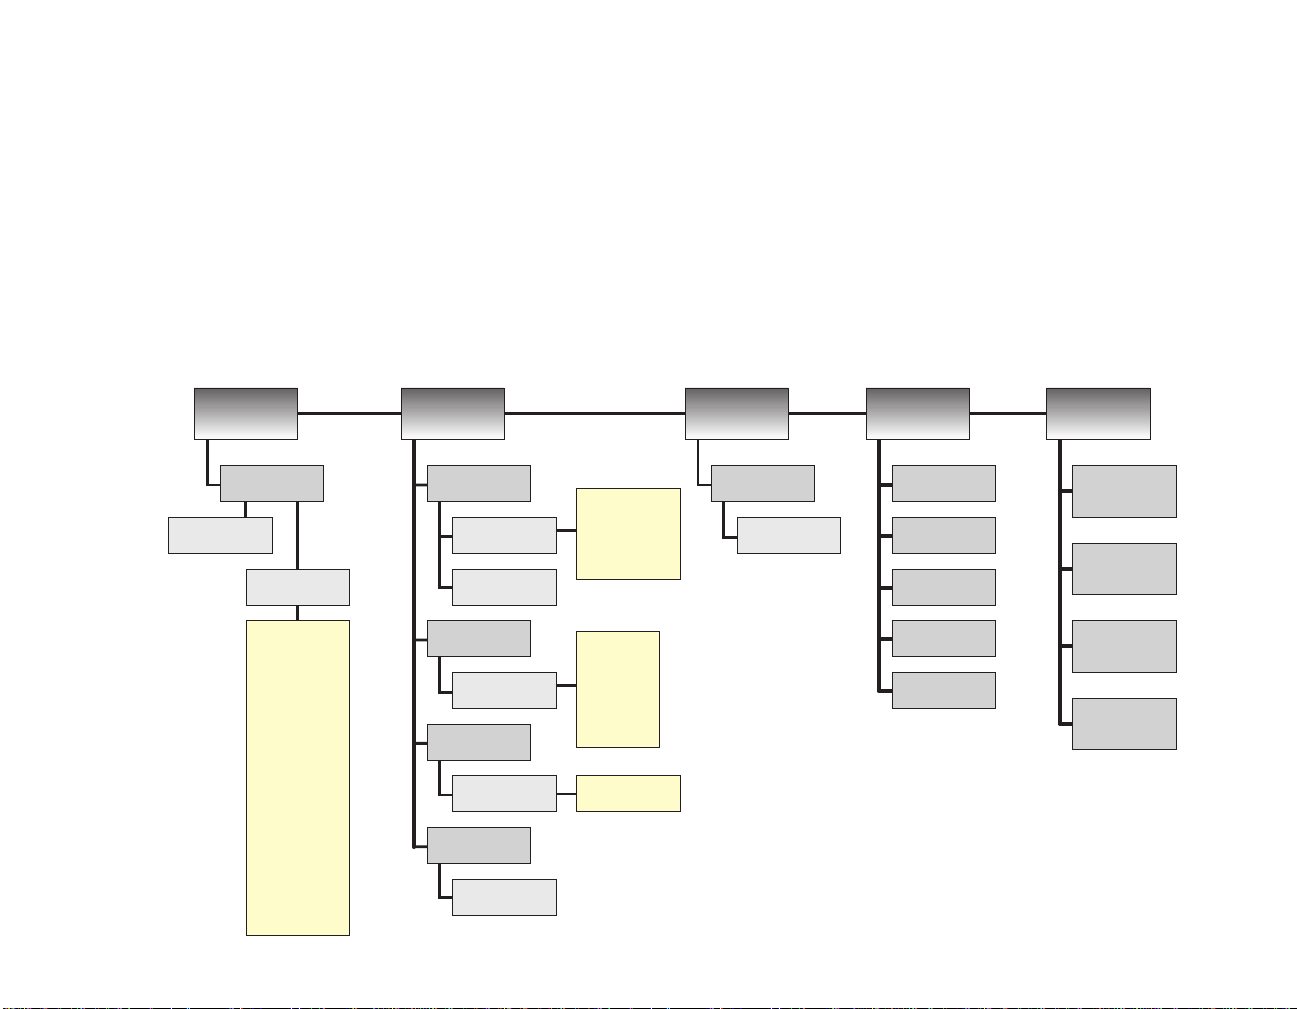
LCD menu tree
IP address:
000.000.000.000
Subnet Mask:
000.000.000.000
Default Gateway:
000.000.000.000
Stats
Config
Manual
BootP
Traps
About
IP Addr=
Subnet=
MAC Addr=
Version=
RS232=
Help
Press Stats to view
domain or port
statistics.
Press Traps to view
SNMP trap
messages.
Press Config to set
IP info, sleep mode,
or port state.
Press About to view
IP & MAC addresses
or firmware version
Sleep
Ports
Select hub&port
hub=1 port=1
RS232
Select baud rate:
9600 19200 38400
Set IP address
History of
SNMP traps
Clear Trap List?
Yes No
Select stat type:
Domain Port
Select wait time
# minutes
Show on sleep:
Usage (p. 29)
Traps (p. 25)
Name (p. 17)
Loc. (p. 17)
Contact (p. 17)
Text (p. 12)
Address (p. 19)
Collisions &
usage per second
Select hub&port
hub=1 port=1
Select state:
enable disable
Packets
(p. 32)
Collisions
(p. 32)
Auto-partitions
(p. 35)
Alignment errors
(p. 34)
Frames too long
(p. 34)
Runts
(p. 35)
Very long events
(p. 35)
Rate mismatches
(p. 35)
Late collisions
(p. 35)
FCS errors
(p. 34)
Short events
(p. 34)
8
Page 10

2
Using the LCD
Navigating
The Management Module has four buttons and an LCD display,
which you can use to display information about your network or to
make changes to the module, hub, or stack.
Esc - use to go back a level
Enter - use to accept selection
Management Module
Main Menu:
Stats Config >
The option currently
selected flashes on
the display.
Esc
Reset
If there are other items
in the menu, an arrow
(< >) appears on the
left or right side of the
display.
Reset button. See page 46.
Arrow keys - use to move through selections
9
Page 11
Changing the LCD contrast
You can change the contrast so the display is viewable from different
angles. For example, if the management module is located in a hub at
the top of a rack.
• Make sure the Main menu is displayed with the Stats item
flashing.
– To darken: Press the Esc button for five seconds to enter
contrast mode. Keep pressing until the display turns darker.
– To lighten: Press the left arrow button for five seconds to enter
contrast mode. Keep pressing until the display turns lighter.
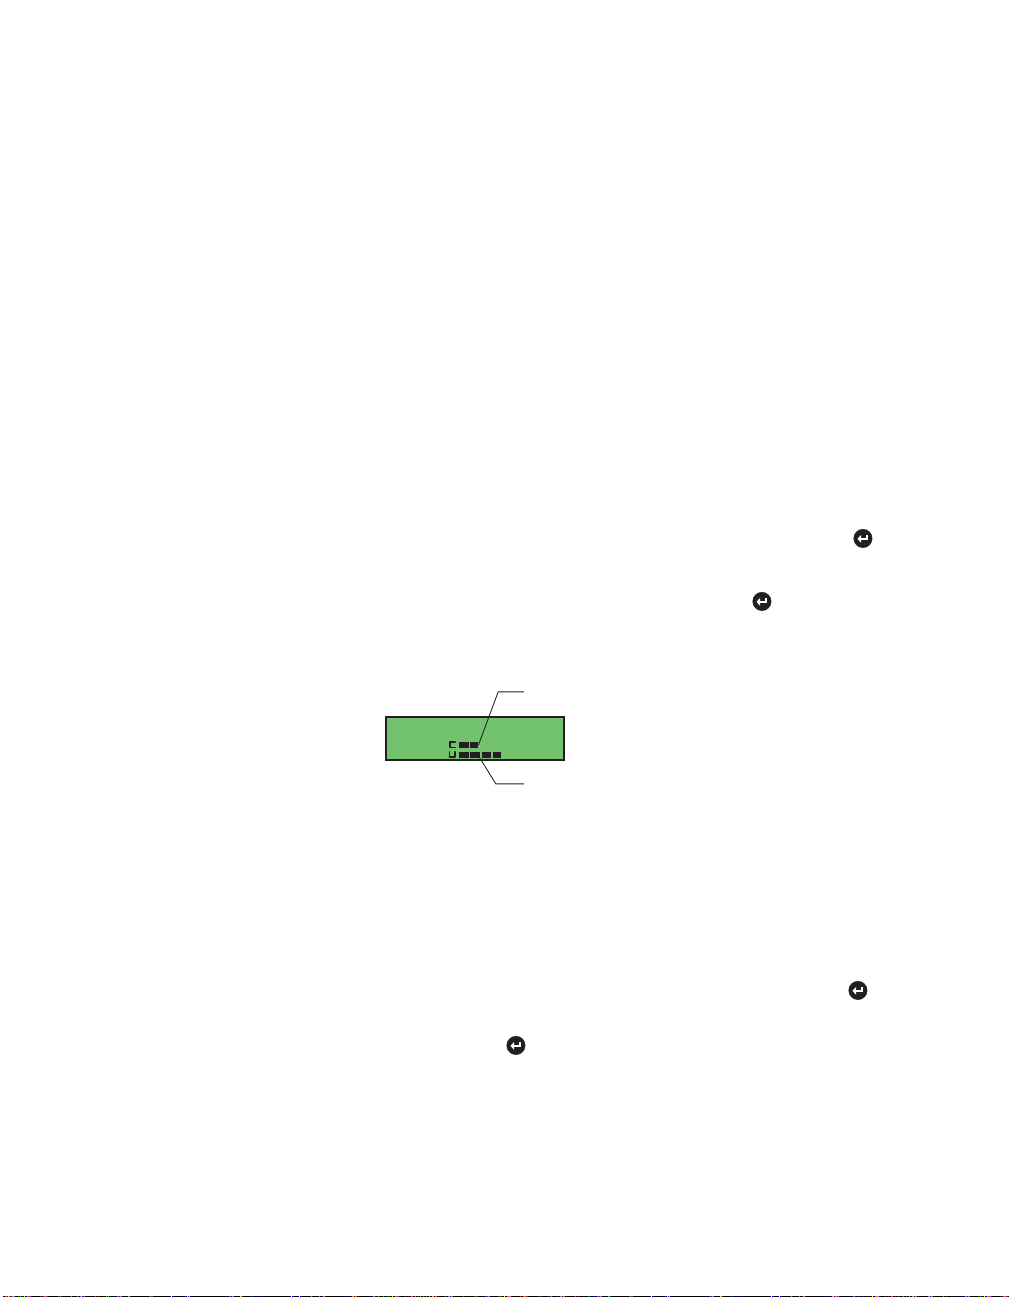
Viewing statistics
From the Stats menu, select the stat type, Domain or Port. Press
Domain
1 Collisions & usage per second appears. Press to display the
following graph. If there are two collision domains (10 and 100
Mbps hubs in the same stack) two graphs will be displayed.
Top bar shows collisions per second
collisions/usage
100Mb
10
Bottom bar shows % utilization
Each segment represents a value of 10 (each pixel within a
segment is a value of 2). In this example, the 100 Mbps
collision domain is 34% utilized and the collision count is 16
collisions per second.
2 Press any key to return to the Main menu.
Port
1 Use the arrow keys to select the hub (from 1 to 8). Press
2 Use the arrow keys to select the port number (1 to 12 or
1 to 24). Press
Page 12

3 Use the arrow keys to step through the different stats —packets,
collisions, auto-partitions, alignment errors, frames too long,
runts, very long events, rate mismatches, late collisions, FCS
errors, short events. While viewing a statistic, you can update
by pressing . For more information on these statistics, see
pages 31-35.
Changing the IP configuration
1 From the Config menu, select Set IP. Press
2 Select OK to continue or Cancel to return to the Main menu.
Press
3 Select Manual or BootP. Press
• If you selected Manual, use the arrow keys to scroll through
the range of values for each number, pressing to set.
• If you selected BootP, the Management Module searches for a
BOOTP server.
4 (Manual) Repeat step 3 for the Subnet mask and Default gateway.
5 When you’re finished, press the Reset button. This resets the
Management Module and all hubs in the stack. When the hub
resets, attached devices temporarily lose connection, but the links
are automatically re-established when the hub is back up.
Setting the sleep mode
Sleep mode displays information on the LCD when you leave it
unattended – like a screen saver.
1 From the Config menu, select Sleep.
2 Set the wait time (time before sleep mode starts). You can set the
delay from 1 to 255 minutes. A setting of 0 turns off the sleep
mode. Press
3 Choose what you want to display during sleep mode. Use the
arrow keys to select one of the options below. Press
Usage: The percent utilization of the collision domain or domains.
Traps: A list of error conditions on the hub. For a list of supported
traps, see page 25.
Name, Loc. (Location), or Contact: For more information on
these options, see page 17.
11
Page 13

Text: User-defined text set via SNMP through LANDesk Network
Manager or Device View for Web. Up to 32 characters can be
displayed on the LCD.
Address: The current IP address of the Management Module.
4 Choose Yes if you want the management module to sleep now or
No to return to the Config menu. Press
Disabling a port
1 From the Config menu, select Ports. Press
2 Use the arrow keys to select the hub (from 1 to 8). Press
3 Use the arrow keys to select the port number (from 1 to 12 or
1 to 24). Press
4 Select Enable or Disable using the arrow keys.
Press
5 Press any key to return to the Config menu.
Setting the serial port baud
1 From the Config menu, select RS232. Press
2 Use the arrow keys to change the baud ( 9600, 19200, or 38400).
Press to set.
3 Press any key to return to the Config menu.
12
Viewing trap messages
1 From the Main menu, select Traps. Press
2 Use the right arrow key to view the traps.
3 At the end of the list choose whether you want to clear the trap
list. Use the arrow keys to select Yes or No and press .
For a list of supported traps, see page 25.
Viewing About information
1 From the Main menu, select About. Press
2 Use the arrow keys to view the IP address, Subnet mask, MAC
address, Version (software version of Management Module), and
RS232 baud.
Page 14

Using the
3
NOTE
Make sure VT100 arrows are
enabled in your terminal emulation program.
NOTE
If you’re running Windows 95
or NT*, make sure the scroll
off
lock is
on your keyboard.
Console Manager
Accessing with the serial port
1 Use the enclosed null modem cable to connect the serial port of
your PC to the serial port of the Management Module.
2 Open a terminal emulation program (such as HyperTerminal in
Microsoft Windows* 95). Use these communication parameters:
• 9600 baud
• 8 data bits
• No parity
• 1 stop bit
• No flow control
3 Log into the Console Manager:
Enter username: [ ]
Enter password: [ ]
By default, no password or username is assigned. See page 45 to
assign them.
13
Page 15

NOTE
Make sure you enable VT100
arrows in the Telnet application you’re using.
If you don’t, you won’t be able
to use the arrow keys.
NOTE
If the screen doesn’t display correctly when connecting, press
q. This will refresh it.
Accessing with Telnet
Telnet lets you access the Management Module in-band (over the
network).
To use Telnet:
1 Make sure an IP address is assigned to the Management Module.
See pages 11 or 19 for instructions.
2 Open a Telnet application. In Windows 95, select Run from the
Start Menu. Type:
telnet E
3 From the Terminal menu, select Preferences. Make sure the
emulation type is VT-100/ANSI and VT100 Arrows are enabled.
4 From the Connect menu, select Remote System. Enter the IP
address of the Management Module and click Connect.
5 Log into the Console Manager:
Enter username: [ ]
Enter password: [ ]
By default, no password or username is assigned. See page 45 to
assign them.
14
Page 16
Navigating
See below for navigation tips. On the top screen (see the next page)
you can press the number of the menu item to select it. For example,
selecting 1 will display the System Configuration screen.
WZ or T: Moves up or down to
the next menu item. For example,
pressing Z moves from Name: to
Location:.
E: Selects a menu item. For
example, pressing E here takes
you to the IP configuration screen.
AS or z: Moves to next
selection within a menu item. For
example, pressing S moves from
100 Mbps to 10 Mbps.
Toggling between insert and overstrike mode
By default, the Console Manager is in overstrike mode, which means
typing in a field replaces existing characters. Press cO to change to
insert mode.
15
Page 17

Top screen (main)
16
The Top screen is the starting point for all other Console Manager
screens. Type the number of a screen to display it (for example,
pressing 4 displays the Port Statistics screen). Or use the WZ arrow
keys and E to display the menu.
To return to the Top screen at any time, press cT.
Page 18
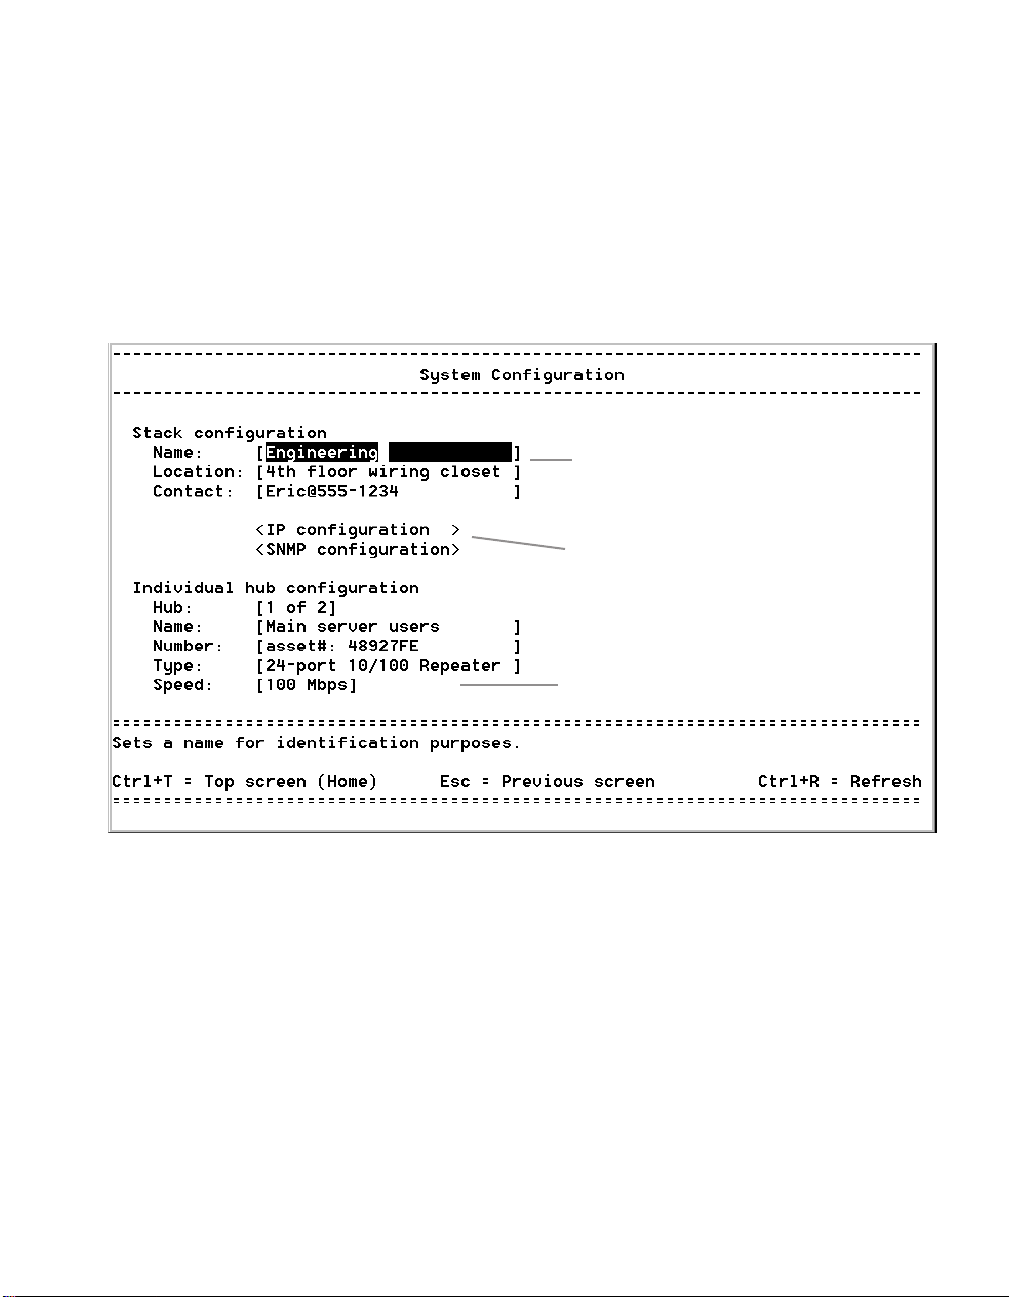
System Configuration screen
Location
Top screen
1. System Configuration
Uses
Name:
Assigns a name to the entire system (Management Module plus
all hubs in the stack). You can use up to 255 characters.
This sets the value for Name in the LCD sleep mode (see page 11). The
LCD displays only the first 16 characters.
Location:
Module plus all hubs in the stack). You can use up to 255 characters.
This sets the value for Loc. in the LCD sleep mode (see page 11). The
LCD displays only the first 16 characters.
Assigns a location to the entire system (Management
17
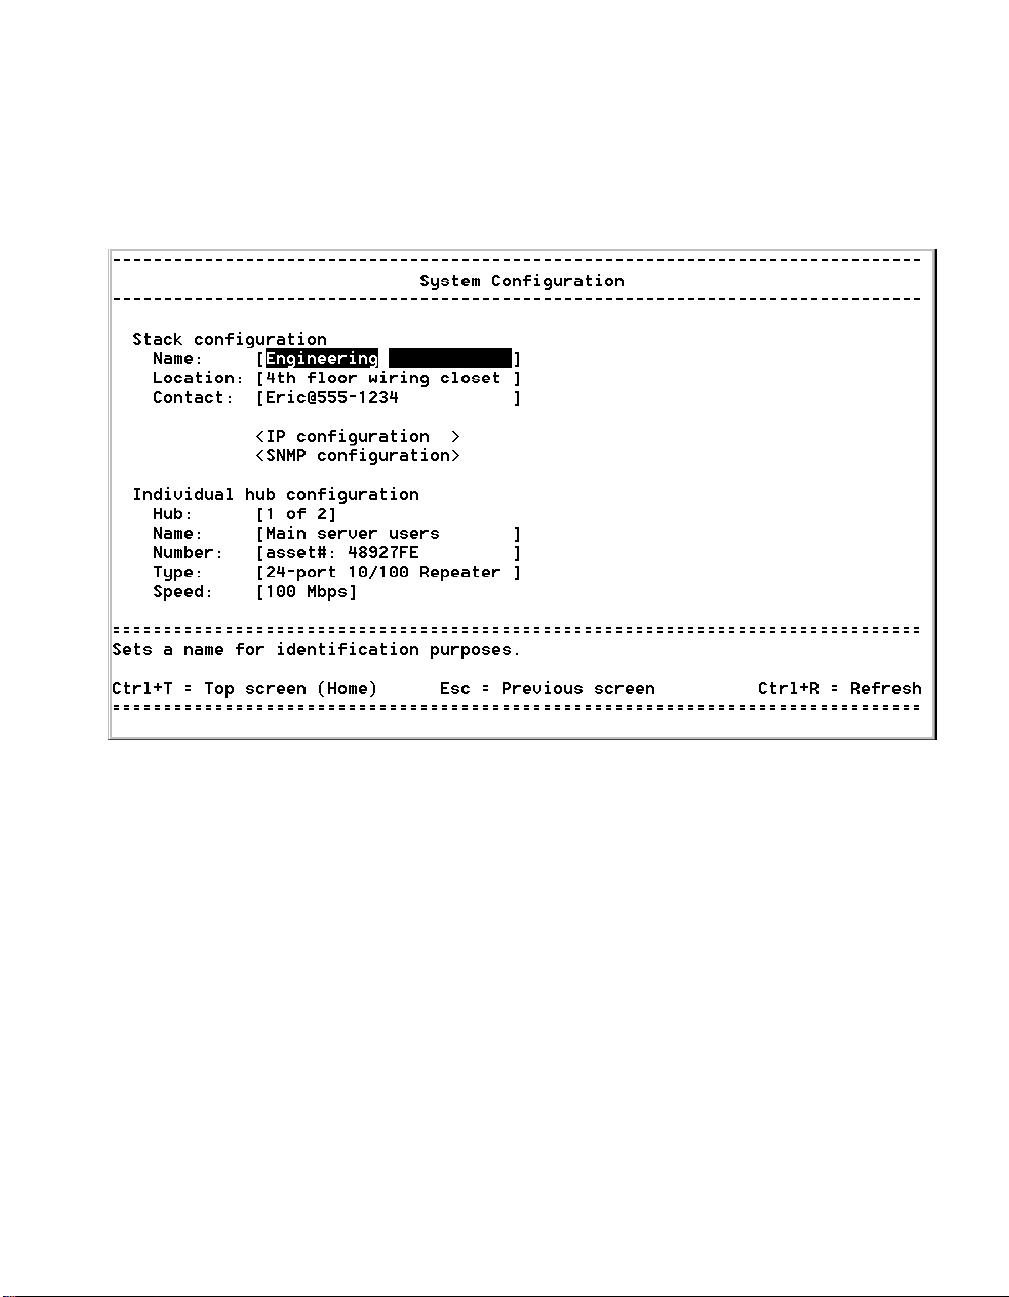
Page 19

The placement of the
Management Module
in the stack has no effect
on hub numbering.
Contact: Assigns a contact person or phone number to the entire
system (Management Module plus all hubs in the stack). You can use
up to 255 characters.
This sets the value for Contact in the LCD sleep mode (see page 11).
The LCD displays only the first 16 characters.
<IP configuration>: Press E to display the IP
Configuration screens.
<SNMP configuration>: Press E to display the SNMP
Configuration screens.
Hub: Use AS or z to select the number of the hub in the
stack. The hub at the top of the stack is number one. The location of
the Management Module in the stack has no effect on hub numbering.
Intel Express
10/100 Stackable Hub
Change hub speed
Collision
Power10BASE-T
Managed
100BASE-TX
Status
Hub 1 of 4
Intel Express
10/100 Stackable Hub
Change hub speed
100BASE-TX
Intel Express
10/100 Stackable Hub
Change hub speed
100BASE-TX
Intel Express
10/100 Stackable Hub
Change hub speed
100BASE-TX
Collision
Managed
Status
Collision
Managed
Status
Collision
Managed
Status
Green (left)
Solid = Link
Blink = Activity
Amber (right)
Solid = Disabled
Blink = Wrong Speed
Green (left)
Solid = Link
Blink = Activity
Amber (right)
Solid = Disabled
Blink = Wrong Speed
Green (left)
Solid = Link
Blink = Activity
Amber (right)
Solid = Disabled
Blink = Wrong Speed
Power10BASE-T
Power10BASE-T
Power10BASE-T
Hub 2 of 4
Hub 3 of 4
Hub 4 of 4
12345678 910111213141516 17 18 19 20 21 22 23 24
Management Module
Esc
Main Menu:
Stats Config >
12345678 9101112
12345678 910111213141516 17 18 19 20 21 22 23 24
12345678 910111213141516 17 18 19 20 21 22 23 24
Reset
Green (left)
Solid = Link
Blink = Activity
Amber (right)
Solid = Disabled
Blink = Wrong Speed
NOTE
Changing the speed of a hub
resets all statistical counters for
all hubs, regardless of speed .
18
Name: Assigns a name to an individual hub. Use up to 24 characters.
Number: Assigns a number to the hub. Use up to 24 characters. This
setting is not related to hub numbering.
Type: Displays the manufacturer-assigned type of hub. You can
change this to whatever you’d like. Use up to 24 characters.
Speed: Use AS or z to change the speed on the selected
hub. The change takes effect immediately. Remember that all ports on
a hub operate at the same speed. All devices attached to the hub must
match that speed.
Page 20

Local IP Configuration screen
Location
Top screen
1. System Configuration
<IP configuration>
<Configure IP locally>
Uses
Management Module MAC address:
manufacturer-assigned hardware address.
Current settings:
by the Management Module. The IP address shown here is the one
you’d use to access the Management Module through Telnet or a
ping test.
Displays the IP configuration currently used
Displays the unique
19
Page 21

IP address:
The unique user-assigned network address for the
Management Module.
Subnet mask:
Should match the subnet mask of other devices on
your network.
Default gateway:
The IP address of the device that routes to
different networks. Typically a router or routing server.
New settings:
Use to assign a new IP configuration to the
Management Module.
• Choose <USE NOW> to reset the Management Module and use
the new local settings immediately. You’ll have to log in again if
you choose <USE NOW>.
• Choose <USE NEXT RESET> to save the new local settings. The
settings take effect when you reset the Management Module using
the menu item or front panel button.
• Choose <CANCEL> to clear the new settings and return to the
previous menu.
20
Page 22

Remote IP Configuration screen
Location
Top screen
1. System Configuration
<IP configuration>
<Configure IP remotely (BOOTP)>
Uses
Management Module MAC address:
manufacturer-assigned hardware address. To use BOOTP, you must
enter this address into your BOOTP server.
BOOTP service:
have the Management Module look for a BOOTP agent on a server to
obtain its IP address. You must first set up the BOOTP server.
Use
AS
or
z
Shows the unique
to change to enabled to
21
Page 23

Select disabled to have the Management Module use the IP
configuration specified in the Local IP Configuration screen.
• Choose <USE NOW> to reset the Management Module and find
the BOOTP server immediately. You’ll have to log in again if you
press <USE NOW>.
• Choose <USE NEXT RESET> to save the setting. The settings
take effect when you reset the Management Module using the
menu item or front panel button.
• Press <CANCEL> to return to the previous menu.
22
Page 24

SNMP Configuration screen
Location
Top screen
1. System Configuration
<SNMP configuration>
Uses
Current read community:
changing) the hub configuration. The string you define here must
match the read community string defined in an SNMP application.
Current write community:
reading) the hub configuration. The string you define here must match
the write community string defined in an SNMP application.
Sets a password for viewing (not
Sets a password for changing (not
23
Page 25

Trap Receiving Stations screen
24
Location
Top screen
1. System configuration
<SNMP configuration>
<Define trap receiving stations>
Uses
Enter the IP addresses of PCs with SNMP management applications
(such as LANDesk Network Manager) installed. When a trap occurs,
such as a speed change on a hub, the Management Module
automatically alerts the SNMP management application.
Page 26

Supported traps include:
• notification of utilization exceeding a defined percentage or
collisions exceeding a defined number (configurable in LANDesk
Network Manager). Also configurable by using a MIB browser to
edit these objects in iee110.mib:
- rptrDomainUtilizationTrapThreshold
- rptrDomainUtilizationTrapPeriod
- rptrDomainCollisionTrapThreshold
- rptrDomainCollisionTrapPeriod
• notification of a hub configuration change, such as a speed change
or an unplugged Cascade Cable.
• notification of a hub power cycled or reset.
IP address fields:
Sets the IP addresses of PCs with SNMP
applications installed.
enabled/disabled:
Select enabled to have the Management
Module send traps to that IP address. Select disabled to prevent
the Management Module from sending traps to that IP address. Use
AS
or
z
Trap community string fields:
to toggle between the two choices.
Sets the community string
that must match the trap community string in the SNMP application.
25
Page 27

Port Configuration screen
26
Location
Top screen
2. Port configuration
Uses
Hub:
Use
AS
or
z
stack. The hub at the top of the stack is number one. The location of
the Management Module in the stack has no effect on hub
numbering.
Disable/enable port:
port. Press
port. Check the status column to see if the port is disabled or OK
(enabled).
Speed:
E
on
Displays the speed of the hub selected in the Hub: field.
to select the number of the hub in the
Use
AS
or
z
<DISABLE/ENABLE>
to select the hub
to disable or enable the
Page 28

Port:
Displays the port number on the hub selected in the
Ports
13-Slot
and
14-Slot
on a 12-port hub refer to the two
Hub:
field.
expansion slots. If you’re facing the hub, the left slot is port 13 and
the right slot is port 14.
13-slot 14-slot
Intel Express
Management Module
Main Menu:
Stats Config >
12345678 9 101112
Esc
Reset
Green (left)
Solid = Link
Blink = Activity
Amber (right)
Solid = Disabled
Blink = Wrong Speed
10/100 Stackable Hub
Change hub speed
Collision
Managed
100BASE-TX
Status
Power10BASE-T
Status:
Displays the current functional state of the port. Possible
values are:
OK: The port is functioning normally.
disabled: The port was manually disabled (see Disable/
enable port). The port cannot establish a link with a device
again until it’s enabled.
partitioned: The port was automatically disabled by the hub
due to an error condition, such as 64 consecutive collisions. The
port will be automatically enabled when the condition clears.
wrong speed: The device attached to the hub is operating at 10
Mbps while the hub is operating at 100 Mbps, or vice-versa.
Link:
Indicates whether a device is properly connected to the port.
27
Page 29

Collision Domain Statistics screen
28
Location
Top screen
3. Collision domain statistics
Uses
Update interval:
example, an Update interval of 5 sec. means the Console Manager
collects and displays information from the Management Module
every five seconds.
Selects the time period between updates. For
Page 30

Collision domain:
Selects which collision domain (10 or 100
Mbps hubs) to view. All hubs in the stack running at the same speed
are in the same collision domain.
Intel Express
10/100 Stackable Hub
Change hub speed
Collision
Power10BASE-T
Managed
100BASE-TX
Status
100 Mbps
100 Mbps
collision domain
10 Mbps
collision domain
12345678 910111213141516 17 18 19 20 21 22 23 24
Management Module
Esc
Main Menu:
Stats Config >
12345678 9101112
12345678 910111213141516 17 18 19 20 21 22 23 24
12345678 910111213141516 17 18 19 20 21 22 23 24
Reset
Green (left)
Solid = Link
Blink = Activity
Amber (right)
Solid = Disabled
Blink = Wrong Speed
Intel Express
10/100 Stackable Hub
Change hub speed
100BASE-TX
Intel Express
10/100 Stackable Hub
Change hub speed
100BASE-TX
Intel Express
10/100 Stackable Hub
Change hub speed
100BASE-TX
Collision
Managed
Status
Collision
Managed
Status
Collision
Managed
Status
Green (left)
Solid = Link
Blink = Activity
Amber (right)
Solid = Disabled
Blink = Wrong Speed
Green (left)
Solid = Link
Blink = Activity
Amber (right)
Solid = Disabled
Blink = Wrong Speed
Green (left)
Solid = Link
Blink = Activity
Amber (right)
Solid = Disabled
Blink = Wrong Speed
Power10BASE-T
Power10BASE-T
Power10BASE-T
100 Mbps
10 Mbps
10 Mbps
NOTE
Since frames vary in length,
it’s best to look at the octet
count to see how much traffic
is passing through the hubs.
Utilization:
The percentage of Ethernet bandwidth (10 or 100
Mbps) being used by devices attached to the hubs. All hubs in the
stack running at the same speed are in the same collision domain and
share either 10 or 100 Mbps of bandwidth.
Collisions:
The number of collisions detected. Collisions are
normal in an Ethernet network. They tend to rise as network
utilization rises.
Frames:
The number of frames detected without errors. Includes
unicast, broadcast, and multicast frames. It does not include frames
received with frames too long, runt, FCS, or alignment errors.
Octets:
The number of octets (bytes) contained in frames received
that had no errors. This includes octets in unicast, broadcast, and
multicast frames. It also includes octets after the start frame delimiter
up to FCS, but not including FCS octets.
FCS errors:
The number of frames detected that are free of partial
octets and do not pass the FCS check. Usually caused by adapter
underrun (when the adapter can’t get enough PCI bandwidth). FCS
errors do not necessarily indicate that data has been lost.
Alignment errors:
The number of frames detected that contain
partial octets and do not pass the FCS check. This is usually caused
by a faulty adapter or poor quality cabling.
29
Page 31

Frames too long:
The number of frames detected that exceed the
maximum permitted frame size of 1518 octets.
Short events:
The number of fragments detected with
ActivityDuration less than ShortEventMaxTime (greater than 74 bit
times and less than 82 bit times). Usually indicates a network
topology problem, such as connecting two Express hubs running at
100 Mbps with UTP cable (instead of Intel Cascade Cables in a
stack) or using cables longer than 100 meters.
Late events:
The number of collisions detected after the
allowable detection period. Usually indicates a network topology
problem, such as daisy-chaining two Express hubs running at 100
Mbps with UTP cable (instead of Intel Cascade Cables in a stack),
daisy-chaining too many hubs running at 10 Mbps, or using cables
longer than 100 meters.
Very long events:
The number of times MAU jabber lockup
protection (MJLP) was detected due to transmission of data that
exceeded five msec. in duration (octet count greater than
maxFramSize). This information can be useful in identifying faulty
devices or ports.
Rate mismatch:
A count of the occurrences of out-of-specification
bit rates. This indicates the number of times the FIFO buffer overruns
or underruns due to transmission rate errors. This could indicate an
incorrect FIFO setting on a LAN adapter or a faulty LAN adapter.
Total errors:
The total number of errors detected since the port
was last reset. Total errors include FCS errors, alignment errors,
frame too long, short events, late events, very long event, and rate
mismatch errors.
30
Runts:
The number of frames detected that are less than the
minimum permitted frame size and have a good FCS. Runts usually
indicate collision fragments, a normal network event.
Auto partitions:
The number of times this port was
automatically partitioned. This condition occurs when 64 consecutive
collisions are detected on the port. These collisions are due to
excessive traffic on the segment, a malfunctioning port, or a
malfunctioning adapter that is jabbering.
Page 32

Port Statistics screen (traffic)
Location
Top screen
4. Port statistics
Statistic: [traffic]
Uses
Hub:
Use
AS
or
z
The hub at the top of the stack is number one. The location of the
Management Module in the stack has no effect on hub numbering.
Ports:
example above shows ports 11-14 on a 12-port hub. If you’re facing
the hub, ports 13 and 14 are the left and right expansion slots,
respectively. See page 27 for an example.
Use
AS
or
to select the number of the hub in the stack.
z
to select the range of ports to view. The
31
Page 33

Statistic:
Use
AS
or
z
to select the type of port statistics
you want to view. Errors is the other type of statistic option you can
view. See page 33.
NOTE
Since frames vary in length,
it’s best to look at the octet
count to see how much traffic
is passing through the hubs.
Update interval:
Use
AS
or
z
to select the time period
between updates. For example, an Update interval of 5 sec. means the
Console Manager collects and displays information from the
Management Module every five seconds.
Speed:
Displays the current speed of the hub in the Hub: field.
Type: Displays the manufacturer-assigned type of hub. You can
change this to whatever you’d like through the System Configuration
screen (see page 17).
% Utilization:
The percentage of Ethernet bandwidth (10 or 100
Mbps) the device attached to that port is using. All hubs in the stack
running at the same speed are in the same collision domain and share
either 10 or 100 Mbps of bandwidth.
Collisions:
The number of collisions detected. Collisions are
normal in an Ethernet network. They tend to rise as network
utilization rises.
Frames:
The number of frames detected without errors. Includes
unicast, broadcast, and multicast frames. Does not include frames
received with frames too long, runt, FCS, or alignment errors.
Octets:
The number of octets (bytes) contained in frames received
that had no errors. This includes octets in unicast, broadcast, and
multicast frames. It also includes octets after the start frame delimiter
up to FCS, but not including FCS octets.
32
Page 34

Port Statistics screen (errors)
Location
Top screen
4. Port statistics
Statistic: [errors]
Uses
Hub:
Use
AS
or
z
The hub at the top of the stack is number one. See page 18 for an
example.
Ports:
11-14 on a 12-port hub. If you’re facing the hub, ports 13 and 14 are
the left and right expansion slots respectively. See page 27 for an
example.
Selects the range of ports to view. The example shows ports
to select the number of the hub in the stack.
33
Page 35

Statistic:
Use
AS
or
z
to select the type of port statistics to
view. Traffic is the other type of statistic option you can view (see
page 31).
NOTE
Since frames vary in length,
it’s best to look at the octet
count to see how much traffic
is passing through the hubs.
Update interval:
Use
AS
or
z
to select the time period
between updates. For example, an update interval of 5 sec. means the
Console Manager collects and displays information from the
Management Module every five seconds.
Speed:
Displays the current speed of the hub in the Hub: field.
Type: Displays the manufacturer-assigned type of hub. You can
change this to whatever you want through the System Configuration
screen (see page 17).
Collisions:
The number of collisions detected. Collisions are
normal in an Ethernet network. They tend to rise as network
utilization rises.
Frames:
The number of frames detected without errors. Includes
unicast, broadcast, and multicast frames. Does not include frames
received with frames too long, runt, FCS, or alignment errors.
Octets:
The number of octets (bytes) contained in frames received
that had no errors. This includes octets in unicast, broadcast, and
multicast frames. It also includes octets after the start frame delimiter
up to FCS but not including FCS octets.
FCS errors:
The number of frames detected that are free of partial
octets and do not pass the FCS check. Usually caused by adapter
underrun (when the adapter can’t get enough PCI bandwidth). FCS
errors do not necessarily indicate that data has been lost.
34
Alignment errors:
The number of frames detected that contain
partial octets and do not pass the FCS check.
Frames too long:
The number of frames detected that exceed the
maximum permitted frame size of 1518 octets.
Short events:
The number of fragments detected with
ActivityDuration less than ShortEventMaxTime (greater than 74 bit
times and less than 82 bit times). Usually indicates a network
topology problem, such as connecting two Express hubs running at
100 Mbps with UTP cable (instead of Intel Cascade Cables in a stack),
or using cables longer than 100 meters.
Page 36

Late events:
The number of collisions detected after the allowable
detection period. Usually indicates a network topology problem, such
as daisy-chaining two Express hubs running at 100 Mbps with UTP
cable (instead of Intel Cascade Cables in a stack), daisy-chaining too
many hubs running at 10 Mbps, or using cables longer than 100
meters.
Very long events:
The number of times MAU jabber lockup
protection (MJLP) was detected due to transmission of data that
exceeded 5 msec. in duration (octet count greater than
maxFramSize). This information can help you identify faulty devices
or ports.
Rate mismatch:
A count of the occurrences of out-of-specification
bit rates. This indicates the number of times the FIFO buffer overruns
or underruns due to transmission rate errors. This could indicate an
incorrect FIFO setting on a network adapter or a faulty adapter.
Total errors:
The total number of errors detected since the port
was last reset. Total errors include FCS errors, alignment errors,
frame too long, short events, late events, very long event, and rate
mismatch errors.
Runts:
The number of frames detected that are less than the
minimum permitted frame size and have a good FCS. Runts usually
indicate collision fragments, a normal network event.
Auto partitions:
The number of times this port was
automatically partitioned. This condition occurs when 64 consecutive
collisions are detected on the port. These collisions are due to
excessive traffic on the segment, a malfunctioning port, or a
malfunctioning adapter that is jabbering.
35
Page 37

Network Health Checks screen
36
Location
Top screen
5. Network health checks
Uses
Device Checks:
speed opposite to the hub, or looks for cabling problems.
Traffic Checks:
traffic (sorted by total octet count), or gives a history of the utilization
percentage and collision count for up to the last hour.
Looks for connected devices that are operating at a
Looks for ports generating the largest volume of
Page 38

Wrong Speed Device screen
Location
Top screen
5. Network health checks
<Check for wrong speed devices>
Uses
Update interval:
between updates. For example, an update interval of 5 sec. means the
Console Manager checks the Management Module every five seconds
to see if it detected wrong speed devices.
<Scroll Down>/<Scroll Up>
speed devices.
Use
AS
or
z
Moves up or down the list of wrong
to select the time period
37
Page 39

Hub:
Displays the hub number in the stack where the wrong speed
device was found. The hub at the top of the stack is number one.
Port:
Displays the port number in the hub where the wrong speed
device was found.
NOTE
All zeros are displayed in the
Last MAC addr field if the
Management Module never
recognized the device on the
port.
For example, the device
plugged into the port was
always at the wrong speed.
Last MAC addr:
Displays the hardware address of the most recent
device that sent data on that port. If all zeros are displayed, the
Management Module never recognized the device on the port.
Problem:
Displays the problem. In this screen, a wrong speed device
is connected to port 10 of hub 7. Correct the problem by changing the
speed of the attached device or by moving the device to a hub running
at the same speed.
38
Page 40

Wrong Polarity Cabling screen
Location
Top screen
5. Network health checks
<Check for wrong polarity cabling to devices>
Uses
Update interval:
example, an Update interval of 5 sec. means the Console Manager
will check the Management Module every five seconds to see if it
detected wrong polarity cabling.
<Scroll Down>/<Scroll Up>
wrong polarity cabling devices.
Hub:
Displays the hub number in the stack where the wrong polarity
device was found. The hub at the top of the stack is number one.
Selects the time period between updates. For
Moves up or down the list of
39
Page 41

Port:
Displays the port number in the hub where the wrong polarity
device was found.
NOTE
All zeros are displayed in the
Last MAC addr field if the
Management Module never
recognized the device on the
port.
For example, the device
plugged into the port always
had wrong polarity cabling
between it and the hub.
Last MAC addr:
Displays the hardware address of the most recent
device that sent data on that port.
Problem:
Displays what the problem is. In this screen, wrong
polarity cabling between the device and the hub. Wrong polarity
cabling is when the TX+ and TX- pairs or RX+ and RX- of a UTP
cable are reversed. This is usually caused by making your own
cables. If a wrong polarity cable is detected, try using a different
cable.
40
Page 42

T o p T raffic Generators screen
Location
Top screen
5. Network health checks
<Top traffic generators>
Uses
View for the last:
Domain:
view top traffic generating devices. All hubs in the stack running at
the same speed are in the same collision domain.
Selects which collision domain (10 or 100 Mbps hubs) to
Selects the time period to look back on.
41
Page 43

Update interval:
Selects the time period between updates. For
example, an Update interval of 5 sec. means the Console Manager
checks the Management Module every five seconds for the list of
devices that are generating the most traffic.
NOTE
If the MAC address changes
with the update interval,
another hub, switch, or
router is probably connected
to the port.
<Scroll Down>/<Scroll Up>
Moves up or down the list of top
traffic generating devices.
Hub:
Displays the hub number in the stack where the device is
attached. The hub at the top of the stack is number one.
Port:
Displays the port number in the hub where the device is
attached.
Last MAC addr:
Displays the hardware address of the most recent
device that sent data on that port.
Octets:
The number of octets (bytes) contained in frames received
that had no errors. This includes octets in unicast, broadcast, and
multicast frames. It also includes octets after the start frame delimiter
up to FCS, but not including FCS octets.
Frames:
The number of frames detected without errors. Includes
unicast, broadcast, and multicast frames. Does not include frames
received with frames too long, runt, FCS, or alignment errors.
42
Page 44

Utilization and Collision History screen
Location
Top screen
5. Network health checks
<Utilization and collision history>
Uses
View for the last:
Domain:
view. All hubs in the stack running at the same speed are in the same
collision domain.
Selects which collision domain (10 or 100 Mbps hubs) to
Selects the time period to look back on.
43
Page 45

Update interval:
example, an Update interval of 5 sec. means the Console Manager
checks the Management Module every five seconds for updated
information.
Selects the time period between updates. For
Utilization Breakdown:
selected collision domain had a utilization percentage in the
particular range. In the example, the 10 Mbps collision domain was
at 0-9% utilization for 41 minutes and 16 seconds.
Collisions/sec Breakdown:
selected collision domain had a collision per second count in the
particular range. In the example, the 10 Mbps collision domain had
0-5 collisions per second for 37 minutes and 59 seconds.
Total time:
Module collected the history. If the total time is less than the View
for the last value, then the Management Module or hub was
probably reset or powered off.
Minimum:
count for the time period.
Maximum:
count for the time period.
Average:
count for the time period.
Displays the total amount of time the Management
Displays the minimum utilization percentage or collision
Displays the maximum utilization percentage or collision
Displays the average utilization percentage or collision
Displays the amount of time the
Displays the amount of time the
Interpreting this screen
It’s best to view utilization coupled with collisions before making any
decisions on the saturation of your network. Generally, Ethernet
saturation starts to occur when the utilization reaches 30% and above.
However, if the collision count is low, you don’t have a saturated
network, but an efficient network.
44
If both the utilization percentage and the collision count are
consistently high (above 30% for utilization and 50-100 collisions/
second or more), then you have a saturated network and will see poor
performance. The best way to alleviate a saturated network is to
segment the network (have fewer devices share a fixed amount of
bandwidth). You can do this by adding a switch to the network.
Page 46

Login, Security & Reset Options screen
Location
Top screen
6. Login, security, and reset options
Uses
Username:
here is used the next time you reset the Management Module or log out
of the Console Manager. You can define only one username.
Old password:
setting blank if you’re assigning one for the first time.
New password: Sets a new password for accessing the Console
Manager. The one you specify here is used the next time you reset the
Management Module or log out and log in to the Console Manager.
By default, no username is assigned. The one you specify
By default, no password is assigned. Leave this
45
Page 47

Confirm new password:
you entered in the
New password
Ensures you entered what you thought
field.
NOTE
Resetting a hub causes devices
connected to the hub to temporarily lose their link.
Resetting the Management
Module doesn’t result in lost
links. However, it resets all
statistic counters to zero.
<Save login settings>:
Saves any changes to the Login
settings. The next time you reset the Management Module or log out
and log in again, you must use the new settings.
<Cancel>:
you already selected
Discards any unsaved changes to the Login settings. If
<Save login settings>
, selecting
<Cancel>
will do nothing.
Reset hub:
Resets an individual hub. If the Management Module is
in this hub, it will also be reset (if you changed the IP configuration
or login setting, the new settings will be used).
Reset all 10 Mbps hubs:
Resets all hubs operating at 10 Mbps
in the stack. Think of this as a 10 Mbps collision domain reset. This
does not reset the Management Module, even if it is in a hub running
at 10 Mbps.
Reset all 100 Mbps hubs:
Resets all hubs operating at 100
Mbps in the stack. Think of this as a 100 Mbps collision domain
reset. This does not reset the Management Module, even if it is in a
hub running at 100 Mbps.
Reset Management Module:
Resets the Management Module.
This resets all statistic counters back to zero. If you changed the IP
configuration or login setting, the new settings are used.
Lock Change hub speed button(s):
Prevents someone from
changing the hub speed through the front panel button on the hub.
Set to on to lock the button(s).
46
This setting is for all hubs in the stack. You can’t lock the speed
button for an individual hub unless you directly edit the MIB.
Front panel reset button
Management Module
Reset
The front panel reset button resets the
Management Module and all hubs in the
stack, regardless of speed. All statistical
counters are also reset.
Esc
➜
Page 48

About screen
Location
Top screen
7. About
Uses
IP address:
currently in use.
Management Module MAC address:
manufacturer-assigned hardware address. You can’t change the
MAC address.
Vendor name: Displays the Management Module manufacturer.
Displays the Management Module IP address
Displays the unique
47
Page 49

Product name:
Displays the type of device the Management
Module is supporting.
Hardware version:
Displays the Management Module’s hardware
version. You can’t update the hardware version. It’s a good idea to
write this information down and have it ready should you need to
contact Intel Customer Support.
Software version:
Displays the Management Module’s software
version. It’s a good idea to write this information down and have it
ready should you need to contact Intel Customer Support.
48
Page 50

Logout screen
Location
Top screen
8. Logout
Uses
Returns to the login screen.
49
Page 51

4
Technical Information
Locating MIB files
The following Management Module MIB files are located on the Intel
Device View for Web CD in the \MIB directory.
• intel.mib
• intelsys.mib
• iee110.mib
You can also download the MIB files from the Intel Customer
Support Web site (http://support.intel.com).
Defaults
Management Module (SNMP agent)
IP address: None assigned
IP configuration BOOTP disabled. Configure locally through
source: LCD or Console Manager.
Read community: Public
Write community: Private
51
Page 52

Hub
Speed: 100 Mbps
Consecutive
collisions before
auto-partition: 64
LCD
Sleep mode: Off
RS232 baud: 9600
Console Manager
Communication
parameters: 9600-8-N-1, no flow control
Username: None assigned
Password: None assigned
Typing mode: Overstrike. Use cO to change to insert.
52
Page 53

Limited Hardware Warranty
Intel warrants to the original owner that the hardware product delivered in this package will be free from defects in material and
workmanship for three (3) years following the latter of: (i) the date of purchase only if you register by returning the registration
card as indicated thereon with proof of purchase; or (ii) the date of manufacture; or (iii) the registration date if by electronic
means provided such registration occurs within 30 days from purchase. This warranty does not cover the product if it is
damaged in the process of being installed. Intel recommends that you have the company from whom you purchased this
product install the product.
INTEL RESERVES THE RIGHT TO FILL YOUR ORDER WITH A PRODUCT CONTAINING NEW OR
REMANUFACTURED COMPONENTS. THE ABOVE WARRANTY IS IN LIEU OF ANY OTHER WARRANTY,
WHETHER EXPRESS, IMPLIED OR STATUTORY, INCLUDING, BUT NOT LIMITED TO, ANY WARRANTY OF
NONINFRINGEMENT OF INTELLECTUAL PROPERTY, MERCHANTABILITY, FITNESS FOR A PARTICULAR
PURPOSE, OR ANY WARRANTY ARISING OUT OF ANY PROPOSAL, SPECIFICATION OR SAMPLE.
This warranty does not cover replacement of products damaged by abuse, accident, misuse, neglect, alteration, repair, disaster,
improper installation or improper testing. If the product is found to be otherwise defective, Intel, at its option, will replace or
repair the product at no charge except as set forth below, provided that you deliver the product along with a return material
authorization (RMA) number either to the company from whom you purchased it or to Intel (North America only). If you ship
the product, you must assume the risk of damage or loss in transit. You must use the original container (or the equivalent) and
pay the shipping charge. Intel may replace or repair the product with either new or remanufactured product or parts, and the
returned product becomes Intel’s property. Intel warrants the repaired or replaced product to be free from defects in material
and workmanship for a period of the greater of: (i) ninety (90) days from the return shipping date; or (ii) the period of time
remaining on the original three (3) year warranty.
This warranty gives you specific legal rights and you may have other rights which vary from state to state. All parts or
components contained in this product are covered by Intel’s limited warranty for this product; the product may contain fully
tested, recycled parts, warranted as if new. For warranty information call one of the numbers below.
Returning a Defective Product (RMA)
Before returning any product, contact an Intel Customer Support Group and obtain an RMA number by calling:
If the Customer Support Group verifies that the product is defective, they will have the Return Material Authorization
Department issue you an RMA number to place on the outer package of the product. Intel cannot accept any product without an
RMA number on the package.
LIMITATION OF LIABILITY AND REMEDIES
INTEL SHALL HAVE NO LIABILITY FOR ANY INDIRECT OR SPECULATIVE DAMAGES (INCLUDING, WITHOUT
LIMITING THE FOREGOING, CONSEQUENTIAL, INCIDENTAL AND SPECIAL DAMAGES) ARISING FROM THE USE
OF OR INABILITY TO USE THIS PRODUCT, WHETHER ARISING OUT OF CONTRACT, NEGLIGENCE, TORT, OR
UNDER ANY WARRANTY, IRRESPECTIVE OF WHETHER INTEL HAS ADVANCE NOTICE OF THE POSSIBILITY OF
ANY SUCH DAMAGES, INCLUDING, BUT NOT LIMITED TO LOSS OF USE, INFRINGEMENT OF INTELLECTUAL
PROPERTY, BUSINESS INTERRUPTIONS, AND LOSS OF PROFITS, NOTWITHSTANDING THE FOREGOING, INTEL’S
TOTAL LIABILITY FOR ALL CLAIMS UNDER THIS AGREEMENT SHALL NOT EXCEED THE PRICE PAID FOR THE
PRODUCT. THESE LIMITATIONS ON POTENTIAL LIABILITIES WERE AN ESSENTIAL ELEMENT IN SETTING THE
PRODUCT PRICE. INTEL NEITHER ASSUMES NOR AUTHORIZES ANYONE TO ASSUME FOR IT ANY OTHER
LIABILITIES.
Some states do not allow the exclusion or limitation of incidental or consequential damages, so the above limitations or
exclusions may not apply to you.
Software provided with the hardware product is not covered under the hardware warranty described above. See the applicable
software license agreement which shipped with the hardware product for details on any software warranty.
North America only: (916) 377-7000
Europe only: +44-1793-404-900
Other locations: Return the product to the place of purchase.
53
Page 54

Federal Communications Commission (FCC) Statement
This equipment has been tested and found to comply with the limits for a Class A digital device, pursuant to Part 15 of the FCC
Rules. These limits are designed to provide reasonable protection against harmful interference when the equipment is operated
in a commercial environment. This equipment generates, uses, and can radiate radio frequency energy and, if not installed and
used in accordance with the instruction manual, may cause harmful interference to radio communications. Operation of this
equipment in a residential area is likely to cause harmful interference in which case the user will be required to correct the
interference at his own expense.
The user is cautioned that changes and modifications made to the equipment without approval of the manufacturer could void
the user’s authority to operate this equipment.
Manufacturer Declaration
This certifies that the Intel Express 10/100 Stackable Hub complies with the EU Directive 89/33/EEC, using the EMC standards
EN55022 (Class A) and EN50082-1. This product also meets or exceeds EN 60950 (TUV) requirements. This product has been
tested and verified to meet CISPR 22 Class A requirements.
WARNING
This is a Class A product. In a domestic environment this product may cause radio interference in which case the user may be
required to take adequate measures.
WARNING
The system is designed to operate in a typical office environment. Choose a site that is:
· Clean and free of airborne particles (other than normal room dust).
· Well ventilated and away from sources of heat including direct sunlight.
· Away from sources of vibration or physical shock.
· Isolated from strong electromagnetic fields produced by electrical devices.
· In regions that are susceptible to electrical storms, we recommend you plug your system into a surge suppressor and
disconnect telecommunication lines to your modem during an electrical storm.
· Provided with a properly grounded wall outlet.
Do not attempt to modify or use the supplied AC power cord if it is not the exact type required.
Ensure that the system is disconnected from its power source and from all telecommunications links, networks, or modems
lines whenever the chassis cover is to be removed. Do not operate the system with the cover removed.
AVERTISSEMENT
Le système a été conçu pour fonctionner dans un cadre de travail normal. L’emplacement choisi doit être:
· Propre et dépourvu de poussière en suspension (sauf la poussière normale).
· Bien aéré et loin des sources de chaleur, y compris du soleil direct.
· A l’abri des chocs et des sources de ibrations.
· Isolé de forts champs magnétiques géenérés par des appareils électriques.
· Dans les régions sujettes aux orages magnétiques il est recomandé de brancher votre système à un supresseur de
surtension, et de débrancher toutes les lignes de télécommunications de votre modem durant un orage.
· Muni d’une prise murale correctement mise à la terre.
Ne pas utiliser ni modifier le câble d’alimentation C. A. fourni, s’il ne correspond pas exactement au type requis.
Assurez vous que le système soit débranché de son alimentation ainsi que de toutes les liaisons de télécomunication, des
réseaux, et des lignes de modem avant d’enlever le capot. Ne pas utiliser le système quand le capot est enlevé.
54
Page 55

WARNUNG
Das System wurde für den Betrieb in einer normalen Büroumgebung entwickelt. Der entwickelt. Der Standort sollte:
· sauber und staubfrei sein (Hausstaub ausgenommen);
· gut gelüftet und keinen Heizquellen ausgesetzt sein (einschließlich direkter Sonneneinstrahlung);
· keinen Erschütterungen ausgesetzt sein;
· keine starken, von elektrischen Geräten erzeugten elektromagnetischen Felder aufweisen;
· in Regionen, in denen elektrische Stürme auftreten, mit einem Überspannungsschutzgerät verbunden sein; während eines
elektrischen Sturms sollte keine Verbindung der Telekommunikationsleitungen mit dem Modem bestehen;
· mit einer geerdeten Wechselstromsteckdose ausgerüstet sein.
Versuchen Sie nicht, das mitgelieferte Netzkabel zu ändern oder zu verwenden, wenn es sich nicht um genau den erforderlichen
Typ handelt.
Das System darf weder an eine Stromquelle angeschlossen sein noch eine Verbindung mit einer
Telekommunikationseinrichtung, einem Netzwerk oder einer Modem-Leitung haben, wenn die Gehäuseabdeckung entfernt
wird. Nehmen Sie das System nicht ohne die Abdeckung in Betrieb.
AVVERTENZA
Il sistema è progettato per funzionare in un ambiente di lavoro tipico. Scegliere una postazione che sia:
· Pulita e libera da particelle in sospensione (a parte la normale polvere presente nell’ambiente).
· Ben ventilata e lontana da fonti di calore, compresa la luce solare diretta.
· Al riparo da urti e lontana da fonti divibrazione.
· Isolata dai forti campi magnetici prodotti da dispositivi elettrici.
· In aree soggette a temporali, è consigliabile collegare il sistema ad un limitatore di corrente. In caso di temporali,
scollegare le linee di comunicazione dal modem.
· Dotata di una presa a muro correttamente installata.
Non modificare o utilizzare il cavo di alimentazione in c. a. fornito dal produttore, se non corrisponde esattamente al tipo
richiesto.
Prima di rimuovere il coperchio del telaio, assicurarsi che il sistema sia scollegato dall’alimentazione, da tutti i collegamenti di
comunicazione, reti o linee di modem. Non avviare il sistema senza aver prima messo a posto il coperchio.
ADVERTENCIAS
El sistema está diseñado para funcionar en un entorno de trabajo normal. Escoja un lugar:
· Limpio y libre de partículas en suspensión (salvo el polvo normal)
· Bien ventilado y alejado de fuentes de calor, incluida la luz solar directa.
· Alejado de fuentes de vibración.
· Aislado de campos electromagnéticos fuertes producidos por dispositivos eléctricos.
· En regiones con frecuentes tormentas eléctricas, se recomienda conectar su sistema a un eliminador de sobrevoltage y
desconectar el módem de las líneas de telecomunicación durante las tormentas.
· Previsto de una toma de tierra correctamente instalada.
No intente modificar ni usar el cable de alimentación de corriente alterna, si no se corresponde exactamente con el tipo
requerido.
Asegúrese de que cada vez que se quite la cubierta del chasis, el sistema haya sido desconectado de la red de alimentación y
de todos lo enlaces de telecomunicaciones, de red y de líneas de módem. No ponga en funcionamiento el sistema mientras la
cubierta esté quitada.
55
Page 56

I
Index
10 Mbps collision domain 7
10 Mbps hubs, resetting 45
100 Mbps collision domain 7
100 Mbps hubs, resetting 45
13-slot, definition 26
14-slot, definition 26
A-C
alignment errors
viewing for collision domain 28
viewing for individual ports 33
viewing from LCD 10
arrow keys, using 15
auto partitions
viewing for collision domain 28
viewing for individual ports 33
viewing from LCD 10
average collision count, viewing 43
average utilization, viewing 43
bandwidth usage. See utilization
baud, setting for serial port 12
BOOTP, enabling 21
breakdown of utilization and collisions 43
bridging between collision domains 7
cabling problems, finding 39
Change speed button, locking 45
changing the hub speed 17
chassis 7
collision count
viewing for collision domain 28
viewing for individual ports 31
viewing from LCD 10
collision domain
hub assignment 7
viewing errors 28
viewing traffic 28
viewing utilization 28
collision history, viewing 43
communications parameters, defaults 13
community strings, changing 23
configuration changes
notifying SNMP applications 24
configuring
hub speed 17
LCD sleep menu loc. 17
LCD sleep menu name 17
LCD sleep menu number 17
congestion, finding busy devices 41
56
Page 57

connecting
serial port 13
Telnet 13
Console Manager, using 13
contact name, assigning 17
contrast control, LCD 10
ctrl+o hot key 15
customer support Inside back cover
D-F
darkening the LCD display 10
default gateway
assigning 19
changing from LCD 11
displaying current setting 19
defaults
collisions before auto-partition 52
hub speed 52
HyperTerminal 14
IP address 51
password 14
read community 51
RS232 baud 52
typing mode 52
username 14
write community 51
defective product, returning 53
devices, finding at wrong speed 37
disabling a port
from Console Manager 26
from LCD 12
display panel. See LCD
displaying
Main screen 16
System Configuration screen 17
Top screen 16
distributing traffic 41
enabling a port
from Console Manager 26
from LCD 12
enabling ports 26
enter key, using 15
errors
viewing for collision domain 28
viewing for individual ports 33
expansion slots
disabling 26
viewing link status 26
FCS errors
viewing for collision domain 28
viewing for individual ports 33
viewing from LCD 10
finding top traffic generating devices 41
frames
viewing for collision domain 28
viewing for individual ports 31
frames too long
viewing for collision domain 28
viewing for individual ports 33
viewing from LCD 10
front panel reset button 46
G-I
gateway address, assigning 19
graphs on LCD 10
hardware address, for Management Module 19
hardware version, viewing 47
hardware warranty 53
history, viewing collision count 43
history, viewing utilization percentage 43
hot keys, using 15
hub name, assigning 17
hub speed, changing with Console Manager 17
hub type, assigning 17
hub type, displaying 17
hubs
numbering in stack 6
resetting 45
stacking 6
HyperTerminal, default parameters 13
in-band connection through Telnet 13
insert mode, enabling 15
57
Page 58

installing, quick start 1
IP address
assigning from LCD 11
assigning locally from Console Manager 19
assigning remotely (BOOTP) 21
displaying current setting 19, 47
displaying in LCD sleep mode 11
viewing from LCD 12
L-O
late collisions, viewing from LCD 10
late events
viewing for collision domain 28
viewing for individual ports 33
LCD
changing the contrast 10
configuring sleep menu options 17
disabling a port 12
enabling a port 12
graphs 10
navigating 9
using 9
viewing collision domain statistics 10
viewing port statistics 10
viewing trap messages 12
LCD sleep contact, assigning 17
LCD sleep loc., assigning 17
LCD sleep name, assigning 17
lightening the LCD display 10
limited hardware warranty 53
link status, viewing for ports 26
local interface, using 13
Local IP Configuration screen, displaying 19
location, assigning 17
logging out 49
Login, reset, and security options screen,
display 45
login settings, changing 45
MAC address
viewing from Console Manager 47
viewing from LCD 12
MAC addresses, associating with ports 41
Main screen, displaying 16
Management Module
assigning a contact name 17
assigning a location 17
naming 17
resetting 45
Management Module MAC address 19
maximum collision count, viewing 43
maximum utilization, viewing 43
MIB
identification 7
locating files 51
navigating
Console Manager 15
LCD 9
netmask, assigning 19
Network Health Checks screen, displaying 36
Network management
through SNMP 13, 14
null modem cable, using 13
octets
viewing for collision domain 28
viewing for individual ports 31
operating status, ports 26
out-of-band connection, serial port 13
overstrike mode, enabling 15
P-R
packet count, viewing from LCD 10
partitioned ports, checking for 26
password
changing 45
default 13
polarity problems, finding 39
Port Configuration screen, displaying 26
Port Statistics (errors) screen, displaying 33
Port Statistics (traffic) screen, displaying 31
58
Page 59

ports
disabling/enabling 26
link status 26
viewing collision count 31
viewing frame count 31
viewing octet count 31
viewing utilization percentage 31
power interruptions, notifying SNMP applica-
tions 24
product name, viewing 47
Quick Start 1
rate mismatches
viewing for collision domain 28
viewing for individual ports 33
viewing from LCD 10
read community string, changing 23
receive pairs, wrong polarity 39
receiving stations, sending traps to 24
remote IP configuration, enabling 21
Remote IP Configuration screen, displaying 21
remote management 14
resetting
10 Mbps hubs 45
100 Mbps hubs 45
individual hubs 45
Management Module 45
with front panel button 46
returning a defective product 53
RMA process 53
router. See default gateway
RS232 port
default parameters 13
setting the baud 12
runts
viewing for collision domain 28
viewing for individual ports 33
viewing from LCD 10
S-T
saturation, finding busy devices 41
screen, LCD. See LCD
security options 45
segmenting, planning 41, 44
serial port baud rate, setting 12
serial port, connecting through 13
short events
viewing for collision domain 28
viewing for individual ports 33
viewing from LCD 10
sleep mode for LCD, setting 11
SNMP applications, sending traps to 24
SNMP community strings, changing 23
SNMP Configuration screen, displaying 23
software version of Management Module
viewing from Console Manager 47
viewing from LCD 12
spacebar, using 15
speed button, locking 45
speed, changing for hub 17
speed mismatches, detecting 37
stack name, assigning 17
stacking hubs 6
statistics, resetting 45
subnet mask
assigning 19
changing from LCD 11
displaying current settings 19
viewing from LCD 12
support Inside back cover
System Configuration screen, displaying 17
tab key, using 15
technical support Inside back cover
Telnet, using 13
toggling insert/overstrike mode 15
Top screen, displaying 16
top talking devices, finding 41
total errors
viewing for collision domain 28
viewing for individual ports 33
traffic
top generating devices 41
utilization history 43
viewing by collision domain 28
viewing by port 31
59
Page 60

transmit pairs, wrong polarity 39
Trap Receiving Stations screen, displaying 24
traps
defining receiving stations 24
displaying in LCD sleep mode 11
types 24
viewing from LCD 12
troubleshooting
customer support Inside back cover
finding wrong polarity cabling 39
finding wrong speed devices 37
keyboard does not work 13, 14
MAC address not displayed 38
port is disabled 27
U-W
update interval, setting for collision domain
statistics 28
usage. See utilization
username
changing 45
default 13
using the Console Manager 13
using the LCD 9
utilization
displaying in LCD 11
viewing for collision domain 28
viewing for individual ports 31
viewing history 43
UTP cable, finding problems 39
vendor name, viewing 47
very long events
viewing for collision domain 28
viewing for individual ports 33
viewing from LCD 10
viewing statistics from LCD 10
VT100 settings 14
wait time for sleep, setting 11
warranty 53
wiring problems, finding 39
write community string, changing 23
Wrong Polarity Cabling screen 39
Wrong Speed Device screen, displaying 37
60
Page 61

Intel Automated Customer Support
You can reach Intel’s automated support services 24 hours a day, every day at no charge. The services contain
the most up-to-date inform ation about Intel products. You can access installation instructions, troubleshooting
information, and general product information.
World Wide Web & Internet FTP Intel BBS
Access Intel’s World Wide Web home page Use Intel’s Bulletin Board. Dial in by
or download information using modem at 8-N-1, and up to 14.4 Kbps.
anonymous FTP.
Troubleshooting
Software updates
Installation notes
Product information
How to access:
WWW
News:
news://cs.intel.com Europe +44-1793-432955
Customer Support:
✓✓
✓
✓✓
✓✓
✓
✓✓
✓✓
✓
✓✓
✓✓
✓
✓✓
US and Canada 1-503-264-7999
http://support.intel.com Worldwide +1-503-264-7999
✓✓
✓
✓✓
FTP
Host:
download.intel.com
Directory:
/enduser_reseller
Intel Customer Support Technicians
Free support for 90 days: You can speak with our technical support professionals free of charge for
90 days after your initial call.
Other support services: You can purchase a range of support services, including 24-hour support,
per-incident support, on-site service, and software and hardware maintenance agreements. For details
about the Intel Support Service options, download document 8549 from one of the automated services.
Worldwide access: Intel has technical support centers worldwide. Many of the centers are staffed by
technicians who speak the local languages. For a list of all Intel support centers, the telephone numbers,
and the times they are open, download document 9089 from one of the automated services.
If you don’t have access to automated services, contact your local dealer or distributor.
Or call +1-916-377-7000 from 07:00 to 17:00 Monday through Friday, U.S. Pacific Time.
03/31/97
 Loading...