

Page 1

Crystal Reports 2008 SP3 User's
Guide
Crystal Reports 2008
windows
Page 2

Copyright
© 2011 SAP AG. All rights reserved.SAP, R/3, SAP NetWeaver, Duet, PartnerEdge,
ByDesign, SAP Business ByDesign, and other SAP products and services
mentioned herein as well as their respective logos are trademarks or registered
trademarks of SAP AG in Germany and other countries. Business Objects and the
Business Objects logo, BusinessObjects, Crystal Reports, Crystal Decisions, Web
Intelligence, Xcelsius, and other Business Objects products and services mentioned
herein as well as their respective logos are trademarks or registered trademarks
of Business Objects S.A. in the United States and in other countries. Business
Objects is an SAP company.All other product and service names mentioned are
the trademarks of their respective companies. Data contained in this document
serves informational purposes only. National product specifications may vary.These
materials are subject to change without notice. These materials are provided by
SAP AG and its affiliated companies ("SAP Group") for informational purposes
only, without representation or warranty of any kind, and SAP Group shall not be
liable for errors or omissions with respect to the materials. The only warranties for
SAP Group products and services are those that are set forth in the express
warranty statements accompanying such products and services, if any. Nothing
herein should be construed as constituting an additional warranty.
2011-05-12
Page 3

Contents
Introduction to Crystal Reports 2008 27Chapter 1
About Crystal Reports................................................................................28
About the Crystal Reports documentation.................................................29
What's New in Crystal Reports 2008 SP3 31Chapter 2
Introduction................................................................................................32
Locate information quickly....................................................................29
Sample Reports....................................................................................29
Flash printing........................................................................................32
Unicode-supported interface................................................................32
Enhanced publishing interface.............................................................32
XML and Web Services Database Driver.............................................33
Viewer Accessibility..............................................................................33
Option to distinguish between empty and non empty rows for SAP
NetWeaver BW Data............................................................................33
HTML interpretation tag <a></a> is now supported.............................34
Installing Crystal Reports 2008 SP3 35Chapter 3
Installation overview..................................................................................36
Installing Crystal Reports 2008 SP3..........................................................36
Installation requirements............................................................................37
Installing Crystal Reports on a local machine............................................37
Creating an installation point and installing from a network server...........40
Creating an installation point for Crystal Reports.................................40
Installing Crystal Reports from a network............................................41
Customizing your installation.....................................................................43
Crystal Reports 2008 SP3 User's Guide 3
Page 4

Contents
Running a silent installation.......................................................................45
Setting custom banners.............................................................................51
Upgrading Crystal Reports components....................................................52
Quick Start 53Chapter 4
Learning how to use Crystal Reports........................................................54
Sample data - Xtreme.mdb..................................................................54
Report Creation Wizards...........................................................................55
Standard...............................................................................................55
Cross-Tab.............................................................................................56
Mailing Label........................................................................................56
OLAP....................................................................................................56
Quick start for new users...........................................................................56
Before you begin..................................................................................57
Creating the report...............................................................................57
Record Selection..................................................................................71
Grouping and sorting............................................................................76
Completing the report...........................................................................80
Quick start for advanced users..................................................................82
Choosing a report type and data source..............................................82
Working with report elements on the Design tab..................................83
Using other reporting features..............................................................85
Report Design Concepts 89Chapter 5
Basic report design....................................................................................90
Deciding on the content of the report........................................................90
Stating the purpose..............................................................................90
Determining the layout of the report ....................................................92
Finding the data....................................................................................92
Manipulating the data...........................................................................94
4 Crystal Reports 2008 SP3 User's Guide
Page 5

Contents
Determining printing area characteristics.............................................95
Developing a prototype on paper..............................................................97
To design a paper prototype.................................................................98
Introduction to Reporting 99Chapter 6
Report creation options............................................................................100
Report Creation Wizards....................................................................100
Another report....................................................................................100
New report..........................................................................................101
Report Creation Wizards....................................................................101
Another report....................................................................................101
New report..........................................................................................102
Choosing data sources and database fields............................................102
The Database Expert.........................................................................102
The Field Explorer..............................................................................105
About the report design environment......................................................108
Design tab..........................................................................................108
Preview tab.........................................................................................112
HTML Preview tab..............................................................................117
Creating a new report..............................................................................118
Selecting the data source...................................................................118
Adding tables......................................................................................119
Linking multiple tables........................................................................120
Placing data on the report .................................................................122
Formatting data .................................................................................131
Record selection.................................................................................131
Grouping, sorting, and summarizing data..........................................131
Using the drill-down option on summarized data...............................132
Using the zoom feature......................................................................133
Inserting page headers and footers...................................................133
Adding a title page to the report ........................................................134
Crystal Reports 2008 SP3 User's Guide 5
Page 6

Contents
Adding summary information to the report.........................................135
Exploring reports and working with multiple reports................................136
The Report Explorer...........................................................................136
The Workbench..................................................................................138
The Dependency Checker..................................................................140
Opening and docking explorers.........................................................142
Beyond basic reports...............................................................................143
BusinessObjects Enterprise Repository 145Chapter 7
What is the BusinessObjects Enterprise Repository? ............................146
Work flow............................................................................................146
Accessing the BusinessObjects Enterprise Repository...........................148
To open the BusinessObjects Enterprise Repository.........................148
Toolbar................................................................................................149
Adding subfolders and subcategories to the repository...........................150
To add a new subfolder or subcategory.............................................150
Adding items to the repository.................................................................151
Adding a text object or bitmap image.................................................151
Adding a text object or bitmap image - another method....................152
Adding a custom function ..................................................................153
Adding a command ...........................................................................153
Using repository objects in reports .........................................................154
Adding a text object or a bitmap image to a report............................154
Adding a custom function to a report.................................................155
Adding a command to a report...........................................................155
Adding a list of values to a parameter................................................156
Modifying objects in the repository..........................................................156
To modify a repository object..............................................................157
Updating connected repository objects in reports ..................................157
To set the update option.....................................................................158
Deleting items from the repository...........................................................158
6 Crystal Reports 2008 SP3 User's Guide
Page 7

Contents
To delete an object from the repository..............................................159
Using Undo in the repository...................................................................159
Designing Optimized Web Reports 161Chapter 8
Overview..................................................................................................162
Key strategies for optimizing web reports..........................................163
Scale with BusinessObjects Enterprise...................................................163
Evaluation times for date functions in BusinessObjects Enterprise....165
Making the right design choices..............................................................166
Using faster report formats.................................................................166
Choosing between live and saved data.............................................167
Designing summary reports...............................................................169
To hide details in a summary report...................................................170
Using subreports carefully..................................................................170
Using other design elements effectively.............................................172
Designing reports to maximize data sharing......................................173
Streamlining your reporting environment.................................................174
Selecting the fastest database and connection..................................174
Using table indexes............................................................................174
Improving table-linking choices..........................................................174
Using thread-safe database drivers...................................................176
Using stored procedures for faster processing..................................177
Using enhanced record selection formulas ............................................177
Pushing down record selection—an example....................................178
Record selection performance tips.....................................................179
Strategies for writing efficient record selection formulas ...................180
Incorporating parameter fields into record selection formulas ..........182
Using SQL expressions where appropriate........................................185
Improving grouping, sorting, and totaling ...............................................186
Performing grouping on server...........................................................186
Benefits of grouping on server—an example.....................................187
Crystal Reports 2008 SP3 User's Guide 7
Page 8

Contents
Using SQL Expressions for groups, sorts, and totals.........................188
Using SQL Expressions for Case Logic.............................................188
Inserting summary and running total fields where possible...............189
Record Selection 191Chapter 9
Selecting records.....................................................................................192
Options for selecting records..............................................................192
Determining which field(s) to use.......................................................192
Using the Select Expert......................................................................193
Using formulas...................................................................................195
Interaction of the Select Expert and the Formula Editor....................196
To view the Select Expert formula......................................................197
Saved data selection formulas...........................................................199
Using formula templates..........................................................................199
Record selection formula templates...................................................199
Pushing down record selection to the database server...........................202
Troubleshooting record selection formulas .............................................203
To troubleshoot record selection formulas.........................................203
Correcting selections that do not generate data................................205
Sorting, Grouping, and Totaling 209Chapter 10
Sorting data.............................................................................................210
Understanding sort options................................................................210
Sorting single and multiple fields........................................................213
Sort controls ......................................................................................215
Grouping data..........................................................................................217
Group and sort direction.....................................................................218
Creating custom groups.....................................................................220
Sorting groups conditionally...............................................................221
Sorting records within groups.............................................................223
8 Crystal Reports 2008 SP3 User's Guide
Page 9

Contents
Group selection..................................................................................224
Grouping data in intervals..................................................................229
Grouping by the first letter of a company name.................................231
Grouping data hierarchically...............................................................233
Editing groups....................................................................................241
Summarizing grouped data.....................................................................241
To summarize grouped data...............................................................242
Ordering groups by summarized values............................................243
Selecting top or bottom N groups or percentages .............................244
Selecting top or bottom groups or percentages conditionally............247
Subtotaling...............................................................................................248
Subtotaling data.................................................................................248
Extending prices and subtotaling the extensions...............................249
Percentages.............................................................................................251
Calculating a percentage ...................................................................251
Group headers.........................................................................................253
Creating group headers .....................................................................253
Suppressing group headers...............................................................257
Drilling-down on group headers.........................................................257
Running Totals 259Chapter 11
Understanding running totals...................................................................260
How running totals work.....................................................................260
Creating running totals.............................................................................262
Creating running totals in a list ..........................................................262
Creating running totals for a group.....................................................263
Creating conditional running totals ....................................................265
Creating running totals in a one-to-many linking relationship............267
Creating running totals using a formula...................................................268
To create running totals using a formula............................................269
Crystal Reports 2008 SP3 User's Guide 9
Page 10

Contents
Multiple Section Reports 273Chapter 12
About sections.........................................................................................274
Working with sections..............................................................................274
Inserting a section..............................................................................275
Deleting a section...............................................................................275
Moving a section................................................................................276
Merging two related sections..............................................................276
Splitting and resizing sections.................................................................277
Splitting a section...............................................................................278
Resizing a section..............................................................................278
Using multiple sections in reports ...........................................................279
Keeping variable length objects from overwriting each other.............279
Eliminating blank lines when fields are empty ...................................281
Adding blank lines conditionally ........................................................281
Form letters..............................................................................................282
Working with text objects....................................................................283
Creating a form letter using a text object...........................................285
Printing conditional messages in form letters.....................................291
Formatting 293Chapter 13
Formatting concepts................................................................................294
Using a template......................................................................................294
Applying a template............................................................................295
Removing an applied template...........................................................296
Reapplying the last template selected...............................................297
Using Template Field Objects.............................................................297
Template considerations.....................................................................299
Using the Report Design Environment....................................................302
Section characteristics.......................................................................302
10 Crystal Reports 2008 SP3 User's Guide
Page 11

Contents
Making an object underlay a following section...................................303
Pre-printed forms................................................................................305
Multiple columns.................................................................................305
Hiding report sections.........................................................................306
Hiding report objects..........................................................................307
Placing text-based objects.................................................................310
Placing multi-line, text-based objects.................................................314
Importing text-based objects from a file.............................................315
Spacing between text-based objects.................................................315
Overflow Field Representation...........................................................322
Selecting multiple objects...................................................................323
Vertical placement..............................................................................324
Inserting character and line spacing..................................................324
Setting fractional font sizes................................................................325
Setting page size and page orientation..............................................326
Setting page margins.........................................................................327
TrueType fonts....................................................................................328
Printer drivers.....................................................................................328
Formatting a report for web viewing...................................................329
Formatting properties...............................................................................330
Working with absolute formatting ............................................................330
Adding borders, color, and shading to a field ....................................331
Making a report, section, area, or object read-only............................331
Locking an object's size and position.................................................332
Changing your default field formats...................................................333
Adding and editing lines ....................................................................335
Adding and editing boxes...................................................................336
Expected behavior of line and box formatting....................................337
Adding shapes to a report..................................................................341
Scaling, cropping, and sizing objects.................................................342
Using conventional accounting formats.............................................343
Crystal Reports 2008 SP3 User's Guide 11
Page 12

Contents
Repeating report objects on horizontal pages ...................................344
Using white space between rows ......................................................346
Working with conditional formatting.........................................................348
Conditional on or off properties..........................................................349
Conditional attribute properties..........................................................350
Changing fonts conditionally..............................................................352
Changing margins conditionally.........................................................352
Changing X position conditionally......................................................353
Creating footers after the first page....................................................354
Using the Highlighting Expert.............................................................356
Undo/Redo activities..........................................................................360
Using the Format Painter ........................................................................361
To copy and apply formatting.............................................................362
Working with barcodes............................................................................363
Adding a barcode...............................................................................363
Changing the appearance of a barcode.............................................364
Removing a barcode..........................................................................365
Charting 367Chapter 14
Charting concepts....................................................................................368
Charting overview...............................................................................368
Chart layouts .....................................................................................369
Chart types.........................................................................................370
Where to place a chart ......................................................................373
Drill-down with charts.........................................................................374
Drill-down with legends......................................................................374
Creating charts........................................................................................374
Charting on details or formula fields (Advanced layout).....................375
Charting on summary or subtotal fields (Group layout) .....................377
Charting on Cross-Tab summaries (Cross-Tab layout) .....................378
Charting on an OLAP cube (OLAP layout) ........................................380
12 Crystal Reports 2008 SP3 User's Guide
Page 13

Contents
Working with charts.................................................................................381
Editing charts using the Chart Expert.................................................381
Editing charts using the Chart Options menu items...........................382
Editing charts using other menu items...............................................382
Using the zooming features with bar and line charts.........................384
Auto-arranging charts.........................................................................385
Formatting charts...............................................................................385
Using the underlay feature with charts...............................................386
Mapping 389Chapter 15
Mapping concepts....................................................................................390
Mapping overview..............................................................................390
Map layouts........................................................................................390
Map types...........................................................................................391
Where to place a map........................................................................394
Drill-down with maps..........................................................................395
Creating maps.........................................................................................395
Mapping on details fields (Advanced layout) .....................................395
Mapping on group fields (Group layout).............................................399
Mapping on Cross-Tab summaries (Cross-Tab layout)......................400
Mapping on an OLAP cube (OLAP layout)........................................401
Working with maps..................................................................................403
Editing maps using the Map Expert...................................................403
Changing the map title.......................................................................403
Changing the map type......................................................................404
Changing map layers.........................................................................404
Resolving data mismatches...............................................................406
Changing the geographic map...........................................................407
Zooming in and out on a map.............................................................407
Panning a map...................................................................................408
Centering a map.................................................................................408
Crystal Reports 2008 SP3 User's Guide 13
Page 14

Contents
Hiding and showing the Map Navigator ............................................408
Formatting Maps................................................................................410
Using the underlay feature with maps................................................410
OLE 413Chapter 16
OLE overview..........................................................................................414
OLE terminology.................................................................................414
Types of OLE objects.........................................................................415
General OLE considerations..............................................................416
Inserting OLE objects into reports...........................................................416
To copy and paste OLE objects .........................................................417
How OLE objects are represented in a report.........................................417
Editing OLE objects in reports.................................................................418
In-place editing...................................................................................418
Dynamic OLE menu commands........................................................418
OLE and the Insert Picture command................................................419
Working with static OLE objects..............................................................419
Inserting a static OLE object..............................................................420
Making a static OLE object dynamic..................................................420
Converting a static OLE object to a bitmap image object..................421
Working with embedded vs. linked objects..............................................422
Embedded objects..............................................................................422
Linked objects....................................................................................423
Integrating Shockwave Flash (SWF) objects...........................................425
Printing Shockwave Flash (SWF) objects..........................................426
Adding an Xcelsius SWF object to a report .......................................426
Using data binding to bind an Xcelsius SWF object to a report.........427
Cross-Tab Objects 429Chapter 17
What is a Cross-Tab object?....................................................................430
14 Crystal Reports 2008 SP3 User's Guide
Page 15

Contents
Cross-Tab example..................................................................................431
Report of order data - no sorting/grouping.........................................432
Report of order data - grouped by region...........................................433
Report of order data - grouped by product.........................................434
Report of order data - grouped by region and product.......................434
Order data in a Cross-Tab object.......................................................435
Creating a Cross-Tab report....................................................................437
To create a new cross-tab report........................................................437
To add a Cross-Tab to an existing report...........................................437
Specifying the data source.................................................................439
Modifying the links..............................................................................440
Adding a chart....................................................................................440
Selecting records................................................................................440
Defining the structure of the Cross-Tab..............................................441
Applying a predefined style and finishing the report..........................442
Adding a Cross-Tab to an existing report using the Cross-Tab Expert.442
Working with Cross-Tabs.........................................................................445
Showing values as percentages........................................................445
Abbreviating large summarized fields ...............................................446
Customizing row/column labels..........................................................447
Using running totals in Cross-Tabs....................................................448
Printing Cross-Tabs that span multiple pages ...................................449
Formatting Cross-Tabs............................................................................450
Changing width, height, and alignment of Cross-Tab cells ...............450
Formatting background color of entire rows/columns........................450
Formatting fields individually .............................................................451
Formatting several fields at one time.................................................451
Suppressing Cross-Tab data..............................................................451
Displaying summarized fields horizontally.........................................453
Advanced Cross-Tab features.................................................................453
Calculated Members..........................................................................454
Crystal Reports 2008 SP3 User's Guide 15
Page 16

Contents
Embedded Summaries.......................................................................458
Building Queries 461Chapter 18
Connecting to a universe.........................................................................462
To connect to a universe....................................................................462
Defining the data selection for a query....................................................463
To build a simple query.......................................................................463
To create a combined query...............................................................464
Quick reference to objects..................................................................465
Editing an existing query..........................................................................466
To edit an existing query.....................................................................467
Viewing the SQL behind a query.............................................................467
To view the SQL when you create a query.........................................467
To view the SQL after you have created a query...............................468
Query filters and prompts........................................................................468
Creating query filters..........................................................................468
Building prompts.................................................................................469
Combining query filters and prompts.................................................471
Using And or Or to combine query filters...........................................471
Quick reference to query filter operators............................................472
Editing and removing query filters......................................................475
Filtering data using subqueries and database ranking............................476
What is a subquery?...........................................................................476
Building a subquery............................................................................477
What is a database ranking?..............................................................480
Creating a database ranking..............................................................480
Creating and Updating OLAP Reports 485Chapter 19
OLAP reporting with Crystal Reports.......................................................486
OLAP grid objects..............................................................................486
16 Crystal Reports 2008 SP3 User's Guide
Page 17

Contents
Creating an OLAP report.........................................................................487
To create an OLAP report...................................................................487
Specifying the data source.................................................................487
Defining the structure of the grid........................................................488
Setting sliced dimensions and specifying the number of grids...........490
Applying a predefined style................................................................492
Inserting a chart..................................................................................493
Updating an OLAP report........................................................................493
To update a cube location in an OLAP grid object.............................494
Updating the database location..........................................................495
Formatting data in an OLAP grid.............................................................495
Changing the background color of a dimension.................................496
Creating an alias for a dimension.......................................................497
Formatting grid lines...........................................................................498
Labelling dimensions..........................................................................498
Changing the view of OLAP data ...........................................................498
To show or hide dimension members ................................................499
To create asymmetry in an OLAP grid...............................................499
To add totals to an OLAP grid............................................................499
To change the display format for member names..............................500
To alter the data displayed in the OLAP grid......................................500
To pivot an OLAP grid .......................................................................500
To define the order of fields in the OLAP grid ...................................500
Sorting and filtering OLAP grid data........................................................501
Sorting data in an OLAP grid .............................................................501
Filtering data in an OLAP grid ...........................................................503
Adding calculations to OLAP grids .........................................................504
Printing, Exporting, and Viewing Reports 505Chapter 20
Distributing reports...................................................................................506
Printing a report..................................................................................506
Crystal Reports 2008 SP3 User's Guide 17
Page 18

Contents
Faxing a report...................................................................................506
Exporting a report...............................................................................507
Working with Web folders...................................................................521
Working with Enterprise folders .........................................................522
Viewing reports........................................................................................525
What are Report Parts?......................................................................526
What is navigation?............................................................................526
The Report Part Drilldown option.......................................................530
The Another Report Object option.....................................................533
Hyperlinks displayed in the viewers...................................................540
Creating an Enterprise Hyperlink.......................................................542
Using smart tags......................................................................................543
To use smart tags with a Crystal Reports object................................544
Report Alerts 545Chapter 21
About Report Alerts ................................................................................546
Working with Report Alerts......................................................................546
Creating Report Alerts........................................................................546
Editing Report Alerts..........................................................................549
Deleting Report Alerts........................................................................550
Viewing Report Alerts.........................................................................550
Referring to Report Alerts in formulas................................................551
Using Formulas 553Chapter 22
Formulas overview...................................................................................554
Typical uses for formulas....................................................................554
Formula components and syntax............................................................555
Formula components .........................................................................556
Formula syntax...................................................................................557
User Function Libraries in formulas.........................................................558
18 Crystal Reports 2008 SP3 User's Guide
Page 19

Contents
Specifying formulas.................................................................................559
Working with the Formula Workshop.................................................560
Working with the Formula Editor........................................................566
Creating and modifying formulas.............................................................572
Creating a formula and inserting it into a report.................................572
Creating a formula in the Formula Expert .........................................573
Editing formulas..................................................................................575
Searching for formula text..................................................................575
Copying formulas...............................................................................576
Deleting formulas.....................................................................................578
Removing the working formula from your report................................579
Deleting the formula specification......................................................579
Debugging formulas.................................................................................579
Debugging evaluation time errors......................................................580
Debugging tutorial..............................................................................580
Parameter Fields and Prompts 587Chapter 23
Parameter and prompt overview ............................................................588
Parameter field considerations...........................................................588
Prompt considerations........................................................................590
Data and non-data parameters..........................................................590
Optional parameters...........................................................................591
Understanding dynamic prompts.............................................................592
Understanding lists of values...................................................................595
List-of-values types............................................................................596
Determining which list-of-values type to use......................................599
Lists of values and prompt groups contrasted...................................601
Creating a parameter with a static prompt...............................................602
To create a parameter with a static prompt........................................602
To incorporate the parameter into the record selection filter..............605
To incorporate the parameter into a saved data selection formula.....606
Crystal Reports 2008 SP3 User's Guide 19
Page 20

Contents
Creating a parameter with a dynamic prompt..........................................607
To create a parameter with a dynamic prompt...................................607
Creating a parameter with a cascading list of values..............................609
To create a parameter with a cascading list of values........................610
The Parameter Panel...............................................................................612
Working with lists of values......................................................................613
Sharing common lists of values within a report..................................614
Using separate value and description fields.......................................616
Using command objects as list-of-values data sources.....................617
Null handling.......................................................................................617
Long lists of values.............................................................................618
Best practices for prompting....................................................................619
Unmanaged reports............................................................................619
Managed reports................................................................................619
Converting unmanaged reports to managed reports.........................620
Deploying managed reports with dynamic prompts...........................621
Deleting parameter fields.........................................................................621
To delete a parameter that is not used in a formula...........................622
To delete a parameter used with the Select Expert............................622
To delete a parameter that is used in a formula.................................623
Responding to parameter field prompts..................................................623
Previewing a report for the first time...................................................623
Refreshing report data........................................................................624
Advanced parameter features.................................................................625
Creating a parameter with multiple prompting values........................625
Applying conditional formatting using parameter fields......................626
Creating a report title using parameter fields.....................................627
Specifying single or ranges of values.................................................628
Incorporating a parameter into a formula...........................................629
Defining sort order using parameter fields.........................................630
Defining entry type and format using the Edit Mask...........................631
20 Crystal Reports 2008 SP3 User's Guide
Page 21

Contents
Creating a saved-data record filter using parameter fields................633
To create a saved-data record filter using parameter fields...............634
To create a parameter appearing on the Parameter Panel................634
To incorporate the parameter into a saved data selection formula.....635
Adding dynamic grouping using parameter fields..............................636
Subreports 639Chapter 24
What are subreports?..............................................................................640
Unlinked vs. linked subreports...........................................................641
How subreport linking works..............................................................642
Inserting subreports.................................................................................644
Previewing subreports........................................................................645
Saving a subreport as a primary report..............................................645
Updating subreports...........................................................................646
Linking a subreport to the data in the primary report...............................647
To link a subreport to the data in the primary report...........................648
Linking a subreport to the main report without modifying the selection
formula...............................................................................................649
Combining unrelated reports by using subreports ..................................650
Combining two or more unrelated reports..........................................650
Using subreports with unlinkable data.....................................................651
Linking to/from a formula field............................................................652
Linking unindexed tables....................................................................653
Creating an on-demand subreport...........................................................653
To create an on-demand subreport....................................................654
Adding captions to on-demand subreports........................................654
Showing different views of the same data in a report..............................655
Understanding Databases 657Chapter 25
Databases overview................................................................................658
Crystal Reports 2008 SP3 User's Guide 21
Page 22

Contents
Relational database basics................................................................658
Aliases ...............................................................................................659
Locating files......................................................................................661
Indexed tables....................................................................................662
Linking tables...........................................................................................665
Link from and link to...........................................................................665
Link relationships................................................................................665
Performance considerations in one-to-many links.............................666
Data file considerations......................................................................670
SQL database considerations............................................................673
Performance considerations for all reports........................................674
The Database Expert Links tab..........................................................676
Linking indexed tables........................................................................676
Link processing order.........................................................................677
Linking options...................................................................................678
Using SQL and SQL databases..............................................................696
What is SQL?.....................................................................................696
SQL DBMS.........................................................................................699
How does Crystal Reports use SQL? ...............................................700
The SQL language.............................................................................701
Server-side processing............................................................................704
How server-side grouping affects the SQL query..............................705
Mapping database fields..........................................................................707
About the Map Fields dialog box........................................................707
Remapping processes........................................................................708
Remapping altered database fields....................................................710
Saved Data Indexes................................................................................711
How Report Indexing works...............................................................712
Considerations for using Saved Data Indexes...................................713
Indexing the right field(s)....................................................................713
Unicode support in Crystal Reports.........................................................714
22 Crystal Reports 2008 SP3 User's Guide
Page 23

Contents
For additional information........................................................................714
Accessing Data Sources 715Chapter 26
Introduction..............................................................................................716
Six types of data.................................................................................716
Direct access database files ...................................................................717
Advantages........................................................................................717
Disadvantages....................................................................................718
Three layers.......................................................................................718
Common database formats................................................................719
ODBC data sources ................................................................................730
Advantages........................................................................................731
Disadvantages....................................................................................732
Five layers..........................................................................................732
Installing database clients..................................................................735
To ensure correct ODBC DSN configuration......................................735
Common ODBC database formats....................................................736
JDBC data sources .................................................................................740
JNDI ..................................................................................................740
Five layers..........................................................................................741
Supported JDBC database formats...................................................742
Configuring the Crystal Reports JDBC driver.....................................743
Business Objects universes....................................................................743
Business Views........................................................................................744
Crystal SQL Designer files.......................................................................745
Crystal Dictionary files.............................................................................746
Report Processing Model 749Appendix A
Overview .................................................................................................750
What is a "pass"? ..............................................................................750
Crystal Reports 2008 SP3 User's Guide 23
Page 24

Contents
Pre-pass 1..........................................................................................750
Pass 1................................................................................................750
Pre-pass 2..........................................................................................751
Pass 2................................................................................................751
Pass 3................................................................................................752
Crystal Reports Error Messages 753Appendix B
Drive:\filename.extension........................................................................754
Drive:\test.rpt...........................................................................................754
Failed to load database connector..........................................................755
Failed to open the connection. Details: [Database Vendor Code: <vendor
code number>].........................................................................................755
Failed to retrieve data from the database. Details: [Database Vendor Code:
<vendor code number>]...........................................................................756
Creating Accessible Reports 759Appendix C
About accessibility ..................................................................................760
Benefits of accessible reports............................................................760
About the accessibility guidelines......................................................762
Accessibility and Business Objects products.....................................763
Improving report accessibility..................................................................763
Placing objects in reports...................................................................764
Text.....................................................................................................766
Color...................................................................................................770
Navigation..........................................................................................772
Parameter fields.................................................................................773
Designing for flexibility.............................................................................773
Accessibility and conditional formatting.............................................774
Accessibility and suppressing sections..............................................775
Accessibility and subreports...............................................................776
Improving data table accessibility............................................................777
24 Crystal Reports 2008 SP3 User's Guide
Page 25

Contents
Text objects and data table values.....................................................777
Other data table design considerations..............................................783
Accessibility and BusinessObjects Enterprise.........................................784
Setting accessible preferences for BusinessObjects Enterprise........785
Accessibility and customization...............................................................785
Resources................................................................................................787
More Information 789Appendix D
Index 793
Crystal Reports 2008 SP3 User's Guide 25
Page 26

Contents
26 Crystal Reports 2008 SP3 User's Guide
Page 27
Introduction to Crystal Reports 2008
1
Page 28

Introduction to Crystal Reports 2008
1
About Crystal Reports
About Crystal Reports
Crystal Reports is designed to work with your database to help you analyze
and interpret important information. Crystal Reports makes it easy to create
simple reports, and, it also has the comprehensive tools you need to produce
complex or specialized reports.
Create any report you can imagine
Crystal Reports is designed to produce the report you want from virtually
any data source. Built-in report experts guide you step by step through
building reports and completing common reporting tasks. Formulas,
cross-tabs, subreports, and conditional formatting help make sense of data
and uncover important relationships that might otherwise be hidden.
Geographic maps and graphs communicate information visually when words
and numbers are simply not enough.
Extend reporting to the Web
The flexibility of Crystal Reports doesn't end with creating reports — your
reports can be published in a variety of formats including Microsoft Word
and Excel, E-mail and even over the Web. Advanced Web reporting lets
other members of your workgroup view and update shared reports inside
their web browser.
Incorporate reports into applications
Application and web developers can save time and meet their users needs
by integrating the report processing power of Crystal Reports into their
database applications. Support for most popular development languages
makes it easy to add reporting to any application.
28 Crystal Reports 2008 SP3 User's Guide
Page 29

Introduction to Crystal Reports 2008
About the Crystal Reports documentation
Whether it's the web master in IT, the promotion manager in marketing, the
database administrator in finance or the CEO, Crystal Reports is a powerful
tool designed to help everyone analyze and interpret the information that's
important to them.
About the Crystal Reports documentation
The Crystal Reports documentation includes procedures for typical reporting
tasks such as placing fields, formatting reports, and sorting records. It also
contains information on more specific areas of interest such as advanced
formula creation and accessing different types of data. Use the documentation
as a reference for your basic reporting needs as well as an introduction to
new concepts in report creation.
Locate information quickly
• Access online help from the Crystal Reports help menu.
Use the Contents tab to view all major sections in the online help and drill
down to specific headings within each section, the Index tab to view topics
in alphabetical order, and the Search tab to enter a keyword to view all
the sections that relate to the keyword.
1
• Access a PDF version of the Crystal Reports documentation online at
http://support.businessobjects.com/documentation.
The PDF version contains a subset of the topics found in the online help,
along with additional sections—such as a Quick Start—that can help you
learn Crystal Reports.
Sample Reports
Many topics in the Crystal Reports documentation include a list of related
sample reports. Use these reports to illustrate concepts the topic describes.
The sample reports can be adapted to your own needs.
Sample reports are located on the Business Objects Technical Support web
site http://support.businessobjects.com/samples/.
Crystal Reports 2008 SP3 User's Guide 29
Page 30

Introduction to Crystal Reports 2008
About the Crystal Reports documentation
1
30 Crystal Reports 2008 SP3 User's Guide
Page 31

What's New in Crystal Reports 2008 SP3
2
Page 32

What's New in Crystal Reports 2008 SP3
2
Introduction
Introduction
This section provides a high-level overview of the components, features, and
benefits that are provided by the latest release of Crystal Reports.
The following is an overview of the new features in Crystal Reports 2008
SP1.
•
Flash printing
•
Unicode-supported interface
•
Enhanced publishing interface
•
XML and Web Services Database Driver
•
Viewer Accessibility
Flash printing
Crystal Reports 2008 allows you to print SWF objects in your report without
the need to first export the report to PDF.
The printing option can print SWF objects that have data binding as well as
SWF objects that do not have data binding.
Unicode-supported interface
Crystal Reports 2008 now has a Unicode-capable interface that allows you
to use User Function Libraries (UFLs) for multilingual information processing.
For example, in a multilingual report, you can use the UFLs to access and
translate the multilingual text.
Enhanced publishing interface
The Crystal Reports 2008 Publishing page now allows you to set parameter
values for all recipients from the Personalization page. Other improved
usability functions include selecting destinations, PDF merging, and a better
shared publishing workflow.
32 Crystal Reports 2008 SP3 User's Guide
Page 33

What's New in Crystal Reports 2008 SP3
Introduction
XML and Web Services Database Driver
Web services created with SOAP 1.2 are now accessible to Crystal Reports
XML and Web Services driver. This includes new architectures such as .NET
3.0 (Windows Communication Foundation).
Also, the Crystal Reports XML Web Services driver recognizes a Web Service
that returns an ADO.NET DataSet.
Viewer Accessibility
The Webform (DHTML) viewer is now accessible. The enhanced cross-tab
objects can now be navigated by a screen reader.
Option to distinguish between empty and non empty rows for SAP NetWeaver BW Data
2
When you want your report to show all SAP NetWeaver BW data records,
including the empty ones, you can use the new “Show Empty Data” option.
This option has been added to the SAP NetWeaver BW MDX driver to allow
empty data records to be displayed.
The “Show Empty Data” option can be selected when you create the
connecetion (on SAP System Login).
When the “Show Empty Data” option is selected, empty data rows will be
displayed in the report as valid data.
Note:
Setting “Show Empty data” to true will downgrade the data retrieval
performance, so the default value for the option is False. This also applies
when opening a report created with previous versions of this product.
Crystal Reports 2008 SP3 User's Guide 33
Page 34

What's New in Crystal Reports 2008 SP3
2
Introduction
HTML interpretation tag “<a></a>” is now supported
When you add a hyperlink to your report, you can now use the “<a></a> ”
tag to display text instead of the hyperlink.
Example:
<a href="http://www.sap.com">SAP.COM</a>
Note:
Only the “href” linking property is supported; other HTML 4.01 linking properties
are not supported.
34 Crystal Reports 2008 SP3 User's Guide
Page 35

Installing Crystal Reports 2008 SP3
3
Page 36

Installing Crystal Reports 2008 SP3
3
Installation overview
Installation overview
The Crystal Reports Installation Wizard works with Microsoft Windows Installer
to guide you through the installation process. The Installation Wizard
automatically recognizes your computer's operating system and updates
files as required.
Note:
Data-Direct ODBC driver installers are not included as part of the Crystal
Reports installer. Instead, you must download and run these installers
separately.
Installing Crystal Reports 2008 SP3
This section provides step-by-step instructions for installing Crystal Reports
and shows how to customize your installation. The main topics are:
•
Installation requirements
•
Installing Crystal Reports on a local machine
•
Creating an installation point and installing from a network server
•
Customizing your installation
•
Running a silent installation
•
Setting custom banners
•
Upgrading Crystal Reports components
As one of the final steps in the installation process, you'll be asked if you
want to register the product. Follow the on-screen instructions to complete
this process.
36 Crystal Reports 2008 SP3 User's Guide
Page 37

Installation requirements
Minimum installation requirements
Operating Systems
Installing Crystal Reports 2008 SP3
Installation requirements
Windows Vista and Vista SP1
Windows XP Professional SP2
Windows 2003 Server
Windows 2008 server
3
Computer/Processor
Memory
Disk space
Note:
The Java components require a J2EE 1.6 compatible runtime, which is
automatically installed at the same time as Crystal Reports.
450 MHz or higher Pentium-compatible CPU
At least 128 megabytes (MB) of
RAM. 256 MB recommended. 4 gigabytes (GB) maximum
1.0 gigabyte minimum. 1.5 gigabytes
recommended
CD-ROM or DVD driveDrive
Installing Crystal Reports on a local machine
If you are installing Crystal Reports on a computer running any of the
supported operating systems (see Minimum installation requirements above),
you must have Administrator privileges. The installation process creates
Crystal Reports 2008 SP3 User's Guide 37
Page 38

Installing Crystal Reports 2008 SP3
3
Installing Crystal Reports on a local machine
registry entries and may update some system files that require Administrator
rights.
Close all currently running programs and stop as many services as possible
when installing Crystal Reports.
If you want to limit the features you install, see Customizing your installation.
To install on a local machine
1. Unless Autoplay is enabled for your CD-ROM drive, run Setup.exe from
the win32_x86 directory of your product distribution.
Note:
Depending on the configuration of your current system, you may receive
a dialog box informing you to update existing files. If this happens, click
Yes and restart your machine. The Installation Wizard updates the required
files.
2. Choose the language in which you want to install Crystal Reports.
3. Indicate whether or not you want to create a log file during installation (it
is enabled by default ).
4. Click OK.
5. When the Welcome dialog box appears, click Next.
6. Read and accept the License Agreement to proceed with the installation.
7. In the User Information dialog box, type your name, organization, and the
product activation keycode.
8. Click Next.
9. In the Choose Language Packs dialog box, select the languages that you
want to install.
10. Click Next.
The Select Installation Type dialog box appears.
38 Crystal Reports 2008 SP3 User's Guide
Page 39

Installing Crystal Reports 2008 SP3
Installing Crystal Reports on a local machine
3
11. Choose the type of installation that you want to perform:
• Typical installs the most common application features.
• Custom enables you to choose the features that you want installed,
to specify where they will be installed, and to check the disk space
required by each feature. For details, see Customizing your installation
.
12. Click Browse if you want to install Crystal Reports to a directory different
from the default location.
The default location for Crystal Reports is C:\Program
Files\Business Objects\
13. Click Next.
The Start Installation dialog box appears.
Note:
If you install Crystal Reports in Custom Installation Mode on a machine
with an Internet connection, you can choose to disable the automatic Web
Update Service feature. This features lets you check for updates and
Crystal Reports 2008 SP3 User's Guide 39
Page 40

Installing Crystal Reports 2008 SP3
3
Creating an installation point and installing from a network server
service packs each time you open Crystal Reports; if you disable it, you
cannot activate it later.
14. Click Next to begin copying files to your local drive.
Creating an installation point and
installing from a network server
Installing Crystal Reports from a central network location involves two steps:
1. Make a copy of your Crystal Reports product distribution on a server
machine on the network (this copy becomes your installation point). See
Creating an installation point for Crystal Reports.
2. Access the server machine from a workstation, and run Setup.exe to
install Crystal Reports on the workstation. See Installing Crystal Reports
from a network.
Creating an installation point for Crystal Reports
This procedure must be performed by a network administrator who has write
access and network privileges. When this procedure is complete, end users
will be able to access Setup.exe from the network to install Crystal Reports
onto their local machines.
Note:
If users do not have the Microsoft Windows Installer configured on their
machines, the setup process detects the workstation's operating system and
installs the appropriate Microsoft Windows Installer package.
To create an installation point
1. Create a folder on your network, and share this folder for the users who
need to run the Setup.exe.
2. Copy the entire contents of your Crystal Reports product distribution to
the folder that you created in step 1.
3. Assign rights to the users who need to install Crystal Reports from this
folder.
40 Crystal Reports 2008 SP3 User's Guide
Page 41

Installing Crystal Reports 2008 SP3
Creating an installation point and installing from a network server
Note:
Restricting access to this folder lets you stay within your license limit.
Installing Crystal Reports from a network
If your network administrator has copied Crystal Reports to the network,
make sure you have read privileges to that network before beginning this
process.
If you are installing Crystal Reports on a computer running any of the
supported operating systems (see Minimum installation requirements), you
must have Administrator privileges on the computer. The installation process
creates registry entries and may update some system files that require
Administrator rights.
Close all currently running programs and stop as many services as possible
when installing Crystal Reports.
3
To install Crystal Reports from a network
1. Access the folder on the network that contains the Crystal Reports
installation files.
2. Double-click Setup.exe.
Note:
Depending on the configuration of your current system, you may receive
a dialog box informing you to update existing files. If this happens, click
Yes and restart your machine. The Installation Wizard updates the required
files.
3. Choose the language in which you want to install Crystal Reports.
4. Indicate whether or not you want to create a log file during installation (it
is enabled by default ).
5. Click OK.
6. When the Welcome dialog box appears, click Next.
7. Read and accept the License Agreement to proceed with the installation,
then click Next.
8. In the User Information dialog box, type your name, organization, and the
product activation keycode.
Crystal Reports 2008 SP3 User's Guide 41
Page 42

Installing Crystal Reports 2008 SP3
3
Creating an installation point and installing from a network server
Tip:
You may need to contact your Administrator for the product activation
keycode.
9. Click Next.
10. In the Choose Language Packs dialog box, select the languages that you
want to install.
11. Click Next.
The Select Installation Type dialog box appears.
12. Choose the type of installation that you want to perform:
• Typical installs the most common application features.
• Custom enables you to choose the features that you want installed,
to specify where they will be installed, and to check the disk space
required by each feature. For details, see Customizing your installation
.
13. Click Browse if you want to install Crystal Reports to a directory different
from the default location.
42 Crystal Reports 2008 SP3 User's Guide
Page 43

Installing Crystal Reports 2008 SP3
The default location for Crystal Reports is C:\Program
Files\Business Objects\
14. Click Next to begin copying files to your local drive.
Customizing your installation
Selecting the Custom installation option invokes the Select Features dialog
box, which allows you to install specific features, to change the default
location of various features, and to check the amount of disk space required
by each feature.
Customizing your installation
3
The icons in the feature tree indicate whether the feature and its subfeatures
will be installed or not:
• A white icon means that the feature and all its subfeatures will be installed.
• A shaded icon means that the feature and some of its subfeatures will
be installed.
• A yellow 1 means that the feature will be installed when required (installed
on demand).
Crystal Reports 2008 SP3 User's Guide 43
Page 44

Installing Crystal Reports 2008 SP3
3
Customizing your installation
• A red X means that the feature or subfeature is either unavailable or will
not be installed.
Crystal Reports uses an "install on-demand" technology for some of its
features. As a result, the very first time a particular feature is used after being
installed, there may be an extra wait for the "install on-demand" to complete.
This behavior will affect new installations only once and will not occur when
features are restarted.
To select the configuration and location of a feature or subfeature, click its
icon.
Note:
Each feature or subfeature can have its own configuration and location.
Use the following table to determine your installation options for each feature
or subfeature:
Description of what is installedType of feature installation
•
Installs the feature on the local
hard drive.
Will be installed on local hard drive
Entire feature will be installed on local hard drive
Feature will be installed when required
Entire feature will be unavailable
44 Crystal Reports 2008 SP3 User's Guide
•
Uses the Typical install settings
to install some of the feature's
subfeatures to the local hard
drive.
•
Installs the feature and all of its
subfeatures on the local hard
drive.
•
Installs the feature or subfeature
from the product distribution/network when first used.
•
Neither the feature nor its subfeatures are installed.
Page 45

Note:
Subfeatures are listed below each feature. A subfeature can have a different
type of installation than its parent feature.
Running a silent installation
A silent installation is one that you can run either from the command line or
by use of a response file to automatically install Crystal Reports on any
machine in your system, without the installation program prompting for
information during the installation.
The silent Crystal Reports installation is particularly useful when you need
to perform multiple installations and do not want to interrupt people who are
working on machines in your system. You can also use the silent installation
command in your own scripts. For example, if your organization uses scripts
to install software on machines, you can add the silent Crystal Reports
installation command to your scripts.
Note:
• The silent installation is not available from the Crystal Reports Setup
program and is intended only for experienced administrators of Crystal
Reports.
• When you perform a silent installation, you accept the Crystal Reports
end-user license agreement by default. You can find a copy of the license
agreement in the Docs folder of your product distribution.
• Silent installations are intended for new installations; do not use them for
upgrades.
Installing Crystal Reports 2008 SP3
Running a silent installation
3
Command line silent installation
The silent installation command consists of the command setup.exe,
followed by a number of parameters that provide information about the
installation. The following example creates a sub-directory /Crystal
Reports and installs Crystal Reports into it:
setup.exe ADDLOCAL=ALL CLIENTLANGUAGE=<%langcode%> IN
STALL.LP.<%langcode%>.SELECTED="1" REBOOT=ReallySuppress
PIDKEY=<%keycode>% INSTALLDIR="C:\Program Files\Business
Objects" /qn
• <%langcode%> Replace this variable with a valid language code from
the following table.
Crystal Reports 2008 SP3 User's Guide 45
Page 46

Installing Crystal Reports 2008 SP3
3
Running a silent installation
• <%keycode%> Replace this variable with a valid product activation
keycode.
The example uses the most common parameters. You can choose any
number of valid parameters, but it is good practice to keep the silent
installation as simple as possible.
The following table lists the most common parameters used in a
command-line silent installation. To use a parameter, place it on the command
line after the setup.exe command.
Note:
Parameters that are not listed in this table may be available, but they have
not been tested. Untested parameters are not supported.
46 Crystal Reports 2008 SP3 User's Guide
Page 47

CLIENTLANGUAGE=
Installing Crystal Reports 2008 SP3
Running a silent installation
DescriptionInstallation parameter
Use this to specify the language version code for the install.
•
For English, enter EN.
•
For French, enter FR.
•
For German, enter DE.
•
For Spanish, enter ES.
•
For Japanese enter JA.
•
For Simplified Chinese, enter
zh_CN
•
For Traditional Chinese, enter
zh_TW.
•
For Italian, enter IT.
•
For Korean, enter KO.
3
•
For Dutch, enter NL.
•
For Portuguese (Brazilian), enter
PT.
•
For Swedish, enter SV.
Note:
If you don't enter this parameter, the
regular language-selection screen appears at the beginning of your install,
even if you specified the parameters
for a no-prompt installation.
Crystal Reports 2008 SP3 User's Guide 47
Page 48

Installing Crystal Reports 2008 SP3
3
Running a silent installation
INSTALLDIR="filepath"
DescriptionInstallation parameter
Specifies the machine and directory
where you want to create the Crystal
Reports sub-directory, Crystal
Reports and install Crystal Reports
into. Replace filepath with the path
where to create the installation subdirectory. For example, setting
filepath to, C:\Program
Files\Business Objects would
create the path, C:\Program
Files\Business Objects\Crystal Reports\ and install the files
there.
PIDKEY=00000-00000000000000-0000
REBOOT=ReallySuppress
/qn+
/qn
Specifies your product activation
keycode.
Prevents Crystal Reports from
prompting the user to reboot the machine.
Performs the installation silently, but
prompts the user when the installation is complete.
Performs the installation silently,
without prompting the user.
48 Crystal Reports 2008 SP3 User's Guide
Page 49

Installing Crystal Reports 2008 SP3
Running a silent installation
DescriptionInstallation parameter
Specifies a list of features, delimited
by commas, that you want to install.
For example, ADDLOCAL=ALL
3
ADDLOCAL
EXCLUDEDOTNETFILES
INSTALL.LP.<%langcode%>.SE
LECTED="1"
Note:
When using any of the EXCLUDE parameters in this table, you must also
use ADDLOCAL.
For example, ADDLOCAL=ALL EXCLUDEJAVAFILES =1
Specifies whether the .NET developer components should be installed.
For example, EXCLUDEDOTNETFILES=1
The default value is 0, which indicates that the .NET developer components should be installed. The
value 1 indicates these components
should not be installed.
Specifies a particular language pack
to install.
A silent install log file is created in the %TEMP% folder to capture all placeholder
DLL errors. If the installation is successful, it is copied to the logging folder.
If the installation fails for any reason, the installation log file remains in the
%TEMP% folder.
Response file silent installation
During an installation, you can optionally indicate that you want the installer
to create an INI file to act as a response file during subsequent installs. The
Crystal Reports 2008 SP3 User's Guide 49
Page 50

Installing Crystal Reports 2008 SP3
3
Running a silent installation
installer then records the installation options you select as you install Crystal
Reports, and saves the file to disk.
The created INI file can be read by the installer to silently install Crystal
Reports with the same options specified during the creation of the file. This
is helpful for quickly producing a Silent Installation of Crystal Reports without
having to figure out complicated command-line parameters.
Once created during an installation, the INI response file must be included
with the set of Crystal Reports installation files.
The following table lists the parameters used to create and use an INI
response file for silent installation. To use a parameter, place it on the
command line after the setup.exe command.
-w "filepath"
DescriptionInstallation parameter
Creates an INI response file at the
path specified by filepath.
Note:
You can follow all the steps of the installation up to the final dialog in the sequence, then cancel the installation.
This creates the INI response file without installing Crystal Reports.
-r "filepath"
50 Crystal Reports 2008 SP3 User's Guide
Reads the INI response file at the
path specified by filepath, and installs
Crystal Reports based on the settings
in the file.
Note:
In the INI response file, there is a section "others". Set the key to /qb to perform an install with a progress meter.
Set the key to /qa to perform a completely silent install.
Page 51

Installing Crystal Reports 2008 SP3
Setting custom banners
DescriptionInstallation parameter
To be used with the -r parameter.
Creates a silent install log file at the
path specified by filepath.
3
-l "filepath"
Setting custom banners
The installer can be configured to display customized or re-branded banners
along the top and as the background of the Crystal Reports installer. Typically,
this functionality is intended only for partners who have signed agreements
with Business Objects.
In order to use custom banners, find the directory where the MSI installer is
located. Create a sub-directory called res and copy your banner images to
it:
top.bmp
If this parameter is not set, the default
location for the creation of the silent
install log file is the %TEMP% folder.
This log captures all the placeholder
DLL errors.
DescriptionImage filename
Banner that is shown along the top
of the installation window.
Size: 500 x 59 pixels
full.bmp
Banner that is shown as the backdrop
for the installation window.
Size: 1024 x 768 pixels
Crystal Reports 2008 SP3 User's Guide 51
Page 52

Installing Crystal Reports 2008 SP3
3
Upgrading Crystal Reports components
DescriptionImage filename
The Crystal Reports splash screen
splash.bmp
The images must be in Windows bitmap format.
that is shown after installation.
This must be placed in the win32x86
folder.
Upgrading Crystal Reports components
If you have purchased an upgrade product activation keycode, you will find
that the installation program does not remove your previous version of Crystal
Reports. In general, upgrading Crystal Reports components provides you
with a side-by-side installation (that is, an installation in which you can run
either your old or new version of Crystal Reports).
Note:
Crystal Reports 2008 SP1 side-by-side installation is supported when
upgrading from Crystal Reports XI R2 , Crystal Reports XI,Crystal Reports
10, or Crystal Reports 9.
This side-by-side behavior applies to Crystal Reports and the various
Software Development Kits (SDKs). Crystal Reports 2008 for Visual Studio
.NET can be used in side-by-side mode at runtime (that is, applications
written using Crystal Reports XI R2 or Crystal Reports 10 for Visual Studio
.NET will continue to run with Crystal Reports XI R2 or Crystal Reports 10
for Visual Studio .NET assemblies). However, Visual Studio integration is
not side by side; only one version of Crystal Reports can be integrated into
the Visual Studio .NET IDE at any given time.
Note:
For further information that may pertain to your reporting environment, consult
the Release Notes included with your product distribution (re
lease_en.pdf).
52 Crystal Reports 2008 SP3 User's Guide
Page 53

Quick Start
4
Page 54

Quick Start
4
Learning how to use Crystal Reports
Learning how to use Crystal Reports
You can teach yourself how to use Crystal Reports by choosing from the
methods available in this section:
• You can study the sample reports and sample database included with
Crystal Reports.
You will find the sample reports and sample database for Crystal Reports
at the Business Objects Technical Support web site:
http://support.businessobjects.com/samples/
•
You can use the detailed descriptions and instructions in the Quick start
for new users.
•
You can use the summaries and topic cross-references in the Quick start
for advanced users—especially useful if you're already familiar with
reporting concepts.
Each method is a helpful way to learn and understand Crystal Reports and,
although any one might be enough to get you up and running, you can always
come back to this section and consult the other methods as you need them.
Sample data - Xtreme.mdb
A sample database, Xtreme.mdb, is available for you to use while you are
learning Crystal Reports. Xtreme.mdb is a Microsoft Access database and
all of the necessary drivers are included. You should be able to open the
database directly and begin designing reports. Virtually all of the examples
in this manual are based on Xtreme.mdb data.
Xtreme.mdb is located on the Business Objects Technical Support web site
http://support.businessobjects.com/samples/.
Xtreme.mdb is a database that contains data for Xtreme Mountain Bikes, a
fictitious manufacturer of mountain bikes and accessories.
Note:
The sample data has been designed to illustrate various reporting concepts
in a training environment, not to teach database design. While there are
54 Crystal Reports 2008 SP3 User's Guide
Page 55

alternative ways of designing a database, this design was selected to keep
the tutorials and examples focused on reporting, not on data manipulation.
Report Creation Wizards
The tutorials in this section show you how to build a report from scratch. As
a complement or an alternative, however, you may want to use the Report
Creation Wizards available on the Start Page. There are four Report Creation
Wizards:
•
Standard
•
Cross-Tab
•
Mailing Label
•
OLAP
Each wizard guides you through the creation of a report by providing a series
of screens. Many of the wizards have screens unique to a specific type of
report. For example, the Mailing Labels Report Creation Wizard has a screen
that allows you to specify the type of mailing label you want to use.
Quick Start
Report Creation Wizards
4
Standard
Note:
After you've clicked the Finish button in a Report Creation Wizard, you can
click the Stop button on the Navigation Tools toolbar if you don't want the
program to gather all the data from your data source. This is useful if you
want to make adjustments to the report layout that the wizard created.
The Standard Report Creation Wizard is the most generic of the wizards. It
guides you through choosing a data source and linking database tables. It
also helps you add fields and specify the grouping, summarization (totals),
and sorting criteria you want to use. Finally, the Standard Report Creation
Wizard leads you through chart creation and record selection.
The Templates screen contains predefined layouts for you to apply to your
report to give it more impact.
Crystal Reports 2008 SP3 User's Guide 55
Page 56

Quick Start
4
Quick start for new users
Cross-Tab
Mailing Label
OLAP
The Cross-Tab Report Creation Wizard guides you through the creation of
a report in which your data is displayed as a cross-tab object. Two special
screens (Cross-Tab and Grid Style) help you create and format the cross-tab
itself.
The Mailing Labels Report Creation Wizard lets you create a report that is
formatted to print on any size mailing label. You can use the Label screen
to select a commercial label type, or you can define your own layout of rows
and columns for any multi-column style report.
The OLAP Report Creation Wizard lets you create a report in which your
OLAP data is displayed as a grid object. Although similar to the Cross-Tab
Report Creation Wizard in several ways, the OLAP Report Creation Wizard
appears to be different due to the requirements of working with OLAP data
sources. You first specify the location of your OLAP data, and then you
choose the dimensions you want to include in the grid. Next you filter the
report data and choose the style of the grid object, which you can also
customize. Finally, you can define labels for your grid and insert a chart, if
you wish.
Quick start for new users
The following tutorial has been designed to give you confidence when creating
your first report.
In this tutorial, you will get an introduction to the program as you create a
Customer List report. The Customer List is one of the most basic business
reports and typically has information such as Customer Name, City, Region,
and Contact Name.
56 Crystal Reports 2008 SP3 User's Guide
Page 57

You begin by learning the basic concepts: selecting a database, placing
some fields on the report, and then selecting specific records to be included.
You will then learn how to:
• Insert and move database fields.
• Add and format a title.
• Display a report in the Preview tab so you can fine-tune your work.
• Use the Select Expert to ensure the report includes only the data you
need.
• Move objects.
• Group and sort data.
• Insert pictures.
• Print a report.
Before you begin
Quick Start
Quick start for new users
4
This tutorial assumes you are familiar with Microsoft Windows and uses
conventional terms and procedures common to the Windows environment.
If you are not familiar with Windows, please refer to the documentation that
came with Microsoft Windows for further explanation.
The default font for all report sections in the program is set to Arial, 10 point.
If you have changed the default font, or if your printer does not support this
font, the field size, field spacing, and screen shots will look different than
those included in this tutorial.
This tutorial has been designed using Microsoft Windows 2000. Screen shots
may vary slightly if you are using a different platform.
If you are not familiar with the Crystal Reports environment, review Format
ting, which describes working with the grid, using guidelines, and formatting
activities.
Creating the report
1. Click the Start Page tab if the Start Page is not already visible in Crystal
Reports.
Crystal Reports 2008 SP3 User's Guide 57
Page 58

Quick Start
4
Quick start for new users
The New Reports area of the Start Page contains a number of wizards
to guide you through the creation of specific types of reports. Since you
will be learning reporting concepts here, you can skip the wizards and
build your report from scratch. After you have completed this tutorial, you
may want to build some reports using the wizards to decide which method
of report construction you are most comfortable with.
2. In the New Reports area, click Blank Report.
The Database Expert dialog box appears.
Note:
You can create reports based on database files, SQL/ODBC data sources,
Business Views, and a variety of other data sources.
Selecting a database to use
The next step in creating a report is to select a database. Use the Xtreme.mdb
sample database for this tutorial.
The Xtreme.mdb file is located on the Business Objects Technical Support
web site http://support.businessobjects.com/samples/.
Copy Xtreme.mdb to a location on your machine that you can access for the
tutorial.
To select a database
1. In the Database Expert dialog box, expand the Create New Connection
folder and then expand the Database Files folder; then search for the
Xtreme.mdb sample database.
Note:
• You have to use the Open dialog box to find the Xtreme database.
58 Crystal Reports 2008 SP3 User's Guide
Page 59

Quick Start
Quick start for new users
• If you wish to see database and server properties after you have
selected a database, right-click the database node in the Database
Expert and select Properties from the shortcut menu.
2. Expand the Tables node of the Xtreme.mdb connection to see a list of
tables.
4
Because you are dealing only with customers in this tutorial, you will select
the Customer table.
3. Select Customer and click the > arrow to add it to the Selected Tables
list, and then click OK.
The Design tab of the Report Designer appears.
4.
Click Field Explorer on the Standard toolbar.
The Field Explorer dialog box appears.
Crystal Reports 2008 SP3 User's Guide 59
Page 60

Quick Start
4
Quick start for new users
Report sections
Note:
Depending on how it appeared when you last used Crystal Reports, the
Field Explorer dialog box might be docked or in floating mode. For more
information about docking explorers, see Opening and docking explorers.
The Design tab is divided into five sections: Report Header (RH), Page
Header (PH), Details (D), Report Footer (RF), and Page Footer (PF). If at
any time you are unsure of the report section in which you are working, simply
look at the shaded area to the left of the report which always displays either
the section names or the initials that designate the names. See Design tab.
If the Short Section Names check box is selected in the Design View area
of the Options dialog box, then the Report Header, Page Header, Details,
Report Footer and Page Footer section names will appear as RH, PH, D,
RF and PF respectively. If this check box is not selected, follow these steps:
To show short section names
1. On the File menu, click Options.
The Options dialog box appears with the Layout tab active.
2. In the Design View area, select the Short Section Names check box.
3. Click OK to return to the report.
Inserting a field
You'll use the Field Explorer dialog box to insert database fields when you
create a new report.
60 Crystal Reports 2008 SP3 User's Guide
Page 61

This dialog box is set to remain on-screen until you close it. All the tables
available for use are listed in this box.
You will now start placing objects on the report by inserting the Customer
Name field.
To insert a field
1. Expand the Database Fields node in the Field Explorer dialog box and
2. Highlight a field name by clicking the name once.
Quick Start
Quick start for new users
expand a table.
When you highlight a field name, you can review a subset of the values
for that field as well as the field type and size by right-clicking the field
and selecting Browse Data from the shortcut menu.
4
3. Click the Customer Name field and drag it into the Details section of the
report.
An object frame appears with the Arrow cursor as you drag the field onto
the report:
• The object frame represents the object you have just selected for
placement.
• The size of the object frame approximates the size of the data in the
field selected.
4. Move the object frame as far to the left as you can in the Details section.
Crystal Reports 2008 SP3 User's Guide 61
Page 62
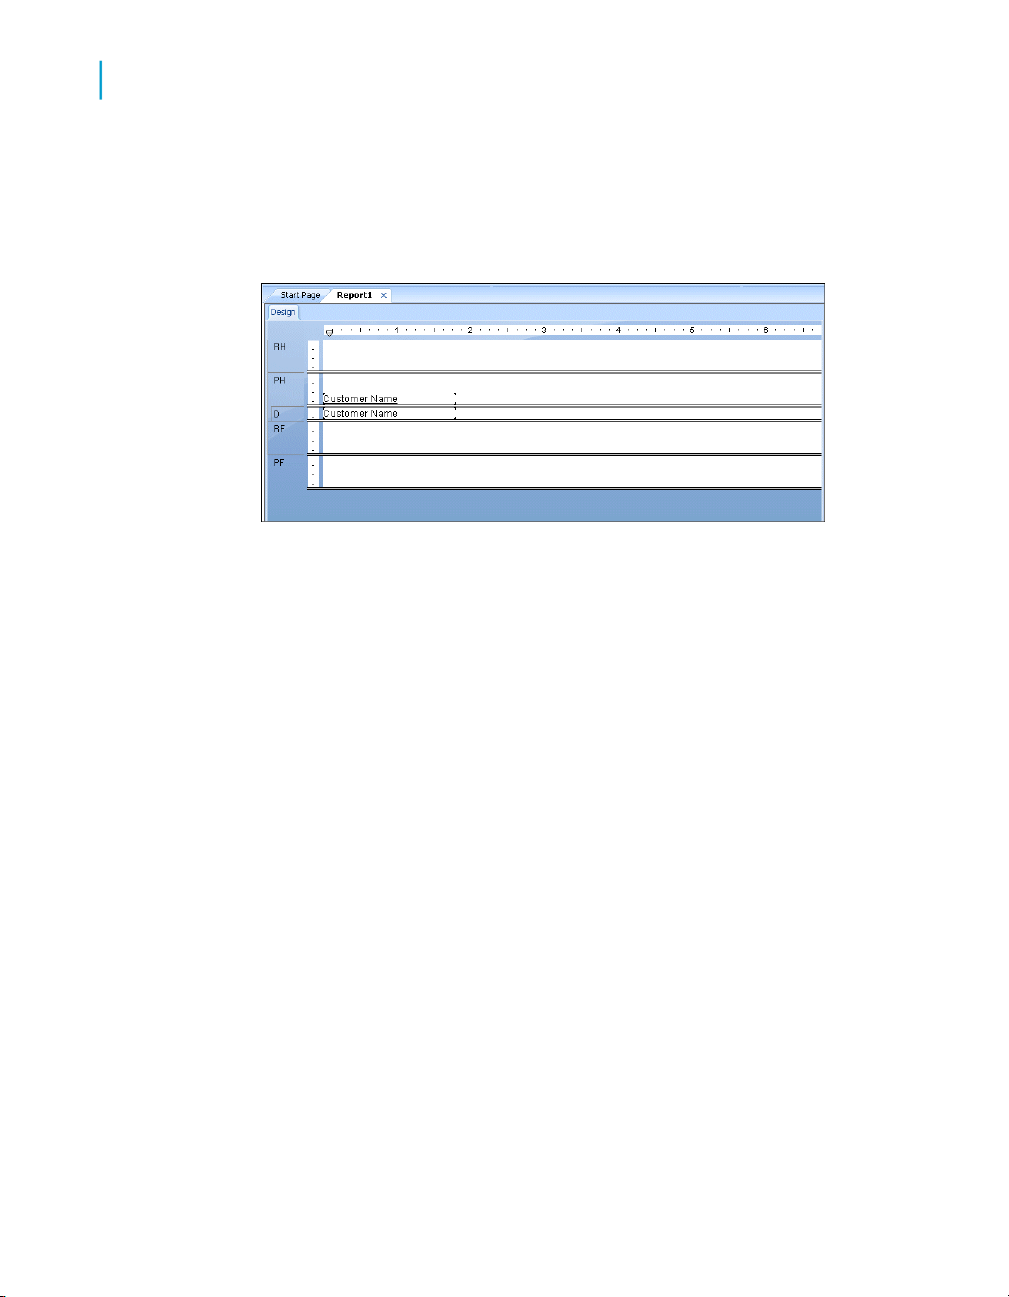
Quick Start
4
Quick start for new users
If you move the field too far to the left, the Arrow cursor turns into a Stop
cursor, indicating that you cannot drag the field that far. Keep in mind that
you cannot place any objects outside the page margin.
The Design tab should look similar to this:
Understanding fields
Before going any further, take a look at the field you just placed in the Details
section:
• First of all, the object frame indicates that when the report is printed, a
field value will appear where the box is positioned.
• If you haven't selected the Show Field Names check box on the Layout
tab of the Options dialog box, the object frame contains Xs to indicate
that the database field contains a text string. Other data types have
different character representations. For example, a currency data type is
represented by $55,555.56.
• If your report is not showing field names, the number of Xs in the object
frame is the data width, the maximum number of characters in the field
as defined by the database. Whether or not your report shows field names,
the width of the object frame is the field width (the amount of space
allocated to the field for printing). Initially it is set to the width needed to
display the maximum number of characters in the field (using the font
selected for the field). You can change this width by resizing the field.
• The size of the characters or Xs indicates the point size selected for the
characters in the field.
62 Crystal Reports 2008 SP3 User's Guide
Page 63

• The font and style (Bold, Underline, and so on) used in displaying the
characters or Xs indicate the font and style selected for the characters in
the field. Later in this tutorial you will learn how to make changes to these
properties.
• The line spacing is adjusted to the point size selected for the characters
in the field.
Adding additional fields
Next, you will insert two additional fields in the report. This time, however,
you will use the Ctrl-click combination to add them at the same time.
To add additional fields
1. Highlight the City field in the Field Explorer dialog box, press the Ctrl key
on your keyboard, and then highlight the Country field. Release the Ctrl
key.
If you scroll through the field list, you will notice that both fields remain
selected.
Quick Start
Quick start for new users
4
Note:
Using the Ctrl-click combination allows you to select a non-continuous
range of fields. The Shift-click combination can be used to select several
fields from the list that are contiguous.
2. Drag the fields to place them.
As the cursor is moved over the report, an object frame appears along
with the Arrow cursor.
3. Place the fields to the right of the Customer Name field.
Both fields appear in the Details section of the report in the same order
in which they are listed in the Field Explorer dialog box.
Selecting fields
When a field is selected, the object frame appears with a handle (box) on its
right, left, top, and bottom edge. These handles indicate that the field is
selected, and therefore active. To do anything with a field (change the font,
move it, and so on), you first have to select it:
Crystal Reports 2008 SP3 User's Guide 63
Page 64

Quick Start
4
Quick start for new users
Resizing fields
• Position the cursor inside the object frame and click once. The handles
appear, indicating the object is selected.
• Move the cursor away from the object frame and click in an empty part
of the window. The handles disappear.
That's all it takes to select and deselect objects.
To resize the field, follow these steps:
1. Click the Customer Name field in the Details section to select it.
2. Press the Ctrl key and click the field heading to select both objects.
3. Move the cursor over the resizing handle on the right edge of the fields
until the cursor turns into a Resizing cursor.
4. Resize the fields to the right until they are approximately two inches in
length.
Reviewing your work
Now let's see how the report looks with three fields placed and positioned.
1.
64 Crystal Reports 2008 SP3 User's Guide
Click Print Preview on the Standard toolbar to activate the Preview
tab.
The screen should look similar to this:
Page 65

Quick Start
Quick start for new users
Note:
The first time you preview a report, you must click Print Preview on the
Standard toolbar to activate the Preview tab. The Preview tab appears
to the right of the Design tab. You can then switch between designing
and previewing the report by clicking the corresponding tab.
4
You have the beginnings of a customer list report, but you still have several
fields to add.
2. When you are finished reviewing the report, return to the Design tab by
clicking it.
Displaying field names
Field pictures (object frames containing character representations) have
been discussed, but there may be times when you want to see the field
names in the Design tab.
To display field names
1. On the File menu, click Options.
The Options dialog box appears with the Layout tab active.
2. Select the Show Field Names check box and click OK.
Now in the Design tab you will see the actual field names instead of
character representations (X, $, #, and so on).
Crystal Reports 2008 SP3 User's Guide 65
Page 66

Quick Start
4
Quick start for new users
Combining database fields in a text object
Instead of adding the Contact First Name and Contact Last Name fields as
separate objects, you can insert both fields in a text object. This allows you
to control the formatting of both fields by making changes to only one object.
When you insert fields in a text object, the fields are automatically trimmed
(they do not have any extra white space on either side). This is important
because a field is a fixed size but the data in the fields can vary in size,
leaving various amounts of unwanted white space.
To combine fields in a text object
1.
2. Insert the field to the right of the fields in the Details section.
Click Insert Text Object on the Insert Tools toolbar. As you move
the cursor over the report, an object frame appears next to it.
As you drag the field, the Design tab automatically scrolls to the right, if
necessary. When you click to place the object, a text object appears and
the horizontal ruler of the Design tab changes to a ruler/tab selector that
is used for editing the text object. If you click an empty area of the report
or a field object, the standard Design tab ruler appears.
3. Click once on the border of the text object to select it for resizing. Handles
appear on all sides of the object.
4. Move the cursor over the right sizing handle of the text object and increase
the width by about 1 inch. You may need to scroll to the right and continue
resizing.
5. Double-click inside the text object to select it for editing. Notice the
insertion point is now flashing within the text object.
6. Select the Contact Last Name field in the Field Explorer dialog box.
Remember, you can move the Field Explorer dialog box by dragging and
dropping it by its title bar.
7. Drag the field to the text object.
8. Move the cursor over the text object until the cursor becomes a Drag and
Drop cursor.
9. Release the mouse button to place the field in the text object. The cursor
now appears after the Contact Last Name field, within the text object.
10. Type a comma and a space after Contact Last Name.
11. In the Field Explorer dialog box, highlight the Contact First Name field.
66 Crystal Reports 2008 SP3 User's Guide
Page 67

Quick Start
Quick start for new users
12. Drag the field to the text object.
13. Move the cursor over the text object until the cursor becomes a Drag and
Drop cursor. Move the cursor to the right of the comma and space you
just typed, and release the mouse button. The field will be inserted to the
right of the comma and space.
14. Click the Preview tab to look at the fields you just placed.
The report should now look similar to this:
4
Adding summary information
The next step is to add summary information to your report. Adding summary
information allows you to specify the author, title, and subject of the report,
as well as any keywords or comments related to the report. When you add
summary information, users can find information related to the report quickly.
To add summary information
1. On the File menu, click Summary Info.
The Document Properties dialog box appears with the Summary tab
active.
Crystal Reports 2008 SP3 User's Guide 67
Page 68

Quick Start
4
Quick start for new users
2. Enter information about your report in the text boxes provided. Be sure
to enter the title "Customer List" in the Title text box. This information will
be used in the next section of the tutorial.
3. Click OK when finished.
Adding a title
As you can see, the report looks incomplete without a title. Although you can
add a title using a text object, you can also tell the program to take the title
information directly from the Title text box in the Document Properties dialog
box.
To add a title
1. Click the Design tab.
2. In the Field Explorer, scroll down to Special Fields and expand it.
3. Choose Report Title.
4. Drag the cursor over the report. An object frame appears.
68 Crystal Reports 2008 SP3 User's Guide
Page 69

5. Position the object frame in the upper left-hand corner of the Page Header
(PH) section of the report and release the mouse button to place the
object.
6. Click the Preview tab or Refresh to review your changes.
The report title object now displays the title that you entered in the Title text
box of the Document Properties dialog box.
Formatting objects
Now you can format the report title. This time, however, you will remain in
the Preview tab to do the work. This will make it easier to see your work
while you are formatting the title.
To format an object
1. To center the title, you will first need to expand the Title field so that it's
about the same width as the data in your report. To do this, select the
object by clicking it.
2. Position the cursor on the right edge of the object until the cursor turns
into a Resizing cursor. Drag the right edge of the field box until it is even
with the right edge of the data in the Contact Name field object.
Quick Start
Quick start for new users
4
You have created a large field that extends from the left edge to the right
edge of the report.
3.
4. Right-click the object and choose Format Field from the shortcut menu.
5. When the Format Editor appears, click the Font tab.
6. Set the report title to a larger, bolder version of the active font by selecting
7. Change the color of the text by selecting Maroon from the Color palette.
8. Click OK when finished.
9. Resize the report title object vertically to accommodate the increased
The title is now formatted to stand out on the report.
With the report title object still selected, click Align Center on the
Formatting toolbar. The title is centered within the object.
Bold from the Style list and 16 (or a point size suitable to the font you
are using) from the Size list.
Notice that the Sample box shows an example of how the text will look.
size of the title.
Crystal Reports 2008 SP3 User's Guide 69
Page 70

Quick Start
4
Quick start for new users
Adding a field heading
As you can see, the Contact Name field is the only field without a heading.
In this section you will create a heading.
To add a field heading
1.
2. Insert the text object in the Page Header section directly above the
3.
4. Click your cursor outside the text object.
The Contact Name field now has a heading that looks just like the other field
titles.
Click Insert Text Object on the Insert Tools toolbar.
Contact Name field.
Click Underline on the Formatting toolbar, and then type Contact
Name into the text object.
Saving the report
1.
70 Crystal Reports 2008 SP3 User's Guide
Click Save on the Standard toolbar to save your work.
Since this is the first time you are saving the report, the Save As dialog
box appears displaying the default directory where the file will be saved.
Page 71

Quick Start
Quick start for new users
Notice that a default file name, based on the report title you defined earlier,
is also displayed.
2. Type Custlist.rpt in the File name box and click Save.
Your report is saved to the default directory or another directory you
chose.
3. Click the Preview tab to view the report.
The report should now look similar to the following:
4
Congratulations! You have just created a basic listing report. You will continue
to refine this report throughout the rest of this tutorial.
Record Selection
Crystal Reports allows you to limit or restrict the records that are to be
included in a report. In this section you will learn how to:
• Select the records you want included in the report.
• Save a report, including the selection criteria.
For example, it may be useful to have a customer list that only lists customers
from the USA. The sample data contains records from the United States and
International customers. It is easy to restrict lists like this using the Select
Expert.
Crystal Reports 2008 SP3 User's Guide 71
Page 72

Quick Start
4
Quick start for new users
Entering the selection criteria
When you scroll through the report, you will see that it contains information
for customers from many different countries. In this step, you will limit the
number of countries displayed to the USA.
To enter selection criteria
1. To begin, click the Design tab to return to design mode.
2. Click an empty area of the report to make sure all fields are deselected.
3.
Click Select Expert on the Expert Tools toolbar.
The Choose Field dialog box appears.
This dialog box lists all the fields currently in the report in the Report Fields
section and then lists all fields that are available from each table in the
database fields section.
4. Since you are going to base record selection on the country field, select
Country in the Fields list and click OK.
The Select Expert appears.
72 Crystal Reports 2008 SP3 User's Guide
Page 73

Quick Start
Quick start for new users
Imagine that you are completing the following sentence:
Select all records where a customer's country is
You complete the sentence with the condition you want the program to
use when selecting records for your report. Right now the condition is
any value, which implies there is no restriction on the record selection.
5. Click the arrow on the operators box to see what other options you have.
Since you want only those records where the Country is USA, select the
is equal to condition.
4
A new box appears on the right. The dialog box sentence now reads:
Select all records where a customer's country is equal
to
All that you need to complete the sentence is the value USA.
6. Click the arrow on the empty list. A list of all the country values appears.
Select USA from the list.
The sentence now reads:
Select all records where a customer's country is equal
to USA
7. Click OK to return to the Design tab.
8. Click the Preview tab to review the results of your work.
The Change In Record Selection Formula dialog box appears.
9. Click Refresh Data.
Crystal Reports 2008 SP3 User's Guide 73
Page 74

Quick Start
4
Quick start for new users
Deleting a field
To delete a field
10. Save this version of the report without overwriting the original report by
choosing Save As from the File menu and giving the new report the name
USA.rpt.
Congratulations! You have started formatting your report and have added
selection criteria to it. More than that, you have learned how to manipulate
your data. By now, you have a good idea of the powerful kinds of reports
you can prepare.
Now that the report contains only records from the USA, displaying the
Country field in the body of the report is not necessary. You can delete this
field before continuing.
1. Select the Country field and the Country column heading using the
Ctrl-click combination.
2. Press Delete on your keyboard.
That is all it takes to delete fields from the report.
The report should now look similar to this:
74 Crystal Reports 2008 SP3 User's Guide
Page 75

Balancing field spacing
Now that the Country field has been deleted, there is a large amount of white
space between the City and Contact Name fields. You might be satisfied
with the spacing as it stands, but it might be more readable if the columns
were better balanced across the page.
To balance field spacing
1. Return to the Design tab. Select the Contact Name field and its field
heading by using the Ctrl-click combination.
2. Place the cursor over one of the two highlighted text objects and drag
them to the left, closer to the City field.
3. Click the Preview tab and review your work again.
The report should look similar to this:
Quick Start
Quick start for new users
4
The spacing between the fields is much better, but it looks as if the report
title is off-center.
4. Click the report title object to select it.
5. Position the cursor on the right handle of the object until the cursor turns
into a Resizing cursor. Drag the right edge of the object frame until it is
even with the right edge of the data in the Contact Name field object.
The report title automatically centers itself based on the size of the object.
Crystal Reports 2008 SP3 User's Guide 75
Page 76

Quick Start
4
Quick start for new users
Grouping and sorting
Data in reports can be grouped and sorted in a variety of ways. Sorting and
grouping tools provide a great deal of flexibility for customizing reports.
Grouping the report
In many reports you need to break the data into groups in order to make it
easier to read and to understand. Crystal Reports lets you do this easily. For
this customer list, you will group the customers by region and then sort the
customers alphabetically within each group.
To group a report
1.
While on the Design tab, click Insert Group on the Insert Tools
toolbar.
The Insert Group dialog box appears.
2. Select Region from the Customer table in the first drop-down list.
76 Crystal Reports 2008 SP3 User's Guide
Page 77

Quick Start
Quick start for new users
The program takes all records with the same value in the region field and
places them together in a group on the report.
3. Select in ascending order from the second drop-down list.
The region grouping will be displayed on the report in alphabetic ascending
order.
4. Click OK.
Notice that two new sections now appear in the Design tab: GH1 (Group
Header #1) and GF1 (Group Footer #1). This is how the program shows
that the report has been grouped.
5. Click the Preview tab to see what the report looks like.
4
6.
You can view the group of interest by clicking on the group name in the Group
Tree. For example, to see the Texas customer group, click TX in the Group
Tree. The program jumps to the Texas group, displaying that group in the
Preview tab. The Group Tree allows you to quickly jump to a specific group
of interest instead of scrolling through the report looking for the group. For
more information on the group tree, see Group Tree.
If the group tree is not visible, select Toggle Group Tree on the
Standard toolbar to see the groups included in the report.
Crystal Reports 2008 SP3 User's Guide 77
Page 78

Quick Start
4
Quick start for new users
Note:
For many reports, you will want to insert summaries, subtotals and grand
totals. For example, when creating a sales report rather than a customer list,
you would want to calculate the total sales amount for each region. See
Sorting, Grouping, and Totaling.
Understanding "live" group headers
When a group is inserted, a group name field is automatically inserted in the
Group Header section of the report. The group name field displays the current
group's name. For example, if you group by region, and preview the report,
the group header for the CA (California) group shows "CA."
The group field name is automatically formatted to stand out from the records
in the group.
Sorting records
In a typical customer list report, customer names are listed alphabetically.
In this example, you will sort the customer names alphabetically within each
region.
To sort records
1.
78 Crystal Reports 2008 SP3 User's Guide
While on the Preview tab, click Record Sort Expert on the Expert
Tools toolbar.
The Record Sort Expert appears.
Page 79

Quick Start
Quick start for new users
The Available Fields list box displays all fields currently on your report
and all the fields in the data source. You can choose to sort based on
any of these fields.
4
The Sort Fields list box displays the fields that are already sorted in the
report. Since the region field has already been sorted, the sorting you are
about to do will be within each region, and not for the entire report.
2. Highlight the Customer Name field and click the > arrow button to add
it to the Sort Fields list.
3. Select Ascending for the Sort Direction and click OK. The report should
now look similar to the following:
Crystal Reports 2008 SP3 User's Guide 79
Page 80

Quick Start
4
Quick start for new users
Notice that the records within each group are in alphabetic order.
Completing the report
You have just one step left to complete the report. A company logo needs
to be added to the first page of the report.
Inserting a company logo
In this section, you will place a company logo at the top of the first page of
the report.
To insert a company logo
1.
2. Choose a bitmap logo (.bmp) file and click Open.
80 Crystal Reports 2008 SP3 User's Guide
While on the Design tab, click Insert Picture on the Insert Tools
toolbar.
The Open dialog box appears.
An object frame appears as you move the cursor over the report. The
object frame represents the logo you will place.
Page 81

Quick Start
Quick start for new users
3. Position the object frame in the upper left-hand corner of the Report
Header (RH) section of the report and click once to place it.
Placing the logo in the Report Header (RH) section ensures that the logo
is printed only on the first page of the report.
Note:
Although there does not appear to be enough room in the Report Header
(RH) section when you place the graphic, the section will automatically
expand to accommodate the picture.
4. Click the Preview tab to view the report.
The final report should look something like this (with the logo that you
chose in step 2):
4
5. Save the report by clicking Save on the Standard toolbar.
You have just completed your first report.
For more information
• For information about distributing reports (printing, exporting, and so on)
see the printing topics in Formatting and Printing, Exporting, and Viewing
Reports.
Crystal Reports 2008 SP3 User's Guide 81
Page 82

Quick Start
4
Quick start for advanced users
Quick start for advanced users
If you are an experienced Windows user who wants to get right into the
program, follow these steps to set up a report for the first time.
If you're not an experienced user, check the Quick start for new users.
Choosing a report type and data source
1. In Windows, click Start > Programs > BusinessObjects XI Release 3
> Crystal Reports, and then select Crystal Reports 2008.
2. Click Blank Report to open the Database Expert dialog box.
As an alternative to creating a blank report, you can choose one of four
Report Creation Wizards.
After choosing a wizard, you can build your report on a variety of data
sources.
3. Browse through the contents of the Database Expert to find the data
source you want to use for your report.
4. Select a table you want to use in your report and click the > arrow to add
it to the Selected Tables list.
5. After you have added all the tables you want to work with, click OK on
the Database Expert.
Note:
If you select more than one table in the Database Expert dialog box, the
Links tab appears. For more information on linking, see Linking multiple
tables.
The Design tab appears with Report Header, Page Header, Details, Page
Footer, and Report Footer areas. A report is created by inserting and
formatting items in each of these areas.
Note:
To use additional database tables for a report and match them up on a
record-by-record basis, click Database Expert on the Expert Tools toolbar,
select the table(s), and then set up the links on the Links tab when it appears.
82 Crystal Reports 2008 SP3 User's Guide
Page 83

Quick Start
Quick start for advanced users
Working with report elements on the Design tab
4
1.
2. To turn the grid on or off, choose the Options command from the File
3. If you are working with the grid off and you want to use snap-to guidelines
4.
Each of the default report areas contains a single section. To add
additional sections, click Section Expert on the Expert Tools toolbar and
use the Section Expert to add the desired sections.
Once you have added sections to an area, you can move, merge, and
delete them in the Section Expert. See Designing with guidelines .
menu and select or clear the Grid check box in the Design View area of
the Layout tab when the Options dialog box appears. See Using the grid.
for positioning objects, click the top or left ruler wherever you want
guidelines to appear.
Some further ways you can use guidelines:
• Drag a field to a guideline until it snaps to the guideline.
• Drag the guideline arrow to move the guideline (and any objects that
are snapped to it).
• Drag the guideline arrow away from the ruler to remove the guideline.
See Designing with guidelines .
If the Field Explorer dialog box is not visible, click Field Explorer on
the Standard toolbar.
Expand the Database Fields node to display a list of fields. To speed the
entry of multiple fields, this box will remain on-screen until you close it.
This dialog box can be moved to a new location or resized, if you wish.
See Placing data on the report .
5. Select the field(s) you want to appear on the report.
You can select and place them one at a time, or use the Shift-click
combination to select a number of contiguous fields, or the Ctrl-click
combination to select fields from the list at random. Drag and drop is also
active. Place the fields in the Details section where you want them to
appear.
Crystal Reports 2008 SP3 User's Guide 83
Page 84

Quick Start
4
Quick start for advanced users
6. Once the objects are in place, you may want to adjust the report sections.
When you place multiple fields, they appear in the same order that they
appear in the Field Explorer dialog box. The program marks the position
of each field with a rectangular frame. The characters in the frame indicate
whether the field is text (XXX...), number (555...), currency ($555...), date
(12/31/99), time (00:00:00), DateTime (12/31/99 00:00:00), or Boolean
(T/F).
Note:
• The field names and field types can be viewed by selecting the Show
Field Names check box on in the Options dialog box (Layout tab).
• The program automatically places field titles in the Page Header
section unless the Insert Detail Field Headings check box is not
selected in the Options dialog box (Layout tab).
• If additional Details sections are added to the report, field titles will
only be placed in the Page Header section for fields in the Details A
(the original) section of your report.
To do this, right-click the shaded area to the left of the section ruler and
use the shortcut menu that appears:
• To expand a section to accommodate an additional line, choose the
Insert Line command.
• To have the program automatically align the objects in the section
horizontally, choose the Arrange Lines command.
• To reduce the size of a section to eliminate unnecessary white space
above and below objects, choose the Fit Section command. See Using
white space between rows .
7. To generate a report title, you must first enter the title in the Document
Properties dialog box. On the File menu, click Summary Info. Enter a
title in the Title text box of the Document Properties dialog box. Click OK.
8. Choose Report Title from the Special Fields list in the Field Explorer. A
rectangular placement frame appears when you move the cursor over
your report. Click once in the Report Header (RH) section to place the
report title. The report title field contains the text that you typed in the
Title text box of the Document Properties dialog box. See Adding a title
page to the report .
9.
84 Crystal Reports 2008 SP3 User's Guide
To see how the results will print, click Print Preview on the Standard
toolbar.
Page 85

To speed processing time while building a report, you can preview the
report using only a small subset of the available data. To do this, go to
the File menu, point to Print and then click Preview Sample. See Preview
tab.
In either case, the program takes you to the Preview tab. You can fine-tune
a report in the Preview tab while viewing the results as actual report data.
You can also close the Preview tab and continue working on the report
in the Design tab.
Using other reporting features
1. If you want to format a field, change the placement or width of a field, or
insert a summary, click the field to select it. Handles appear on the top,
bottom, and sides of each selected field:
• To change the placement of the field(s), use the mouse to drag the
field placement frame to its new position.
• To change the width of the field, use the mouse to drag the right or
left handle.
Quick Start
Quick start for advanced users
4
• Right-click the field to format or to summarize it. A shortcut menu
appears listing commands for formatting and summarizing the field.
Tip:
Many font and formatting options are available on the formatting toolbar.
Note:
To apply formatting only under certain conditions, click Conditional
Formula next to the formatting property in the Format Editor, and create
a formula that defines those conditions. See Working with conditional
formatting.
2. To create a formula that makes data calculations or comparisons, select
Formula Fields in the Field Explorer.
Note:
You can also click Formula Workshop on the Expert Tools toolbar
to work with formulas, custom functions, SQL expressions, and so on.
Crystal Reports 2008 SP3 User's Guide 85
Page 86

Quick Start
4
Quick start for advanced users
3.
4.
5. When you are finished editing, click Save and close to return to the Field
6.
7.
8.
9.
Click New. The Formula Name dialog box appears. Enter a name
for the formula and click OK. The Formula Workshop appears with the
Formula Editor active.
Enter the formula in the Formula Editor. Enter fields, operators, and
functions by selecting them from their respective lists or by typing them
in. You can check the formula syntax by clicking Check.
Explorer dialog box.
Click Insert to Report to place the formula just like you would a
database field. See Using Formulas.
To insert a subreport (a report within a report), click Insert Subreport
on the Insert Tools toolbar and choose an existing report to import as a
subreport or use the Report Creation Wizard to create a new subreport.
See Inserting subreports.
If you want the records in a subreport to match up with the records in a
primary report, click the Link tab of the Insert Subreport dialog box and
specify the link when the tab appears.
To insert a cross-tab object in a report, click Insert Cross-Tab on
the Insert Tools toolbar and set up the cross-tab in the Cross-Tab Expert
when it appears. See Cross-Tab Objects.
To create a parameter field (a field that prompts you for a value
whenever you retrieve data for a report), click Field Explorer on the
Standard toolbar, then select Parameter Fields in the Field Explorer dialog
box when it appears. Click New to set up a parameter field. Once created,
you can insert the parameter field in a report like a database field or select
it from the Fields list in the Formula Workshop.
Parameter fields can be used in reports (as title or label prompts), in
selection formulas (as selection criteria prompts), and in formulas (for a
variety of purposes including specifying sort fields). See Parameter Fields
and Prompts.
10.
86 Crystal Reports 2008 SP3 User's Guide
To add a chart, click Insert Chart on the Insert Tools toolbar. See
Charting.
Page 87

Quick Start
Quick start for advanced users
4
11.
12. To insert a spreadsheet, picture, or other OLE object that you can edit
13.
14.
15.
That's it! It is that easy to build a report.
To add a map, click Insert Map on the Insert Tools toolbar. See
Mapping.
from within the Report Designer using the tools from the object's native
application, choose OLE Object from the Insert menu. See OLE, and
Working with static OLE objects.
To change the record sort order, click Record Sort Expert on the
Expert Tools toolbar. The Record Sort Expert appears. Highlight the
field(s) you want to use for sorting the report data and the sort direction.
See Sorting single and multiple fields.
To limit the report to specific records (for example, the records of
California customers who have year-to-date sales greater than $10,000),
click the first field on which you want your selection to be based and then
click Select Expert on the Expert Tools toolbar. When the Select Expert
appears, set up the record selection criteria.
To print the report, click Print on the Standard toolbar.
Crystal Reports 2008 SP3 User's Guide 87
Page 88

Quick Start
Quick start for advanced users
4
88 Crystal Reports 2008 SP3 User's Guide
Page 89

Report Design Concepts
5
Page 90

Report Design Concepts
5
Basic report design
Basic report design
The purpose of this section is to suggest a structured approach to preparing
a Crystal report. This approach includes the following elements:
• Deciding on the content of the report.
• Developing a prototype on paper.
This section has been designed to provide a conceptual understanding of
the reporting process.
Deciding on the content of the report
Before you do anything else, you should outline the information you want
the report to provide. The following sections provide a guide to making that
outline.
Stating the purpose
What is the overall purpose of the report?
Reports are management tools. Their purpose is to help you quickly grasp
the essential elements and relationships found in raw data, to help you make
effective decisions. For a report to be effective, it has to present the correct
data in a logical way. If it presents the wrong data, or if it presents the right
data in a haphazard manner, the report may slow the decision-making
process or may even encourage incorrect decisions.
A good starting place in the development of a report is to write out the purpose
of the report in a sentence or two. The purpose statement helps you focus
on your primary needs, and it gives the report both a starting point and a
goal.
Here are some examples of purpose statements.
• The purpose of this report is to show monthly and year-to-date sales by
sales representatives, compare this year's numbers to last year's, and
flag representatives whose sales figures do not meet company standards.
90 Crystal Reports 2008 SP3 User's Guide
Page 91

• The purpose of this report is to show sales activity for each item in
inventory, and to suggest reorder quantities based on that activity.
• The purpose of this report is to calculate bowling averages and handicaps
for each member of the bowling league.
Defining the purpose of the report before you start is a critical step in the
overall process.
Who is going to read the report?
A single report is often used by many individuals. A detailed, company-wide
sales report, for example, may be used by sales representatives, the regional
sales manager, the national sales manager, and the Chief Operating Officer
(COO).
These individuals will be interested in different aspects of the report:
• A sales representative will use the report to evaluate individual sales
performance and compare this performance to that of other
representatives in the region.
Report Design Concepts
Deciding on the content of the report
5
• The regional sales manager will use the report to evaluate regional
representatives and compare the region's performance to that of other
regions.
• The national sales manager will use the report to evaluate the performance
of regional managers and compare overall sales to the current sales
forecasts.
• The COO will use the report to evaluate the performance of the
Vice-President of Marketing and the sales department as a whole, and
to project such things as manufacturing needs and warehouse locations.
Since each user of the report has different interests, it is important to plan
the report so it includes the information each user is looking for.
Crystal Reports 2008 SP3 User's Guide 91
Page 92

Report Design Concepts
5
Deciding on the content of the report
Determining the layout of the report
What is the report title going to be?
Write out a working title for the report. You may decide to change it later, but
at least you will have a title to use when creating the prototype report.
What identifying information is needed in the header and footer?
You may wish to include the print date, information on who prepared the
report, a block of text to describe the purpose of the report, the range of data
covered, or something similar. If you are going to include such information,
write it down so you can use it in preparing your prototype.
The information can come from a variety of sources, depending on the kind
of information you plan to use.
• Information on who prepared the report might be drawn from individual
data fields in the database table(s) used. If it is to be drawn from a
database table, what table? Or, what combination of tables?
• A block of text can be created as a text object and placed anywhere on
the report.
• Crystal Reports can generate information such as the print date or page
numbers.
Finding the data
What data do you want to use in the report?
Do you know the type of database you are reporting from? Will you be
reporting off a data file, SQL/ODBC, or another data source?
If you do not know, ask the database administrator in your organization for
help in setting up the database type and location of the data. For more
information, see Accessing Data Sources in the Crystal Reports Online Help.
92 Crystal Reports 2008 SP3 User's Guide
Page 93

Report Design Concepts
Deciding on the content of the report
Are you familiar enough with the data to find the necessary information?
When looking for a Customer Contact name, can the field be found in a
database table?
If not, your MIS professional, database administrator, or co-workers will have
to help you become familiar with the data.
What specific data should appear in the body of the report?
The body should contain all the data needed to fulfill the statement of purpose
you wrote for the report. It should also contain all of the data needed by the
various users that you have identified.
This step requires you to look at the available database table(s). Crystal
Reports allows you to combine data from different databases when you
create reports, so you have a great deal of flexibility in your work.
• Much of the data in a typical report is taken directly from data fields. Which
data fields will be used, and where are they located?
• Other data will be calculated based on data fields. Which data fields will
be used in the calculations?
5
• Still other data will be placed directly into the report using text objects
(headings, notes, labels, and so on).
Does the data exist or does it need to be calculated?
Some report information can be drawn directly from data fields (sales
information, for example); other information will have to be calculated based
on data field values (for example, sales commission, based on the relationship
of sales to quota). In your planning, it can be helpful to segregate or flag data
that needs to be calculated from that which can be used directly. See
Specifying formulas.
What types of fields contain data?
You should take the time to get to know the data type for data fields that will
be used in your calculations. Since formula functions and operators work
with specific kinds of data, it is important to recognize the data type you are
Crystal Reports 2008 SP3 User's Guide 93
Page 94

Report Design Concepts
5
Deciding on the content of the report
working with, before you start any calculations. For example, some functions
require numeric data, while others work with only string fields. For more
information on specific functions and operators, search for "Functions" and
"Operators," or for the function or operator by name in the Crystal Reports
Online Help.
Manipulating the data
Do you want the data organized into groups?
How? By customer? By date? By hierarchy? Or by other criteria? Crystal
Reports provides several options for grouping data in a report. See Grouping
data.
Do you want the data sorted based on record or group values?
Crystal Reports gives you both alternatives. See Understanding sort options.
Do you want the report to contain only specific records or groups?
Crystal Reports gives you the opportunity to base a report on all records in
a given database, or on a limited set of records from the database. Crystal
Reports can be used to select records based on simple date ranges or
comparisons, or to create complex formulas to identify the records to be
included. Take a few minutes to determine the records needed for the report
and list the criteria to be used for selecting those records. See Selecting
records.
Do you want to summarize the data?
Do you want to total, average, count, or determine the maximum or minimum
value included in all the values in any column on the report?
Crystal Reports allows you to do this, and it also allows the grand total (or
the grand total average, grand total count, and so on) to be placed at the
94 Crystal Reports 2008 SP3 User's Guide
Page 95

Deciding on the content of the report
bottom of the selected column. See Calculating a percentage and Selecting
top or bottom N groups or percentages .
What information should be flagged on the report?
You may want to call attention to some data by flagging it on the report. For
example, non-moving inventory items are often flagged on inventory reports
so they can be given special attention. You might want to flag each item that
has shown no activity during the last month, during the last three months, or
during some other defined period. To flag information, identify it and any
conditions that will trigger the flagging.
How do you want information flagged?
You may want to flag items with an asterisk or some other symbol, or you
may want a word to appear as a flag. In any case, you should write out
flagging instructions so they are handy.
Crystal Reports gives you the opportunity to underline report elements, and
change the font type, size, or color used for specific report items. It allows
you to put borders around items and to draw lines and boxes (to break the
report into sections), set off headings, and so on. All of these formatting tools
can be used to highlight key data on a report. See Formatting.
Report Design Concepts
5
Determining printing area characteristics
Each report area has its own printing characteristics. It is important to
understand these characteristics because they affect when and how often
different report objects get printed.
In what order will the areas print on the report?
Areas print in the order they appear on the Design tab (top to bottom). If
there is more than one section in an area, the sections print in the order they
appear. For example, if you have three Report Header sections, all three of
those sections will print, in order, before the section(s) in the Page Header
area begin to print.
Crystal Reports 2008 SP3 User's Guide 95
Page 96

Report Design Concepts
5
Deciding on the content of the report
How often do report objects print?
The way objects print will determine how you design your report. This will
help you decide where to place charts, Cross-Tabs, and formulas to get
specific results.
Report Header
Objects placed in the Report Header area print once, at the beginning of the
report.
• Charts and Cross-Tabs placed in this area contain data for the entire
report.
Note:
Both charts and Cross-Tabs can filter report data by using a Group Sort;
in such cases, the data shown in the chart or Cross-Tab is a subset of
the data for the entire report.
• Formulas placed in this area are evaluated once, at the beginning of the
report.
Page Header
Objects placed in the Page Header area print at the beginning of each new
page.
• Charts or Cross-Tabs cannot be placed in this section.
• Formulas placed in this area are evaluated once per page, at the beginning
of each new page.
Group Header
Objects placed in the Group Header area print at the beginning of each new
group.
• Charts and Cross-Tabs placed in this area contain data just for the group.
• Formulas placed in this area are evaluated once for each group, at the
beginning of the group.
96 Crystal Reports 2008 SP3 User's Guide
Page 97

Report Design Concepts
Developing a prototype on paper
Details area
Objects placed in the Details area print with each new record.
• Charts or Cross-Tabs cannot be placed in this area.
• Formulas placed in this area are evaluated once for each record.
Group Footer
Objects placed in the Group Footer area print at the end of each group.
• Charts and Cross-Tabs placed in this area contain data just for the group.
• Formulas placed in this area are evaluated once for each group, at the
end of the group.
Report Footer
Objects placed in the Report Footer area print once at the end of the report.
• Charts and Cross-Tabs placed in this area contain data for the entire
report.
5
Note:
Both charts and Cross-Tabs can filter report data by using a Group Sort;
in such cases, the data shown in the chart or Cross-Tab is a subset of
the data for the entire report.
• Formulas placed in this area are evaluated once, at the end of the report.
Page Footer
Objects placed in the Page Footer area print at the bottom of each page.
• Charts and Cross-Tabs cannot be placed in this area.
• Formulas placed in this area are evaluated once per page, at the end of
each new page.
Developing a prototype on paper
While a paper prototype is useful regardless of your level of expertise with
Crystal Reports, it is particularly valuable when you are first learning the
program. With the paper prototype in hand, you can put your full effort into
Crystal Reports 2008 SP3 User's Guide 97
Page 98

Report Design Concepts
5
Developing a prototype on paper
learning and using the commands, rather than into trying to design and learn
at the same time.
To design a paper prototype
1. Get the same size paper you will be using for the finished report.
2. Position the title and other descriptive header information, using boxes
or lines to represent report elements.
3. Position the footer information.
4. Review the page layout for balance.
5. Look at the information you intend to include in the body of the report:
• Count the number of fields being used and estimate the appropriate
spacing between fields.
• Use rectangles to pencil in the fields within the estimated spacing.
• Change the spacing if you need to.
• Decide on a logical sequence for presenting the data in the body of
the report.
• Label the fields to indicate that sequence.
6. Use small boxes to indicate group values and totals.
7. Place random flags in the column where you want flags to appear.
8. Darken any elements you want highlighted to make them stand out from
the rest of the prototype.
9. Review the finished product for layout and balance, and make changes
as needed.
98 Crystal Reports 2008 SP3 User's Guide
Page 99

Introduction to Reporting
6
Page 100

Introduction to Reporting
6
Report creation options
Report creation options
Each time you create a new report, you have three options:
• Use a Report Creation Wizard.
• Use another report as a model.
• Create a report from scratch.
You will probably use each option at some time.
Report Creation Wizards
The Report Creation Wizards help create reports as quickly as possible and
many new users and developers alike prefer to create the majority of their
reports using them. All you have to do is choose the wizard that most closely
matches your report type. The wizard walks you through the process of
creating reports step-by-step.
Another report
To build a new report based on one that already exists, another report can
be used as a model. Open the report you want to use in this way by selecting
the Open File option and save it to a new file using Save As (found on the
File menu). This method is useful to:
• Create a new report with a different grouping or different record selection
than that of an existing report.
• Reconstruct a report based on an earlier time period using the same
report structure used today.
• Create an entirely new report based on a set of databases that are linked
in another report. You can create a report and delete the fields without
disturbing the underlying links. Then, without relinking, you can build all
your new reports based on this report.
Crystal Reports also lets you format a report by applying a template. See
Using a template for more information.
100 Crystal Reports 2008 SP3 User's Guide
 Loading...