

Page 1

*TB 9-6625-2155-35
...........................
...............................
......
...........
..........
....
...............
.........................
...............................
................
...................
................
........
........
.......................
...................
SUPERSEDED COPY DATED 1 MAY 1989
DEPARTMENT OF THE ARMY TECHNICAL BULLETIN
CALIBRATION PROCEDURE FOR
SIGNAL GENERATOR SG-1219/U
(HEWLETT-PACKARD, MODEL 8673M)
Headquarters, Department of the Army, Washington, DC
6 December 2000
Approved for public release; distribution is unlimited.
REPORTING OF ERRORS
You can help improve this publication by calling attention to errors and by
recommending improvements and stating your reasons for the recommendations.
Your letter or DA Form 2028, Recommended Changes to Publications, should be
mailed directly to Commander, U.S. Army Aviation and Missile Command,
ATTN: AMSAM-MMC-LS-LP, Redstone Arsenal, AL 35898-5230. A reply will be
furnished to you. You may also send in your comments electronically to our email address: ls-lp@redstone.army.mil or by FAX (256) 842-6546/DSN 788-6546.
Paragraph Page
SECTION I. IDENTIFICATION AND DESCRIPTION
Test instrument identification
Forms, records, and reports
Calibration description ................................
II. EQUIPMENT REQUIREMENTS
Equipment required ................................
Accessories required ................................
III. CALIBRATION PROCESS
Preliminary instructions ................................
Equipment Setup ................................
Display resolution and accuracy
Single sideband phase noise
Harmonics, subharmonics, multiples
RF output level ................................
Pulse modulation................................
Amplitude modulation................................
Frequency modulation................................
Power supply................................
Final procedure................................
and nonharmonic spurious signals
1 2
2 2
3 2
4 3
5 3
6 4
7 5
8 6
9 9
10
11 12
12 18
13 22
14 26
15 30
16 32
10
__________
*This bulletin supersedes TB 9-6625-2155-35, dated 1 May 1989, including all changes.
Page 2
TB 9-6625-2155-35
SECTION I
IDENTIFICATION AND DESCRIPTION
1. Test Instrument Identification. This bulletin provides instructions for the
calibration of Signal Generator, SG-1219/U (Hewlett-Packard, Model 8673M). The
manufacturer’s manual and TM 9-6625-3143-40 were used as the prime data sources in
compiling these instructions. The equipment being calibrated will be referred to as the TI
(test instrument) throughout this bulletin.
a. Model Variations. None.
b. Time and Technique. The time required for this calibration is approximately 8
hours, using the dc and low frequency and microwave techniques.
2. Forms, Records, and Reports
a. Forms, records, and reports required for calibration personnel at all levels are
prescribed by TB 750-25.
b. Adjustments to be reported are designated (R) at the end of the sentence in which
they appear. When adjustments are in tables, the (R) follows the designated adjustment.
Report only those adjustments made and designated with (R).
3. Calibration Description. TI parameters and performance specifications which
pertain to this calibration are listed in table 1.
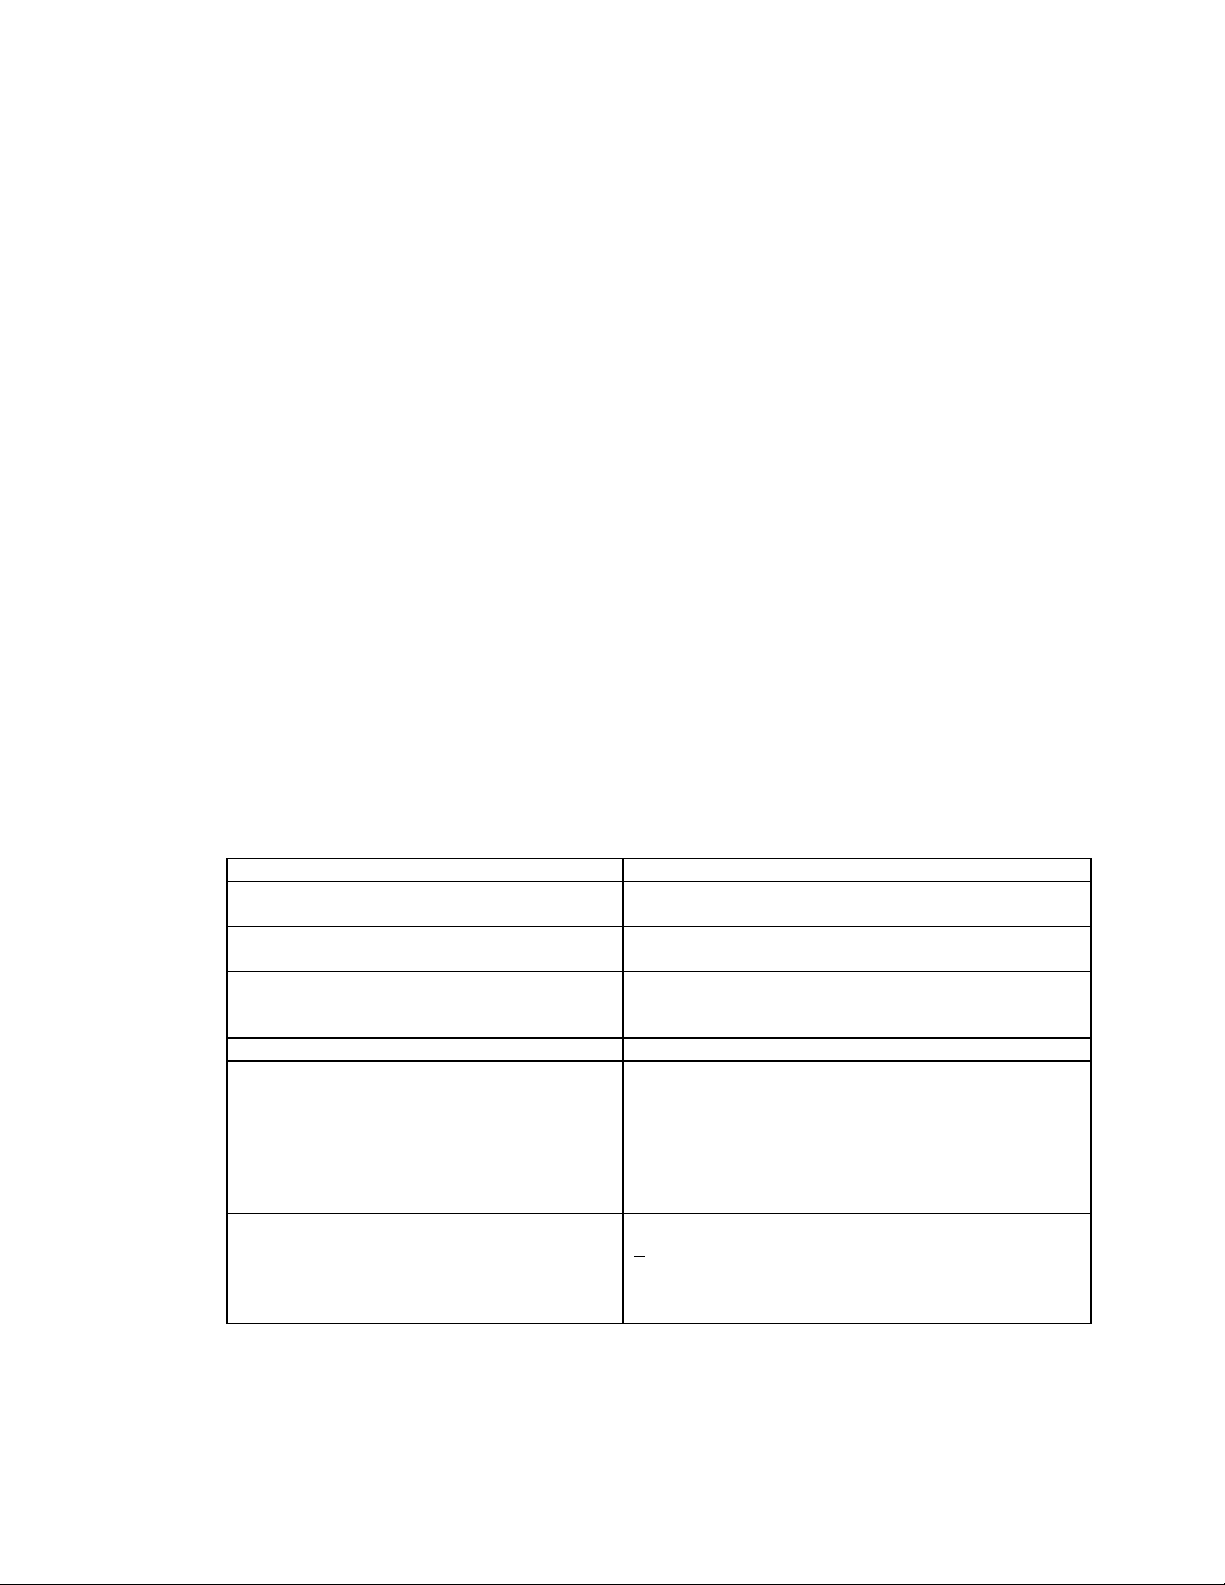
Table 1. Calibration Description
Test instrument parameters Performance specifications
Display accuracy and
resolution 2 to 18 GHz
Single sideband
phase noise
Harmonics:
Subharmonics
Spurious signals
Reference oscillator Accuracy: 1 x 10
RF output level
Level accuracy:
2.0 to 12.0 GHz
>12.0 to 18.0 GHz
Pulse modulation:
RF pulse width
Maximum peak power
Overshoot
Undershoot
See footnotes at end of table.
Display: ± 500 kHz
Resolution: 3 kHz
<-60 dBc 1 kHz offset from carrier
<-40 dBc
<-35 dBc
<-50 dBc
Range: +8 dBm to -120 dBm2
±2.0 dB (+8 to -60 dBm output level)
±3.5 dB (-61 to -120 dBm output level)
±3.0 dB (+8 to -60 dBm output level)
±4.5 dB (-61 to -120 dBm output level)
>80 ns
+3 dBm
<20% of carrier level
<20% of carrier level
-8
per 10 s1
/
2
Page 3
1
2
3
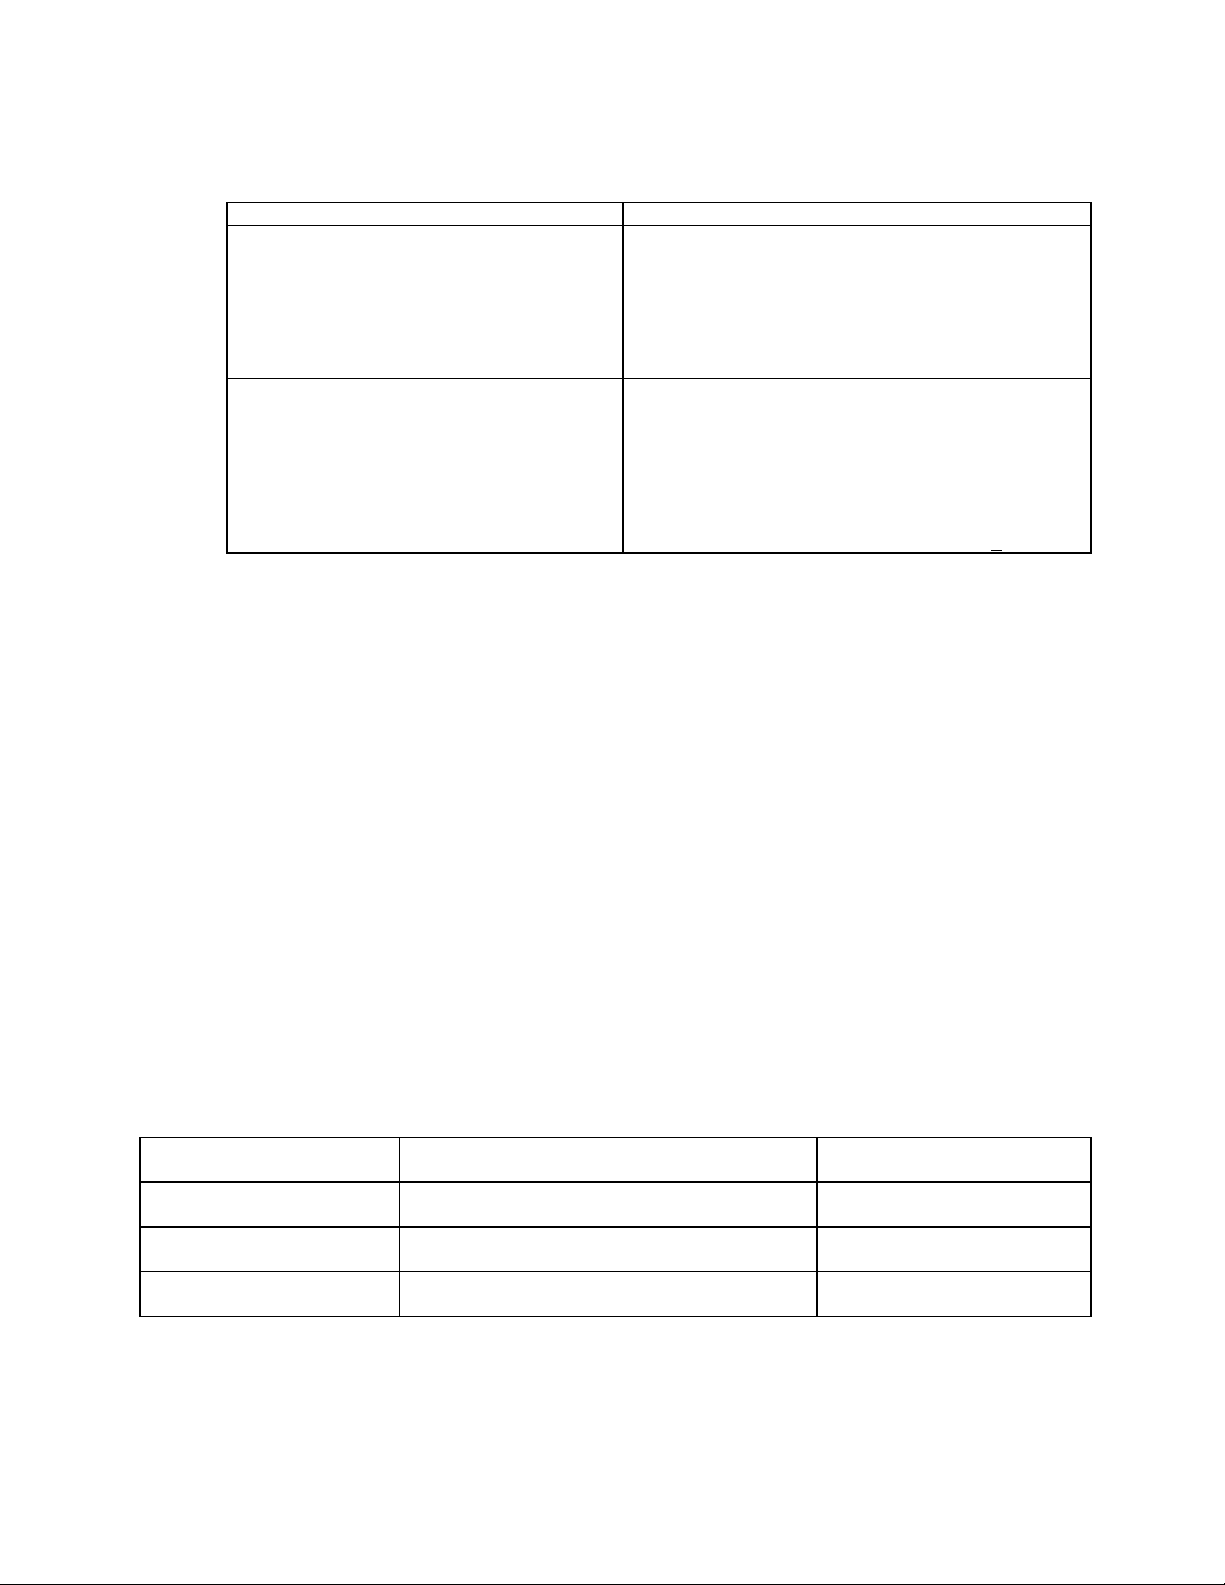
Table 1. Calibration Description - Continued
Test instrument parameters Performance specifications
Amplitude modulation:
Meter accuracy
Depth
Rates
Incidental FM
Frequency modulation:
Meter accuracy
Frequency response relative to a
100 kHz rate
Maximum deviation
Distortion
Incidental AM
As per CECOM specification.
Calibrated to -90 dBm.
Procedure limitation (see text).
EQUIPMENT REQUIREMENTS
TB 9-6625-2155-35
± 7% of reading ± 3% of range
0 to 75%: 2.0 to 18.0 GHz
0 dBm maximum carrier level
10 Hz to 50 kHz: 3 dB bandwidth
30% depth
<10 kHz p-p3: 30% modulation depth
±7% of reading ±3% of range
±3 dB, 50 Hz to 2 MHz
10 MHz 50 kHz to 1 MHz modulation rate
10 MHz/V deviation range
<5% 100 kHz rate at 1 MHz peak deviation
<5% Rates <100 kHz; peak deviations <1 MHz
SECTION II
4. Equipment Required. Table 2 identifies the specific equipment to be used in this
calibration procedure. This equipment is issued with Secondary Transfer calibration
Standards Set AN/GSM-287 or AN/GSM-705. Alternate items may be used by the
calibrating activity. The items selected must be verified to perform satisfactorily prior to
use and must bear evidence of current calibration. The equipment must meet or exceed the
minimum use specifications listed in table 2. The accuracies listed in table 2 provide a fourto-one ratio between the standard and TI.
5. Accessories Required. The accessories required for this calibration are common
usage accessories, issued as indicated in paragraph 4 above, and are not listed in this
calibration procedure. The following peculiar accessory is also required for this calibration:
Mixer, RHG Model DM 1-18A (P/N 21-159-2).
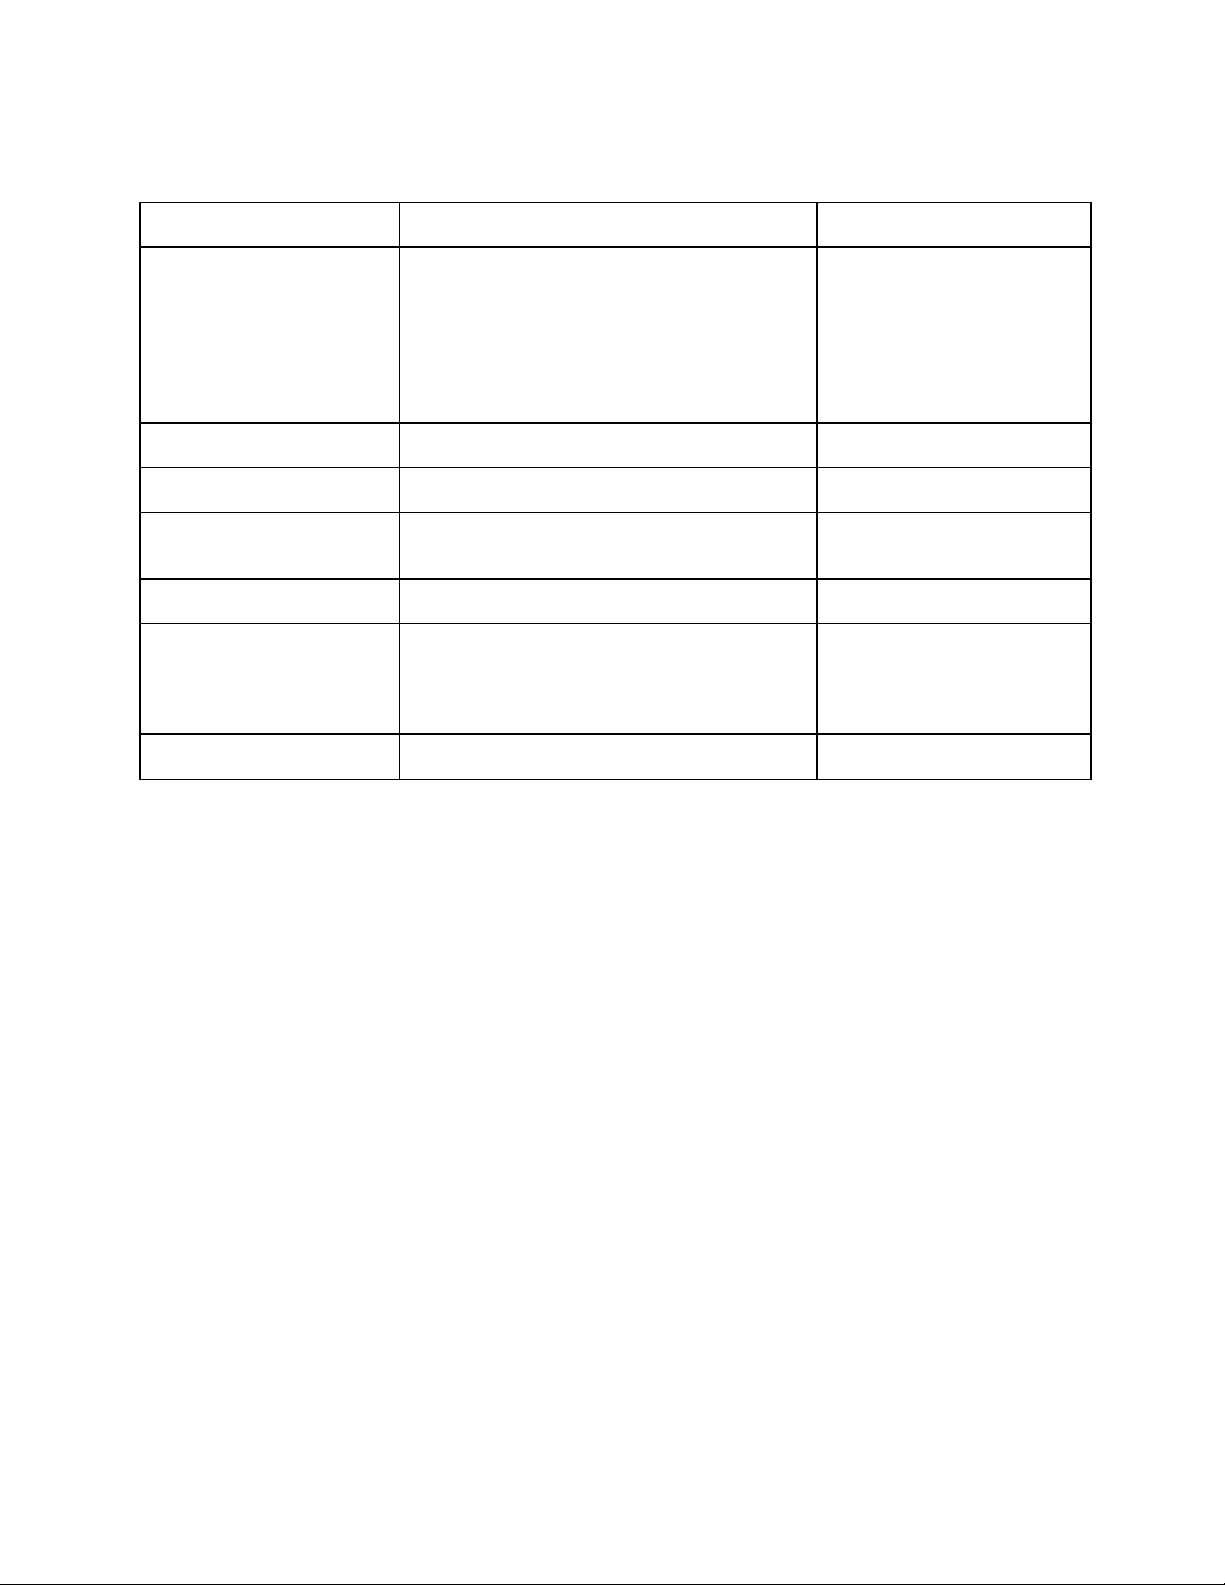
Table 2. Minimum Specifications of Equipment Required
Minimum use Manufacturer and model
Common name specifications (part number)
ATTENUATOR SET
(FIXED)
AUDIO ANALYZER Range: 1.0 to 100.0 kHz
FREQUENCY
DIFFERENCE METER
Range: 2 to 18 GHz
Accuracy: (See test report)
Accuracy: <2.0%
Range: 10 MHz
Resolution: 1 part in 10-8
Weinschel, Model 9918 (9918)
Boonton, Model 1120/S10
(MIS-35954/2)
Tracor, Model 527E
(MIS-10318)
3
Page 4
TB 9-6625-2155-35
Table 2. Minimum Specifications of Equipment Required - Continued
Minimum use Manufacturer and model
Common name specifications (part number)
MEASURING RECEIVER Range: 2.0 to 18 GHz
Range: +8 to -74.5 dBm
Accuracy: +.5 dB
Range: AM 0 to 80%
Accuracy: ±2% at 1 kHz
Range: FM .05 to 100 kHz
Accuracy: ±2% at 1 kHz
Deviation: ±12 kHz
MULTIMETER Range: 0 to 40 V dc
Accuracy: 0.01%
OSCILLOSCOPE Range: 5.0 V at 100 ns
Accuracy: 3.0%
PULSE GENERATOR Range: Period 10 µs
Accuracy: Determined by oscilloscope
SIGNAL GENERATOR Range: Output level +8 dBm
Frequency range: 2 to 18 GHz
SPECTRUM ANALYZER Range: 2.0 to 18 GHz at +10 to –60 to dBm
Accuracy: ±0.2% of the center frequency +20%
of the span/div
Range: Span 500 Hz to 20 MHz
Accuracy: ±5%
TIME/FREQUENCY
WORKSTATION
Frequency: 1 MHz
Accuracy: 5 parts in 1010 per day
Hewlett-Packard, Model
8902A (8902A) w/sensor
module, Model 11792A
(11792A) and converter,
Model 11793A (11793A)
John Fluke, Model 8840A/AF
05/09 (AN/GSM-64D)
Tektronix, Type 2465BOPT46
(2465BOPT46)
Lecroy Model 9210 (9210)
with plug-in, Model 9211
(9211)
(SG-1219/U)
(AN/USM-489A)
Autek Systems, Model 620
(MIS-38946)
SECTION III
CALIBRATION PROCESS
6. Preliminary Instructions
a. The instructions outlined in paragraphs 6 and 7 are preparatory to the calibration
process. Personnel should become familiar with the entire bulletin before beginning the
calibration.
b. Items of equipment used in this procedure are referenced within the text by common
name and item identification number as listed in table 2.
c. Unless otherwise specified, verify the result of each test and, whenever the test
requirement is not met, take corrective action before continuing with the calibration.
Additional maintenance information is contained in the manufacturer’s manual and TM 96625-3143-40 for this TI.
d. When indications specified in paragraphs 8 through 14 are not within tolerance,
perform the power supply check prior to making adjustments. After adjustments are made,
repeat paragraphs 8 through 14. Do not perform power supply check if all other
parameters are within tolerance.
e. Unless otherwise specified, all controls and control settings refer to the TI.
4
Page 5

TB 9-6625-2155-35
7. Equipment Setup
WARNING
HIGH VOLTAGE is used or exposed during the performance of
this calibration. DEATH ON CONTACT may result if
personnel fail to observe safety precautions. REDUCE
OUTPUT(s) to minimum after each step within the
performance check where applicable.
a. Remove TI from protective cover only as necessary to make adjustments.
NOTE
Refer to the table 2 for equipment models required and their
designated IEEE addresses. The TI must be connected to
controller GPIB1 IEEE interface card and all standards must
be connected to GPIB0.
NOTE
For the remainder of this procedure the SG-1219/U connected
to the measuring receiver will be called the local oscillator.
NOTE
Many indications, such as MESSAGE, ∆∆F, SWEEP FREQ
START, etc., will only appear when the appropriate entry
pushbutton is pressed and held in the IN position.
b. Connect TI to a 115 V ac power source.
c. Set LINE switch to ON and allow a 2-hour warm-up and stabilization.
d. Connect FREQUENCY STD INT connector of TI to SIG INPUT of frequency
difference meter. Set FREQUENCY STANDARD INT/EXT SWITCH to INT.
e. Connect 1 MHz output of time/frequency workstation to REF INPUT of the
frequency difference meter.
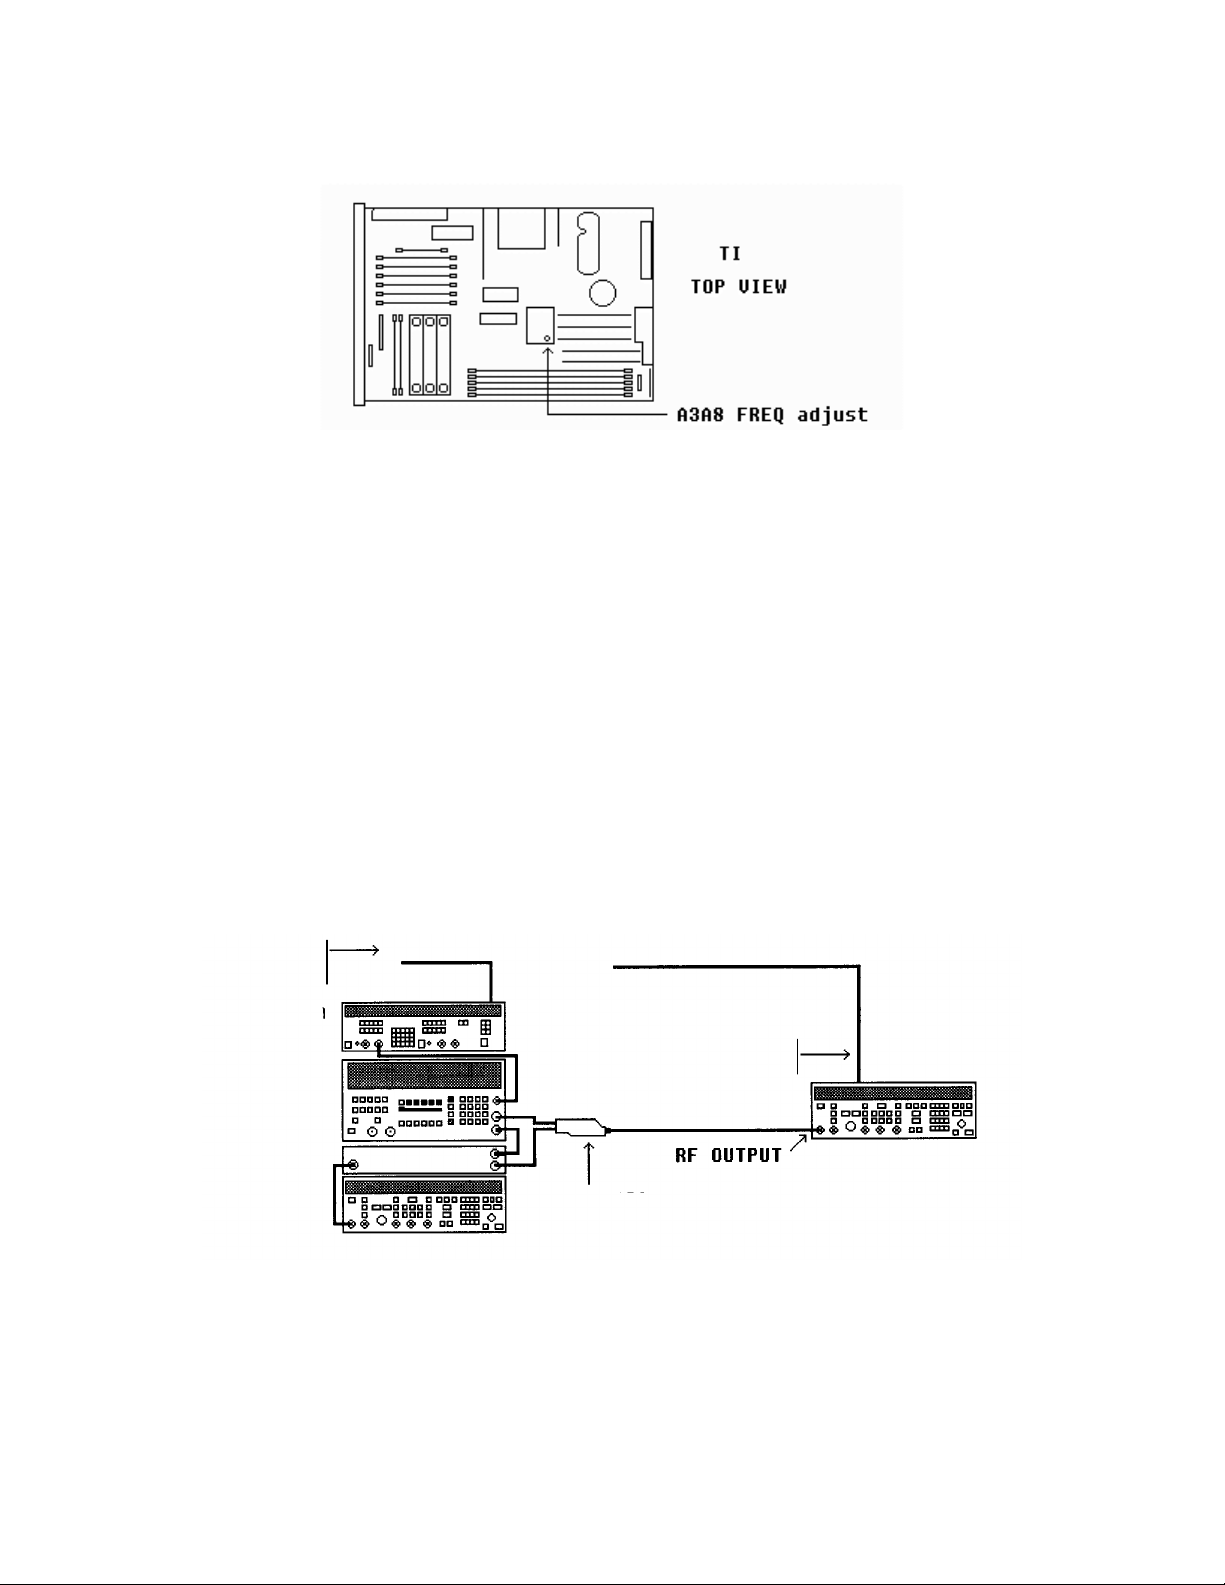
f. Adjust FREQ adjust A3A8 (fig. 1) for minimum frequency difference meter
indication.
g. Verify oscillator drift is less than 1 part in 10-8 per 10 s.
5
Page 6
TB 9-6625-2155-35
ADDRESS 9
488
GPIB 1
GPIB 0
1219/U
ADDRESS 19
MEASURING
Figure 1. Frequency adjust location.
h. Replace TI top cover.
i. Disconnect frequency difference meter from the TI and the time/frequency
workstation.
8. Display Resolution and Accuracy
a. Performance Check
(1) On the local oscillator rear panel disconnect the jumper between FREQ
STANDARD INT/EXT connectors and set the INT/EXT switch to EXT.
(2) Connect the local oscillator 10 MHz OUT to the measuring receiver TIME
BASE 10 MHz INPUT.
(3) Connect TI 10 MHz OUT (rear panel) to the local oscillator FREQ STANDARD
EXT connector.
(4) Finish connection as shown in figure 2.
TO: IEEE-488
AUDIO ANALYZER
ADDRESS 23
RECEIVER
ADDRESS 14
SG-
6
TO: IEEE-
TEST INSTRUMENT
SENSOR MODULE
( H-P MODEL 11792A)
Figure 2. Frequency resolution hookup.
Page 7
TB 9-6625-2155-35
(5) Press TI keys as listed in (a) through (f) below.
(a) RCL 0.
(b) Adjust OUTPUT LEVEL for 0 dB.
(c) ALC INTERNAL on.
(d) RF OUTPUT on.
(e) FREQ INCR, 1, kHz.
(f) FREQUENCY, 4, GHz.
(6) Set local oscillator and measuring receiver to measure 4 GHz, using the local
oscillator, and measuring receiver offset frequencies listed in table 3.
(7) Record the measuring receiver frequency indication as reference.
(8) Calculate the minimum and maximum limits for the 4 GHz rows in table 3 using
the formula below:
Minimum = (Reference + TI increment amount) – FREQ INCR setting
Maximum = (Reference + TI increment amount) +FREQ INCR setting
(9) Press the TI FREQ INCREMENT up arrow key three times as indicated in
table 3, and verify that the indication is within the tolerances calculated in (8) above.
(10) Press the TI FREQ INCREMENT down arrow key four times as indicated in
table, and verify that the indication is within the tolerances calculated in (8) above.
(11) Repeat (5)(e) through (10) above for settings of FREQUENCY 8 GHz with
FREQ INCR of 2 kHz, and FREQUENCY 15 GHz with FREQ INCR of 3 kHz.
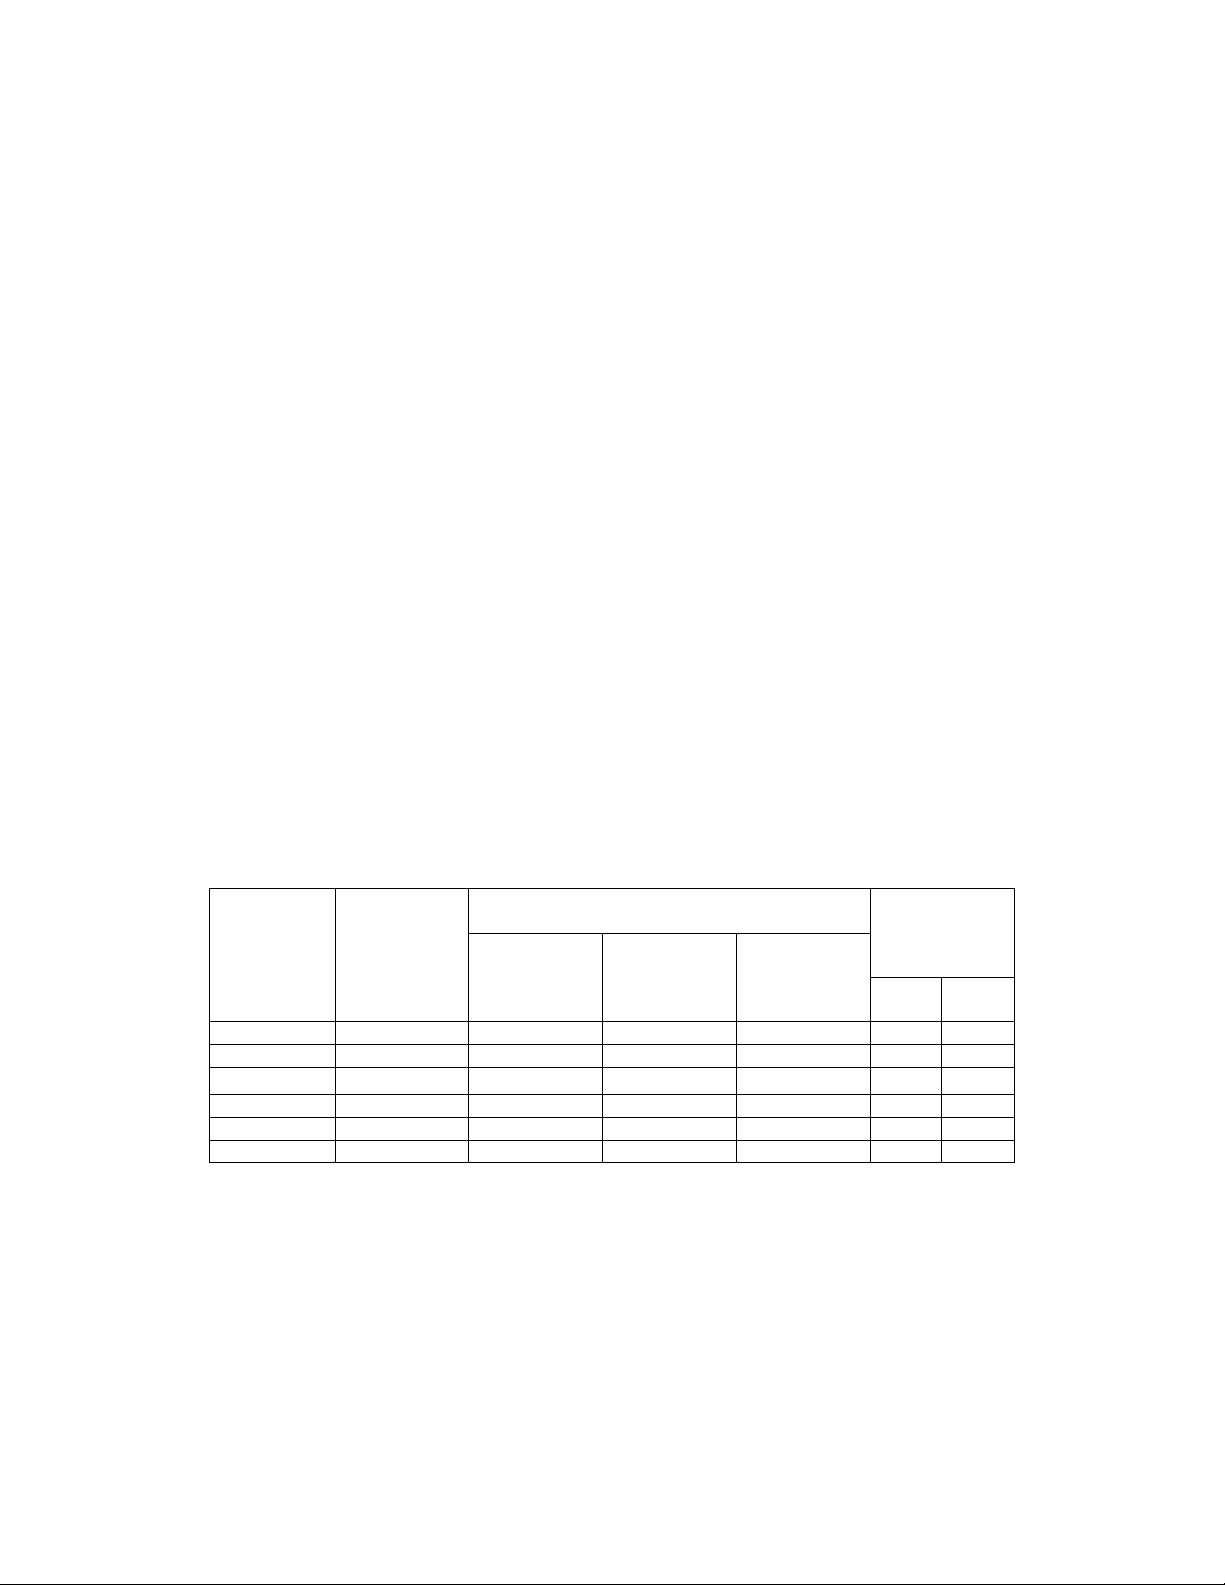
Table 3. Frequency Increment
Local
oscillator
(GHz)
4.12053 4120.530 4.000000
4.12053 4120.530 4.000000
8.12053 8120.530 8.000000
8.12053 8120.530 8.000000
15.12053 15120.530 15
15.12053 15120.530 15
Measuring
receiver
offset
(MHz)
Frequency
(GHz)
Test instrument
Step
increment
direction
UPUPUP
DNDNDNDN
UPUPUP
DNDNDNDN
UPUPUP
DNDNDNDN
Increment
amount
.003
-.001
.006
-.002
.009
-.003
Tolerance
Min Max
(12) Press TI keys as listed in (a) through (f) below.
(a) RCL 0.
(b) Adjust OUTPUT LEVEL for 0 dB.
(c) ALC INTERNAL on.
7
Page 8
TB 9-6625-2155-35
(d) RF OUTPUT on.
(e) FREQ INCR, 1, 1, 1, ., 1, 1, 3, and MHz.
(f) FREQUENCY, 2, GHz.
(13) Set local oscillator and measuring receiver to measure 2 GHz, using the local
oscillator, and measuring receiver offset frequencies listed in table 4.
(14) Verify that the measuring receiver indicates within tolerances listed in table 4.
(15) Repeat (12)(e) through (14) above for remaining settings in table 4 verifying
measuring receiver indicates within the tolerances listed.
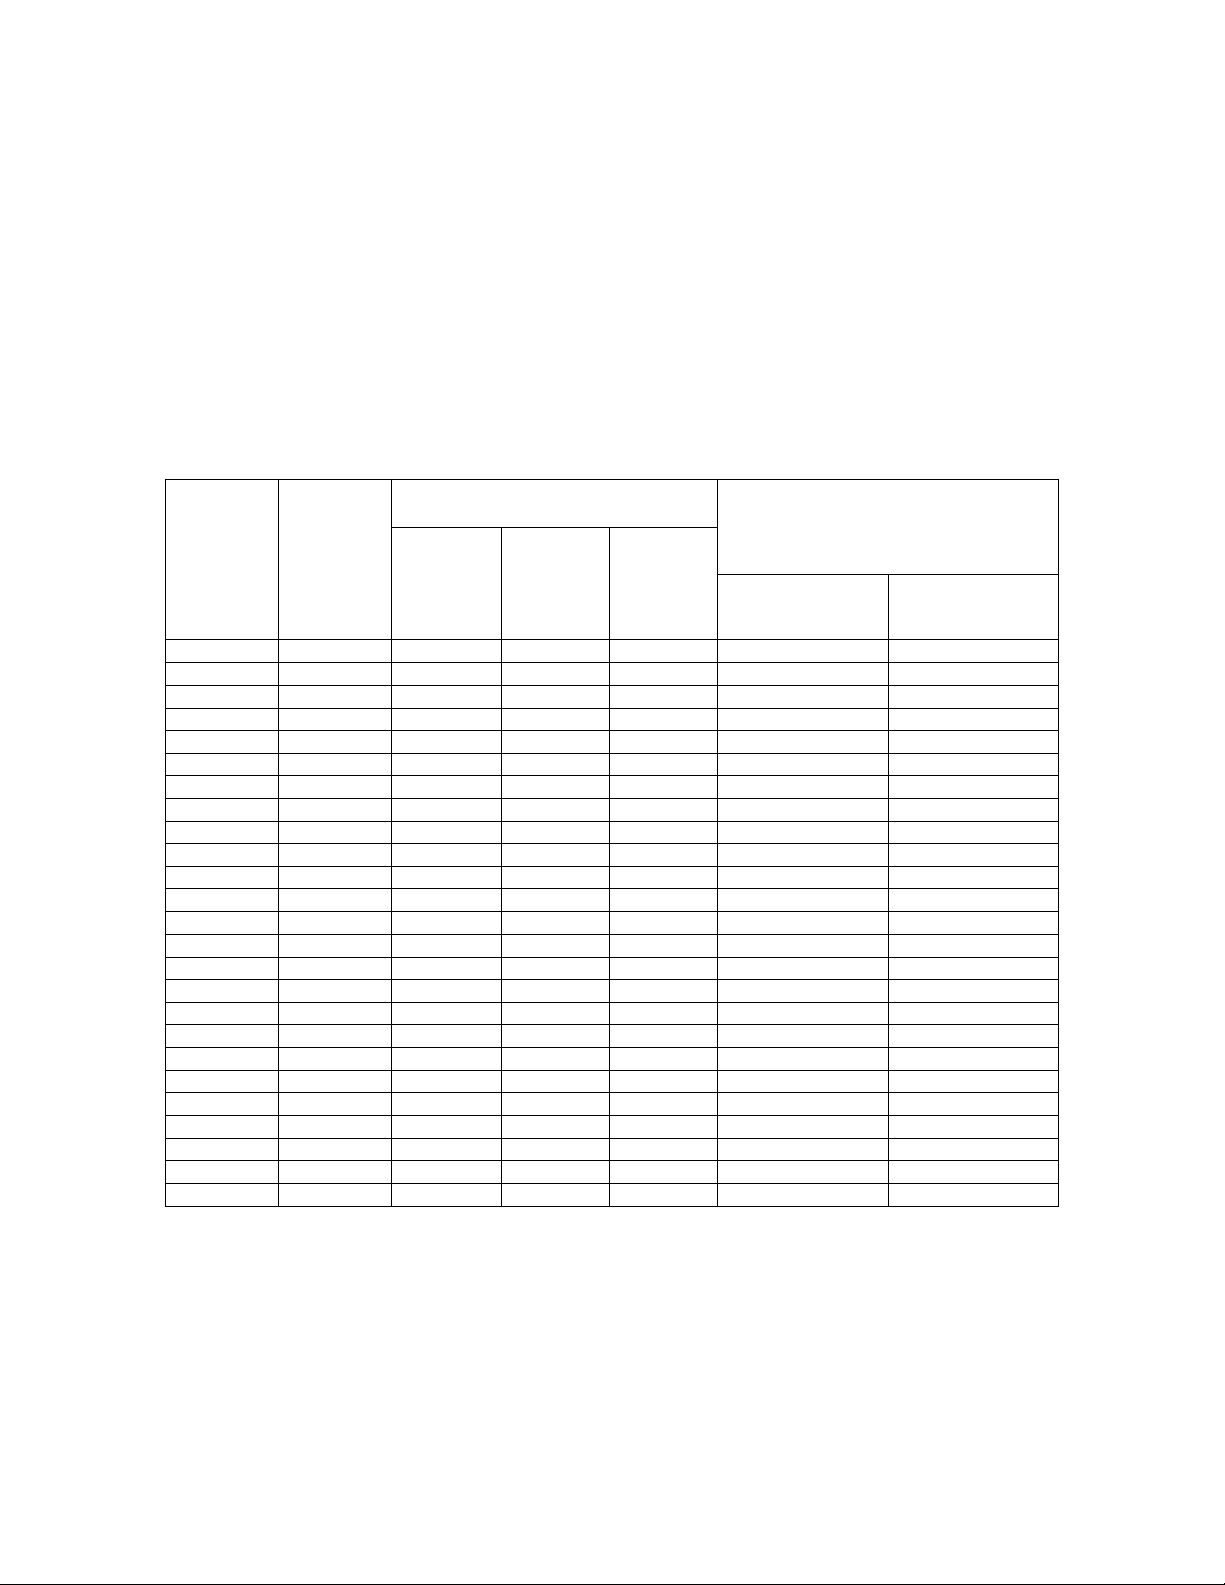
Table 4. Frequency Resolution
Test instrument
Local
oscillator
(GHz)
2.120530 2120.530 2 111.113 1999.99700M 2000.00300M
2.231643 2231.643 UP 2111.11000M 2111.11600M
2.342756 2342.756 UP 2222.22300M 2222.22900M
2.453869 2453.869 UP 2333.33600M 2333.34200M
2.544982 2544.982 UP 2444.44900M 2444.45500M
2.676095 2676.095 UP 2555.56300M 2555.56800M
2.787208 2787.208 UP 2666.67600M 2666.68100M
2.898321 2898.321 UP 2777.78800M 2777.94000M
3.009434 3009.434 UP 2888.90100M 2888.90700M
3.120530 3120.530 2 1000 UP 2999.99700M 3000.00300M
4.120530 4120.530 UP 3999.99700M 4000.00300M
5.120530 5120.530 UP 4999.99700M 5000.00300M
6.120530 6120.530 UP 5999.99700M 6000.00300M
7.120530 7120.530 UP 6999.99700M 7000.00300M
8.120530 8120.530 UP 7999.99700M 8000.00300M
9.120530 9120.530 UP 8999.99700M 9000.00300M
10.12053 10120.53 UP 9999.99700M 10000.00300M
11.12053 11120.53 UP 10999.99700M 11000.00300M
12.12053 12120.53 UP 11999.99700M 12000.00300M
13.12053 13120.53 UP 12999.99700M 13000.00300M
14.12053 14120.53 UP 13999.99700M 14000.00300M
15.12053 15120.53 UP 14999.99700M 15000.00300M
16.12053 16120.53 UP 15999.99700M 16000.00300M
17.12053 17120.53 UP 16999.99700M 17000.00300M
18.12053 18120.53 UP 17999.99700M 18000.00300M
Measuring
receiver
offset
(MHz)
Frequency
(GHz)
Step
increment
setting
Step
increment
direction
Signal generator workstation
Minimum
indications
Maximum
(16) Disconnect TI 10 MHz OUT (rear panel) from the local oscillator FREQ
STANDARD EXT connector.
(17) Reconnect the jumper between the local oscillator FREQ STANDARD
INT/EXT connector.
8
Page 9
(18) Set local oscillator INT/EXT switch to INT position.
ADDRESS 10
b. Adjustments. No adjustments can be made.
9. Single Sideband Phase Noise
a. Performance Check
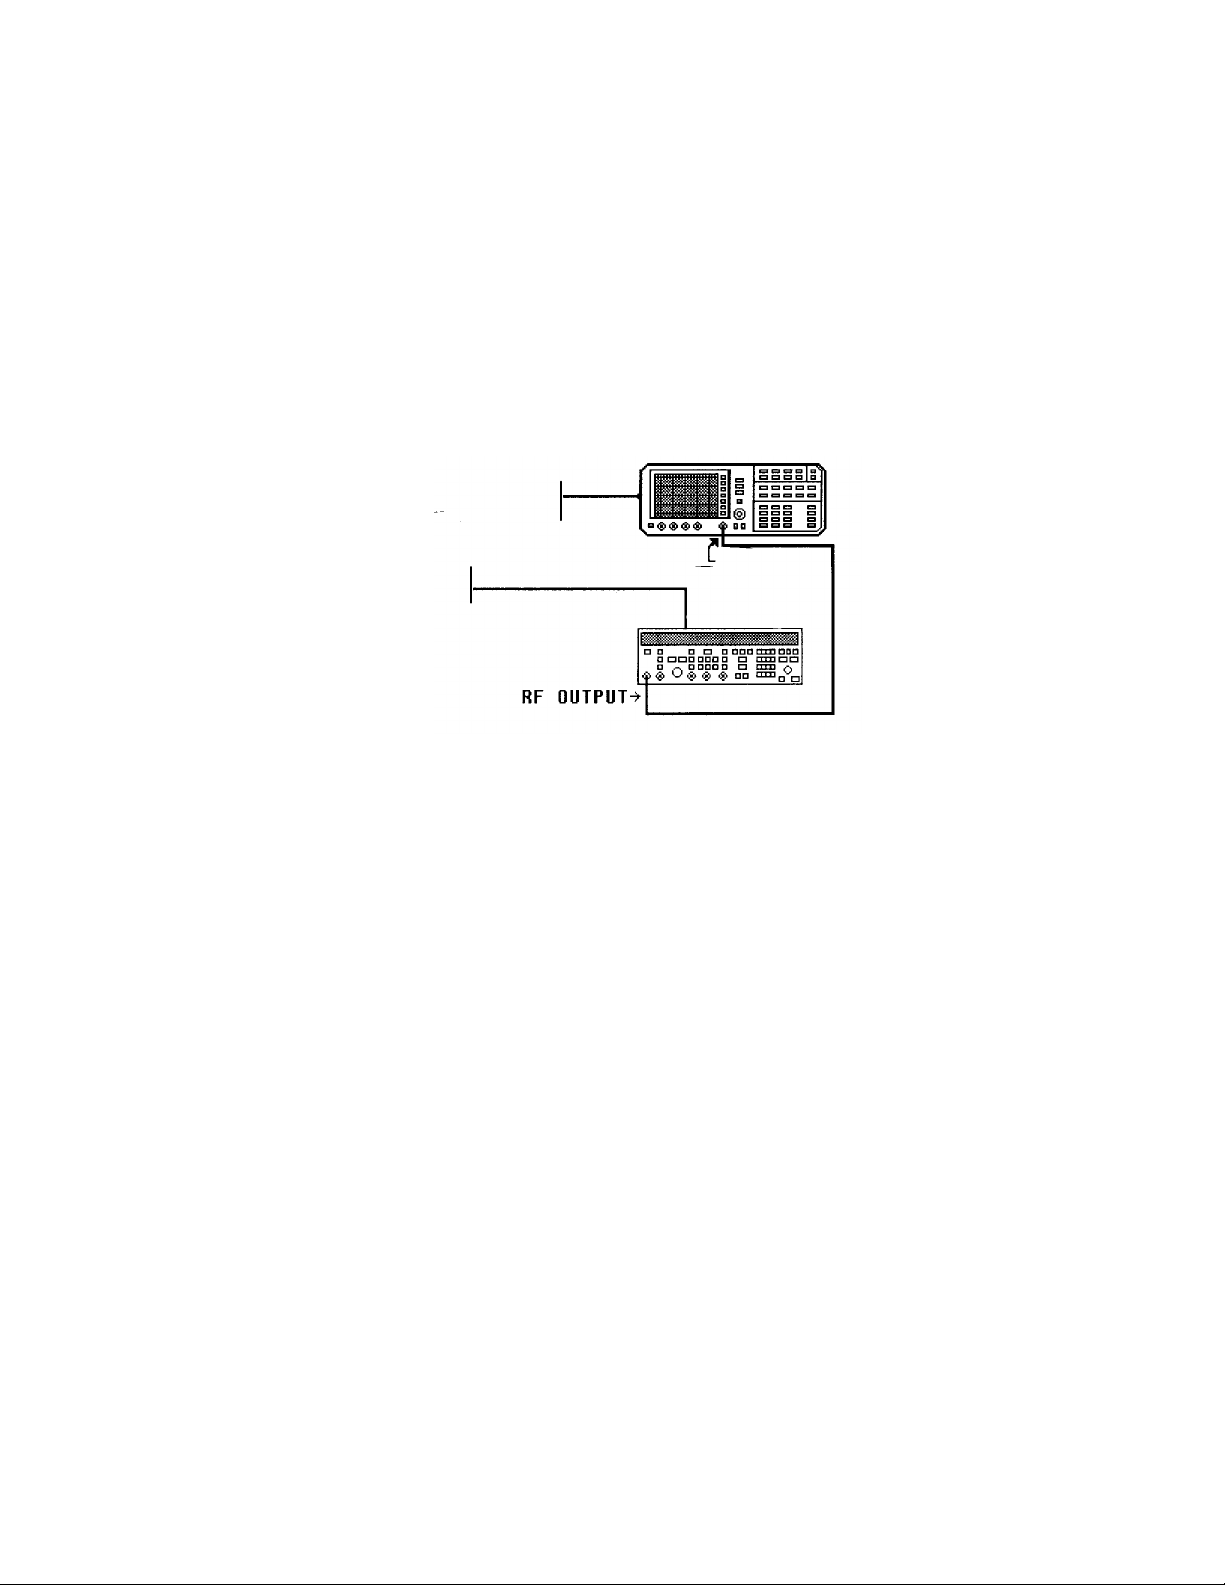
(1) Connect equipment as shown in figure 3.
SPECTRUM ANALYZER
TO: IEEE 488
GPIB 0
TB 9-6625-2155-35
TO: IEEE 488
GPIB 1
TEST INSTRUMENT
ADDRESS 9
Figure 3. Sideband phase noise hookup.
INPUT
50ΩΩ
(2) Press TI keys as listed in (a) through (e) below.
(a) RCL 0.
(b) Adjust OUTPUT LEVEL for 8 dB.
(c) ALC INTERNAL on.
(d) RF OUTPUT on.
(e) FREQUENCY, 5, ., 9, 9, 9, GHz.
(3) Set spectrum analyzer as listed in (a) through (f).
(a) PRESET.
(b) AMPLITUDE REF LVL to 8 dBm.
(c) All markers off.
(d) FREQUENCY CENTER FREQ to 5.999 GHz.
(e) VIDEO BW and RES BW to AUTO.
(f) SPAN to 1 MHz.
(4) Allow spectrum analyzer to sweep signal a couple of times then set spectrum
analyzer as listed in (a) through (d) below:
9
Page 10
TB 9-6625-2155-35
ADDRESS 9
IN/OUT
GPIB 1
GPIB 0
ADDRESS 10
(a) PEAK SEARCH.
(b) SIG TRK ON.
(c) SPAN 2.5 kHz.
(d) VIDEO BW 10 Hz.
(5) Allow spectrum analyzer to sweep signal for approximately 50 seconds then set
spectrum analyzer as listed in (a) through (d) below.
(a) PEAK SEARCH.
(b) MKRNOISE on.
(c) TRACE, view A.
(d) MARKER DELTA 1 kHz.
(6) Spectrum analyzer ∆∆MKR will indicate less than or equal to the minimum
indication listed in table 5.
(7) Repeat technique of (2) through (6) above for remaining frequencies listed in
table 5.
Table 5. Side Band Phase Noise 1 kHz Removed
Test instrument
frequency
(GHz)
5.999 -62.5
12 -62.5
18 -62.5
Spectrum analyzer
indication
(dB)
minimum (≤)
b. Adjustments. No adjustments can be made.
10. Harmonics, Subharmonics, Multiples and Non-harmonic Spurious Signals
a. Performance Check
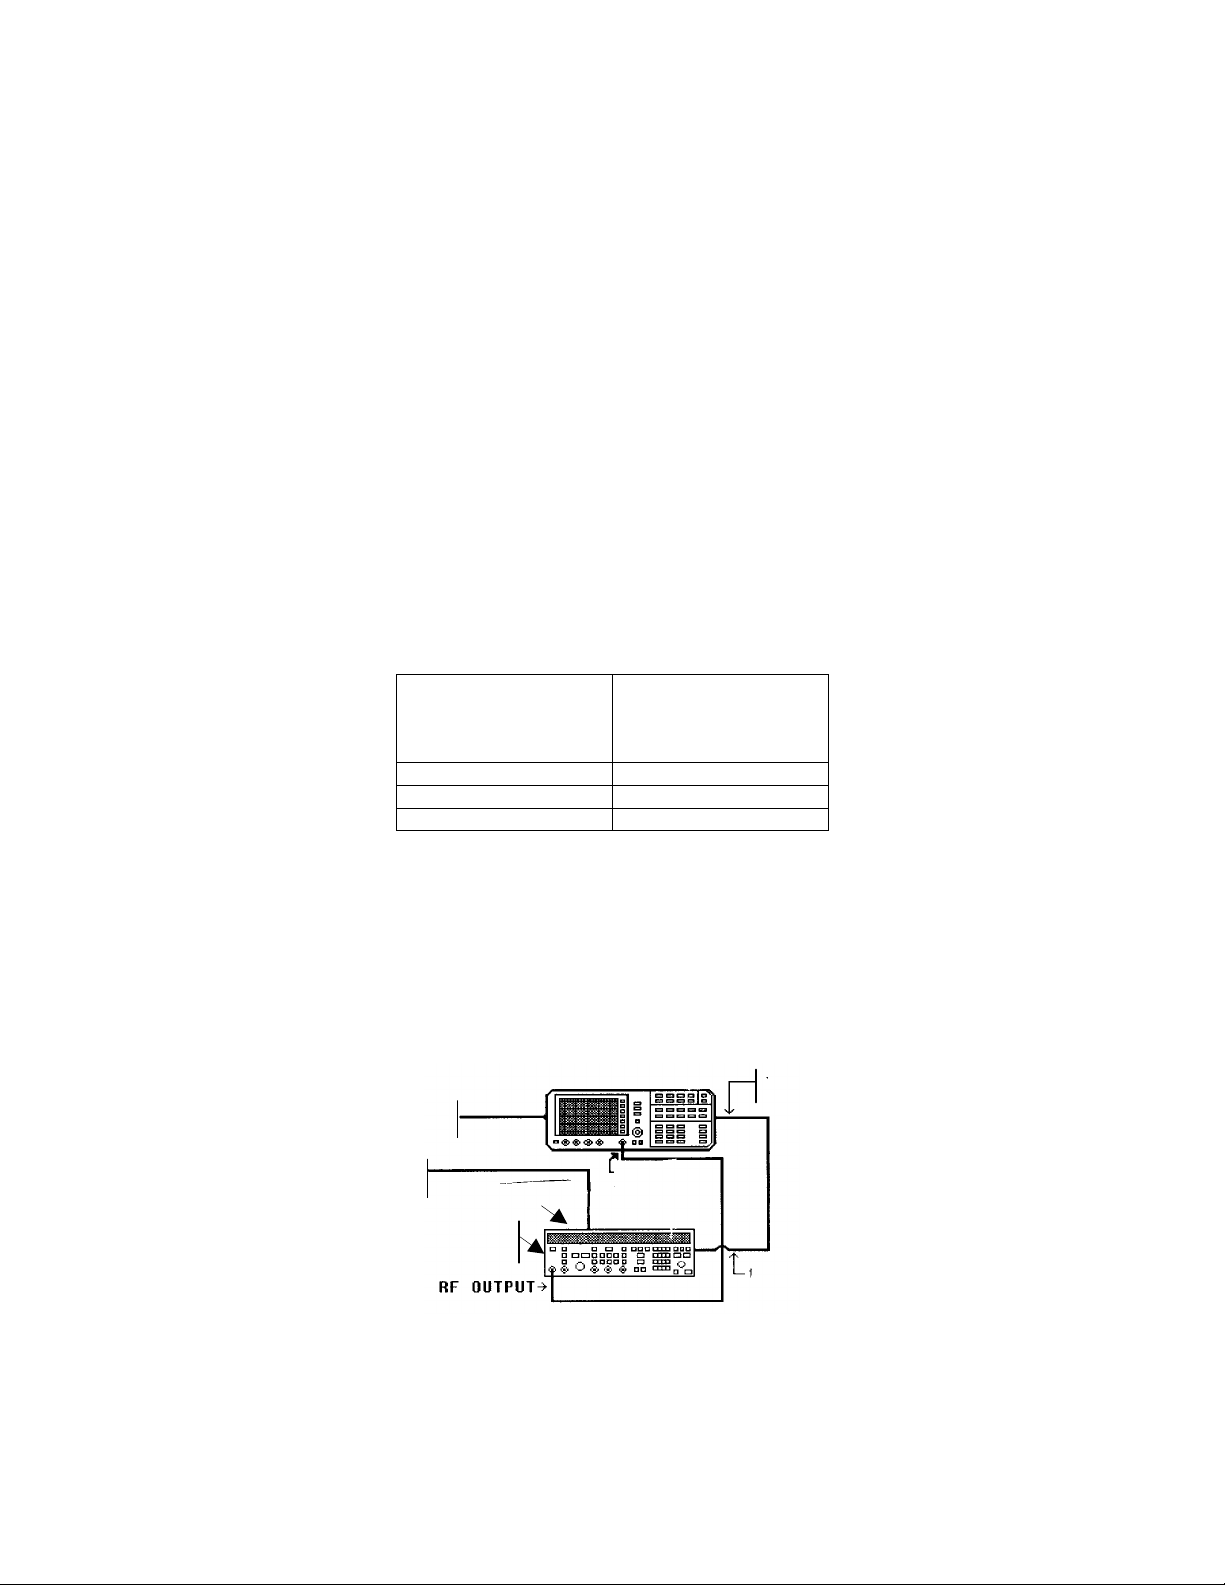
(1) Connect equipment as shown in figure 4 below.
SPECTRUM ANALYZER
TO: IEEE 488
TO: IEEE 488
IEEE
TEST INSTRUMENT
Figure 4. Harmonic, Subharmonic, Multiples and Non-harmonic spurious hookup.
INPUT
TO: 10 MHZ REF
TO: 10 MHZ REF
OUT
10
Page 11

TB 9-6625-2155-35
(2) Press TI keys as listed in (a) through (e) below.
(a) RCL 0.
(b) Adjust OUTPUT LEVEL for -3 dB.
(c) ALC INTERNAL on.
(d) RF OUTPUT on.
(e) FREQUENCY, 2, GHz.
(3) Set spectrum analyzer controls as listed in (a) through (g).
(a) PRESET.
(b) AMPLITUDE REF LVL to -3 dBm.
(c) VIDEO BW to AUTO.
(d) RES BW 10 kHz.
(e) SPAN to 1 MHz.
(f) All markers off.
(g) Center frequency to 2 GHz.
(4) Allow the display to sweep a few times then set spectrum analyzer as listed in
(a) through (d).
(a) PEAK SEARCH.
(b) MARKER →→ CF.
(c) MARKER DELTA.
(d) FREQUENCY, CENTER FREQ, (harmonic frequency listed in table 6)
GHz.
(5) The spectrum analyzer ∆∆MKR will indicate less than or equal to the minimum
limit listed in table 6.
(6) Set TI frequency to next frequency listed in table 6 and repeat (3)(f) through (5)
above.
(7) Repeat (6) above for remaining frequencies listed in table 6.
Table 6. Harmonic Distortion Check
Test
instrument
frequency
(GHz)
2 4 2nd -40
4 8 2nd -40
6 12 2nd -40
8 16 2nd -40
8 4 .5 -35
10 5 .5 -35
12 6 .5 -35
Harmonic
frequency
Harmonic
Spectrum analyzer
indication
(dB)
minimum (≤)
11
Page 12

TB 9-6625-2155-35
Table 6. Harmonic Distortion Check - Continued
Test
instrument
frequency
(GHz)
14 4.6667 .33 -35
14 9.3333 .66 -35
16 5.3333 .33 -35
16 10.6667 .66 -35
18 6 6 GHz Sub -35
18 12 12 GHz Sub -35
Harmonic
frequency
Harmonic
Spectrum analyzer
indication
(dB)
minimum (≤)
(8) Press TI FREQUENCY, 2.5, and GHZ keys.
(9) Set spectrum analyzer center frequency to 2.5 GHz, video bandwidth to AUTO,
resolution bandwidth to 10 kHz, and span to 1 MHz.
(10)
are ≤ 50 dBc
Using the spectrum analyzer, verify that all non-harmonic spurious signals
TI frequencies listed in table 7.
Table 7. Non-harmonic Spurious Signal Level
Test instrument frequency
(GHz)
2.500 000 < -50 dBc
3.000 000 < -50 dBc
3.500 000 < -50 dBc
4.500 000 < -50 dBc
5.000 000 < -50 dBc
5.500 000 < -50 dBc
6.500 000 < -50 dBc
Spurious signal level
(11) Reduce all outputs to minimum and disconnect equipment.
b. Adjustments. No adjustments can be made.
11. RF Output Level
a. Performance Check
(1) Connect equipment as shown in figure 5.
12
Page 13

TO: IEEE-488
AUDIO
ADDRESS 23
MEASURING
RECEIVER
ADDRESS 14
ADDRESS 19
GPIB 0
TB 9-6625-2155-35
ANALYZER
SG-1219/U
SENSOR
MODULE
TO: IEEE-488
GPIB 1
TEST INSTRUMENT
ADDRESS 9
Figure 5. RF output hookup.
(2) Connect sensor module to measuring receiver CALIBRATION RF POWER
OUTPUT.
(3) Connect TI RF 50 OHM output to measuring receiver power sensor.
(4) Press TI keys as listed in (a) through (e) below.
(a) RCL 0.
(b) Adjust OUTPUT LEVEL for -3 dB.
(c) ALC INTERNAL on.
(d) RF OUTPUT on.
(e) FREQUENCY, 2, GHz.
(5) Using measuring receiver and tuned level techniques in Log Mode, sweep the TI
from 2 GHz to 18 GHz in 1 GHz steps, and record the highest and lowest levels.
(6) Calculate the flatness using the formula below. The flatness will be less than or
equal to the maximum limit listed in table 8.
Flatness = (highest – lowest) / 2
Table 8. Output Level Flatness.
Start frequency Stop frequency Max limit
2 GHz 18 GHz 1.999
(7) Press TI FREQUENCY, 2, and GHz keys. Verify the measuring receiver
indicates within minimum and maximum limits for TI output levels listed in table 9 below,
using standard tuned level measurement techniques.
13
Page 14

TB 9-6625-2155-35
Table 9. 2 GHz Output Level Test.
Test
instrument
output level
0 -2 2
-10 -12 -8
-20 -22 -18
-30 -32 -28
-40 -42 -38
-50 -52 -48
-60 -62 -58
-70 -73.5 -66.5
-80 -83.5 -76.5
-90 -93.5 -86.5
-100 -103.5 -96.5
Min
Max
(8) Press TI FREQUENCY, 6, and GHz keys. Verify the measuring receiver
indicates within minimum and maximum limits for TI output levels listed in table 10
below, using standard tuned level measurement techniques.
Table 10. 6 GHz Output Level Test
Test
instrument
output level
0 -2 2
-10 -12 -8
-20 -22 -18
-30 -32 -28
-40 -42 -38
-50 -52 -48
-60 -62 -58
-70 -73.5 -66.5
-80 -83.5 -76.5
-90 -93.5 -86.5
-100 -103.5 -96.5
Min
Max
(9) Press TI FREQUENCY, 12, and GHz keys. Verify the measuring receiver
indicates within minimum and maximum limits for TI output levels listed in table 11
below, using standard tuned level measurement techniques.
Table 11. 12 GHz Output Level Test
Test
instrument
output level
0 -2 2
-10 -12 -8
-20 -22 -18
-30 -32 -28
-40 -42 -38
Min
Max
14
Page 15

TB 9-6625-2155-35
Table 11. 12 GHz Output Level Test - Continued
Test
instrument
output level
-50 -52 -48
-60 -62 -58
-70 -73.5 -66.5
-80 -83.5 -76.5
-90 -93.5 -86.5
-100 -103.5 -96.5
Min
Max
(10) Press TI FREQUENCY, 12.5, and GHz keys. Verify the measuring receiver
indicates within minimum and maximum limits for TI output levels listed in table 12
below, using standard tuned level measurement techniques.
Table 12. 12.5 GHz Output Level Test
Test
instrument
output level
0 -3 3
-10 -13 -7
-20 -23 -17
-30 -33 -27
-40 -43 -37
-50 -53 -47
-60 -63 -57
-70 -74.5 -65.5
-80 -84.5 -75.5
-90 -94.5 -85.5
-100 -104.5 -95.5
Min
Max
(11) Press TI FREQUENCY, 18, and GHz keys. Verify the measuring receiver
indicates within minimum and maximum limits for TI output levels listed in table 13
below, using standard tuned level measurement techniques.
Table 13. 18 GHz Output Level Test
Test
instrument
output level
0 -3 3
-10 -13 -7
-20 -23 -17
-30 -33 -27
-40 -43 -37
-50 -53 -47
-60 -63 -57
-70 -74.5 -65.5
-80 -84.5 -75.5
-90 -94.5 -85.5
-100 -104.5 -95.5
Min
Max
15
Page 16

TB 9-6625-2155-35
b. Adjustments
(1) Remove TI protective covers.
(2) Press TI FREQUENCY,2 ,GHz keys and adjust the output level to –3 dB.
(3) Set the measuring receiver to measure tuned power at 2 GHz in a LOG mode.
(4) Press number 6 pushbutton on the TI.
(5) Press service switch A2A2S1 (fig. 6).
Figure 6. A2A2 board.
(6) Press TI RCL 1.
(7) Adjust A1A2A2R29 (fig. 7) for a measuring receiver indication of –3.0 dBm (R).
Figure 7. A1A2 board.
(8) Using TUNE KNOB, tune the test instrument from 2 to 6.6 GHz. Record
minimum and maximum measuring receiver indications and frequencies where they occur.
(9) Adjust A1A8R55 (fig. 8) to reduce the difference between minimum/maximum
power indications (R).
16
Page 17

TB 9-6625-2155-35
Figure 8. A1A8 board.
(10) Using TUNE KNOB, tune the test instrument to 2 GHz.
(11) Readjust A1A2A2R29 (fig. 7) for a measuring receiver indication of 3.0 dBm.
(12) Tune the test instrument from 2 to 6.6 GHz. Verify that the output level stays
within ±1 dB of -3 dBm.
(13) Repeat (8) through (12) above until level stays within 1 dB of – 3dBm or until no
further improvement can be made.
(14) Press TI RCL 2.
(15) Using TUNE KNOB, tune the test instrument from 6.600002 to 12.99902 GHz.
Record minimum and maximum measuring receiver indications and frequencies where they
occur.
(16) Adjust A1A8R82 (fig 8) to minimize difference between minimum and maximum
power indications (R).
NOTE
If minimum and maximum output power levels are more than
±1.5 dB from –3 dBm, repeat the entire adjustment procedure
until measuring receiver indicates within ±1.5 dB of –3 dBm.
(17) Press TI SWEEP MODE OFF, FREQ INCR, 2, 0, 0, and MHz keys.
(18) Verify the measuring receiver indicates –3 dBm ±0.2 dBm. Readjust
A1A2A2R29 (fig. 7) as necessary for best compromise.
(19) Using TUNE KNOB, tune the test instrument from 2 to 12.2 GHz.
Verify that the difference between the minimum and maximum power indications are equal
to or less than 3 dB.
(20) Press TI RCL and 3 keys.
(21) Using TUNE KNOB, tune the test instrument from 12.300003 to
17.59999901 GHz. Record minimum and maximum measuring receiver indications and
frequencies where they occur.
17
Page 18

TB 9-6625-2155-35
ADDRESS 9
GPIB 1
GPIB 0
(22) Adjust A1A8R67 (fig. 8) to minimize difference between minimum and
maximum power indications (R).
(23) Press TI SWEEP MODE OFF, FREQUENCY, 2, and GHz keys.
(24) Adjust A1A2A2R29 (fig. 7)for a measuring receiver indication of –3.0 dBm.
(25) Press service switch A2A2S1 (fig. 6).
(26) Reduce TI RF output level to minimum.
(27) Replace TI top cover.
12. Pulse Modulation
a. Performance Check
(1) Disconnect cable from local oscillator RF OUTPUT connector.
(2) Connect equipment as shown in figure 9.
TO: IEEE-488
TO: IEEE 488
TEST INSTRUMENT
TO MEASURING RECEIVER SG-1219/U
RF OUTPUT
Figure 9. Pulse modulation hookup.
PULSE GENERATOR
(3) Press TI keys as listed in (a) through (g) below.
(a) RCL 0.
(b) Adjust OUTPUT LEVEL for 3 dB.
(c) ALC INTERNAL on.
OSCILLOSCOPE
ADDRESS 1
PLUG-IN
18
Page 19

TB 9-6625-2155-35
(d) RF OUTPUT on.
(e) FREQUENCY, 2, GHz.
(f) AUTO PEAK on.
(g) PULSE NORMAL on.
(4) Press local oscillator keys as listed in (a) through (e) below.
(a) RCL 0.
(b) Adjust OUTPUT LEVEL for 8 dB.
(c) ALC INTERNAL on.
(d) RF OUTPUT on.
(e) FREQUENCY, 2.05, GHz.
(5) Set the pulse generator to produced the outputs listed in (a) through (f) below.
(a) Recall Setup, Standard, Enter, Enter.
(b) Frequency to 1 MHz.
(c) A: Width to 110 nS.
(d) A:VHI to 5 V.
(e) A:VLO to 0 V.
(f) A:DISP off.
(6) Set the oscilloscope as listed in (a) through (k) below.
(a) MODE, CH1, CH2.
(b) CH1, Coupling, 50ΩΩ.
(c) CH1, Volts/Div 20 mV.
(d) CH2, Coupling, 50ΩΩ .
(e) CH2, Volts/Div 100 mV.
(f) TRIGGER A MODE to Auto.
(g) TRIGGER A Source to CH2.
(h) TRIGGER Coupling to DC.
(i) TRIGGER Slope +.
(j) Horizontal SEC/DIV to 200 ns.
(k) Video bandwidth limit to off.
NOTE
The next several test require that you adjust the oscilloscope as
necessary to obtain a centered 5 division pulse as shown in
figure 10.
19
Page 20

TB 9-6625-2155-35
Figure 10. Pulse modulated display.
(7) Verify pulse overshoot and undershoot is less than 20% and ALC UNLEVEL
light on TI is extinguished. If signal is not within limits specified perform adjustments
listed in b below.
(8) Set TI, and local oscillator to the remaining frequencies and levels listed in table
14, and repeat (7) above at each frequency.
Table 14. Pulse Modulation Overshoot and Undershoot Check
Test instrument
Frequency
(GHz)
2.00 3 2.050 Overshoot Undershoot @ 2.0 GHz
2.00 -10 2.050 Overshoot Undershoot @ 2.0 GHz -
6.60 3 6.650 Overshoot Undershoot @ 6.6 GHz
6.60 -10 6.650 Overshoot Undershoot @ 6.6 GHz -
6.60 0 6.650 Overshoot Undershoot @ 6.6 GHz 0dBm
6.70 3 6.750 Overshoot Undershoot @ 6.7 GHz
6.70 10 6.750 Overshoot Undershoot @ 6.7 GHz -
6.70 0 6.750 Overshoot Undershoot @ 6.7 GHz 0dBm
12.290 3 12.340 Overshoot Undershoot @ 12.29 GHz
12.290 -10 12.340 Overshoot Undershoot @ 12.29 GHz -
12.290 0 12.340 Overshoot Undershoot @ 12.29 GHz
12.300 3 12.350 Overshoot Undershoot @ 12.3 GHz
12.300 -10 12.350 Overshoot Undershoot @ 12.3 GHz -
Level
(dB)
LO
Frequency
(GHz)
Description
+3dBm
10dBm
+3dBm
10dBm
+3dBm
10dBm
+3dBm
10dBm
0dBm
+3dBm
10dBm
20
Page 21

TB 9-6625-2155-35
Table 14. Pulse Modulation Overshoot and Undershoot Check - Continued
Test instrument
1
Frequency
(GHz)
12.300 0 12.350 Overshoot Undershoot @ 12.3 GHz
18.000 3 18.050 Overshoot Undershoot @ 18.0 GHz
18.000 -10 18.050 Overshoot Undershoot @ 18.0 GHz -
18.000 0 18.050 Overshoot Undershoot @ 18.0 GHz
18.0001 8 18.050 Overshoot Undershoot @ 18.0 GHz
Remove 6 dB attenuator pad before adjusting output level to 8 dB.
Level
(dB)
LO
Frequency
(GHz)
Description
0dBm
+3dBm
10dBm
0dBm
8dBm
(9) Disconnect equipment setup, and reconnect local oscillator RF OUTPUT
connector.
b. Adjustments
(1) Remove TI top cover.
(2) Press TI keys as listed in (a) through (g) below.
(a) RCL, 0.
(b) FREQUENCY, 2, and GHz.
(c) OUTPUT LEVEL to 3 dB.
(d) RF OUTPUT to on.
(e) ALC INTERNAL to on.
(f) AUTO PEAK to on.
(g) PULSE and NORMAL .
(3) Set the local oscillator to produce a 2.050 GHz signal at 8 dBm and turn the RF
OUTPUT then AUTO PEAK on.
(4) Reset the pulse generator then set to produce a 1 MHz pulse train with a width
of 100 ns, VHI of 5 and VLO of 0, and turn the output on.
(5) Press oscilloscope controls as listed in (a) through (i) below:
(a) CH1 50ΩΩ.
(b) CH1, VOLT/DIV .02.
(c) CH2 50 Ω Ω.
(d) TRIGGER MODE A AUTO LVL.
(e) TRIGGER SOURCE CH2.
21
Page 22

TB 9-6625-2155-35
SENSOR MODULE
GPIB 1
(f) TRIGGER COUPLING DC.
(g) TRIGGER SLOPE +.
(h) SEC/DIV 200 nS.
(i) 20MHz BW LIMIT to off.
(6) Adjust oscilloscope as required for centered five division pulse as in figure 10.
(7) Adjust A1R4R25 (fig. 11) for best pulse shape (R).
Figure 11. A1A4 adjustment locations.
(8) Adjust A1A4R9 (fig. 11) cw until ALC UNLEVEL light is on, then adjust
A1A4R9 ccw until ALC UNLEVEL light is extinguished (R).
(9) Reduce all outputs to minimum.
(10) Replace TI top cover.
13. Amplitude Modulation
a. Performance Check
(1) Connect equipment as shown in figure 12 below.
TO: IEEE 488
TO: IEEE 488
GPIB 0
AUDIO ANALYZER
ADDRESS 23
MEASURING RECEIVER
ADDRESS 14
SIGNAL GENERATOR
ADDRESS 19
TEST INSTRUMENT
ADDRESS 9
22
Figure 12. Amplitude modulation hookup.
Page 23

TB 9-6625-2155-35
(2) Press TI keys as listed in (a) through (e) below.
(a) RCL 0.
(b) Adjust OUTPUT LEVEL for -13 dB.
(c) ALC INTERNAL on.
(d) RF OUTPUT on.
(e) FREQUENCY, 16.6, GHz.
(3) Set audio analyzer as listed in (a) through (d) below.
(a) PRGM 99 ENTER RCL.
(b) 600Ω output.
(c) Source frequency 1 kHz.
(d) Source level 0.7 V.
(4) Set measuring receiver to measure amplitude modulation, with +PEAK detector,
high pass and Lo pass filters off and at a frequency of 16.6 GHz.
(5) Press TI AM MTR and 100%AM keys. Adjust the audio analyzer output level of
a 50.0 ±0.1% AM indication on the measuring receiver.
(6) If the TI meter does not indicate within limits listed in table 15 perform b below.
(7) Repeat (5) and (6) above for the 75% AM meter indication listed in table 15.
Table 15. AM Meter
Test instrument meter indication Test
description
50% AM meter 43.5 56.5
75% AM meter 70 80
Min Max
(8) Press TI keys as listed in (a) through (b) below.
(a) Adjust OUTPUT LEVEL for -0 dB.
(b) FREQUENCY, 3.9, GHz.
(9) Set audio analyzer as listed in (a) through (b) below.
(a) Source frequency 1 kHz.
(b) Source level 0.425 V.
(10) Set measuring receiver to measure amplitude modulation, with +PEAK detector,
high pass and Lo pass filters off and at a frequency of 3.9 GHz.
(11) Press TI AM MTR and 100%AM keys. Adjust the audio analyzer output level of
a 30.0 ±0.05% AM indication on the measuring receiver.
23
Page 24

TB 9-6625-2155-35
(12) Set audio analyzer to measure LEVEL and set units to dB then select RATIO
mode.
(13) Set the audio analyzer to the frequencies listed in table 16; the audio analyzer
will indicate within limits listed in table 16.
Table 16. External AM Frequency Response
Test description
50 Hz response 50 -3 3
400 Hz response 400 -3 3
500 Hz response 500 -3 3
25 kHz response 25000 -3 3
50 kHz response 50000 -3 3
Audio
analyzer
frequency
(Hz)
Audio analyzer indication
Min
(dB)
Max
(dB)
(14) Set audio analyzer as listed in (a) through (e) below.
(a) PRGM 99 ENTER RCL.
(b) 600Ω output.
(c) Source frequency 1 kHz.
(d) Source level 0.7 V.
(15) Set TI frequency to 3.9 GHz.
(16) Set local oscillator and measuring receiver to measure a frequency of 3.9 GHz.
(17) Press TI AM MTR and 100%AM keys. Set audio analyzer to measure
distortion.
(18) The audio analyzer will indicate within limits listed in table 17 for the current
audio analyzer source frequency and level.
(19) Set the audio analyzer to produced a 10 kHz signal at 0.425 V.
(20) Set measuring receiver to measure FM using + PEAK detector.
(21) The audio analyzer will indicate within limits listed in table 17 for the current
audio analyzer source frequency and level.
(22) Press measuring receiver INST PRESET.
(23) Set TI frequency to 6.2 GHz, and set measuring receiver and local oscillator to
measure 6.2 GHz using the offset frequencies listed in table 17.
(24) Set measuring receiver to measure FM using + PEAK detector. The measuring
receiver will indicate within limits listed in table 17 for the current frequency.
(25) Press TI AM OFF. Repeat (23) and (24) for remaining settings in table 17.
24
Page 25

TB 9-6625-2155-35
Table 17. Distortion, Incidentals, and Residuals
Audio analyzer
Test description Frequency Level (GHz) (MHz) maximum
Pct. Dist @ 1kHz 1000 .7 3.9 ----- 8
Inc. FM @ 3.9 GHz 10000 .425 3.9 ----- 10000
Inc. FM @ 6.2 GHz ----- ----- 6.2 6320.530 10000
Inc FM @ 12.3 GHz ----- ----- 12.3 12420.530 10000
Inc. FM @ 18 GHz ----- ----- 18 18120.530 10000
Res FM @ 6.2 GHz ----- ----- 6.2 6320.530 10000
Res FM @ 12.3 GHz ----- ----- 12.3 12420.530 10000
Res FM @ 18 GHz ----- ----- 18 18120.530 10000
Test
instrument
frequency
Offset
frequency
(26) Disconnect equipment setup
b. Adjustments
(1) Remove TI top cover.
(2) Press TI keys as listed in (a) through (g) below:
Measuring
receiver
indication
(a) RCL 0.
(b) ALC INTERNAL to on.
(c) FREQUENCY 1, 6, ., 6, and GHz.
(d) Adjust OUTPUT LEVEL to –10 dB.
(e) RF OUTPUT to on.
(f) MTR LVL to on.
(g) AM 100%.
(3) Set the audio analyzer to produce a 1 kHz, 1.06 V output with 600Ω output
impedance, then select special function 17.
(4) Set measuring receiver and local oscillator to measure 16.6 GHz, then select AM
measurement and + PEAK detector.
(5) Adjust A1A3R83 (fig. 13) for an indication of 73.0% AM on the measuring
receiver (R).
(6) Adjust A1A6R84 (fig. 13) until TI meter indicates 75% on middle scale of output
meter (R).
25
Page 26

TB 9-6625-2155-35
GPIB 1
SENSOR MODULE
ADDRESS 19
Figure 13. AM adjustment locations.
(7) Reduce all outputs to minimum.
(8) Replace TI top cover.
14. Frequency Modulation
a. Performance Check
(1) Connect equipment as shown in figure 14 below.
TO: IEEE 488
AUDIO ANALYZER
ADDRESS 23
MEASURING RECEIVER
ADDRESS 14
SIGNAL GENERATOR
Figure 14. Frequency modulation hookup.
TO: IEEE 488
GPIB 0
TEST INSTRUMENT
ADDRESS 9
26
Page 27

TB 9-6625-2155-35
(2) Press TI keys as listed in (a) through (g) below.
(a) RCL 0.
(b) Adjust OUTPUT LEVEL for 0 dB.
(c) ALC INTERNAL on.
(d) RF OUTPUT on.
(e) FREQUENCY, 15.0, GHz.
(f) MTR FM.
(g) FM DEVIATION .1 MHz.
(3) Set audio analyzer as listed in (a) through (e) below.
(a) PRGM 99 ENTER RCL.
(b) SPCL 17 ENTER.
(c) 50Ω output.
(d) Source frequency 100 kHz.
(e) Source level 1.4 V.
(f) LEVEL STEP 0.01V.
(4) Set measuring receiver to measure frequency modulation, with + PEAK
detector, high pass filter to 300 Hz and Lo pass filter off and at a frequency of 15 GHz.
(5) Adjust the audio analyzer output level for a 100.0 kHz indication on the TI
meter.
(6) If the measuring receiver does not indicate within limits listed in table 18
perform b below.
Table 18. FM Meter Accuracy
Test description
100 kHz FM meter 85 k 115 k
Measuring receiver indication
(Hz)
Min Max
(7) Press TI keys as listed in (a) and (b) below.
(a) FREQUENCY, 4.0, GHz.
(b) FM DEVIATION MHz OFF.
(8) Set audio analyzer as listed in (a) and (b) below.
(a) Source level 20 mV.
(b) LEVEL STEP 0.1mV.
(9) Press TI FM DEVIATION 10 button. Set measuring receiver to measure
frequency modulation with +PEAK detector, high pass filter to 300 Hz and Lo pass filter
off, and at a frequency of 4 GHz.
27
Page 28

TB 9-6625-2155-35
(10) Using the up and down arrow keys, adjust the audio analyzer output level for a
140.0 ± 0.5 kHz FM deviation indication on the measuring receiver.
(11) Set audio analyzer to measure level and set units to dB, then set audio analyzer
to ratio mode.
(12) Set audio analyzer to frequencies listed in table 19 and verify that audio
analyzer level indication is within limits listed in table 19.
Table 19. External FM Frequency Response.
Test description
50 Hz Response 50 -3 3
120 Hz Response 120 -3 3
500 Hz Response 500 -3 3
1 kHz Response 1000 -3 3
5 kHz Response 5000 -3 3
10 kHz Response 10000 -3 3
50 kHz Response 50000 -3 3
140 kHz Response 140000 -3 3
Audio analyzer
frequency
(Hz)
Audio analyzer indication
Min
Max
(13) Set audio analyzer as listed in (a) and (e) below.
(a) Source level 20 mV.
(b) LEVEL STEP 0.1mV.
(c) Frequency to 1 kHz.
(d) Analyzer level units to dB.
(e) Ratio mode off.
(14) Set measuring receiver high and Lo pass filters off and then select FM
measurement with + PEAK detector.
(15) Set audio analyzer frequency to 140 kHz and set ratio mode on.
(16) Set the audio analyzer to frequency listed in table 20 and verify that the audio
analyzer level indicates less than the maximum listed in table 20.
(17) Press TI FM DEVIATION OFF and set frequency to 2 GHz.
(18) Adjust measuring receiver and local oscillator so that the measuring receiver
will measure 2 GHz.
(19) Press TI FM DEVIATION 1 MHz.
(20) Set audio analyzer to produce a 100 kHz, 0.707 V signal output.
(21) Set measuring receiver to measure AM with +PEAK detector.
(22) Measuring receiver will indicate less than the maximum limit listed in table 20.
28
Page 29

TB 9-6625-2155-35
(23) Set TI frequency to next setting listed in table 20 and repeat (20), (23), and (24).
(24) Repeat (23) above for remaining TI frequencies listed in table 20.
Table 20. Distortion and Incidentals
Test description
Pct. Dist. @ 100 kHz 100000 .020 5
Inc. AM @ 4 GHz 2 2120.530 5
Inc. AM @ 6.7 GHz 6.7 6820.530 5
Inc. AM @ 12.4 GHz 12.4 12520.532 5
Inc. AM @ 18 GHz 18 18120.531 5
Audio analyzer
Frequency Level
Test
instrument
frequency
(GHz)
Offset
frequency
(MHz)
Measuring
receiver/audio
analyzer
indication
maximum
(25) Disconnect all equipment.
b. Adjustments
(1) Remove TI top cover.
(2) Press TI keys as listed in (a) through (g) below:
(a) RCL 0.
(b) ALC INTERNAL to on.
(c) FREQUENCY 1, 5, and GHz.
(d) Adjust OUTPUT LEVEL to 0 dB.
(e) RF OUTPUT to on.
(f) MTR FM to on.
(g) FM DEVIATION MHz .1 on.
(3) Set the audio analyzer to produce a 100 kHz, 0.01 V LEVEL STEP size, 1.414 V
output with 600Ω output impedance, then select special function 17.
(4) Set measuring receiver and local oscillator to measure 15 GHz, then select FM
measurement and 300 Hz HP FILTER, 3 kHz LP FILTER, and +PEAK detector.
(5) Adjust A1A6R35 (fig. 15) for an indication of 100.0 ±1 kHz FM deviation on the
measuring receiver (R).
(6) Adjust A1A6R70 (fig. 15) until TI meter indicates 100 kHz FM Deviation (needle
at full scale) (R).
29
Page 30

TB 9-6625-2155-35
Figure 15. FM Adjustment locations.
(7) Reduce all outputs to minimum.
(8) Replace TI top cover.
15. Power Supply
a. Performance Check
(1) Connect digital voltmeter to A3A1TP1 and chassis (fig. 16). If digital voltmeter
does not indicate between +21.98 and +22.02 V dc, perform b(1) below.
Figure 16. A3A1 card.
(2) Connect digital voltmeter to A3A3TP5 (fig. 17) and chassis. If digital voltmeter
does not indicate between +19.998 V dc and +20.002 V dc, perform b(2) below.
30
Page 31

TB 9-6625-2155-35
Figure 17. A3A3 card.
(3) Repeat technique of (2) above for test points and indications in table 13.
Table 13. Power Supply Checks
Test instrument Voltage (V dc)
test points Min Max
A3A3TP6 (fig. 11) +9.9 +12.1
A3A3TP2 (fig. 11) +5.1 +5.3
A3A4TP5 (fig. 12) -5.15 -5.25
A3A4TP4 (fig. 12) -9.8 -10.2
A3A4TP1 (fig. 12) -39.0 -40.6
Figure 18. A3A4 Card.
b. Adjustments
(1) Adjust A3A1R2 (fig. 16) for an indication of +22.00 V dc on digital voltmeter (R).
(2) Adjust A3A3R50 (fig. 17) for an indication of 20.000 V dc on digital voltmeter.
No further adjustments can be made (R).
31
Page 32

TB 9-6625-2155-35
16. Final Procedure
a. Deenergize and disconnect all equipment.
b. Annotate and affix DA label/form in accordance with TB 750-25.
32
Page 33

TB 9-6625-2155-35
By Order of the Secretary of the Army:
Official:
ERIC K. SHINSEKI
General, United States Army
Chief of Staff
JOEL B. HUDSON
Administrative Assistant to the
Sec retary of the Army
DISTRIBUTION:
To be distributed in accordance with IDN 342253, requirements for calibration procedure
TB 9-6625-2155-35.
0027703
PIN: 064151-000
 Loading...