

Page 1

TM 11-6625-2780-14&P
TECHNICAL MANUAL
OPERATOR’S, ORGANIZATIONAL, DIRECT SUPPORT
AND GENERAL SUPPORT MAINTENANCE MANUAL
INCLUDING REPAIR PARTS AND SPECIAL TOOLS LISTS
FOR
SIGNAL
GENERATORS SG-1 112(V)1/U
(NSN 6625-00-566-3067)
AND SG-1l12(V)2/U
(NSN 6625-00-500-6525)
(HEWLETT-PACKARD MODEL 8640B,
OPTIONS 001 AND 004)
HEADQUARTERS, DEPARTMENT OF THE ARMY
31 DECEMBER 1980
Page 2

By Order of the Secretary of the Army:
Official:
J. C. PENNINGTON
Major General, United States Army
The Adjutant General
DISTRIBUTION:
To be distributed in accordance with distribution list.
E. C. MEYER
General, United States
Chief of Staff
Army
Page 3

This manual contains copyright material reproduced by permission of the Hewlett-Packard Company.
TM 11-6625-2780-14&P
T ECHNICAL M ANUAL
No. 11-6625-2780-14&P
DEPARTMENT OF THE ARMY
W
ASHINGTON
HEADQUARTERS
, DC
31 December 1980
OPERATOR’S, ORGANIZATIONAL, DIRECT SUPPORT,
AND GENERAL SUPPORT MAINTENANCE MANUAL
INCLUDING REPAIR PARTS AND SPECIAL TOOLS LISTS
FOR
SIGNAL GENERATORS SG-1112(V)1/U (NSN 6625-00-566-3067)
AND SG-1112(V)2/U (NSN 6625-00-500-6525)
(HEWLETT-PACKARD MODEL 8640B, OPTIONS 001 AND 004)
REPORTING ERRORS AND RECOMMENDING IMPROVEMENTS
You can help improve this manual. If you find any mistakes or if you know of a way to improve the
procedures, please let us know. Mail your letter, DA Form 2028 (Recommended Changes to Publications and
Blank Forms), or
munications and Electronics Materiel Readiness Command and Fort Monmouth, ATTN: DRSEL-ME-MQ,
Fort Monmouth,
In either case, a reply will be furnished direct to you.
DA
Form 2028-2 located in the back of this manual, direct to: Commander, US Army Com-
NJ 07703.
This manual is an authentication of the manufacturer’s commercial literature which, through usage, has been found to
rover the data required to opersaate and maintain this equipment. The manual was not prepared in accordance with military
specifications; therefore, the format has not been structured to consider categories of maintenance.
i
Page 4

Model 8640B Option 004
Table of Contents
CONTENTS
Section
o
INTRODUCTION . . . . . . . . . . . . . . . . . . . 0-1
I
GENERAL INFORMATION . . . . . . . 1-1
Introduction . . . . . . . . . ...1-1
1-1.
1-6.
Specifications . . . . . . . . . . . . 1-1
1-8.
Instruments Covered by Manual . . . . . . 1-1
1-13.
General Description . . . . . . . . . . 1-2
Performance Characteristics . . . . . . . 1-2
1-19.
1-20.
1-26.
1-31.
1-37.
1-42.
1-45.
1-48.
1-51.
1-57.
1-61.
1-65.
1-69.
1-76.
1-82.
II
2-1.
2-3.
2-5.
2-6.
2-8.
2-11.
2-13.
2-15.
2-18.
2-20.
2-22.
2-23.
2-25.
III
3-1.
3-3.
3-5.
3-7.
3-9.
IV
4-1.
4-4.
4-6.
4-8.
4-12.
Spectral Purity . . . . . . . . . . 1-2
Frequency Counter . . . . . . . . . 1-3
Phase-Lock Mode . . . . . . . . . 1-3
Amplitude Modulation . . . . . . . . 1-4
Pulse Modulation . . . . . . . . . . 1-4
Frequency Modulation . . . . . . . . 1-4
Standard and Optional Audio Oscillators . . 1-5
Multi-Function Meter and Annunciators . . 1-5
Output Level . . .
Options . . . . . .
Accessories Supplied .
Equipment Available .
Service and User Aids .
Test Equipment Required
INSTALLATION . . .
Introduction . . . .
Initial Inspection . . .
Preparation for Use . .
Power Requirements
Line Voltage Selection
Power Cable . . .
Mating Connectors .
Operating Environment
Bench Operation . . .
Rack Mounting . . .
Storage and Shipment . .
Environment . . . .
Packaging . . . . .
OPERATION . . . . .
Introduction . . . . .
Panel Features . . . .
Operator’s Checks . . .
Operating Instructions . .
Operator’s Maintenance .
PERFORMANCE TESTS
Introduction . . . . .
Equipment Required . .
Test Record . . . . .
Test Procedures . . . .
Basic Functional Checks .
. .
. . . . . . . .
. . . . . . . .
. . . . . . . .
. . . . . . . .
. . . . . . . .
. . . . . . . .
. . . . . . . .
. . . . . . . .
. . . . . . . .
. . . . . . . .
. . . . . . . .
. . . . . . . .
. . . . . . . .
. . . . . . .
. . . . . . .
. . . . . . .
. . . . . . .
. . . . . . .
. . . . . . .
. . . . . .
. . . . . . .
. . . . . . .
. . . . . . .
. . . . . . .
. . . . . . .
.
. . . . . . .
. . . . . . .
. . . . . . .
. . . . . . .
. . . . . . .
. . . . . . .
Page
1-6
1-6
1-6
1-6
1-7
1-7
2-1
2-1
2-1
2-1
2-1
2-2
2-2
2-3
2-3
2-3
2-3
2-3
2-3
2-3
3-1
3-1
3-1
3-1
3-1
3-1
4-1
4-1
4-1
4-1
4-1
4-5
Section
IV PERFORMANCE TESTS (cont’d)
4-13. Frequency Range Test . . . . . . .
4-14. Frequency Accuracy and Fine Tune Test .
4-15. Frequency Stability Vs Time and
Restabilization Time Test . . . .
4-16. Frequency Stability Vs Temperature Test.
4-17. Frequency Stability Vs Line Voltage Test .
4-18. Frequency Stability Vs Load, Level, and
Mode Test . . . . . . . . . .
4-19. Harmonics Test . . . . . . . . .
4-20. Sub-Harmonics and Non-Harmonic
Spurious Test . . . . . . . .
4-21. Single Sideband Phase Noise Test . . .
4-22. Single Sideband Broadband Noise Floor
Test . . . . . . . . . . . .
4-23. Residual AM Test . . . . . . . .
4-24. Residual FM Test . . . . . . . .
4-25. Output Level Accuracy Test (abbreviated).
4-26. Output Level Accuracy Test (complete) .
4-27. Output Level Flatness Test . . . . .
4-28.
Output Impedance Test (Signal-Frequency) . 4-47
Output Impedance Test (Broadband) . . . 4-49
4-29.
4-30.
Auxiliary Output Test . . . . . . . . 4-50
4-31.
Output Leakage Test . . . . . . . . 4-51
4-32.
Internal Modulation Oscillator Test . . . . 4-53
4-33.
Internal Modulation Oscillator
Distortion Test (Option 001) . . . . . 4-55
4-34.
AM 3 dB Bandwidth Test . . . . . . . 4-56
4-35.
AM Distortion Test . . . . . . . . . 4-58
4-36.
AM Sensitivity and Accuracy Test . . . . 4-59
Peak Incidental Phase Modulation Test . . 4-62
4-37.
4-38.
Demodulated Output Accuracy Test . . . 4-65
4-39.
AM Phase Shift Test . . . . . . . . . 4-69
4-40.
AM Flatness Test . . . . . . . . . . 4-71
4-41.
Pulse Modulation Test . . . . . . . . 4-73
Pulse On/Off Ratio Test . . . . . . . 4-77
4-42.
4-43.
FM 3 dB Bandwidth Test . . . . . . . 4-78
4-44.
FM Distortion Test . . . . . . . . . 4-79
4-45.
FM Sensitivity and Accuracy Test . . . . 4-81
4-46.
Incidental AM Test . . . . . . . . . 4-85
4-47.
Counter External Sensitivity Test . . . . 4-87
4-48.
Internal Reference Accuracy Test . . . . 4-88
4-49.
Internal Reference Drift Rate (Stability)
Test . . . . . . . . . . . . .4-89
Phase Lock Restabilization Time Test . . . 4-92
4-50.
V
ADJUSTMENTS . . .
Introduction . . . .
5-1.
5-3.
Safety Considerations .
5-9. Test Equipment Required
5-11.
Posidriv Screwdrivers
.
. . . . . . .
. . . . . . .
. . . . . . .
. . . . . . .
. . . . . . .
Page
4-13
4-14
4-16
4-18
4-19
4-20
4-21
4-23
4-25
4-27
4-30
4-31
4-34
4-39
4-45
5-1
5-1
5-1
5-1
5-1
ii
Page 5

Table of Contents
Model 8640B Option 004
CONTENTS (cont'd)
Section
V
ADJUSTMENTS (cont'd)
5-13.
5-15.
5-19.
5-22.
5-25.
5-26.
Blade Tuning Tools . . . . . . .
Service Aids . . . . . . . . .
Factory Selected Components . . . .
Post-Repair Tests and Adjustments . . .
Power Supply Adjustments . . . . .
Fixed-Frequency Modulation Oscillator
Adjustment . . . . . . . . .
Variable Frequency Modulation Oscillator
5-27.
Adjustment (Option 001) . . . . .
Meter Adjustments . . . . . . . .
5-28.
RF Detector Offset Adjustment . . . .
5-29.
.
. .
. .
. .
. .
. .
. .
. .
. .
Page
5-1
5-1
5-2
5-3
5-8
5-8
5-9
5-12
5-13
5-30. Output Level Vernier and Meter Adjustment. . 5-14
5-31. Preliminary AM Adjustments . . . . . . 5-17
5-32. AM Accuracy Adjustment . . . . . . . . 5-19
5-33. Peak Deviation and Range Switch
Adjustment . . . . . . . . .
5-34.
Range Switch Adjustment . . . . . .
VT Pot (A3R1) Adjustment . . . . .
5-35.
VT Voltage Adjustment . . . . . .
5-36.
5-37.
RF Oscillator End Stop Adjustment . .
RF Oscillator Output Power Adjustment .
5-38.
5-39.
RF Filter Adjustment . . . . . . .
5-40.
preliminary FM Adjustments . . . . .
FM Linearity Adjustment . . . . . .
5-41.
5-42.
FM Linearity Adjustment (Alternate) . .
5-43.
FM Sensitivity Adjustment . . . . .
Internal Reference Frequency Adjustment
5-44.
VI
REPLACEABLE PARTS . . . . . . . .6-1
Introduction . . . . . . . . . ...6-1
6-1.
Exchange Assemblies . . . . . . . . . 6-1
6-3.
Abbreviations. . . . . . . . . . . .6-1
6-5.
Replaceable Parts List . . . . . . . . .6-1
6-7.
Ordering Information . . . . . . . . . 6-1
6-11.
Spare Parts Kit . . . . . . . . . .. 6-1
6-14.
6-16.
Illustrated Parts Breakdowns . . . . . . . 6-2
VII
MANUAL CHANGES . . . . . . . . .7-1
7-1.
Introduction . . . . . . . . . . ..7-1
7-3.
Manual Changes.. . . . . . . . ..7-1
7-6.
Manual Change Instructions . . . . . . . 7-4
7-7.
Instrument Improvement Modifications . . . 7-16
7-9.
Improved FM Bandwidth on 5 kHz Devia-
. .
. .
. .
. .
. .
. .
. .
. .
. .
. .
. .
. .
5-22
5-22
5-23
5-25
5-25
5-28
5-29
5-33
5-35
5-38
5-40
5-42
tion Range (Serial Number Prefixes
1323A and 1327A) . . . . . . . . .7-16
Section
7-11.
A10A2 RF Divider Assembly Improvement
(Serial Number Prefixes 1333A and Below).
7-13.
A18, A20, and A22 Power Supply Regulator Improvements (Serial Number Prefixes
1333A and Below) . . . . . . . .
7-15.
Al1 Variable Frequency Modulation
Oscillator Improvements (Serial Number
Prefixes 1339A and Below) . . . . .
7-18.
A12 Rectifier Assembly Input Crowbar
Failures (Serial Number Prefixes 1339A
and Below) . . . . . . . . . . .
7-20.
Reliability Improvements in AM and Pulse
Circuits (Serial Number Prefixes 1345A
and Below) . . . . . . . . . .
7-23.
All Variable Frequency Modulation
Oscillator (Option 001) Improvement
(Serial Number prefixes 1350A and
Below) . . . . . . . . . . .
7-26.
Improvement in Lock Acquisition Capability (Serial Number Prefixes 1350A
and Below). . . . . . . . . .
7-28.
+44.6V Regulator Improvement (Serial
Number Prefixes 1405A and Below) .
7-30.
Line Switch Modification (Serial Number
Prefixes 1406A and Below) . . . . .
7-33.
Reduction in Popcorn Noise on Power
Supplies (Serial Number Prefixes 1406A
and Below) . . . . . . . . . . .
7-35.
Recommended Fuse Replacement for
220/240V Operation (Serial Number
Prefixes 1423A and Below) . . . . .
SERVICE . . . . . . . . . . . .
VIII
Introduction : . . . . . .
8-1.
Principles of Operation . . . .
8-5.
Troubleshooting . . . . . .
8-8.
Recommended Test Equipment .
8-12.
Service Aids . . . . . . .
8-14.
Repair . . . . . . . . .
8-23.
8-24.
8-26.
8-28.
8-30.
8-37.
8-39.
8-40.
8-53.
8-60.
8-68.
Factory Selected Components
Etched Circuits . . . . .
Etched Conductor Repair . .
Component Replacement . .
Illustrated Parts Breakdowns .
Basic Circuit Theory . . . .
Binary Circuits and Symbols .
Binary Registers . . . . .
Decade Counters and Symbols
Linear Integrated circuits .
. . . .
. . . .
. . . .
. . . .
. . . .
. . . .
. . . .
. . . .
. . . .
. . . .
. . . .
. . . .
. . . .
. . . .
. . . .
. . . .
Page
7-16
7-16
7-16
7-16
7-16
7-16
7-17
7-17
7-17
7-18
7-18
8-1
8-1
8-1
8-1
8-1
8-1
8-3
8-3
8-3
8-3
8-3
8-5
8-5
8-5
8-8
8-9
8-11
iii
Page 6

Model 8640B Option 004
Service Sheet
Overall Block Diagram . . . . . .
1
FM Circuits and RF Oscillator
2
Troubleshooting . . . . . . .
AM/AGC Circuits and Output Amplifier
3
Troubleshooting . . . . . . .
Counter/Lock Circuits Troubleshooting
4
RF Oscillator (A3) . . . . . . .
5
FM Amplifiers (A3, A5, A9, A13) . .
6
FM Shaping Circuits and Phase Lock
7
Loop Filter (A7, A9) . . . . .
Over-Deviation Detector and Meter
8
Control Circuits (A6, A7, A9) . .
Fixed-Frequency Modulation Oscillator
9
(A1l, A13) . . . . . . . .
9A
Variable-Frequency Modulation
Oscillator for Option 001
(A1l, A13) . . . . . . . .
RF Filters (A10A1) . . . . . . .
10
RF Dividers (A10A2) . . . . . .
11
AGC Amplifiers and Amplitude
12
Modulator
(A26, A26A3, A26A4) . . . . .
RF Amplifier, Pulse Switching, and
13
Step Attenuators (A1A1, A19A1,
A26, A26A1, A26A2) . . .
AM Preamplifier (A13, A26A2) .
14
. .
. .
. .
. .
. .
. .
. .
. .
. .
. .
. .
. .
. .
. . . .
. . . .
SERVICE SHEETS
Page
8-18
8-20
8-22
8-24
8-26
8-28
8-30
8-32
8-34
8-36
8-38
8-40
8-42
8-44
8-46
Service Sheet
15
16
17
18
19
20
21
22
23
24
25
A
B
C
D
E
F
G
H
Table of Contents
Page
AM Interconnections, RF ON/OFF Switch
and Demodulation Amplifier
(A9, A26A8) . . . . . . . . . . 8-48
RF Vernier (A19A1, A26) . . . . . . . 8-50
Meter Circuits (A2, A4, A6) . . . . . . 8-52
Counter RF Scaler (A8A1, A8A3) . . . . 8-54
Counter Time Base (A8A3, A9) . . . . . 8-56
Up/Down Counter & Display (A8A2, A8A4) . 8-58
Counter Phase Lock Circuits (A8A2) . . . 8-60
Power Supply Circuits
(A12, A14, A20, A22) . . . . . . . 8-62
–5.2V Regulator and Fan Circuits
(A16, A18). . . . . . . . . . . 8-64
Power Supply Mother Board (A17) . . . . 8-67
Modulation/Metering Mother Board (A13) . 8-68
Al and A19 Assemblies Removal
8-70
and Disassembly . . . . . . .
A3 Assembly Removal and Disassembly
A8 Assembly Removal and Disassembly
A9 and All Assemblies Removal
and Disassembly . . . . . . .
Al0 Assembly Removal and Disassembly
A26 Assembly Removal and Disassembly
General Removal Procedures and
Top Internal Views . . . . . .
Rear Panel and Bottom Internal Views
. .
. .
. .
. .
. .
. .
. .
. .
8-72
8-74
8-76
8-78
8-80
8-82
8-85
Table
1-1.
Specifications . . . . . . .
Recommended Test Equipment .
1-2.
Recommended Test Accessories .
1-3.
Recommended Test Abridgements
4-1.
Recommended Test Equipment
4-2.
(Basic Functional Checks) . .
Record of Basic Functional Checks
4-3.
Performance Test Record . . .
4-4.
Factory Selected Components .
5-1.
Post-Repair Test and Adjustments
5-2.
RF Filter Check . . . . . .
5-3.
Part Numbers for Exchange Assemblies . . . 6-2
6-1.
Reference Designations and
6-2.
Abbreviations . . . . . . . . . . . 6-3
Replaceable Parts . . . . . . . . . . 6-5
6-3.
6-5. Part Number-National Stock Number
Cross Reference Index. . . .
A. References . . . . . . . .. A-l
B. Components of END Item List . B-1
. . . . .
. . . . .
. . . . .
. . . . .
. . . . .
. . . . .
. . . . .
. . . . .
. . . . .
. . . . .
TABLES
Page
1-8
1-14
1-19
4-2
4-5
4-11
4-94
5-3
5-4
5-32 8-7.
6-45
APPENDIXES
Table
6-4.
7-1.
7-2.
8-1.
8-2.
8-3.
8-4.
8-5.
8-6.
8-8.
8-9.
C.
D.
Code List of Manufacturers . . .
Manual Changes by Serial Number .
Summary of Changes by Component
Etched Circuit Soldering Equipment
Logic Levels . . . . . . . .
Assembly Information Index . . .
Schematic Diagram Notes . . . .
Meter Drive Amplifier Data . . .
Total Count of Time Base Reference
Counters U13, U14, and U15 .
Count Modes of Counters A8A3U13
and U14 . . . . . . . .
Count Modes of Counter A8A3U15
Data Inputs of Decimal Point
Shift Register . . . . . . .
Additional Authorization
Maintenance Allocation .
. .
6-45
. .
. .
. .
. .
.
8-14
8-15
..
. .
8-52
. .
8-56
. .
8-56
. .
8-56
. .
8-56
List N.A.
D-1
iv
Page
7-1
7-2
8-4
8-6
Page 7

Table of contents
Model 8640B Option 004
ILLUSTRATIONS
1-1.
HP Model 8640B Option 004 Signal Generator
(Option 001) and Accessories Supplied 1-0
Measured Single Sideband Noise vs Offset
1-2.
from Carrier . . . . . . . . .. 1-2
1-3.
Specified Signal-to-Phase Noise Ratio . . .
1-4.
AM Distortion vs AM Rate . . . . . . 1-4
1-5.
Pulsed RF . . . . . . . . . . . .1-5
1-6.
FM Distortion vs FM Rate . . . . . . . 1-5
1-7.
520/1040 MHz Notch Filter . . . . . . 1-20
1-8.
FM Linearity Circuit . . . . . . . . 1-20
1-9.
Noise Phase Lock Circuit . . . . . . . 1-21
2-1.
Line Selector . . . . . . . . . . . 2-1
Power Cables Available , . . . . . . . 2-2
2-2.
2-3.
Preparation for Rack Mounting . . . . . 2-4
3-1.
Lamp Replacement . . . . . . . . . 3-1
Front Panel Controls, Indicators, and
3-2.
connectors . . . . . . . . . .. 3-2
Internal AC/DC Switch , . . . . . . . 3-6
3-3.
3-4.
Rear Panel Controls and Connectors . . . 3-7
Operator's Checks . . . . . . . . . 3-8
3-5.
Setting the Frequency and Amplitude
3-6.
Controls . . . . . . . . . .. 3-13
3-7..
Setting the Modulation Controls. . . . . 3-16
4-1.
Frequency Stability vs Time and Restabiliza-
tion Time Test Setup . . . . . . . 4-16
Frequency Stability vs Temperature
4-2.
Test Setup . . . . . . . . . . .4-18
Frequency Stability vs Line Voltage
4-3.
Test setup . . . . . . . . . . .4-19
Frequency Stability vs Load, Level, and
4-4.
Mode Test Setup. . . . . . . . . 4-20
SubHamonics and Non-Harmonic
4-5.
Spurious Test Setip . . . . 4-24
Single sideband Phase Noise Test Setup . . 4-25
4-6.
Single sideband Broadband Noise
4-7.
Floor Test Setup . . . . . . . . . 4-28
4-8.
Residual AM Test Setup . . . . . . . 4-30
4-9.
Residual FM Test Setup . . . . . . . 4-32
4-10.
Output Level Accuracy Test Setup
(Abbreviated) . . . . . . . . . . 4-34
4-11.
Output Level Accuracy Test Setup
(Complete). . . . . . , . . . . 4-41
Output Level Flatness Test Setup . . . . 4-45
4-12.
4-13.
Output Impedance Test Setup
(Signal Frequency) . . . . . . . . 4-47
4-14.
Output Impedance Test (Broadband) . . . 4-49
Output Leakage Test Setup . . . . . . 4-52
4-15.
4-16.
Internal Modulation Oscillator Test
setup . . . . . . . . . . . . 4-54
v
1-3
Figure
Page
4-17. Internal Modulation Oscillator Distortion
Test Setup . . . . . . . . . . .4-55
4-18. AM 3 dB Bandwidth Test Setup . . . . . 4-56
4-19. AM Distortion Test Setup . . . . . . . 4-58
4-20. AM Sensitivity and Accuracy Test Setup . . 4-60
4-21. Peak Incidental Phase Modulation
Test Setup . . . . . . . . . . .4-63
4-22. Demodulated Output Accuracy Test
Setup . . . . . . . . . . . .4-65
4-23. AM Phase Shift Test Setup . . . . . . 4-69
4-24. Lissajous Display . . . . . . . . . . 4-70
4-25. AM Flatness Test Setup . . . . . . . 4-72
4-26. Pulse Modulation Test Setup . . . . . . 4-74
4-27. Pulse Measurements . . . . . . . . . 4-75
4-28. FM 3 dB Bandwidth Test Setup . . . . . 4-78
4-29. FM Distortion Test Setup . . . . . . . 4-80
4-30. FM Sensitivity and Accuracy Test Setup . . 4-82
4-31. Incidental AM Test Setup . . . . . . . 4-85
4-32. Counter External Sensitivity Test Setup . . 4-87
4-33. Internal Reference Accuracy Test Setup . . 4-88
4-34. Internal Reference Drift Rate (Stability)
Test Setup . . . . . . . . . . .4-90
5-1.
RF Detector Offset Adjustment Test
Setup . . . . . . . . . . . .
5-2.
Output Level Vernier and Meter Adjustment
Test Setup . . . . . . . . . . .
5-3.
Preliminary AM Adjustments . . . . . .
5-4.
AM Accuracy Adjustment Test Setup . . .
VT Pot Adjustment . . . . . . . . .
5-5.
5-6.
Location of RF Oscillator Stop Adjustments.
5-13
5-15
5-17
5-19
5-24
Shown in Maximum ccw Position. Top
View with Instrument Upside Down . .
5-7.
RF Oscillator Output Power Adjustment
Test Setup . . . . . . . . . . .
5-8.
Filter Terminology . . . . . . . . .
5-9.
RF Filter Adjustment Test Setup . . . .
5-26
5-28
5-29
5-30
5-10.256-512 MHz High Band Capacitor
Adjustment Orientation . . . . . . 5-33
5-11. FM Linearity Adjustment Test Setup . . . 5-36
5-12. FM Linearity Display . . . . . . . . 5-38
5-13. FM Linearity Adjustment (Alternate)
Test Setup . . . . . . . . . . .5-39
5-14. FM Sensitivity Adjustment Test Setup . . . 5-41
5-15. Internal Reference Frequency Adjustment
Test Setup . . . . . . . . . . .5-42
6-1.
Cabinet Parts . . . . . . . . . .. 6-43
Type “N” Connector . . . . . . . . 6-44
6-2.
Page 8

Model 8640B Option 004
Table of Contents
ILLUSTRATIONS (cont'd)
Figure
A26A2 AM Offset and Pulse Switching Assembly
7-1.
Backdating (Change C) . . . . . . . . 7-6
A12 Rectifier Assembly Component Locations
7-2.
Backdating (Change C) . . . . . . . . 7-7
A12 Rectifier Assembly Backdating
7-3.
(Change) . . . . . . . . . . . . 7-7
A3A4 Connector Board Assembly
7-4.
Backdating (Change G) . . . . . . . . 7-9
A8A1 RF Scaler Assembly Component
7-5.
Locations Backdating (Change H) . . . . 7-10
A22 +20V and -20V Regulator Assembly
7-6.
Component Locations Backdating
(Change I) . . . . . . . . . . . .7-12
7-7.
Power Supply Circuits Backdating
(Change I) . . . . . . . . . . . . 7-13
7-8.
A22 +20V and -20V Regulator Assembly
Backdating (Change I) . . . . . . . . 7-14
Modified Line Switch Wiring . . . . . . . 7-18
7-9.
Signal Generator with Circuit Boards on
8-1.
Extenders . . . . . . . . . . . .8-2
Examples of Diode and Transistor
8-2.
Marking Methods . . . . . . . . . . 8-4
Open Collector Output Stage (AND Gate) . . 8-6
8-3.
Binary Symbols . . . . . . . . . . . 8-6
8-4.
Triggered Flip-Flop . . . . . . . . . . 8-7
8-5.
D Flip-Flop . . . . . . . . . . .. 8-7
8-6.
Schmitt Trigger . . . . . . . . . . . 8-7
8-7.
J/K Flip-Flop. . . . . . . . . . . . 8-8
8-8.
Multiple Input J/K Flip-Flop . . . . . . . 8-8
8-9.
8-10.
Binary Latch . . . . . . . . . ...8-9
Binary Shift Register . . . . . . . . . 8-9
8-11.
8-12.
Basic Decade Counter (Scaler) . . . . . . 8-9
8-13.
Programmable Counter . . . . . . . . . 8-10
8-14.
Programmable Up/Down Counter . . . . . 8-12
Operational Amplifier . . . . . . . . . 8-13
8-15.
8-16.
Comparator . . . . . . . . . ...8-14
8-17.
Simplified Block Diagram . . . . . . . . 8-19
Overall Block Diagram . . . . . . . . . 8-19
8-18.
FM Circuits and RF Oscillator Block
8-19.
Diagram . . . . . . . . . . . ..8-21
AM/AGC Circuits and Output Amplifier
8-20.
Block Diagram . . . . . . . . . . 8-23
Counter/Lock Circuits Block Diagram . . . . 8-25
8-21.
P/O A3A4 Connector Board Assembly
8-22.
Component Locations . . . . . . . . 8-27
RF Oscillator Simplified Diagram . . . . . 8-27
8-23.
P/O A3A4 Connector Board Assembly
8-24.
Component Locations . . . . . . . . 8-28
P/O A9 Peak Deviation and Range Switch
8-25.
Assembly Component Locations. . . . . 8-28
Page
Figure
8-26. A5 FM Amplifier Assembly Component
Locations . . . . . . . . . .. 8-29
8-27. FM Amplifiers Schematic Diagram . . . . 8-29
8-28. P/O A7 FM Shaping Assembly
Component Locations . . . . . . 8-31
8-29. FM Shaping Circuits and Phase Lock Loop
Filter Schematic Diagram . . . . . 8-31
8-30. P/O A6 Annunciator Assembly
Component Locations . . . . . . 8-32
8-31. P/O A9 Peak Deviation and Range Switch
Assembly Component Locations. . 8-32
8-32. P/O A7 FM Shaping Assembly
Component Locations . . . . . . 8-33
8-33. Over-Deviation Detector and Meter Control
Circuits Schematic Diagram . . . . . 8-33
8-34. All Fixed-Frequency Modulation Oscillator
Component Locations . . . . . . 8-35
8-35. Fixed-Frequency Modulation Oscillator
Schematic Diagram . . . . . 8-35
8-36. All Variable-Frequency Modulation
Oscillator Assembly (Option 001 )
Component Locations . . . . . . . 8-37
8-37. Variable-Frequency Modulation Oscillator
(Option 001) Schematic Diagram . . . 8-37
8-38. Action of RANGE Switch . . . . . . . 8-38
8-39. A10A1 RF Filter Assembly Component
Locations . . . . . . . . . .. 8-38
8-40. RF Filters Schematic Diagram . . . . . 8-39
8-41. Simplified Logic Diagram of the Filter
Divider Assembly . . . . . . . 8-40
8-42. A10A2 RF Divider Assembly Component
Locations . . . . . . . . . .. 8-41
8-43. RF Dividers Schematic Diagram . . . . . 8-41
8-44. A26A3 Modulator Assembly Component
Locations . . . . . . . . . .. 8-43
8-45. A26A4 AGC Amplifier Assembly
Component Locations . . . . . . 8-43
8-46. AGC Amplifiers and Amplitude Modulator
Schematic Diagram . . . . . . . . 8-43
8-47. A26A1 Power Amplifier and AGC Detector
Assembly Component Locations. . . . 8-45
8-48. P/O A26A2 AM Offset and Pulse Switching
Assembly Component Locations. . . . 8-45
8-49. RF Amplifier, Pulse Switching, and Step
Attenuator Schematic Diagram . . . . 8-45
8-50. P/O A26A2 AM Offset and Pulse Switching
Assembly Component Locations. . . . 8-47
8-51. AM Preamplifier Schematic Diagram . . . 8-47
8-52. A26A8 Demodulation Amplifier
Assembly Component Locations. . . . 8-49
Page
vi
Page 9

Table of Contents Model 8640B Option 004
ILLUSTRATIONS (cont'd)
Figure
Page
8-53. AM Interconnections, RF ON/OFF Switch
and Demodulation Amplifier
Schematic Diagram . . . . . . . 8-49
8-54. A19A2 RF Vernier Assebly
component Locations . . . . . . 8-51
8-55. RF Vernier Schematic Diagram . . . . . 8-51
8-56. A2 Meter Switch/Detector Assembly
Component Locations . . . . . . . 8-52
8-57. A4 Metir/Annunciator Drive Assembly
Component Locations . . . . . . . 8-53
8-58. P/0 A6 Annunciator Assembly
Component Locations . . . . . . . 8-53
8-59. Meter Circuits Schematic Diagram . . . . 8-53
8-60. A8A1 RF Scaler Assembly
Component locations . . . . . . . 8-55
8-61. P/O A8A3 Time Base Assembly
Component Locations . . . . . . . 8-55
8-62. Counter RF Scaler Schematic Diagram . . 8-55
8-63. P/O A8A3 Time Base Assembly
Component Locations . . . . . . . 8-57
8-64. Counter Time Base Schematic Diagram . . 8-57
8-65. A8A4 Counter Display Assembly
Component locations (P/O A8) . . . . 8-59
8-66. P/O A8A2 Counter/Lock Board
Assembly Component Locations . . . 8-59
8-67. Up/Down Counter and Display
Schematic Diagram . . . . . . . . 8-59
8-68. P/O A8A2 Counter/Lock Board
Assembiy Component Locations . . . 8-61
8-69. Counter Phase Lock Circuits
Schematie Diagram . . . . . . . . 8-61
8-70. Current Foldback . . . . . . . . . 8-62
8-71. A12 Rectifier Assembly
Component Locations . . . . . . . 8-62
8-72. A20 +5.2V and +44.6V Regulator Assembly
Component Locations . . . . . . . 8-63
Figure
Page
8-73. A22 +20V and -20V Regulator Assembly
Component Locations . . . . . . . 8-63
8-74. Power Supply Circuits
Schematic Diagram . . . . . . . . 8-63
8-75. A18 -5.2V Regulator and Fan Driver
Assembly Component Locations. . . . 8-65
8-76. -5.2V Regulator and Fan Circuits
Schematic Diagram . . . . . . . . 8-65
8-77. A17 Power Supply Mother Board Assembly
Component Locations . . . . . . . 8-67
8-78. Power Supply Mother Board
Schematic Diagram . . . . . . . . 8-67
8-79. A13 Modulation/Metering Mother Board
Assembly Component Locations. . . . 8-68
8-80. Modulation/Metering Mother Board
Schematic Diagram . . . . . . . . 8-69
8-81. Al and A19 Output Level Assemblies
Illustrated Parts Breakdown . . . . . 8-71
8-82. RF Oscillator Transistor Preparation . . . 8-72
8-83. RF Oscillator Transistor Orientation . . . 8-72
8-84. A3 RF Oscillator Illustrated
Parts Breakdown . . . . . . . . . 8-73
8-85. A8 Counter/Lock Assembly Illustrated
Parts Breakdown . . . . . . . . . 8-75
8-87. All Variable-Frequency Modulation
Oscillator (Option 001)
Illustrated Parts Breakdown . . . . . 8-77
8-88. Al0 Divider/Filter Assembly
Illustrated Parts Breakdown . . . . . 8-79
8-89. A26 AM/AGC and RF Amplifier
Illustrated Parts Breakdown . . . . . 8-81
8-90. Top Internal Views
(Option 001 Shown) . . . . . . . 8-83
8-91. Rear Panel Views . . . . . . . . . . 8-85
8-92. Bottom Internal Views
(Option 001 Shown) . . . . . . . 8-85
vii
Page 10

Model 8640B Option 004
To avoid the possibility of injury or death, the
following precautions must be followed before the
instrument is switched on:
If this instrument is to be energized via an
a.
autotransformer for voltage reduction, make sure
that the common terminal is connected to the
earthed pole of the power source.
The power cable plug shall only be
b.
inserted into a socket outlet provided with a
protective earth contact. The protective action
must not be negated by the use of an extension
cord without a protective conductor (grounding).
c.
Before switching on the instrument, the
protective earth terminal of the instrument must
be connected to a protective conductor of the
power cord. This is accomplished by ensuring that
the instrument’s internal earth terminal is correctly
connected to the instrument’s chassis and that the
power
Sheet 22).
Whenever it is likely that the protection has been
impaired, the instrument must be made inoperative
and be secured against any unintended operation.
Any interruption of the protective (grounding)
conductor inside or outside the instrument or
disconnection of the protective earth terminal is
likely to make the instrument dangerous. Intentional interruption is prohibited.
HIGH VOLTAGE
Any adjustment, maintenance, and repair of the
opened instrument under voltage should be
avoided as much as possible and, if inevitable,
should be carried out only by a skilled person who
is aware of the hazard involved.
cord is wired correctly (see Service
Cautions/Warnings
GROUNDING
Any interruption of the protective (grounding)
conductor inside or outside the instrument is likely
to cause damage to the instrument. To avoid
damage, this instrument and all line powered
devices connected to it must be connected to the
same earth ground (see Section II).
LINE VOLTAGE
Be sure to select the correct fuse rating for the
selected line voltage (see
SELECTION in Section II); fuse ratings are listed
on the fuse compartment.
To prevent damage to the instrument, make the
line voltage selection BEFORE connecting the line
power. Also ensure that the line power cord is
connected to a line power socket that is provided
with a protective earth contact.
SAFETY
To avoid the possibility of damage to test equip-
ment, read completely through each test before
starting it. Make any preliminary control settings
necessary for correct test equipment operation.
COUNTER INPUT
Do not apply a dc
COUNTER INPUT.
SEMI-RIGID COAX
While working with
coaxial cables-in the generator, do NOT bend the
cables more than necessary. Do NOT torque the
RF connectors to more than 2 INCH-POUNDS.
voltage or >+15 dBm to
and around the semi-rigid
LINE VOLTAGE
Capacitors inside the instrument may still be
charged even if the instrument has been disconnected from its source of supply.
FUSES
Make sure that only fuses with the required rated
current and of the specified type (normal blow,
time delay, etc.) are used for replacement. The use
of repaired fuses and the short-circuiting of fuseholders must be avoided.
viii
Page 11

SECTION O
TM 11-6625-2780-14&P
0-1.Scope
This manual describes Signal Generators SG-1112(V)1/U and SG-1112(v)2/U and provides instructions for
operation and maintenance. Throughout this manual, the
SG-1112(v)1/U is referred to as Model 8640B Option
004 and the SG-ll12(v)/U is referred to as Model
8640B Optin 001. A Manufacturer's Part Number to
National Stock Number Coss Reference Index for the
SG-1112(v)1/U and the SG-ll12(V)2/U is given in
Section VI of this manual.
0-2. Indexes of Publications
a. DA Pam 310-4.
Refer to the latest issue of DA Pam
310-4 to determine whether there are new editions,
changes, or additional publications pertaining to the
equipment.
b. DA Pam .310- 7.
Refer to DA Pam 310-7 to deter-
mine whether there are modification work orders
(MWO's)pertaining to the equipment.
0-3. Maintenance Forms, Records, and Re-
ports
a. Reports of Maintenance and Unsatisfactory Equip-
ment. Department of the Army forms and procedures
used for equipment maintenance will be those described
by TM 38-750, The Army Maintenance Management
System.
b. Report of Packaging and Handling Deficiencies.
Fill
out and forward Standard Form 364 (Report of Dis-
crepancy (ROD)) as prescribed in AR 735-1l-2/NAVSUPINST 4440.127E/AFR 400-54/MCO 4430.3E
and DLAR 4140.55.
c. Discrepancy in Shipment Report (DISREP) (SF
361).
Fill out and forward Discrepancy in Shipment Report (DISREP) (SF 361) as prescribed in AR 55-38/NAVSUPINST 4610.33B/AFR 75-18/MCO
P4610.19C, and DLAR 4500.15.
0-4. Reporting Equipment Improvement
Recommendations (EIR)
If your equipment needs improvement, let us know, Send
us an EIR. You, the user, are the only one who can tell us
what you don’t like about your equipment. Let us know
what you don’t like about the design. Tell us why a
procedure is hard to perform. Put it on an SF 368 (Quality
Deficiency Report). Mail it to Commander, US Army
Communications and Electronics Materiel Redness
Command and Fort Monmouth, ATTN: DRSEL-MEMQ, Fort Monmouth, NJ 07703. We’ll send you a reply.
0-5. Administrative Storage
Administrative storage of equipment issued to and used
by Army activities shall be in accordance with paragraph
2-22.
0-6. Destruction of Army Electronics
Materiel
Destruction of Army electronics materiel to prevent
enemy use shall be in accordance with TM 750-244-2.
0-1
Page 12
General Information
Model 8640B Option 004
MODEL 8640B OPTION 004
RACK MOUNTING KIT
DEMO CAL LABELS
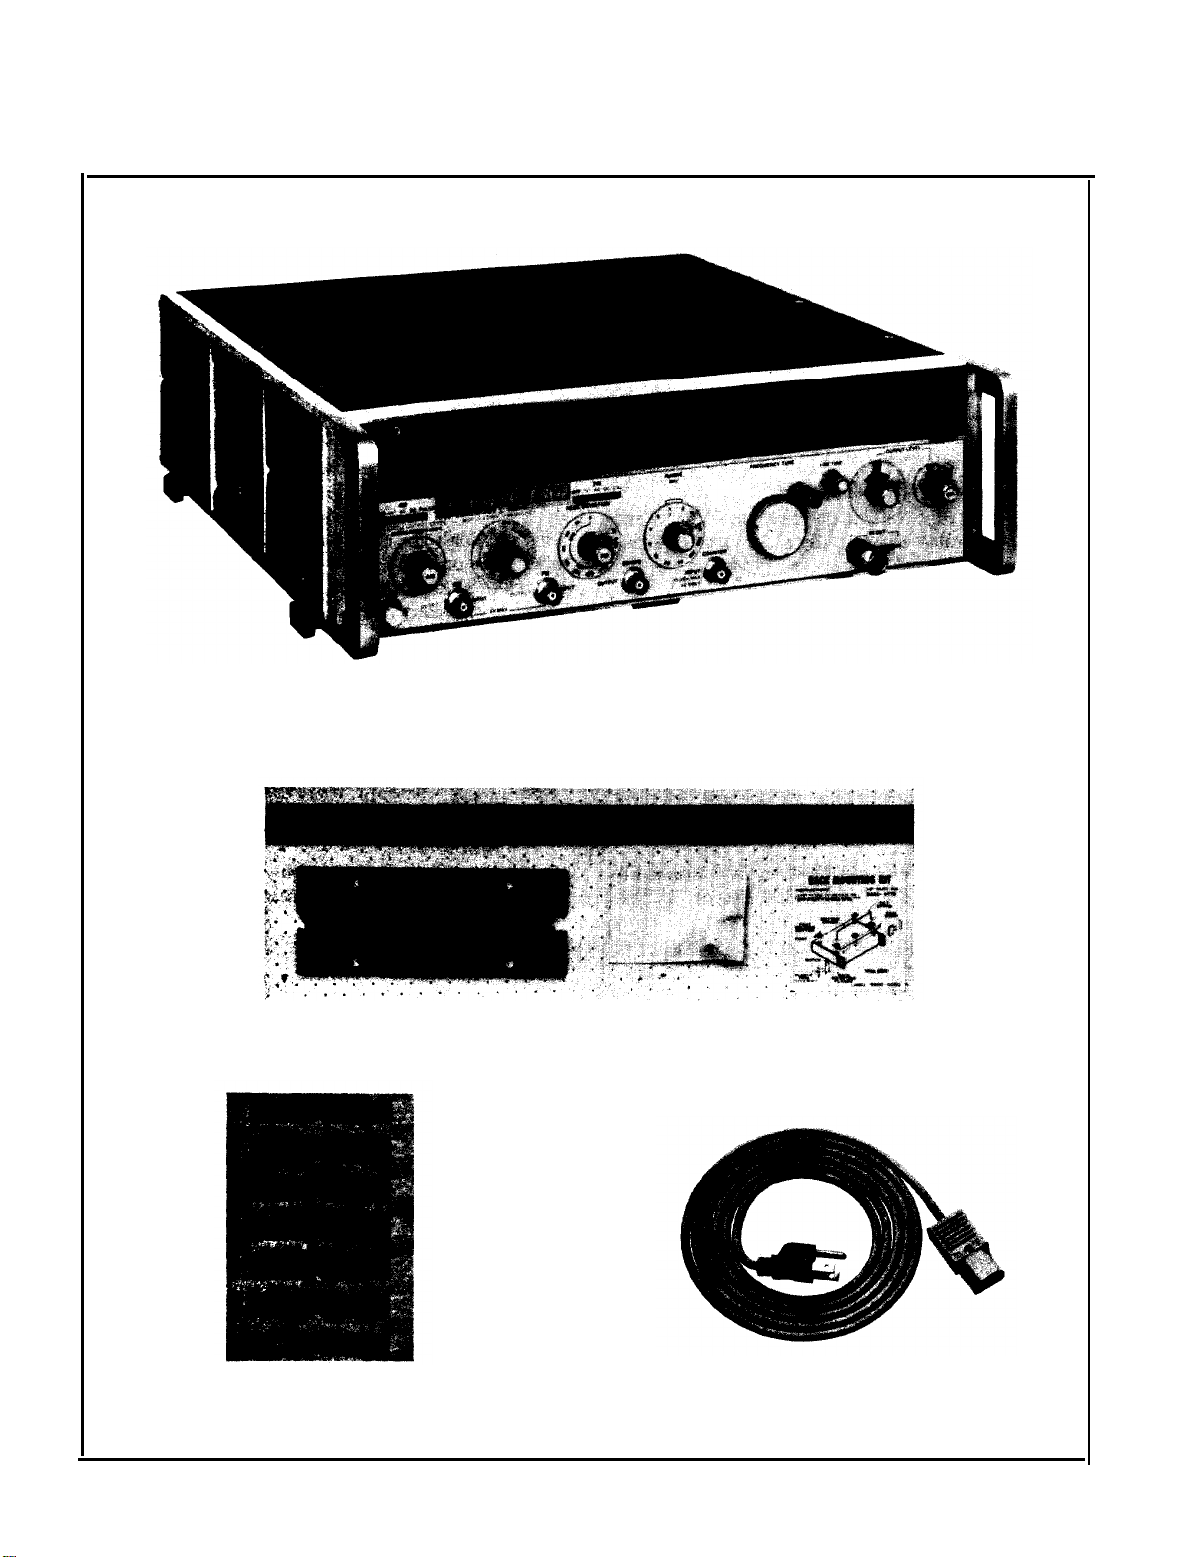
Figure 1-1. HP Model 8640B Option 004 Signal Generator (Option 001) and Accessories Supplied
1-0
LINE POWER CABLE
Page 13

Model 8640B Option 004
General Information
SECTION I
GENERAL INFORMATION
1-1. INTRODUCTION
1-2. This manual contains operating and service
information for the Hewlett-Packard Model 8640B
Option 004 Signal Generator. The Signal Generator
(with variable frequency modulation oscillator
Option 001) is shown in Figure 1-1 with all of its
externally supplied accessories.
1-3. This section of the manual describes the
instruments documented by this manual and covers
instrument description, options, accessories, specifications and other basic information. The other
sections provide the following:
Section II, Installation:
information about initial
inspection, preparation for use, and storage and
shipment.
Section III, Operation:
information about panel
features, and provides operating checks, instructions, and maintenance information.
Section IV, Performance Tests:
information required to check basic instrument functions and to
verify that the instrument is performing as specified in Table 1-1.
Section V, Adjustments:
information required to
properly adjust and align the instrument.
1-5. Deleted.
1-6. SPECIFICATIONS
1-7. Instrument specifications are listed in Table
1-1. These specifications are the performance
standards or limits against which the instrument
can be tested. Paragraph 1-19 lists some supple-
mental performance characteristics. Supplemental
characteristics are not specifications but are typical
characteristics included as additional information
for the user.
1-8. INSTRUMENTS COVERED BY MANUAL
1-9.
This instrument has a two-part serial number.
The first four digits and the letter comprise the
serial number prefix which defines the instrument
configuration. The last five digits form the sequential suffix that is unique to each instrument. The
contents of this manual apply directly to instruments having the serial prefixes 1435A and
1438A.
Section VI, Replaceable Parts:
ordering informa-
tion for all replaceable parts and assemblies.
Section VII, Manual Changes:
information to revise this manual to document earlier configurations
of the instrument and information suggesting instrument modifications.
Section VIII, Service:
information required to re-
pair the instrument.
1-4. Deleted.
1-10. An instrument manufactured after the print-
ing of this manual may have a serial prefix that is
different from that indicated above. If
80, refer to Section VII and make the
applicable manual changes.
1.11.
1-1
Page 14
General Information
1-12. For information concerning a serial number
prefix not covered in this manual,
contact your nearest Hewlett-
Packard office.
1-13. GENERAL DESCRIPTION
1-14. The Model 8640B Option 004 Signal Generator is an adaptation of the Model 8640B specifically designed for testing ILS, VOR, and UHF
communications receivers used in aviation as well
as general Purpose HF, VHF and UHF receivers.
The Signal Generator covers the frequency range
500 kHz to 512 MHz (450 kHz to 550 MHz with
band over-range)
and can be extended to
1100 MHz with an external doubler. An optional
variable audio oscillator is also available to extend
the CW output range of the generator down to
20 Hz.
Model 8640B Option 004
1-18. Other significant features are extremely low
noise, built in phase lock and counter, and front
panel controls designed
for operating convenience
and flexibility.
1-19.
PERFORMANCE
1-20.
Spectral Purity
1-21.
The basic frequency source of the
CHARACTERISTICS
Signal
Generator is a mechanically-tuned high-Q cavity
oscillator that operates over the frequency range
230-550 MHz. This oscillator has an inherent
stability of better than 10 ppm/10 min and exceptionally low noise characteristics. The lower 9
frequency ranges are obtained by dividing the basic
oscillator frequency and filtering the unwanted
harmonics. Using this technique, sub-harmonic and
non harmonic-spurious signals are virtually eliminated. A band overlap of 7% to 10% adds conven-
ience when operating near the nominal band edges.
1-15. This solid-state generator has an output level
range of +15 to -142 dBm (1.3V to 0.018 µV) that
is calibrated and metered. The output is leveled to
within ±0.5 dB from 108 to 336 MHz and within
±0.75 dB across the full frequency range of the
instrument.
1-16. The generator also provides AM, FM and
pulse modulation for a wide range of receiver test
applications. AM and FM can be performed
independently or simultaneously in either the
internal or external modes. This modulation is
calibrated and metered for direct readout under all
operating conditions. External pulse modulation is
also available.
1-17. For avionics testing (VOR/ILS), an external
audio generator’ is required to provide the com-
posite modulation.
When used with a suitable
external audio generator the Option 004 has flat
AM response and minimum phase shift from 30 Hz
to 10 kHz as well as constant group delay between
9 kHz and 11 kHz for accurate VOR and ILS
testing. A front panel jack also provides a very
accurate demodulated audio signal (AC/DC
0-1 Vrms or AC only 0-5 Vrms) for precise AM
settings.
1
e.g., Bendix RVG 33A — VOR Audio Generator
Collins 479S-4A
Tel-Instrument
Corporation T-20A — VOR/ILS Audio Signal Generator
RIG 32A
— ILS Audio Generator
— ILS Audio Signal Generator
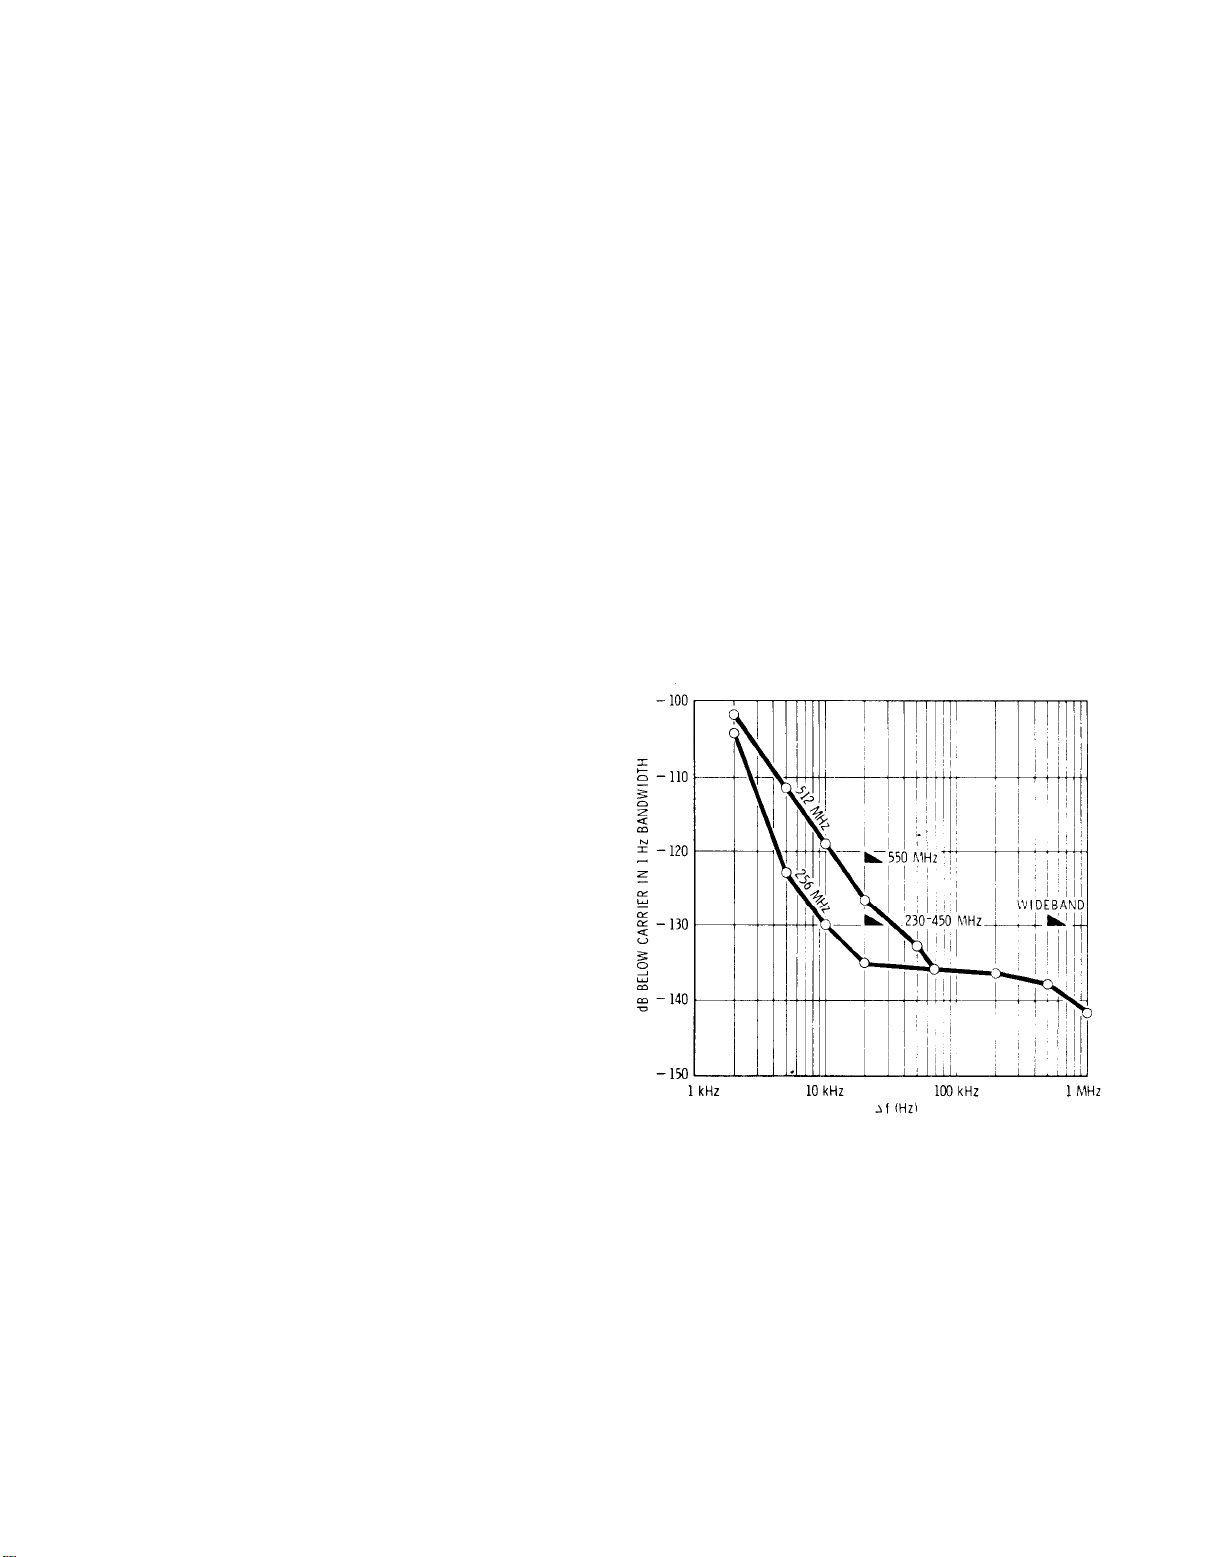
Figure 1-2. Measured Single Sideband Noise vs
Offset from Carrier. (Stated in a 1 Hz Bandwidth
at 256 and 512 MHz Carrier Frequencies on
256-512 MHz Band. ) Markers indicate specified
limits.
1-22. Frequency within a band is selected with a
FREQUENCY TUNE control of approximately 8
turns (see Figure 3-2) for fast selection of the
desired output frequency. A mechanical FINE
TUNE control has a tuning range of 1000 ppm for
precision frequency setting.
1-2
Page 15
Model 8640B Option 004
General Information
1-23. Restabilization time is short when tuning the
frequency across any one band. The total frequency excursion after any frequency change is
typically <20 ppm and within 15 minutes the
output has restabilized to the specified
10 ppm/10 min. When not phase locked, no restabilization time is required when switching frequency
binds for a fixed position cm the frequency tune
control.
1-24. Noise performance of the generator is excellent. The high-Q cavity oscillator has been
optimized with use of a low noise microwave
transistor for a spectrally pure output signal.
Figure 1-2 shows the typical measured single-sideband noise performance in a 1 Hz bandwidth for
various offsets from a (256 and 512 MHz) carrier.
The low close-in noise characteristic is ideally
suited for the stringent adjacent channel tests that
are commonly made on a wide variety of
communication receivers.
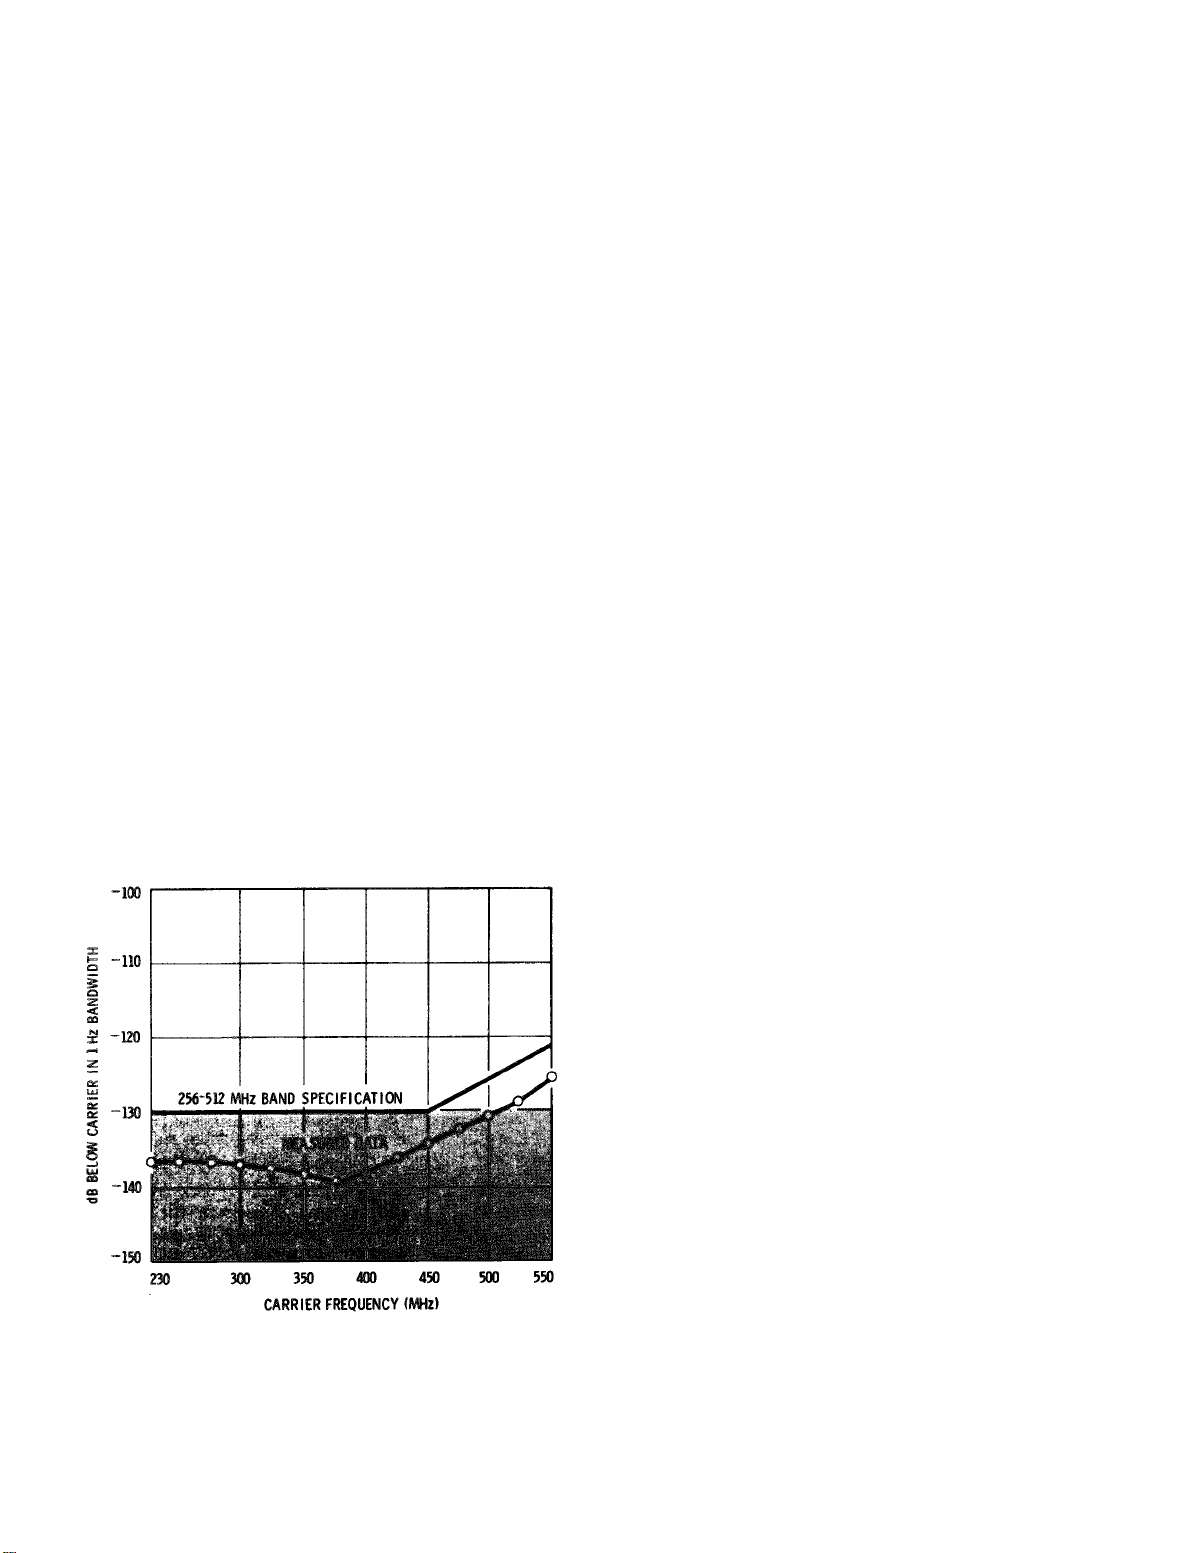
1-25. Figure 1-3 gives a plot of the specified SSB
noise perfomance for a 20 kHz offset from the
carrier for the 256-512 MHz band. From 230 to
450 MHz, noise is >130 dB/Hz below the carrier
level and rises to 122 dB/Hz at 500 MHz. This
signal-to-noise ratio decreases by approximately
6 dB for each division of the output frequency
down to the broadband noise floor of better than
130 dB/Hz. This exceptional noise performance is
also preserved in the phase lock mode and only
slightly degraded during FM.
1-26.
Frequency Counter
1-27. The Signal Generator has a built-in 550 MHz
frequency counter and phase lock synchronizer.
The 6-digit light-emitting diode (LED) display gives
a normal resolution of 10 kHz at 500 MHz and
10 Hz at 500 kHz. The resolution can be increased
using the X10 or X100 EXPAND buttons near the
display. In the X100 EXPAND mode, the resolution is 100 Hz at 500 MHz and 0.1 Hz at
500 kHz.
1-28. This resolution, combined with the high
stability of the generator, allows precise frequency
selection and meaningful measurements on high
performance receiver systems. When selecting the
external doubler band, the counter displays the
doubled output frequency directly.
1-29. When using the expand modes, it is possible
for significant digits or the decimal points to be
shifted off the display. When this occurs, an
OVERFLOW light reminds the operator that the
display is not showing the complete output fre-
quency.
1-30. The built-in counter can also be used to
count external input signals from 1 Hz to 550 MHz
and eliminates the need for a separate frequency
counter in many measurement systems. Input
sensitivity is <100 mV into 50. Using the EXPAND buttons, it is possible to achieve a resolution
of 1 Hz in the 0-10 MHz EXTERNAL count mode
or 100 Hz in the 0-550 MHz mode.
Figure 1-3. Specified Signal-to-Phase Noise Ratio
at 20 kHz Offset vsus Carrier Frequency (MHz).
(Stated in a 1 Hz Bandwidth.) For lower bands,
phase-noise decreases approximately 6 dB per fre-
quency division down to the broadband noise
floor.
1-31. Phase-Lock Mode
1-32. Also included in the Signal Generator is a
built-in phase lock synchronizer that locks the RF
output frequency to the crystal time base used in
the counter. In this locked mode, output stability
is better than 5 x 10
-8
/h while the spectral purity
and FM capability of the unlocked mode are
preserved. For higher stability, it is possible to lock
to an externally applied 5 MHz standard. Two
Model 8640B’s can also be locked to a common
timebase reference for performing various two-tone
measurements.
1-33. Phase locking the generator is simple - just
push the front panel LOCK button. The generator
is then locked to the frequency shown on the
LED
display. If lock is broken (for example by tuning
1-3
Page 16
General Information
Model 8640B Option 004
to a new output frequency or during warmup),
there is an immediate indication: the LED display
flashes. The generator can be relocked by releasing
the LOCK button and then relocking.
1-34. The generator can be locked in the normal
mode of the counter or in the X10 EXPAND mode
if the OVERFLOW light is not on. It is normally
not possible nor recommended to lock in the X100
EXPAND mode or when counting external inputs.
Maximum resolution in the locked mode is 1 kHz
at 500 MHz, increasing to 1 Hz at 500 kHz.
1-35. If an output frequency between adjacent
counter indications is required, a TIME BASE
VERNIER is provided with a range of ±20 ppm.
This fine tunes the internal crystal time base and
sets the output frequency between adjacent counts
(i.e., the least significant digits of the display). This
gives continuous coverage of all output frequencies
even in the phase lock mode. An UNCAL annunciator near the vernier will light when this mode has
been selected indicating that the counter display is
incorrect.
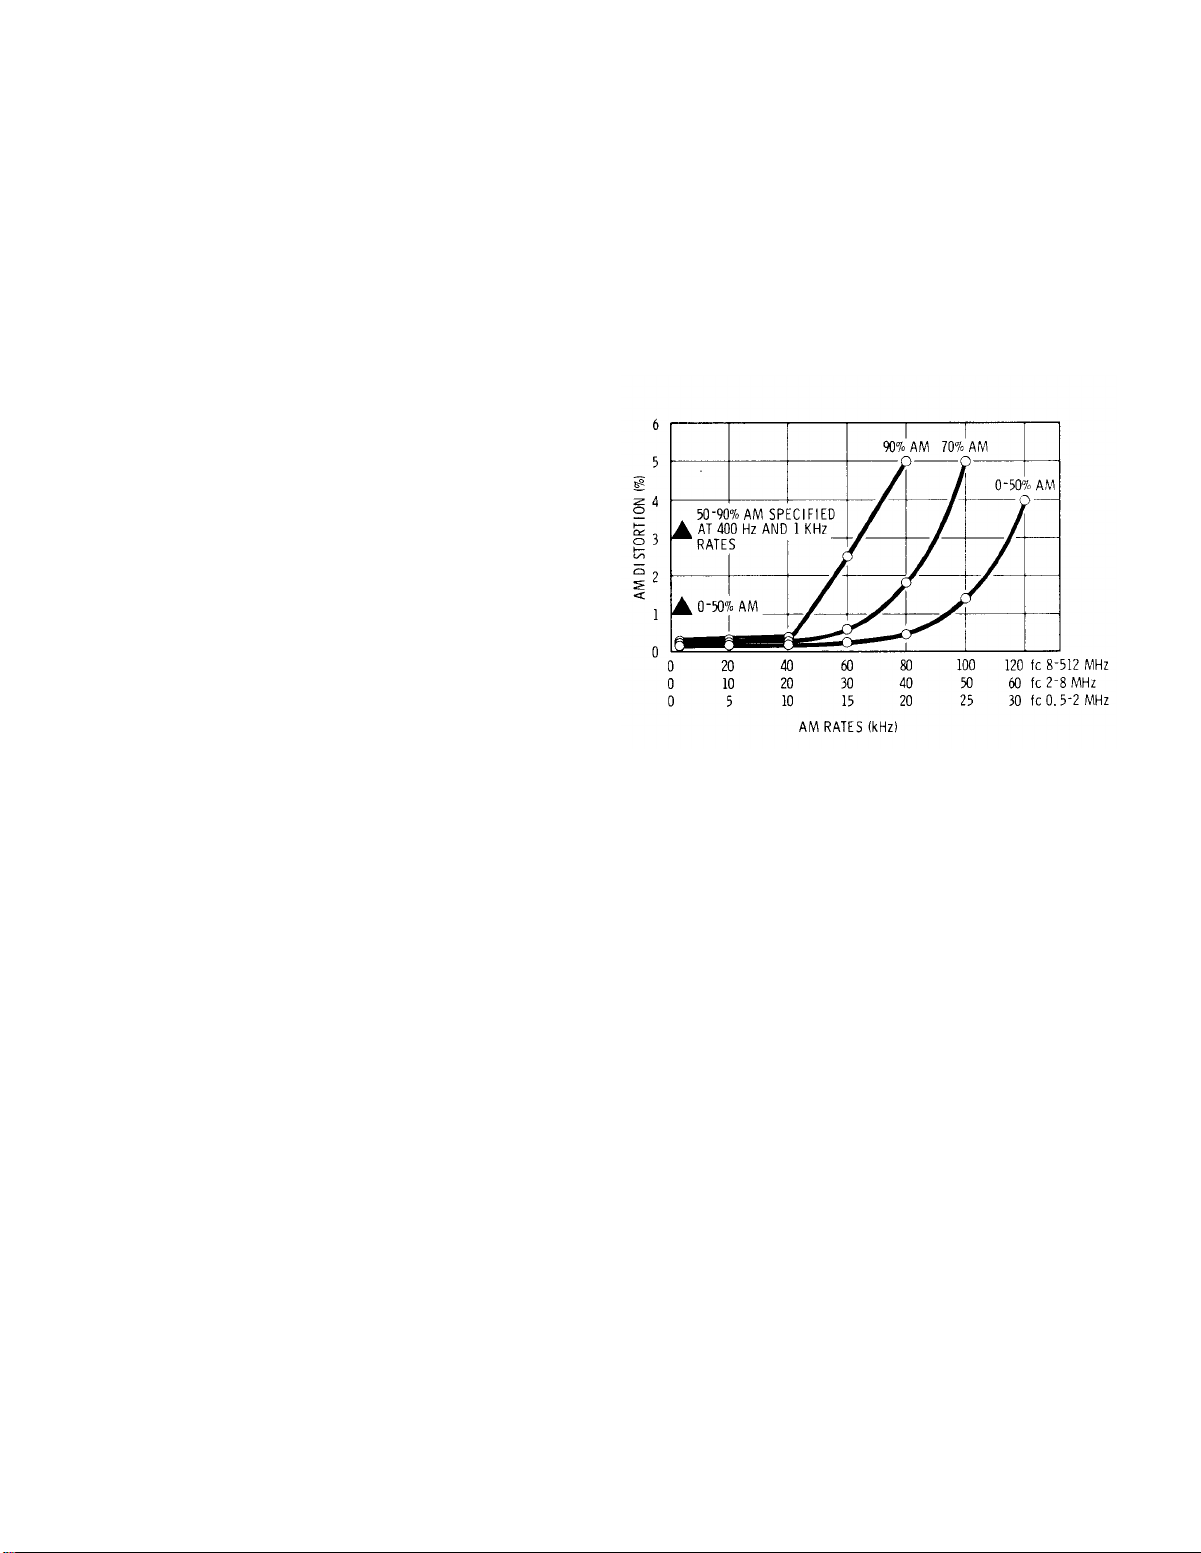
1-41. AM up to rates of 50 kHz is possible
depending on carrier frequency and modulation
depths. Distortion is specified at 400 Hz and
1000 Hz to be <1% up to 50% AM, <3% to 90%
AM. Figure 1-4 shows measured AM distortion
characteristics for other modulation frequencies.
Note that for 0-50% AM, distortion is <1% to
approximately 90 kHz for an output frequency of
200 MHz.
1-36. When phase locked, the narrow bandwidth
of the phase lock loop (<5 Hz) preserves full FM
capabilities down to rates of 50 Hz and assures no
degradation in noise from the unlocked mode
(residual FM is not changed by phase locking).
1-37.
Amplitude Modulation
1-38. AM is variable from 0 to 100% with the
rates, accuracy, and low incidental FM required for
the most stringent AM applications. The front
panel meter gives a direct readout of percent AM in
either the internal or external mode and autoranges
the 0-100% scale to 0-30% for improved nettability
at low modulation depths.
1-39. For precision measurement of AM, the front
panel DEMOD OUTPUT jack provides a demodulated AM signal (either 0 - 1 Vrms or 0 -5 Vrms)
which is directly proportional to percent AM. The
DEMOD CAL label lists values of this voltage by
which percent AM can be set very accurately
(within 1%) with an ac voltmeter. The label was
prepared when the instrument was calibrated. A
new label should be prepared whenever the generator is recalibrated.
1-40. DEMOD OUTPUT can also be connected to
the Demod Input of some modulation sources for
sensing the phase relationship of the output RF
envelope and the input modulating signal.
Figure 1-4. AM distortion us AM rate measured at
200 MHz and +10 dBm, but applies to all bands.
(Supplemental information only.)
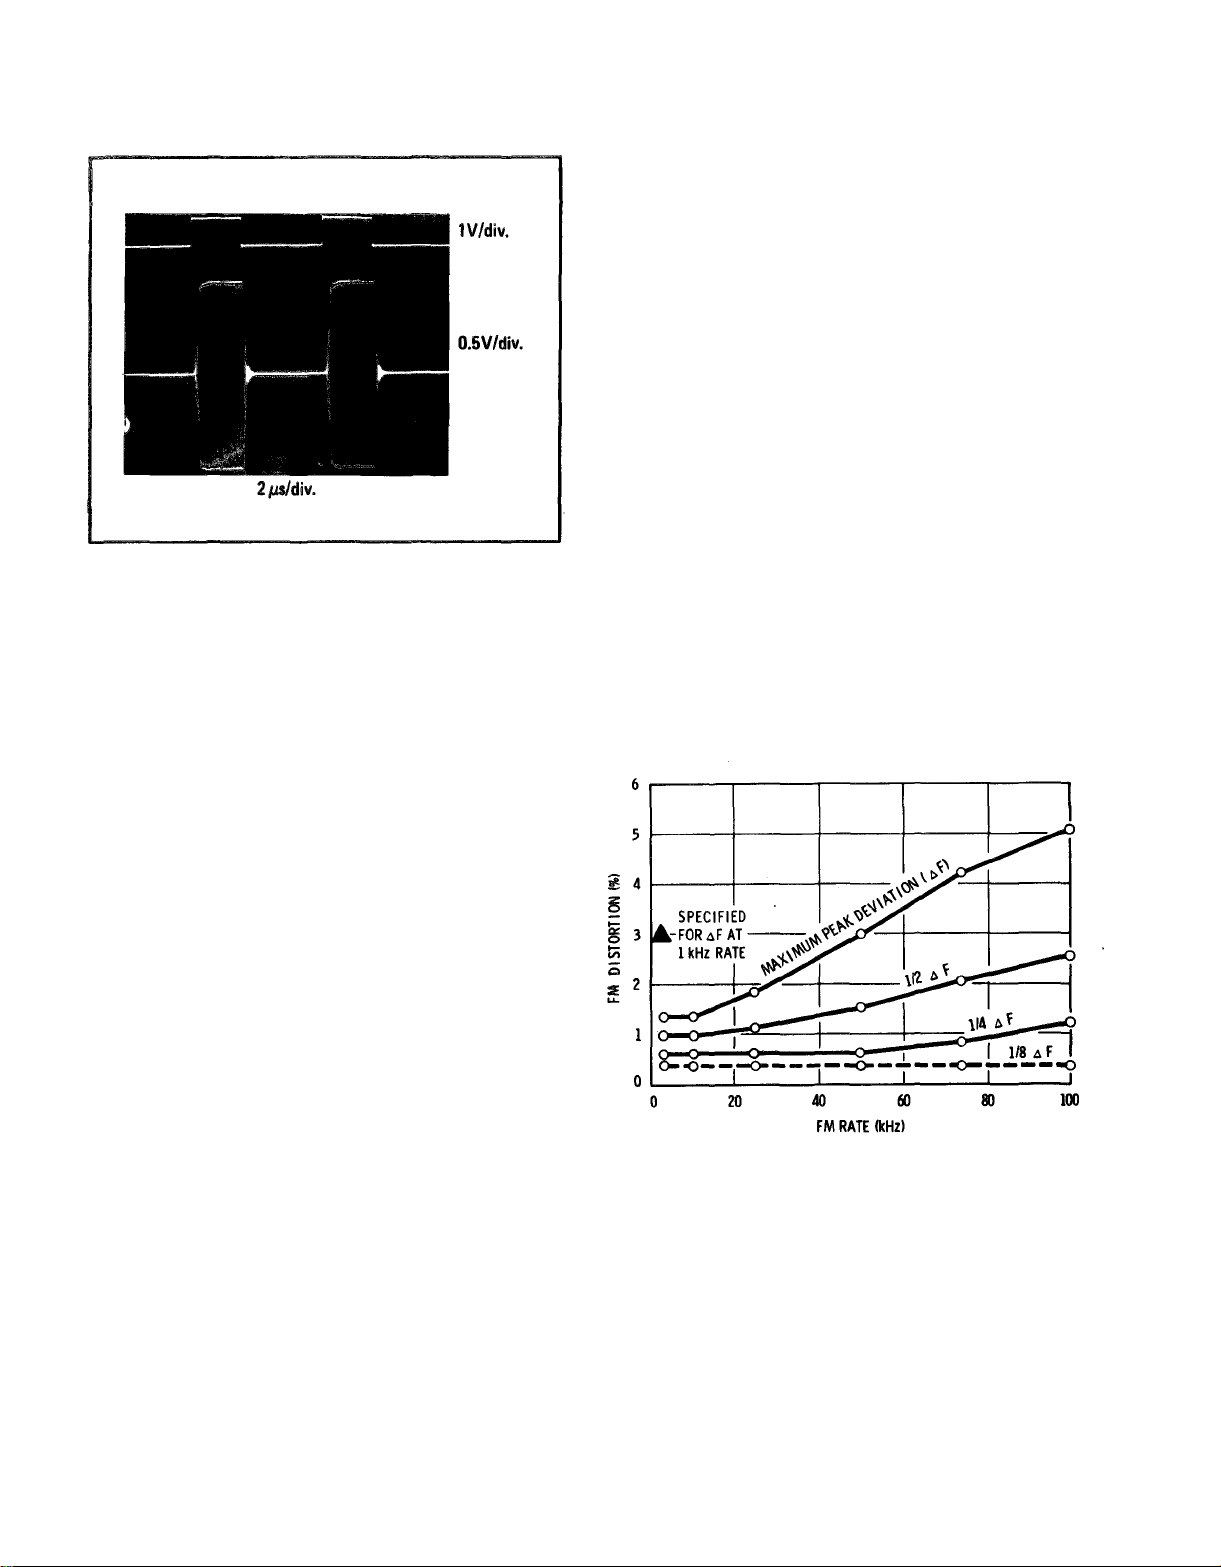
1-42.
Pulse Modulation
1-43. Also included on the AM function switch is
a position for external PULSE modulation. In this
mode, pulse inputs with repetition rates to
500 kHz and widths down to 2 µ
S can be applied
to modulate the RF carrier. Rise and fall times
vary with output frequency down to <1 µ
S from 8
to 512 MHz.
1-44. Pulse inputs turn the RF on. Hence with no
pulse inputs the RF will read approximately zero
on the built-in level meter. For pulse inputs greater
than 0.5V, the RF output is on, calibration is
preserved and the level meter reads the pulse-on
power of the RF output. For repetition rates
below that specified, the pulsed RF output is still
available but the pulse-on level is no longer
calibrated or metered.
1-45.
Frequency Modulation
1-46. FM is calibrated, metered and constant with
RF frequency and band changes. Peak deviations to
at least 0.57. of carrier frequency are available (i.e.,
1% of the minimum frequency in each octave
band). On the 256-512 MHz band, for example,
1-4
Page 17
Model 8640B Option 004
Figure 1-5. Pulsed RF 20 MHz Carrier Frequency
-
at
400 kHz Pulse Rate and 1 µs Pulse Width.
the maximum
deviation is 2.56 MHz peak or
5.12 MHz peak-to-peak. With this wide deviation
capability, it is possible to sweep the generator,
using the dc coupled FM mode and a sawtooth
input, to test and align IF filters and
discriminators.
General Information
available separately at the front panel and can be
varied in level from 3V to <20 mV into 600
Ω.
This audio oscillator, Option 001, extends the
usable CW range of the generator down to 20 Hz.
1-51. Multi-Function Meter and Annunciators
1-52. The front panel meter on the Signal Gener-
ator monitors the RF output level in dBm and
volts, the
peak deviation in kHz or MHz. The accuracy of
this meter is usually better then ±3% of reading.
Pushbuttons select the meter function, and scale
lights indicate the range on which the meter
reading should be made. For RF output level and
AM%, the scales autorange for better resolution.
For FM, the appropriate scale is selected by the
PEAK DEVIATION range switch.
AM modulation percentage, and the FM
1-53. Also provided are three front panel annunciators that indicate when certain settings of RF
level and modulation controls exceed specified
limits. Besides giving a warning indication, the
annunciators instruct the operator about returning
the instrument to proper operation.
1-47. For narrowband FM applications, a minimum full scale deviation of 5 kHz is provided on
the meter and the PEAK DEVIATION range
switch. When switching from the CWto FM mode,
there is negligible shift in carrier frequency and no
degradation in spectral purity for these narrow
deviations. With the generator in the phase lock
mode it is
possible to modulate at rates down to
50 Hz while maintaining accurate FM calibration
and the carrier drift stability of a crystal oscillator.
Using the unlocked mode, it is possible to modul-
Z
ate from dc to 250 kH
with a carrier drift stability
of <10 ppm/10 min.
1-48.
Standard and Optional Audio Oscillators
1-49. Standard tones for internal modulation are
400 Hz and 1000 Hz. These tones are also available
at the front panel and can be varied in output level
from 1 V to <10 mV into 600 Ω. Total harmonic
distortion is typically <0.25%.
1-50. Optionally available on the Signal Generator
is a built-in variable frequency oscillator covering
the range 20 Hz to 600 kHz (fixed tones of 400 Hz
and 1000 Hz are also provided). This internal
oscillator has a wide range of standard modulation
frequencies and is useful for testing receiver audio
bandwidth. Output from this modulation souce is
Figure 1-6. FM distortion vs FM rate measured in
the 8-16 MHz band, but applies to all bands (sup-
plemental information only).
1-54. The REDUCE PEAK POWER annunciator
lights whenever the combined settings of RF
output and AM modulation levels exceed allowable
knits. The specification allows for up to 100% AM
on all RF output ranges except the +16 dBm range.
On the +16 dBm range RF levels with up to 50%
AM are normally possible before the annunciator
will light. When the annunciator lights it is necea-
1-5
Page 18

General Information Model 8640B Option 004
sary to reduce either the OUTPUT LEVEL 10 dB
switch or the AM MODULATION control.
1-55. The REDUCE PEAK DEVIATION annunciator lights whenever the PEAK DEVIATION
RANGE switch has been set to exceed the allowable limits for any output FREQUENCY RANGE.
The specification allows for a maximum peak
deviation of 1% of the minimum frequency in each
band (e.g., 2.56 MHz on the 256-512 MHz band).
When the annunciator lights, the FM is automatically turned off and the FM meter reads zero.
1-56. The REDUCE FM VERNIER annunciator
lights whenever the FM input and FM vernier
setting combine to exceed the 1 volt drive level
required to achieve the maximum deviation indicated on the PEAK DEVIATION range switch.
When this occurs, either the FM vernier or the
amplitude of the incoming modulation signal
should be reduced to obtain specified FM
performance.
1-57. Output Level
1-58. The wide output range of the generator is
achieved with a 20 dB step attenuator, a 1 dB step
attenuator and a 2 dB vernier. Output levels can be
read directly on the attenuator dials or (for greater
accuracy) on the autoranging meter. The meter
scales are automatically selected to give the maxi-
mum indicator resolution for any output level.
1-59. The maximum output level of +15 dBm
permits high level tests on receiver IF’s, amplifiers,
and mixers without additional power amplifica-
tion. At the same time, extremely low leakage
ensures receiver sensitivity measurements down to
levels of 0.03 µV in a shielded system.
1-60. For improved accuracy at low output levels,
the meter, in conjunction with the attenuators, is
factory-calibrated against a precision standard to
remove much of the error that is accumulated from
the attenuator’s steps. Using a power meter and
calibrating the output for one output frequency
and vernier setting, it is then possible to make
sensitivity measurements to better than ±1 dB
accuracy down to output levels of --127 dBm.
1-61. OPTIONS
1-62. Option 001. Option 001 (covered in this
manual ) provides a modulation oscillator that is
continuously settable from 20 Hz to 600 kHz. The
oscillator can also be set for 400 Hz or 1 kHz fixed
tones.
1-63. Option 002. Option 002 (an internal fre-
quency doubler available in the standard Model
8640B) is not compatible with the Model 8640B
Option 004 and thus is not covered in this manual.
1-64. Option 003. Option 003 (either factory built
or retrofitted) protects the generator’s output circuits from accidental applications of reverse power
up to 25 watts. Option 003 is documented in a
separate manual supplement.
1-65. ACCESSORIES SUPPLIED
1-66. The Model 8640B Option 004 is supplied
with the following accessories (they are shown in
Figure 1-1):
Rack Mounting Kit (HP 5060-8740)
Line Power Cable (HP 8120-1378)
2 Amp Fuse (HP 2110-0002)
1.25 Amp Fuse (HP 2110-0094)
Demod Cal Labels (HP 7120-4244)
1-67. The rack mounting kit, the cable, and the
fuses are fully described in Section II.
1-68. The following accessories are mounted inside
the instrument’s chassis and are available for
adjustment and repair (for more information, see
Sections V and VIII):
Combination Wrench (HP 5001-0135)
Spare fuses for power supply circuit boards
30-pin Extender Board (HP 08640-60036)
1-69. EQUIPMENT AVAILABLE
1-70. Fuseholder. The HP Model 11509A Fuse-
holder attaches to the RF OUT jack and prevents
accidental damage to the generator’s output attenuator by externally applied R F. It is primarily
used when testing transceivers.
The fuseholder may not protect the output amplifier against a fast pulse of
reverse power on the top two ranges, of
the OUTPUT LEVEL 10 dB switch.
1-71. Termination. The HP Model 11507A Termi-
nation maintains the generator’s output level calibration when the output is connected to load
impedances other than 50 ohms. It can provide
source impedances of 25 and 5 ohms, and it can
simulate a broadcast-band dummy antenna. The
frequency range is 50 kHz to 65 MHz.
1-6
Page 19

Model 8640B Option 004
General Information
1-72. 75 Ohm Adapter. The HP Model 11687A 50
to 75 Ohm Adapter connects to the generator’s output to provide a source impedance of 75 ohms.
1-73. Doubler. The HP Model 11690A Doubler
extends the usable frequency range of the generator one octave to 1024 MHz (actually to
1100 MHz with 7% frequency over-range). Conver-
sion low in the doubler is typically <13 dB.
1-74.
Mixer. The HP Model 10514A Double Bal-
ancedi Mixer can be used at the generator's output
as a nanosecond pulse modulator or as a balanced
mixer.
1-75. Protective Cover. The HP 5060-8767 Con-
trol Panel Cover protects the panel from dust and
impact damage.
1-76. SERVICE AND USER AIDS
1-77. Video Tapes. Video tapes covering instru-
ment use, application, and service are available.
Contact the nearest Hewlett-Packard Sales and
Service Office for a list of presently available tapes.
1-78. Application Notes. Informative notes con-
cerning the use of signal generators are also
available from the nearest Hewlett-Packard Sales
and Service Office.
1-79. Service Notes. Hewlett-Packard makes de-
sign improvements to its current line of instrument on a continuing basis. Many of these
improvements can be incorporated in earlier produced instruments. Modification and general ser-
vice information is passed on in the form of Service
Notes. To obtain the Service Notes contact the
nearest Hewlett-Packard Sales and Service Office.
1-80. Deleted.
1-81. Deleted.
1-82. TEST EQUIPMENT REQUIRED
1-83. Tables 1-2 and 1-3 list the test equipment
and accessories required to check, adjust and repair
the Model 8640B Option 004. (Table 4-2 is a
separate list of relatively inexpensive, commonly
available test equipment for the Basic Functional
Check only.) Refer to the Mac in Appendix
D for Army test equipment requirements.
NOTE
The safety classification of this instru-
ment is Safety Class I. It has been
designed and tested according to IEC
Publication 348 SAFETY REQUIREMENTS FOR ELECTRONIC MEASURING APPARATUS and has been sup-
plied in safe condition. The instruction
manual contains in formation, warnings,
and cautions which must be followed by
the user to ensure safe operation and to
retain the instrument in safe condition.
1-7
Page 20
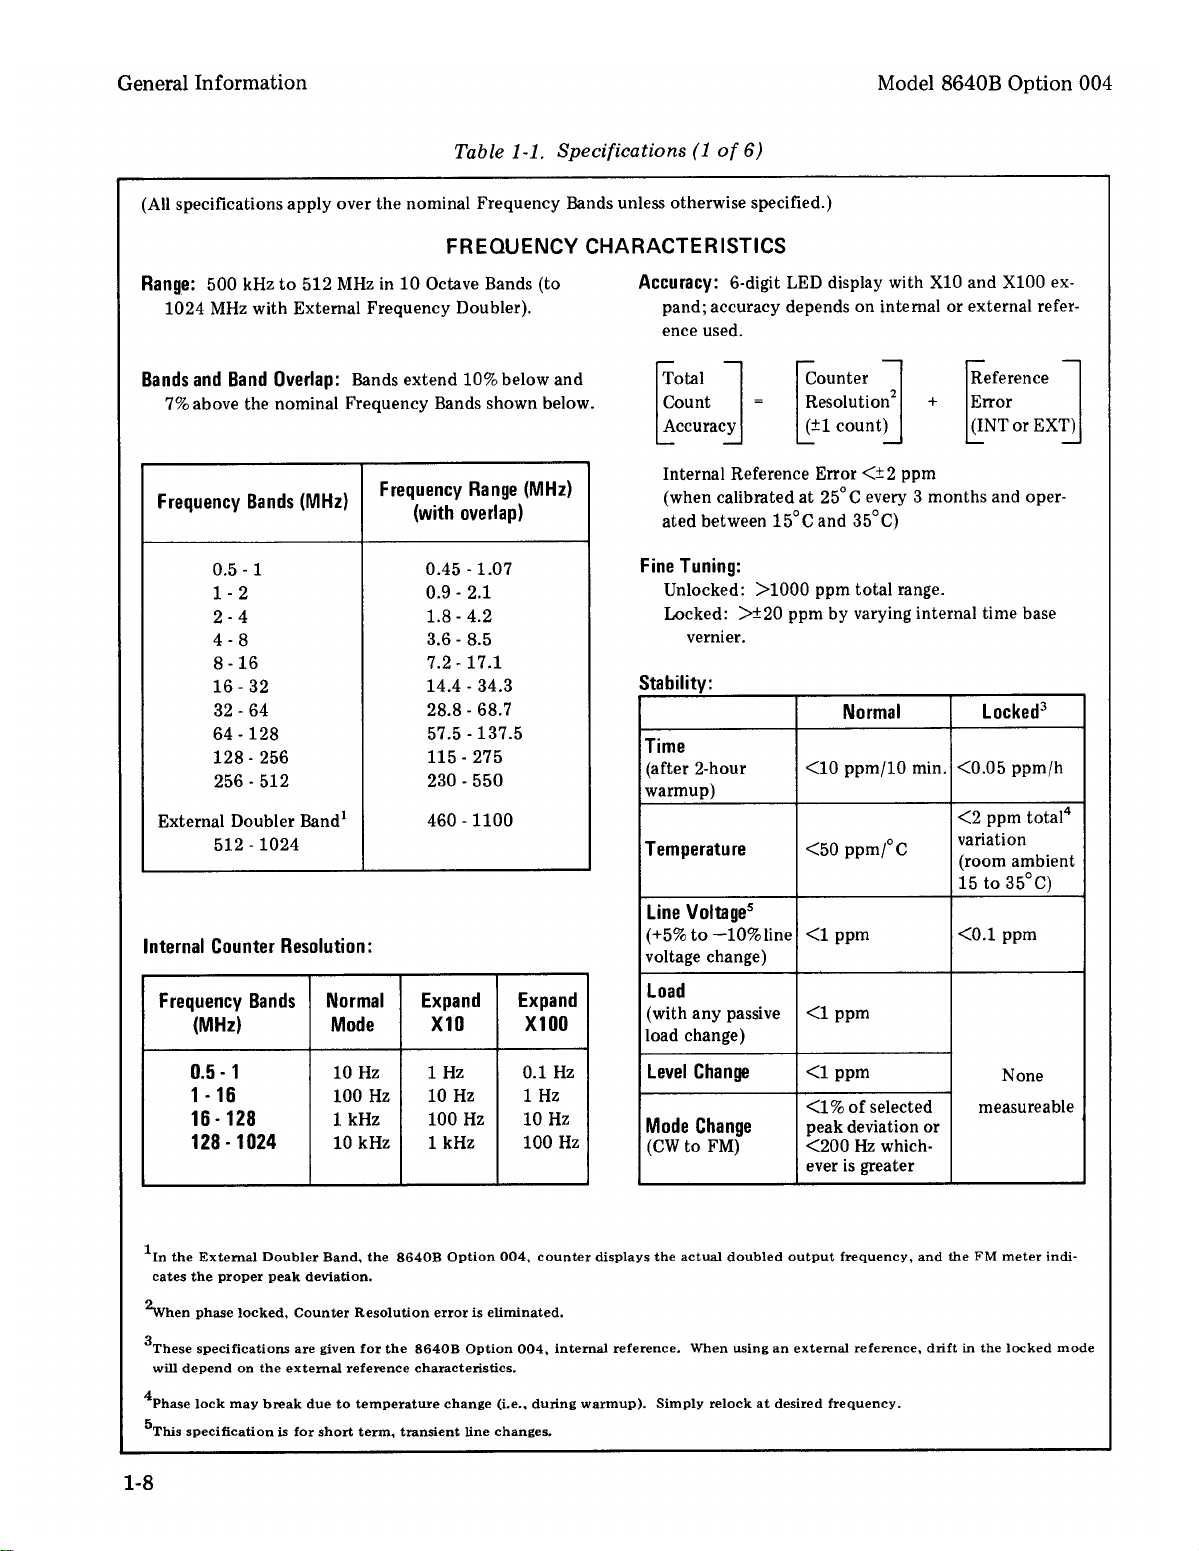
Table 1-1.
1-8
Page 21
Model 8640B Option 004
Table 1-1. Specifications (2 of 6)
FREQUENCY CHARACTERISTICS (Cont’d)
Restabilization Time:
After frequency
change
After band change
After 1 min in RF
OFF Mode
Harmonics:
(on IV, +10 dBm, output range and below)
>35 dB below fundamental of 0.5 to 128 MHz.
>30 dB below fundamental of 128 to 512 MHz.
Subharmonic and Nonharmonic Spurious:
frequencies within 15 kHz of carrier whose effects
are specified in Residual AM and FM): >100 dB
below carrier.
Noise:
Averaged rms noise level below carrier stated
in a 1 Hz bandwidth.
SSB Phase Noise at 20 kHz offset from carrier. (See
Figures 1-2 and 1-3.)
256 MHz to 512 MHz: >130 dB from 230 to
450 MHz increasing linearly to >122 dB down
at. 550 MHz.
0.5 MHz to 256 MHz: Decreases approximately
6 dB for each divided frequency range until it
reaches SSB Broadband Noise Floor of
>140 dB.
SSB Broadband Noise Floor greater than 1 MHz
offset from carrier (see Figures 1-2 and 1-3):
>130 dB down.
<15 min
2
<10 min
SPECTRAL PURITY
Residual AM:
(excluding
Residual FM:
General Information
Normal
Locked
l
<1 min
after
None
relocking
to be within
0.1 ppm of
steady-state
frequency
(Averaged rms)
Post-detection Noise Bandwidth
300 Hz to 3 kHz
>85 dB down
20 Hz to 15 kHz
>78 dB down
(Averaged rms)
CW and up to Up to maxi-
1/8 maximum mum allowable
allowable peak peak
deviation deviation
Post-detection
Noise
Bandwidth
230 to 550 MHz
Note:
Residual FM decreases by approximately 1/2 for
300 Hz 20 Hz 300 Hz 20 Hz
to to to to
3 kHz 15 kHz 3 kHz 15 kHz
<5 Hz <15 Hz
<15 Hz <30HZ
each divided frequency range until limited by broad-
band noise floor. This limit for 300 Hz to 3 kHz is
about 1 Hz, and for 20 Hz to 15 kHz is about 4 Hz.
These are measured values in the 230 to 550 MHz
range
and calculated for divided ranges, knowing the
noise distribution.
1
OUTPUT CHARACTERISTICS
Range:
+15 dBm to –142 dBm (1.3V to 0.018 µV).
Level Flatness:
Attenuators: a 10 dB step attenuator, and a 1 dB <±0.75 dB from 0.5 to 512 MHz referred to output
step attenuator with vernier allow selection of
any output level over the full output level range.
Vernier: >2 dB continuously variable from a CAL
detent position.
1
These specifications are given for the 8640B Option 004 internal reference. when using an external reference. drift in the locked mode
will depend on the external reference characteristics.
2
This specification apply only if the RF ON/OFF switch has been wired to turn the RF Oscillator off.
at 190 MHz.
<±0.5 dB from 108 to 336 MHz referred to output
at 190 MHz.
(Flatness applies to +10 to -10 dBm.)
1-9
Page 22
General Information
Model 8640B Option 004
Table 1-1. Specifications (3 of 6)
OUTPUT CHARACTERISTICS (Cont’d)
Impedance:
50
Ω,
ac coupled, VSWR. <2.0 on 3V and
IV output ranges; <1.3 on all other ranges.
Reverse Power Damage Level:
40 Vdc maximum.
20 dBm maximum on 3V and IV output ranges;
27 dBm maximum on all other ranges.
Reverse Power Protection (Option 003):
Protects signal
generator from accidental applications of up to
25 watts (+44 dBm) of RF power (between dc and
1100 MHz) into generator output.
Auxiliary Output:
Ω,
into 50
Rear panel BNC output is >–5 dBm
source impedance is approximately 500
Ω.
Leakage: (With all unused outputs terminated properly.)
Leakage limits are below those specified in MIL-I6181D. Furthermore, less than 3 µV is induced in a
2-turn, l-inch diameter loop 1 inch away from any
surface and measured into a 50 Ω receiver. This permits receiver sensitivity measurements to at least
<0.03 µV in a shielded system.
MODULATION CHARACTERISTICS
General
Types: Internal AM and FM.
External AM, FM, and PULSE.
Simultaneous AM and FM, or PULSE and FM.
Internal Modulation Sources: (independently adjustable
output is available at front panel).
Standard:
Frequency: Fixed 400 Hz and 1 kHz, ±2%.
Output Level: Indicated 10 mVrms to 1 Vrms,
into 600
Ω
Level Accuracy:
Note: Level Accuracy error consists of allowances
for meter accuracy, detector linearity, temperature
flatness, attenuator accuracy, and twice the measurement error. All but the attenuator accuracy and the
measurement error can be calibrated out with a
power meter at a fixed frequency and a fixed vernier
setting.
Optional: (Internal Variable Audio Oscillator,
Option 001).
Frequency: Variable 20 Hz to 600 kHz,±l0%
in 5 decade continuous bands plus fixed
400 Hz and 1 kHz ±3%.
Output Level: 20 mVrms to 3 Vrms into
600
Ω.
Total Harmonic Distortion:
< 0.25% 400 Hz and 1 kHz fixed tones
< 0.5%
< 1.0%
20 Hz to 2 kHz
2 kHz to 600 kHz
Amplitude Modulation
(Not applicable when OUTPUT LEVEL 10 dB switch in +16 dBm position).
Depth: 0 to 100%.
AM Rates: INT and EXT ac; 20 Hz to AM 3 dB band-
width. EXT dc; dc to AM 3 dB bandwidth.
1
AM is possible in tbe +16 dBm output range with AM depths
typically up to 50%, however DEMOD OUTPUT is not calibrated in this range and degradation of other AM specifications
should be expected.
1-10
1
AM 3 dB Bandwidth: (See Figure 1-4.)
Frequency
Bands
0.5-2 MHz
2-8 MHz
8-512 MHz
0 to
50% AM
15 kHz
30 kHz
50 kHz
50 to
90% AM
12.5 kHz
20 kHz
35 kHz
Page 23
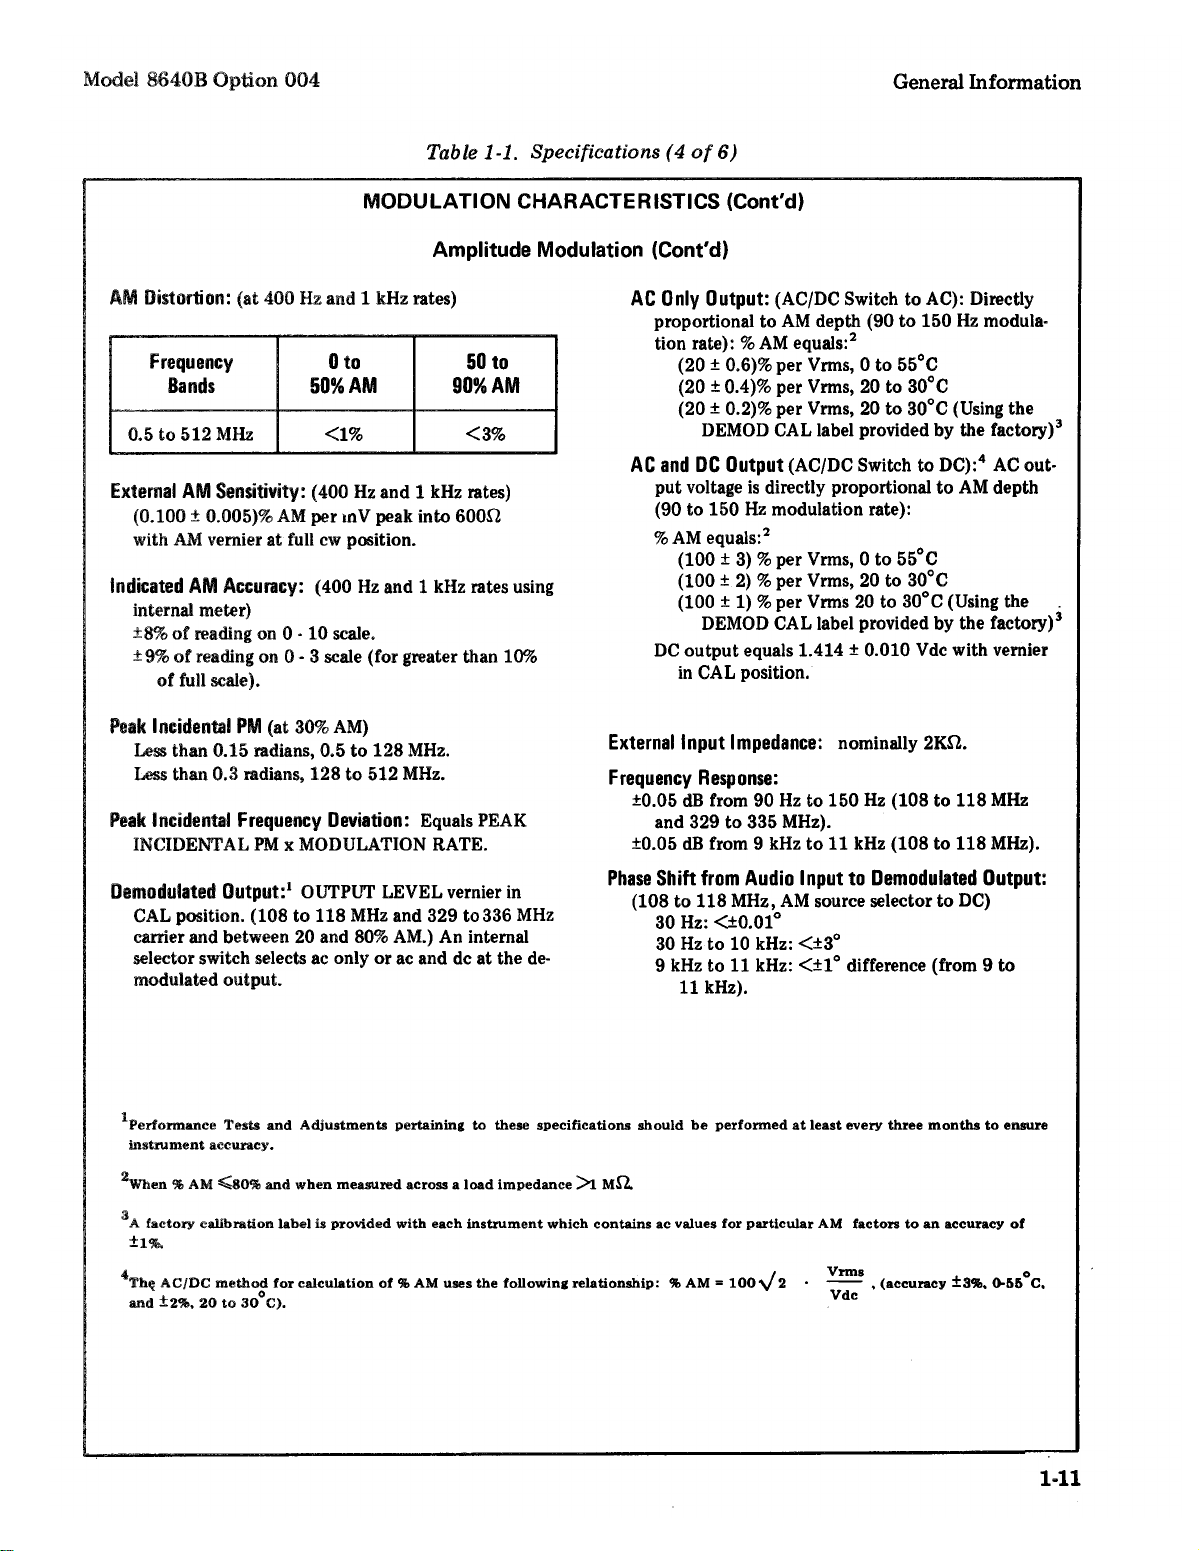
Table 1-1.
1-11
Page 24
General Information
Model 8640B Option 004
Table 1-1. Specifications (5 of 6)
MODULATION CHARACTERISTICS (Cont’d)
Pulse Modulation
Frequency Bands (MHz)
Rise and Fall Times
Pulse Repetition Rate
Pulse Width Minimum
for level accuracy within
1
dB of CW (>0.1% duty cycle)
Pulse ON/OFF ratio
Peak Input Required
Deviation:
Maximum allowable deviation equals 1% of
lowest frequency in each band as below.
Frequency Band
(MHz)
0.5-1
1-2
2-4
4-8
8-16
16-32
32-64
64-128
128-256
256-512
512-1024
Maximum Peak
Deviation (kHz)
5
10
20
40
80
160
320
640
1280
2560
5120
2
<1
µs
32-512
µs
50
Hz
500 kHz
to
0.5-1
<9
µs
50 Hz
50 kHz
10
µs
1-2
<4
to
µs
2-8
<2
µs
50 Hz to
100 kHz
5
µs
>40
dB
8-32
50 Hz
to
250 kHz
Nominally > +0.5V (5V max) sinewave or pulse return to zero,
into 50
Ω.
Frequency
Modulation
FM Distortion:
(at 400 Hz and 1 kHz rates) See
Figure 1-6.
<1% for deviations up to 1/8 maximum allowable.
<3% for maximum allowable deviation.
External FM Sensitivity:
1 volt peak yields maximum
deviation indicated on PEAK DEVIATION switch
with FM vernier at full cw position.
External FM Sensitivity Accuracy:
±6% from 15 to 35°C
for FM excluding maximum peak deviation position.
Maximum peak deviation position, ±9% typically.
Indicated FM Accuracy:
(400 Hz and 1 kHz rates using
internal meter) ±10% of meter reading (for greater
than 10% of full scale).
FM 3 dB Bandwidth:
1
Internal and External ac; 20 Hz to 250 kHz.
External dc; dc to 250 kHz.
1
With 8640B Option 004 in LOCKED MODE, external FM is possible only for rates greater than 50 Hz.
Incidental AM:
<0.5% AM for FM up to 1/8 maximum allowable
deviation.
<1% AM for FM at maximum allowable deviation.
(at 400 Hz and 1 kHz rates)
1-12
Page 25
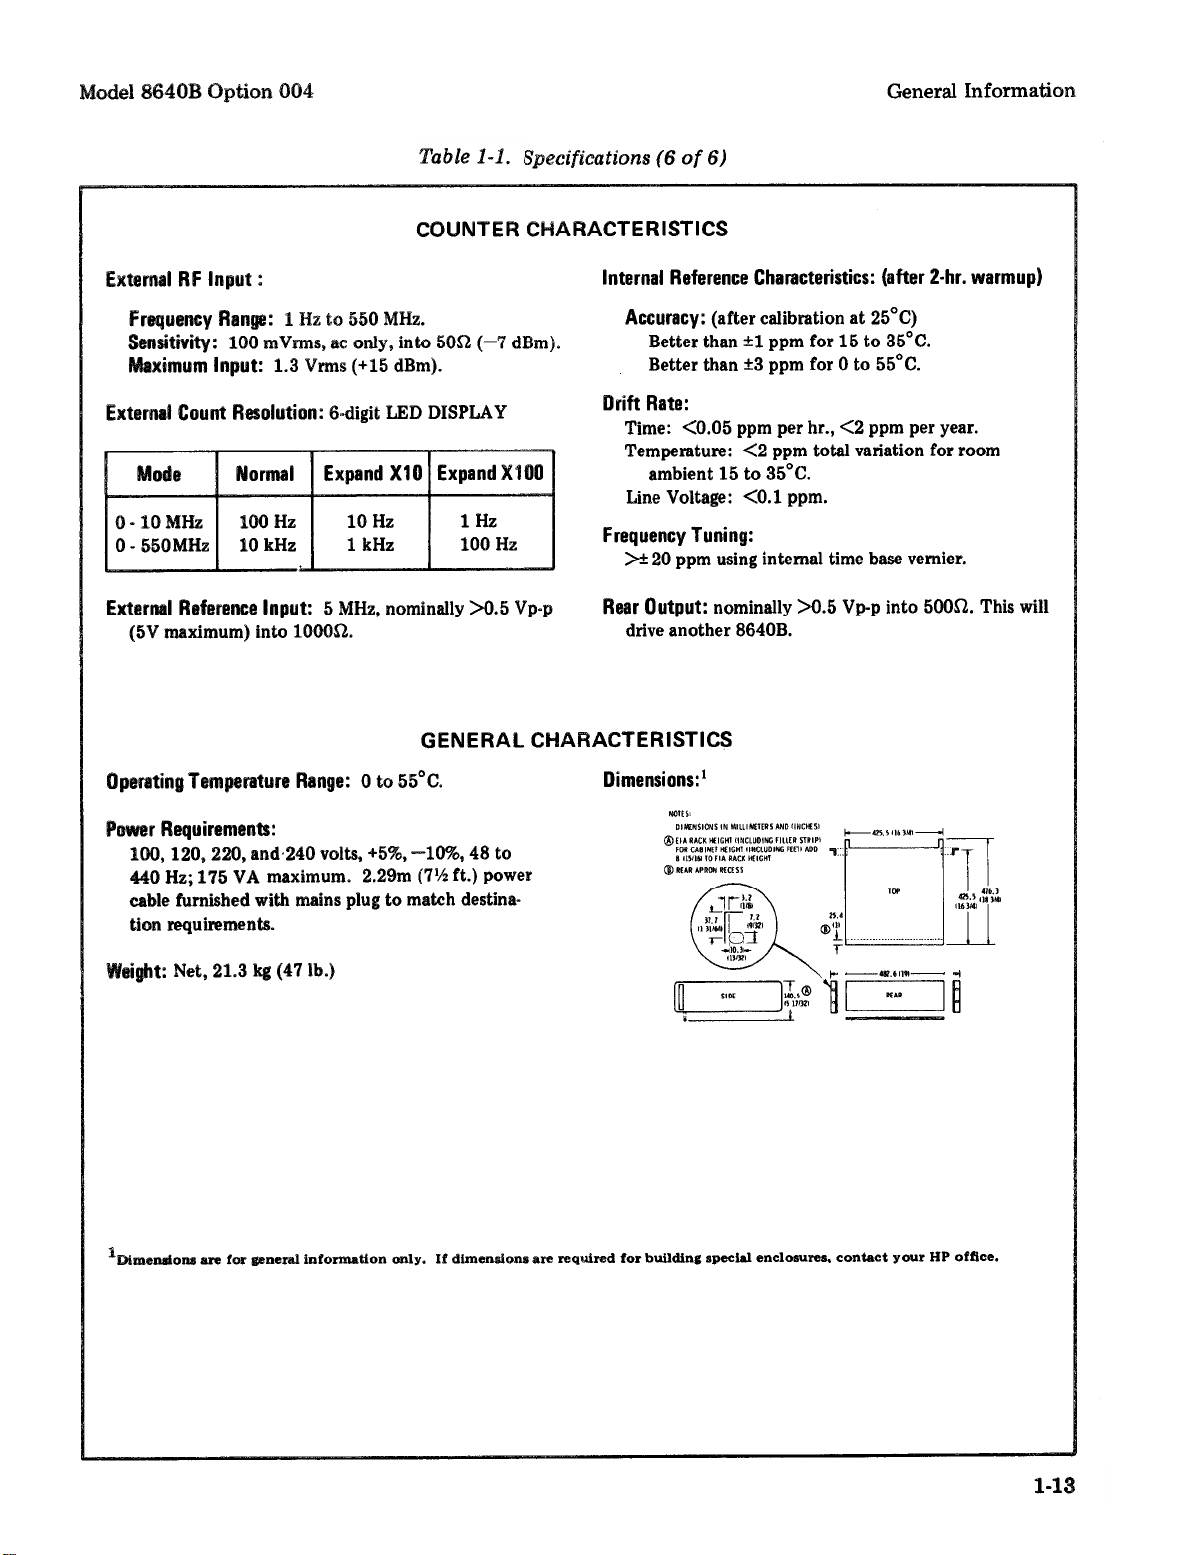
Table 1-1.
1-13
Page 26
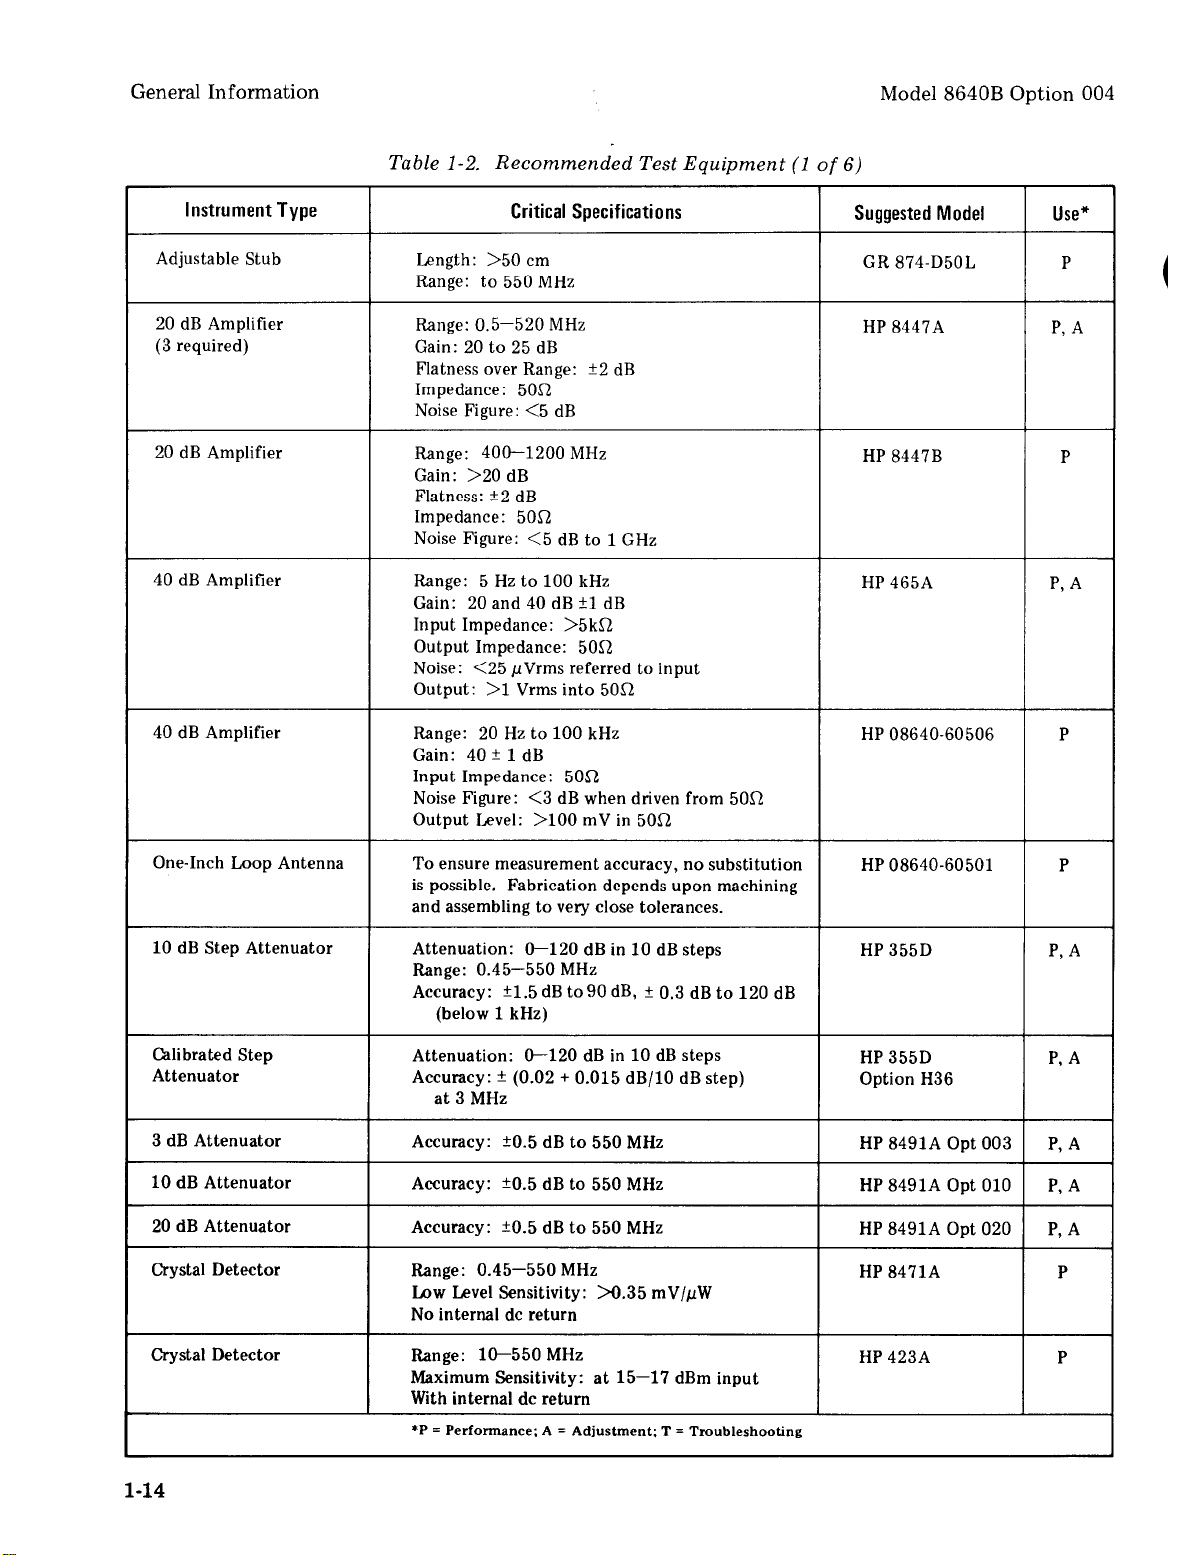
Table 1-2.
1-14
Page 27
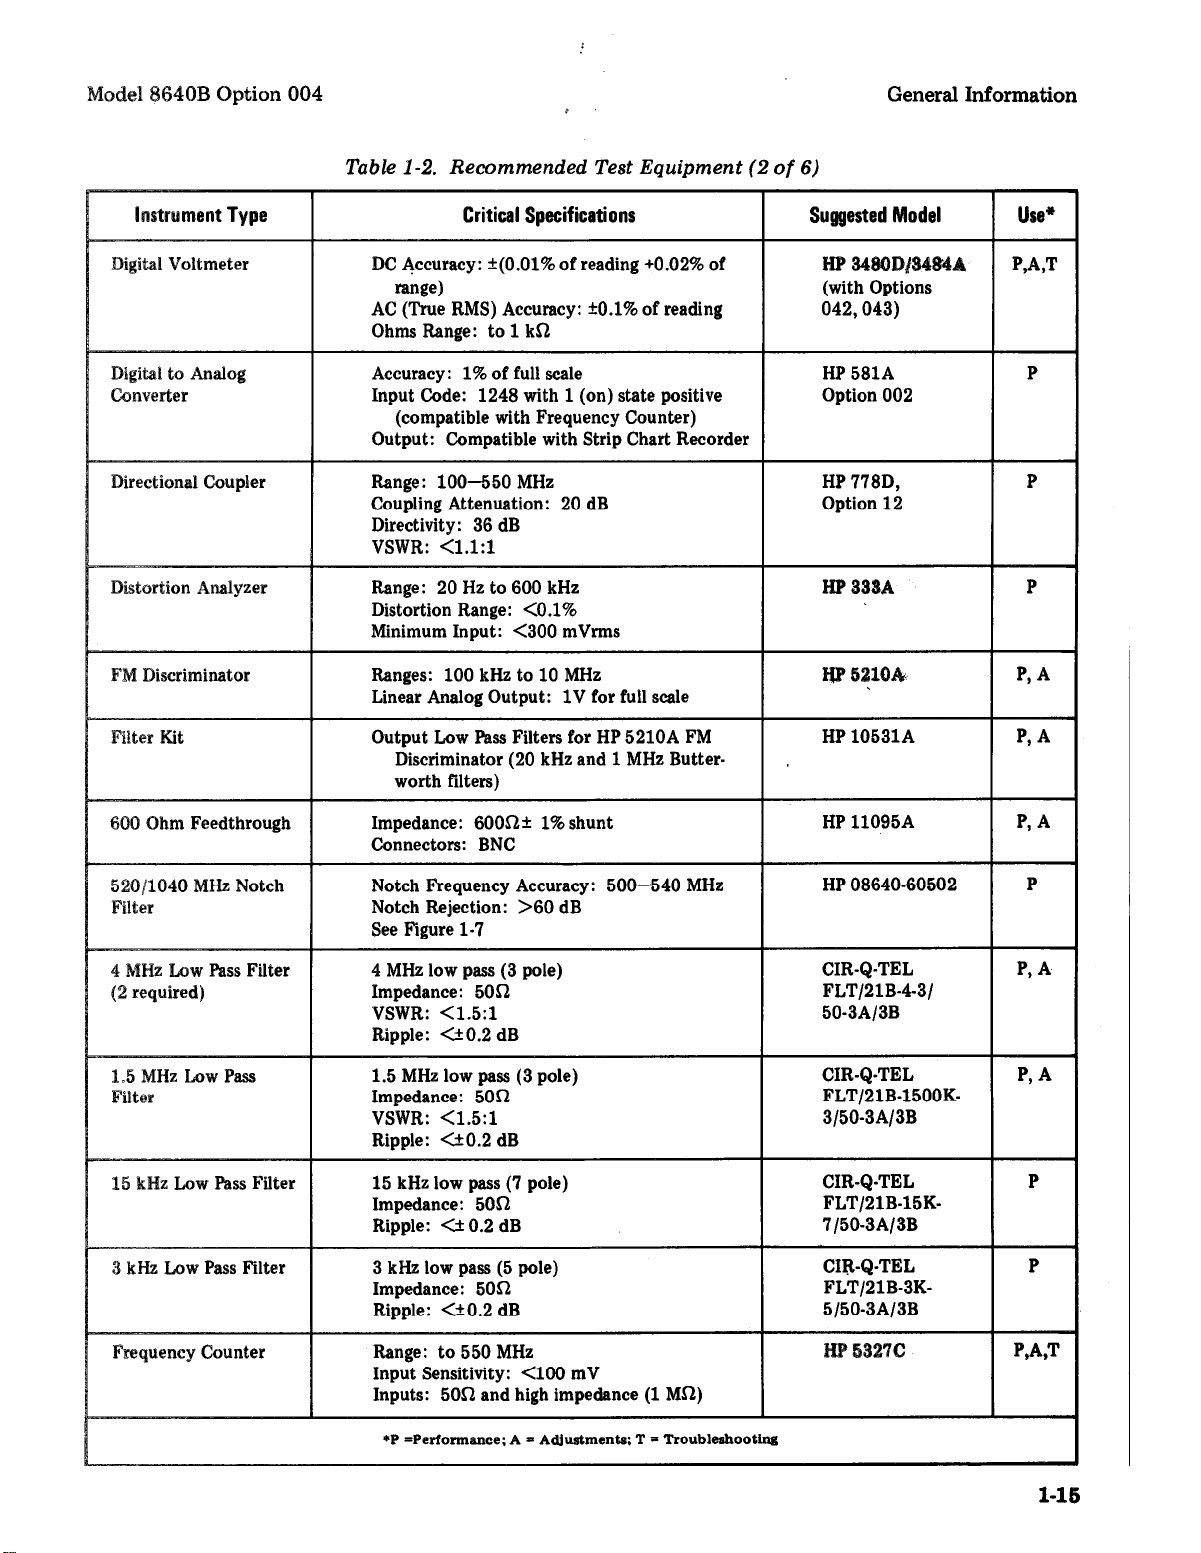
Table 1-2.
1-15
Page 28
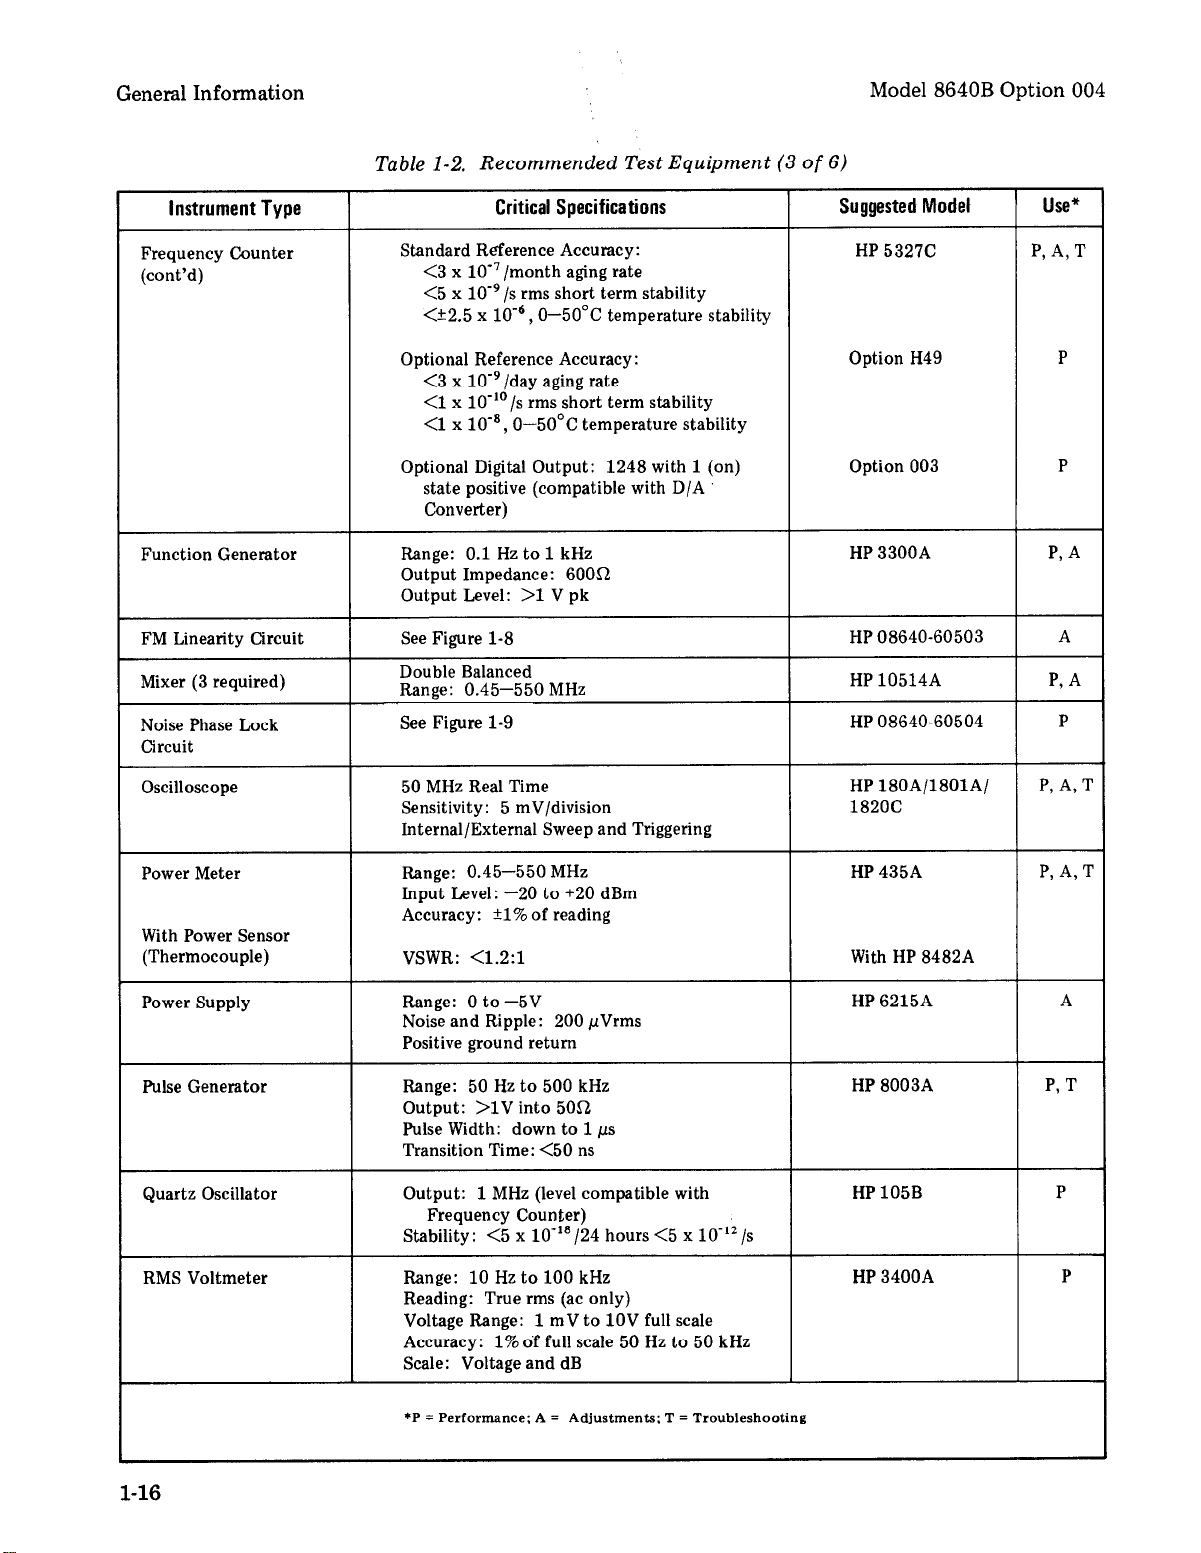
Table 1-2.
Figure 1-9
Figure 1-8
1-16
Page 29
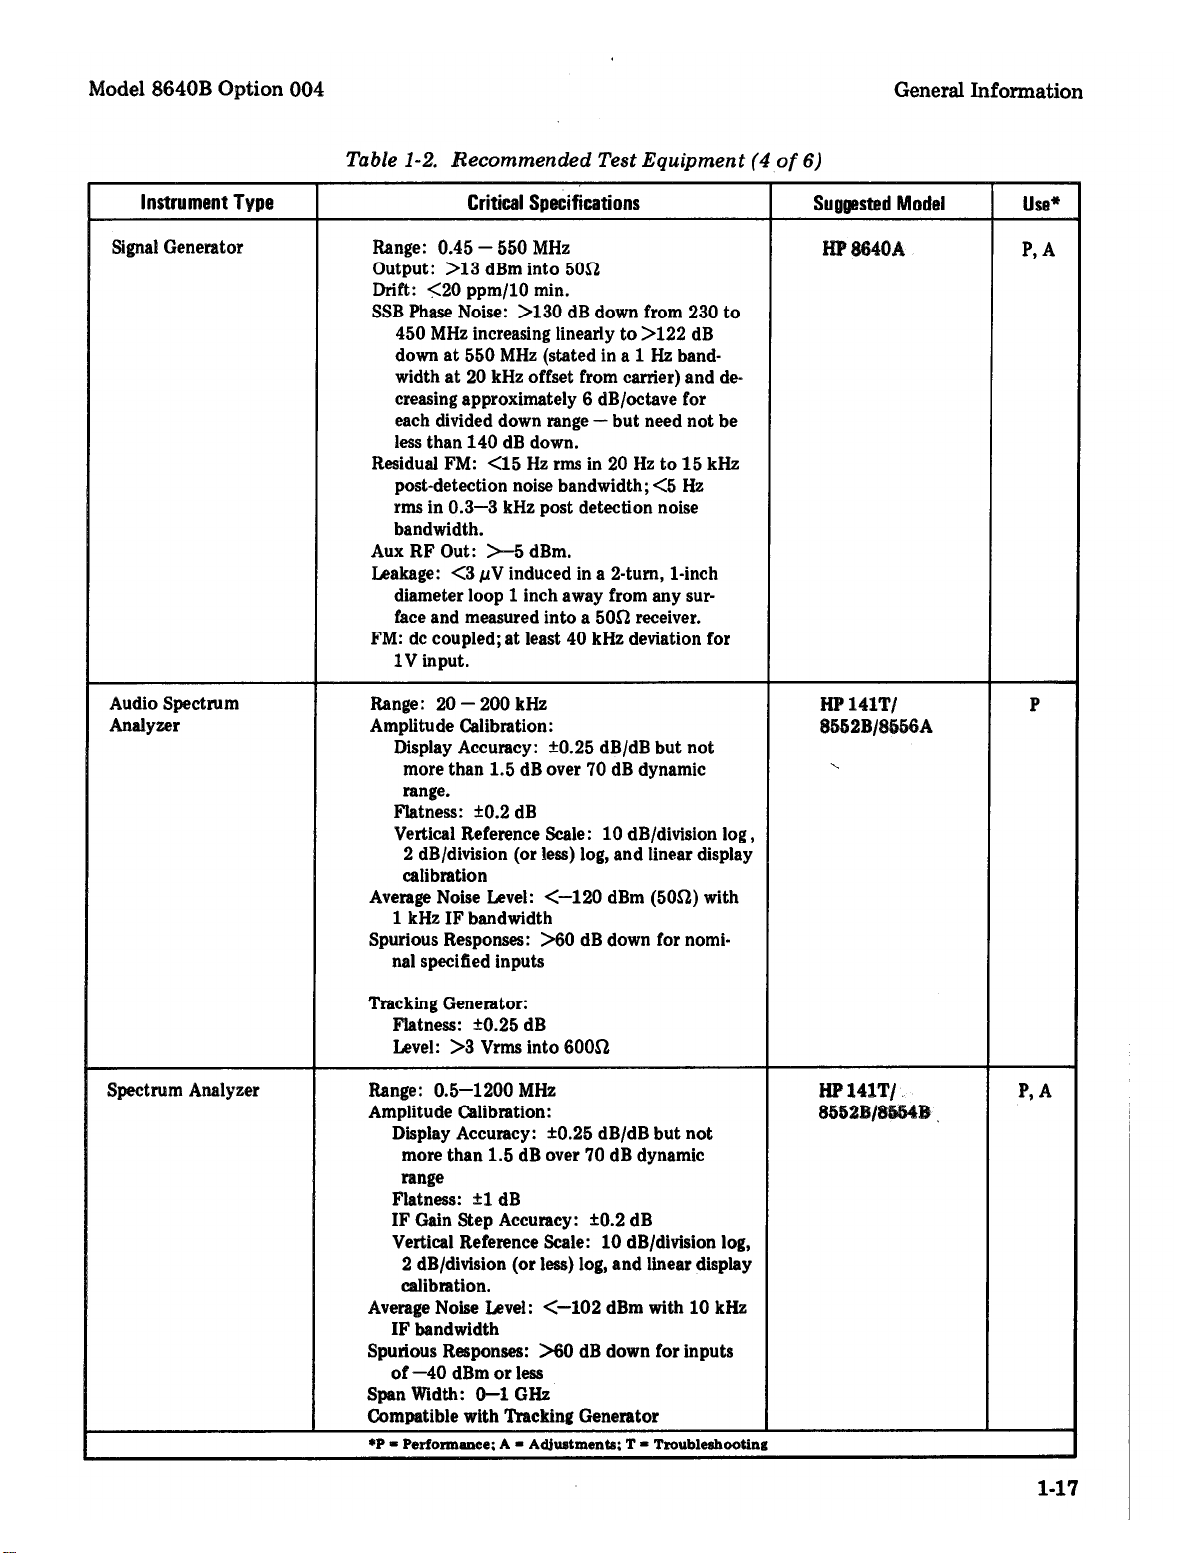
Table 1-2.
1-17
Page 30
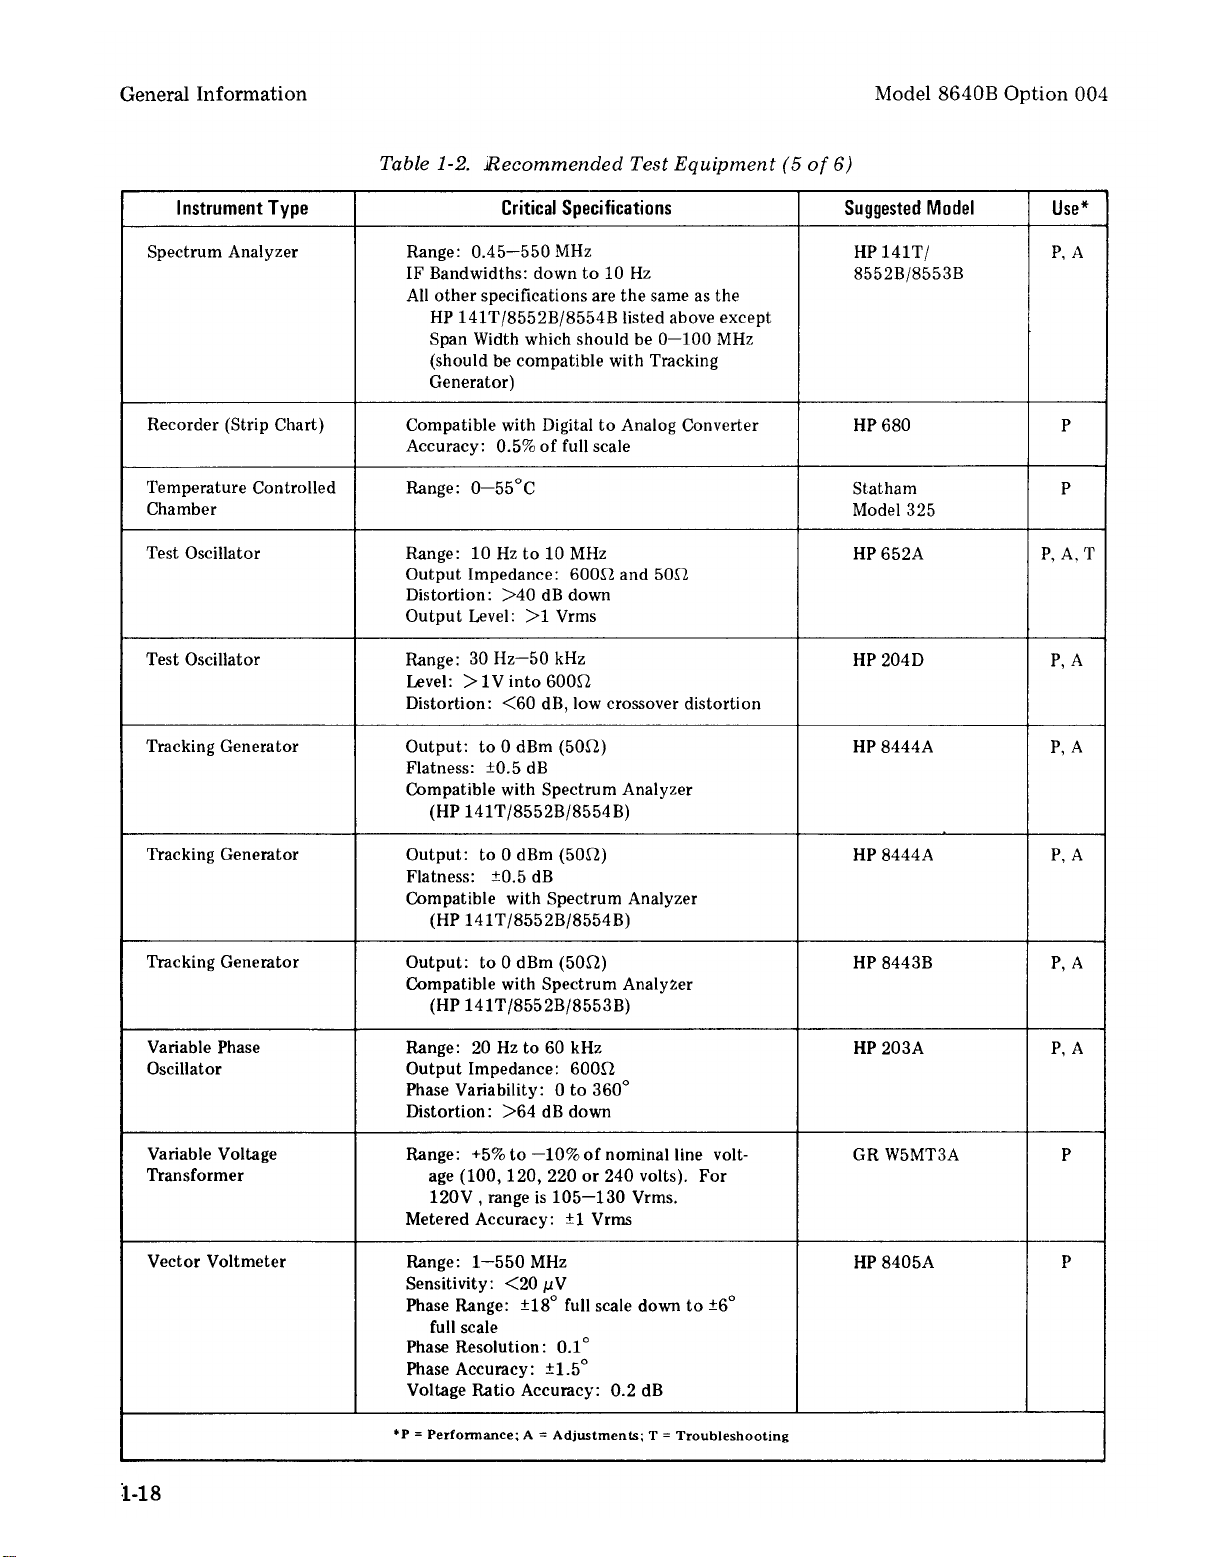
Table 1-2.
1-18
Page 31

Table 1-2.
Table 1-3.
1-19
Page 32

Figure 1-7.
1-20
Figure 1-8.
Page 33

Figure 1-9.
1-21/1-22
Page 34

Page 35

Model 8640B Option 004
Installation
SECTION II
INSTALLATION
2-1. INTRODUCTION
2-2. This section explains how to prepare the
Model 8640B Option 004 Signal Generator for use.
It explains how to connect the instrument to
accept available line voltage, and it also describes
bench operation, rack mounting, storage, and
shipment.
2-3. INITIAL INSPECTION
2-4. Inspect the shipping container for damage. If
the shipping container or cushioning material is
damaded it should be kept until the contents of the
shipment have been checked for completeness and
the instrument has been checked mechanically and
electrically. The contents of the shipment should
be as shown in Figure 1-1, and procedures for
checking electrical performance are given in
Section IV. If the contents are incomplete, if there
is mechanical damage or defect, or if the instru-
ment does not pass the electrical performance test,
refer to paragraph 0-4.
If the
shipping container is damaged, or the cushioning
material shows signs of stress, notify the carrier as
well as the Hewlett-Packard office. Keep the
shipping materials for carrier’s inspection. The HP
office will arrange for repair or replacement without waiting for claim settlement.
2-5. PREPARATION FOR USE
2-6. Power Requirements
2-7. The Model 8640B Option 004 requires a
power source of 100, 120, 220, or 240 Vac +5,
–10%, 48 to 440 Hz, single phase. Power consumption is 175 VA maximum.
SELECTION OF OPERATING VOLTAGE
1. Open cover door and rotate fuse-pull to Ieft.
2. Select operating voltaga by orienting PC board
to position desired voltage on top-left side.
Push board firmly into module slot.
3. Rotate fuse-pull back into normal position
and re-insert fuss in holders, using cautions to
select correct fuse value.
Figure 2-1. Line Selector
2-1
Page 36

Installation
2-8.
To prevent damage to the instrument,
make the line voltage selection BEFORE
connecting the line power. Also ensure
the line power cord is connected to a
line power socket that is provided with a
protective earth contact.
2-9. A rear panel,
line power module permits
operation from 100, 120, 220, or 240 Vat. The
number ‘visible in the window (located on the
module) indicates the nominal line voltage to
which the instrument must be connected.
2-10. To prepare the instrument for operation,
slide the fuse compartment cover to the left (the
line power cable must be disconnected). Pull the
handle marked FUSE PULL and remove the fuse;
rotate the handle to the left. Gently pull the
printed circuit voltage selector card from its slot
and orient it so that the desired operating voltage
appears on the top-left side (see Figure 2-1).
Model 8640B Option 004
Section I
NOTE
The correct fuse rating for the line
voltage selected is listed on the line
power module. More information about
fuses is given in the table of replaceable
parts in Section VI (reference designa-
tion is F1).
2-11. Power Cable
2-12. In accordance with international safety
standards, this instrument is equipped with a
three-wire power cable. When connected to an
appropriate power line outlet, this cable grounds
the instrument cabinet. The type of power cable
plug shipped with each instrument depends on the
country of destination. Refer to Figure 2-2 for the
part numbers of the power cable plugs available,
2-2
Figure 2-2. Power Cables Available
Page 37

Model 8640B Option 004
To avoid the possibility of injury or
death, the following precautions must
be followed before the instrument is
switched on:
a. If this instrument is to be energized
via an autotransformer for voltage reduction, make sure that the common ter-
minal is connectad to the earthed pole of
the power source.
b. The power cable plug shall only be
inserted into a socket outlet provided
with a protective earth contact. The
protective action must not be negated
by the use of an extension cord without
a protective conductor (grounding).
c. Before switching on the instrument,
the protective earth terminal of the
instrument must be connected to a
protective conductor of the power cord.
This is accomplished by ensuring that
the instrument’s internal earth terminal
is correctly connected to the instrument’s chassis and that the power cord is
wired correctly (see Service Sheet 22).
Installation
rack mounting are adequate for the top and
bottom cabinet surfaces.
2-18. Bench Operation
2-19. The instrument cabinet has plastic feet and a
foldaway tilt stand for convenience in bench
operation. The tilt stand raises the front of the
instrument for easier viewing of the control panel,
and the plastic feet are shaped to make full-width
modular instruments self-aligning when stacked.
2-20. Rack Mounting
2-21. This instrument is supplied with a rack
mounting kit. This kit contains all the necessary
hardware and installation instructions for mounting the instrument on a rack with 19 inch spacing
(see Figure 2-3).
2-22. STORAGE AND SHIPMENT
2-23. Environment
2-24. The instrument should be stored in a clean,
dry environment. The following environmental
limitations apply to both storage and shipment:
Temperature . . . . . -40°C to +75°C
Humidity . . . . . . . <95% relative
Altitude . . . . . . . . <25,000 feet
2-13. Mating Connectors
2-14. Mating connectors used with the Model
8640B Option 004 should be either 50 ohm-type
BNC male or Type N male connectors that are
compatible with US MIL-C-39012.
2-15. Operating Environment
2-16. The operating environment should be within
the following limitations:
Temperature . . . . . . 0°C to +55°C
Humidity . . . . . . . <95% relative
Altitude . . . . . . . . <15,000 feet
2-17. A forced-air cooling system is used to
maintain the operating temperature required within the instrument. The air intake and filter are
located on the rear panel, and warm air is
exhausted through perforations in the right-hand
side panel. When operating the instrument, choose
a location that provides at least three inches of
clearance at the rear and two inches clearance at
the right side. The clearances provided by the
plastic feet in bench stacking and the filler strips in
2-25. Packaging
2-26. Original Packaging. Containers and materials
identical to those used in factory packaging are
available through Hewlett-Packard offices. If the
instrument is being returned to Hewlett-Packard
for servicing, attach a tag indicating the type of
service required, return address, model number,
and full serial number. Also, mark the container
FRAGILE to assure careful handling. In any
correspondence, refer to the instrument by model
number and full serial number.
2-27. Other Packaging. The following general instructions should be used for re-packaging with
commercially available materials:
a.
Wrap the instrument in heavy paper or
plastic. (If shipping to a Hewlett-Packard office or
service center, attach a tag indicating the type of
service required, return address, model number,
and full serial number.)
Use a strong shipping container. A dou-
b.
blewall carton made of 350-pound test material is
adequate.
2-3
Page 38

Installation
c.
Use enough shock-absorbing material (3to 4-inch layer) around all sides of the instrument
to provide a firm cushion and prevent movement
inside the container. Protect the control panel with
cardboard.
d.
Seal the shipping container securely.
e.
Mark the shipping container FRAGILE
to assure careful handling.
Model 8640B Option 004
2-4
Figure 2-3. Preparation for Rack Mounting
Page 39

SECTION III
OPERATION
3-1. INTRODUCTION
3-2. This section describes the functions of the
controls and indicators of the Model 8640B Option
004 Signal Generator. It explains how to set the
frequency, amplitude, and modulation controls,
and covers such operator maintenance as fuse and
indicator lamp replacement and fan filter cleaning.
3-3. PANEL FEATURES
3-4. Front panel controls, indicators, and connectors are shown and described in Figure 3-2. The
Internal AC/DC Switch is described in Figure 3-3.
Rear panel controls and connectors are shown and
described in Figure 3-4.
3-5. OPERATOR’S CHECKS
3-6. Use the operator’s checks in Figure 3-5 to
verify proper operation of the Signal Generator’s
main functions.
3-7. OPERATING INSTRUCTIONS
3-8. Figures 3-6 and 3-7 explain how to set the
frequency, amplitude, and modulation controls.
Figure 3-6 also explains how to use the frequency
counter and phase lock controls.
panel. Then clean it, using a solution of warm
water and soap, or replace it,. using the part
number listed in the table of replaceable parts in
Section VI.
3-12. The fan motor has factory lubricated, sealed
bearings and requires no periodic maintenance.
3-13. Lamp Replacement. Figure 3-1 explains
how to replace the lamp located in the line power
switch.
3-14. Meter Zeroing. To mechanically zero the
front panel meter, set LINE switch to OFF and
place instrument in its normal operating position.
Turn adjustment screw cw until indicator indicates
zero, then turn adjustment slightly ccw to free
mechanism from adjusting peg.
3-9. OPERATOR’S MAINTENANCE
3-10. Fuse. The main ac line fuse is located on the
rear panel next to the line power cable jack. To
remove the fuse, first remove the line power cable
from its jack. Slide the fuse compartment cover to
the left, then pull the handle marked FUSE PULL
and remove the fuse.
Be sure to select the correct fuse rating
for the selected line voltage (see LINE
VOLTAGE SELECTION in Section II);
fuse ratings are listed on the fuse compartment.
3-11. Fan. The cooling fan's filter is located on
the rear panel. To service the filter use a No. 2
pozidriv screwdriver (HP 8710-0900) to remove
the four screws that hold the falter to the rear
Figure 3-1. Lamp Replacement
3-1
Page 40

Operation
Model 8640B Option 004
FRONT PANEL FEATURES
Meter Function: interlocked buttons select one of
three functions.
AM: meter indicates percent of amplitude
modulation.
FM: meter indicates peak frequency devia-
tion.
LEVEL: meter indicates RF output level in
Vrms or dBm 50
Ω.
SCALE: annunciator lamps light to indicate ap-
plicable meter scale. Meter scale is automatically
selected.
Meter: automatically ranges to one of three scales,
read according to meter function.
AM X 10%: 0-3 scale is read 0-30%; 0-10
scale is read 0-100%.
FM kHz/MHz: 0-3, 0-5, and 0-10 scales are
read in kHz or MHz, depending upon setting
of PEAK DEVIATION switch (e.g., with
PEAK DEVIATION set to 80 kHz, a meter
reading of 7.2 indicates that deviation is
72 kHz).
LEVEL VOLTS: 0-3 and 0-10 scales are
read in microvolt, millivolts, or volts depending upon setting of the OUTPUT
LEVEL 10 dB switch. The –10 to +3 dB
scale is read relative to the dBm scales on the
OUTPUT LEVEL dials.
Output Problem Annunciators: lamps light to
indicate that modulation or OUTPUT LEVEL
settings are causing generator to be uncalibrated.
REDUCE PEAK POWER: indicates a combination of OUTPUT LEVEL and amplitude
modulation that exceeds specified limits
(i.e., 100% AM on all RF frequency ranges
except 256-512 MHz, and typically greater
than 50% AM on this top range).
REDUCE FM VERNIER: indicates that an
external FM input level or vernier setting is
causing FM deviation to exceed limits.
3-2
Figure 3-2. Front Panel Controls, Indicators, and Connectors (1 of 4)
Page 41

Model 8640B Option 004
Operation
FRONT PANEL FEATURES
REDUCE PEAK DEVIATION:
indicates
PEAK DEVIATION setting is too high for
the selected frequency range.
COUNTER MODE: Buttons control operation of
frequency counter.
EXPAND: X10 expands resolution one
digit, moving the decimal point one place to
the left; X100 expands resolution two digits,
moving the decimal point two places to the
left.
NOTE
EXPAND X10 and EXPAND Xl 00
buttons are interlocked so that only
one button can be depressed at a time.
LOCK: phase locks Signal Generator to the
internal (or to an external) crystal reference.
Display indicates lock frequency; loss of lock
causes display to flash and indicate actual
frequency of Signal Generator
INT: programs counter to count frequency
of signal Generator.
OUTPUT LEVEL 1 dB: 1 dB steps, 0 to-12 dB.
OUTPUT LEVEL 10 dB: -130dBm
to +10 dBm and a 6 dB step to +16 dBm.
RF On/OFF: enables or disables the RF output.
NOTE
The RF ON/OFF switch may be wired
to turn off only the amplitude modulator. This allows the RF oscillator to
remain warmed up, the Auxiliary RF
Output to remain on, and the counter
and phase lock to remain operating. If
it is desirable to switch both the
modulator and the RF Oscillator off,
the RF ON/OFF function may be
easily modified (see Service Sheet 5 in
Section VIII).
RF OUT: RF output through Type
N female
connector. (Connector meets US MIL-C-39012.)
50 ohm ac coupled source impedance.
EXT 0-10, EXT 0-550: programs counter to
count frequency of signal at COUNTER
INPUT jack; also selects counter frequency
range in MHz.
Frequency MHz: counter readout indicates
RF frequency in MHz. Flashing display indicates
loss of phase lock. The OVERFLOW lamp lights to
indicate that significant data is not being displayed.
TIME BASE VERNIER:
used as a fine frequency
tune when in lock mode to give continuous tuning
between lock points (the use of the COUNTER
MODE EXPAND X10 control is necessary on
some ranges to tune over the full range). When
control is not in CAL position, the UNCAL lamp
lights to indicate that the counter is uncalibrated.
OUTPUT LEVEL VERNIER:
varies RF amplitude
over a 2 dB range from a CAL detent position
(also see DEMOD OUTPUT).
Figure 3-2. Front Panel Controls, Indicators, and Connectors (2 of 4)
Any interruption of the protective
(grounding) conductor inside or outside the instrument is likely to cause
damage to the instrument. To avoid
damage, this instrument and all line
powered devices connected to it must
be connected to the same earth ground
(see section II).
FINE TUNE:
fine frequency control.
FREQUENCY TUNE: coarse frequency control.
COUNTER INPUT: external input to frequency
counter impedance is 50 ohms.
Do not apply a dc voltage or >+15 dBm
to COUNTER INPUT.
3-3
Page 42

3-4
Figure 3-3
Figure 3-2.
Page 43

Figure 3-2.
3-5
Page 44

3-6
Figure 3-3.
Page 45

Figure 3-4.
Figure 2-1
Section II
3-7
Page 46

3-8
Figure 3-5.
Page 47

Figure 3-5.
3-9
Page 48

3-10
Figure 3-5.
Page 49

Figure 3-5.
3-11
Page 50

3-12
Figure 3-5.
Page 51

Figure 3-6.
3-13
Page 52

3-14
Figure 3-6.
Page 53

Figure 3-6.
3-15
Page 54

3-16
Figure 3-7.
Page 55

Figure 3-7.
3-17
Page 56

Figure 3-7.
3-18
Page 57

Figure 3-7.
3-19
Page 58

Figure 3-7.
3-20
Page 59

4-1.
4-2.
Section III
4-3.
Table 1-1
SECTION IV
4-8.
4-9.
4-10.
4-4.
4-5.
SECTION IV
4-11.
Table 4-2
Section I
4-6.
4-7.
Table 4-1
4-1
Page 60

Performance Tests
Model 8640B Option 004
Table 4-1. Recommended Test Abridgements (1 of 3)
Para.
No.
4-13.
4-14.
4-15.
4-16.
4-17.
4-18.
4-19.
Performance Test Alteration Remark
Frequency Range Test
Frequency Accuracy
and Fine Tune Test
Frequency Stability vs. Omit steps 5 to 7
Time and Restabilization
Time Test
Frequency Stability vs.
Temperature Test
Frequency Stability vs.
Line Voltage Test
Frequency Stability vs.
Load, Level, and Mode
Test environment.
Harmonics Test
Check only 0.5 – Ranges obtained by binary division of 230–
1 MHz range
Omit steps 5 to 8
Omit test
Omit test
Omit test
None
550 MHz RF oscillator. All dividers operate
on 0.5 — 1 MHz range.
Fine tune of secondary importance.
Restabilization time of secondary importance.
Drift is small in a normal lab environment.
Frequency shifts are small in a normal lab
environment.
RF oscillator well buffered from external loading, FM offset null constant under normal lab
4-20.
4-21.
4-22.
4-23.
4-24.
4-25.
4-26.
4-27.
Sub-harmonics and Non-
harmonic Spurious Test except counter, which is heavily shielded and
Single Sideband Phase
Noise Test
Single Sideband Broad- None
band Noise Floor Test
Residual AM Test Omit step 4 Normally within specification for 300 Hz to
Residual FM Test
Output Level Accuracy
Test (Abbreviated)
output Level Accuracy Omit test.
Test (Complete)
Output Level Flatness
Test
Omit test
None
Omit steps 6 and 7
None
None
No mechanism for generation of spurious signals
filtered.
3 kHz bandwidth if within specification for
20 Hz to 15 kHz bandwidth.
Normally within specification for 300 Hz to 3 kHz
bandwidth if within specification for 20 Hz to
15 kHz bandwidth.
Most useful ranges checked by abbreviated test.
4-2
Page 61

Model 8640B Option 004
Performance Tests
Table 4-1. Recommended Test Abridgements (2 of 3)
Para.
No.
4-28.
4-29.
4-30.
4-31.
4-32.
4-33.
4-34.
4-35.
Performance Test Alteration
Remark
Output Impedance Test
(Signal Frequency)
Omit one test.
Output Impedance Test
A condition that is out of specification will
usually show on both tests.
(Broadband)
Auxiliary Output Test Omit test.
Output Leakage Test
Omit step 5, and use
400 MHz amplifier
Auxiliary output a secondary function.
The 400 MHz amplifier bandwidth is adequate
to check leakage over the output range of 0.5
to check to 512 MHz to 512 MHz.
in step 4.
Internal Modulation Omit test. Exactness of modulation frequency not critical
Oscillator Test for most applications.
Internal Modulation Omit test
Excessive distortion will usually manifest itself
Oscillator Distortion in AM and FM distortion tests.
Test (Option 001)
AM 3 dB Bandwidth
Omit test.
Accuracy at most often used frequencies
Test checked in AM sensitivity test.
AM Distortion Test
4-36.
4-37.
4-38.
4-39.
4-40.
4-41.
4-42.
4-43.
4-44.
AM Sensitivity and
Accuracy Test
Omit step 8, but
check meter in
A spot check of meter accuracy is usually
adequate,
steps 1 to 7.
Peak Incidental Phase Omit test. Test requires access to inside of instrument.
Modulation Test Specification does not normally degrade with
time.
Demodulated Output
None
Accuracy Test
AM Phase Shift Test
Omit test.
A condition that is out of specification will
usually show up on the AM Flatness Teat also.
AM Flatness Test
Pulse Modulation Test
None
Omit steps 7 to 8.
Performance usually improves at the higher
frequencies.
Pulse On/Off Ratio Test
omit step 4
Performance usually improves at the lower
frequencies.
FM 3 dB Bandwidth Omit test. Accuracy at most often used frequencies
Test
FM Distortion Test
None
checked in FM sensitivity test.
4-45.
FM Sensitivity and
Accuracy Test
Omit steps 6 to 9,
A spot cheek of meter accuracy is usually
but check meter adequate.
in steps 1 to 5.
4-3
Page 62

Performance Tests
Model 8640B Option 004
Table 4-1. Recommended Test Abridgements (3 of 3)
Para.
No.
4-46.
4-47.
4-48.
4-49.
4-50.
Performance Test Alteration
Incidental AM Test
Counter External Sensitivity Test
Internal Reference
Accuracy Test
Internal Reference Drift
Rate (Stability) Test
Phase Lock Restabilization Time Test
Omit test.
Omit steps 3 and
4.
None
Omit test,
Omit test,
Remark
Incidental AM usually of secondary importance
and FM sensitivity test will usually show conditions that are out of specification (i.e., the first
order sidebands will be uneven),
Performance usually improves at lower
frequencies.
Drift is small in a normal lab environment.
Frequency error during the short lock acquisi-
tion time usually not significant.
4-4
Page 63

PERFORMANCE TESTS
4-12. BASIC FUNCTIONAL CHECKS
DESCRIPTION:
A minimum of commonly available test equipment is used to check the overall basic functions of the Signal
Generator.
EQUIPMENT:
Table
4-2.
Recommended Test Equipment (Basic Functional Checks)
Instrument Type
AC Voltmeter
Critical Specifications Suggested Models
Accuracy: ±1% at 0.7 Vrms
HP 400E, or
HP 34740A/34702A
Frequency Counter
Power Meter
Range: 10 MHz
Accuracy: <0.1 ppm
Frequency Range: 10 MHz to
1 GHz
HP 5326C Option 010, or
HP 5382A Option 001
HP 435A/8482A, or
HP 432A/478A
Input Level: >10 dBm
Accuracy: ±1%
Pulse Generator
output: lV into 50$2
Range: >2 kHz (waveform
HP 3311A, or
HP 8011A
not critical)
Spectrum Analyzer Range: >100 MHz
Resolution Bandwidth:
>10 kHz to <100 Hz
HP 8558B/181T, or
HP 8553B/8552A/141T, or
HP 8554B/8552A/141T
Log and linear display
PROCEDURE:
1.
Set the Signal Generator’s controls as follows. Return the controls to these initial settings before
.
starting any-section within the check.
Meter Function
COUNTER MODE: EXPAND
LOCK .
Source .
TIME BASE VERN . . .
AM
AUDIO OUTPUT LEVEL . :
MODULATION
MODULATION FREQUENCY .
FM
PEAK DEVIATION . : : :
PEAK DEVIATION Vernier .
.
.
.
.
.
.
.
.
.
.
.
.
—
. .
. .
. .
. .
. .
. .
. .
. .
. .
. .
. .
. .
.
.
.
.
.
.
.
.
.
.
.
.
. . .
. . .
. . .
. . .
. . .
. . .
. . .
. . .
. . .
. . .
. . .
. . .
.
.
.
.
.
.
.
.
.
.
.
.
—
. .
. . .
. .
. .
. .
. .
. .
. .
. .
. .
. .
. .
. .
. .
. .
. .
. .
. .
. .
FM
off
off
INT
CAL
OFF
1v
Fully CCW
1 kHz
.
OFF
. .
5 kHz
.
Fully CCW
4-5
Page 64

Performance Tests
4-12. BASIC FUNCTIONAL CHECKS (Cent’d)
Model 8640B Option 004
RANGE
FREQUENCY TUNE “ :
FINE TUNE
OUTPUT LEVEL 10 dB
OUTPUT LEVEL 1 dB
OUTPUT LEVEL Vernier
RF ON/OFF
LINE...:::
TIME BASE (rear panel)
2. Preliminary Checks:
(Refer to step 1 for initial control settings.)
Set LINE switch to OFF. The panel meter should read exactly O when viewed directly from the
a.
front.
The air filter on the rear panel should be clean.
b.
c.
Set LINE switch to ON. The lamp in the switch pushbutton should light.
The fan should be operating.
d.
e.
Set PEAK DEVIATION as indicated below. The correct SCALE annunciator should light as
shown.
. . . . . . . . . . . .
. . . . . . . . . . . .
.,. . . . . . . . . .
-
. . . . . . . . . . . .
. . . . . . . . . . . .
. . . . . . . . . . .
. . . . . . . . . . . .
. . . . . . . . . . . .
. . . . . . . . . . . .
0.5-1 MHz
. Centered
. Centered
+10 dBm
. .
0 dB
. .
CAL
. .
. .
ON
ON
. . INT
Peak Deviation Scale
f.
Set PEAK DEVIATION to 10 kHz, and FM to INT. The REDUCE PEAK DEVIATION
annunciator should light.
Set PEAK DEVIATION to 5 kHz and PEAK DEVIATION Vernier fully
g.
VERNIER annunciator should light. Return FM to OFF.
h.
Set OUTPUT LEVEL 10 dB switch fully
REDUCE PEAK POWER annunciator should’ light. Return OUTPUT LEVEL 10 dB-switch to
+10 dBm, AM to OFF, and MODULATION to fully ccw position.
Counter and Frequency Checks:
3.
(Refer to step 1 for initial control settings.)
a.
Adjust TIME BASE VERN out of CAL position. The UNCAL annunciator should light. Return
TIME BASE VERN to CAL.
5 kHz
10 kHz
20 kHz
0-5
0-10
0-3
CW. The REDUCE FM
CW. AM to INT. and MODULATION fully CW. The
4-6
Page 65

Model 8640B Option 004
PERFORMANCE TESTS
4-12. BASIC FUNCTIONAL CHECKS (Cent’d)
b.
Measure the frequency of the rear panel TIME BASE output with an accurate
frequency should be between 4,999,995 and 5,000,005 Hz (with a 2-hour
temperature between 15 and 35°C).
c.
Set RANGE and counter EXPAND as indicated below. The location of the decimal point should
be correct as shown.
Performance Tests
counter. The
warm-up and
I
At the last settings in step c, the OVERFLOW annunciator should be on.
Using RANGE and FREQUENCY TUNE controls, check each display digit for proper lighting of
the LED’s.
f.
Release X1OO EXPAND button. Press LOCK button. The displayed count should be steady and
the display should not blink.
Rotate FINE TUNE one-half turn
g.
h.
Rotate FINE TUNE one turn
i.
Rotate FREQUENCY TUNE one-half turn. Phase lock should break and the display should blink.
Range MHz
128-1024
16-128
1-16
0.5-1
0.5-1
0.5-1
I
CCW
. The display should remain unchanged.
Expand
off
off
off
off
X10
X100
CW
. The display should remain unchanged.
Decimal Point
XXXXXX
XXXXXX
XXXXXX
XXXXXX
XXXXXX
XXXXXX
Release LOCK button, set COUNTER MODE to EXT 0-10, RANGE to 0.5-1 MHz, FRE-
j.
QUENCY TUNE to fully ccw position, FINE TUNE centered, and OUTPUT LEVEL to –7 dBm.
Connect RF OUT to COUNTER INPUT. Counter should read 0.450 MHz or less (but not all
zeros).
k.
Rotate FREQUENCY TUNE to fully cw position. Counter should read 1.07 MHz or greater.
1.
Set counter reading to 0.625 MHz. Set RANGE as indicated below and note frequency displayed
for both EXT 0-10 and INT COUNTER MODE. The frequency should be correct as shown and
except for the number of significant digits displayed, should be the same for both counter modes.
4-7
Page 66

Performance Tests
PERFORMANCE TESTS
4-12. BASIC FUNCTIONAL CHECKS (Cent’d)
Model 8640B Option 004
Range (MHz)
0.5-1
1-2
2-4
4-8
8-16
Counter Reading (MHz)
0.625
1.25
2.50
5.00
10.0
m. Continue as in the preceding step except compare the counter reading for EXT 0-550 and INT
COUNTER MODE.
Range (MHz)
8-16
16-32
32-64
64-128
128-256
256-512
512-1024
Counter Reading (MHz)
10.0
20.0
40.0
80.0
160
320
(INT)
640
320 (EXT 0-550)
n. Set RANGE to 256-512 MHz and tune to 550 MHz. Counter should read 550 MHz on EXT
0-550 COUNTER MODE.
o.
Tune frequency to approximately 345 MHz. Slowly rotate FREQUENCY TUNE in a cw
direction. A faint but audible click should be heard when tuning through the range 355-357 MHz.
This is relay switching of the high band filters.
4.
Meter and Modulation Oscillator Checks:
(Refer to step 1 for initial control settings.)
a.
Set FM to INT, AM to AC, MODULATION fully CW, and Meter Function to AM. Connect FM
OUTPUT to AM INPUT through a BNC tee. Connect an ac voltmeter to the tee. Set AUDIO
OUTPUT LEVEL to 0.707 Vrms as read on the voltmeter. The generator’s front panel meter
should read between 9.6 and 10.4. Return AM to OFF.
b. Connect FM OUTPUT to COUNTER INPUT with COUNTER MODE set to EXT 0-10 and
EXPAND Xl 00. The counter should read between 980 and 1020 Hz for standard instruments,or
970 and 1030 Hz for Option 001. Record this frequency for future reference.
980
970
1030 Hz (Option 001)
1020 Hz
48
Page 67

Model 8640B Option 004
PERFORMANCE TESTS
4-12. BASIC FUNCTIONAL CHECKS (Cent’d)
For Option 001 only set MODULATION FREQUENCY to Xl and MODULATION FRE-
c.
QUENCY vernier to 100. Change MODULATION FREQUENCY range as shown below. The
counter should read within the frequency limits indicated.
MODULATION FREQUENCY Range Frequency Limits (Hz)
Performance Tests
Xl
X10
Xl00
Xlk
X3k
Output Level Checks
5.
(Refer to step 1 for initial control settings.)
a.
Set RANGE to 128-256 MHz, FREQUENCY TUNE to 190 MHz, and Meter Function to
LEVEL. Connect a power meter to RF OUT and set OUTPUT LEVEL for a front panel meter
indication of +9 dBm (+10, -1 ). The power meter should read between +7.5 and +10.5 dBm.
b.
Reduce OUTPUT LEVEL to +3 dBm as read on the panel meter. The power meter should read
between +1.5 and +4.5 dBm.
c.
Return OUTPUT LEVEL to +9 dBm as read on the power meter. Tune across all frequency
bands for which the power sensor is specified and note maximum and minimum level variations.
The level should be between +8.5 and +9.5 dBm for frequencies between 108 and 336 MHz;
between +8.25 and +9.75 dBm for other frequencies between 0.5 and 512 MHz.
6.
AM and Pulse Checks
90-110
900-1100
9,000-11,000
90,000-110,000
270,000-330,000
(Refer to step 1 for initial control settings.)
a.
Set RANGE to 64-128 MHz, FREQUENCY TUNE to 108 MHz, and OUTPUT LEVEL to
-40 dBm. Connect RF OUT to the input of a spectrum analyzer.
b.
Set analyzer controls to display the 108 MHz signal with 10 kHz or greater resolution bandwidth,
linear vertical scale, 5 to 20 kHz of display smoothing, and zero frequency span width. Check
that the signal is peaked on the display and adjust the vertical sensitivity for 4 divisions of
deflection. (It is also good to ensure that the base lime with no signal is at the bottom line of the
display.)
c.
Set AM to INT, and Meter Function to AM. Adjust MODULATION for a panel meter reading of
50%. Set the analyzer scan trigger to rodeo. The peak-to-peak amplitude on the display should
span 3.6 to 4.4 divisions centered about the fourth graticule line. The waveform should appear
undistorted.
4-9
Page 68

Performance Tests
PERFORMANCE TESTS
4.12. BASIC FUNCTIONAL CHECKS (Cent’d)
d.
Adjust MODULATION for a peak-to-peak amplitude spanning the second and sixth graticule
lines. Connect an ac voltmeter to DEMOD OUTPUT. The voltmeter should read between 0.475
and 0.525 Vrms if the internal AC/DC switch is set to DC, or between 2.37 and 2.63 Vrms if the
switch is set to AC.
Connect a pulse generator to AM INPUT and set it for an output of +lV into
e.
and 0.5 ms width. Set analyzer resolution bandwidth to 100 kHz or greater and no display
smoothing.
f.
Set AM to OFF. Check that the signal is peaked and at the fourth graticule line. Set AM to
PULSE. The level of the flat part of the pulse should be between 3.5 and 4.5 divisions.
Set AM to OFF. Adjust the analyzer to view the 108 MHz signal in the smallest resolution
bandwidth and frequency span that is reasonable, and set vertical scale to 10 dB log per division.
Step OUTPUT LEVEL down in 10 dB steps and check that the output signal decreases in 10 dB
steps to the lowest observable level on the analyzer.
Model 8640B Option 004
50
1 kHz rate,
–
7.
FM Check
(Refer to step 1 for initial control settings.)
a.
Set FREQUENCY TUNE to 1 MHz, and OUTPUT LEVEL to –37 dBm. Locate the signal on the
spectrum analyzer. Adjust the analyzer for full-scale deflection of the signal in 10 dB log per
vertical division with 100 Hz resolution bandwidth and 500 Hz to 2 kHz frequency span per
division.
b.
Set FM to INT and increase PEAK DEVIATION Vernier for a panel meter reading of 2.4 kHz
(note that the carrier decreases as peak deviation increases). The carrier signal should be down
greater than 18 dB from its original level (which corresponds to a peak deviation accuracy of
± l0%).
To obtain a more accurate measurement, adjust PEAK DE VIATION Vernier
for a carrier null. The panel meter should read 2.405 times the modulation
rate measured in step 4b (± 10%). The above steps may also be repeated for
other carrier frequencies.
NOTE
4-10
Page 69

Model 8640B Option 004
Performance Tests
PERFORMANCE TESTS
Table 4-3. Record of Basic Functional Checks (1 of 2)
Step
2.
Preliminary Checks
a.
Meter mechanical zero
b.
Clean air filter
LINE ON/OFF lamp
c.
Description
d. Fan
e.
SCALE annunciators:
0-5
0-10
0-3
f.
REDUCE PEAK DEVIATION annunciator
REDUCE FM VERNIER annunciator
g.
h.
REDUCE PEAK POWER annunciator
3. Counter and Frequency Checks
a.
Time base UNCAL annunciator
b.
Time base accuracy
c.
Decimal point
OVERFLOW annunciator
d.
e.
Frequency display LED’s
f.
Phase lock achieved
Phase lock range
g.
Phase lock range
h.
Phase lock broken
i.
Low frequency range
j.
k.
High frequency range
1.
Band check and counter sensitivity
0.5-16 MHz
m. Band check and counter sensitivity
16-1024 MHz
n.
Counter high frequency sensitivity
o.
High band/low band switch
.
4.
Meter and Modulation Oscillator Checks
a.
Panel meter accuracy
b.
Modulation oscillator frequency accuracy
1 kHz
4-11
Page 70

Performance Tests
BASIC FUNCTIONAL CHECKS (Cont’d)
Table 4-3. Record of Basic Functional Checks (2 of 2)
Model 8640B Option 004
PERFORMANCE TESTS
Step
4.
5.
6.
Description
Meter and Modulation Oscillator Checks (Cent’d)
Modulation oscillator frequency accuracy
c.
(Option 001): Xl
X10
Xl00
Xlk
X3k
Output Level Checks
a.
Output level accuracy
b.
Output level accuracy
c.
Output level flatness
108 to 336 MHz
0.5 to 512 MHz
AM and Pulse Checks
c.
AM accuracy and distortion
d.
DEMOD OUTPUT accuracy
f.
Pulse level accuracy
Output attenuator
g.
4-12
7.
FM Check
FM accuracy
b.
Page 71

Model 8640B Option 004
Performance Tests
PERFORMANCE TESTS
4-13. FREQUENCY RANGE TEST
SPECIFICATION:
Range: 500 kHz to 512 MHz in 10 octave bands.
Bands and Band Overlap: Bands extend 10% below and 7% above the nominal limits shown below.
Nominal
Frequency
Bands
(MHz)
Frequency
(Range (MHz)
(with overlap)
0.51
1-2
2-4 4-8
8-16
16-32
32-64 128
64- 128-
256
0.45 0.9 1.8 3.6 7.2 14.4 28.8 57.5 115
to
1.07
2.1
4.2
8.5
to to to to to to
17.1 34.3 68.7 137.5 275
256-
512
230 230 to 550
550 ternalDoubler)
External
Doubler Band
512-1024
(without Ex-
DESCRIPTION:
The frequency range is verified by using a frequency counter to measure the frequency at the low and high
ends of each band. (See Table 4-1. Recommended Test Abridgements. )
EQUIPMENT:
HP 5327C
Frequency Counter . . . . . . . . . . . .
.
PROCEDURE:
1.
Connect generator's AUX RF OUTPUT jack (located on rear panel) to
frequency counter’s 50 ohm
input after setting Signal Generator’s controls as follows:
COUNTER MODE: EXPAND . . . . . . . . .
LOCK . . . . . . . . . .
Source . . . . . . . . . .
AM . . . . . . . . . . . . . . . . .
. . .
. . . off
. . . INT
. . . OFF
FM
RANGE-:::::::::: ::::::
FREQUENCY TUNE . . . . . . . . . .. . .
FINE TUNE . . . . . . . . . . . . . .
RF ON/OFF . . . . . . . . . . . . . .
Set FREQUENCY TUNE fully ccw. The frequency counter should read 230 MHz or less.
2.
256-512 MHz
. .
. .
. . . ON
off
. OFF
Fully CW
Centered
Set FREQUENCY TUNE fully
3.
CW. The frequency counter should read
230.0 MHz
550 MHz or greater.
550.0 MHz
4-13
Page 72

Performance Tests
PERFORMANCE TESTS
4-13. FREQUENCY RANGE TEST (Cent’d)
4.
Set RANGE as shown below and check frequency at high and low ends of each band.
Model 8640B Option 004
Range (MHz)
512-1024
128-256
64-128
32-64
16-32
8-16
4-8
2-4
1-2
0.5-1
4-14. FREQUENCY ACCURACY AND FINE TUNE TEST
Low End
<230.0 MHz
<115.0
<57.50 MHz
<28.80 MHz
<14.40 MHz
<7.200 MHz
<3.600 MHz
<1.800 MHz
<0.900 MHz
<0.450 MHz
MHz
SPECIFICATION:
Accuracy:
Total
Counter
I
I
Reference
High End
>550.0 MHz
>275.0 MHz
>137.5 MHz
>68.70 MHz
>34.30 MHz
>17.10 MHz
>8.500 MHz
>4.200 MHz
>2.100 MHz
>1.070 MHz
I
Internal Reference Error: <t 2 ppm (when calibrated at 25° C every 3 months and operated between
15° C and 35” C).
When phase locked, Counter Resolution error is eliminated.
Fine Tuning: Unlocked, >1000 ppm total range. Locked mode, >± 20 ppm by varying internal time base
vernier.
DESCRIPTION:
Frequency accuracy is checked (using the Signal Generator’s internal reference) by comparing the
generator’s counter indication to the frequency reading on an external frequency counter. The fine tune
range is also checked with the external counter. (See Table 4-1. Recommended Test Abridgements.)
EQUIPMENT:
Frequency Counter . . . . . . . . . HP 5327C Option H49
PROCEDURE:
Connect generator’s AU. RF OUTPUT jack (located on rear panel) to frequency counter’s input after
1.
setting Signal Generator’s controls as follows:
4-14
Page 73

Model 8640B Option 004
Performance Tests
PERFORMANCE TESTS
4-14. FREQUENCY ACCURACY AND FINE TUNE TEST (Cont’d)
COUNTER MODE: EXPAND . . . . . . . . . . . . X100
LOCK . . . . . . . . . . . .. Off
Source . . . . . . . . . . . ..INT
AM . . . . . . . . . . . . . . . . . . .. OFF
FM
RANGE:::::::::: :::::::
OFF
32-64 MHz
FREQUENCY TUNE . . . . . . . . . . . . . . 50 MHz
RF ON/OFF . . . . . . . . . . . . . . . . ..ON
Allow Signal Generator and frequency counter to stabilize for two hours.
2.
Set frequency counter time base to give at least one more digit resolution than the generator’s counter.
3.
The difference in reading between the two counters should be <110 Hz (2 ppm + last digit uncertainty
of 10 Hz).
110 Hz
Set COUNTER MODE EXPAND to X10 and LOCK to ON. Allow one minute to acquire phase lock.
4.
Increase the frequency counter resolution by 10. The difference in counter readings should be
<100 Hz (2 ppm).
Note frequency counter reading. Turn TIME BASE VERN control ccw until it just leaves the detent
5.
position. The frequency counter should now read >1 kHz (> 20 ppm) higher than the reading noted
above.
1 kHz
Turn TIME BASE VERN fully
6.
CCW. The frequency counter should now read> 1 kHz (> 20 ppm) lower
than the reading first noted in step 5.
1 kHz
Set TIME BASE VERN to CAL (fully
8.
Set FINE TUNE fully
CW. Note frequency counter reading, then set FINE TUNE fully CCW. The
CW). Set COUNTER MODE LOCK to Off.
frequency counter should read >50 kHz (1000 ppm) lower than the reading noted above.
50 kHz
100 Hz
4-15
Page 74

Performance Tests
Model 8640B Option 004
PERFORMANCE TESTS
4-15. FREQUENCY STABILITY VS TIME AND RESTABILIZATION TIME TEST
SPECIFICATION:
Stability vs Time (after 2 hour warmup): <10 ppm/10min (normal mode).
Restabilization Time (normal mode):
After frequency change: <15 min.
After band change: none.
After 1 min. in RF OFF mode: <10 min.
]
NOTE
Stability specifications for phase lock mode are determined by counter time
base reference. See the internal reference tests.
DESCRIPTION:
A frequency counter, digital to analog converter, and strip-chart recorder are used to measure the frequency
drift after warm-up and restabilization time. (See Table 4-1. Recommended Test Abridgements.)
NOTE
For these tests, ambient room temperature and line voltage must not change.
Figure 4-1. Frequency Stability us Time and Restabilization Time Test Setup
EQUIPMENT:
Frequency Counter . . . . . . . . .
HP 5327C Option 003
Digital to Analog Converter . . . . . . . . HP 581A Option 002
Recorder (for D/A Converter) . . . . . . . . . . . HP 680
PROCEDURE:
1.
Connect equipment as shown in Figure 4-1 after setting Signal Generator’s controls as follows:
1
This specification applies only if the RF ON/0FF switch has been wired to turn the RF Oscillator off.
4-16
Page 75

Model 8640B Option 004
Performance Tests
PERFORMANCE TESTS
4-15. FREQUENCY STABILITY VS TIME AND RESTABILIZATION TIME TEST (Cont’d)
COUNTER MODE: EXPAND . . . . . . . . . . . . Off
LOCK . . . . . . . . . . . .. Off
Source . . . . . . . . . . . ..INT
AM . . . . . . . . . . . . . . . . . . .. OFF
FM
RANGE:::::::::: :::::::
OFF
32-64 MHz
FREQUENCY TUNE . . . . . . . . . . . . . . 50 MHz
RF ON/OFF . . . . . . . . . . . . . . . ..ON
2.
Set frequency counter to read frequency directly (i.e., not divided down). Use a 1s gate time so that
the last three digits span from 000 to 999 Hz.
Calibrate the recorder for a zero to full-scale reading that corresponds to a 000 to 999 Hz reading of
3.
the frequency counter’s last three digits (i.e., 1 kHz full scale).
4.
Warm up the equipment for two hours. Establish a reference on the recorder and record the
generator’s output frequency for 10 minutes. The frequency change in 10 minutes should be <500 Hz
(half of full scale).
5.
Set the FREQUENCY TUNE control fully ccw and back again to approximately 50 MHz. After 15
minutes record the frequency for 10 minutes. The frequency change in 10 minutes should be
<500 Hz.
Set RANGE to 16-32 MHz and record the frequency for 10 minutes. The frequency change in 10
6.
minutes should be <250 Hz.
Set RANGE to 32-64 MHz and set RF ON/OFF to OFF. After one minute set RF ON/OFF to ON.
7.
Record the frequency for 10 minutes. The frequency change for 10 minutes should be <500 Hz.
NOTE
If the instrument has been wired to switch the RF Oscillator off (with RF
ON/OFF switch), wait 10 minutes after switching RF mode to ON before
continuing with step 7.
500 Hz
500 Hz
250 Hz
500 Hz
4-17
Page 76

Performance Tests
Model 8640B Option 004
PERFORMANCE TESTS
4-16. FREQUENCY STABILITY VS TEMPERATURE TEST
SPECIFICATION:
Stability vs Temperature: <50ppm/°C (normal mode).
NOTE
Stability specifications for phase lock mode are determined by counter time
base reference. See the internal reference tests.
DESCRIPTION:
A frequency counter is used to measure drift as temperature is changed. A temperature controlled chamber
is used to vary the temperature. (See Table 4-1. Recommended Test Abridgements.)
Figure 4-2. Frequency Stability vs Temperature Test Setup
EQUIPMENT:
Frequency Counter . . . . . . . . . . . . . . HP 5327C
Temperature Controlled Chamber . . . . . . Statham Model 325
PROCEDURE:
Connect equipment as shown in Figure 4-2 after setting Signal Generator’s controls as follows:
1.
COUNTER MODE: EXPAND . . . . . . . . . . . . Off
LOCK . . . . . . . . . . . .. Off
Source . . . . . . . . . . . ..INT
AM . . . . . . . . . . . . . . . . . . .. OFF
FM
RANGE . . . . . . . .
. . . . . . . . . . . . . . OFF
32-64 MHz
FREQUENCY TUNE . . . . . . . . . . . . . . 50 MHz
RF ON/OFF . . . . . . . . . . . . . . . ..ON
2.
Set temperature controlled chamger for 15° C. Allow Signal Generator to stabilize for two hours. Then
note frequency counter reading.
Set chamber for 35° C. Again, allow Signal Generator to stabilize for two hours. Frequency change
3.
-
from reading noted in step 2 should be less than 50 kHz.
4-18
50 kHz
Page 77

Model 8640B Option 004
PERFORMANCE TESTS
4-17. FREQUENCY STABILITY VS LINE VOLTAGE TEST
SPECIFICATION:
Stability vs Line Voltage (+5% to –10% line voltage change): <1 ppm (normal mode).
NOTE
Stability specifications for phase lock mode are determined by counter time
base reference. See the internal reference tests.
DESCRIPTION:
A frequency counter is used to measure frequency shift line voltage is changed +5% to -10%o. (See Table
4-1.
Recommended Test Abridgements.)
Figure 4-3. Frequency Stability vs Line Voltage Test Setup
EQUIPMENT:
Frequency Counter . . . . . . . . . . . . . HP5327C
Variable Voltage Transformer . . . . . . . . . GR W5MT3A
PROCEDURE:
1.
Connect equipment as shown in Figure 4-3 after setting Signal Generator’s controls as follows:
follows:
AM. . . . . . . . . . . . . . . . . . .. OFF
FM
RANGE:::::::::: :::::::
OFF
32-64 MHz
FREQUENCY TUNE . . . . . . . . . . . . . . 50 MHz
RF ON/OFF . . . . . . . . . . . . . . . ..ON
2.
Set variable voltage transformer 5% above the nominal voltage set on generator’s line power module
(e.g., if nominal line voltage is 120 Vat, set transformer for 126 Vat). Note frequency counter reading.
3.
Set variable voltage transformer 10% below nominal line voltage (e.g., for a nominal 120 Vat, set
transformer for 108 Vat), then note counter’s reading. The frequency change from the reading noted
in step 2 should be <50 Hz (i.e., <1 ppm).
50 Hz
4-19
Page 78

Performance Tests
Model 8640B Option 004
PERFORMANCE TESTS
4-18. FREQUENCY STABILITY VS LOAD, LEVEL, AND MODE TEST
SPECIFICATION:
Stability vs Load (with any passive load change): <1 ppm.
Stability vs Level Change: <1 ppm.
Stability vs Modulation Mode Change (CW to FM): <1’% of selected peak deviation or <200 Hz, whichever
is greater.
DESCRIPTION:
A frequency counter is used to measure frequency shift as the output load is changed by means of an
adjustable stub, as RF OUTPUT LEVEL is changed 6 dB, and as modulation mode is changed from CW to
FM. The frequency is monitored at the rear panel auxiliary RF output jack. (See Table 4-1. Recommended
Test Abridgements.)
Figure 4-4. Frequency Stability us Load, Level, and Mode Test Setup
EQUIPMENT
:
Frequency Counter
Adapter (Male Type N to GR 874) : : : : : : : :
Adjustable Stub . . . . . . . . .
General Radio 874-DSOL
HP 5327C
HP 1250-0874
PROCEDURE;
1.
Connect equipment as shown in Figure 4-4 after setting Signal Generator’s controls as follows:
AM . . . . . . . . . . . . . . . . . . .. OFF
FM
OFF
RANGE::::::::: ::::::: 256-512 MHz
FREQUENCY TUNE..... . . . . . . . .
OUTPUT LEVEL Switches . . . . . . . . . . .
512 MHz
+16 dBm
OUTPUT LEVEL Vernier . . . . . . . . . . . . . CAL
RF ON/OFF . . . . . . . . . . . . . . . ..ON
2.
Slowly slide adjustable stub through its range and note maximum and minimum counter readings. The
difference in counter readings should be less than 512 Hz,
512 Hz
4-20
Page 79

Model 8640B Option 004
Performance Tests
PERFORMANCE TESTS
4-18. FREQUENCY STABILITY VS LOAD, LEVEL, AND MODE TEST (Cont’d)
3.
Remove adjustable stub, note frequency counter reading, then set OUTPUT LEVEL 10 dB switch one
step ccw. Again, note frequency counter reading. It should have changed less than 512 Hz.
With FM switch set to OFF, note the frequency counter reading. Set PEAK DEVIATION switch to
4.
10 kHz and PEAK DEVIATION vernier fully clockwise. Set FM to AC and again, note frequency
counter reading. It should have changed less than 200 Hz.
Repeat step 4 with PEAK DEVIATION set as shown below. The frequency change should be as
5.
specified.
512 Hz
200 Hz
peak Deviation
20 kHz
40 kHz
80 kHz
160 kHz
320 kHz
640 kHz
1.28 MHz
2.56 MHz
Frequency Change
<200 Hz
<400 Hz
<800 Hz
<1.6 kHz
<3.2 kHz
<6.4 kHz
<12.8 kHz
<25.6 kHz
4-19. HARMONICS TEST
SPECIFICATIONS:
Harmonics: (on 1V, +10 dBm output range and below)
>35 dB below fundamental of 0.5 to 128 MHz,
>30 dB below fundamental of 128 to 512 MHz.
DESCRIPTION:
A spectrum analyzer is used to measure harmonics as the Signal Generator is tuned from 0.5 to 512 MHz.
EQUIPMENT:
Spectrum Analyzer . . . . . . . . . HP 141T/8552B/8554B
4-21
Page 80

Performance Tests
Model 8640B Option 004
PERFORMANCE TESTS
4-19. HARMONICS TEST (Cont’d)
PROCEDURE:
Connect generator’s RF OUTPUT to analyzer’s input after setting Signal Generator’s controls as
1.
follows:
Meter Function
COUNTER MODE: EXPAND . . . . . . . . . . . . . . . . .
LOCK . . . . . . . . . . . . .
LEVEL
off
off
Source . . . . . . . . . . . . .INT
AM . . . . . . . . . . . . . . . . . . .. OFF
FM
RANGE . . . . . . . . . . . . . . . . . . . . . . . . . . . . .
. OFF
0.5-1 MHz
FREQUENCY TUNE . . . . . . . . . . . . . .0.5 MHZ
OUTPUT LEVEL Switches . . . . . . . . . . .
+10 dBm
OUTPUT LEVEL Vernier . . . . . . . . . . . . . CAL
RF ON/OFF . . . . . . . . . . . . . . . ..ON
Set spectrum analyzer to measure harmonics 35 dB below the fundamental from 0.5 to 2 MHz. Set
2.
input attenuation to 50 dB, resolution bandwidth to 100 kHz, frequency span per division (scan
width) to 1 MHz, scale to log (10 dB/div), and scale reference level to +10 dBm. Adjust analyzer’s
frequency controls to set O Hz to the left edge of the display.
NOTE
If 50 dB of analyzer input attenuation is not available, use an external
attenuator such as the Model 355D.
Slowly tune Signal Generator to 1 MHz, checking that all harmonics are more than 35 dB below the
3.
fundamental.
35 dB
4-22
NOTE
If any harmonic below 512 MHz appears to be out of specification, remove
any possible analyzer error and remeasure the harmonic as follows:
a. Tune the generator to the frequency of the harmonic.
b. Using the analyzer’s IF attenuator, step the signal down 30 dB on the
display and note the –30 dB point on the display.
c. Step the IF attenuator up 30 dB and retune the generator to its original
setting.
d. Using the –30 dB point noted on the display as a reference, remeasure
the harmonic.
.
Page 81

Model 8640B Option 004
Performance Tests
PERFORMANCE TESTS
4-19. HARMONICS TEST (Cont’d)
4.
Set
spectrum analyzer and Signal Generator as shown below. On each range, set FREQUENCY TUNE
to the low end of the band and use analyzer’s frequency controls to set the fundamental to the left
edge of the display. Keeping the fundamental near the left edge of the display, tune FREQUENCY
TUNE to the high end of the band. All harmonics should be as specified.
NOTE
On
bands 8-16 MHz and above, check for harmonics while tuning down in
frequency. For frequencies above 500 MHz, tune analyzer to observe second
harmonic.
Spectrum Analyzer
Resolution Bandwidth
100 kHz
100 kHz
100 kHz
300 kHz
300 kHz
300 kHz
300 kHz
300 kHz
300 kHz
Freq. Span Per Division
1 MHz
2 MHz
5 MHz
10 MHz
20 MHz
50 MHz
100 MHz
100 MHz
100 MHz
Range
1-2 MHz
2-4 MHz
4-8 MHz
8-16 MHz
16-32 MHz
32-64 MHz
64-128 MHz
128-256 MHz
256-512 MHz
Signal Generator
Harmonics Down
>35 dB
>35 dB
>35 dB
>35 dB
>35 dB
>35 dB
>35 dB
>30 dB
>30 dB
4-20. SUB-HARMONICS AND NON-HARMONIC SPURIOUS TEST
SPECIFICATIONS:
Sub-Harmonics and Non-Harmonic Spurious: (excluding frequencies with 15 kHz of carrier whose effects
are specified under Residual AM and FM) >100 dB below carrier.
DESCRIPTION:
A notch filter is used to remove the fundamental. All non-harmonic spurious and sub-harmonics are then
amplified and measured with a spectrum analyzer. (See Table 4-1. Recommended Test Abridgements.)
4-23
Page 82

Performance Tests
PERFORMANCE TESTS
4-20. SUB-HARMONICS AND NON-HARMONIC SPURIOUS TEST (Cont’d)
Figure 4-5. Sub-Harmonics and Non-Harmonic Spurious Test Setup
EQUIPMENT:
520/1040 MHz Notch Filter . . . . . . . . . HP 08640-60502
10dB Step Attenuator . . . . . . . . . . . .
20dB Amplifier . . . . . . . . . . . . . . HP 8447A
Spectrum Analyzer . . . . . . . . . HP 141 T/8552B/8554B
Model 8640B Option 004
HP 355D
PROCEDURE:
1.
Connect equipment as shown in Figure 4-5 after setting Signal Generator’s controls as follows:
Meter Function
COUNTER MODE:
ExPAND:::::::: :::.
LOCK . . . . . . . . . . . . .
LEVEL
off
off
Source . . . . . . . . . . . . .INT
AM, . . .
FM
RANGE “ : : :
FREQUENCY TUNE..... . . . . . . . .
OUTPUT LEVEL Switches . . . . . . . . . . .
. . . . . . . . . . . . . . . . OFF
. . . . . . . . . . . . . . . . OFF
. . . . . . . . . . . . . 128-256 MHz
260 MHz
+10 dBm
OUTPUT LEVEL Vernier . . . . . . . . . . . . . CAL
RF ON/OFF . . . . . . . . . . . . . . ..ON
2.
Set step attenuator to 60 dB. Set analyzer’s input attenuation to 0 dB, scale switch to log (10 dB/div),
and reference level controls to
-30 dBm; set resolution bandwidth to 30 kHz, frequency span per
division (scan width) to 1 MHz, and tune the frequency controls to set 260 MHz at the center of the
display. Adjust reference level vernier to set signal peak to top (reference) graticule line on display.
Set generator’s RANGE switch to 256-512 MHz. Tune analyzer to display the 520 MHz signal (i.e., the
3.
second harmonic of 260 MHz).
Tune generator’s FREQUENCY TUNE for a minimum signal on analyzer’s display. Set the step
4.
attenuator to O dB, and again tune FREQUENCY TUNE for a minimum signal.
The signal on the display should be below the top (reference level) graticule line. Tune the spectrum
5.
analyzer slowly to 500 kHz. All non-harmonic spurious signals, and
-sub
-harmonics should be below
the –40 dB graticule on the display (> 100 dB down).
40 dB
4-24
Page 83

Model 8640B Option 004
Performance Tests
PERFORMANCE TESTS
4-21. SINGLE SIDEBAND PHASE NOISE TEST
SPECIFICATION:
SSB Phase Noise at 20 kHz Offset from carrier:
(Averaged rms noise level below carrier stated in a 1 Hz bandwidth.)
256 MHz to 512 MHz: >130 dB from 230 to 450 MHz increasing linearly to >122 dB down at
550 MHZ.
0.5 MHz to 256 MHz: Decreases approximately 6 dB for each divided frequency range until it reaches
SSB Broadband Noise Floor of >130 dB.
DESCRIPTION:
Phase noise is measured with a spectrum analyzer. A reference signal generator and a mixer are used to
down-convert the test Signal Generator’s CW signal to O Hz (the two signal generators are phase locked
together). Then the spectrum analyzer measures SSB phase noise at a 20 kHz offset from the carrier.
NOTE
This test measures the total SSB phase noise of both generators. Therefore,
the reference signal generator must have SSB phase noise that is less than or
equal to the specification for the test generator.
Figure 4-6. Single Sideband Phase Noise Test Setup
4-25
Page 84

Performance Tests
Model 8640B Option 004
PERFORMANCE TESTS
4-21. SINGLE SIDEBAND PHASE NOISE TEST (Cont’d)
EQUIPMENT:
Reference Signal Generator . . . . . . . . . . . HP 8640A
Mixer . . . . . . . . . . . . . . . . . .HP 10514A
10dB Step Attenuator . . . . . . . . . . . . HP 355D
40 dB Amplifier . . . . . . . . . . . . HP 08640-60506
Oscilloscope . . . . . . . . . . . HP 180A/1801A/1820C
Spectrum Analyzer . . . . . . . . . HP 141T/8552B/8556A
Noise Phase Lock Circuit . . . . . . . . . . HP 08640-60504
PROCEDURE:
Connect equipment as shown in Figure 4-6 after setting test Signal Generator’s controls as follows:
1.
Meter Function
LEVEL
COUNTER MODE: EXPAND : : : : : : : : : : : . off
LOCK . . . . . . . . . . . . . off
Source . . . . . . . . . . . . .INT
AM . . . . . . . . . . . . . . . . . . .. OFF
FM
. . . . . . . . . . . . .
OFF
PEAK Deviation ... . . . . . . . . . 5 kHz
PEAK DEVIATION Vernier . . . . . . . . . . . .
RANGE
FREQUENCY TUNE” : : : : : : : : : : : : .
Fully CW
256-512 MHz
550 MHz
OUTPUT LEVEL switches . . . . . . . . . . . . –7 dBm
OUTPUT LEVEL Vernier . . . . . . . . . . . . . CAL
RF ON/OFF . . . . . . . . . . . . . . . ..ON
2.
Set analyzer’s input level control to -40 dBm, resolution bandwidth to 1 kHz, dBm/dBV control to
dBm 50 ohm, span width per division (scan width) to 5 kHz, and center frequency controls to 20 kHz.
Set display reference level to -40 dBm (at 10 dB per division). Using analyzer’s 20 kHz markers,
measure and note 20 kHz on the display.
3.
Set oscilloscope’s volts/div control to 0.02 and time/div control to 50 µs; set the input to measure dc.
Set 10 dB step attenuator to 80 dB. Set 40 dB amplifier’s input impedance switch to 50 ohms.
4.
Set reference signal generator for a 549.98 MHz, CW signal at +13 dBm (i.e., 20 kHz below test
generator’s frequency). Fine adjust its frequency for a 20 kHz signal on analyzer’s display. Adjust
analyzer’s display reference level controls so that the 20 kHz signal is 4.3 dB below the top (reference)
graticule line.
4-26
NOTE
The correction factors for this measurement are as follows:
a. The DSB to SSB transfer is 6 dB because the mixing process translates
two correlated 1 kHz BW portions of the noise into the 1 kHz BW of the
analyzer - giving twice the effective noise voltage.
Page 85

Model 8640B Option 004
Performance Tests
PERFORMANCE TESTS
4-21. SINGLE SIDEBAND PHASE NOISE TEST (Cont'd)
NOTE (Cont’d)
b. +2.5 dB because noise is average detected after logging’.
c. -0.8 dB. Effective noise BW is 1.2 x 3 dB BW which gives -0.8 dB
-10 log (actual 3 dB BW/nominal 3 dB BW)’.
Summing the correction factors gives -4.3 dB -1 O log (actual 3 dB
B W/nominal 3 dB BW) or approximately -4.3 dB ±1 dB.
Phase lock the generators by setting test generator’s FM switch to DC and by tuning reference signal
5.
generator to 550 MHz (i.e., for a difference frequency of O Hz). Monitor phase lock on oscilloscope,
checking that mixer’s output is 0 Vdc (if it is not, fine tune reference generator until it is).
Set analyzer’s display smoothing (video filter) to 10 Hz. Set step attenuator to 0 dB. The top
6.
(reference) graticule line on analyzer’s display represents 110 dB/Hz below carrier level (the transfer
from a 1 kHz BW to a 1 Hz BW is 30 dB). The average noise level on the display should be >12 dB
below top graticule line at 20 kHz (i.e., > 122 dB below carrier).
12 dB
NOTE
Set oscilloscope to check for possible line-related signals in test setup. They
should be <10 m Vp-p.
Set test Signal Generator to 450 MHz and FM switch to OFF. Set reference signal generator to
7.
449.98 MHz (i.e., 20 kHz below the test generator’s frequency). Repeat steps 2 through 6. The average
noise level on the display should be >20 dB below top graticule line at 20 kHz.
20 dB
NOTE
SSB phase noise can be checked at any other frequency
550 MHz by following the procedures given above.
from 230 kHz to
Noise decreases
approximately 6 dB per each octave band change down to -130 dB below
carrier.
4-22. SINGLE SIDEBAND BROADBAND NOISE FLOOR TEST
SPECIFICATION:
SSB Broadband Noise Floor at greater than 1 MHz offset from carrier (averaged rms noise level below
carrier stated in a 1 Hz bandwidth ): >130 dB down.
1
See Hewlett-Padmrd Application Note 160-4, Spectrum Analysis - Noise Measurement.
4-27
Page 86

Performance Tests
Model 8640B Option 004
PERFORMANCE TESTS
4-22. SINGLE SIDEBAND BROADBAND NOISE FLOOR TEST (Cont’d)
DESCRIPTION:
A spectrum analyzer is used to measure the broadband noise floor (a reference signal generator and a mixer
are used to down-convert the test Signal Generator’s RF output and noise to within the range of the
spectrum analyzer). A reference level is set on the analyzer with a 5 kHz signal, the signal is changed to
1 MHz and removed from the analyzer with a filter, and the broadband noise floor is measured.
Figure 4-7. Single Sideband Broadband Noise Floor Test Setup
EQUIPMENT:
Reference Signal Generator . . . . . . . . . . . HP 8640A
Mixer
HP 10514A
15 kHz Low-Pass Filter (LPF) “ : : : : : : : : CIR-Q-TEL 7 pole
10dB Step Attenuator . . . . . . . . . .
HP 355D
40 dB Amplifier . . . . . . . . . . . HP 08640-60506
Spectrum Analyzer . . . . . . . . . HP 141T/8552B/8556A
PROCEDURE:
1.
Connect equipment as shown in Figure 4-7 after setting test Signal Generator’s controls as follows:
Meter Function
COUNTER MODE: EXPAND : : : : : : : : : : : .
LEVEL
off
LOCK . . . . . . . . . . . .. Off
Source . . . . . . . . . . . . .INT
AM . . . . . . . . . . . . . . . . . . .. OFF
FM
OFF
RANGE:::::::::: ::256-512MHz
FREQUENCY TUNE . . . . . . . . . . . . 500.000 MHz
OUTPUT LEVEL Switches . . . . . . . . . . . . -7 dBm
OUTPUT LEVEL Vernier . . . . . . . . . . . . . CAL
RF ON/OFF . . . . . . . . . . . . . . . ..ON
2.
Set 10 dB step attenuator to 80 dB. Set reference signal generator for a 500.005 MHz (i.e., 5 kHz
above the test generator’s frequency ), CW signal at +13 dBm (output vernier maximum
CW). Set 40 dB
amplifier’s input impedance switch to 50 ohms.
4-28
Page 87

Model 8640B Option 004
Performance Tests
PERFORMANCE TESTS
4-22. SINGLE SIDEBAND BROADBAND NOISE FLOOR TEST (Cont’d)
3. Set spectrum analyzer’s resolution bandwidth to 1 kHz, set input level control to –40 dBm and
dBm/dBV to dBm 50 ohm, and adjust frequency controls to set the 5 kHz difference frequency in the
center of the display. Set analyzer’s display reference level controls for 10 dB per division with the
5 kHz difference signal 1.3 dB from the top (reference) graticule line on the display.
NOTE
The correction factors for this measurement are as follows:
a. The DSB to SSB transfer is –3 dB because the mixing process translates
two uncorrelated 1 kHz BW portions of the noise into the 1 kHz BW of the
~
analyzer - giving
b, +2.5 dB because noise is average detected after logging
c.
-0.8 dB. Effective noise BW is 1.2 x 3 dB BW which gives -0.8 dB
times the effective noise voltage.
1
.
–10 log (actual 3 dB BW/nominal 3 dB B W)’.
Summing the correction factors gives -1.3 dB -10 log (actual 3 dB
BW/nominal 3 dB BW) or approximately -1.3 dB ±1 dB.
4. Change reference signal generator’s output frequency to 501.00 MHz. Set 10 dB step attenuator to
O dB. Set analyzer’s display smoothing (video filter) to 10 Hz. The top graticule line on analyzer’s
display represents —110 dB (the transfer from a 1 kHz BW to a 1 Hz BW is 30 dB). The average noise
level on the display should be> 20 dB below the top graticule line (i.e., > 130 dB below carrier).
20 dB
NOTE
If the test generator appears to be out of specification, check for excessive
noise in the test setup by disconnecting the test generator. The noise level on
the analyzer’s display should decrease at least 10 dB.
4-29
Page 88

Performance Tests
4-23. RESIDUAL AM TEST
SPECIFICATION:
Residual AM: (Averaged rms)
Model 8640B Option 004
PERFORMANCE TESTS
Post-detection Noise Bandwidth
300 Hz to 3 kHz
>85 dB down
20 Hz to 15 kHz
>78 dB down
DESCRIPTION:
An rms voltmeter is calibrated with a measured amount of amplitude modulation from the Signal
Generator. Then the AM is removed and the generator’s residual AM is read directly from the voltmeter.
(See Table 4-1. Recommended Test Abridgements.)
Figure 4-8. Residual AM Test Setup
EQUIPMENT:
RMS Voltmeter . . . . . . . . . . . . . . HP 3400A
Detector
3 kHz Low-Pass Filter(LPF) . . . . . . . . . . . . . . . . . . . . “
CIR-Q-TEL 5 Pole
HP 8471A
15 kHz Low-Pass Filter (LPF) . . . . . . . . CIR-Q-TEL 7 Pole
40 dB Amplifier . . . . . . . . . . . . . .
HP 465A
Capacitor 5~F . . . . . . . . . . . . . . HP 0180-2211
50 Ohm Load . . . . . . . . . . . . . . .HP 11593A
PROCEDURE:
Connect equipment as shown in Figure 4-8 (with the generator connected to
1.
through the detector, amplifier, 15 kHz LPF, and across the 50 ohm load). Set
controls as follows:
4-30
the rms voltmeter
Signal Generator’s
Page 89

4-23.
4-24.
4-31
Page 90

Performance Tests
Model 8640B Option 004
PERFORMANCE TESTS
4-24. RESIDUAL FM TEST (Cent’d)
DESCRIPTION:
An FM discriminator is used to measure FM deviation (a reference signal generator and a mixer are used to
down-convert the test Signal Generator’s RF output to within the range of the discriminator). The
discriminator output is filtered and amplified and then measured with a voltmeter. The voltmeter reading,
in mVrms, is proportional to the rms frequency deviation of the residual FM. (See Table 4-1.
Recommended Test Abridgements.)
NOTE
This test measures the total residual FM of both generators. Therefore, the
reference generator must have residual FM that is less than or equal to the
specification for the test generator.
Figure 4-9. Residual FM Test Setup
EQUIPMENT:
FM Discriminator . . . . . . . . . . . . . . HP 5210A
Filter Kit . . . . . . . . . . . . . . . .HP 10531A
RMS Voltmeter . . . . . . . . . . . . . HP 3400A
40dB Amplifier . . . . . . . . . . . . . . HP 465A
Capacitor5 µF . . . . . . . . . . . . . . HP 0180-2211
Reference Signal Generator . . . . . . . . . . . HP 8640A
Mixer
HP 10514A
3 kHz Low-Pass Filter (LPF) “ : : : : : : : : “CIR-Q-TEL 5 Pole
15 kHz Low-Pass Filter (LPF) . . . . . . . . CIR-Q-TEL 7 Pole
50 0hm Load . . . . . . . . . . . . . .. HP 11593A
PROCEDURE:
1.
Connect equipment as shown in Figure 4-9 after setting test Signal Generator’s controls as follows:
Meter Function
COUNTER MODE: EXPAND : : : : : : : : : : : .
LEVEL
OFF
LOCK . . . . . . . . . . . .. Off
Source . . . . . . . . . . . . .INT
AM . . . . . . . . . . . . . . . . . . .. OFF
FM . . . . . . . . . . . . . . . . . . ..AC
4-32
Page 91

Model 8640B Option 004
Performance Tests
PERFORMANCE TESTS
4-24. RESIDUAL FM TEST (Cent’d)
PEAK DEVIATION . . . . . . . . . . . . . .320kHz
PEAK DEVIATION Vernier . . . . . . . . . . . .
RANGE
FREQUENCY TUNE” : : : : : : : : : : : : .
Fully
CW
256-512 MHz
500 MHz
OUTPUT LEVEL Switches . . . . . . . . . . . . -7 dBm
OUTPUT LEVEL Vernier . . . . . . . . . . . . . CAL
RF ON/OFF . . . . . . . . . . . . . . . ..ON
Install shorting board in discriminator and calibrate it for 1 Vdc (at the output jack) for a full-scale
2.
meter reading. Remove shorting board, prepare a 20 kHz Butterworth low-pass filter (from the filter
kit.), and install the filter in the discriminator.
Set reference signal generator for a 500.10 MHz, CW signal at +13 dBm.
3.
Connect discriminator to mixer. Set discriminator’s range to 100 kHz and sensitivity to 0.01 Vrrns.
4.
Fine tune either generator for a full-scale meter reading on the discriminator.
Connect amplifier to discriminator output. Connect the voltmeter through the 15 kHz LPF to
5.
amplifier’s output. The signal out of the amplifier is 0.5 mVrms per 1 Hz (rms) of residual FM
deviation, and the average voltmeter reading should be less than 7.5 mVrms (i.e., <15 Hz (rms)
residual FM).
NOTE
Test setup calibration can be checked by setting the test generator’s FM to
INT, PEAK DEVIATION to 5 kHz (vernier fully
CW), and MODULATION
FREQUENCY to 1000 Hz. The voltmeter should read 1.77 Vrms.
6.
connect the capacitor between amplifier and filter. Replace 15 kHz LPF with 3 kHz LPF. The average
voltmeter reading should be less than 2.5 mVrms (i.e., <5 Hz (rms) residual FM).
Set test Signal Generator’s PEAK DEVIATION switch to 2.56 MHz. The average voltmeter reading
7.
should be less than 7.5 mVrms (i.e., <15 Hz (rms) residual FM).
Remove the capacitor and replace 3 kHz LPF with 15 kHz
8.
LPF. The average voltmeter reading should
be less than 15 mVrms (i.e., <30 Hz (rms) residual FM).
7.5 mVrms
2.5 mVrms
7.5
mVrrns
15 mVrms
4-33
Page 92

Performance Tests
PERFORMANCE TESTS
4-25. OUTPUT LEVEL ACCURACY TEST (Abbreviated)
Model 8640B Option 004
SPECIFICATION:
Range: A 10 dB step attenuator and a 1 dB step attenuator with a vernier allow selection of output levels
from +15 dBm to –142 dBm (1.3V to 0.018 µV) into
50.
Level Accuracy:
Output Level (dBm)
Total Accuracy as
Indicated on
Level Meter
+15 to-10
±1.5 dB
–10to–50
±2. 0 dB
–50 to –142
±2.5 dB
DESCRIPTION:
The RF level accuracy for the upper four OUTPUT LEVEL 10 dB ranges is measured with a power meter.
For the lower ranges, a reference signal is established on a spectrum analyzer display, the Signal Generator’s
OUTPUT LEVEL 10 dB switch and the spectrum analyzer’s vertical scale log reference level control are
stepped together, and any amplitude variations are measured on the analyzer’s display, An RF attenuator
and amplifier at the RF OUT are adjusted for analyzer compatibility and best sensitivity.
This procedure uses an IF substitution technique in which the spectrum analyzer’s IF is the standard. The
IF step accuracy should be within ± 0.2 dB overall. The IF step accuracy can be checked using the above
technique by comparing a lab calibrated attenuator (such as HP Model 355D Option H36) with the IF step
control at the frequency of attenuator calibration (e.g., 3 MHz for the HP 355D Option H36 ).
NOTE
This procedure checks output level accuracy from +15 dBm to -130 dBm,
all of the attenuator sections in the OUTPUT LEVEL step attenuators, and
the OUTPUT LEVEL Vernier. If, in addition, level accuracy must be verified
down to -142 dBm, see paragraph 4-26.
4-34
Figure 4-10. Output Level Accuracy Test Setup (Abbreviated)
Page 93

Model
8640B
Option 004
PERFORMANCE TESTS
4-25. OUTPUT LEVEL ACCURACY TEST (Abbreviated) (Cent’d)
Performance Tests
EQUIPMENT:
Spectrum Analyzer . . . . . . . . . HP
Power Meter . . . . . . . . . . . . . . .
Power Sensor . . . . . . . . . . . . . . . HP
20
dB
Amplifier (2 required) . . . . . . . . . . HP
10dB Step Attenuator . . . . . . . . . . . .
Double Shielded Cable (2 required) . . . . . .
141T/8552B/8554B
HP
435A
8482A
8447A
HP
355D
HP 08708-6033
PROCEDURE:
Connect equipment as shown in Figure 4-10 after setting Signal Generator’s controls as follows:
Meter Function
COUNTER MODE: EXPAND” : : : : : : : : : : : .
AM . . . . . . . . . . . . . . . . . . .. OFF
FM
RANGE”::::::::::
FREQUENCY TUNE . . . . . . . . . . . . .
OUTPUT LEVEL Switches . . . . . . . . . . .
OUTPUT LEVEL Vernier . . . . . . . . . . . . . CAL
RF ON/OFF . . . . . . . .
2.
$et
power meter’s controls so that it can measure +15 dBm. Connect power sensor to Signal
Generator’s RF OUT.
3.
Set Signal
Oenerator’s
RF OUTPUT LEVEL controls and vernier for levels (set using generator’s panel
meter) shown in the table below;
LEVEL
off
LOCK . . . . . . . . . . . .. Off
Source . . . . . . . . . . .
..INT
. OFF
::::::
256-512 MHz
512 MHz
+15
dBm
. . . . . . .
veri&
that the level is within the specified tolerance.
..ON
435
Page 94

Performance Tests
PERFORMANCE TESTS
4-25. OUTPUT LEVEL ACCURACY TEST (Abbreviated) (Cent’d)
Signal Generator
Output Level
10 dB
RF Level Set
(with Panel Meter)
Model 8640B Option 004
Power Meter
Reading (dBm)
Fully cw
1
step ccw
from fully cw
I
I
2 steps ccw
+15 dBm
+14 dBm
+13 dBm
+12 dBm
+11 dBm
+10 dBm
+10 dBm
+ 9 dBm
+ 8 dBm
+ 7 dBm
+ 6 dBm
+ 5 dBm
+ 4 dBm
+ 3 dBm
+ 2 dBm
+ 1 dBm
0 dBm
- 1 dBm
- 2 dBm
0
dBm
+13.5–
+12.5_
+11.5_
+10.5_
+ 9.5+ 8.5-
+ 8.5+ 7.5-
+ 6.5-
+ 5.5
+ 4.5+ 3.5+ 2.5+ 1.5+ 0.5-
- 0.5-
- 1.5-
- 2.5-
- 3.5-
- 1.5.
+16.5
+15.5
+14.5
+13.5
+12.5
+11.5
+11.5
+10.5
+9.5
+8.5
+ 7.5
+ 6.5
+ 5.5
+ 4.5
+ 3.5
+ 2.5
+ 1.5
+ 0.5
- 0.5
+ 1.5
from fully cw
3 steps ccw
–11 dBm
-12.5.
- 9.5
4.
Set step attenuator to 70 dB. Set spectrum analyzer center frequency to 512 MHz, resolution
bandwidth to 1 kHz, frequency span per division (scan width) to 0.5-kHz, input attenuation to 0 dB,
tuning stabilizer on, display smoothing (video filter) to 100 Hz, 2 dB per division vertical log display
with a —20 dBm reference level.
5.
Connect attenuator to generator’s RF OUT without disturbing generator’s controls. Center signal on
analyzer’s display. Consider the center horizontal graticule line equivalent to —11 dBm (with a panel
meter reading of —1 dB), then with the vertical scale reference vernier control set the signal peak to be
equal to the last measured level on the power meter.
NOTE
If, for example, the last power meter reading-was -11.4 dBm, the vertical
scale resolution is 2 dB/division, therefore, the signal peak should be 0.4 dB
or 0.2 division below the center (reference) graticule line.
4-36
Page 95

Model 8640B Option 004
PERFORMANCE TESTS
4-25. OUTPUT LEVEL ACCURACY TEST (Abbreviated) (Cont’d)
6.
Step
Signal Generator’s OUTPUT LEVEL 10 dB switch and analyzer’s vertical scale log reference level
control as shown in the following table. Verif
the center (reference) graticule line in each case. If necessary, use generator’s OUTPUT LEVEL 1 dB
switch and vernier to reset panel meter to -1 dB.
y that the amplitude falls within ± 2.0 dB (1 division) of
Performance Tests
Signal Generator
RF Level Set
Output Level 10 dB
3 steps ccw
4 steps ccw
5 steps ccw
6 steps ccw
7.
Set analyzer’s vertical scale log reference level to –10 dBm and reset the 10 dB step attenuator to
30 dB. with the vertical scale log reference vernier, set the signal peak to the same level, with respect
to the horizontal center (reference) graticule line, as the last measurement recorded on the preceding
table.
If generator appears to be out of specification, check accuracy of spectrum
analyzer's vertical scale calibration.
Step
8.
Signal Generator’s OUTPUT LEVEL 10 dB switch and analyzer’s vertical scale log reference level
control as shown in the followimg table. Verify that the amplitude is within the specified tolerance. If
necessary, w generator’s OUTPUT LEVEL 1 dB switch and-vernier to reset panel_ meter to —1 dB.
(with Panel
Meter)
–11 dBm -20
–21 dBm
–31 dBm -40
-41 dBm -50
NOTE
Log Reference
Level Control
Spectrum Anal yzer
(dBm)
-30
I
Display Amplitude
(dB)
Set Level
-2.0
-2.0
-2.0
+2.()
+2.()
+2.()
Signal Generator
RF Level Set
Output Level 10 dB
stepsCCW
6
7 steps ccw
8 steps ccw
9 steps ccw
10 steps ccw
Set step attenuator to 0 dB; set spectrum analyzer’s vertical scale log reference to –20 dBm. Adjust
9.
vertical scale log reference vernier to give the same level, with respect to the center (reference)
graticule line, as tie last recorded entry on the previous table.
(with Panel
Meter)
-41 dBm –lo
–51 dBm
-61 dBm
–71 dBm
–81
dBm
Log Reference
Level Control
Spectrum Analyzer
(dBm)
–20 –2.5
–30 –2.5
40
–50 –2.5
–2.5
Display Amplitude
(dB)
Bet level
+2.5
+2.5
+2.5
+2.5
4-37
Page 96

Performance Tests
Model 8640B Option 004
PERFORMANCE TESTS
4-25. OUTPUT LEVEL ACCURACY TEST (Abbreviated) (Cent’d)
10. Set Signal Generator and analyzer controls as shown in the following table. The amplitude levels
should be within the specified tolerances. If necessary, use generator’s OUTPUT LEVEL 1 dB switch
and vernier to reset panel meter to -1 dB.
Signal Generator
Output Level 10 dB
10 steps ccw -81 dBm
RF Level Set
(with Panel
Log Reference
Level Control
Meter) (dBm)
Spectrum Anal yzer
-20
Display Amplitude
(dB)
Set Level
11 steps ccw -91 dBm -30 -2.5
12 steps ccw
13 steps ccw
14 steps ccw -121 dBm -60
11.
Set analyzer’s display to 10 dB/division log. Adjust log reference level vernier to set signal to –10 dB
-101 dBm -40 -2.5
-111 dBm -50 -2.5
-2.5
graticule line (one major division from top of display) plus last recorded entry on previous table.
NOTE
If the following step appears to be out of specification, check the accuracy
of the analyzer’s display with an external, calibrated attenuator.
Set Generator’s OUTPUT LEVEL 10 dB switch one step ccw to –131 dBm. The amplitude level
12.
indicated on analyzer’s display should be within 2.5 dB of the -20 dB graticule line (second major
division from top of display).
-22.5
+2.5
+2.5
+2.5
+2.5
-17.5 dB
4-38
NOTE
The noise level on the analyzer’s display should be >10 dB below the signal
level. The signal should drop into the noise when the OUTPUT LEVEL 1 dB
switch is turned fully
CCW.
Page 97

4-26
Range: a 10 dB step attenuator and a 1 dB step attenuator with vernier allow selection of output levels
from +15 dBm to -142 dBm (1.3V to 0.018 µV) into
50.
Output Level (dBm)
+15 to -loI-lo to -50 -50 to -142
I
Total Accuracy as
Indicated on
+1.5 dB
±2.O dB
±2.5 dB
Level Meter
DESCRIPTION:
RF output level accuracy above –10 dBm is measured with a power meter; below -10 dBm, cumulative
error is measured against a lab calibrated step attenuator using an IF substitution technique. The test Signal
Generator’s output is down-converted to 3 MHz (the IF) using a mixer and a reference signal generator. The
3 MHz IF is fed through the calibrated step attenuator to a spectrum analyzer. A reference level is
established on the analyzer, and the step attenuator and the test generator’s OUTPUT LEVEL 10 dB switch
are stepped together. Any amplitude variations are measured with a DVM connected to the analyzer’s
vertical output.
A spectrum analyzer tracking generator is connected, with the two signal generators, in a phase lock loop
that prevents relative drift between the units. (See Table 4-1. Recommended Test Abridgements.)
NOTE
This procedure allows the output level accuracy to be verified down to
-142 dBm. Care must be taken to ensure that leakage signals do not reduce
the dynamic range of the test setup (use double-shielded coaxial cable HP
08708-6033). Keep cables in the phase lock path away from cables in the
measurement path.
Reference Signal Generator . . . . . . . . . . . HP 8640A
20 dB Amplifier (3 required) . . . . . . . . . . HP 8447A
10dB Step Attenuator . . . . . . . . . . . .
HP 355D
Calibrated Step Attenuator . . . . . . . . HP 355D Option H36
Digital Voltmeter . . . . . . . . . . . . HP 3480D/3484A
Spectrum Analyzer . . . . . . . . . HP 141T/8552B/8553B
Tracking Generator . . . . . . . . . . . . . HP 8443B
Mixer (3 required) . . . . . . . . . . . . . .HP10514A
4 MHz Low-Pass Filter (LPF, 2 required) . . . . . CIR-Q-TEL 3 Pole
1.5 MHz Low-Pass Filter (LPF) . . . . . . . . CIR-Q-TEL 3 Pole
Oscilloscope . . . . . . . . . . . HP 180A/1801A/1820C
20dB Attenuator . . . . . . . . ‘. . .
13 dB Attenuator . . . . . .
HP 8491A Option 10 and Option 03
Power Meter . . . . . . . . . . . . . . .
HP 8491A Option 20
HP 435A
4-39
Page 98

Performance Tests
PERFORMANCE TESTS
4-26. OUTPUT LEVEL ACCURACY TEST (Complete) (Cent’d)
Power Sensor . . . . . . . . . . . . . . . HP 8482A
Double Shielded Cable (17 required) . . . . . .
Noise Filter
SPST Switch . . . . . . . . . . . . . . HP3101-0163
100
k
Resistor . . . . . . . . . . . . HP 0757-0465
100µF Capacitor . . . . . . . . . . . . HP 0180-0094
Model 8640B Option 004
HP 08708-6033
4-40
Page 99

Model 8640B Option 004
Performance Tests
PERFORMANCE TESTS
4-26. OUTPUT
LEVEL ACCURACY TEST (Complete) (Cont’d)
Figure 4-11. Output Level Accuracy Test Setup (Complete)
4-41
Page 100

Performance Tests
PERFORMANCE TESTS
4-26. OUTPUT LEVEL ACCURACY TEST (Complete) (Cont’d )
Model 8640B Option 004
PROCEDURE
Connect power meter and power sensor to the test Signal Generator’s RF OUT jack. Set test
1.
generator’s controls as follows:
2.
Set power meter’s controls so that it can measure +15 dBm. Connect power sensor to test Signal
Generator’s RF OUT.
3.
Set test Signal Generator’s RF OUTPUT LEVEL controls and vernier for levels (set using generator’s
panel meter) shown in the table below; verify that the level is within the specified tolerance.
:
Meter Function
COUNTER MODE: EXPAND : : : : : : : : :
LOCK . . . . . . . . . .
Source . . . . . . . . . .
AM . . . . . . . . . . . . . . . . .
FM
RANGE.::::::::: :::::::
FREQUENCY TUNE . . . . . . . . . . . .
OUTPUT LEVEL Switches . . . . . . . . . .
OUTPUT LEVEL Vernier
RF ON/OFF....:::: ::::::
Signal Generator
Power Meter Reading
Output Level 10 dB
R F Level Set
(with Panel Meter)
LEVEL
. .
. . . off
. . .
. . . INT
. . . OFF
. . . OFF
256-512 MHz
512 MHz
+15 dBm
. . .
. . .
(dBm)
off
CAL
ON
Fully cw
1 step ccw
from fully cw
2 steps ccw
3 steps ccw
+15 dBm +13.5
+14 dBm +12.5
+13 dBm
+12 dBm +10.5
+11 dBm
+10 dBm
+10 dBm
+ 9 dBm
+ 8 dBm
+ 7 dBm
+ 6 dBm
+ 5 dBm + 3.5 + 6.5
+ 4 dBm
+ 3 dBm
+ 2 dBm
+ 1 dBm
0 dBm
- 1 dBm
- 2 dBm
0 dBm
-11 dBm -12.5
+11.5
+ 9.5
+ 8.5
+ 8.5
+ 7.5
+ 6.5
+ 5.5
+ 4.5
+ 2.5
+ 1.5
+ 0.5
- 0.5
- 1.5
- 2.5
- 3.5 _- 0.5
- 1.5 + 1.5
+16.5
+15.5
+14.5
+13.5
+12.5
+11.5
+11.5
+10. 5
+ 9.5
+ 8.5
+ 7.5
+ 5.5
+ 4.5
+ 3.5
+ 2.5
+ 1.5
+ 0.5
- 9.5
4-42
 Loading...