

Page 1

User’s Guide
HP 86140A Series
Optical Spectrum Analyzer
Page 2

© Copyright Hewlett-Packard
Company 2000
All Rights Reserved. Reproduction, adaptation, or tr anslation without prior written
permission is prohibited,
except as allowed under copyright laws.
HP Part No. 8 6140 -90035
Printed in USA
February 2000
Hew lett -Packard Compan y
Lightwave Division
1400 Fountaingrove Park way
Santa Rosa, CA 9 5403-1799,
USA
(707) 577-1 400
Notice.
The information contained in
this document is subject to
change without notice. Companies, names, and data used
in examples herein are fictitious unless otherwise noted.
Hew lett -Packard makes no
warranty of any kind with
regard to this material, including but not limited to, the
implied warranties of merchantability and fitness for a
particular purpose. HewlettPackard shall not be liable f or
errors contained herein or for
incidental or consequential
damages in connection with
the furnishing, performance,
or use of this material.
Restricted Rights Legend.
Use, duplication, or disclosure by the U.S. Government
is subject to restrictions a s set
forth in subparagraph (c) (1)
(ii) of the Rights in Technical
Data and Computer Software
clause at DFARS 252.2 27-7013
for DOD agencies, and subparagraphs (c) (1) and (c) (2 )
of the Commercial Computer
Software Restricted Rights
claus e a t FAR 52 .22 7-19 for
other agencies.
Warrant y.
This Hewlett-Packard instrument product is warranted
against defects in material and
workmanship for a perio d of
one year from date of shipment. During the warranty
period, Hewlett-Packard Company will, at its option, either
repair or replace products
which prove to be defective.
For warranty service o r repair,
this product must b e returned
to a service facility designated by Hewlett-Packard.
Buyer shall prepay shipping
charges to Hewlett-Packard
and Hewlett-Packard shall pay
shi ppi ng charg es to return the
product to Buyer. However,
Buyer shall pay all shipping
charges, duties, and taxes for
products returned to HewlettPackard from another country.
Hew lett -Packard wa rran ts
that its software and firmware
designated by HewlettPackard for use with an
instrument will execute its
programming instructions
when properly installed o n
that instrument. HewlettPackard does not warrant that
the operation of the instrument, or sof tware, or firmware
will be uninterrupted or errorfree.
Limitation of Warranty.
The foregoing warranty shall
not apply to defects resulti ng
from improper or inadequate
maintenance by Buyer, Buyersupplied software or interfacing, unauthorized modification or misuse, operation
outside of the environmental
specifications for the product,
or improper site preparation
or maintenance.
No other warranty is
expressed or implied.
Hewlett-Packard specifically
disclaims the implied warranties of merchantability and fitness for a parti cular purpose.
Exclusive Remedi es.
The remedies provided herein
are buyer's sole and exclusive
remedies. Hewlett-Packard
shall not be liable for any
direct, indirect, special, incidental, or consequential damages, whether based on
contract, tort, or any other
legal theory.
Safety Symbols.
CAUTION
caution
The
sign de notes a
hazard. It calls attention to a
procedure whi ch, if not correctly performed or adhered
to, could result in damage to
or destruction of the product.
Do not proceed beyond a caution sign until the indicated
conditions are fully understood and met.
WARNING
warning
The
sign denotes a
hazard. It calls attention to a
procedure whi ch, if not correctly performed or adhered
to, could result in injury or
loss of life. Do not proceed
beyond a warning sign until
the indicated conditions are
fully understood and met.
The instruction manual symbol. The product is marked with this
warning symbol when
it is necessary for the
user to refer to the
instructions in the
manual.
The laser radiation
symbol. This warning
symbol is marked on
products which have a
laser output.
The AC symbol is used
to indicate the
required nature o f the
line module input
power.
|The ON symbols are
used to mark the positions of the instrument
power line switch.
❍The OFF symbols
are used to mar k the
positions of the instrument power line
switch.
The CE mark is a registe r ed trademark of
the European Community.
The CSA mark is a registe r ed trademark of
the Canadian Standards Association.
The C-Tick mark is a
registered trademark
of the Australian Spectrum Management
Agency.
This text denotes the
ISM1-A
instrument is an
Industrial Scientific
and Medical Group 1
Class A product.
ii
Page 3

General Safety Considerations
General Safety Considerations
This product has been designed and tested in accordance with IEC Publication 1010, Safety Requirements for Electronic Measuring Apparatus, and has
been supplied in a safe condition. The instruction documentation contains
information and warnings which must be followed by the user to ensure safe
operation and to maintain the product in a safe condition.
Install the instrument according to the enclosure protection provided.
This instrument does not protect against the ingress of water.
This instrument protects against finger access to hazardous parts within the
enclosure.
WARN ING
WARN ING
WARN ING
WARN ING
CAUTION
If this product is not used as specified, the protection provided by the
equipment could be impaired. This product must be used in a normal
condition (in which all means for protection are intact) only.
No operator serviceable parts inside. Refer servicing to qualified
service personnel. To prevent electrical shock do not remove covers.
This is a Safety Class 1 Product (provided with a protective earthing
ground incorporated in the power cord). The mains plug shall only be
inserted in a socket outlet provided with a protective earth contact.
Any interruption of the protective conductor inside or outside of the
instrument is likely to make the instrument dangerous. Intentional
interruption is prohibited.
To prevent electrical shock, disconnect the instrument from mains
before cleaning. Use a dry cloth or one slightly dampened with water
to clean the external case parts. Do not attempt to clean internally.
Fiber-optic connectors are easily damaged when connected to dirty or
damaged cables and accessories. The HP 86140 series’s front-panel INPUT
connector is no exception. When you use improper cleaning and handling
techniques, you risk expensive instrument repairs, damaged cables, and
compromised measurements. Before you connect any fiber-optic cable to the
HP 86140 series, ref er to “Cleaning Co nnecti ons for Accurate Measurements”
on page 6-10.
CAUTION
This product is designed for use in Installation Category II and Pollution
Degree 2 per IEC 1010 and 664 respectively.
iii
Page 4

General Safety Considerations
CAUTION
CAUTION
CAUTION
CAUTION
CAUTION
Do not use too much liquid in cleaning the optical spectrum analyzer. Water can
enter the front-panel keyboard, damaging sensitive electronic components.
VENTILATION REQUIREMENTS: When installi ng the product in a cabinet, the
convection into and out of the product must not be restricted. The ambient
temperature (outside the cabinet) must be less than the maximum operating
temperature of the product by 4° C for every 100 watts dissipated in the
cabinet. If the total power dissipated in the cabinet is greater than 800 watts,
then forced convection must be used.
Always use the three-prong AC power cord supplied with this instrument.
Failure to ensure adequate earth grounding by not using this cord may cause
instrument damage.
Do not
connect ac power until you have verified the line voltage is correct as
described in “Line Power Requirements” on page 1-7. Damage to the
equipment could result.
This instrument has autoranging line voltage input. Be sure the supply voltage
is within the specified range.
iv
Page 5

Contents
1 Setting Up the OSA
2 A Quick Tour
HP 86140/2 Fro nt and Rear P anel s 2-4
HP 86143/5 Fro nt and Rear P anel s 2-6
Optical Spectrum Analyzer Display 2-8
The Menu Bar 2-10
The Softkey Panels 2-11
Tutorial: Getting Started 2-20
Changing the Printer Paper 2-23
3 Using the Optical Spectrum Analyzer
Front-Panel Keys 3-3
The Menus 3-7
The Amplitude Menus 3-8
The Bandwidth/Sweep Menus 3-14
The Markers Menus 3-21
The Save/Recall Menus 3-34
The System Menus 3-40
The Traces Menus 3-56
The Wavelength Menus 3-61
To Fill In a Setup Panel 3-65
4 Remote Operation
Getting Started 4-4
Monitoring the Instrument 4-11
Example Programs 4-16
Front Panel Functions to Remote Commands 4-31
Command Trees 4-37
Common Commands 4-42
CALCulate Subsystem Commands 4-45
CALibration Subsystem Commands 4-68
DISPlay Subsystem Commands 4-71
FORMat Subsystem Commands 4-76
HCOPy Subsystem Commands 4-77
INITiate Subsystem Comm ands 4-78
MEMory Subsystem Commands 4-79
Contents-1
Page 6

Contents
MMEMory Subsystem Commands 4-80
SENSe Subsystem Commands 4-81
SOURce[n] Subsystem Commands 4-90
STATus Subsystem Commands 4-91
SYSTem Subsystem Commands 4-93
TRACe Subsystem Commands 4-95
TRIGger Subsystem Commands 4-99
UNIT Subsystem Commands 4-101
HP 71450 Series Commands to HP 86140 Series Equivalents 4-102
5Status Listings
Overview 5-2
Error Reporting Behavior 5-4
SCPI-Defined Errors 5-5
OSA Notices 5-16
OSA Warnings 5-17
Application-Specific Warnings 5-28
OSA Status Errors 5-34
OSA Errors 5-35
Firmware Errors 5-37
6 Reference
Options and Accessories 6-2
AC Line-Power Cords 6-4
Front-Panel Fiber-Optic Adapters 6-6
Printer Head Cleaning Procedure 6-7
Cleaning Connections for Accurate Measurements 6-10
Returning the Instrument for Service 6-21
Hewlett-Packard Sales and Service Offices 6-24
7 Specifications and Regulatory Information
Definition of Terms 7-3
Specifications 7-5
Regulatory Information 7-10
Contents -2
Page 7

1
Setting Up the OSA
Page 8

Setting Up the OSA
Setting Up the OSA
Setting Up the OSA
This chapter shows you how to set up your optical spectrum analyzer, connect
power and accessories, and verify general operation. Although the pictures in
this section show an HP 86140A or 86142A optical spectrum analyzer, setting
up other HP 86140-series optical spectrum analyzers is very similar. Refer to
Chapter 6, “Reference” for the following additional information:
• Tips on avoiding
niques.
• List of available options, accessories, and power cords.
• Instructions on returning your instrument to HP for service.
• HP Sales and Service Offices.
costly
repairs by proper optical connection cleaning tech-
1-2
Page 9
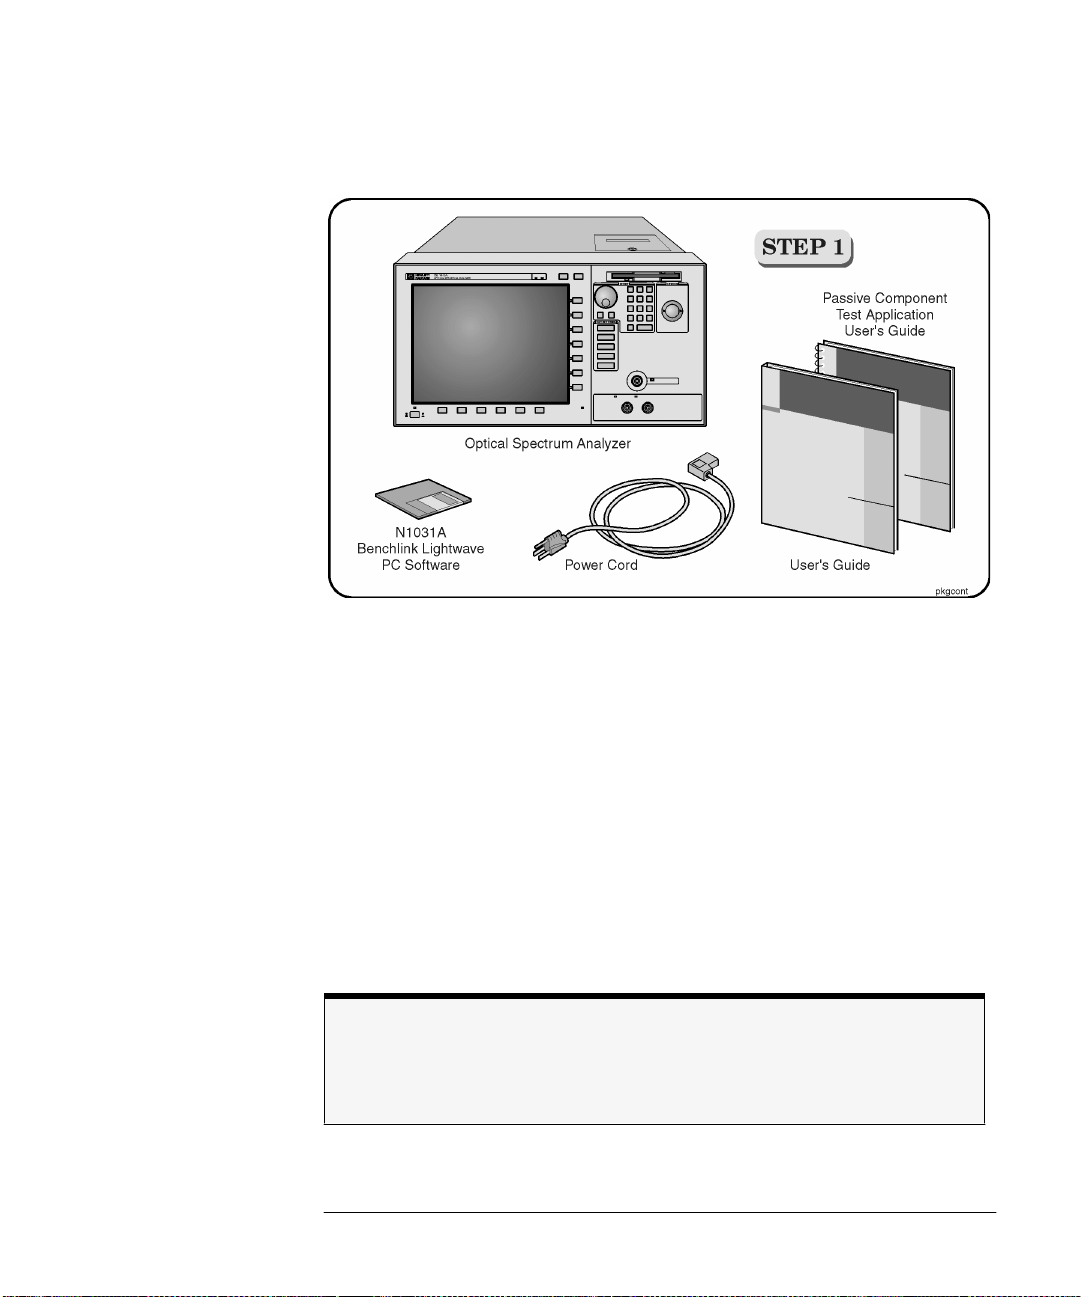
Package contents for HP 86140 series optical spectrum analyzers
Setting Up the OSA
Setting Up the OSA
❒
Inspect the shipping container for damage.
❒
Inspect the instrument.
❒
Verify that you received the options and accessories you ordered.
Keep the shipping container and cushioning material until you have inspected
the contents of the shipment for completeness and have checked the optical
spectrum analyzer mechanically and electrically.
If anything is missing or defective, contact your nearest Hewlett-Packard Sales
Office. If the shipment was damaged, contact the carrier, then contact the
nearest Hewlett-Packard Sales Office. Keep the shipping materials for the carrier’s inspection. The HP Sales Office will arrange for repair or replacement at
Hewlett-Packard’s option without waiting for claim settlement.
Note
The N1031A BenchLink software allows you to upload graphics and trace date to a personal computer for preparing a report, creating an analysis, or storing the waveforms for
later use.
1-3
Page 10

Setting Up the OSA
Setting Up the OSA
You can tilt your instrument upward for easier viewing. On the HP 86140A and
86142A instruments, lift up the front of the instrument, grasp one of the wire
bails under the front corner, and pull it down and forward until it latches into
place. Repeat f or the other wire bail. On HP 86143A and 86145A instruments,
pivot the handle to tilt the instrument.
1-4
Page 11

Setting Up the OSA
Setting Up the OSA
CAUTION
Although you can operate all instrument functions using only the front-panel
keys and trackball, these accessories make your optical spectrum analyzer
even easier to use! Connect any standard PC-compatible mouse (or other
pointing device), keyboard, or external VGA-compatible display.
not
Do
stack other objects on the keyboard; this will cause self-test failures on
power-on.
1-5
Page 12
Setting Up the OSA
Setting Up the OSA
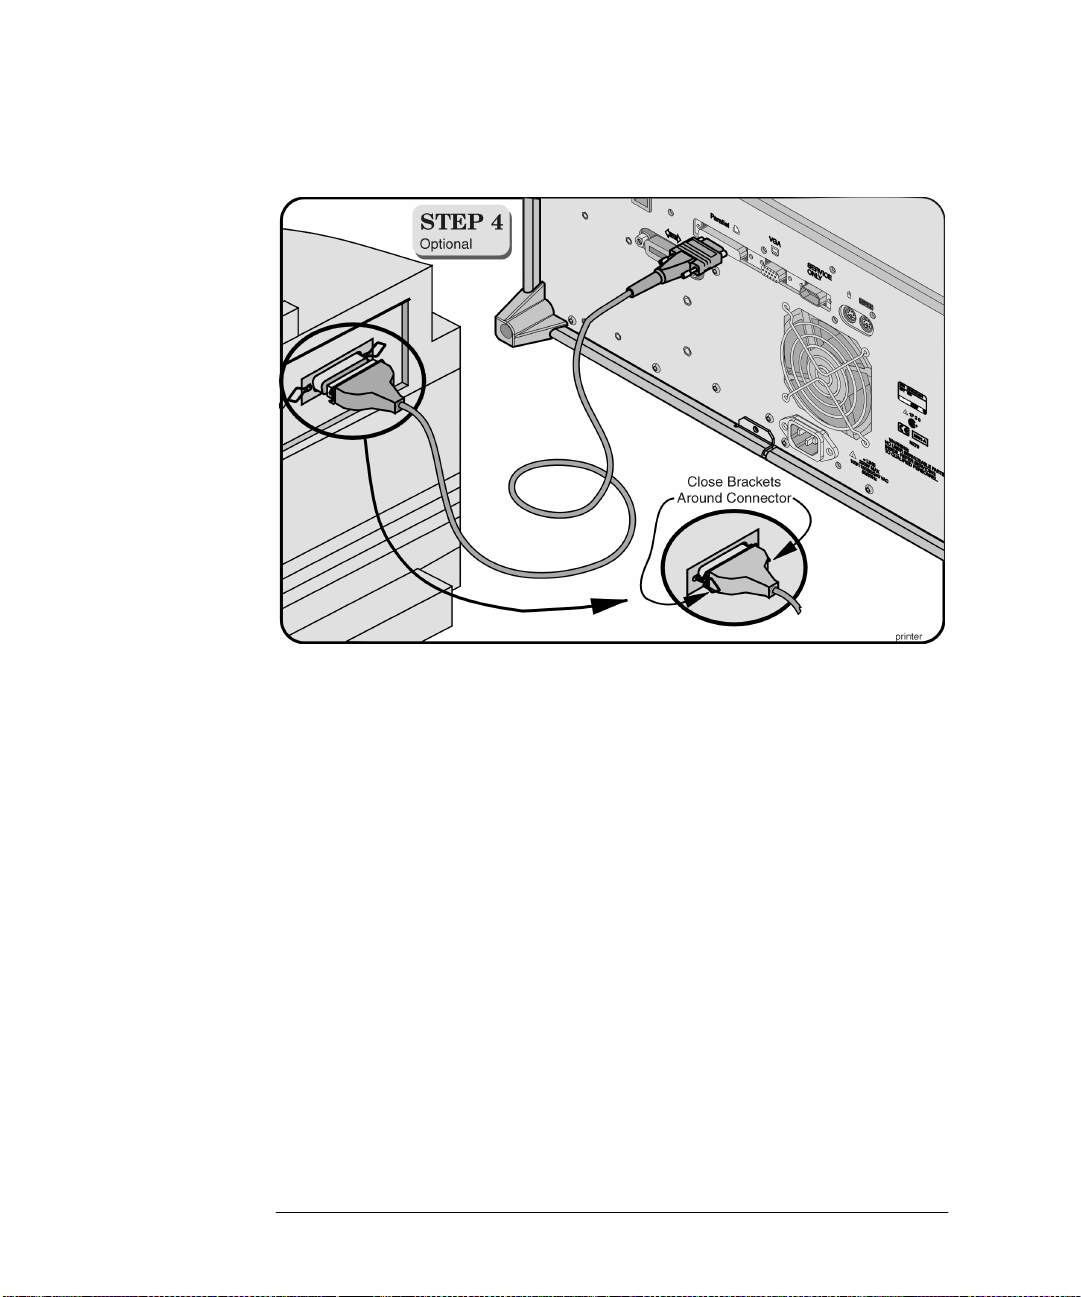
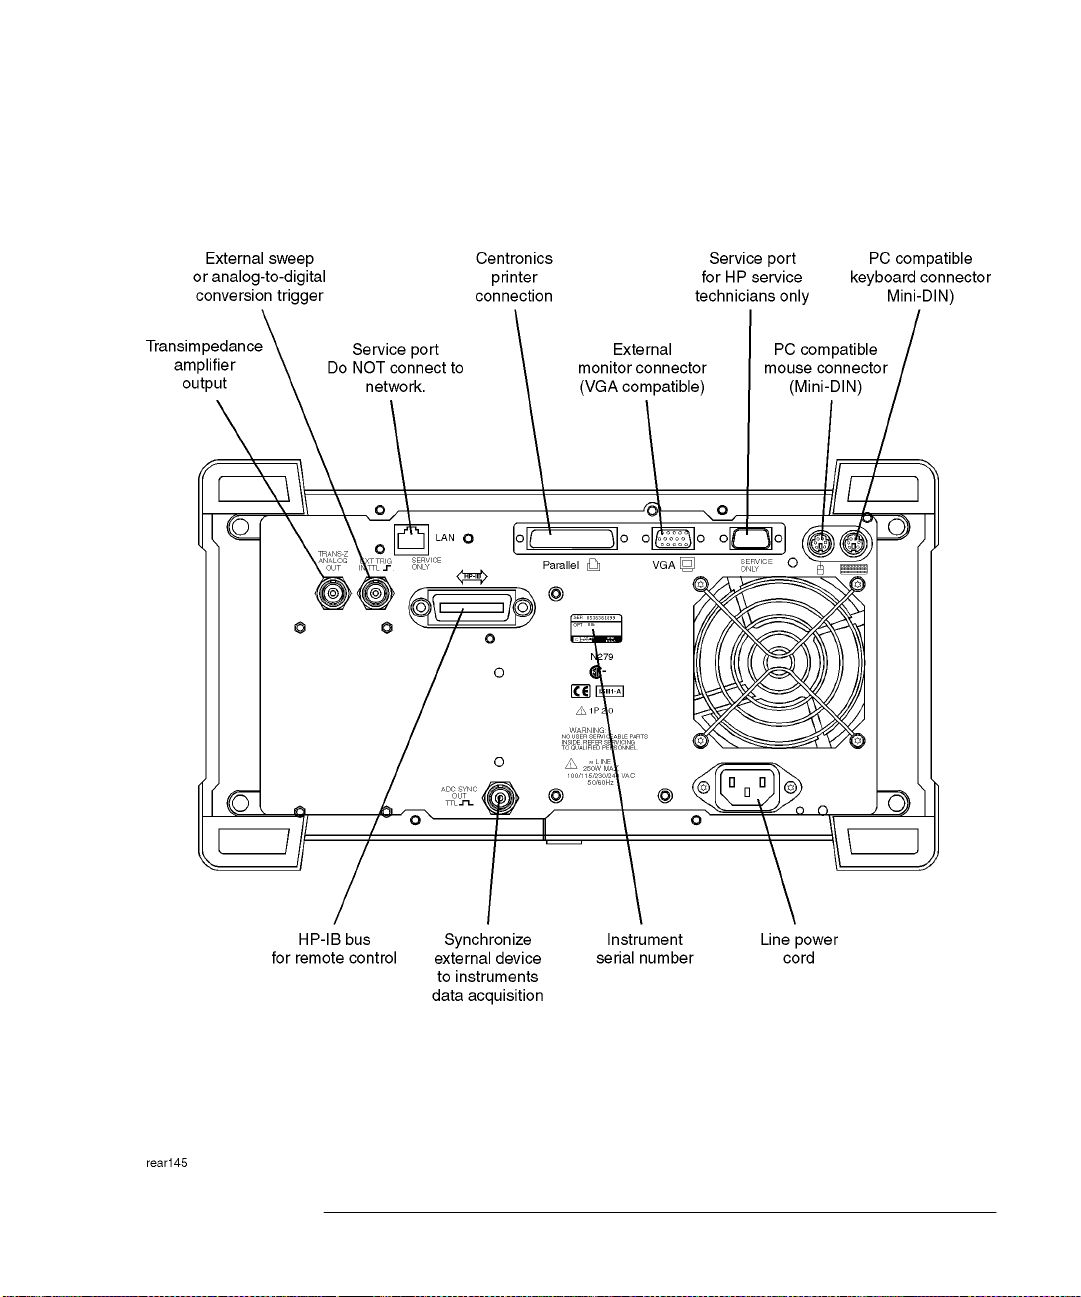
You can connect a PCL-language printer (for example, an HP LaserJet) to the
instrument’s rear panel
Parallel
connector. Use a parallel Centronics printer
cable, such as an HP C2950A (2 m) or HP C2951A (3 m).
1-6
Page 13
Setting Up the OSA
Setting Up the OSA
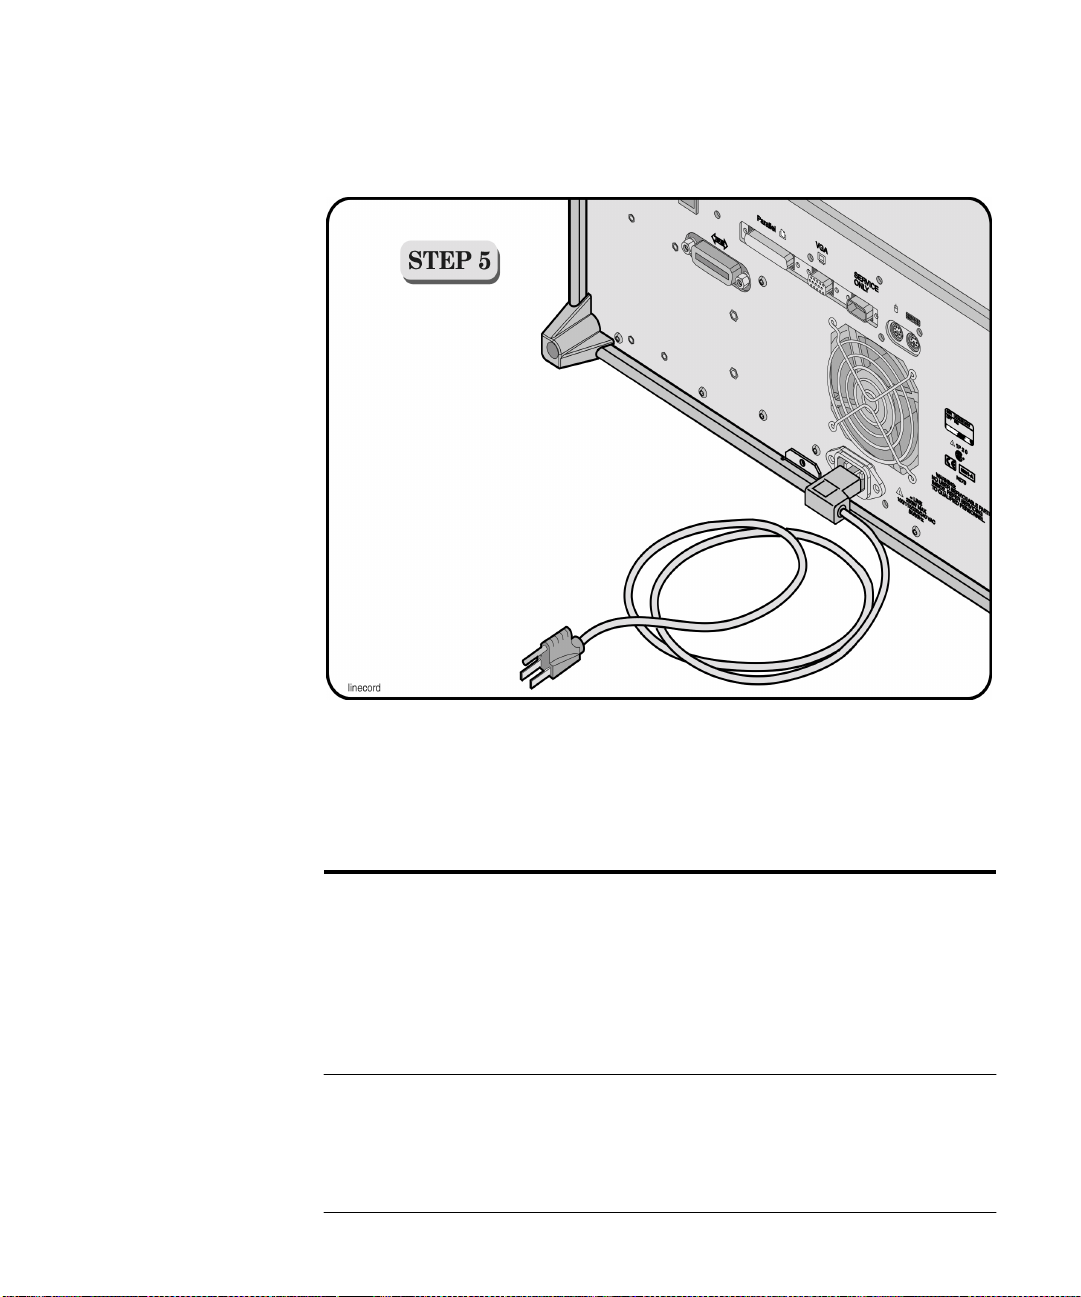
The optical spectrum analyzer automatically adjusts for line input voltages in
the range of 100 to 240 VAC. There is no manual selection switch. The line
cord provided is matched by HP to the country of origin of the order. Refer to
“AC Line-Power Cords” on page 6-4.
Line Power Requirements
Power 115 VAC: 110 VA MAX. / 60 WATTS MAX. / 1.1 A MAX.
230 VAC: 150 VA MAX. / 70 WATTS MAX. / 0.6 A MAX.
Voltage nominal: 115 VAC / 230 VAC
range 115 VAC: 90–132 V
range 230 VAC: 198–254 V
Frequency nominals: 50 Hz / 60 Hz
range: 47–63 Hz
1-7
Page 14
Setting Up the OSA
Setting Up the OSA
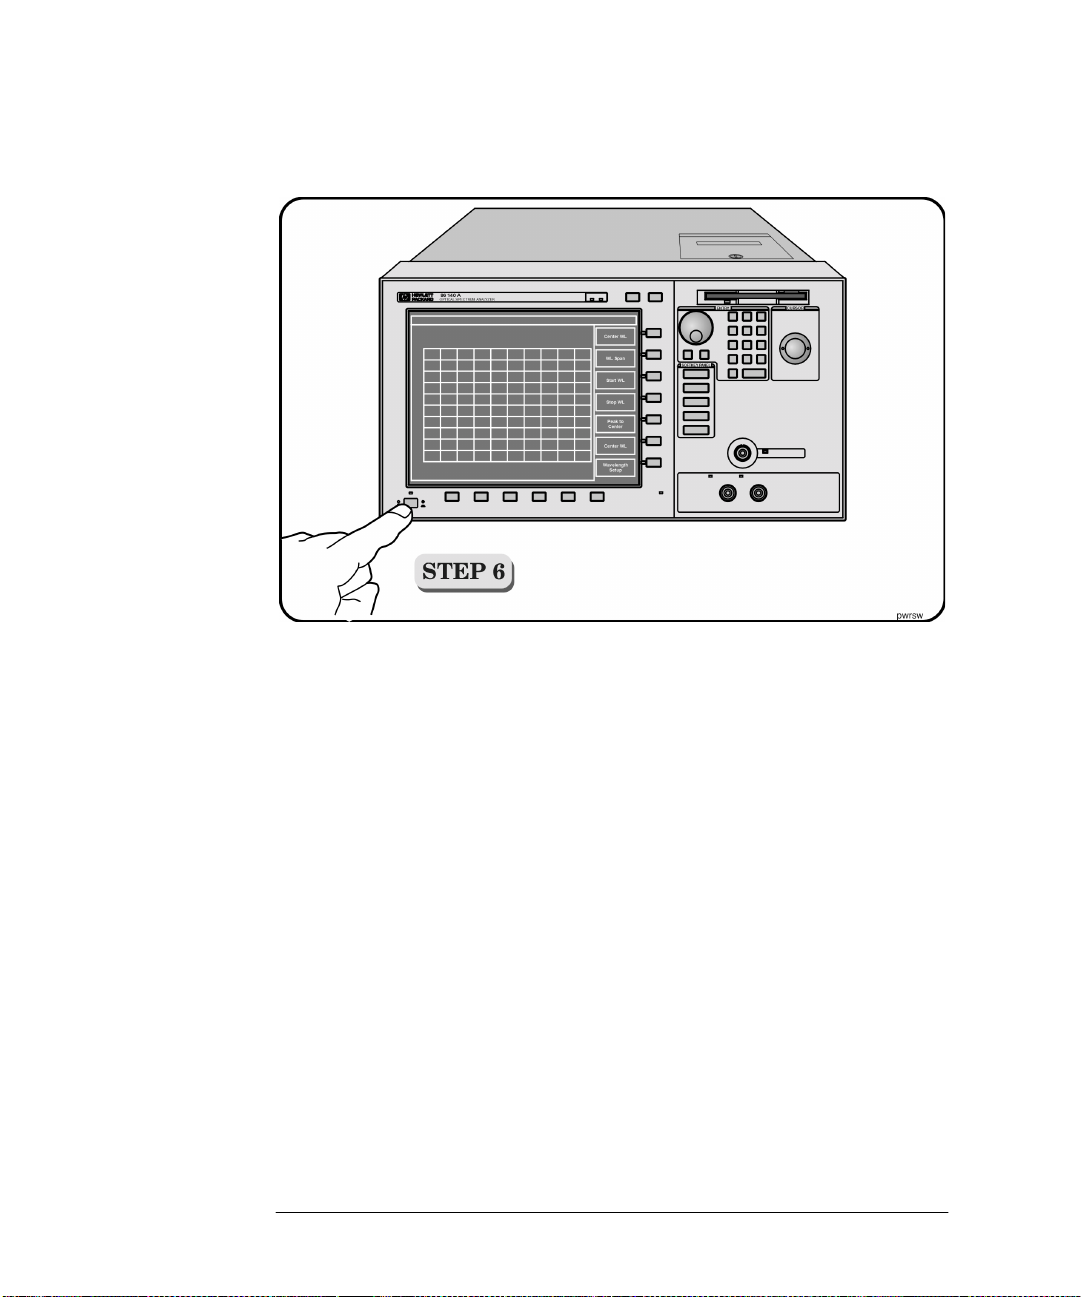
• Press the power switch at the lower left-hand corner of the front panel.
After a short initialization period, the display will look similar to the picture on
this page. The instrument is ready to use.
1-8
Page 15
Setting Up the OSA
Setting Up the OSA
CAUTION
Fiber-optic connectors are easily damaged when connected to dirty or
damaged cables and accessories. The HP 86140 series’s front-panel
INPUT
connector is no exception. When you use improper cleaning and handling
techniques, you risk expensive instrument repairs, damaged cables, and
compromised measurements. Before you connect any fiber-optic cable to the
HP 86140 series optical spectrum analyzer, refer to “Cleaning Connections for
Accurate Measurements” on page 6-10.
1-9
Page 16
Setting Up the OSA
Setting Up the OSA
1-10
Page 17

2
HP 86140/2 Fro nt and Rear P anel s 2-4
HP 86143/5 Fro nt and Rear P anel s 2-6
Optical Spectrum Analyzer Display 2-8
The Menu Bar 2-10
The Softkey Panels 2-11
The Amplitude menus 2-12
The Applications menus 2-13
The Bandwidth/Sweep menus 2-14
The Marker menus 2-15
The Save/Recall menus 2-16
The Systems menus 2-17
The Traces menus 2-18
The Wavelength menus 2-19
Tutorial: Getting Started 2-20
Changing the Printer Paper 2-23
A Quick Tour
Page 18
A Quick Tour
A Quick Tour
A Quick Tour
HP 86140A-series optical spectrum analyzers display input light spectra from
600 nm to 1700 nm. To change instrument settings use the softkeys. To display different softkeys use these items:
• Softkey panel and softkeys
Print, Save/Recall, System,
•
• Menu bar
The menu bar or keys can be used to access the same functions. Use the trackball or an optional pointing device to make menu and softkey selections.
Application
and
keys
2-2
Page 19

A Quick Tour
A Quick Tour
All displayed wavelength values show values as measured in a vacuum. This
default setting can be changed t o show values as measured in air. See “To
change the default wavelength settings” on page 3-63 for more information.
OPTICAL INPUT
The
mode fiber
connector on standard instrument versions uses
. Connecting multi-mode fiber to these connectors results in large
single
reflections and insertion loss.
Auto Align
Auto Meas
Appl’s
To ensure maximum amplitude accuracy, connect an input signal to the instrument and then press
Auto Align
. This starts an automatic alignment procedure
that should be performed whenever the instrument has been:
• moved,
• subjected to large temperature changes, or
• warmed up at the start of each day.
Press the
Auto Meas
key to automatically locate the largest signal present at the
input connector.
Additional software applications can be purchased and installed in your optical spectrum analyzer. These applications automate and simplify your measurement tasks. Press this key to access your applications.
2-3
Page 20
A Quick Tour
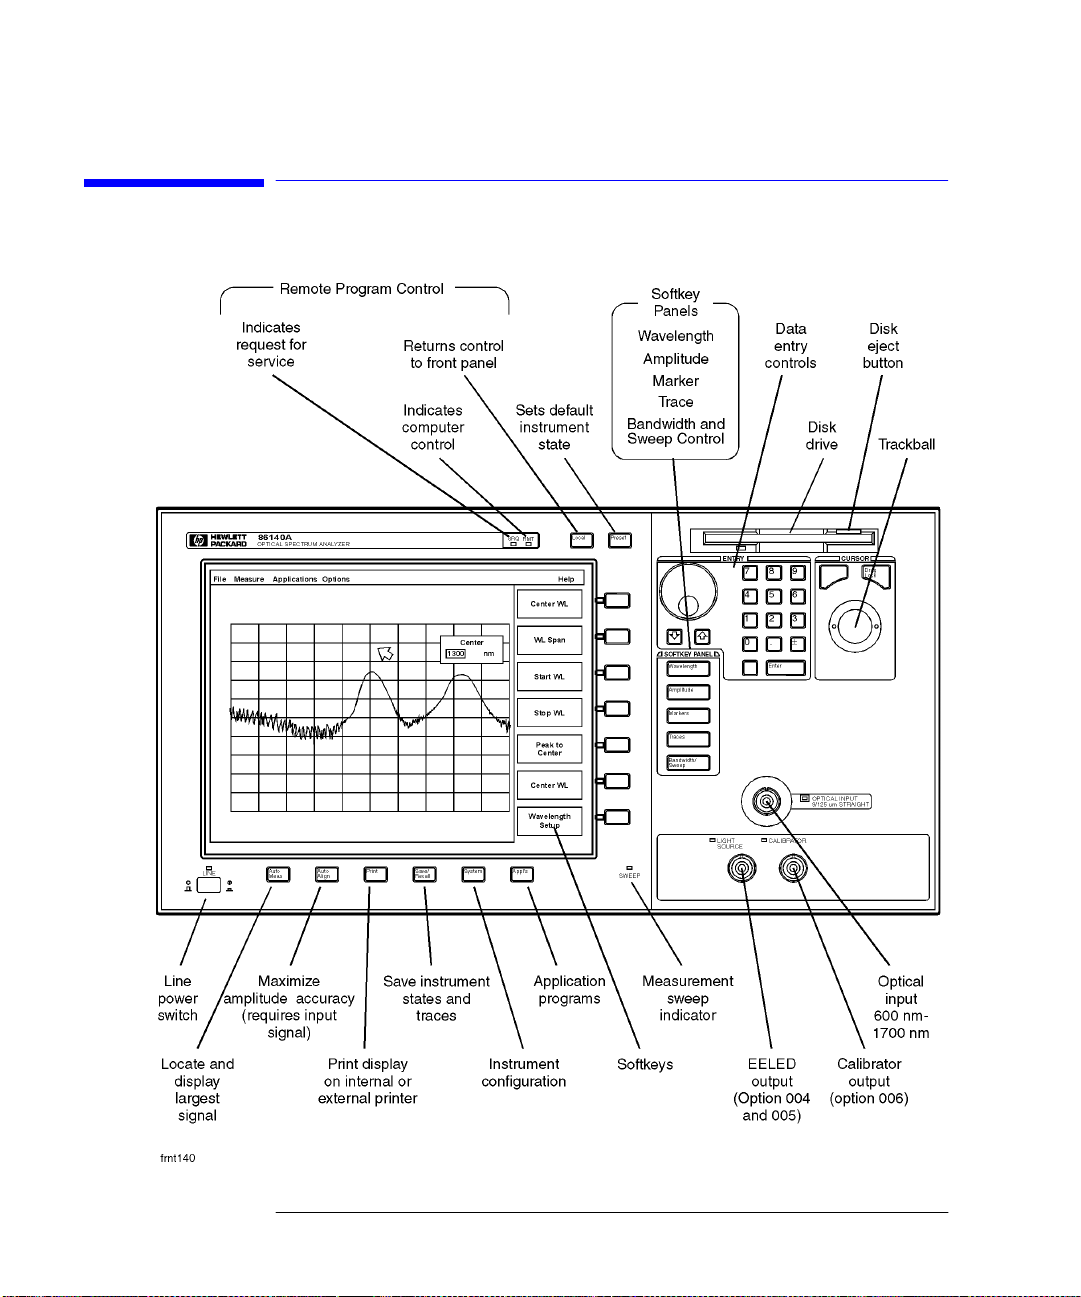
HP 86140/2 Front and Rear Panels
HP 86140/2 Front and Rear Panels
2-4
Page 21

A Quick Tour
HP 86140/2 Front and Rear Panels
2-5
Page 22

A Quick Tour
HP 86143/5 Front and Rear Panels
HP 86143/5 Front and Rear Panels
2-6
Page 23
A Quick Tour
HP 86143/5 Front and Rear Panels
2-7
Page 24
A Quick Tour
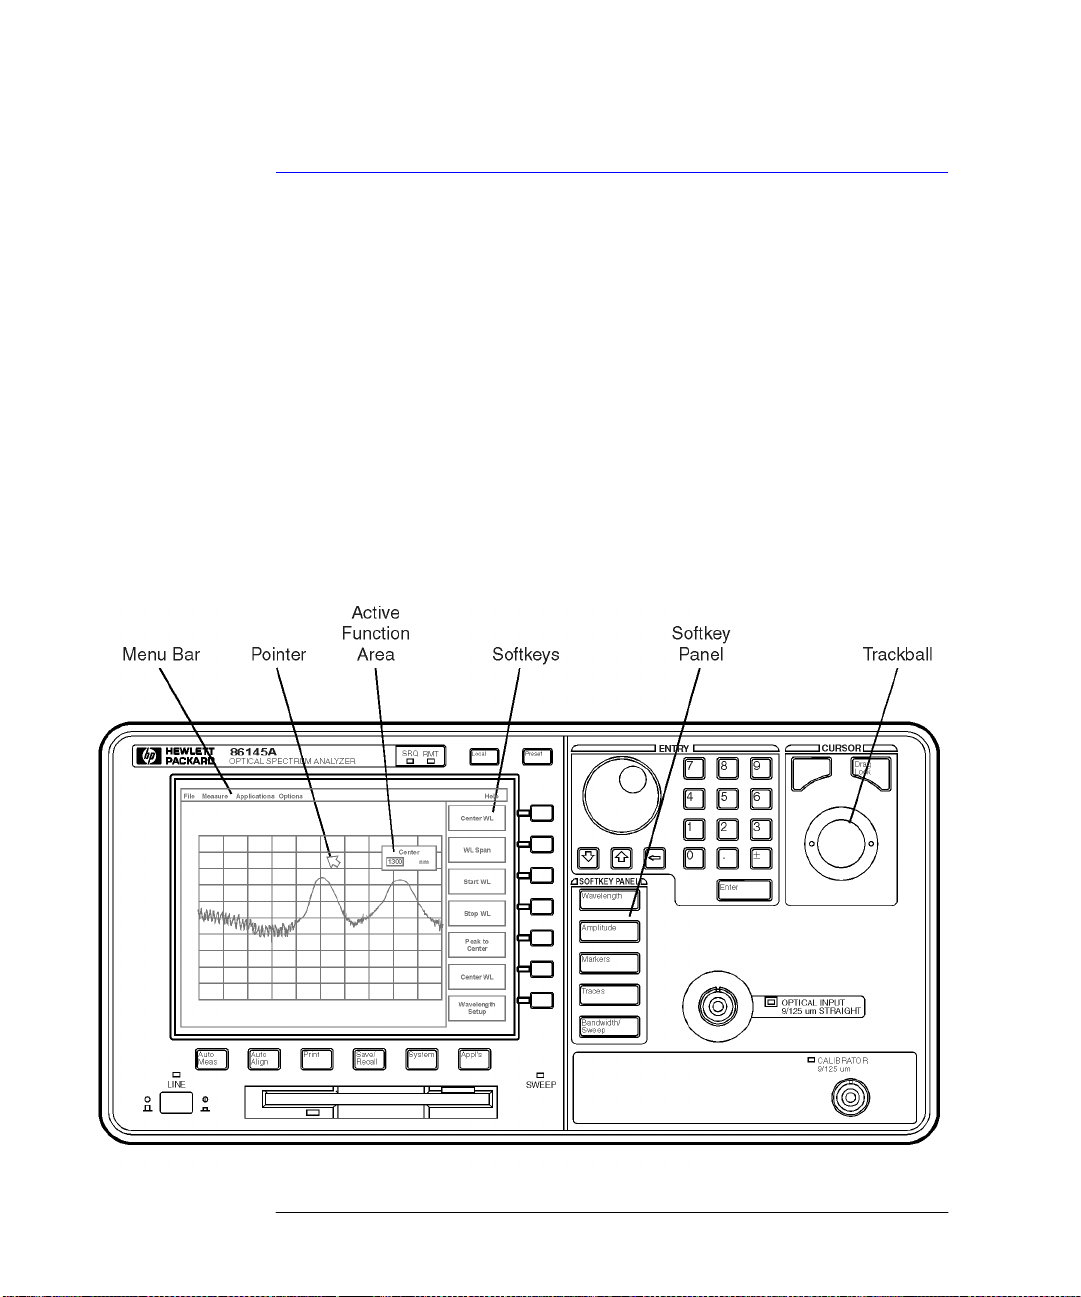
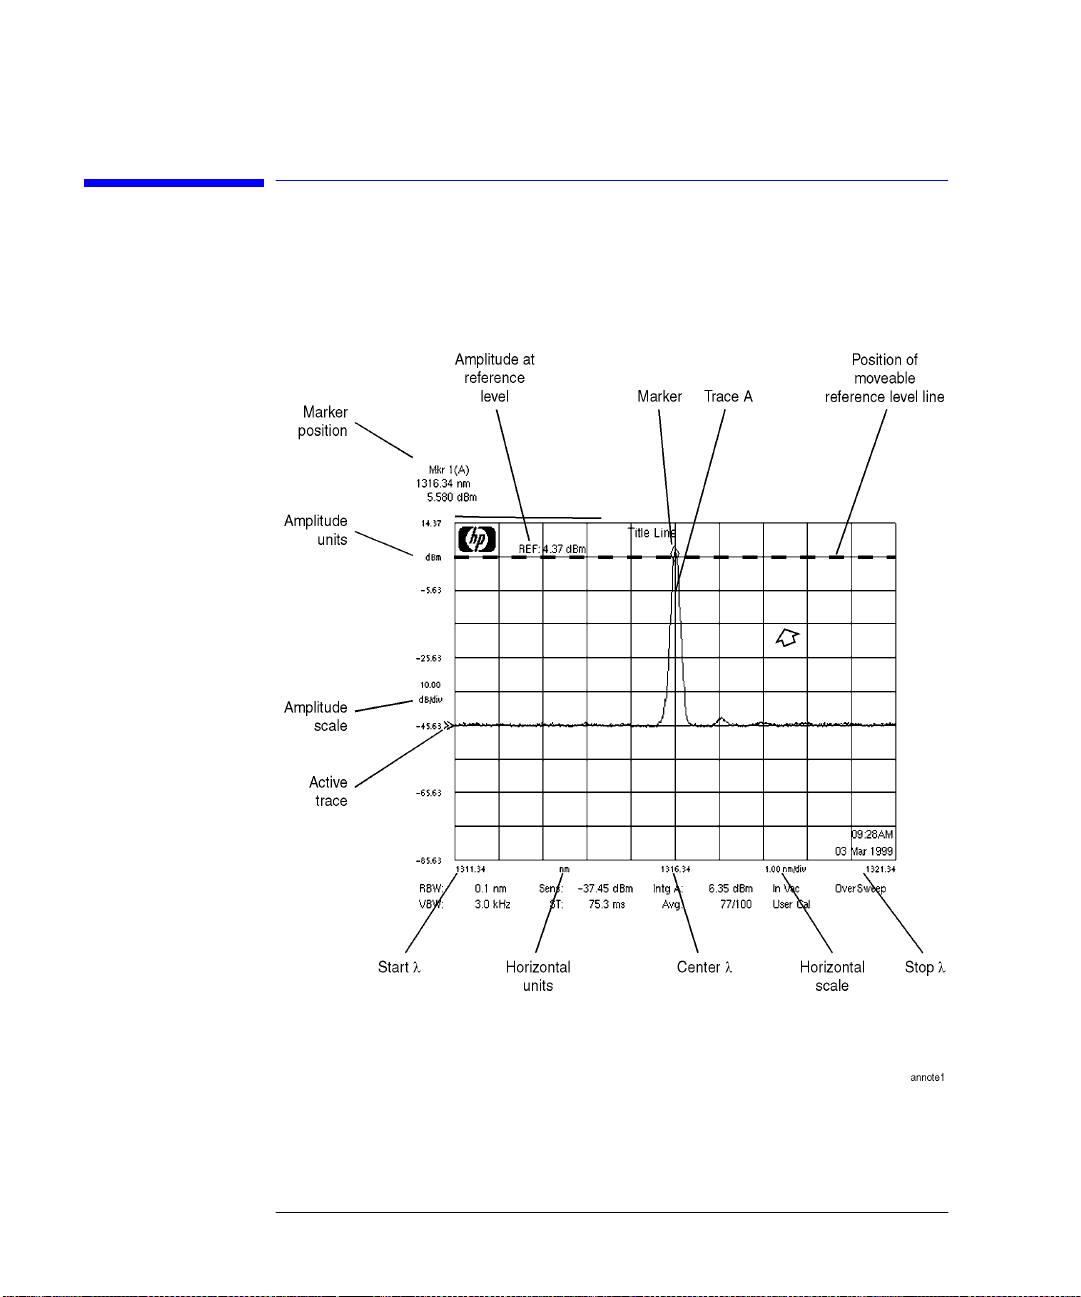
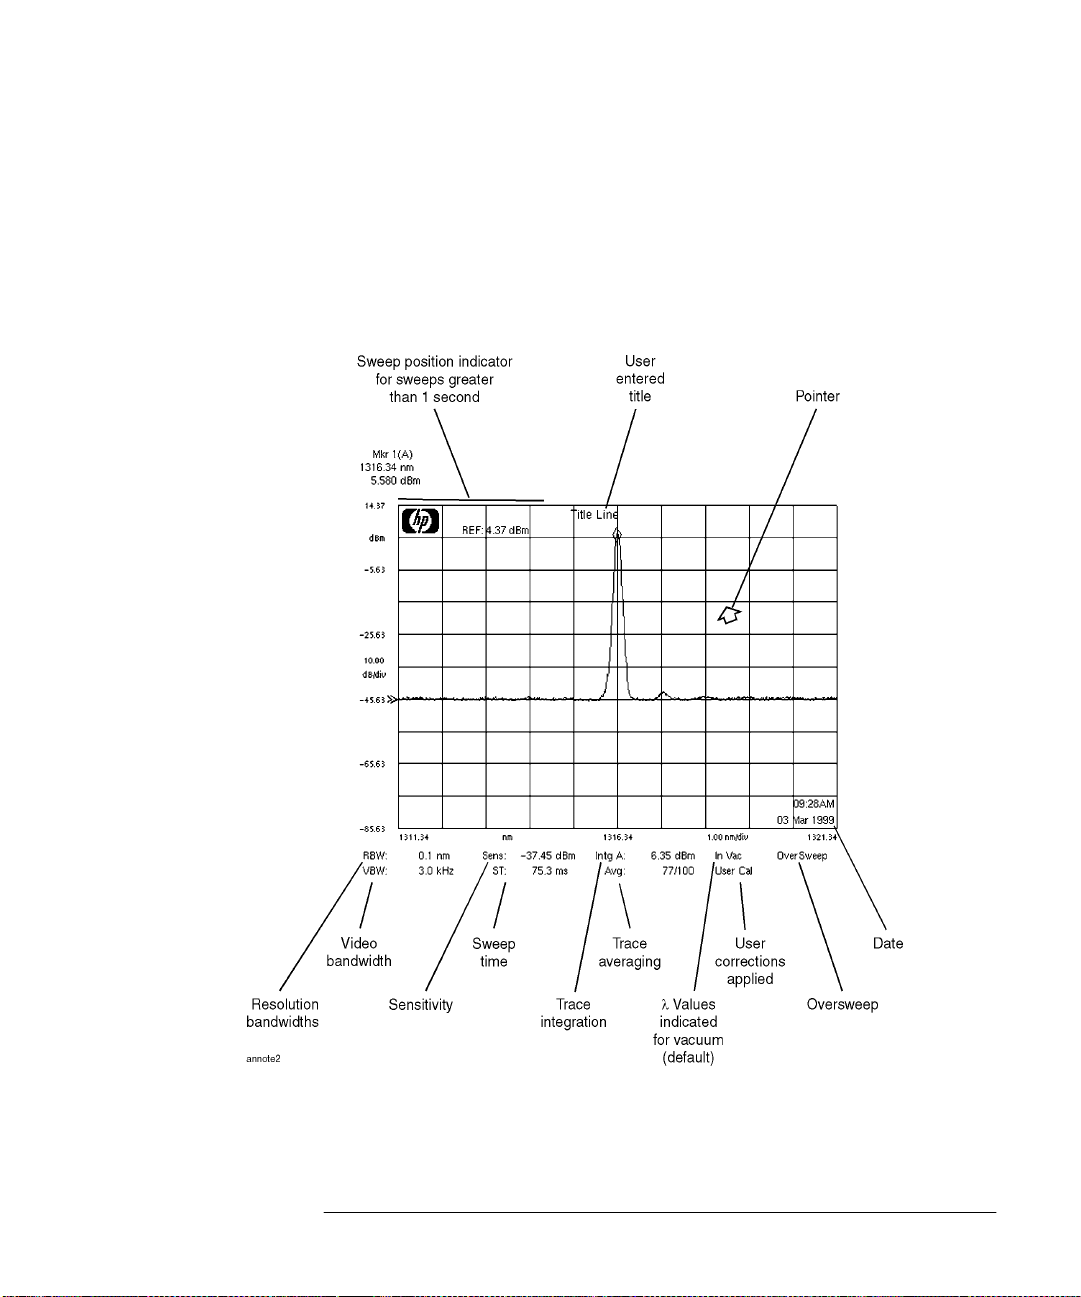
Optical Spectrum Analyzer Display
Optical Spectrum Analyzer Display
2-8
Page 25
A Quick Tour
Optical Spectrum Analyzer Display
2-9
Page 26
The File menu
A Quick Tour
The Menu Bar
The Menu Bar
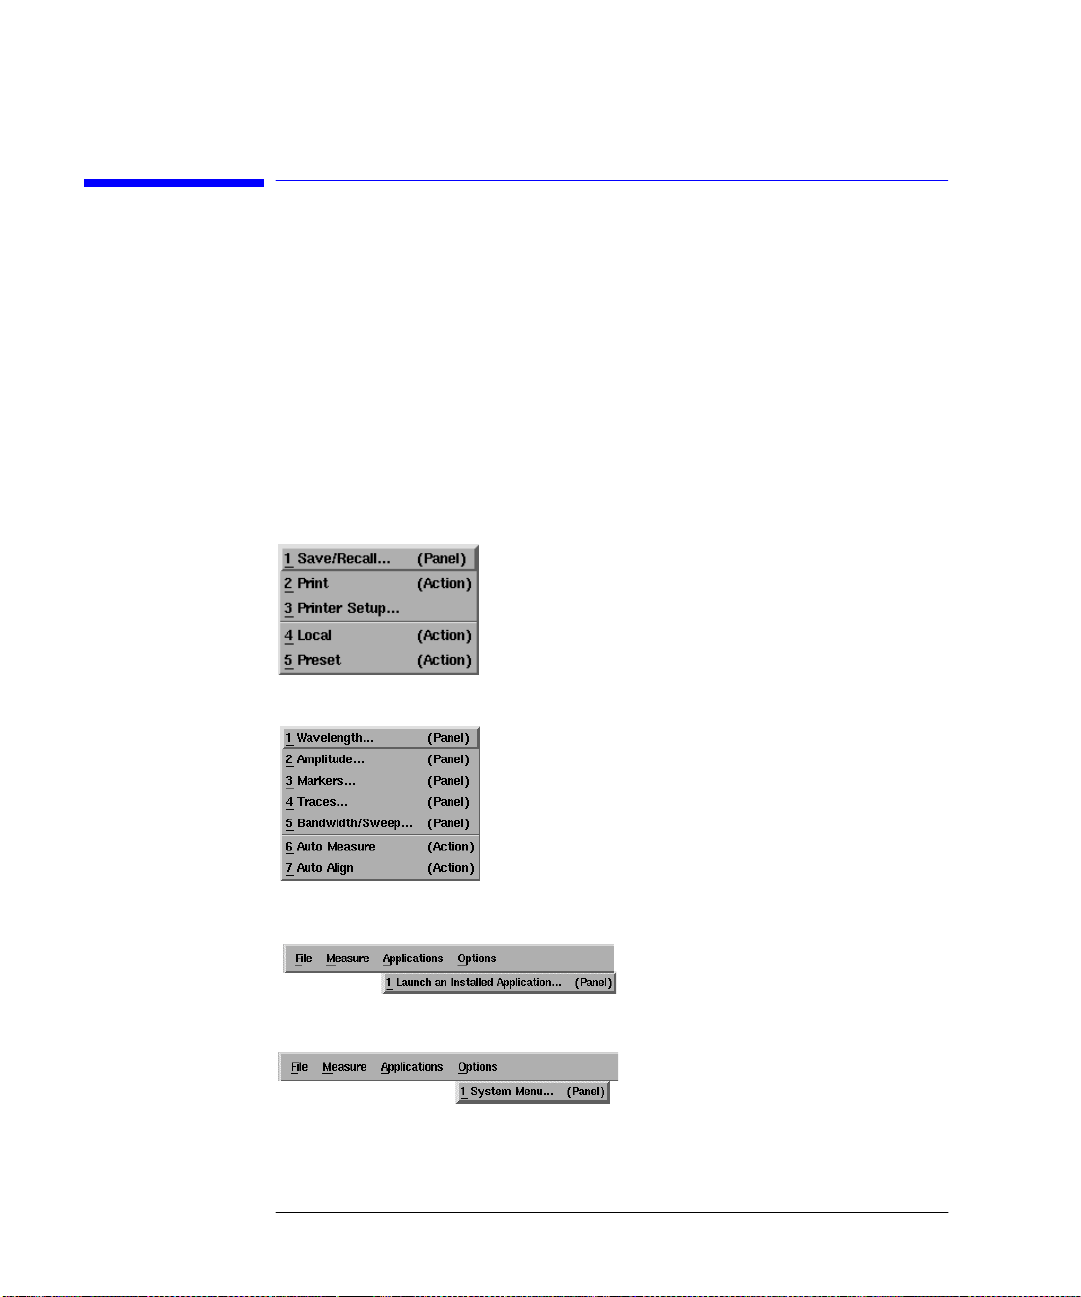
The Menu bar includes the File, Measure, Application, and Op tions drop-down
menus. Each menu selection includes a descriptive label.
(Action) Indicates the selection will perform an action such as
making a measurement or printing the display.
(Panel) Indicates the selection will open a softkey panel.
The Measure menu
The Applications
menu
The Options menu
2-10
Page 27

A Quick Tour
The Softkey Panels
The Softkey Panels
The softkey panels can be accessed using either the front-panel keys or the
menu bar. This section includes brief descriptions of the following menus. See
Chapter 3, “Using the Optical Spectrum Analyzer” for additional information
on each of the OSA functions.
The Amplitude menus 2-12
The Applications menus 2-13
The Bandwidth/Sweep menus 2-14
The Marker menus 2-15
The Save/Recall menus 2-16
The Systems menus 2-17
The Traces menus 2-18
The Wavelength menus 2-19
2-11
Page 28
A Quick Tour
The Softkey Panels
The Amplitude menus
The Amplitude softkeys are accessed by using the front-panel
the Measure menu Amplitude selection on the menu bar.
The Measure menu
Amplitude
key or
2-12
Page 29
The Applications menus
A Quick Tour
The Softkey Panels
The Applications menu
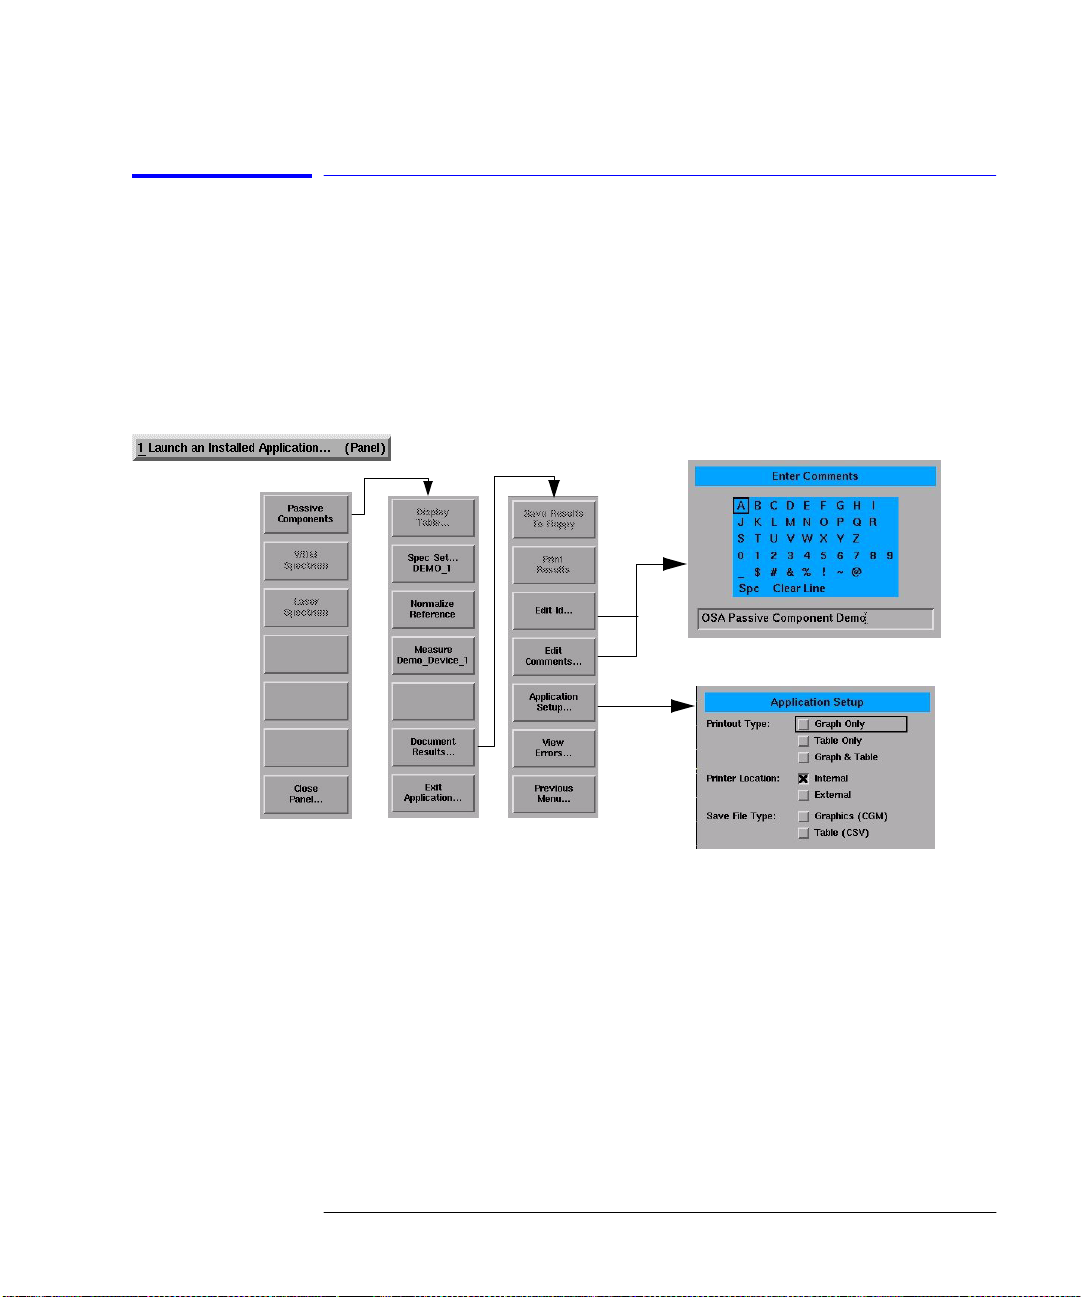
The Applications (Appl’s) softkeys are accessed by using the front-panel
key or the Applications menu Launch an Installed Application.... selection on
the menu bar.
For a complete description of the applications, refer to the manual that came
with your software.
Appl’s
2-13
Page 30
A Quick Tour
The Softkey Panels
The Bandwidth/Sweep menus
The Bandwidth/Sweep softkeys are accessed by using the front-panel
width/Sweep
menu bar.
The Measure menu
key or the Measure menu Bandwidth/Sweep selection on the
Band-
2-14
Page 31

The Marker menus
A Quick Tour
The Softkey Panels
The Measure menu
The Markers softkeys are accessed using the front-panel
Measure menu Markers selection on the menu bar.
Markers
key or the
2-15
Page 32

The File menu
A Quick Tour
The Softkey Panels
The Save/Recall menus
The Save/Recall softkeys and setup panels are accessed by using the dropdown File menu Save/Recall selection or the front-panel
these functions to save, recall and print the measurement results.
Save/Recall
key. Use
2-16
Page 33

The Systems menus
A Quick Tour
The Softkey Panels
The Options menu
The System softkeys are accessed using the front-panel
Options menu System selection on the menu bar.
System
key or the
2-17
Page 34

A Quick Tour
The Softkey Panels
The Traces menus
The Measure menu
The Traces softkeys are accessed by using the front-panel
Measure menu Traces selection on the menu bar.
Traces
key or the
2-18
Page 35

The Wavelength menus
A Quick Tour
The Softkey Panels
The Measure menu
The Wavelength softkeys are accessed using the front-panel
the Measure menu Wavelength selection on the menu bar.
Wavelength
key or
2-19
Page 36

A Quick Tour
Tutorial: Getting Started
Tutorial: Getting Started
This tutorial will introduce you to the HP 86140 series optical spectrum analyzer front panel controls. You will perform an auto alignment, perform a peak
search, use a delta marker and print the display.
Instrument setup
A source signal must be present at the input of the optical spectrum analyzer.
In this tutorial a Fabry-Perot laser was used as the source. You can use
another source o r the opti onal 1310/1550 nm
used, the display will differ from those shown.
To set the OSA to a know n state
1
Press the front-panel
complete description of preset conditions, see page 3-5.
To perform an Auto Align
For maximum amplitude accuracy, perform an automatic alignment whenever
the optical spectrum analyzer has been moved, subjected to large temperature
changes, or following warm-up. See “To perform an Automatic Alignment ” on
page 3-2 for more information.
2-20
Preset
key to set the instrument to a known state. For a
EELED
. If another source is being
Page 37

A Quick Tour
Tutorial: Getting Started
2
Connect a fiber from the source to the input connector of the optical spectrum
analyzer. Be sure to follow the good connector practices described in “Cleaning
Connections for Accurate Measurements” on page 6-10.
3
Enable the source.
4
Press the front-panel
Auto Align
key to optimize the detection of the incoming
signal. This takes a few moments to complete.
To perform a peak search
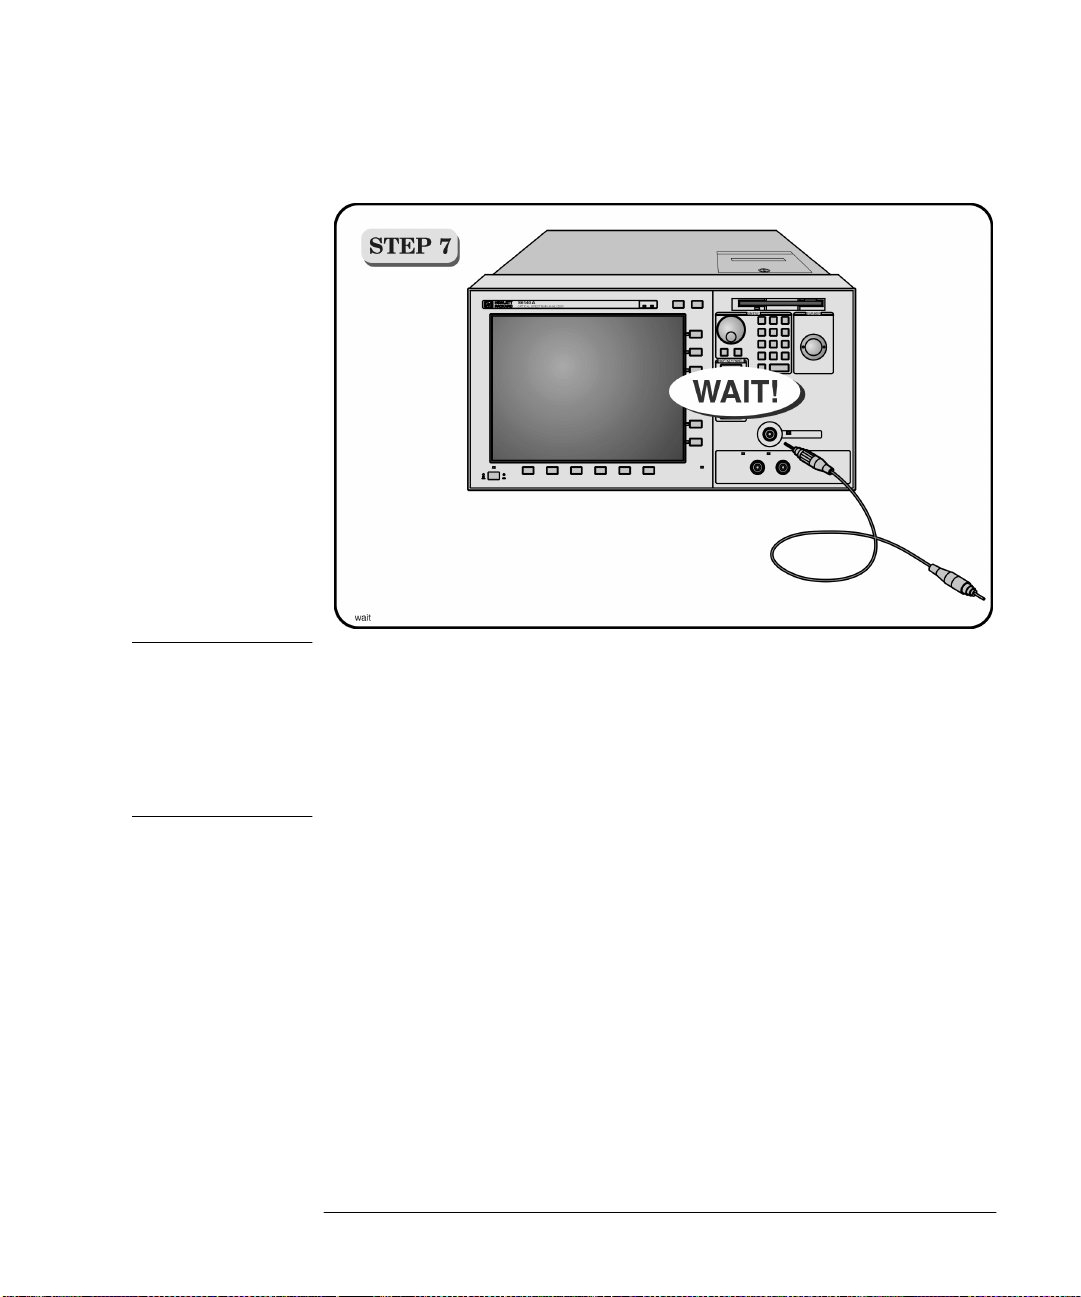
5
Press the front-panel
Auto Meas
key to locate and zoom-in on the signal. Please
wait until the Auto Measure routine is complete. A marker is placed on the peak
of the displayed signal.
Trace with normal marker.
To zoom in on the signal
Press the
Span
softkey and then use the knob, step keys, or numeric keypad to
zoom in on the signal.
2-21
Page 38

A Quick Tour
Tutorial: Getting Started
Using the delta marker
The optical spectrum analyzer has four types of markers; normal markers,
bandwidth markers, delta markers and noise markers. The marker currently
being displayed is a normal marker. In the next step we will use it as a delta
marker.
6
Press the front-panel
7
Press the
8
Press the
More Marker Functions....
Delta Marker
Marker
key.
softkey.
softkey to activate the delta marker and the active
function area.
9
Use the knob, step keys or numeric entry pad to move the delta marker.
10
The reference marker remains stationary.
Trace with delta marker.
Printing the display
11
Press the
Print
key to print a copy of the display. The output will be sent to the
internal or external printer, depending on the printer selected. For information
on selecting the printer, see “To set up a printer” on page 3-44.
2-22
Page 39

Changing the Printer Paper
A Quick Tour
Changing the Printer Paper
2-23
Page 40

A Quick Tour
Changing the Printer Paper
CAUTION
CAUTION
CAUTION
CAUTION
Avoid dropping the coin or screwdriver, used to open the printer door, into the
printer assembly.
Always use HP brand paper to ensure quality printing and long printer life.
Order paper as HP part number 9270-1370.
Never use the printer without printer paper as this can damage the printer
head.
• If the instrument is on, the paper feeder automatically scrolls whenever paper
is inserted into the feeder.
• Lift the paper latch to correct paper alignment problems. The scroll knob allows you to manually advance the paper.
To avoid damage caused by losing parts and tools inside the instrument, always
turn the instrument off
before
installing the printer paper.
2-24
Page 41

3
To perform an Automatic Alignment 3-2
Front-Panel Keys 3-3
The Menus 3-7
The Amplitude Menus 3-8
The Bandwidth/Sweep Menus 3-14
The Markers Menus 3-21
The Save/Recall Menus 3-34
The System Menus 3-40
The Traces Menus 3-56
The Wavelength Menus 3-61
To Fill In a Setup Panel 3-65
To use the navigation softkeys 3-66
Using the Optical Spectrum Analyzer
Page 42

Using the Optical Spectrum Analyzer
Using the OSA
Using the OSA
In this chapter, there are sections on both the menus and the front-panel keys.
Any of the instrument settings can be changed by using either the front-panel
keys or the menu bar selections. Many of the menu selections and front-panel
keys display a softkey panel. Settings in softkey panels are changed using the
softkeys, data-entry keys, mouse, and trackball.
To perform an Automatic Alignment
For maximum amplitude accuracy, perform an automatic alignment whenever the optical
spectrum analyzer has been moved, subjected to large temperature changes, or following warm-up. This function can also be accessed by choosing the Measure menu Auto
Align selection on the menu bar. For a complete description of the Auto Align function,
see the Auto Align section on the next page.
3-2
Page 43

Using the Optical Spectrum Analyzer
Front-Panel Keys
Front-Panel Keys
The optical spectrum analyzer has front-panel keys that perform a function
when pressed.
For maximum amplitude accuracy, perform the automatic alignment whenever the optical spectrum analyzer has been moved, subjected to large temperature changes, or following warm-up. This function can also be accessed by
choosing the Measure menu Auto Align selection on the menu bar.
Pressing the
matic alignment of the instrument using the largest signal found in a full span
sweep. This aligns the output of the monochromator with the photodetector
for improved amplitude accuracy. You should use the Auto Align function
whenever the OSA is bumped or physically moved to a new location.
The automatic alignment requires the connection of an external light source.
This can be a broadband or narrowband source. If there is insufficient signal
power, the automatic alignment will not be performed, and an error message
will be reported.
The Auto Align function saves and restores the current instrument state. This
allows the Auto Align function to be used in the middle of a measurement routine.
If markers are turned on, the Auto Align function attempts to do the automatic
alignment at the wavelength of the active marker. If the instrument is in zero
span, the alignment is performed at the center wavelength.
To perform an Auto Align function from the remote interface, see the descriptions of the following remote commands:
“CALibra tion:A LIGn ” on page 4-68
“CALibration:ALIGn:MARKer[1|2|3|4]” on page 4-68
Auto A lign
button on the front panel of the OSA performs an auto-
3-3
Page 44

Using the Optical Spectrum Analyzer
Front-Panel Keys
Pressing the
Auto Meas
button on the front panel of the OSA performs an automatic measurement of the largest signal found in a full span sweep and places
a marker at the signal peak. Auto measure requires the connection of an
external light source. This can be a broadband or narrowband source. If there
is insufficient signal power, the automatic measurement will not be performed,
and a warning message will be reported. This automatic measurement routine
is normally the best way to adjust sensitivity while maintaining the fastest
sweep rates.
The Auto Measure function uses trace A to perform the measurement. Since
the Auto Measure function can alter the instrument state, we recommend that
this operation be performed
before
a measurement sequence is started.
Using the Auto Measure Setup panel shown below, you can modify the
automeasure span and the vertical scale, tune to the wavelength indicated by
the marker and optimize the sensitivity. See “To change the automeasure
defaults” on page 3-53 for more information.
To perform an Auto Measure from the remote interface, see the descriptions
of the following remote commands:
“DISPlay[:WINDow[1]]:TRACe:ALL[:SCALe][:AUTO]” on page 4-71
“DISPlay[:WINDow[1]]:TRACe:X[:SCALe]:AUTO:SPAN
<numeric_value>[M|NM|UM]” on page 4-74
“DISPlay[:WINDow[1]]:TRACe:X[:SCALe]:AUTO:SPAN:AUTO ON|OFF|1|0”
on page 4-74
“DISPlay[:WINDow[1]]:TRACe:Y[:SCALe]:AUTO:PDIVision
<numeric_value>[DB]” on page 4-74
“DISPlay[:WINDow[1]]:TRACe:Y[1|2][:SCALe]:AUTO:PDIVision:AUTO
OFF|ON|0|1” o n page 4-74
“DISPlay[:WINDow[1]]:TRACe:ALL[:SCALe][:AUTO]:MARKer OFF|ON|0|1”
on page 4-73
“DISPlay[:WINDow[1]]:TRACe:ALL[:SCALe][:AUTO]:OPTimize
OFF|ON|0|1” o n page 4-73
3-4
Page 45

Using the Optical Spectrum Analyzer
Front-Panel Keys
Places the optical spectrum analyzer under local control. Enables the front
panel keys after the instrument has been under control with an external computer via HP-IB.
Sets the optical spectrum analyzer to a known state.
1 nm
Preset
Value
span ratio
position
Ratio units
Function
a
Function
Start wavelength 600 nm Stop wavelength 1700 nm
Wavelength offset 0 Wavelength step size Auto
Resolution bandwidth Auto Resolution bandwidth to
Wavelength units nm Medium Vacuum
Wavelength limit On Grating order Auto
Power reference level 0 dBm Power reference level
Power scale 10 dB/div Ratio reference level 0 dB
Ratio reference level position 5 Ratio scale 10 dB/div
Amplitude units Auto
Sensitivity Auto Video bandwidth Auto
Auto range On Trans-Z lock Off
Repetitive sweep On Sweep time Auto
Auto chop Off Gated sweep Off
Trigger mode Normal ADC trigger delay 10 µs
ADC sync out Off Sweep limit Off
Trace length 1001 Current source pulse width 100 µs
Current source duty cycle 100% Auto zero On
User wavelength calibration Enabled User power calibration Enabled
Graticule On Annotation On
Current marker MKR 1 Normal marker interpolation Off
Bandwidth marker interpolation On Normal marker units nm
Bandwidth marker units nm Peak search threshold –90 dBm
Threshold enable Off Peak search excursion 3 dB
Pit search excursion 3 dB Peak search on end-of-sweep Off
Marker search limit Off Line markers Off
Marker noise normalization
bandwidth
Marker 1–4 Off Marker 1–4 bandwidth Off
Preset
Value
0.01
9
Auto
3-5
Page 46

Using the Optical Spectrum Analyzer
Front-Panel Keys
Function
Marker 1–4 bandwidth
amplitude
Marker 1–4 noise Off Marker 1–4 delta marker
Current trace TRA Trace integration Off
Trace integration limit Off Trace mean Off
Trace mean limit Off Trace average count 100
Trace data format
TRB–TRF visibility Off TRA update On
TRB–TRF update Off TRA–TRF min hold Off
TRA–TRF max hold Off TRA–TRF averaging Off
TRA–TRF trace math Off TRB–TRF data 3-point
Raw trace 3-point
a. Ac cessible only via the remote interface.
a
Preset
Value
–3 dB Marker 1–4 delta Off
units
ASCII TRA visibility On
dummy trace
Function
Preset
Value
nm
dummy trace
Select this function to print a copy of the display. Using the Printer Setup
menu selection, you can specify the printer as the built-in printer or a printer
that is connected to the rear-panel parallel connector. See “To set up a
printer” on page 3-44 for a complete description of this function.
3-6
Page 47

Using the Optical Spectrum Analyzer
The Menus
The Menus
The front-panel menu keys are used to perform calibrations, setup measurements, set markers, save and recall data, set system preferences, and so forth.
Pressing a front-panel menu key displays a softkey menu or setup panel.
The Amplitude Menus 3-8
The Bandwidth/Sweep Menus 3-14
The Markers Menus 3-21
The Save/Recall Menus 3-34
The System Menus 3-40
The Traces Menus 3-56
The Wavelength Menus 3-61
3-7
Page 48

Using the Optical Spectrum Analyzer
The Amplitude Menus
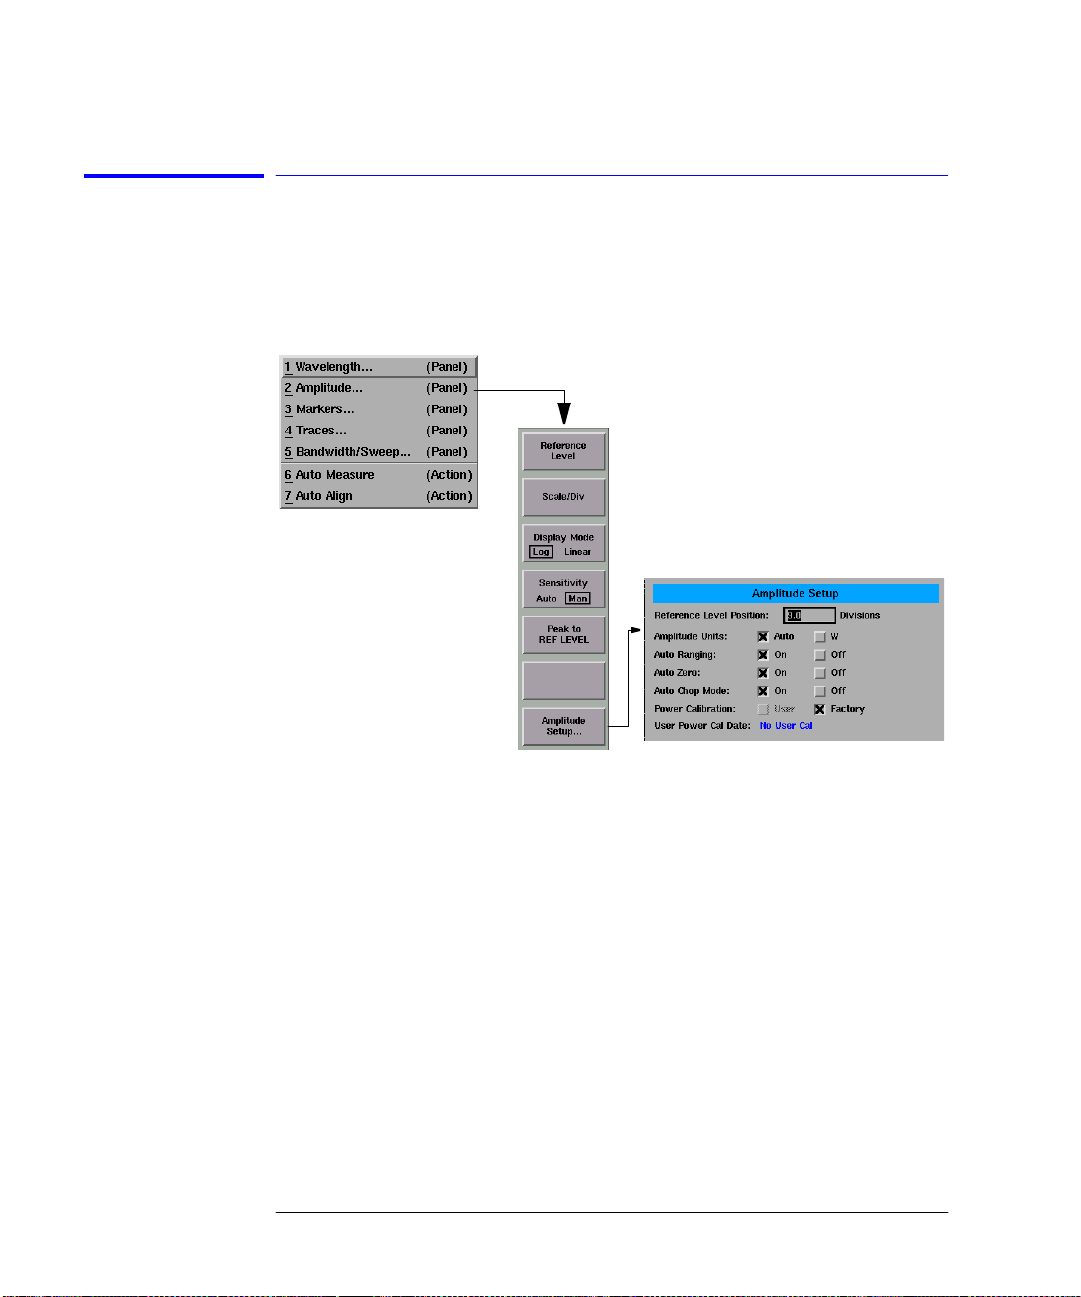
The Amplitude Menus
The Amplitude menus are accessed using the front-panel
Amplitude
key or the
Measure menu Amplitude selection on the menu bar. If you wish to change
amplitude settings, the following functions and setup panels are available:
Function See....
Reference Level “To change the reference level” on page 3-9
Scale/Division “To change the value of the vertical amplitude scale” on
page 3-9
Display Mode “To change the display mode between log and linear” on
page 3-10
Sensitivity “To change the sensitivity” on page 3-10
Peak to Reference Level “To set the reference level to the peak value” on page 3-11
Amplitude Setup.... “To change the default amplitude settings” on page 3-11
Note
Normally, the optical spectrum analyzer automatically selects the amplitude units
according to whether the scale is logarithmic (dBm) or linear (watts). See “To change the
default amplitude settings” on page 3-11.
Linear scale
In linear scale, the graticule is scaled in linear units, proportional to the input
power. The bottom of the graticule line represents zero watts. The top of the
graticule represents the reference level. Therefore, with 10 graticule lines,
each division represents 10% of the input signal at the top of the screen.
Logarithmic scale
Logarithmic scales range from 0.01 to 20.00 decibels-per-division. The 10 dBper-division scale is the default setting.
3-8
Page 49

Using the Amplitude functions
To change the reference level
Using the Optical Spectrum Analyzer
The Amplitude Menus
1
Press the front-panel
2
Press the
3
Use the knob, step keys or numeric entry pad to enter the desired value.
The reference level value is the amplitude level shown at the reference level
position. The reference level position is indicated on the display by a green
line and the
graticule division from the top of the display. For the right vertical scale, the
default position is midscreen. The reference level can be specified in dBm or
watts.
Note
When using the step keys, the increment and decrement values are determined by the
settings of the Scale/Division function. See “To change the value of the vertical ampli-
tude scale” for more information.
Note
If both the left and right vertical scales are displayed, the reference level of the active
trace is adjusted.
To change the value of the vertical amplitude scale
Reference Level
REF
Amplitude
annotation on the display. The default position is one major
key.
softkey.
1
Press the front-panel
2
Press the
3
Use the knob, step keys or numeric entry pad to enter the desired value.
Note
This function determines the amount the value increases or decreases when using the
arrow keys to set the reference level. See “To change the reference level” for more
information.
Scale/Div
Amplitude
softkey.
key.
3-9
Page 50

Using the Optical Spectrum Analyzer
The Amplitude Menus
Note
If both the left and right vertical scales are displayed, the scale/division of the active
trace is changed.
To change the display mode between log and linear
1
Press the front-panel
2
Press the
To change the sensitivity
1
Press the front-panel
2
Press the
3
Use the knob, step keys or numeric entry pad to enter the desired value.
This key toggles the sensitivity between automatic and manual. The sensitivity
setting indicates the smallest signal amplitude that will be displayed across
the current wavelength range. Increasing sensitivity slows the sweep speed.
An increase in sensitivity may also require a narrower video bandwidth, which
will slow the sweep speed.
Normally, the optical spectrum analyzer selects the greatest sensitivity possible that does not require amplification changes during the sweep. If you manually increase the sensitivity level, the sweep pauses to allow this change in
gain.
Automatic mode
When in automatic mode, the analyzer selects the greatest sensitivity possible
that does not require amplification changes during the sweep.
Display Mode
Sensitivity
softkey to toggle between Auto and Manual modes.
Amplitude
key.
softkey to toggle between Log and Linear data display.
Amplitude
key.
Manual mode
When sensitivity is increased manually, the sweep pauses to allow this change
in gain.
3-10
Page 51

Note
The settings for sensitivity, video bandwidth and sweep time interact. If the sensitivity is
set to manual, the video bandwidth and sweep time may be forced to Auto mode. If the
video bandwidth is set to manual, the sensitivity and sweep time may be forced to Auto.
If the sweep speed is set to manual and is set too fast, the
come on in the display area. Since these settings interact, it is recommended that only
of the settings be changed, whichever setting is most important to the measurement
one
task being performed.
To set the reference level to the peak value
Using the Optical Spectrum Analyzer
The Amplitude Menus
OVER SWEEP
indicator will
1
Press the front-panel
2
Press the
Peak to REF LEVEL
Amplitude
The system sets the value of the reference level equal to the value of the highest point on the active trace.
To change the default amplitude settings
1
Press the front-panel
2
Press the
3
The Amplitude Setup panel opens. Refer to “To Fill In a Setup Panel” on
Amplitude Setup....
Amplitude
page 3-65 for information on changing and selecting items in the setup panel.
The Amplitude Setup panel
key.
softkey.
key.
softkey.
3-11
Page 52

Using the Optical Spectrum Analyzer
The Amplitude Menus
Setup panel
select ions
Reference Level Position
The value selected for the Reference Level Position determines the position of
the reference level on the graticule. Setting this value to zero divisions places
the reference level on the very bottom of the grid. Setting the reference level
to 10 divisions places the reference level at the top of the grid. Pressing the
front-panel
Preset
key resets the reference level to 9.0 divisions.
Note
When using the knob or step keys, the value will automatically change. When using the
numeric entry pad, a terminator must be selected from the softkey panel.
Amplitude Units
Selecting Auto for amplitude units allows power to be shown in dBm when
using the logarithmic scale and in watts when using the linear scale. Selecting
W forces the readout to be in watts, regardless of the amplitude scaling.
Auto Ranging
The Auto Range function allows the OSA to change the gain of the transimpedance amplifier during a sweep. This provides measurements to be made at
the widest dynamic range and at the fastest sweep speed.
Pressing the front-panel
Preset
key turns Auto Ranging ON.
Note
It is recommended that Auto Ranging always be turned ON.
Auto Zero
Turns Auto Zero ON and
be zeroed between sweeps. Selecting
front-panel
Preset
key resets this function to ON.
OFF
. Auto Zero ON enables the internal amplifiers to
OFF
disables this feature. Pressing the
Note
Turning Auto Zero
allows the instrument to sweep faster, but results in less accu-
OFF
racy on low level signals.
3-12
Page 53

Using the Optical Spectrum Analyzer
The Amplitude Menus
Note
The optical spectrum analyzer performs a more complete zeroing when the instrument is
first turned on. You can run this more complete routine anytime by pressing the
softkey. Refer to “To zero the instrument” on page 3-50 for more information.
Now
Zero
Auto Chop Mode
Enables the spectrum analyzer chop mode. Chop mode increases dynamic
range for long sweep times by subtracting ambient light. Subtracting the ambient light can improve sensitivity but slow down the sweep speed.
Pressing the front-panel
Preset
key turns this function
OFF
.
Note
Sweep times of 50 msec × the # of trace points, or longer, use a special “chop” mode.
Chop mode increases dynamic range, stabilizes measurements against drift, and reduces
effects of stray light. This special chop mode is enabled by setting the Auto Chop mode
to ON.
Power Calibration
Power Calibration allows you to use amplitude correction factors either from
the factory calibration or from the last successful user calibration. Pressing
the front-panel
Pre set
key resets this function to User. If a user calibration has
not been performed, the factory calibration data is used.
User Power Cal Date
The User Power Cal Date displays the date of the last successful user-performed amplitude calibration. See “To perform a power calibration” on
page 3-44 for information on performing an amplitude calibration.
3-13
Page 54

Using the Optical Spectrum Analyzer
The Bandwidth/Sweep Menus
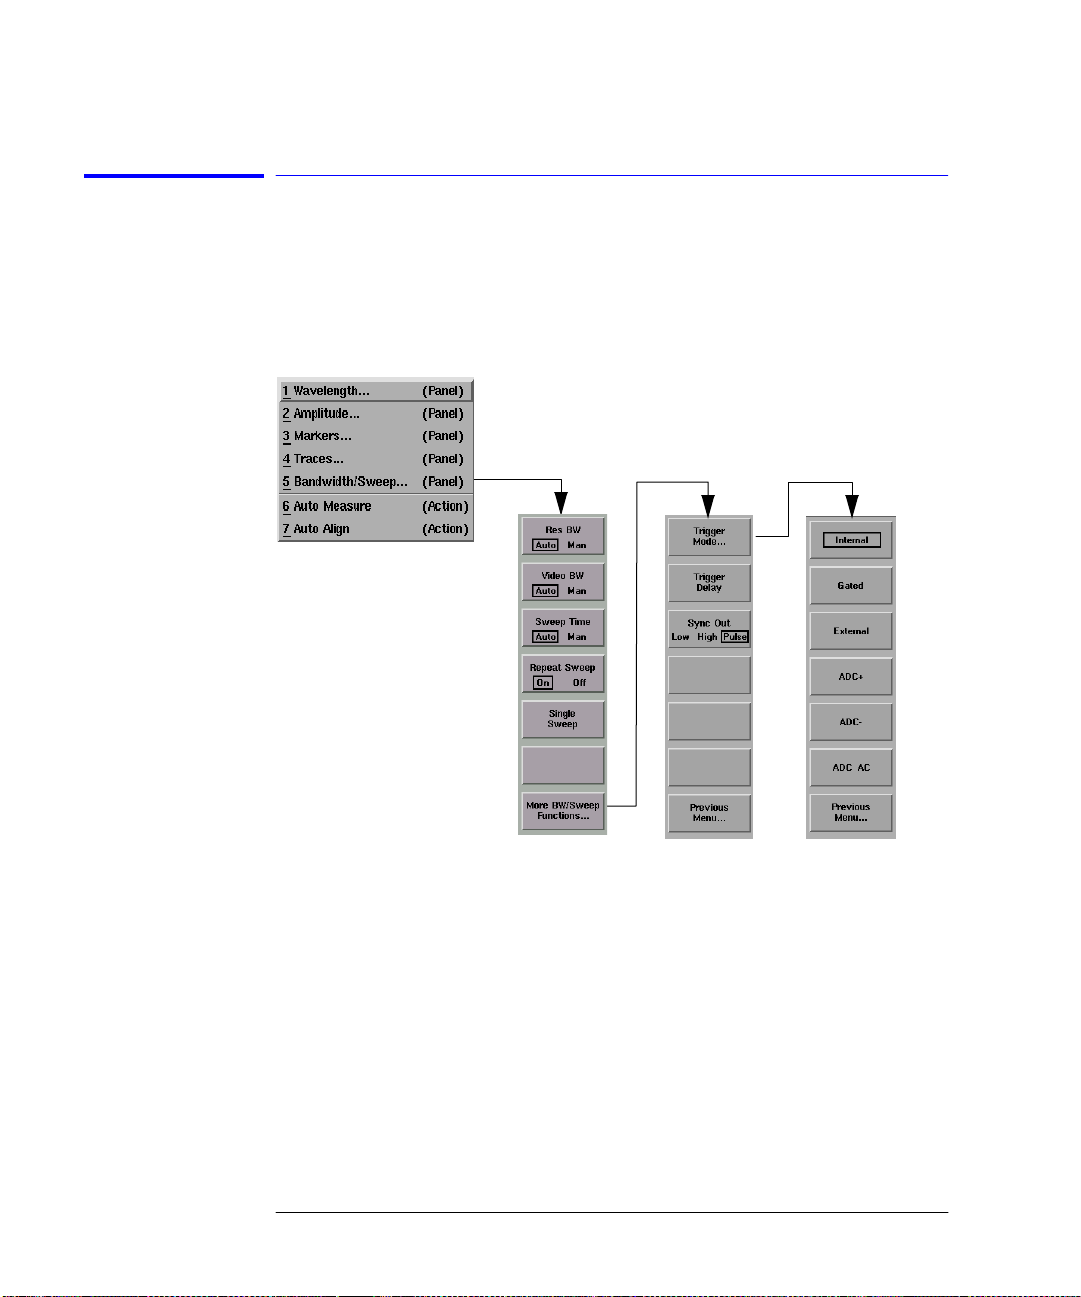
The Bandwidth/Sweep Menus
The Bandwidth/Sweep softkeys are accessed by using the front-panel
width/Sweep
key or the Measure menu Bandwidth/Sweep selection on the
Band-
menu bar. If you wish to change bandwidth or sweep settings, the following
functions and setup panels are available:
Function See....
Resolution Bandwidth “To change the resolution bandwidth” on page 3-15
Video Bandwidth “To change the video bandwidth” on page 3-15
Sweep Time “To change the sweep time” on page 3-16
Repeat Sweep “To turn repeat sweep on and off” on page 3-17
Single Sweep “To perform a single sweep” on page 3-17
Trigger Mode....
Internal “To select the internal trigger” on page 3-18
Gated “To select a gated trigger” on page 3-18
External “To select an external trigger” on page 3-19
ADC+, ADC–, and ADC AC “To select the
Trigger Delay “To set the trigger delay” on page 3-20
trigger” on page 3-19
ADC
Synch Out “To select the synchronous output” on page 3-20
3-14
Page 55

Using the Bandwidth/Sweep functions
To change the resolution bandwidth
The ability to display two closely spaced signals as two distinct responses is
determined by resolution bandwidth.
Using the Optical Spectrum Analyzer
The Bandwidth/Sweep Menus
1
Press the front-panel
2
Press the
3
Toggle between selecting the resolution bandwidth automatically or manually.
4
Use the knob, step keys or numeric entry pad to enter the desired value.
The resolution bandwidth can be set to one of the following values:
0.07 (0.06 for the HP 86142A and 86145A), 0.1, 0.2, 0.5, 1, 2 , 5, or 10 nm.
Resolution bandwidth filtering occurs before detection of the light.
In Auto mode, the resolution bandwidth is coupled to the span in a preset
0.01:1 ratio. This means that the optical spectrum analyzer attempts to set a
bandwidth value that is 1% of the span setting. You can alter this behavior by
manually setting the resolution bandwidth.
To change the video bandwidth
1
Press the front-panel
2
Press the
3
Toggle between selecting the video bandwidth automatically or manually.
4
Use the knob, step keys or numeric entry pad to enter the desired value.
Video bandwidth filtering occurs after detection of the light. In the autocoupled mode, the video bandwidth has an extremely wide range. This allows the
optical spectrum analyzer to avoid unnecessary filtering that would reduce the
sweep speed more than required.
Normally, the video bandwidth is coupled to the requested sensitivity. Manually entering a video bandwidth breaks this coupling. The video bandwidth can
be manually set from 100 mHz to 3 kHz, or the bandwidth of the currently
selected transimpedance amplifier, whichever is less.
Res BW
Video BW
Bandwidth/Sweep
softkey.
Bandwidth/Sweep
softkey.
key.
key.
3-15
Page 56

Using the Optical Spectrum Analyzer
The Bandwidth/Sweep Menus
The following functions affect video bandwidth:
• Changing the sensitivity value.
• Changing the reference level.
• Turning autoranging ON or
The range of video bandwidth available in Auto mode is much greater than can
be set manually from the front panel. A lower video bandwidth value requires
a longer sweep time. Because of the interdependence between the video
bandwidth and sensitivity, it is recommended that either the sensitivity or the
video bandwidth be changed, whichever is the most important to the measurement task being performed.
To change the sweep time
OFF
.
1
Press the front-panel
2
Press the
3
Toggle between selecting sweep time automatically or manually.
4
Use the knob, step keys or numeric entry pad to enter the desired value.
Sweep Time
Bandwidth/Sweep
softkey.
key.
The sweep time is the amount of time required for the optical spectrum analyzer to sweep the current measurement range. The optical spectrum analyzer
automatically selects sweep times based on coupling of the following instrument settings:
• Wavelength span
• Resolution bandwidth
• Video bandwidth
• Sensitivity
• Trace length
• Power level
Coupling of these parameters yields optimum amplitude accuracy. When coupled, the optical spectrum analyzer always uses the fastest sweep possible
while still maintainin g the specified accuracy. Coupled, sweep times range
from 50 ms to a maximum value that depends on the n umber of t race points
used to draw the trace. This relationship is shown in the following equation:
50 ms sweep time 1s()trace points()≤≤
The default number of trace points is 1001, so the maximum sweep time is
normally 100 seconds. When coupling is disabled, the sweep time can be set
from 56.3 ms to a maximum of 1000 seconds. If you change the number of
trace points, the maximum sweep time changes as well.
3-16
Page 57

Manually setting the sweep time turns coupling off.
Note
Using the Optical Spectrum Analyzer
The Bandwidth/Sweep Menus
If the sweep time is set too fast, an
play is no longer calibrated and that trace data may not meet specifications. Increase
the sweep time until the
slow, measurement times may be excessively long.
To turn repeat sweep on and off
1
Press the front-panel
2
Press the
Repeat Sweep
To perform a single sweep
1
Press the front-panel
2
Press the
Single Sweep
then stop.
When first turned on, the optical spectrum analyzer uses free run triggering
with continuous sweeps. Free run triggering ensures evenly timed sweeps for
a stable display of the current tuning range. Sweeps continuously repeat as
long as trigger conditions are met. The
of the optical spectrum analyzer is on when the sweep is in progress. The indicator is off between sweeps.
OVER SWEEP
OVER SWEEP
message disappears. If the sweep time is set too
Bandwidth/Sweep
softkey to toggle this function ON or
Bandwidth/Sweep
message appears indicating the dis-
key.
OFF
key.
.
softkey. The instrument will perform a single sweep and
SWEEP
indicator light on the front panel
Note
Single sweep mode is especially useful when programming the instrument. Use single
sweeps for the following reasons:
• Insure trace reflects current measurement range settings
• Capture traces before processing them with math commands
• Capture traces before positioning markers
3-17
Page 58

Using the Optical Spectrum Analyzer
The Bandwidth/Sweep Menus
To select the internal trigger
1
Press the front-panel
2
Press the
3
Press the
4
Press the
Internal triggering synchronizes the start of the sweep to an internally generated trigger signal. Internal triggering ensures continuously triggered sweeps
with the shortest delay between sweeps.
To select a gated trigger
1
Press the front-panel
2
Press the
3
Press the
4
Press the
In some measurements, the spectrum at a particular time within the modulation period is more important than the average spectrum. Gated triggering can
be used to synchronize the data acquisition portion of the OSA to a gating trigger connected to the rear-panel EXT TRIG IN connector. Gated triggering
requires a TTL-compatible signal with a minimum of 0 Vdc and a maximum of
+5 V.
Gated triggering is used to select data samples containing valid information.
When the gating signal is high, the data sample is accepted. When the gating
signal is low, the data sample is replaced by a data point with a value of
–200 dBm. The sweep time must be long enough to get data for each wavelength point, or else the Max Hold function must be used to complete a trace
over several sweeps.
Bandwidth/Sweep
More BW/Sweep Functions....
Trigger Mode....
Internal
softkey.
softkey.
Bandwidth/Sweep
More BW/Sweep Functions....
Trigger Mode....
Gated
softkey.
softkey.
key.
softkey.
key.
softkey.
3-18
Page 59

To select an external trigger
Using the Optical Spectrum Analyzer
The Bandwidth/Sweep Menus
To sele ct the
1
Press the front-panel
2
Press the
3
Press the
4
Press the
More BW/Sweep Functions....
Trigger Mode....
External
Bandwidth/Sweep
softkey.
softkey.
key.
softkey.
External triggering synchronizes the sweep with a signal connected to the
rear-panel
EXT TRIG IN
connector. External triggering requires a TTL-compatible signal with a minimum of 0 V and a maximum of +5 V. There is a time
delay between the external trigger signal and the data measurement that is set
by the Trigger Delay value.
trigger
ADC
1
Press the front-panel
2
Press the
3
Press the
4
Press either the
More BW/Sweep Functions....
Trigger Mode....
Bandwidth/Sweep
softkey.
ADC+, ADC–
, or
softkey.
ADC AC
key.
softkey.
The softkeys in the menu select the type of triggering for the analog-to-digital
converter in the data acquisition hardware of the OSA. The
ADC+
gers the OSA on the rising edge of the external trigger signal, and the
softkey triggers it on the falling edge. The
ADC AC
softkey alternately triggers
on the rising and falling edge of the external trigger signal. The amplitude
measured on opposite edges are subtracted and the absolute value of the
result becomes the trace amplitude value. The delay between the external
trigger and the triggering of the analog-to-digital converter is set by the trigger
delay value.
softkey trig-
ADC–
3-19
Page 60

Using the Optical Spectrum Analyzer
The Bandwidth/Sweep Menus
To set the trigger delay
1
Press the front-panel
2
Press the
3
Press the
4
Use the knob, step keys or numeric entry pad to enter the desired value.
5
Use the
More BW/Sweep Functions....
Trigger Delay
Trigger Delay
the triggering of the analog-to-digital converter.
The value you select is displayed in the Active Function Area.
To select the synchronous output
1
Press the front-panel
2
Press the
3
Press the
More BW/Sweep Functions....
Sync Out
The synchronous output allows external equipment to receive a sync signal at
each sample point of the OSA sweep. When
TTL LOW
. When
specified, the signal will go
goes low when the analog-to-digital converter is triggered. The width of the
synchronous output pulse is equal to the trigger delay.
Bandwidth/Sweep
key.
softkey.
softkey.
softkey to set the delay between the external trigger and
Bandwidth/Sweep
key.
softkey.
softkey until th e desired output is selected.
LOW
is selected, the signal will be a
HIGH
is selected, the signal will be a
HIGH
when the external trigger is recognized and
TTL HIGH
. When
PULSE
is
3-20
Page 61

The Markers Menus
Using the Optical Spectrum Analyzer
The Markers Menus
The Markers softkeys are accessed using the front-panel
Markers
key or the
Measure menu Markers selection on the menu bar. If you wish to change
marker settings, the following functions and setup panels are available:
Function See....
Active Marker.... “To select the active marker” on page 3-23
Marker Trace.... “To set the active trace” on page 3-23 (Marker key)
Marker Bandwidth.... “To set markers to measure bandwidth” on page 3-24
–3 dB, –6 dB, –10 dB, –20 dB
Marker Bandwidth Off
Peak Search “To perform a peak search” on page 3-25
Marker to Center “To change the center wavelength with a marker” on
Marker to Reference Level “To change the reference level with a marker” on page 3-25
More Marker Functions....
Marker Search Menu....
Search Mode “To perform a peak search” on page 3-25
“To set markers to measure bandwidth” on page 3-24
“To perform a peak search using a marker” on page 3-24
page 3-24
“To perform a pit search” on page 3-26
Noise Marker “To set the noise marker function” on page 3-27
Delta Marker “To set the delta marker function” on page 3-28
Trace Integration “To calculate the total power under a trace” on page 3-28
Line Marker Menu....
Wavelength Marker 1 “To set the wavelength line markers” on page 3-28
3-21
Page 62

Using the Optical Spectrum Analyzer
The Markers Menus
Function See....
Wavelength Marker 2 “To set the wavelength line markers” on page 3-28
All Line Markers Off “To turn off all line makers and line marker functions” on
page 3-29
Advanced Line Marker Functions....
Sweep Limit “To sweep between line markers” on page 3-29
Search Limit “To search between line markers” on page 3-29
Integrate Limit “To integrate between line markers” on page 3-30
Marker Setup.... “To change the default marker settings” on page 3-30
3-22
Page 63

Using the Marker functions
To select the active marker
Using the Optical Spectrum Analyzer
The Markers Menus
1
Press the front-panel
2
Press the
3
Select the appropriate marker to activate, deactivate, or turn all markers off.
Selecting a marker always places that marker on the currently selected Active
trace at the center wavelength. Turning a marker
function that was on for that particular marker. When the marker is turned ON
again, all the marker functions for that marker will be off.
To set the active trace
1
Press the front-panel
2
Press the
3
Select the trace to activate.
or
1
Press the front-panel
2
Press the
3
Select the trace to activate.
Note
Markers
Active Marker....
Markers
Active Trace....
Traces
Active Trace....
key.
softkey.
key.
softkey.
key.
softkey.
OFF
will turn off any marker
The active trace is designated by a double arrow (>>) on either the right or left side of
the display.
3-23
Page 64

Using the Optical Spectrum Analyzer
The Markers Menus
To set markers to measure bandwidth
1
Press the front-panel
2
Select an active marker.
3
Place the marker on the peak of the signal to be measured by pressing the
SEARCH
softkey.
4
Press the
5
Select a pre-defined bandwidth or use the knob, step keys, or numeric entry
Marker BW....
Markers
softkey.
pad to enter the active marker bandwidth amplitude for the active marker.
If a peak search is not performed, then pressing the
the bandwidth around the currently active marker. If the bandwidth markers
cannot be placed at the selected value, an error message, such as “
found
” will be displayed.
To perform a peak search using a marker
1
Press the front-panel
2
Select an active marker.
3
Press the
PEAK SEARCH
Markers
softkey.
The active marker is placed on the highest point of the active trace. If no
marker is ON, Marker #1 will be turned ON and placed on the highest point of
the active trace.
key.
key.
Marker BW....
PEAK
softkey finds
BW not
To change the center wavelength with a marker
1
Press the front-panel
2
Place a marker on the trace to be centered.
3
Press the
Marker to CENTER
Markers
softkey.
key.
The center wavelength is set to the wavelength value of the active marker.
3-24
Page 65

To change the reference level with a marker
Using the Optical Spectrum Analyzer
The Markers Menus
1
Press the front-panel
2
Place a marker on the trace at the level you want moved to the reference level
position.
3
Press the
The reference level is set to the amplitude of the active marker.
To perform a peak search
1
Press the front-panel
2
Select an active marker.
3
Press the
or
1
Press the front-panel
2
Select an active marker.
3
Press the
4
Press the
5
Press the
6
Press the
Markers
key.
Marker to REF LEVEL
PEAK SEARCH
Markers
softkey.
Markers
softkey.
key.
key.
More Marker Functions....
Marker Search Menu....
Search Mode....
Peak Search
softkey. Select from the following options:
softkey.
softkey and toggle to select Peak search mode.
softkey.
Next Peak Down
Places the marker on the next highest peak from the current marker amplitude. This next highest peak must meet the peak excursion and threshold criteria. If the specified marker is
OFF
, it will be turned ON, placed at the center
wavelength, and the search for the next maximum will begin from that point.
Next Peak Left
Places the marker on the next p eak located at a shorter wavelength than the
current marker wavelength position. This next peak must meet the peak
excursion and threshold criteria. If the specified marker is
OFF
, it will be
turned ON, placed at the center wavelength, and the search to the left will
begin from that point.
3-25
Page 66

Using the Optical Spectrum Analyzer
The Markers Menus
Next Peak Right
Places the marker on the next peak located at a longer wavelength than the
current marker wavelength position. This next peak must meet the peak
excursion and threshold criteria. If the specified marker is
turned ON, placed at the center wavelength, and the search to the right will
begin from that point.
Active Marker....
Turns a particular marker ON or
marker function that was on for that particular marker. When the marker is
turned ON again, all the marker functions for that marker will be off.
Note
For addition information on setting the peak and pit excursion criteria, see “Peak Excur-
sion” and “Pit Excursion” on page 3-32.
To perform a pit search
OFF
. Turning a marker
OFF
, it will be
OFF
will turn off any
1
Press the front-panel
2
Select an active marker.
3
Press the
4
Press the
5
Press the
6
Press the
More Marker Functions....
Marker Search Menu....
Search Mode....
Pit Search
Markers
key.
softkey.
softkey.
softkey and toggle to select Pit search mode.
softkey. Select from the following options:
Next Pit Up
Places the marker on the next lowest pit from the current marker amplitude.
This next highest pit must meet the peak excursion and threshold criteria. If
the specified marker is
OFF
, it will be turned ON, placed at the center wave-
length, and the search for the next minimum will begin from that point.
Next Pit Left
Places the marker on the next pit located at a shorter wavelength than the
current marker wavelength position. This next pit must meet the pit excursion
and threshold criteria. If the specified marker is
OFF
, it will be turned ON,
placed at the center wavelength, and the search to the left will begin from that
point.
3-26
Page 67

Next Pit Right
Places the marker on the next pit located at a longer wavelength than the current marker wavelength position. This next pit must meet the pit excursion
and threshold criteria. If the specified marker is
placed at the center wavelength, and the search to the right will begin from
that point.
Active Marker....
Turns a particular marker ON or
marker function that was on for that particular marker. When the marker is
turned ON again, all the marker functions for that marker will be off.
Note
For addition information on setting the peak and pit excursion criteria, see “Peak Excur-
sion” and “Pit Excursion” on page 3-32.
To set the noise marker function
OFF
. Turning a marker
Using the Optical Spectrum Analyzer
The Markers Menus
OFF
, it will be turned ON,
OFF
will turn off any
1
Press the front-panel
2
Select an active marker.
3
Press the
4
Press the
5
Toggle the noise marker ON or
More Marker Functions....
Noise Marker
Markers
softkey.
key.
softkey.
OFF
.
The noise marker measures the spectral power density at the position of the
active marker. The measurement is referenced to a 0.1 nm or 1 nm resolution
bandwidth. The reference bandwidth used to normalize the noise is selected
on the Marker setup panel. See “To change the default marker settings” on
page 3-30 for additional information.
3-27
Page 68

Using the Optical Spectrum Analyzer
The Markers Menus
To set the delta marker function
1
Place the marker to be used as a reference on the desired trace and at the
desired wavelength.
2
Press the front-panel
3
Press the
4
Press the
More Marker Functions....
Delta Marker
Markers
softkey.
To fix the position of the reference marker and activate the delta marker, toggle the delta marker ON. Use the front-panel knob or keypad to move the delta
marker to the desired location. If the delta function is turned ON and no
marker is active, Marker #1 will be turned ON, placed at the center wavelength,
and the delta function will be turned ON.
To calculate the total power under a trace
1
Press the front-panel
2
Press the
3
Use the
More Marker Functions....
Trace Integ
Markers
softkey to turn trace integration on.
Only one total power calculation can be turned on at a time. For example, if a
total power calculation is being performed on trace A, turning a total power
calculation for trace B ON will turn the calculation for trace A
To set the wavelength line markers
1
Press the front-panel
Markers
key.
softkey.
key.
softkey.
key.
OFF
.
2
Press the
3
Press the
4
Press the
5
Position the line markers using the knob, step keys, or numeric entry pad.
More Marker Functions....
Line Marker Menu....
Wavelength Marker 1
softkey.
or
softkey.
Wavelength Marker 2
softkey.
Line markers let you perform sweeps, searches and integrations over a
reduced section of the selected wavelength range. Wavelength Marker 1 is
always to the left of Wavelength Marker 2.
3-28
Page 69

To turn off all line makers and line marker functions
Using the Optical Spectrum Analyzer
The Markers Menus
1
Press the front-panel
2
Press the
3
Press the
4
Press the
More Marker Functions....
Line Marker Menu....
Line Markers Off
To sweep between line markers
1
Press the front-panel
2
Press the
3
Press the
4
Select and set Wavelength Marker 1 and 2 to the desired wavelength sweep
More Marker Functions....
Line Marker Menu....
limits.
5
Press the
6
Press the
Advanced Line Mkr Functions....
Sweep Limit
When the sweep limit is ON, the instrument will only sweep between Wavelength Marker 1 and Wavelength Marker 2.
To search between line markers
Markers
key.
softkey.
softkey.
softkey.
Markers
key.
softkey.
softkey.
softkey.
softkey to toggle this function ON or
OFF
.
1
Press the front-panel
2
Press the
3
Press the
4
Select and set Wavelength Marker 1 and 2 to the desired wavelength search
More Marker Functions....
Line Marker Menu....
Markers
key.
softkey.
softkey.
limits.
5
Press the
6
Press the
Advanced Line Mkr Functions....
Sear ch Limit
softkey to toggle this function ON or
softkey.
OFF
.
When the search limit is ON, all the marker peak/pit searches will be between
Wavelength Marker 1 and Wavelength Marker 2.
3-29
Page 70

Using the Optical Spectrum Analyzer
The Markers Menus
To integrate between line markers
1
Press the front-panel
2
Press the
3
Press the
4
Select and set Wavelength Marker 1 and 2 to the desired integration limits.
5
Press the A
6
Press the
More Marker Functions....
Line Marker Menu....
dvanced Line Mkr Functions
Integrate Limit
Turning the integration limit ON will calculate the power between Wavelength
Marker 1 and Wavelength Marker 2 when the Trace Integration function in ON.
See “To calculate the total power under a trace” on page 3-28.
Note
Although there is a single range controlling the total power integration, the marker
search range, and the wavelength sweep range, there are three independent state settings for limiting the total power integration, the marker search, and the wavelength
sweep to the range.
To change the default marker settings
1
Press the front-panel
Markers
key.
softkey.
softkey.
.... softkey.
softkey to toggle this function ON or
Markers
key.
OFF
.
2
Press the
3
Press the
4
The Marker Setup panel opens. Refer to “To Fill In a Setup Panel” on page 3-65
More Marker Functions....
Marker Setup....
softkey.
softkey.
for information on changing and selecting it ems in the setup panel.
3-30
Page 71

The Marker Setup panel
Using the Optical Spectrum Analyzer
The Markers Menus
Setup panel
select ions
Normal Marker Units
Sets the X-axis readout for frequency or wavelength when the instrument is in
a non-zero span. This setting controls only the normal marker X-axis and the
delta reference readout. This setting controls all four normal markers. The
bandwidth and delta offset markers have their own settings.
Bandwidth Marker Units
Sets the bandwidth marker X-axis readout for frequency or wavelength when
the instrument is in a non-zero span. The delta markers have their own setting. This setting controls all four bandwidth markers.
Delta Marker Units
Sets the delta marker X-axis readout for frequency or wavelength when the
instrument is in a non-zero span. The bandwidth markers have their own setting. This setting controls all four delta markers.
Normal/Delta Marker Interpolation
Turns the normal/delta marker interpolation ON or
ON
, the normal/delta markers will be placed at the exact wavelength or fre-
OFF
. When interpolation is
quency value selected if it is within the trace range. The marker will linearly
interpolate between two trace data points. The default state is
OFF
.
This setting controls the interpolation state for all four markers when in the
normal or delta mode.
3-31
Page 72

Using the Optical Spectrum Analyzer
The Markers Menus
Bandwidth Marker Interpolation
Turns the bandwidth marker interpolation ON or
ON
, the bandwidth markers will be placed at the exact number of dB (NDB)
OFF
. When interpolation is
from the normal marker if within the trace range. The position of the marker
will be linearly interpolated between two trace data points. The default state is
ON
. If interpolate is
OFF
, for negative NDB values, the bandwidth markers will
be at values closest to and more negative than the NDB value. For positive
NDB values, the bandwidth markers will be at values closest to and more positive than the NDB values. This will typically result in a wider bandwidth measuremen t.
Peak Excursion
Sets the peak excursion value for the marker search routines.
Peak excursion criteria
The peak excursion value is used to determine whether or not a local maximum in the trace is to be considered a peak. To qualify as a peak, both sides of
the local maximum must fall by at least the peak excursion value.
Pit Excursion
Sets the pit excursion value for the marker search routines.
Pit excur s io n criteria
The pit excursion value is used to determine whether or not a local minimum
in the trace is to be considered a pit. To qualify as a pit, both sides of the local
minimum must rise by at least the pit excursion value.
3-32
Page 73

Using the Optical Spectrum Analyzer
The Markers Menus
Use Marker Search Threshold
This limits the marker search function to data points above the selected
threshold level.
Marker Search Threshold Value
Selects the amplitude threshold value used for limiting the marker search
function. When Marker Search Threshold is ON, a dotted line is shown on the
display at the threshold level.
Noise Marker Reference Bandwidth
Sets the normalization bandwidth for the noise marker. There are two allowable settings: 1 nm and 0.1 nm.
Note
Changing this value will change the value of the noise marker by 10 dB.
Peak Search at End of Each Sweep
Finds the peak value of the trace and moves the marker to the peak at the end
of each sweep. This function operates on the active marker. This function
operates on normal, delta, bandwidth and noise markers.
3-33
Page 74

Using the Optical Spectrum Analyzer
The Save/Recall Menus
The Save/Recall Menus
The Save/Recall softkeys are accessed by using the front-panel
Save/Recall
key
or the File menu Save/Recall selection on the menu bar. If you wish to change
save or recall settings, the following functions are available:
Function See....
Save Menu.... “To save measurement and trace data” on page 3-35
Recall Menu.... “To recall measurement and trace data” on page 3-37
“To select a file from the catalog” on page 3-37
Delete Menu.... “To delete a file from internal memory or a floppy disk” on page 3-38
Format Floppy Disk.... “To format a floppy disk” on page 3-39
Backup/Restore Menu....
Backup Internal Memory “To backup or restore the internal memory” on page 3-39
Restore Internal Memory “To backup or restore the internal memory” on page 3-39
Fast Save “To save in Fast Save mode” on page 3-39
Fast Recall “To recall in Fast Recall mode” on page 3-39
3-34
Page 75

Using the Save/Recall functions
To save measurement and trace data
Using the Optical Spectrum Analyzer
The Save/Recall Menus
Setup panel
select ions
1
Press the front-panel
2
Press the
3
The Save Setup panel opens. Refer to “To Fill In a Setup Panel” on page 3-65
for information on changing and selecting it ems in the setup panel.
The Save Setup panel
Save
Saves the measurement data in a binary format (
traces and all measurement conditions. When the file is recalled, the instrument state will be set to the same state as when the file was saved. The
Trace(s) Only option creates an ASCII (
trace data will be displayed
“To display the OSA State information panel ” on page 3-47 for a description of
the OSA state information.
Save Menu....
Save/Recall
softkey.
key.
.dat
file). This includes the
.csv
) file. When the file is recalled, the
under the current instrument settings.
Refer to
Save Traces
Selects the traces to be saved.
Save Graphics
Saves graphic data when selected. The graphic data is stored in Computer
Graphics Metafile (CGM) format. This is a vector graphics format that
describes pictures and graphical elements in geometric terms. This selection
is valid only when saving to the floppy drive.
3-35
Page 76

Using the Optical Spectrum Analyzer
The Save/Recall Menus
Save to
Selects saving data to a floppy disk or to internal memory.
File Name
Selects manual or automatic mode for choosing a file name.
4
When you are satisfied with your selections, press the
Choose File to Save
softkey.
The Filename Menu setup panel opens.
The Filename Menu setup panel
To enter a filename using the arrow keys
1
Use the front-panel step keys (⇑ and ⇓) and the arrow softkeys (→ and ←) to
highlight each letter of the filename.
2
When the desired letter or function is selected, press the
3
Select the BackSpace function to delete individual letters.
4
Select the Clear Line function to delete the entire filename.
Select
softkey.
5
When you finish entering the filename, press the
SAVE FILE
softkey.
To enter a filename using a trackball or mouse
1
Use the pointing device to place the cursor on a letter of the filename. Click on
the character to select it.
2
Click the BackSpace function to delete individual letters.
3
Click the Clear Line function to delete the entire filename.
4
When you finish entering the filename, click the
3-36
SAVE FILE
softkey.
Page 77

To recall measurement and trace data
Using the Optical Spectrum Analyzer
The Save/Recall Menus
1
Press the front-panel
2
Press the
3
The Recall Setup panel opens.
Recall Menu....
The Recall Menu setup panel
Setup panel
select ions
Recall
Selects whether a measurement or trace will be recalled.
Recall From
Selects whether to recall from a floppy disk or from internal memory.
4
When you are satisfied with your selections, press the
softkey. The Catalog panel opens. See “To select a file from the catalog” on
page 3-37.
To select a file from the catalog
Save/Recall
softkey.
key.
Choose File to Recall
1
Press the front-panel
2
Press the
3
Press the
4
Make the desired selections on the setup panel. Refer to “To Fill In a Setup
Recall Menu....
Choose File to Recall
Save/Recall
Delete Menu....
or
or
key.
softkey.
Choose File to Delete
softkey.
Panel” on page 3-65 for information on changing and selecting items in the
setup panel.
5
When you are satisfied with your selections, press
Enter
. The Catalog panel
opens.
3-37
Page 78

Using the Optical Spectrum Analyzer
The Save/Recall Menus
The Catalog setup panel
6
Use the arrow keys to highlight the n ext five previous file softkeys, or click on
the desired filename using a trackball or mouse. Press
Enter
to recall or delete
the selected file.
To delete a file from internal memory or a floppy disk
1
Press the front-panel
2
Press the
Delete Menu....
Save/Recall
softkey.
key.
The Delete Setup panel
Setup panel
select ions
Delete File From:
Selects whether to delete from a floppy disk or from internal memory.
Press the
Choose File to Delete
softkey to open the Catalog window. See “To
select a file from the catalog” on page 3-37 for information on selecting the file
to delete.
3-38
Page 79

To format a floppy disk
Using the Optical Spectrum Analyzer
The Save/Recall Menus
1
Press the front-panel
2
Press the
3
Press the
Format Floppy Disk....
Format
Save/Recall
softkey to format the 3.5 floppy disk. Press the
to stop the format action and return to the previous screen.
To backup or restore the internal memory
Save/Recall
Softkey panel
select ions
1
Press the front-panel
2
Press the
Backup/Restore Menu....
Backup Internal Memory
An OSA Backup Utility screen appears asking you to insert a formatted floppy
disk in the external drive.
Restore Internal Memory
An OSA Restore Utility screen appears. This operation will remove all files
from internal memory and replace them with files from backup floppy disks.
To save in Fast Save mode
1
Press the front-panel
Save/Recall
key.
softkey.
key.
softkey.
key.
Cancel
softkey
2
Press the
3
The instrument saves the measurement to internal memory.
To reca ll in Fast Recall mode
1
Press the front-panel
2
Press the
3
The instrument recalls the measurement saved previously by the Fast Save
function.
Fast SAVE
softkey.
Fast RECALL
Save/Recall
softkey.
key.
3-39
Page 80

Using the Optical Spectrum Analyzer
The System Menus
The System Menus
The System softkeys are accessed using the front-panel
System
key or the
Options menu System selection on the menu bar. If you wish to change system
settings, the front-panel System key provides access to the following functions
and setup panels:
Function See....
Help....
Show Critical Errors.... “To display notices, bandwidth errors, critical errors and
warnings” on page 3-42
Show BW Errors.... “To display notices, bandwidth errors, critical errors and
warnings” on page 3-42
Show Warnings.... “To display notices, bandwidth errors, critical errors and
warnings” on page 3-42
Show Notices.... “To display notices, bandwidth errors, critical errors and
warnings” on page 3-42
Revision.... “To display the firmware revision” on page 3-42
Set Title.... “To add a title to the display” on page 3-42
Display Setup.... “To change the display setup” on page 3-43
Printer Setup.... “To set up a printer” on page 3-44
Calibration....
Power Cal Setup.... “To perform a power calibration” on page 3-44
Wavelength Cal Setup.... “To perform a wavelength calibration” on page 3-45
Move Active Area “To move the active function area” on page 3-47
3-40
Page 81

Using the Optical Spectrum Analyzer
The System Menus
Function See....
More System Functions....
OSA State.... “To display the OSA State information panel” on page 3-47
Active Panel “To display the Active Function Area” on page 3-48
Set Time/Date.... “To change the time and date” on page 3-48
Service Menu....
Power On State “To select the power-on state” on page 3-48
Factory Preset (IP) “To perform a factory preset (IP)” on page 3-49
Firmware Upgrade “To upgrade the firmware” on page 3-50
Adv Service Functions....
Zero Now “To zero the instrument” on page 3-50
Grating Order “To set the grating order mode” on page 3-51
Wavelength Limit “To set the wavelength limit” on page 3-51
More Adv Service
Functions....
TransZ 2-3 Lock “To set the TransZ 2 - 3 Lock” on page 3-52
Multi-Point Align “To set multi-point alignment” on page 3-52
OSA Extended
State....
Auto Measure Setup.... “To change the automeasure defaults” on page 3-53
Remote Setup.... “To set the HP-IB address” on page 3-55
“To display the OSA Extended State information panel” on
page 3-53
3-41
Page 82

Using the Optical Spectrum Analyzer
The System Menus
Using the System functions
To display notices, bandwidth errors, critical errors and warnings
Note
The Show Notices...., Show BW Errors...., Show Critical Errors...., and Show Warnings....
functions are only available if a notice, bandwidth error, critical error, or warning has
been generated by the system. If no notices, bandwidth errors, critical errors, or warnings have been generated, these functions will be grayed out.
1
Press the front-panel
2
Press the
3
Press the S
Warnings....
critical error or warning. You can print the queue, clear the queue, or page up
and down to view the in formation.
To display the firmware revision
1
Press the front-panel
2
Press the
3
Press the
information.
To add a title to the display
1
Press the front-panel
2
Press the
Help....
how Notices...., Show BW Errors...., Show Critical Errors....
softkey. A window opens displaying the notice, bandwidth error,
Help....
Revision....
Set Title....
System
key.
softkey.
Show
or
System
key.
softkey.
softkey. A display appears showing the firmware revision
System
key.
softkey. The Title Setup panel appears.
3-42
Page 83

The Title Setup panel
Refer to “To Fill In a Setup Panel” on page 3-65 for information on changing
and selecting items in the setup panel.
To change the display setup
Using the Optical Spectrum Analyzer
The System Menus
Setup panel
select ions
1
Press the front-panel
2
Press the
Display Setup....
System
key.
softkey. The Display Setup panel appears.
The Display Setup panel
HP Logo
When this function is ON, the HP logo is shown on the display and printouts.
Date/Time
Turns the date and time ON or
OFF
on the display.
Title
Turns the title ON or
OFF
on the display.
3-43
Page 84

To set up a prin ter
Using the Optical Spectrum Analyzer
The System Menus
Active Function Area Assist
When this function is ON, the function set in the Active Function Area is automatically set to the first, or top, softkey function. For example, when you
press the front-panel
Bandwidth/Sweep
key, the Active Function Area Assist
function will set the Active Function Area to resolution bandwidth. This
means you can immediately enter the desired resolution bandwidth. There is
no need to press the
Res BW
softkey.
1
Press the front-panel
2
Press the
Printer Setup....
The Printer Setup panel
Setup panel
select ions
Printer Location
Selects either the internal printer or an external printer as the print destination.
To perform a power calibration
1
Press the front-panel
2
Press the
3
Press the
Calibration....
Power Cal Setup....
System
key.
softkey. The Printer Setup panel appears.
System
key.
softkey.
softkey. The Power Calibration Setup panel appears.
The Power Calibration setup panel
3-44
Page 85

Using the Optical Spectrum Analyzer
The System Menus
Setup panel
select ions
Factory Pow er Cal Date
Shows the date of the last factory-performed power calibration.
User Power Cal Date
Shows the date of the last successful user-performed power calibration.
Set Calibration Power
This is the exact amplitude of the calibration source that will be used for the
next power calibration. The power entered must be within +10 dB and –3 dB
of the amplitude measured using the factory calibration.
Set Calibration Wavelength
This is the approximate wavelength of the calibration source that will be used
for the next user power calibration. The wavelength entered must be within
2.5 nm of the wavelength measured using the factory calibration.
4
Enter the power and wavelength of the calibration signal.
5
Press the
Perform Calibration....
softkey.
6
Follow the on-screen instructions and then press
To perform a wavelength calibration
1
Press the front-panel
2
Press the
3
Press the
Calibration....
Wavelength Cal Setup....
panel appears.
System
softkey.
Execute Calibration
.
key.
softkey. The Wavelength Calibration Setup
3-45
Page 86

Using the Optical Spectrum Analyzer
The System Menus
The Wavelength Calibration setup panel
Setup panel
select ions
Factory Wave le ngth Cal Date
Shows the date of the last factory-performed wavelength calibration.
User Waveleng th Cal Date
Shows the date of the last successful user-performed wavelength calibration.
Signal Source
Select either an external single wavelength signal source or the internal calibrator as the wavelength calibration source.
Wavelength Referenced In (for external calibration source only)
Selects air or vacuum for the calibration. If the internal calibrator is selected,
this selection will not be available.
Set Calibration Wavelength (for external calibration source only)
This is the exact wavelength of the calibration source that will be used for the
next user wavelength calibration. The wavelength entered must be within
2.5 nm of the wavelength measured using the factory calibration. If the internal calibrator is selected, this selection will not be available.
4
If you are using an external calibration source, enter the signal source and
wavelength of the calibration signal and whether the calibration is referenced
in air or vacuum. If you are using an internal calibration source, continue with
Step 5.
3-46
Page 87

Using the Optical Spectrum Analyzer
The System Menus
5
Press the
6
Follow the on-screen instructions and then press
Perform Calibration....
To move the active function area
1
Press the front-panel
2
Press the
Move Active Area
System
softkey. Each press of the softkey moves the active
function area to one of eight on-screen locations.
To display the OSA State information panel
1
Press the front-panel
2
Press the
3
Press the
More System Functions....
OSA State....
System
softkey.
softkey.
key.
key.
softkey.
Execute Calibration
.
4
The OSA State Information display panel opens and can be printed.
The OSA State information panel
3-47
Page 88

Using the Optical Spectrum Analyzer
The System Menus
To display the Active Function Area
1
Press the front-panel
2
Press the
3
Press the
ON
OFF
or
To change the time and date
NOTE
Changing the time, date, or time zone causes the instrument to reboot.
1
Press the front-panel
2
Press the
3
Press the
System
key.
More System Functions....
Active Panel
softkey to toggle the display of the Active Function Area
.
System
key.
More System Functions....
Set Time/Date....
softkey. The Time/Date Setup panel appears.
softkey.
softkey.
4
Use the navigation keys to set the date, time and time zone that are correct for
your location.
5
Press the
To select the power-on state
1
Press the front-panel
2
Press the
3
Press the
4
Press the
3-48
Set Time/Date
softkey when you are satisfied with your selections.
System
key.
More System Functions....
Service Menu....
Power On State
softkey.
softkey. Toggle to select IP or Last.
softkey.
Page 89

Using the Optical Spectrum Analyzer
The System Menus
The IP function is the same as the front-panel
the Preset conditions, see page 3-5. When Last is selected the instrument will
power-on in the same state it was in when last powered-off.
To perform a factory preset (IP)
1
Press the front-panel
2
Press the
3
Press the
4
Press the
More System Functions....
Service Menu....
Factory Preset (IP)
The factory preset function restarts the instrument and sets it to the same
states as the front-panel
complete list of the preset conditions. In addition, it also sets the following
functions.
Function Factory Preset Value
Wavelength functions
User wavelength calibration date None
User wavelength calibration source None
User wavelength calibration wavelength 0 nm
Wavelength for next wavelength calibration 1150 nm
Wavelength for next amplitude calibration 1150 nm
User wavelength calibration correction Zero
Amplitude functions
User amplitude calibration date None
User amplitude calibration source None
User amplitude calibration wavelength 0 nm
User amplitude calibration amplitude –300 dBm
Amplitude for next amplitude calibration 0 dBm
User amplitude calibration correction Zero
Auto Measure functions
Auto-Measure optimize sensitivity Off
Auto-Measure auto span On
Auto-Measure Manual span 10 nm
Auto-Measure dB/div auto On
Auto-Measure manual dB/division 10 dB/division
System
softkey.
softkey.
Preset
Preset
key. For a complete list of
key.
softkey.
key. See “SYSTem:PRESet” on page 4-93 for a
3-49
Page 90

Using the Optical Spectrum Analyzer
The System Menus
Function Factory Preset Value
Miscellaneous functions
Power-on in last state Off
HP-IB address 23
Time display On
HP logo display On
Active function area assist On
Active function area location Upper right
Printer interface Internal
To upgrade the firmware
To upgrade the firmware you must have the firmware upgrade disk set from
HP.
1
Press the front-panel
2
Press the
3
Press the
4
Press the
5
You are prompted for each disk in the firmware upgrade set. When the last disk
has been copied, the instrument will finish the installation process and restart.
To zero the instrument
1
Press the front-panel
2
Press the
3
Press the
4
Press the
5
Press the
The Zero Now function causes the auto zero function to run immediately. This
allows you to manually zero the instrument when the Auto Zero function is off.
The dark current of the photodetector is measured one time, and then the
resulting correction is applied to all subsequent measurements, for improved
amplitude accurac y.
System
key.
More System Functions
Service Menu
.... softkey.
Firmware Upgrade
System
.... softkey.
.... softkey.
key.
More System Functions....
Service Menu....
softkey.
Adv Service Functions....
Zero Now
softkey.
softkey.
softkey.
3-50
Page 91

Note
The optical spectrum analyzer compensates for temperature-related current drift
between each sweep. Although this “zeroing” increases amplitude accuracy, it increases
the time between sweeps. If amplitude accuracy is not critical to your measurement, you
can turn off zeroing. Refer to “Auto Zero” on page 3-12 for additional information.
The optical spectrum analyzer performs a more complete zeroing when the instrument is
first turned on. You can run this more complete routine anytime by pressing the
softkey.
NOW
To set the grating order mode
Using the Optical Spectrum Analyzer
The System Menus
ZERO
1
Press the front-panel
2
Press the
3
Press the
4
Press the
5
Press the
6
Toggle between 1 and AUTO.
The Grating Order function lets you ch oose between 1st order grating only and
the Automatic setting. The Automatic mode selects 2nd order mode if the stop
wavelength is less than 900 nm. The 2nd order grating mode provides a slightly
higher measurement sensitivity. Note that the 10 nm resolution bandwidth is
not available when using the 2nd order grating mode. The grating order is
listed in the OSA State Information. See “To display the OSA State information
panel” on page 3-47 for more i nformation.
To set the wavelength limit
1
Press the front-panel
2
Press the
3
Press the
System
key.
More System Functions....
Service Menu....
softkey.
Adv Service Functions....
Grating Order
softkey.
System
key.
More System Functions....
Service Menu....
softkey.
softkey.
softkey.
softkey.
4
Press the
Adv Service Functions....
softkey.
3-51
Page 92

Using the Optical Spectrum Analyzer
The System Menus
5
Press the
range of 600 to 1700 nm. When this function is
OSA can be tuned down to 350 nm, and the stop wavelength can be tuned up
to 2000 nm.
Note
The performance of the OSA is not specified and the amplitude is not calibrated outside
the 600–1700 nm range.
To set the TransZ 2 - 3 Lock
1
Press the front-panel
2
Press the
3
Press the
4
Press the
5
Press the
6
Press the
Setting the TransZ 2-3 Lock to ON prohibits the instrument from using a transimpedance gain higher than 10k ohms. This ensures that there is sufficient
video bandwidth for making accurate pulsed measurements. This is useful for
EDFA pulsed testing. The Preset state for TransZ 2-3 Lock is
Wavelength Limit
softkey. Toggle ON to limit the span to the specified
System
key.
More System Functions....
Service Menu....
Adv Service Functions....
softkey.
softkey.
More Adv Service Menu....
TransZ 2 - 3 Lock
softkey.
softkey.
softkey.
OFF
, the start wavelength of the
OFF
.
To set multi-point alignment
1
Press the front-panel
2
Press the
3
Press the
4
Press the
5
Press the
6
Press the
Multi-Point Align is an advanced service function that requires a broadband
white light source. This function is to be used by HP service personnel.
3-52
System
key.
More System Functions
Service Menu
Adv Service Functions
.... softkey.
.... softkey.
More Adv Service Menu
Multi-Point Align
softkey.
.... softkey.
.... softkey.
Page 93

To display the OSA Extended State information panel
Using the Optical Spectrum Analyzer
The System Menus
1
Press the front-panel
2
Press the
3
Press the
4
Press the
5
Press the
6
Press the
More System Functions....
Service Menu....
Adv Service Functions....
More Adv Service Menu....
OSA Extended State....
System
softkey.
key.
softkey.
softkey.
softkey.
softkey. The OSA Extended State Information
panel is displayed and can be printed.
The OSA Extended State function provides information useful to HP service
personnel.
To change the automeasure defaults
1
Press the front-panel
2
Press the
3
Press the
More System Functions....
Auto Measure Setup....
System
key.
softkey.
softkey. The Automeasure Setup panel appears.
3-53
Page 94

Using the Optical Spectrum Analyzer
The System Menus
4
Use the arrow keys or the numeric entry pad to set the wavelength span
manually or automatically. Refer to “To Fill In a Setup Panel” on page 3-65 for
information on changing and selecting items in the setup panel.
Setup panel
select ions
Span
This function selects the wavelength span for viewing the signal located by the
auto measure function. If Auto is specified, the span is set wide enough to display most of the signal. If a particular span is desired, deselect Auto and put
the desired span in the nm dialog box. The default selection for Span is Auto.
Note
If the span is set too narrow, the auto measure operation may not complete successfully.
If this happens a warning message is displayed.
Scale/Div
The dB/div selection sets the vertical scale to be used after performing the
auto measure function. If Auto is specified, the measurement function sets the
vertical scale to a value based on the dynamic range of the signal. If a particular vertical scale is desired, deselect Auto and put the desired dB/div in the dB
dialog box. The default selection for dB/div is Auto.
AutoMeas at Marker
Selecting the ON state for AutoMeas at Marker causes the auto measure function to perform its operation at the wavelength of the active marker. This
allows you to measure a signal other than the largest one found in a full span
sweep. The default selection for Automeasure at Marker is
OFF
.
Optimize Sensitivity
Selecting the ON state for Optimize Sensitivity causes the auto measure function to set the sensitivity so the resulting measurement has a minimal amount
of noise. It does this by finding the minimum in the measurement trace and
comparing this value to the known sensitivity of the instrument at that wavelength. Sensitivity is then reduced until the signal is close to this minimum
sensitivity or the sweep time becomes too long. The Optimize Sensitivity function is useful when viewing high dynamic range signals. The drawback to turning this function ON is that it generally requires a longer sweep time to get
better sensitivity. The default selection for Optimize Sensitivity: is
OFF
.
3-54
Page 95

Note
None of the Automeasure Setup parameters are affected by the front-panel Preset key.
They are not saved as part of the measurement setup.
To set the HP-IB address
Using the Optical Spectrum Analyzer
The System Menus
Setup panel
select ions
1
Press the front-panel
2
Press the
3
Press the
4
The Current HPIB Address information shows the HP-IB address currently
More System Functions....
Remote Setup....
System
key.
softkey.
softkey. The Remote Setup panel appears.
being used. To change the address, use the numerical entry pad or knob to
change the New HPIB Address information. Press the
Defaults
softkey to reset
the address to factory preset defaults. Refer to “To Fill In a Setup Panel” on
page 3-65 for information on changing and selecting items in the setup panel.
5
Press the
Set HPIB Address
softkey if changes were made.
The Remote Setup panel
Current HPIB Address
Shows the HP-IB address currently being used.
New HPIB Address
Enter the new HP-IB address in the text box using the number keys or knob.
3-55
Page 96

Using the Optical Spectrum Analyzer
The Traces Menus
The Traces Menus
The Traces softkeys are accessed by using the front-panel
Traces
key or the
Measure menu Traces selection on the menu bar. If you wish to change trace
settings, the front-panel Traces key provides access to the following functions
and setup panels:
Function See....
Active Trace.... “To set the active trace” on page 3-57
Update <trace> “To set the update function for the trace” on page 3-57
View <trace> “To set the display function for the trace” on page 3-57
Hold <trace>.... “To set the Hold.... function” on page 3-58
Trace Math....
Default Math Trace C.... “To set the trace math for trace C” on page 3-58
Default Math Trace F.... “To set the trace math for trace F” on page 3-59
Exchange Menu.... “To exchange both the X-axis and Y-axis data of two traces” on
page 3-59
All Math Off “To turn all math functions off” on page 3-59
Averaging.... “To set up averaging” on page 3-60
Trace Setup.... “To set the number of points in a sweep” on page 3-60
3-56
Page 97

Using the Traces functions
To set the active trace
Using the Optical Spectrum Analyzer
The Traces Menus
1
Press the front-panel
2
Press the
3
Use the arrow keys or knob to select the active trace.
Active Trace....
Traces
or
1
Press the front-panel
2
Press the
3
Use the arrow keys or knob to select the active trace.
Active Trace....
Markers
To put a marker on a trace, or to make changes to a trace, it must be the active
trace. The active trace is designated by the double-arrows at either the left or
right edge of the graticule.
To set the update function for the trace
1
Press the front-panel
2
Select the trace to be changed.
3
Press the
4
Use the arrow keys or knob to select ON or
Update <trace>
Traces
When ON, the trace always accepts data when data is available.
OFF
When
, the trace will not be updated.
key.
softkey.
key.
softkey.
key.
softkey.
OFF
.
To set the display function for the trace
1
Press the front-panel
2
Select the trace to be changed.
3
Press the
View <trace>
Traces
softkey to turn the display of the selected trace ON or
key.
OFF
3-57
.
Page 98

Using the Optical Spectrum Analyzer
The Traces Menus
To set the Hold.... function
1
Press the front-panel
2
Press the
Hold <trace>....
None turns the Hold function off.
The maximum hold function compares the current amplitude value of each
point on a trace in the current sweep to the corresponding point detected during the previous sweep, then displays the maximum value.
The minimum hold function compares the current amplitude value of each
point on a trace in the current sweep to the corresponding point detected during the previous sweep, then displays the minimum value.
Pressing the
Max/Min Reset
trace. Subsequent traces are accumulated in the hold sequence.
To set the trace math for trace C
1
Press the front-panel
2
Press the
3
Press the
Trace Math....
Default Math Trace C....
when the math operations are turned on. The result is placed in Trace C.
4
Select the appropriate softkey to define the math expression.
C=A
–B, C=A
LOG
Defines the math expression to be used and turns the math operation ON. The
math operation is performed in linear units.
Traces
key.
softkey to select None, Min or Max.
softkey resets the hold function to the last acquired
Traces
key.
softkey.
softkey to define the math expression to be used
+B, C=A
LOG
–B, C=A
LIN
LIN
+B
Trac e C Ma th O f f
Determines whether or not math processing is performed.
3-58
Page 99

To set the trace math for trace F
Using the Optical Spectrum Analyzer
The Traces Menus
1
Press the front-panel
2
Press the
3
Press the
4
Select the appropriate softkey to define the math expression.
F=C
Trace Math....
Default Math Trace F....
–D
LOG
Traces
key.
softkey.
softkey. The result is placed in trace F.
Defines the math expression to be used and turns the math operation ON. The
math operation is performed in linear units.
Trac e F M a th Of f
Determines whether or not math processing is done.
To exchange both the X-axis and Y-axis data of two traces
1
Press the front-panel
2
Press the
3
Press the
4
Select the two traces to be exchanged for both the X- and Y-axis.
Trace Math....
Exchange Menu....
Traces
key.
softkey.
softkey.
To turn all math functions off
1
Press the front-panel
2
Press the
3
Press the
Trace Math....
All Math Off
Traces
key.
softkey.
softkey.
3-59
Page 100

To set up averaging
Using the Optical Spectrum Analyzer
The Traces Menus
1
Press the front-panel
2
Press the
3
Toggle averaging ON or
Averaging....
softkey.
number of measurements to be averaged.
Use the keys to select the number of measurements to be averaged. When the
number of measurements taken is less than the count, the following formula is
used to calculate the data:
If the number of measurements is greater than or equal to the count, the following formula is used to calculate the data:
New averag e
Averaging values other than those displayed can be entered by using the
numeric keypad or the knob when the Avg Count active function area is displayed.
To set the number of points in a sweep
1
Press the front-panel
2
Press the
Trace Setup....
Traces
key.
OFF
. If averaging is on, softkeys appear to select the
sum of all measurements
AVG
Traces
--------------------------------------------------------------------- -=
number of measurements
count 1–
------------------------ last average
count
key.
new measurement
--------------------------------------------------+×=
softkey. The Trace Setup panel will appear.
count
The Trace Setup panel
3
Enter the desired sweep length in the setup panel. The minimum sweep length
is three points. The maximum sweep lengt h is 10,001 points. Refer to “To Fill
In a Setup Panel” on page 3-65 for information on changing and selecting items
in the setup panel.
3-60
 Loading...