

Page 1

Notice
Hewlett-Packard to Agilent Technologies Transition
This documentation supports a product that previously shipped under the HewlettPackard company brand name. The brand name has now been changed to Agilent
Technologies. The two products are functionally identical, only our name has changed. The
document still includes references to Hewlett-Packard products, some of which have been
transitioned to Agilent Technologies.
Printed in USA March 2000
Page 2
HEWLETT
PACKARD
OPERATING AND PROGRAMMING MANUAL
8566B
SPECTRUM ANALYZER
100 Hz - 2.5 GHz/2 - 22 GHz
SERIAL NUMBERS
This manual applies directly to Model 8566B RF
Sections with serial numbers prefixed 2410A and
Display Sections with serial numbers prefixed 2403A.
0
Copyright HEWLETT-PACKARD COMPANY 1984
1212 VALLEY HOUSE DRIVE, ROHNERT PARK, CALIFORNIA.94928. U.S.A.
IF-
MANUAL PART NO. 08566-90040
Microfiche Part No.
08566-90044
Printed: March 1984
Page 3

CERTIFICATION
Hewlett-Packard Company certifies that
shipment
from
the factory. Hewlett-Packard further certifies that its calibration measurements are
traceable to the United States National Bureau
calibration facility, and to the calibration facilities
thb
product met its published specifications at the time
of
Standards, to the extent allowed by the Bureau’s
of
other International Standards Organization
of
members.
WARRANTY
This Hewlett-Packard instrument product is warranted against defects in material and workmanship
for a period of one year from date of shipment. During the warranty period, Hewlett-Packard
Company will, at its option, either repair or replace products which prove to be defective.
For warranty service or repair, this product must be returned to a service facility designated by HP
Buyer shah prepay shipping charges to HP and HP shall pay shipping charges to return the product
to Buyer. However, Buyer shall pay all shipping charges, duties, and taxes for products returned to
HP from another country.
HP warrants that its software and firmware designated by HP for use with an instrument will execute
its programming instructions when properly
installed
on that instrument. HP does not warrant that
the operation of the instrument, or software, or firmware will be uninterrupted or error free.
LIMITATION OF WARRANTY
The foregoing warranty shall not apply to defects resulting from improper or inadequate
maintenance by Buyer, Buyer-supplied software or interfacing, unauthorized modification or misuse,
operation outside of the environmental specifications for the product, or improper site preparation
or maintenance.
NO OTHER WARRANTY IS EXPRESSED OR IMPLIED. HP SPECIFICALLY DISCLAIMS
THE IMPLIED WARRANTIES OF MERCHANTABILITY AND FITNESS FOR A
PARTICULAR PURPOSE.
EXCL USI YE REMEDIES
THE REMEDIES PROVIDED HEREIN ARE BUYER’S SOLE AND EXCLUSIVE REMEDIES.
HP SHALL NOT BE LIABLE FOR ANY DIRECT, INDIRECT, SPECIAL, INCIDENTAL, OR
CONSEQUENTIAL DAMAGES, WHETHER BASED ON CONTRACT, TORT, OR ANY
OTHER LEGAL THEORY
ASSISTANCE
Product maintenance agreements and other customer assistance agreements are available for
Hewlett-Packard products.
For any assistance, contact your nearest Hewlett-Packard Sales and Service Office. Addresses are
provided at the back
of
this manual.
Page 4

Section I
Manual Operation
Chapter 1 -GETTING STARTED
Chapter 2 - DATA
Chapter 3 - FUNCTION
Chapter 4 - CRT
Chapter 5 - TRACE
Chapter 6 - MARKER
Chapter 7 Chapter 8 - COUPLED FUNCTION
Chapter 9 Chapter 10 - INSTRUMENT STATE
Chapter 1 1 - SHIFT
Chapter 12 - USER
Chapter 13 - PLOTTER OUTPUT
SCALE
SWEEP
DISPLAY
AND
AND TRIGGER
KEY
DEFINED
REFERENCE LINE
FUNCTIONS
KEYS
Page 5
GENERAL INFORMATION
GENERAL DESCRIPTION
GENERAL INFORMATION
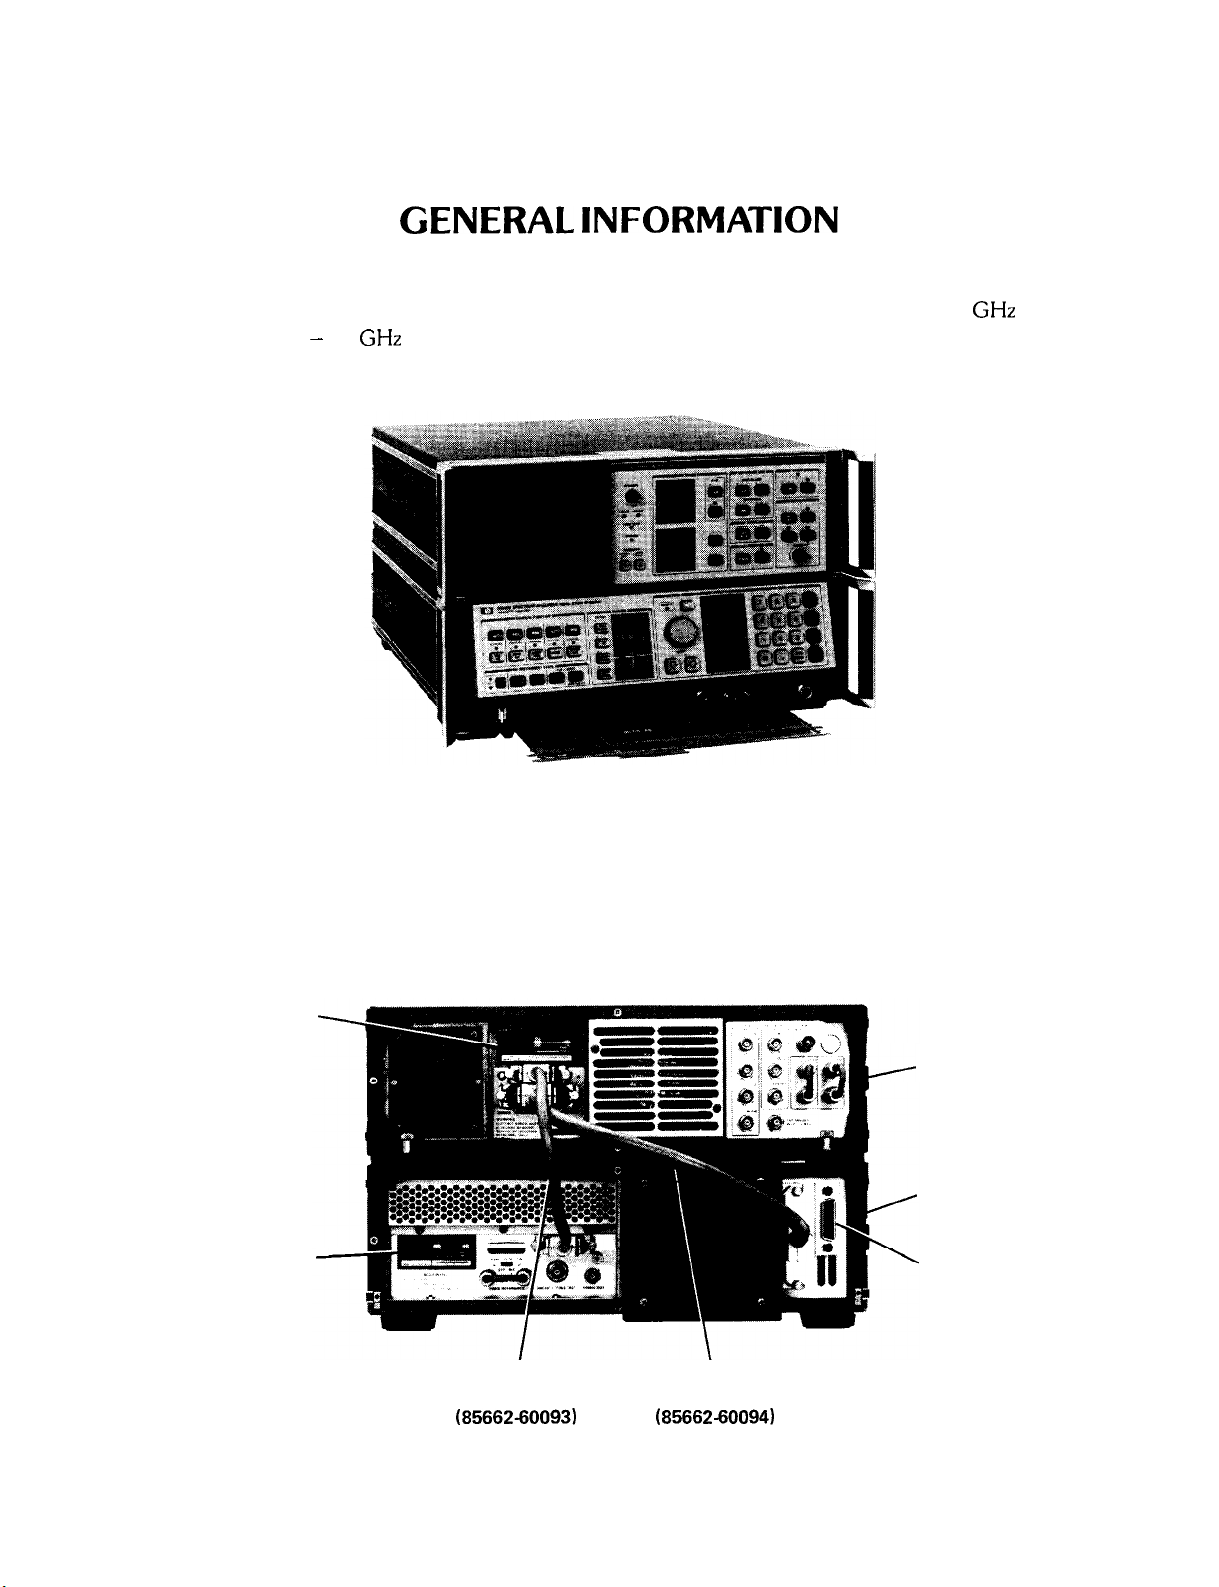
The HP 8566B is a high-performance spectrum analyzer which operates from 100 Hz to 2.5 GHz in the low
frequency band and 2 - 22
frequency tuning and an internal micro-computer to automate controls and provide useful operating features.
GHz
in the preselected microwave band. It uses a synthesized LO to provide accurate
HP 8566B SPECTRUM ANALYZER
The HP 8566B consists of an 85662A Display Section and an 85660B RF Section. Connect the two sections
along with the inter-connection cables as shown in the illustration below.
Connect interconnection cables as shown:
Line Module
85662A
Display Section
85660B
RF Section
Line Module.
Interconnect Cable Interconnect Cable
I
(85662-60093)
\
(85662-60094)
HP-IB
Connector
REAR PANEL CONNECTIONS
Manual Operation 1
Page 6

INITIAL POWER ON
CAUTION
GENERAL INFORMATION
Before connecting the line power cords, make sure the appropriate line voltage and
line fuse have been selected for both the RF and Display sections of the analyzer. For
complete information on line voltage and fuse selection, refer to the HP 8566B Operator’s Handbook. For information on line power cords for a specific country, contact the
nearest Hewlett-Packard office.
INITIAL POWER ON
After making the AC power line connections, the STANDBY lights of both the RF and Display section should be
on. As long as the instrument is operating (LINE ON) or in STANDBY, the accuracy specifications of the internal
frequency standard will be met. After a cold start, such as on-receipt of instrument, the analyzer requires 24 hours
to stabilize prior to meeting specified performance.
INSTR
LINE ON AND STANDBY
CHECK LED
Upon LINE ON, the instrument will perform an automatic internal instrument check. If one or both of the red
instrument check lights (INST CHECK I and II) remain on after this brief check routine, refer to the chart below to
localize the problem.
LED On
I
II
Calibration
Problem
Digital Storage failure in 85662A
Interface Failure
Controller
(A15)
Check bus interconnect cable (85662-60094)
Check bus interconnect cable (85662-60094)
and check if Al2 board is connected tightly
Check if Al5 is connected tightly in 85660B
and that contacts are clean.
Solution
In order to meet specified frequency and amplitude accuracy, the analyzer’s calibration must be checked periodically to ensure the highest performance.
2 Manual Operation
Page 7
GENERAL INFORMATION
RF INPUT
FREQZERO
0
c
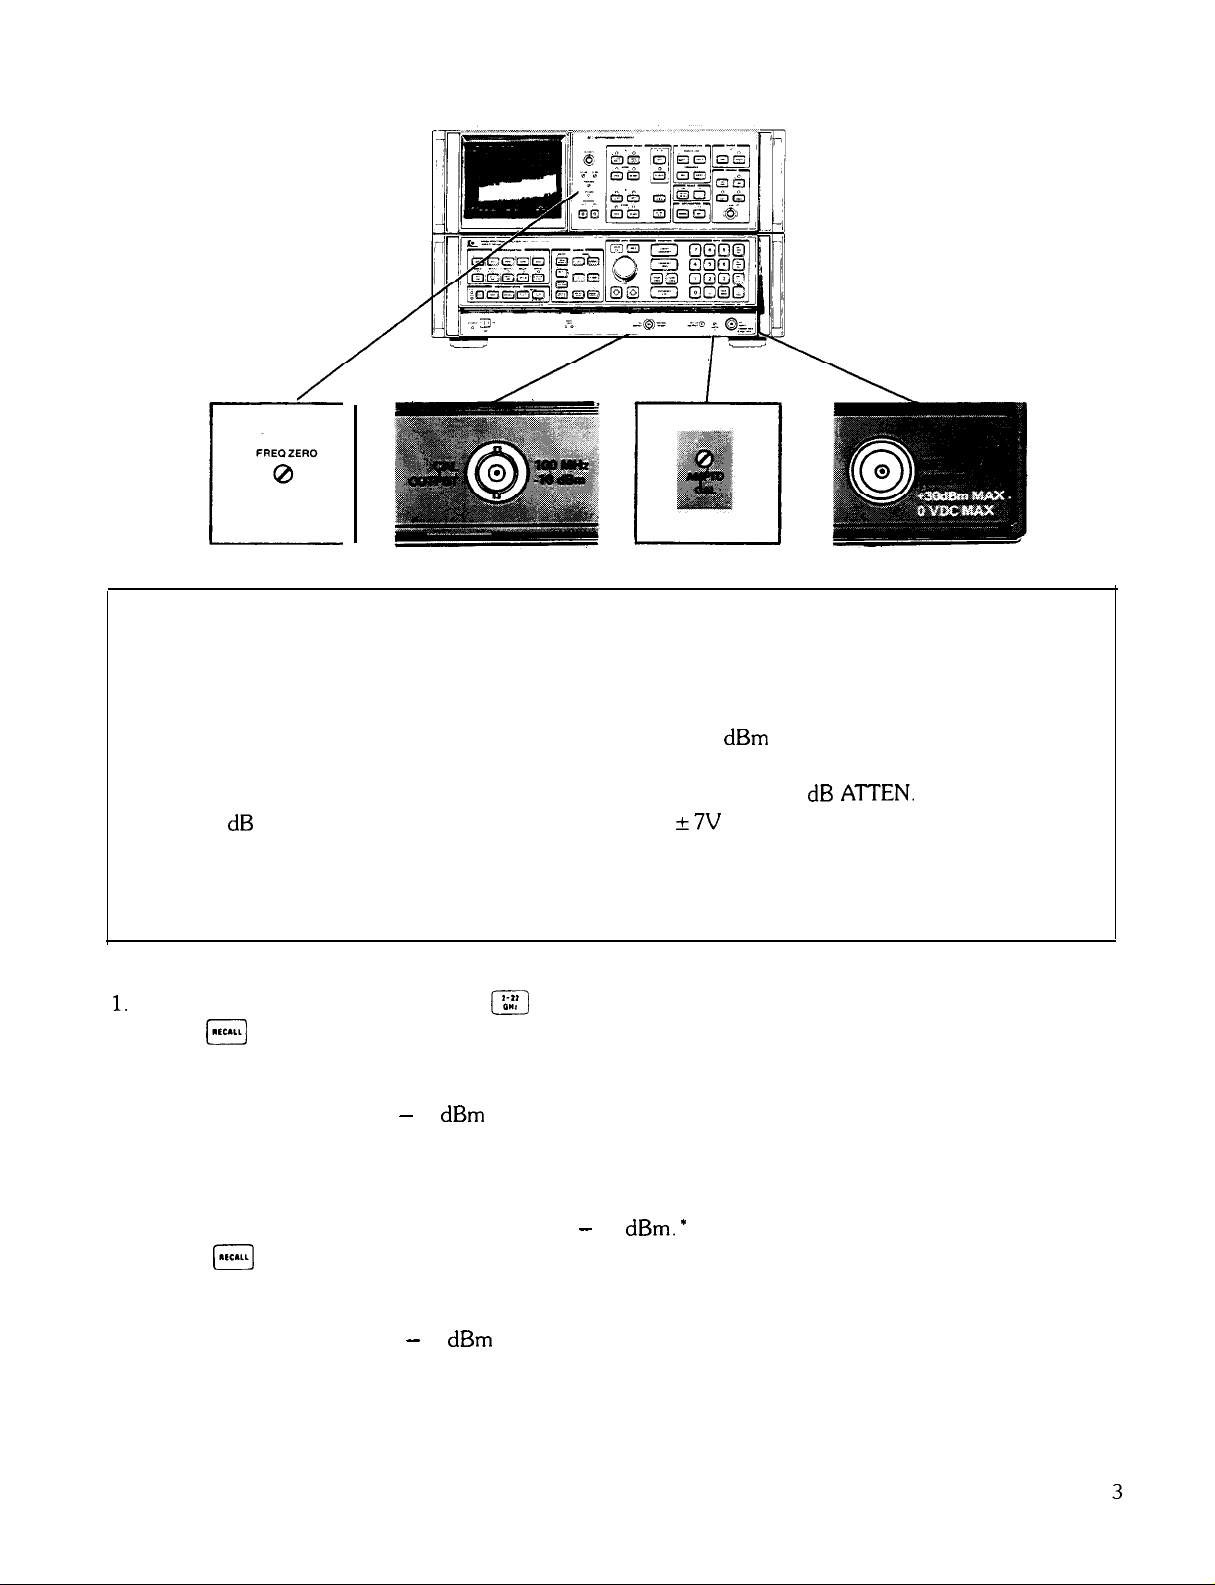
Connect cable from CAL OUTPUT signal to RF input to perform initial calibration.
CAUTION
RF INPUT
Excessive signal input power will damage the input attenuator and the input mixer. The
spectrum analyzer total RF power must not exceed + 30 dBm (1 watt).
DC Precaution: The HP 8566B cannot accept DC voltages in 0 dB
dB or greater input attenuation, a maximum of
damage. A blocking capacitor is recommended at the input when DC is present with an
RF signal.
Manual Calibration Procedure
1.
After instrument has stabilized, press
2.
Press
@
8; this recalls the following stored control settings from the analyzer’s internal memory:
Center Frequency = 100 MHz
Frequency Span = 2 MHz
Reference Level = - 7 dBm
Res BW = 1 MHz
Scale = 1 dB/Div
Marker = Normal
3.
Adjust AMPTD CAL for a marker amplitude of - 10 dBm.
4. Press
[1Ic1LLl
9; this recalls the following:
Center Frequency = 100 MHz
Frequency Span = 0 Hz
Reference Level = - 7 dBm
Res BW = 30 Hz
Scale = 1 dB/Div
Sweep Time = 10 Sec.
m
ATTEN.
k7V
DC can be accepted without
*
With 10
l
If connection cable has significant loss, it must be accounted for separately.
Manual Operation 3
Page 8

CRT DISPLAY
5.
Maximize amplitude response with FREQ ZERO adjustment.
Error Correction Routine
A 30 second internal error correction routine minimizes uncertainties due to control changes in the analyzer. To
start the routine, press
A “CORR’D” readout will appear on the left edge of the CRT upon completion of this routine. If the message
“Adjust AMPTD CAL” appears in the display, repeat the manual calibration before running the error correction
routine again.
(,,,,,
W
(%?I.
GENERAL INFORMATION
CRT DISPLAY
The analyzer’s CRT display presents the signal response trace and all pertinent measurement data. The active
function area names the function under DATA control and shows the function values as they are changed. All the
information necessary to scale and reference the graticule is provided.
MARKER
Reference User display
level
annotation amplitude
frequency
Active
function
readout
/
Center Resolution
frequency
’
-
11
PF’:
BW 1
L/
bandwidth
LHX
YBW
100
I
Video
bandwidth
bun
17.wa
ass
4
CIHX
,TRACE
/TRACE
Internally
’
generated
graticule
HZ
Sweep time
span
A
B
PLOTTER OUTPUT
The trace data, graticule, and annotation on the analyzer’s screen can be directly output via HP-IB to a
Packard plotter (such as the HP
front pane1 of the analyzer.
4 Manual Operation
7245A/B,
7240A, 7470A, or 9872C) by pressing the LOWER LEFT key on the
Hewlett-
Page 9
GENERAL INFORMATION
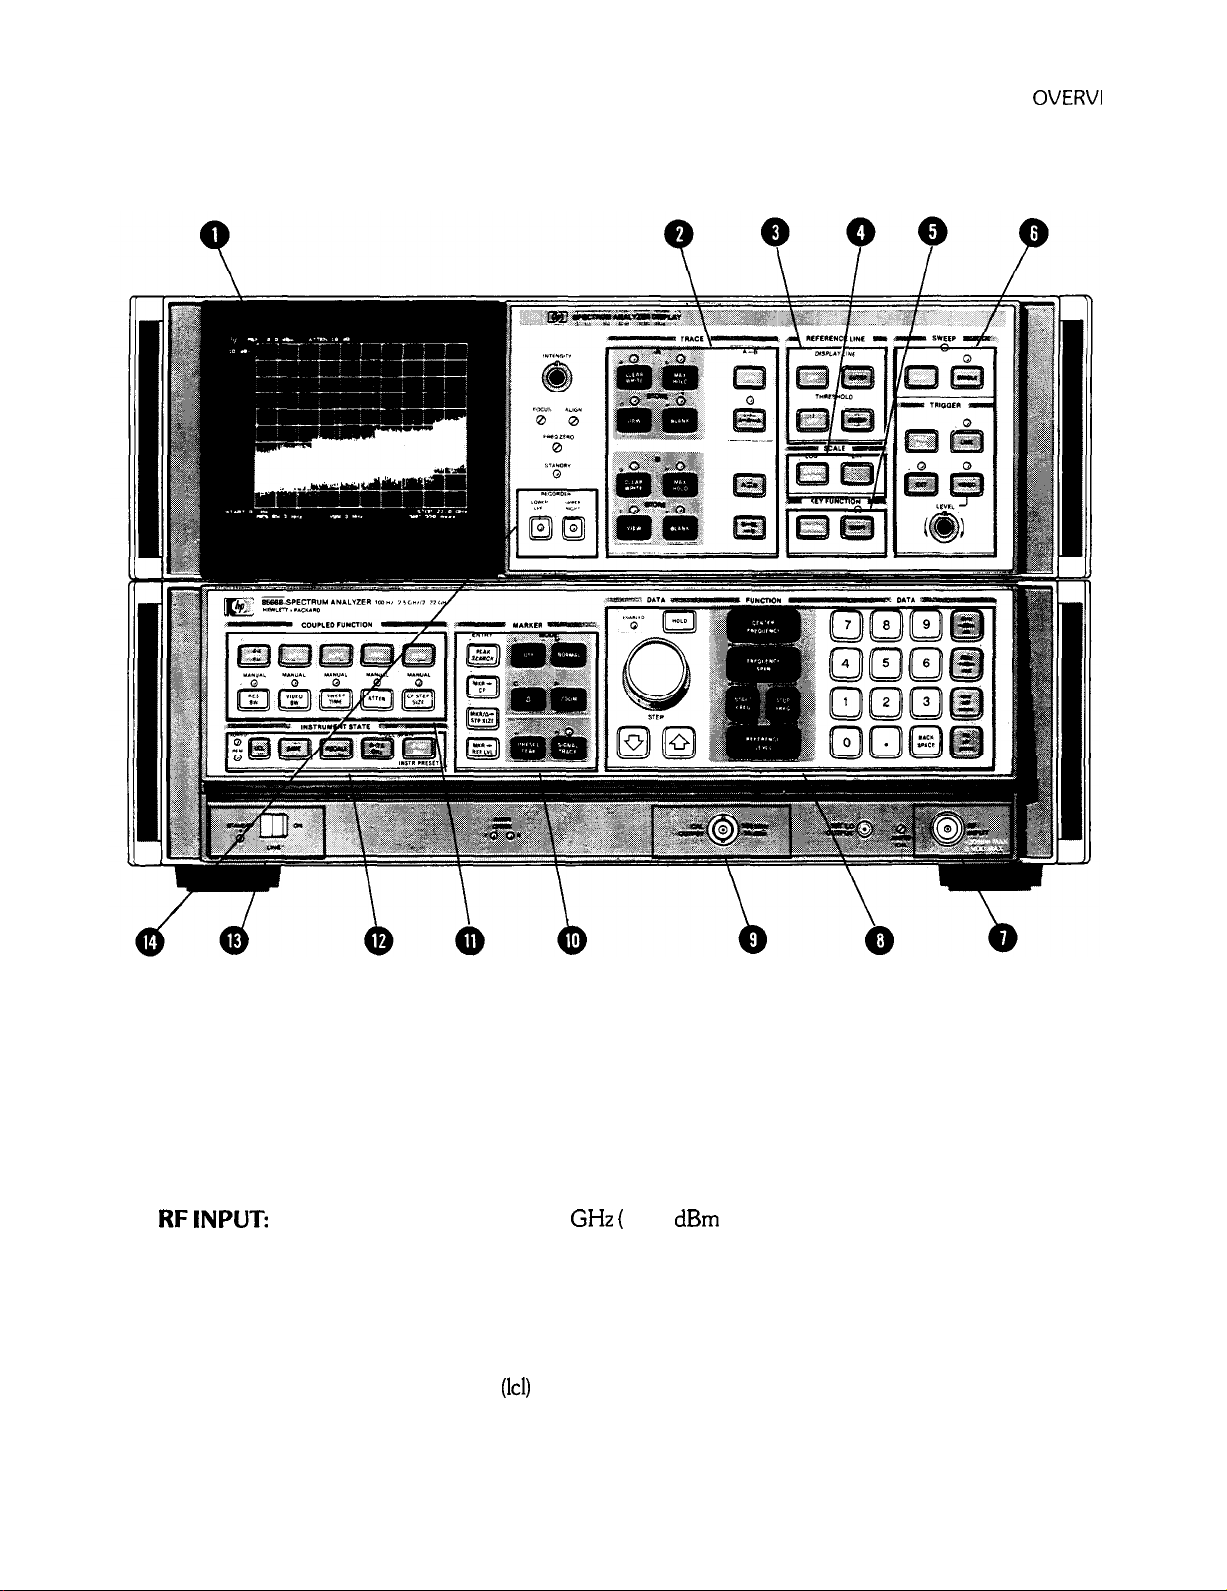
FRONT PANEL OVERVIEW
FRONT PANEL
OVERVI
IEW
Control Groups
1
CRT DISPLAY:
2
TRACE:
3 REFERENCE LINE:
4 SCALE:
5 KEY FUNCTION:
6 SWEEP and TRIGGER:
7
RFINPUT:
8
DATA/FUNCTION:
9
CAL OUTPUT:
10
MARKER:
11
COUPLED FUNCTION:
12
INSTRUMENT STATE:
13 LINE ON &STANDBY:
14
REORDER/PLOTTER
FUNCTIONS:
Signal response and analyzer settings
Control of signal response display
Measurement and display aids
Selects logarithmic or linear amplitude scale
Access to special functions
Selects trace update trigger
100 Hz to 22 GHz ( + 30 dBm max. power)
Fundamental analyzer control
Calibration signal
Movable bright dot markers for direct frequency and amplitude readout
Maintenance of absolute amplitude and frequency calibration by automatically selecting certain analyzer control settings
Local
(1~1)
select key, SAVE and RECALL keys and FULL SPAN keys
Powers instrument and performs instrument check
Controls output to recorder or HP-IB controlled plotter
Manual Operation 5
Page 10
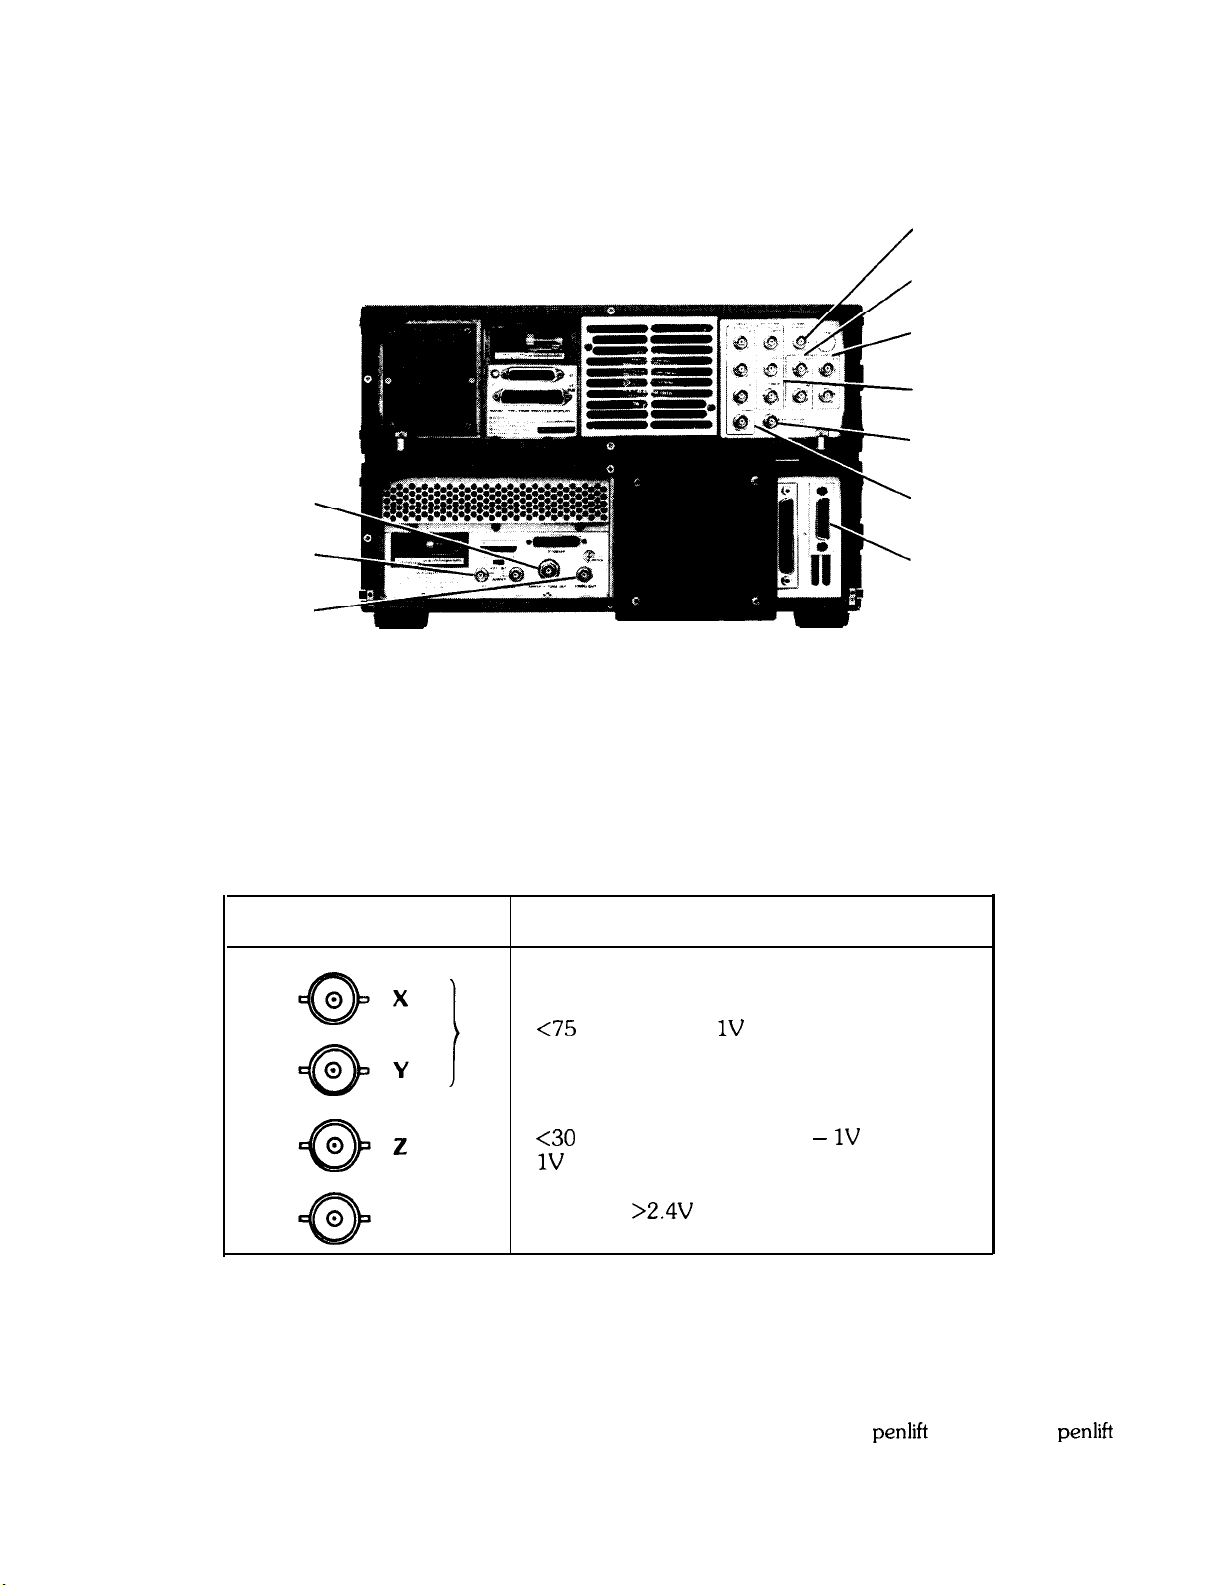
REAR PANEL OUTPUTS
REAR PANEL OUTPUTS
GENERAL INFORMATION
21.4 MHz IF Output
IF Input/Output
Video Input/Output
Recorder Outputs
External Trigger
Sweep and Tune Output
Frequency Reference
10 MHz Output
Display Outputs
HP-IB
Connector
Display Outputs
Display outputs allow all the CRT information to be displayed on an auxiliary CRT display such as the HP 1310A
Large Screen Display.
Display Outputs
<75
nsec rise times. 1V full deflection.
output
<30
nsec rise time. Intensity: - 1V blank, 0 to
1V
intensity modulation.
BLANK
TTL level
>2.4V
for blanking. Compatible with
most oscilloscopes.
Recorder Outputs
The recorder outputs allow the x-y plot of trace data with x-y plotters using positive
penlift
input. The front panel keys enable outputs for the calibration of x-y plotter reference points:
6 Manual Operation
coils or TTL
penlift
Page 11
GENERAL INFORMATION
REAR PANEL OUTPUTS
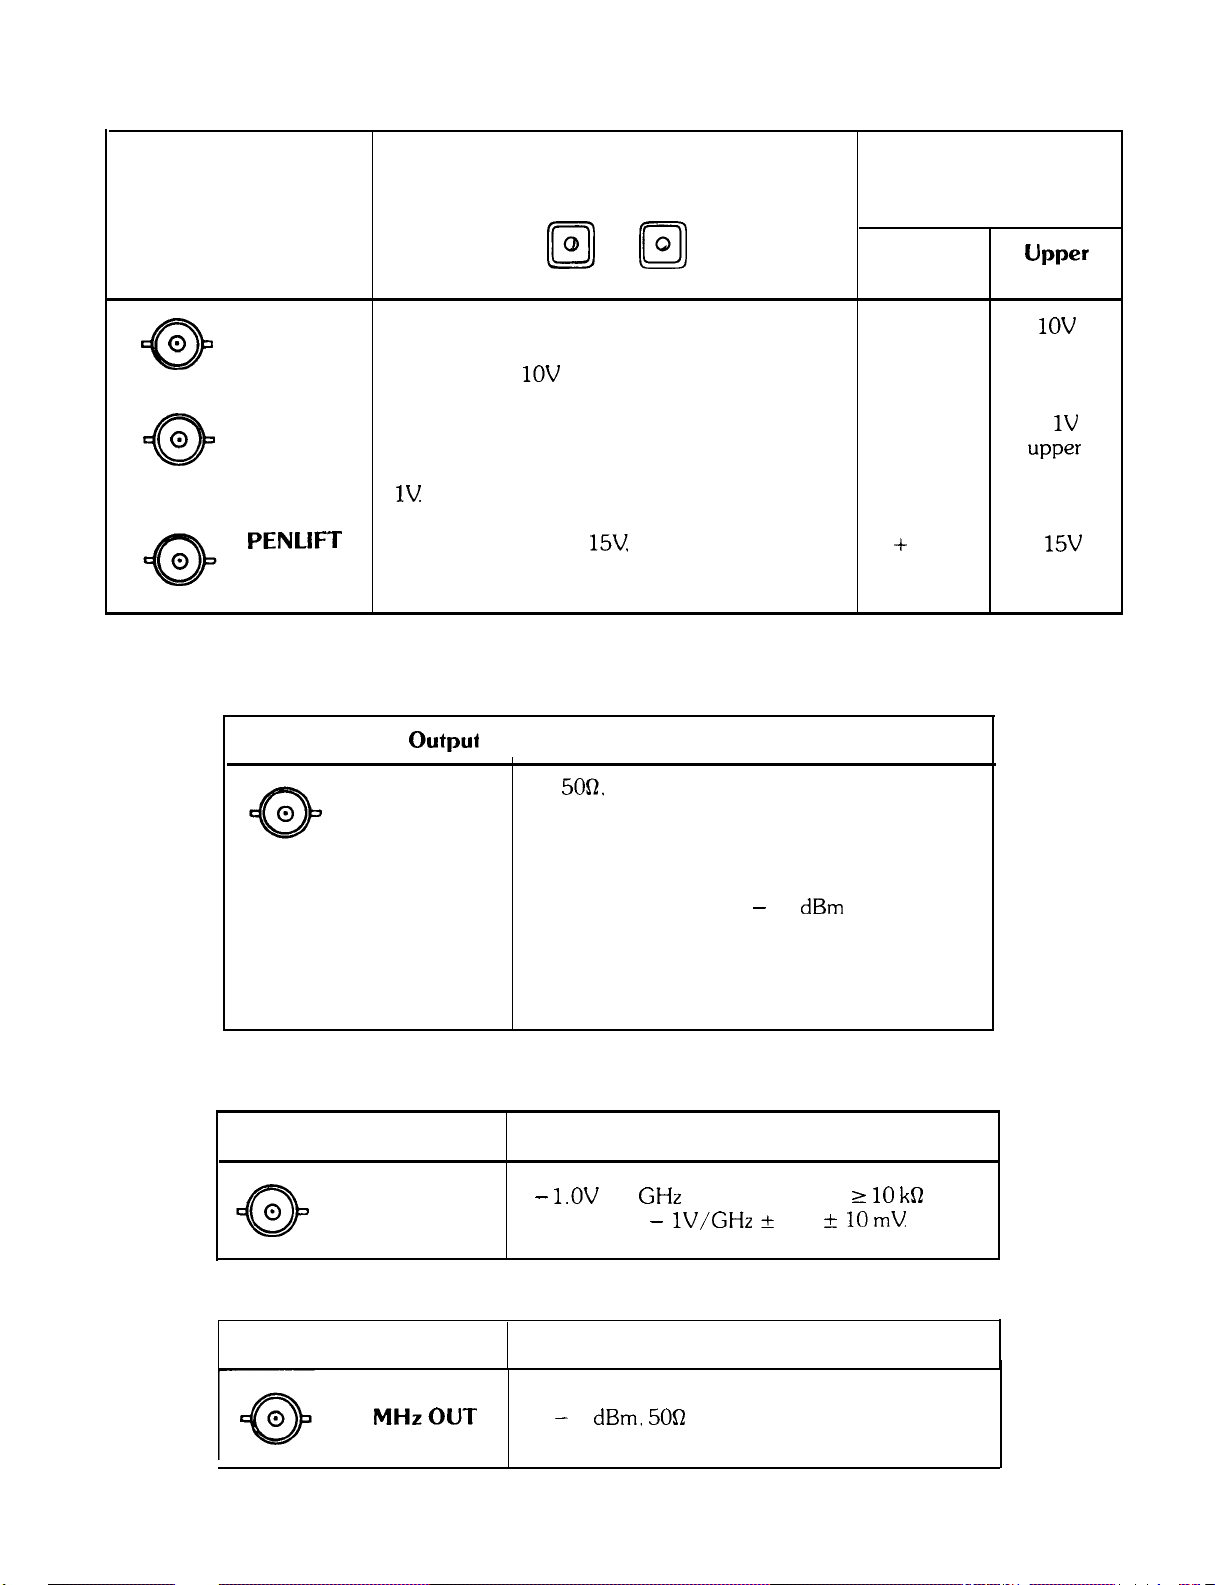
Recorder
outputs
SWEEP
0
0
VIDEO
0
0
PENLIFT
21.4 MHz IF Output
RECORDER
LOWER UPPER
LEFT
@
RIGHT
a
A voltage proportional to the horizontal sweep of
the CRT trace that ranges from OV for the left
edge and to +
1OV
for the right edge.
Detected video output (before A-D conversion)
proportional to vertical deflection of the CRT
trace. Output increases 100 mV/div from 0 to
1V
A blanking output,
15V
occurs during CRT
retrace; otherwise output is low at OV (pen
down).
RECORDER Outputs
when keys or HP-IB
commands are enabled
Lower
Left
OV
left
ov
lower
+ 15v
Upper
Right
1ov
right
+
1v
upper
+
15v
Sweep Plus
Tune Output
Sweep Plus Tune Output
10 MHz Output
21.4 MHz IF
21.4 MHz
IF OUTPUT
SWEEP + TUNE
OUT
Output
output
A
5052,
21.4 MHz output related to the RF input
to the analyzer.
In log scales, the IF output is logarithmically
related to the RF input signal; in linear, the output is linearly related.
The output is nominally - 20 dBm for a signal at
the reference level.
The analyzer’s resolution bandwidth setting controls the bandwidth. The input attenuator and IF
step gain positions control the amplitude.
Output
l.OV per GHz of tune frequency,
-
Accuracy:
- lV/GHz
+ 2% -t
110 kQ
10mV
load.
10 MHz Output
10
MHzOUT
> - 5 dBm.
output
50R
output impedance
Manual Operation 7
Page 12
REAR PANEL OUTPUTS
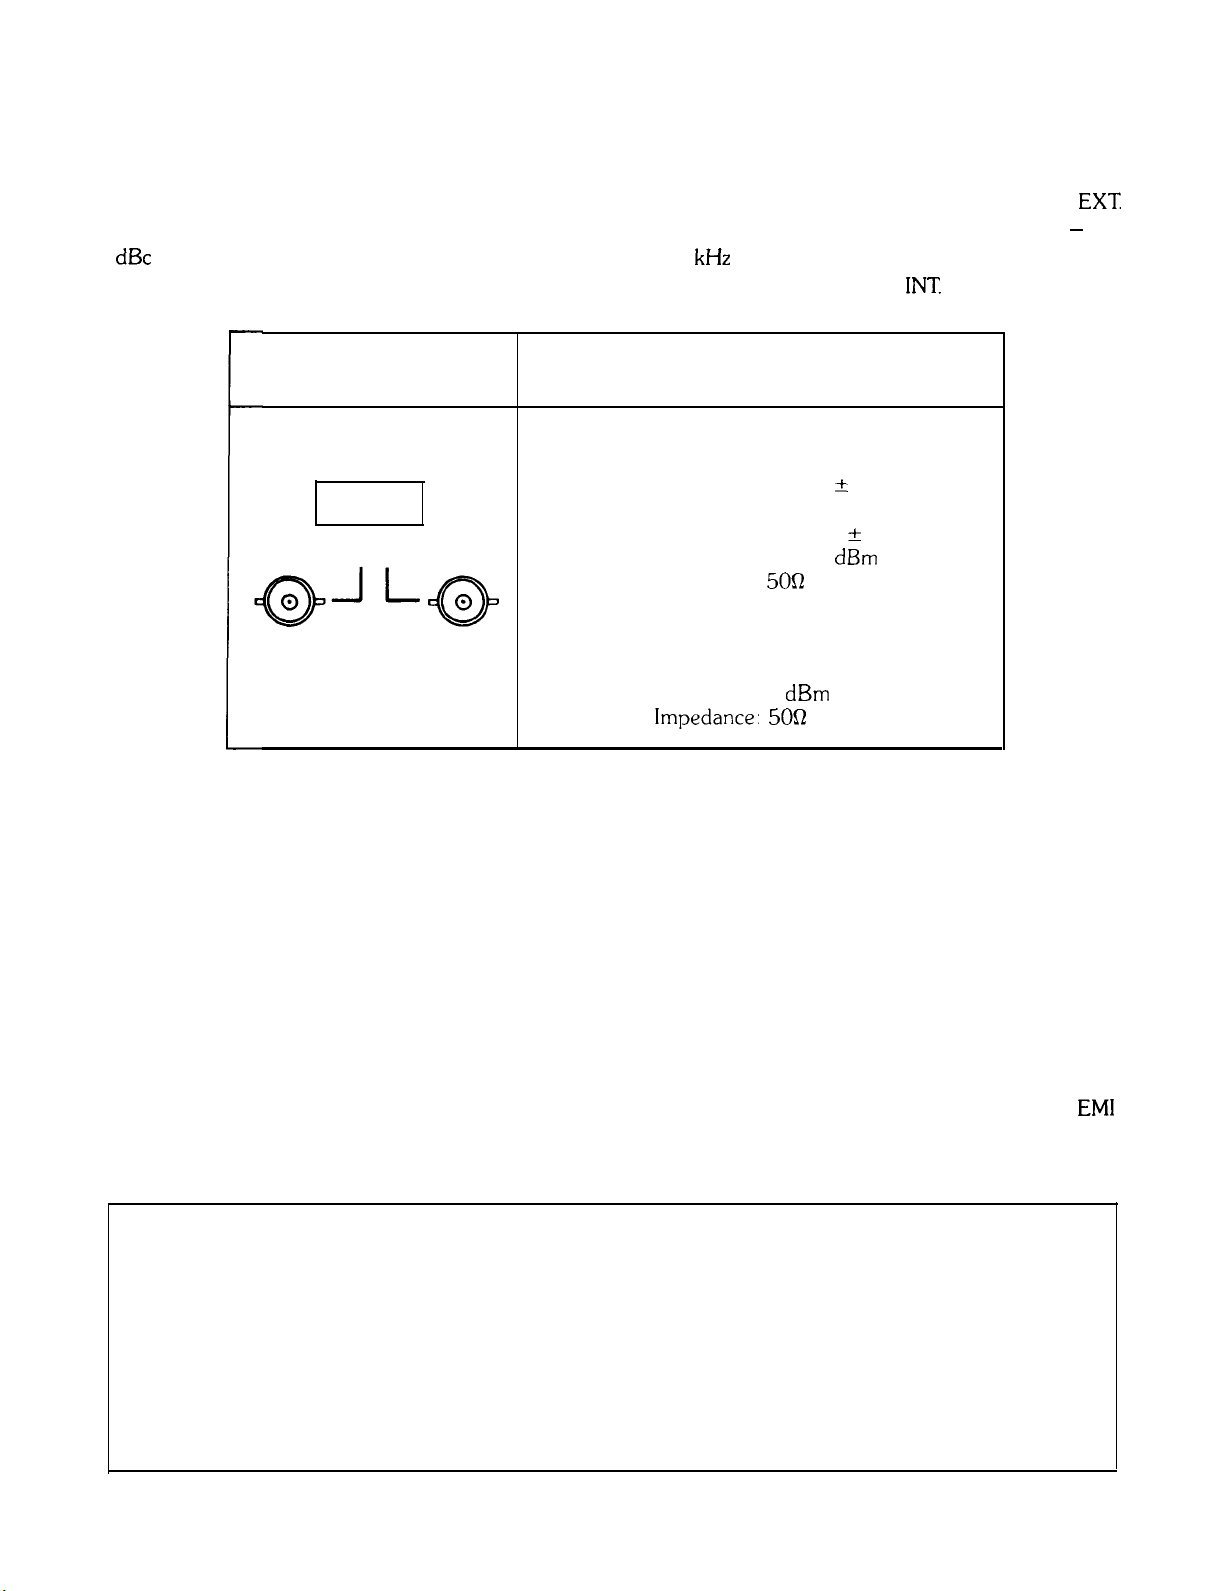
Frequency Reference Input/Output
GENERAL INFORMATION
To lock the spectrum analyzer to an external frequency reference, set the FREQ REFERENCE switch to
EXT.
Analyzer performance will be degraded unless frequency reference phase noise and spurious signals are < - 140
dBc single sideband (1 Hz) referred to 10 MHz at a 100 Hz to 10
the spectrum analyzer internal frequency reference, set the FREQ REFERENCE switch to
Frequency Reference
Input/Output
kHz
offset. To lock another spectrum analyzer to
INT
Input/Output
External Frequency Reference Requirements:
Frequency: 5 MHz & 50 Hz
or
EXT INT
Power: 0 to 10 dBm
Input Impedance:
10 MHz ? 100 Hz
5Of2
nominal
Internal Frequency Reference Characteristics.
Frequency: 10 MHz
Power: 0 dBm
Output
impedance: 5OQ
HP-IB Input Output Connector
The Hewlett-Packard Interface Bus allows remote operation of the analyzer as well as input and output of measurement data. See Section II of this manual.
IF and Video Connectors
The IF and Video connectors allow the 85650A Quasi-Peak Adapter to be used with the analyzer for
EM1
measurements
NOTE
When the Quasi-Peak Adapter is disconnected from the analyzer, make sure the IF INP
connector connects to the IF OUT connector with one short BNC cable, and VIDEO
INP connector connects to the VIDEO OUT connector with the other short BNC cable.
Failure to connect the BNC cables will result in a loss of signal.
8 Manual Operation
Page 13
GENERAL INFORMATION
REAR PANEL OUTPUTS
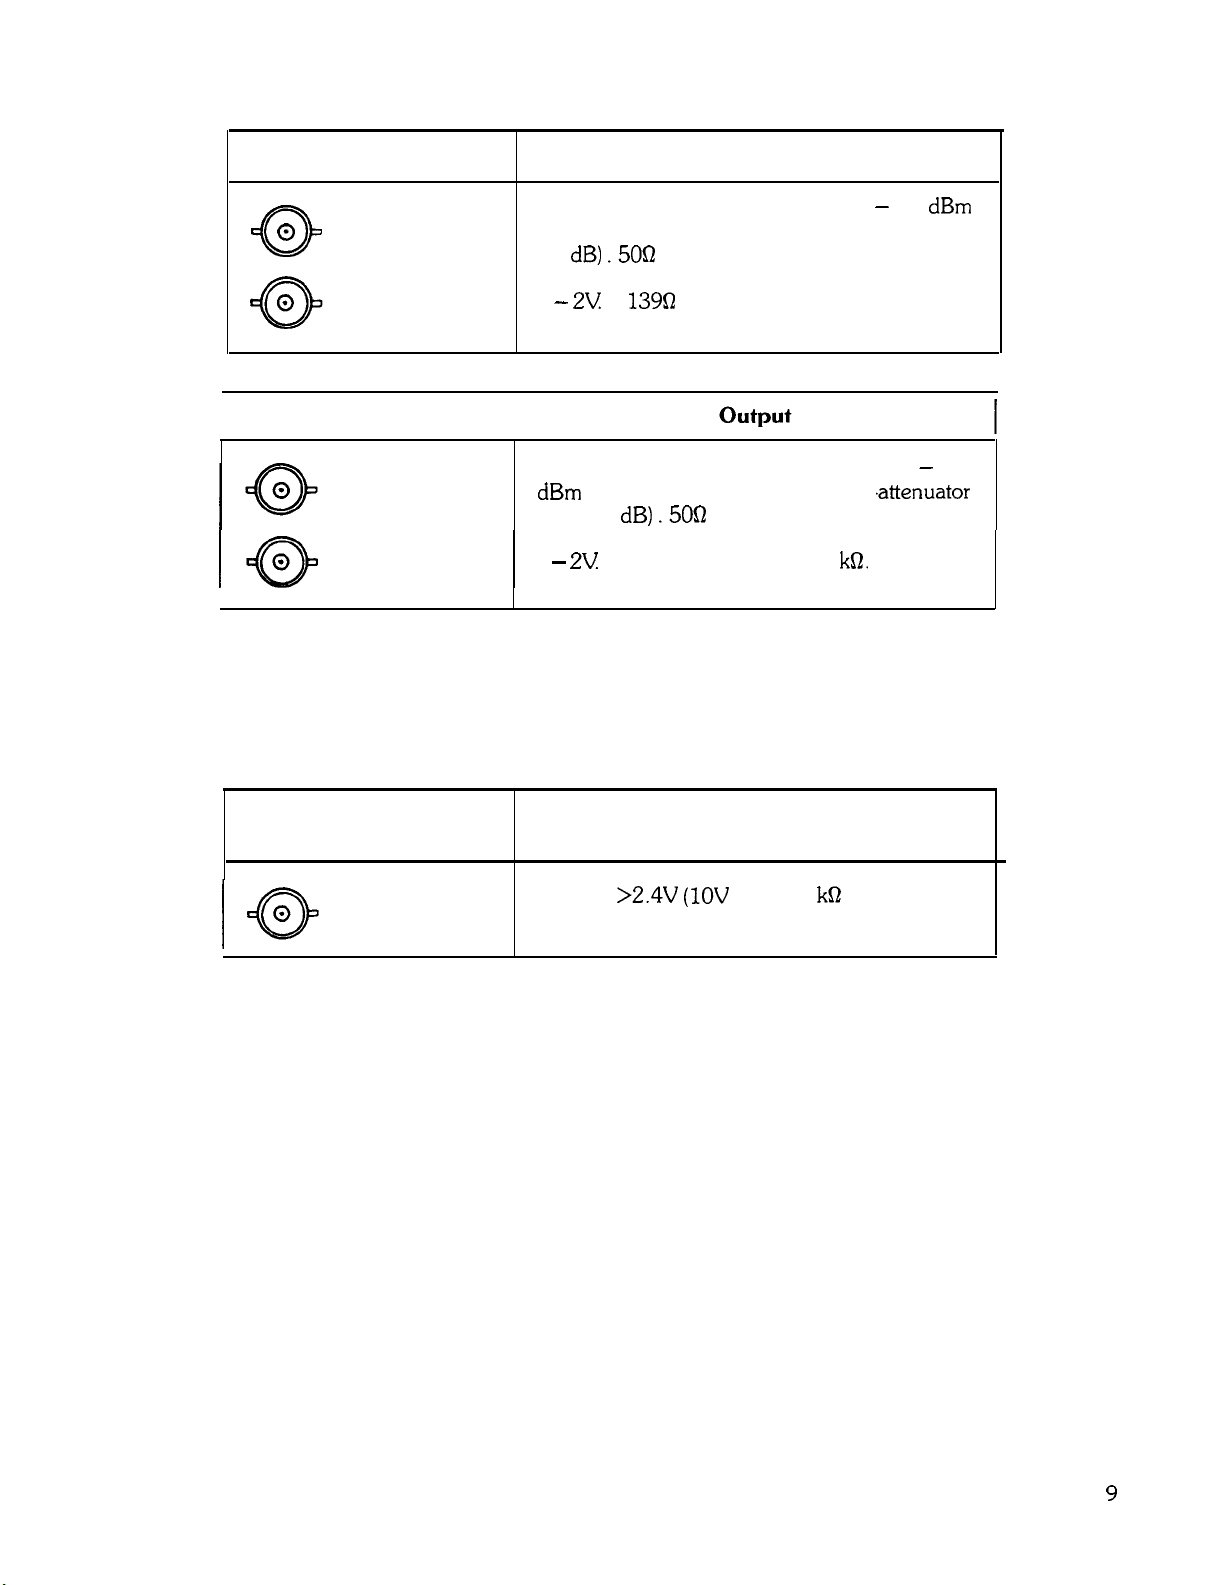
IF and Video Connectors
Input
21.4 MHz input. Input is nominally - 11 dBm
0
0
IF and Video Connectors
IF INP
VIDEO INP
(with spectrum analyzer input attenuator set to
10
dB) .5OQ
0 -
2V
input impedance.
139Q
input impedance.
21.4 MHz output. Output is nominally - 11
IF OUT
VIDEO OUT
dBm (with spectrum analyzer input .attenuator
set to 10
0 -
dB) .5OQ
output impedance.
2V Output impedance < 10
kQ.
External Sweep Trigger Input
The External Sweep Trigger input allows the analyzer’s internal sweep source to be triggered by an external
voltage.
External Sweep Trigger
Input
EXT TRIGGER
Must be
>2.4V (1OV
impedance.
Input
max) . 1 kQ nominal input
Manual Operation
9
Page 14
GETTING STARTED
FRONT PANEL CONCEPT
Chapter 1
GETTING STARTED
GENERAL DESCRIPTION
This chapter is intended to provide you with a quick overview of the use and capability of the HP 8566B Spectrum
Analyzer. The chapters following provide the details on each aspect of operation.
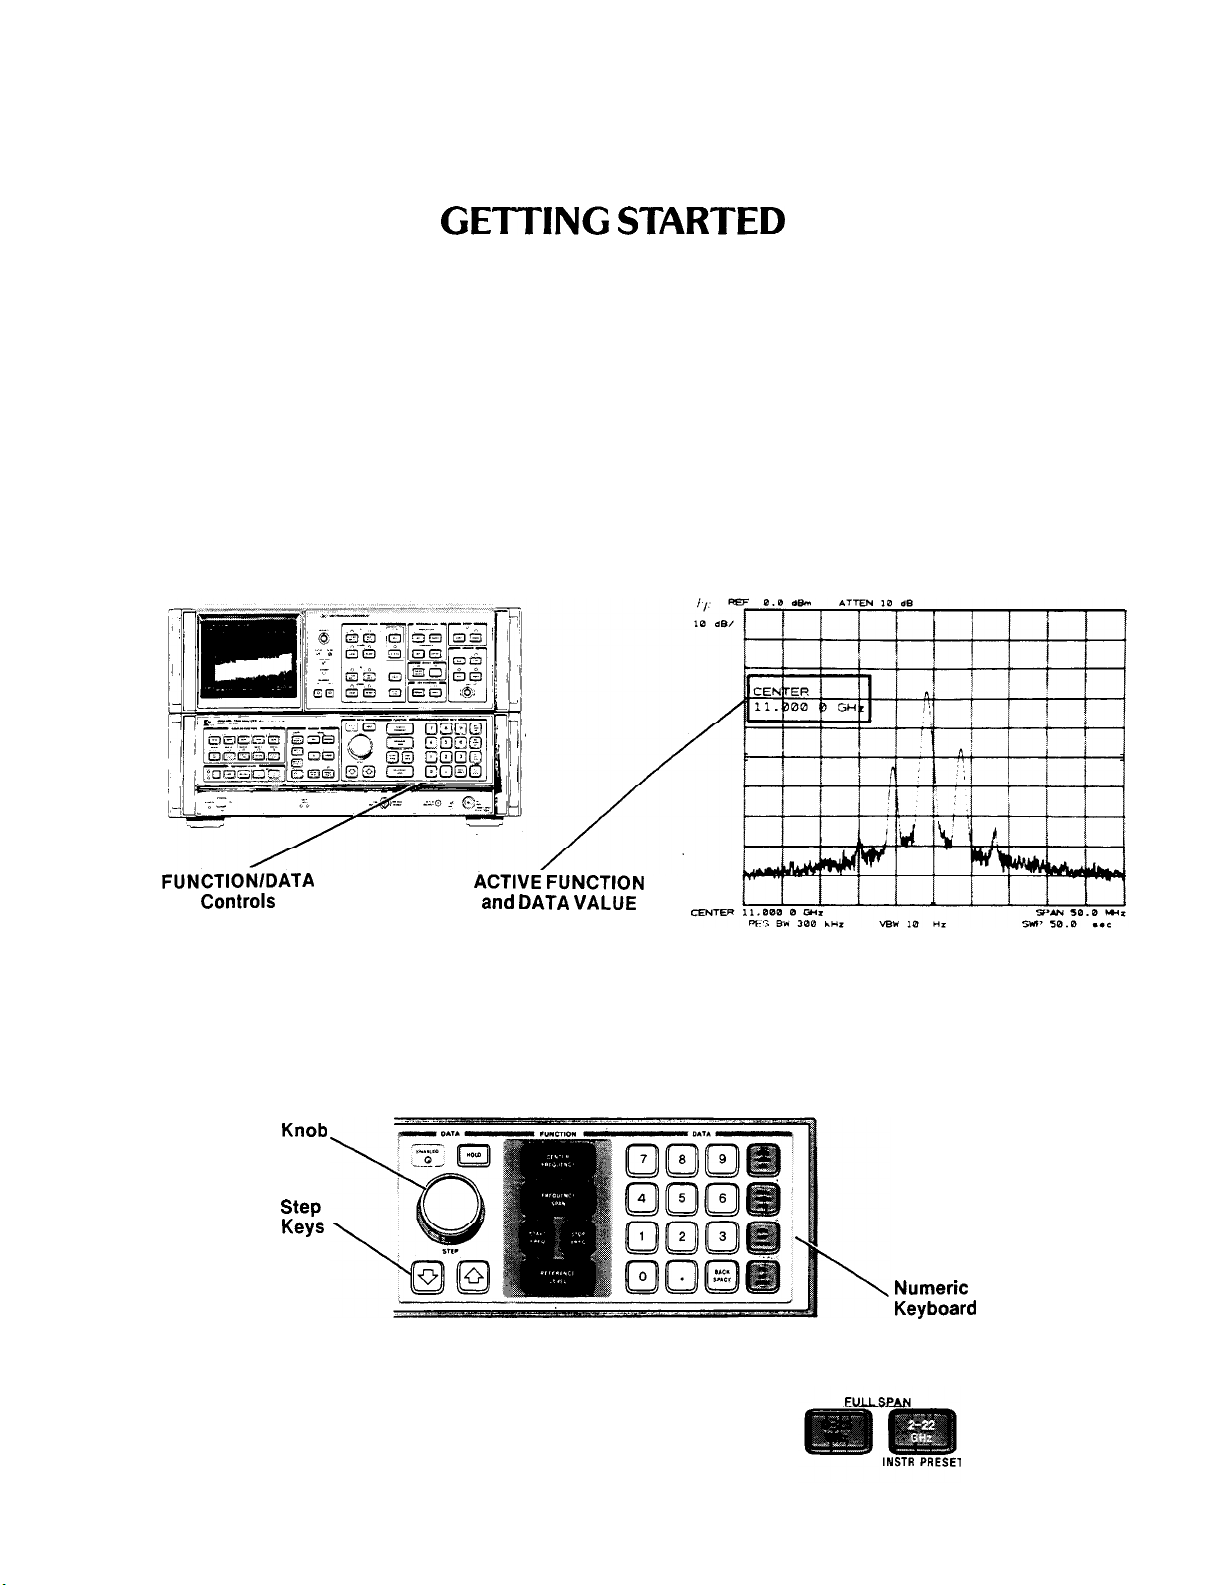
FRONT PANEL CONCEPT
The basic controls on the HP 8566B front panel consist of FUNCTION keys and DATA control keys. Functions are
activated by pressing the appropriate key; its value is then changed via the DATA control knob, step keys or
numeric keyboard. The activated FUNCTION will appear on the CRT as well as its current value.
FUNCTION/DATA
Controls
ACTIVE FUNCTION
and DATA
VALUE
The front panel controls are grouped by function. The majority of measurements can be made with only the
FUNCTION/DATA group illustrated. The major FUNCTION controls are CENTER FREQUENCY FREQUENCY SPAN (or START/STOP FREQ),
and REFERENCE LEVEL. The value of the activated FUNCTION
can be changed continuously with the knob, incrementally with STEP KEYS or exactly with the numeric keyboard.
Knob
Step
Keys
Numeric
Keyboard
MAKING A MEASUREMENT
Two FULL SPAN keys allow you to select a wide
Manual Operation 1 1
Page 15
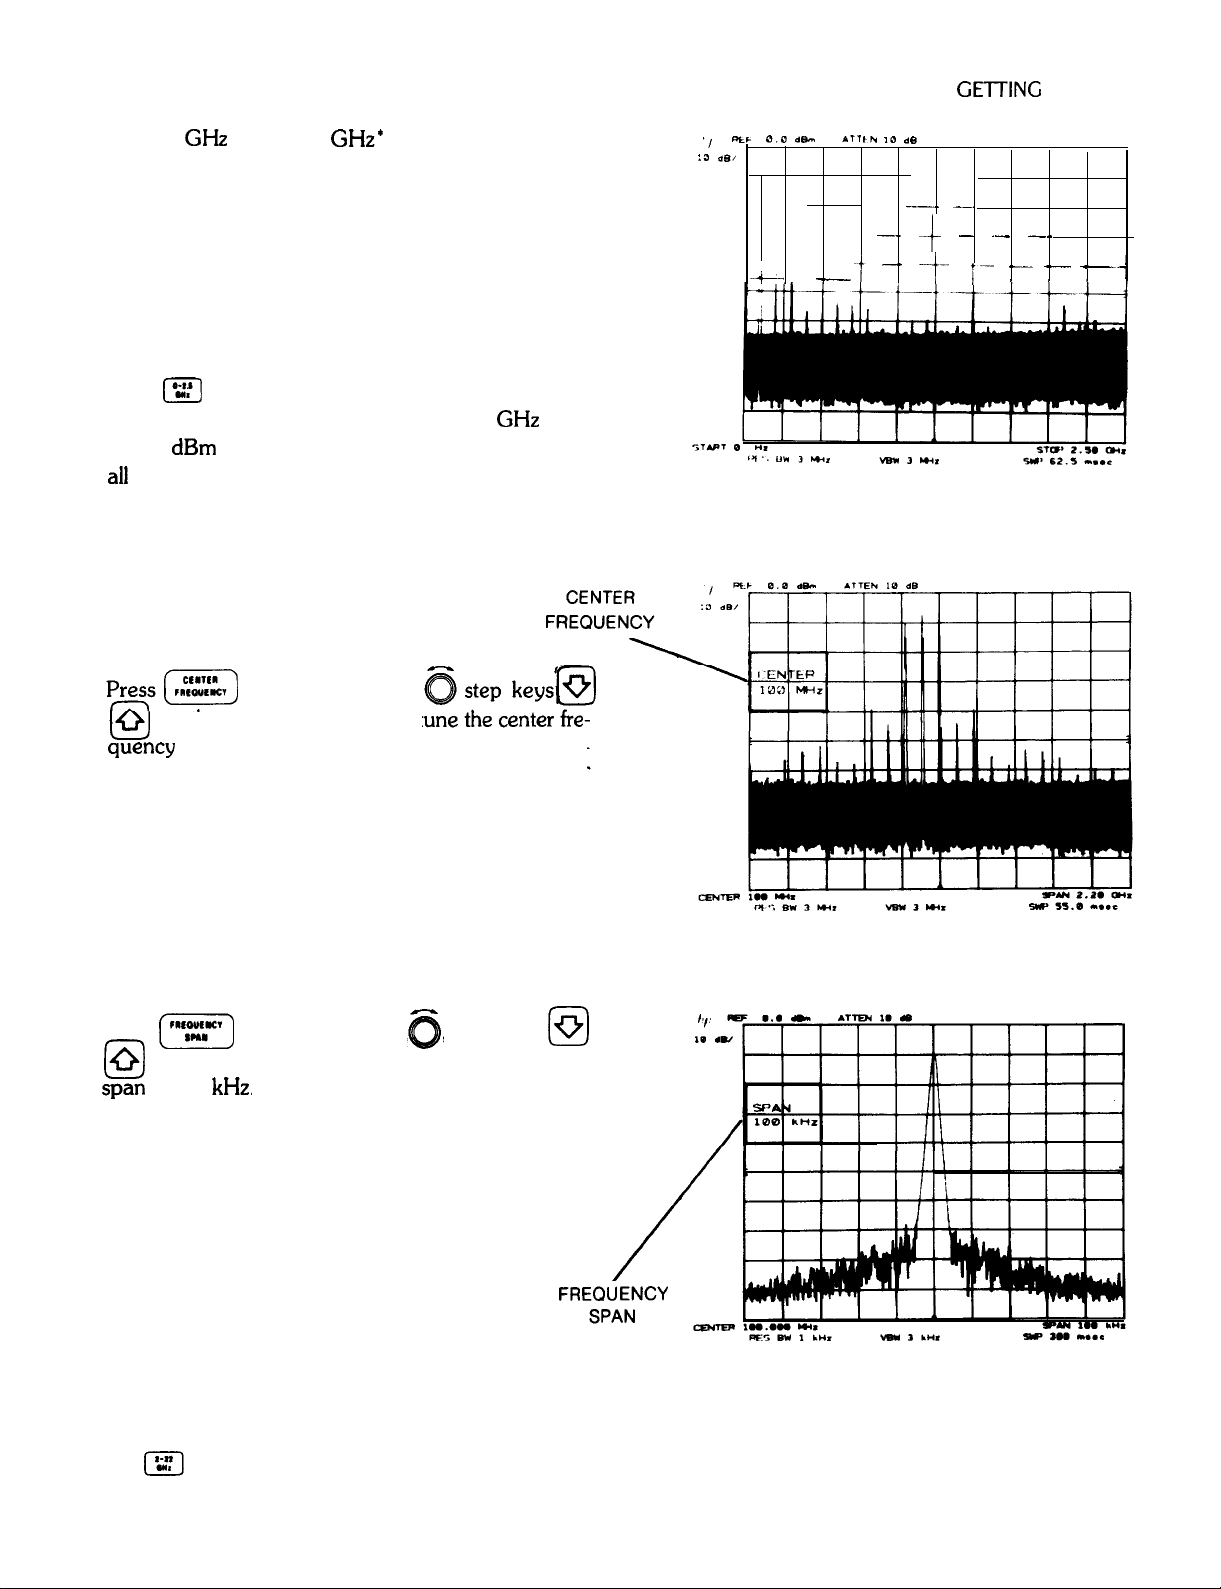
MAKING A MEASUREMENT
0- 2.5 GHz or 2 -22 GHz’ frequency span. Both
keys preset all the analyzer functions to automatically
maintain a calibrated display during the course of the
measurement.
Example
Connect the CAL OUTPUT signal to RF INPUT
Press
l%J
This presets the analyzer to a full 0- 2.5 GHz span
with 0 dBm Reference level and automatically couples
al1
secondary receiver functions.
,,
e&c 0.0 d&n .Tllh
:3
&I
T
GE-l-l-ING
10
de
--_.
_
-.' t -- --' -.'
--
-.
t--
i-
STARTED
'--
--
---
and use the knob
or the numeric keyboard to t
quency
to 100 MHz. Note that the activated FUNCTION (CENTER FREQUENCY) appears on the CRT
graticule field.
Press
bl
$6
(91
or numeric keyboard to reduce the frequency
to 100
and use the knob
kHz.
, step keys
@
‘The
I’;:]
key is also activated with LINE ON.
12 Manual Operation
/
FREQUENCY
Page 16
GETTING STARTED
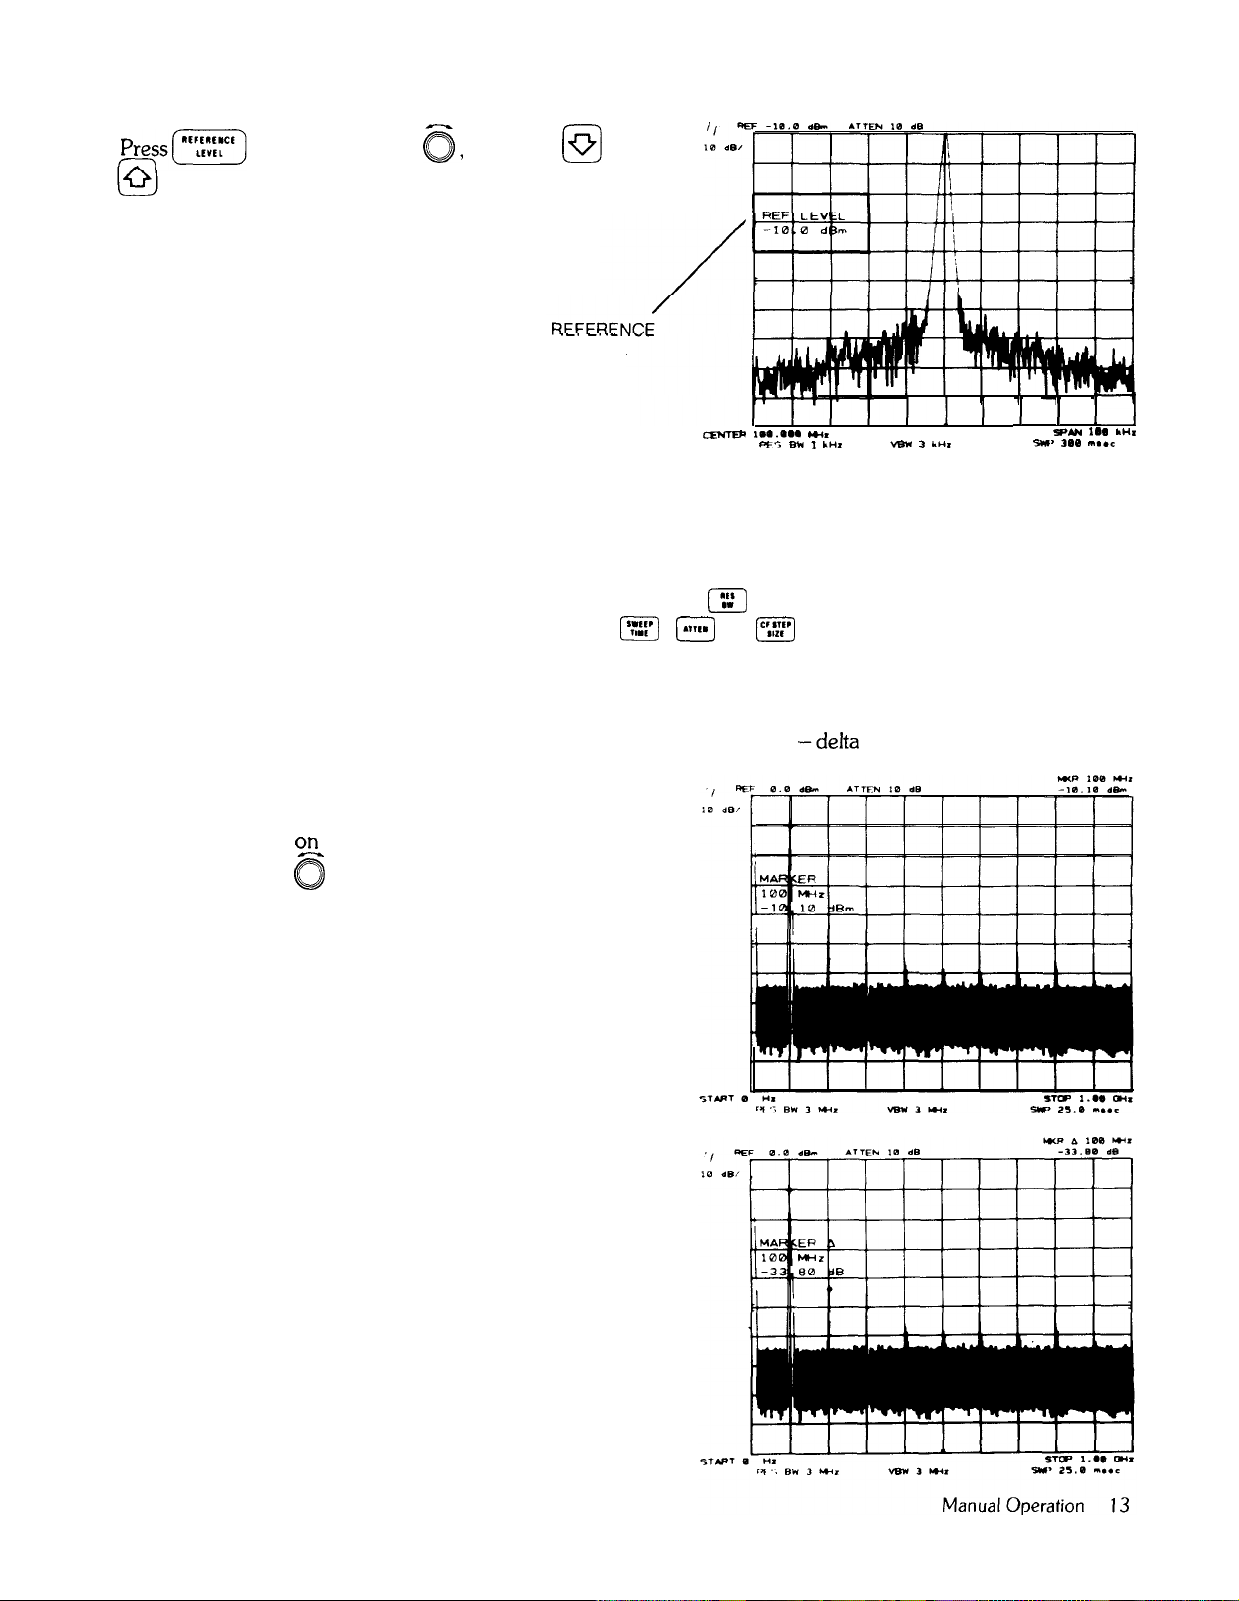
DIRECT FREQUENCY AND AMPLITUDE READOUT
and use the knob 0, step keys
or numeric keyboard to position the peak of the
signal on the top graticule line.
The frequency and amplitude of the signal are read out from the graticule border. All secondary analyzer functions
(resolution bandwidth, video bandwidth, sweep time, and attenuation) were automatically adjusted to maintain a
fully calibrated display. The coupled functions can also be uncoupled to allow manual operation.
For instance, to manually control the resolution bandwidth, press (::‘1 and change bandwidth with any combina-
tion of DATA control. The above also applies to I’:“:“) , @ ,
c)
0
.-. -.
LEVEL
.-
lzxrEu a...e.. m*
[,,,.)
, or
Pf5
ml 1
[‘::::‘1
I1 I I I
.“I
wn 3 L”,
SW’
I1
1..
5pbN
3ae
Il..=
DIRECT FREQUENCY AND AMPLITUDE READOUT
.“I
Markers can be used to quickly identify signal frequency and
measure signal separation or amplitude differences.
Activate a marker 02 the display with NORMAL.
Tune marker with 0 .
tude of the signal are read out with the marker.
To measure the harmonic(s) of the signal, press A and
tune the second marker to the signal’s harmonic. The
frequency separation and amplitude difference are
read out.
The frequency and ampli-
amplitudes
-delta
(A) markers are available to
Page 17

SAVE/RECALL GETTING STARTED
SAVE/RECALL
The HP 8566B instrument control settings can be saved in an internal memory and later recalled to make a
measurement.
SHIFT KEYS
In addition to the front panel functions listed on the keys, another set of functions can be assigned to the same keys
by pressing the blue B key prior to activating a front panel key. These will be covered in more detail in Chapter
11.
[/
[I(c1111 m
to
0
6
provide access to the six internal storage registers.
AUTOMATIC MEASUREMENTS
The HP 8566B is fully programmable via the Hewlett-Packard Interface Bus (HP-IB) -HP’s implementation of
IEEE STD 488-1975. Internationally, HP-IB is in concert with the IEC main interface document.
A computing controller/calculator can be used with the HP 8566B to configure an automatic measurement
system. Just as the analyzer’s front panel is keyed manually to control functions and change values, simple
program codes are transmitted via the HP-IB with a controller to make measurements automatically These program codes are listed in the Remote Operation section of the instrument pull-cards.
Detailed information on remote operation is found in Section II of this manual.
14 Manual Operation
Page 18
DATA
DATA CONTROLS
CHAPTER 2
DATA
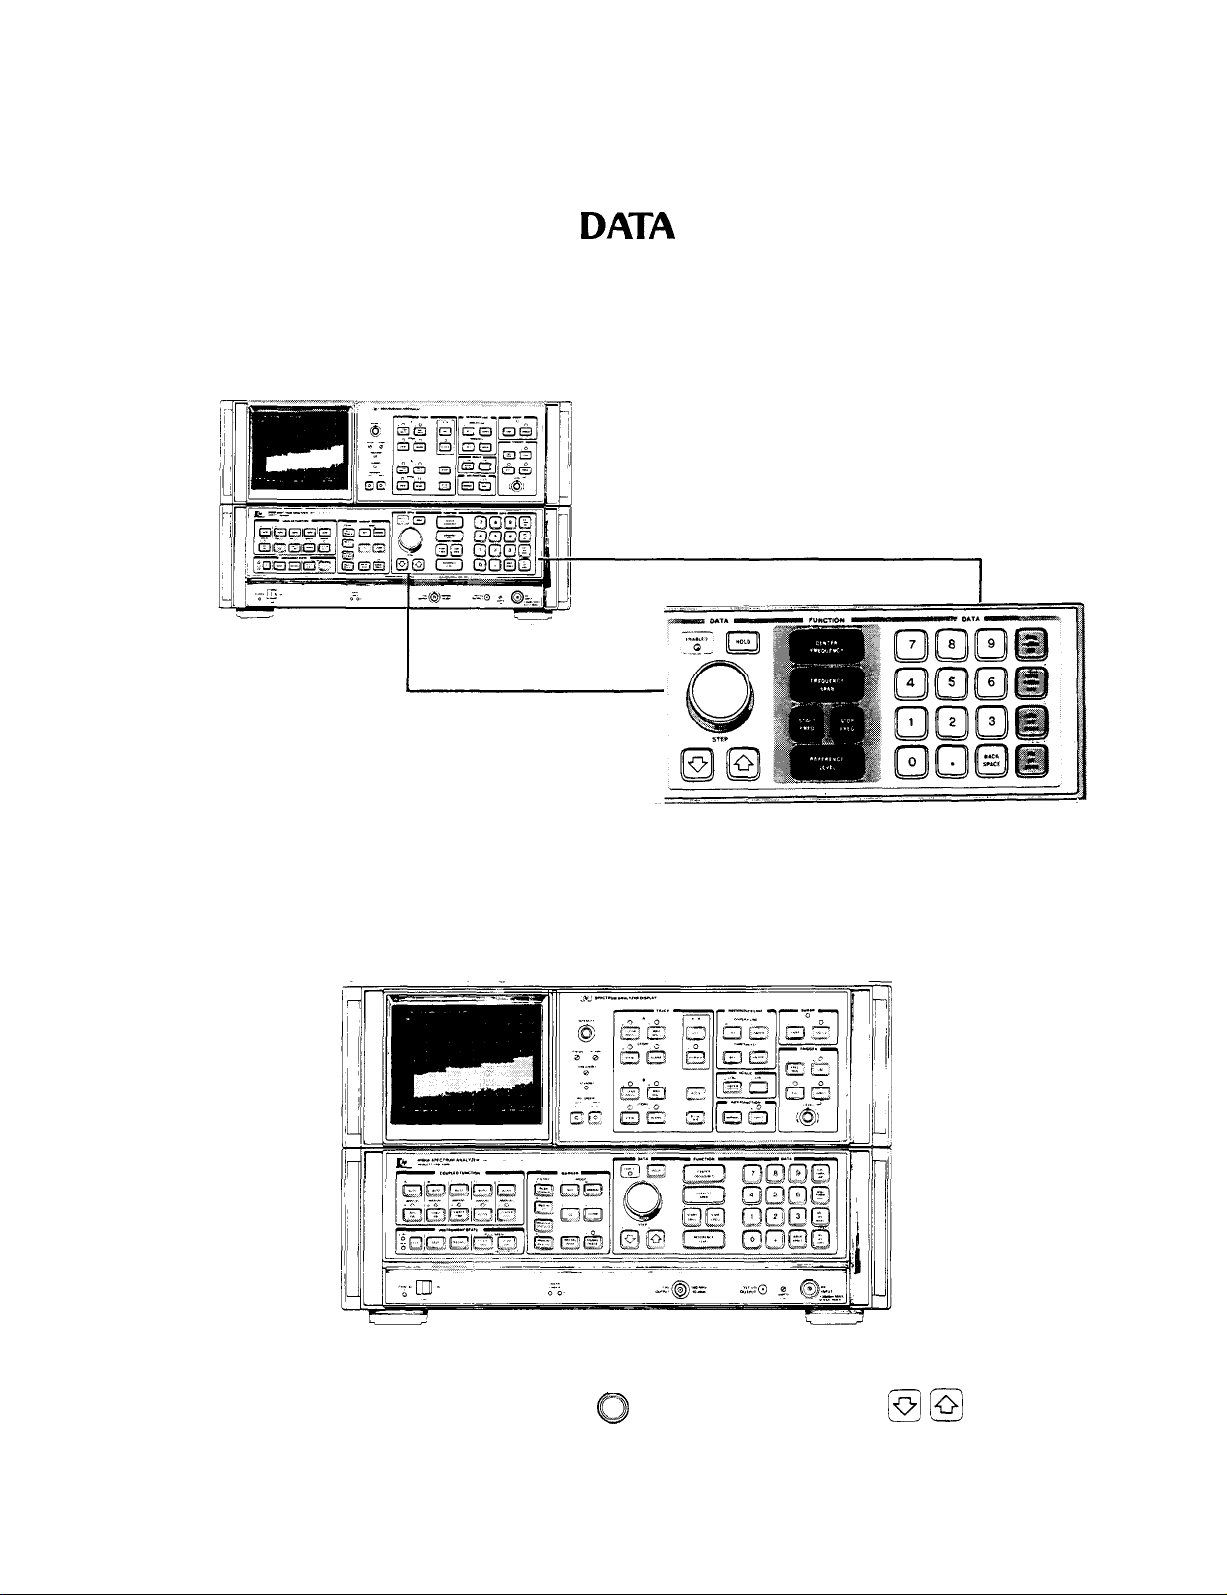
GENERAL DESCRIPTION
DATA controls are used to change function values for functions such as center frequency, start frequency, resolu-
tion bandwidth, or marker position.
DATA CONTROLS
The DATA controls are clustered about the FUNCTION keys which “call up” or activate the most frequently used
spectrum analyzer control functions: center frequency, frequency span (or start/stop frequency), and reference
level. The other functions that accept DATA control are shown below:
FRONT PANEL FUNCTIONS USING DATA CONTROLS
To the left of the FUNCTION Keys are the Data knob 0 and the DATA STEP keys
to make incremental changes to the activated function. To the right of the FUNCTION keys is the DATA number/
units keyboard which allows changes to an exact value.
@ @
, which are used
Manual Operation 15
Page 19

DATA ENTRY READOUT
The DATA controls will change the activated function in a manner prescribed by that function. For example, center
frequency can be changed continuously with the DATA knob 0 ,
with the DATA STEP keys @ a ,
width, which can be set only to discrete values, can still be changed with any of the DATA controls. The DATA
knob 0 and DATA STEP keys 13
from the number/units keyboard which may not coincide with an allowable bandwidth will select the nearest
bandwidth.
or set exactly with the DATA number/units keyboard. Resolution band-
61
increment the setting from one bandwidth to the next. An entry
or in steps proportional to the frequency span
DATA
DATA ENTRY READOUT
DATA entries are read from the CRT display as they are changed.
PREVENTING DATA ENTRY
A function can be deactivated by pressing m . The active function readout is blanked and the ENABLED light
goes out, indicating no DATA entry can be made. Pressing a function key re-enables the DATA controls.
DATA KNOB
The DATA knob 0 11a ows the continuous change of center frequency, frequency span (or start/stop frequencies), reference level, marker positions, display line, and threshold. It can also change the function values which
are only incremented.
Clockwise rotation of the DATA knob will increase the function value. For continuous changes, the knob’s sensitivity is determined by the measurement range and the speed at which the knob is turned. For example, when the
center frequency is activated,
one quarter turn.
increases the value of the center frequency one horizontal division of span per
0
DATA STEP KEYS
The DATA STEP keys allow rapid increase @ or decrease
dependent either upon the analyzer’s measurements range, on a preset amount,
fixed values, the next value in a sequence. Examples: Activate center frequency and
frequency value by an amount equal to one division of the frequency span (one tenth of the frequency span). If
the center frequency step size m has
amount. If frequency span were activated,
sequence. Activate resolution bandwidth
single step,
16 Manual Operation
hen
10)
and [&
preset,
would change the span to the next lower value in predetermined
~
will select the next widest bandwidth.
--I
2)
of the active function value. The step size is
r
or,
for those parameters with
will increase the center
6
0
will increase the center frequency by that preset
El
Each press results in a
Page 20

DATA DATA NUMBER/UNITS KEYBOARD
DATA NUMBER/UNITS KEYBOARD
The DATA number/units keyboard (or DATA keyboard) allows exact value entries to center frequency, frequency
span (or start/stop frequency), reference level, log scale, marker positions, display line, threshold, and the COUPLED FUNCTIONS.
An activated parameter is changed by entering the number (with the CRT display providing a readout) then
selecting the appropriate units key. The value is not changed (entered) until the units key is pressed.
l
.
The number portion of the entry may include a decimal,
number. Corrections to number entries are made with
Example: With center frequency activated,
(TJ-Jp-JJQ[Z][Z]~@
0
0
:::,:
If not, the decimal is understood at the end of the
,
which erases the last digit for each press.
will set the center frequency to 1.250
If the units key were pressed without a number entry, 1 is entered (except in zero frequency span).
Negative DATA Entry
Negative entries from the number units keyboard can be made for power and frequency but not time and voltage.
Negative power entries can be made using -Z . The “ - dBm” key will enter - dBm, - dBmV or - dBpV For
example, in reference level, with the dBmV units, an entry of
Negative frequency entries can be made using
as a prefix to the frequency entry For example, to enter a negative start frequency, press
p-J(TJ(TJ@~
Not all functions will accept negative entries (the sign will be ignored).
This enters the frequency value as - 100 MHz.
GHz.
““I
0
will enter - 50 dBmV
m-m
z; (g-m
0
MULTIPLE DATA CHANGES
A function, once activated, may be changed as often as necessary without reactivating that function (see Chapter
3, FUNCTION). Any of the DATA controls can be used in any order. l
It is not always necessary to make a DATA entry. For example, start and stop frequency may be activated simply to
allow readout of the left and right display reference frequencies as start/stop frequencies.
l Exceptions are the SHIFT KEY FUNCTIONS which use only DATA number/units keyboard. See Chapter 11.
Manual Operation 17
Page 21
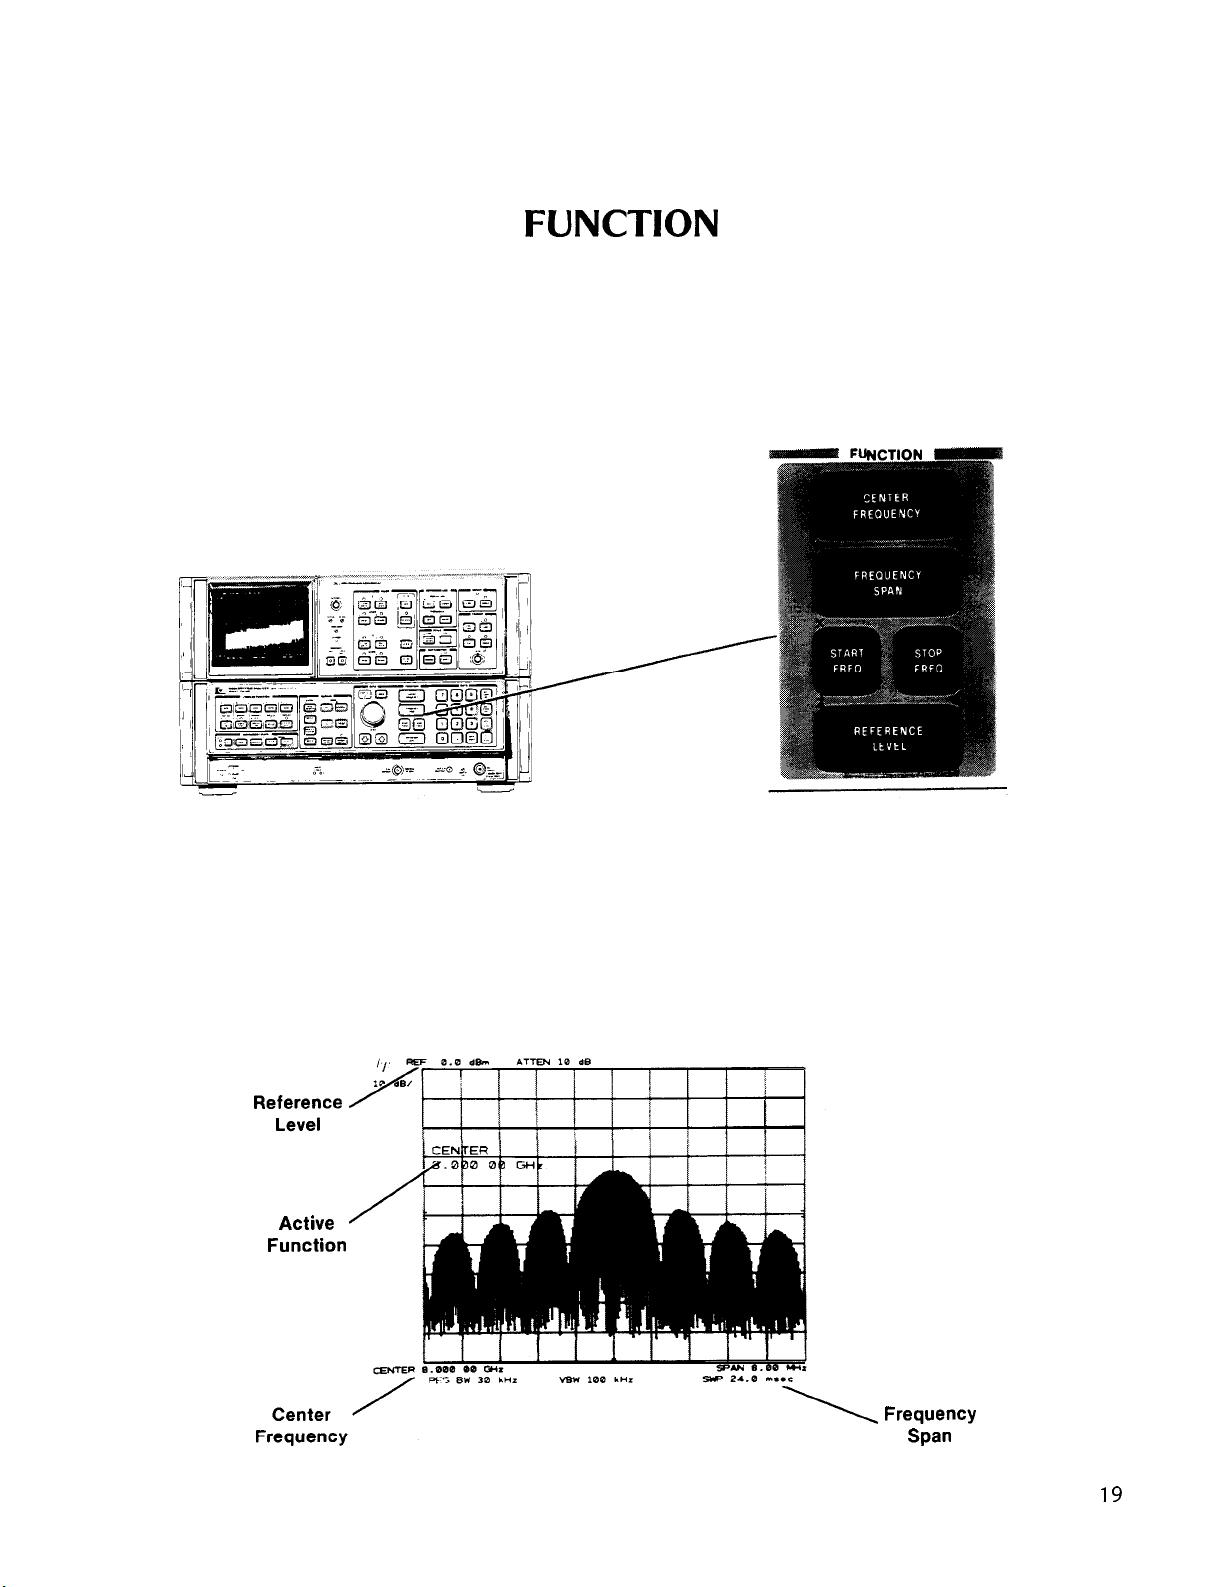
FUNCTION GENERAL DESCRIPTION
CHAPTER 3
FUNCTION
GENERAL DESCRIPTION
This chapter describes the use of the major function block- CENTER FREQUENCY FREQUENCY SPAN (or
START/STOP FREQUENCY), and REFERENCE LEVEL.
NCTION -
A FUNCTION is enabled by pressing the desired FUNCTION key Once enabled, the function, along with its
current data value, is displayed in the active graticule area of the CRT as well as outside the graticule border. To
change the value of the active function, use either the DATA knob, step keys, numeric keyboard, or a combination
of all three. The HOLD key above the DATA knob can be used to retain the present instrument state and prevent
any inadvertent entry of DATA. HOLD clears the active function area of the CRT as well as de-activates any
function.
Active
Function
Frequency
Span
Manual Operation
19
Page 22
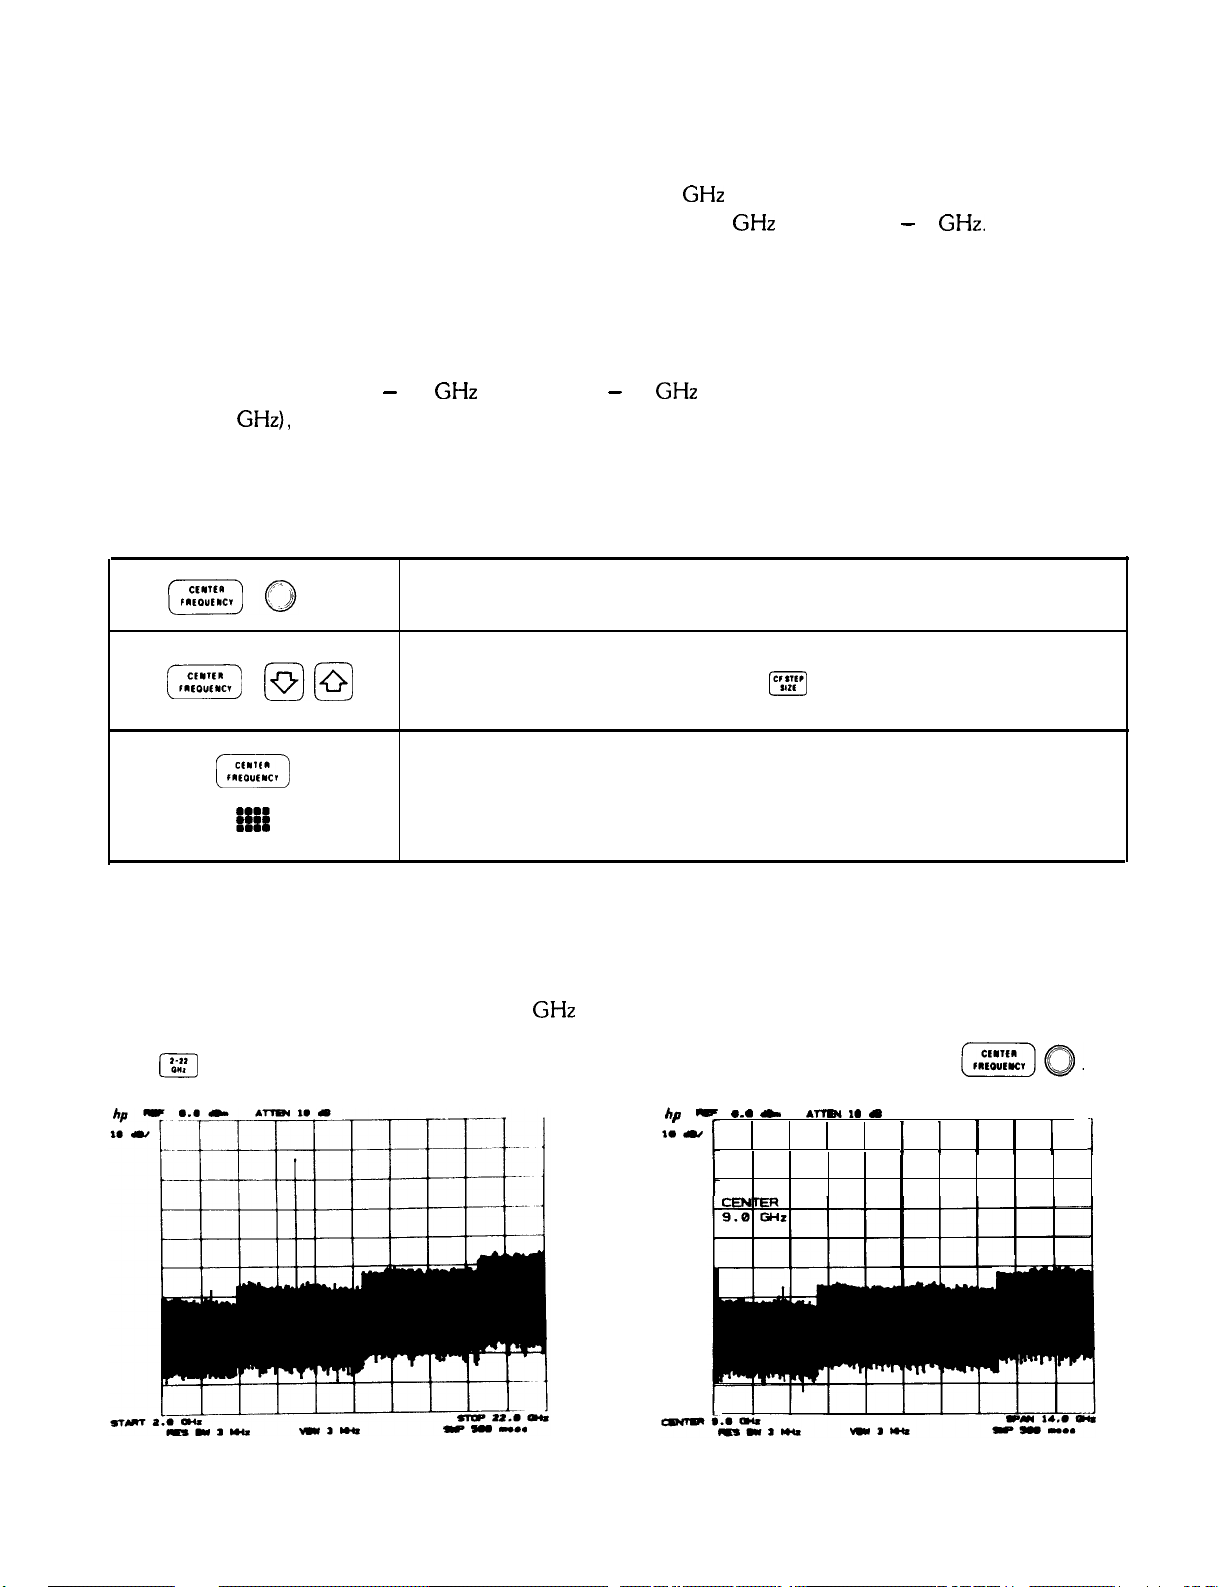
CENTER FREQUENCY
CENTER FREQUENCY
FUNCTION
The center frequency can be tuned continuously from 0 to 22
Additional band overlap enables the center frequency to tune up to 24 GHz and below to - 1
The center frequency can be set with 1 Hz resolution. Readout resolution is 1% of the frequency span, hence the
highest readout resolution is obtained with narrow frequency spans. Data entered, however, is always accurate to
1 Hz even though the center frequency readout may display less resolution.
During band crossings (from 0 - 2.5
or above 22
Appendix for detailed information.)
DATA Entry with CENTER FREQUENCY
[-iEz]
GHz),
(EC)
. . . .
#I
the frequency span may change to enable the desired center frequency to be set. (See
@@
GHz
low band to 2 - 22
Changes the center frequency by about one half the total frequency span
each full turn.
Changes the center frequency by one tenth of the frequency span, i.e., by
one division. COUPLED FUNCTION
size.
Allows direct center frequency entry. The analyzer will accept a center frequency entry with 1 Hz resolution. Even though the readout may show a
fewer number of digits (due to wide frequency span), as the span is narrowed the full entry will be read out. Abbreviated readouts are not rounded.
GHz
using any combination of DATA controls.
GHz.
GHz
microwave band) or at band edges (below 0 Hz
[‘::::‘I
can be used to change this step
Example
Once a signal response is placed at the center of the display, the frequency of the signal can be read out from
CENTER FREQUENCY The input signal is a 9 GHz synthesized source.
Press
1’6::)
for a full span display.
20 Manual Operation
Tune signal to center of display with
. . .
L
b -
I. *
.-I.*
! ! ! ! ! 1
(-ZZ)~.
Page 23
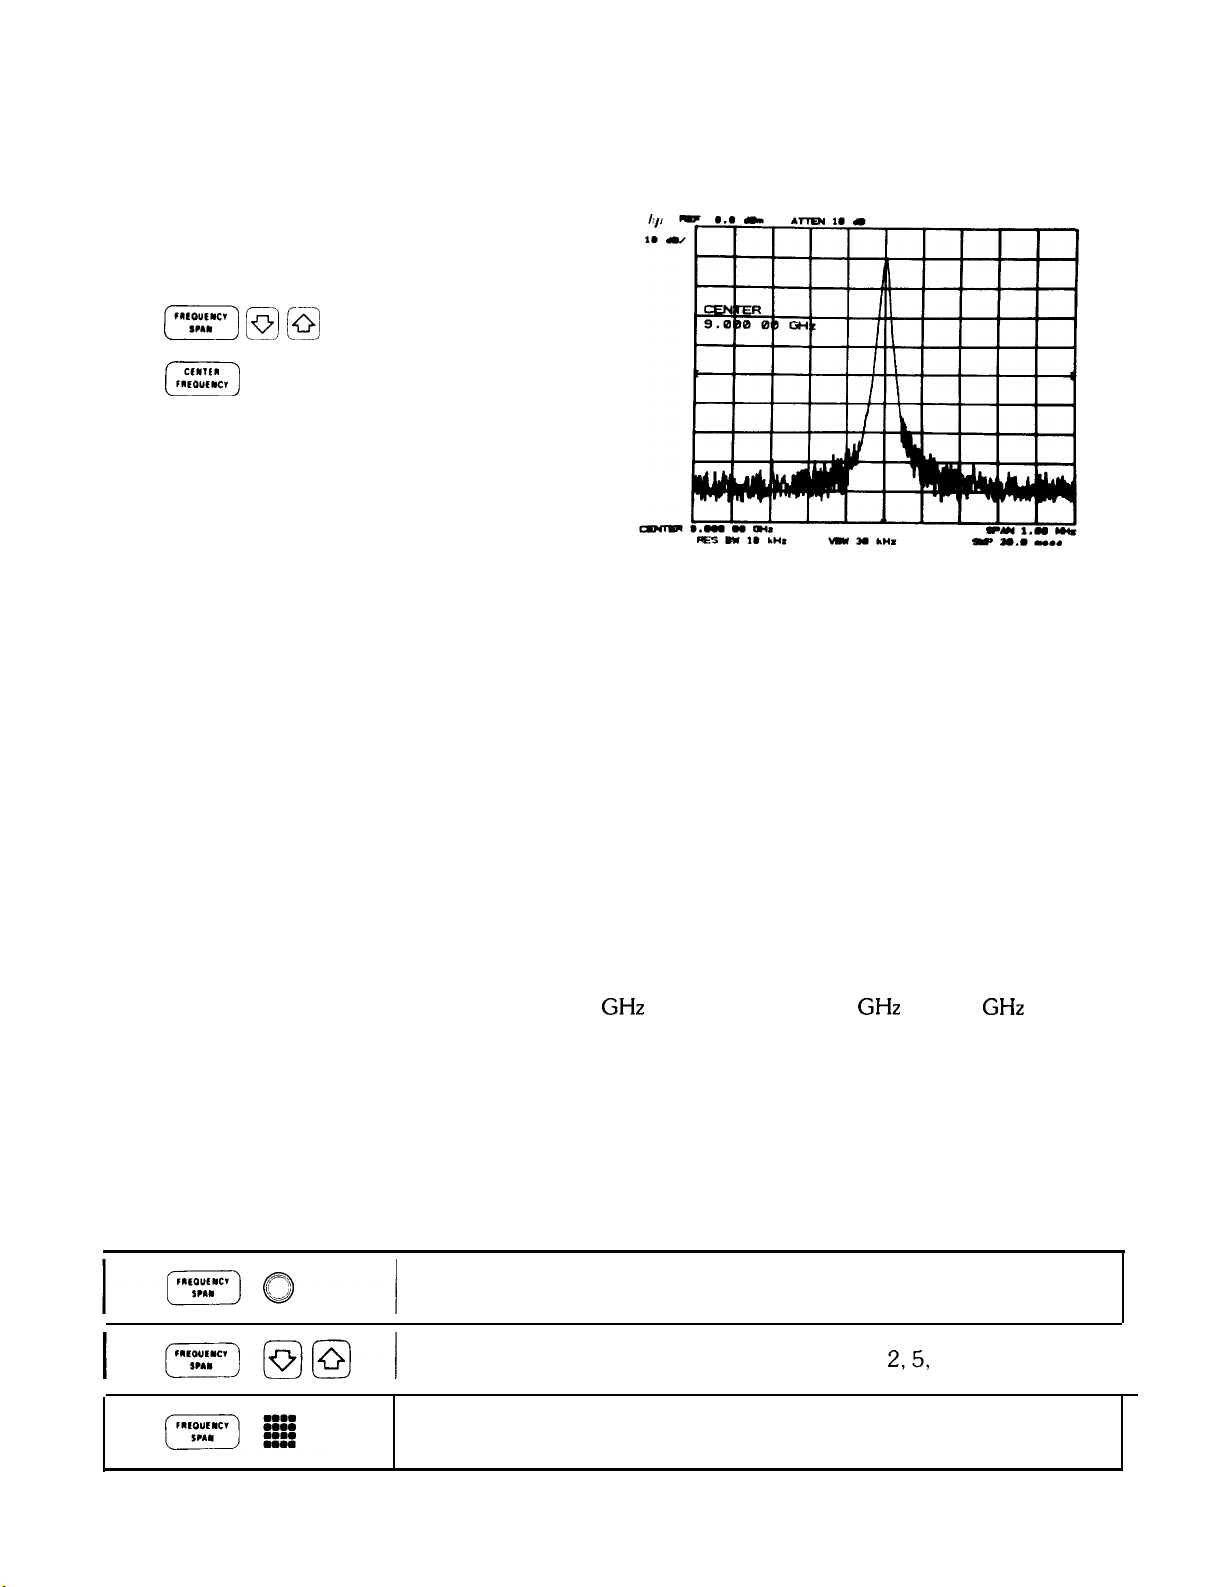
FUNCTION
Reducing the frequency span will increase the center
frequency readout resolution.
Press
then
[Fj
(x]
@
@
FREQUENCY SPAN
FREQUENCY SPAN
The frequency span changes the total display frequency range symmetrically about the center frequency. Note that
the frequency span readout refers to the total display frequency range; to determine frequency span per division,
divide by 10.
As the frequency span is changed, resolution bandwidth and video bandwidth automatically change to provide a
predetermined level of resolution and noise averaging, respectively. Sweep time also changes automatically to
maintain a calibrated display.
The analyzer can be adjusted to span a maximum of 2.5 GHz in the low band and 22 GHz (2 to 24
the microwave band. A minimum span of 100 Hz is allowed in both bands as well as 0 Hz (zero span) which
enables the analyzer to function as a fixed-tune receiver. In zero span, the analyzer can display modulation
waveforms in the time domain.
DATA Entry with FREQUENCY SPAN
Changes the frequency span continuously.
GHz
range) in
Changes the frequency span to the next value in a 1,
2,5,
10 sequence.
Enters an exact value up to three digits, depending on span. Additional
digits will be deleted without rounding.
Manual Operation 21
I
Page 24
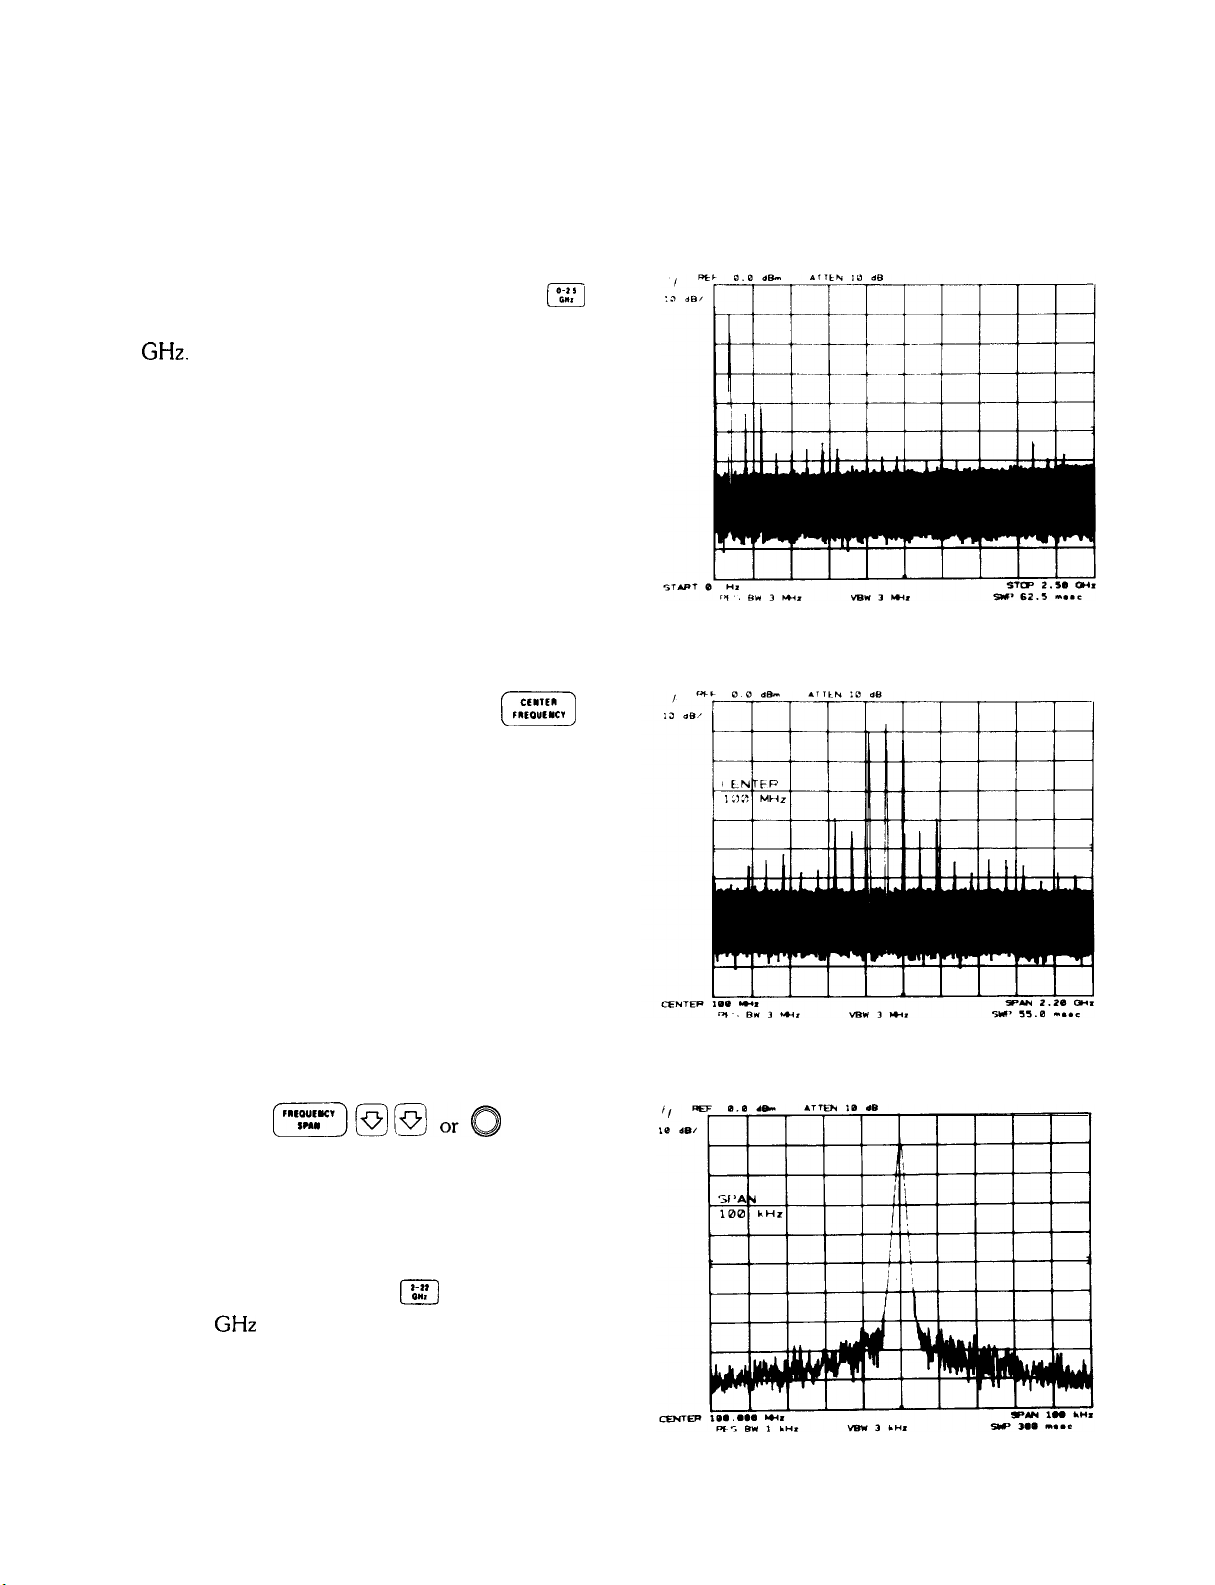
FREQUENCY SPAN FUNCTION
Example
Use FREQUENCY SPAN to zoom in on signals.
Connect CAL OUTPUT
This selects a convenient
2.5
GHz.
to RF INPUT press
full span display from 0 to
Tune center frequency to 100 MHz with:
100 MHz.
[06::1
[?%%-I
Reduce span with:
[F]@@or~
The desired span can also be selected with the
numeric keyboard. Note that narrow frequency spans
provide increased center frequency resolution.
In the microwave band, pressing
enables a 20
22 Manual Operation
GHz
full span.
m
Page 25
FUNCTION
FREQUENCY SPAN
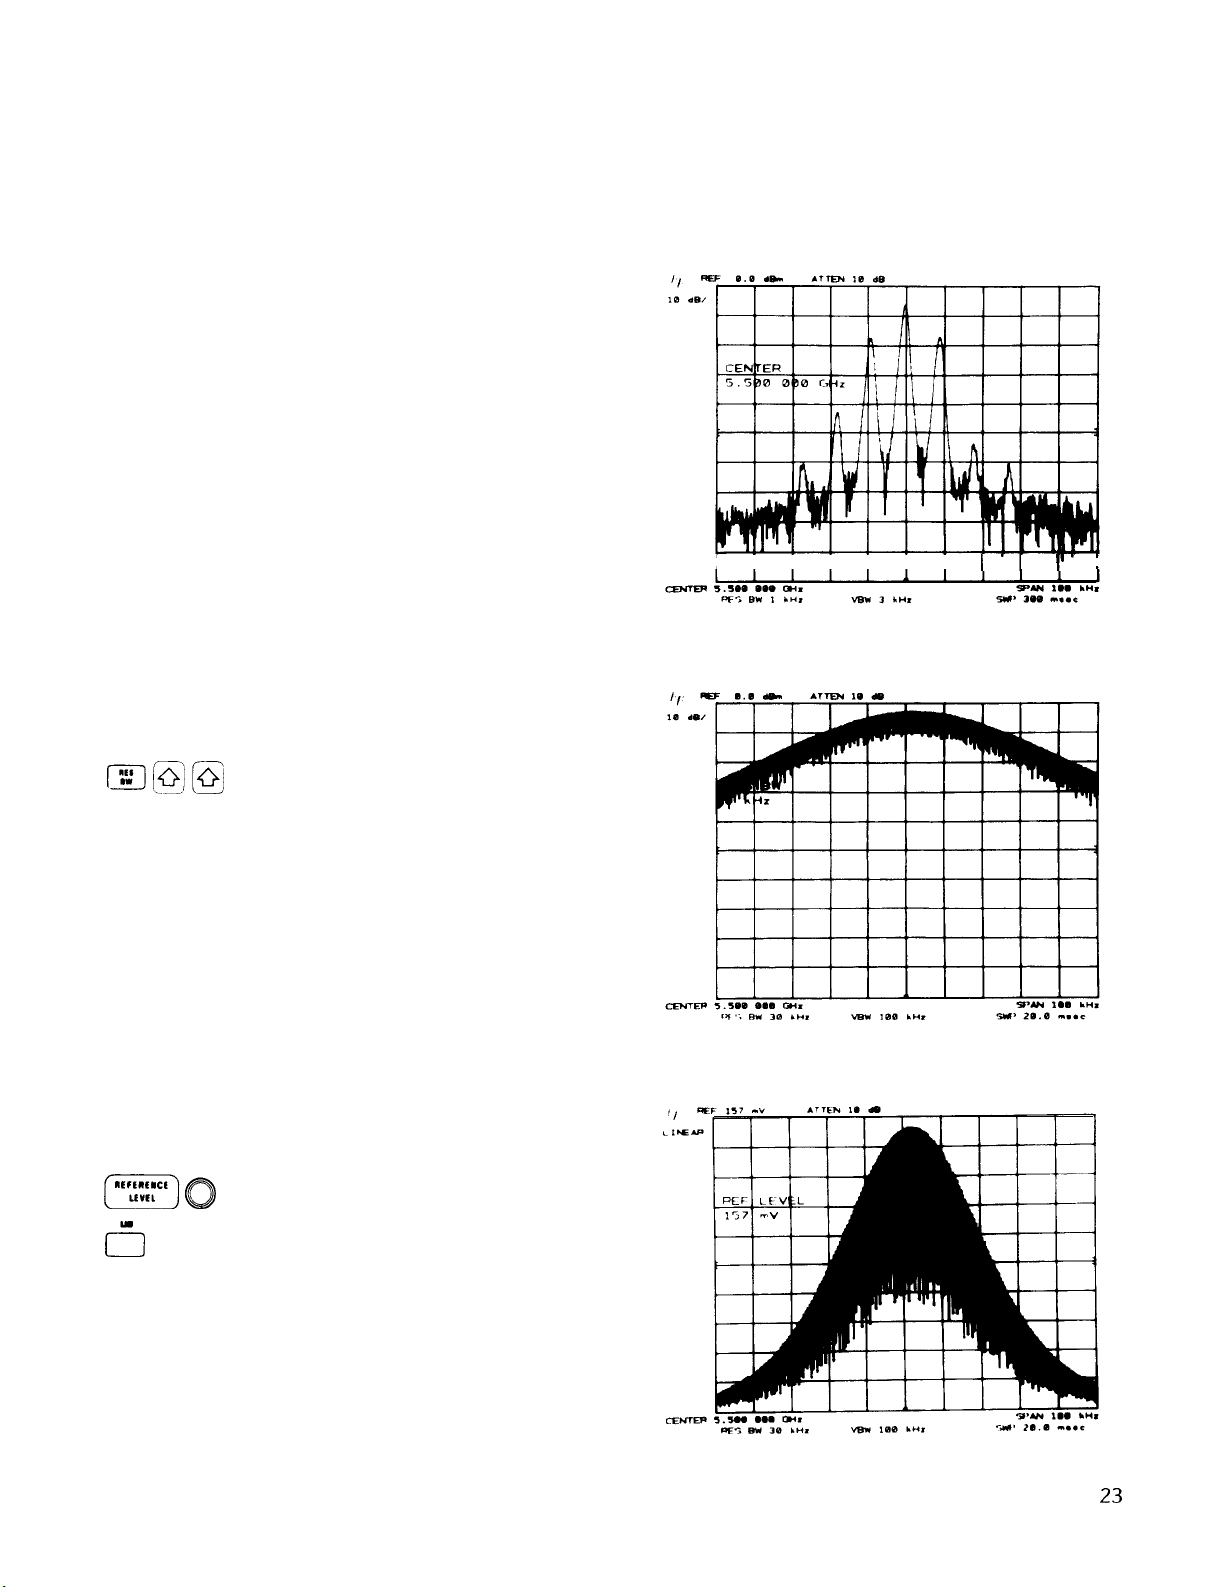
Example
Operating the spectrum analyzer in zero span. The modulation waveform of an AM signal can be displayed in the
time domain.
In the frequency domain, we can accurately determine the modulation frequency and level.
I
I
I
I I I I
I.1
I” I
To demodulate the AM, increase the resolution band-
width to include both sidebands with the IF passband.
L-E-@@
Position the signal at the reference level and select a
linear voltage display
(G&ii)gFJ
fi
SCALE.
Manual Operation
23
Page 26

START/STOP FREQUENCY FUNCTION
I/h
iii
To select zero span, press
Video trigger can be used to trigger on the waveform.
The sweep time control can be adjusted to change the
horizontal scale.
[F)
m
a
START/STOP FREQUENCY
Another way to adjust the frequency range is by using START/STOP FREQUENCY instead of CENTER FREQUENCY and FREQUENCY SPAN. Activating START FREQ or STOP FREQ causes both to read out in place of
CENTER FREQUENCY and SPAN on the CRT START FREQ sets the left graticule frequency and STOP FREQ
sets the right graticule frequency; both are mutually exclusive with CENTER FREQUENCY and FREQUENCY
SPAN.
The INSTRUMENT STATE keys, w and m , select a start/stop frequency from 0 to 2.5 GHz and 2 to 22
GHz,
respectively. Additional over-range allows start frequency setting of - 1
The maximum start/stop frequency span allowable is 22
(START FREQ = STOP FREQ) .
GHz;
the minimum span is 100 Hz and zero span
GHz
and stop frequency of 24
GHz.
Start/Stop frequency readout resolution is 1% of the span (span = stop frequency - start frequency). Both start
or stop frequencies can be entered with 1 Hz resolution.
DATA Entry with START/STOP Frequency
Changes the start or stop frequency. The amount of change per turn is a
constant percentage of the frequency span.
or
Changes the frequency by one tenth of the total frequency span.
Exact start or stop frequencies can be entered. The number of digits read out
depends upon the frequency span.
24 Manual Operation
Page 27
FUNCTION
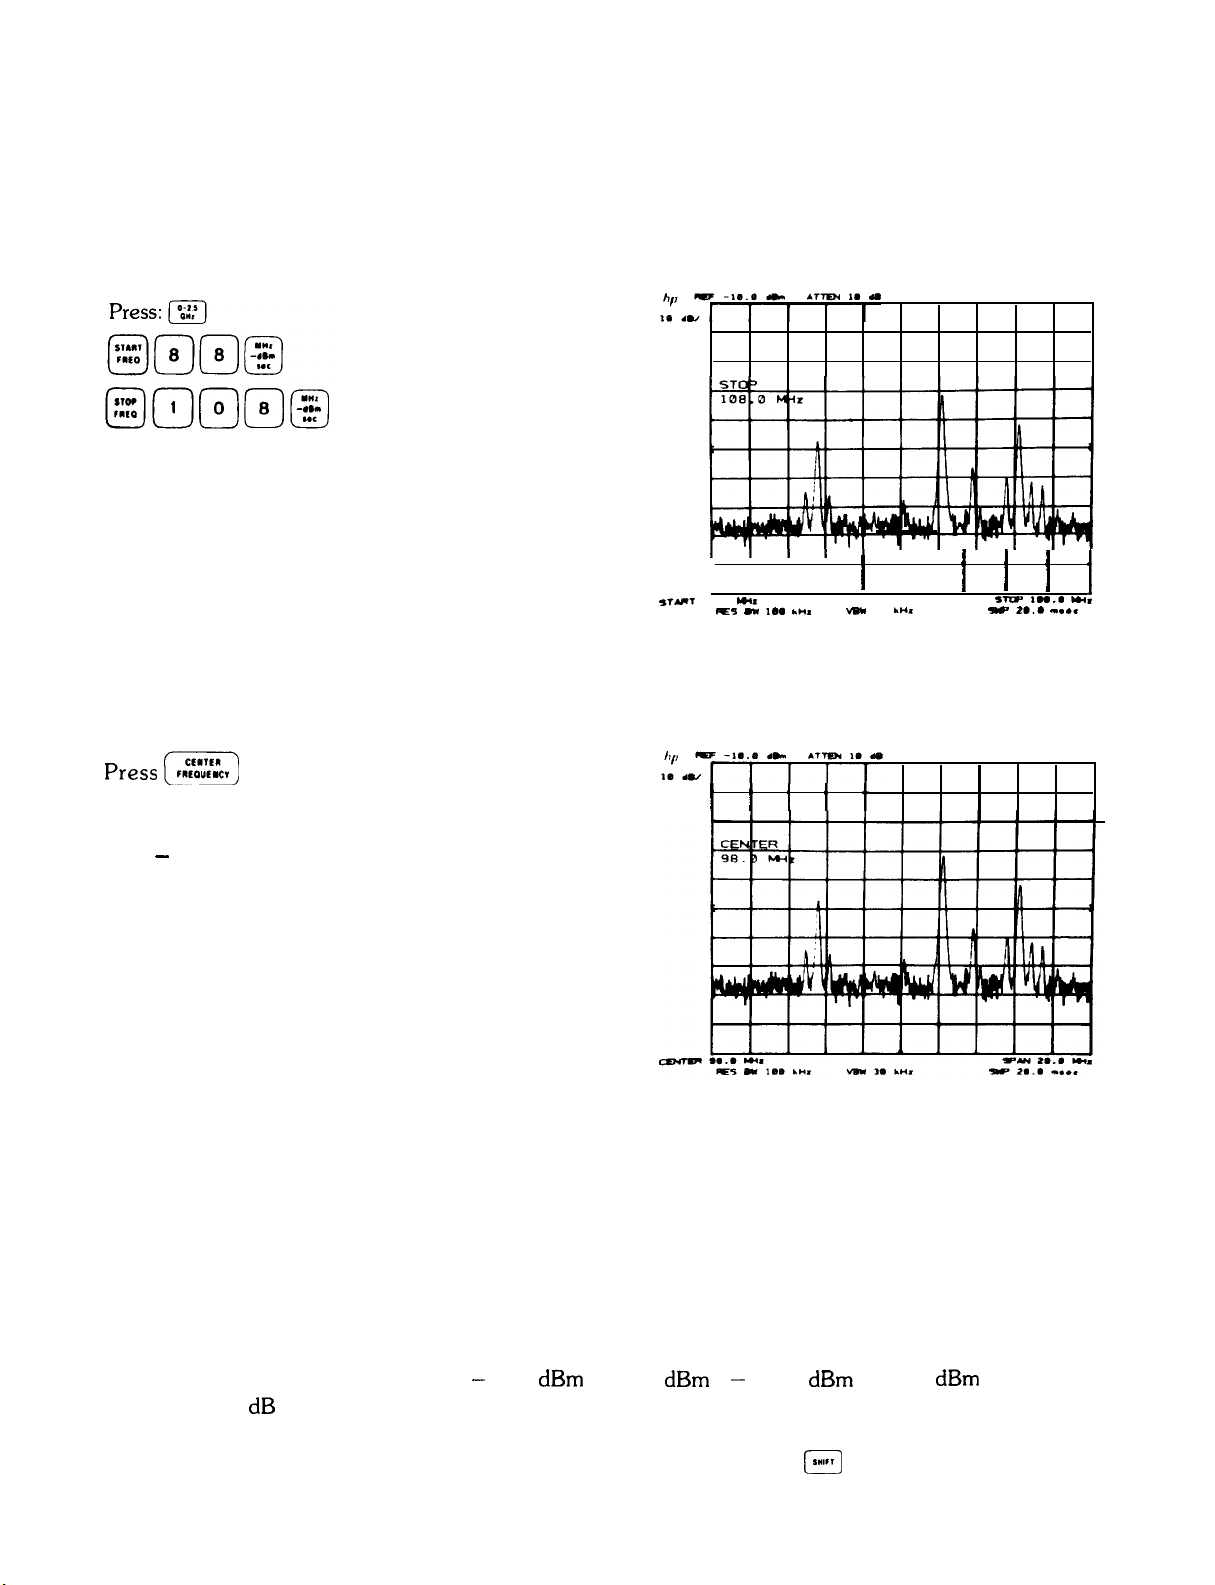
Example
Set start/stop frequency to monitor FM broadcast band
REFERENCE LEVEL
Press (?iiEiJ
unchanged, although the START/STOP frequency
readouts are replaced by center frequency and span
(108 - 88 = 20 MHz).
.
Note that horizontal scaling is
t i iii ii i i i
,fYT
. . . .
YI.
IF5 mu
Ia. *“a
I i i i t
vs*
3.
L”.
mu=
I”.. WI,
- 2... “...
I
REFERENCE LEVEL
The REFERENCE LEVEL function changes the absolute amplitude level of the top graticule line. The vertical
scale (amplitude units per division) is selected from the SCALE control group. To measure signal level, the peak of
the signal’s response is positioned on the top graticule line and its amplitude is read out from REF LEVEL.
The reference level can be adjusted from - 89.9 dBm to + 30 dBm ( - 139.9 dBm to + 60 dBm with extended
range) with 0.1 dB resolution. The input attenuator is automatically coupled with the reference level to prevent
gain compression; signals which are above the gain compression point will be displayed above the reference level
line. Different mixer input levels as well as amplitude units can be selected (see
(L*lrl
FUNCTIONS Chapter 11).
Manual Operation 25
Page 28

REFERENCE LEVEL
DATA Entry with REFERENCE LEVEL
In logarithmic scale, the changes are in 0.1 dB steps: in linear scale, the
changes are made to the least significant digit.
FUNCTION
pi?-)
pJ@
In logarithmic scale, changes the reference level in steps according to
division scale. In linear scale, changes the reference level in 1 dB steps.
Allows entry of exact reference levels. Digits entered beyond the displayed
number of digits are deleted.
Example
Measure amplitude of calibration signal.
Press
@
(-E]
100 MHz
dB/
[ “%?)
To measure signal amplitude, press
and
position signal peak to top graticule line. Read amplitude from REF LEVEL.
26 Manual Operation
; ,
i
i
i
\
Page 29
FUNCTION
FUNCTION/DATA SUMMARY
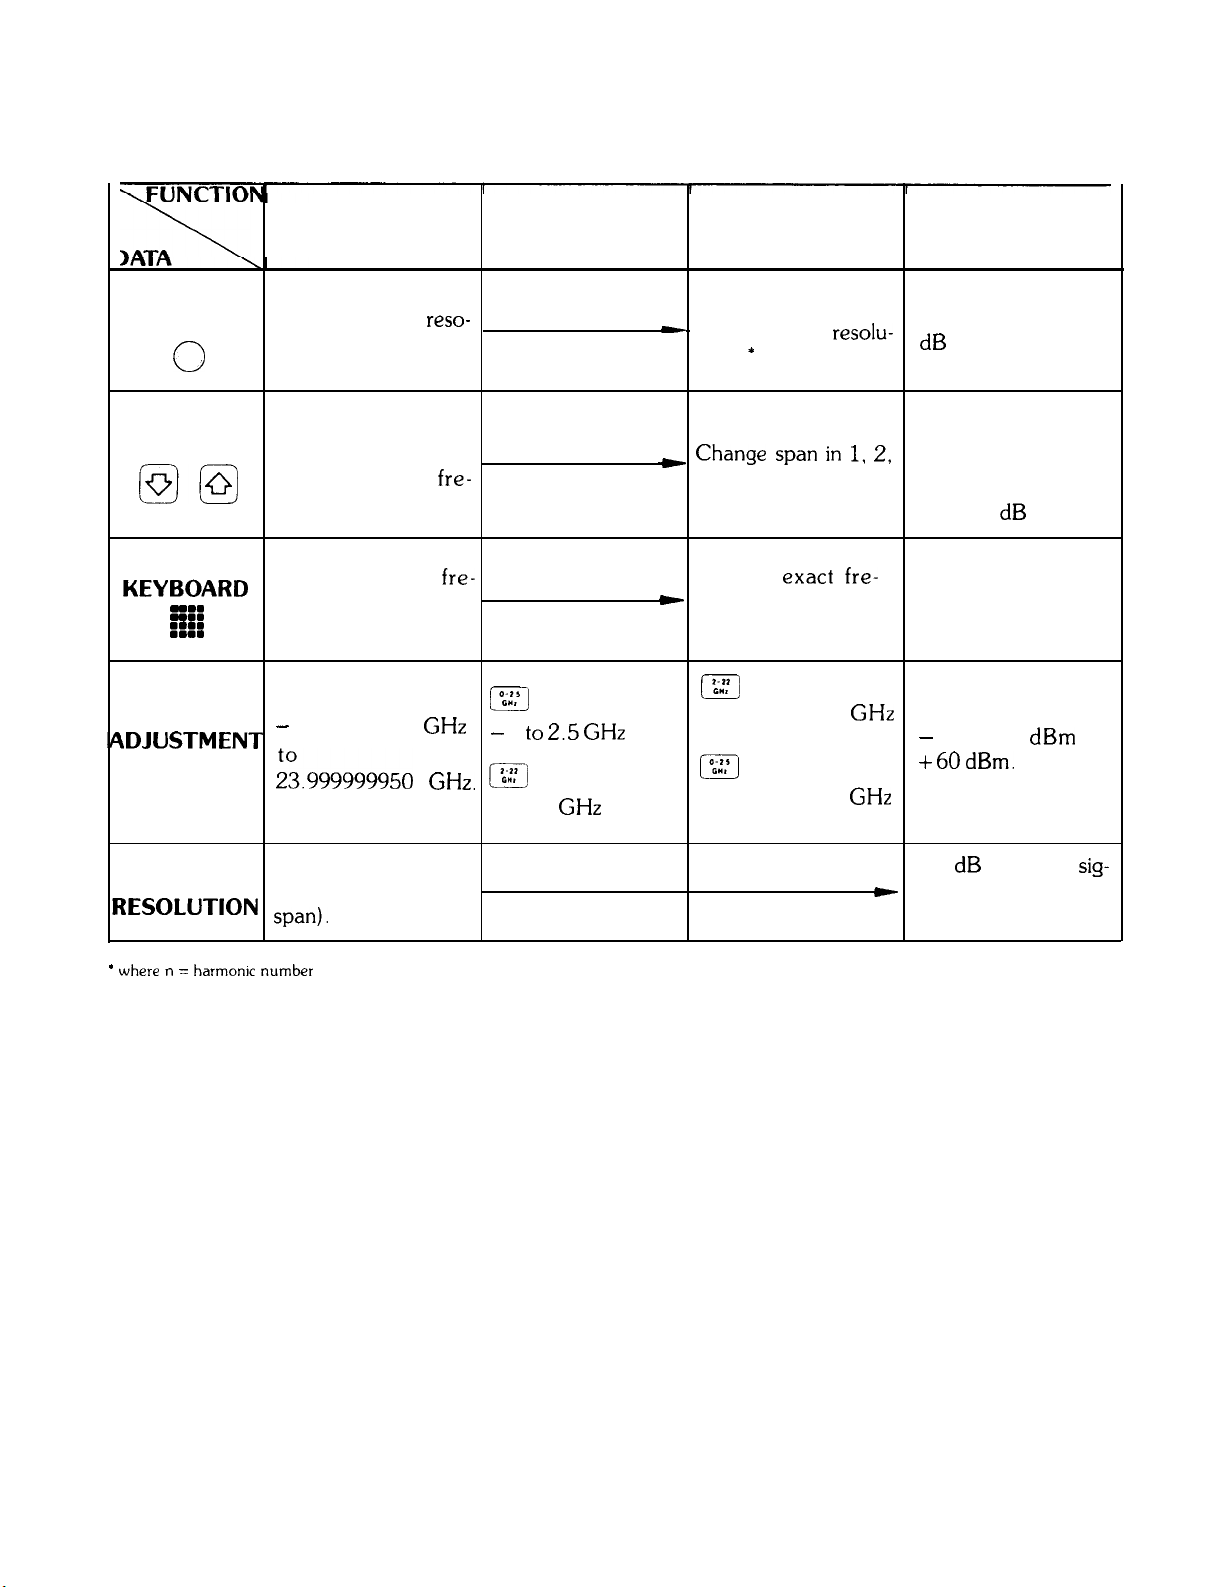
FUNCTION/DATA SUMMARY
CENTER
FREQUENCY
KNOB
Change continuously
with up to 1 Hz
reso-
lution in narrow
0
STEP KEYS
spans.
Change frequency in
one division steps
(i.e., 10% of fre- 5, 10 sequence.
@I@
NUMERIC
KEYBOARD Enter exact fre-
: t::
1:::
rDJUSTMENT
RANGE
quency span).
quency with up to 1
Hz resolution.
-
1.000000000
:03.999999950
GHz
GHz. a
FREQUENCY
SPAN
m
_
1 to
2.5 GHz
2 to 24
GHz
START/STOP
FREQUENCY
Change continuously
a
with n x 2 Hz resolu-
tion
*
- Change span in ” 2’
Enter
*
quency with n x 2 Hz
exact
fre- level. Digits entered
resolution *
m
100 Hz to 22 GHz
and zero span.
106::
100 Hz to 2.5 GHz
and zero span.
REFERENCE
LEVEL
Continuous with 0.1
dB tuning resolution.
Incremental change
in accordance with
log scale. In linear,
changes incrementally in 1 dB steps.
Enter exact reference
beyond last displayed
digit are deleted.
-
139.9
dBm
to
+60dBm.
READOUT
tESOLUTlON span),
* where n = harmomc number
1% of SPAN (Up to
1 Hz in narrow
0.1 dB in log; 4
c
nificant digits in lin-
ear.
sig-
Manual Operation 27
Page 30
CRT DISPLAY
CHAPTER 4
CRT DISPLAY
GENERAL DESCRIPTION
This chapter describes the CRT display adjustments, readouts, and graphics.
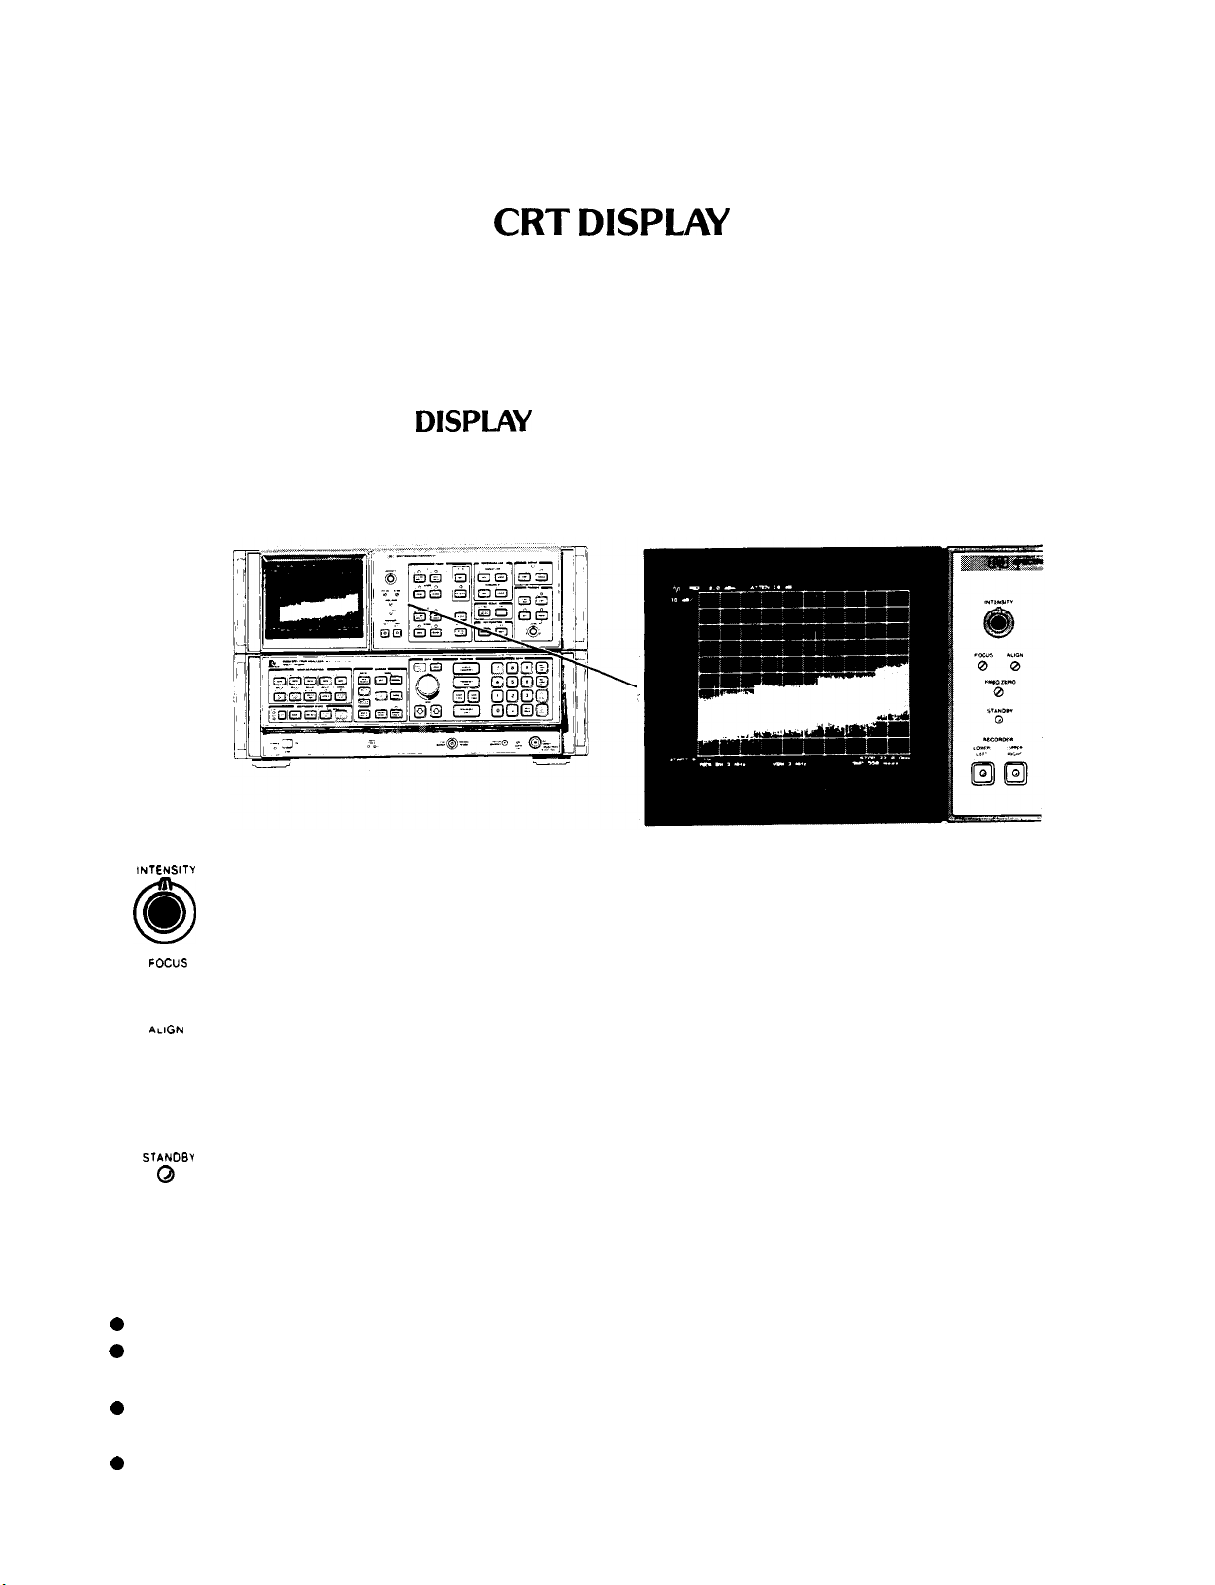
ADJUSTMENT OF THE DISPLAY
ADJUSTMENT OF THE
The adjustments for intensity, focus, and alignment simultaneously affect all the lines and characters on the display.
CRT Display and Adjustments
DISPLKY
lNTENSlTY
Controls intensity for all the CRT writing.
A screwdriver adjustment which focuses all the CRT writing. Focusing any one element on the CRT
focuses all the writing.
0
0
FOCUS
0
nLlGN
0
A screwdriver adjustment which tilts all the displayed CRT information.
DISPLAY SECTION LINE POWER
STANDBY
0
The light indicates power condition of the Spectrum Analyzer Display section as dictated by the LINE
power switch on the 85660B RF section.
CRT DISPLAY OVERVIEW
The cathode ray tube of the Spectrum Analyzer Display section displays:
active function name and value
0
0
graticule
l
traces of the signal response
values that calibrate the frequency, time, and amplitude axes
0
l
values for the spectrum analyzer receiver parameters -that is, COUPLED FUNCTIONS.
operator originated labels and graphics
0
Manual Operation 29
Page 31

CRT DISPLAY OVERVIEW
Active Function
The function which has been activated for DATA entry is read out in the graticule area shown.
OFF 8 0 d&l .TTEN 18 dtl
I
!O do,
CRT DISPLAY
START
*.a c+I*
PFCI
BY 3
*Hz
Activating a function immediately writes its name in the active function area along with its present value. The
following summarizes the names and readout formats for the front panel designated active functions after an
INSTRUMENT PRESET
Function
FuNcT’oNc)
(,,,::c’)
COUPLED FUNCTION
I::‘1
pg)
Examples of Active
Function Readout
SPAN
20 GHz
START
2
GHz
STOP
22 GHz
REF LEVEL
.O
dBm
RES BW
3 MHz
VIDEO BW
3 MHz
SWEEPTIME
500 msec
vB*
3
WI
r-
5TB Z2.B M,
5111’ 5RB “...<
Function
I--)
(,,,.
(,.J(I*I(1lM
REFERENCE LINE
(,.,,,
Examples of Active
Function Readout
MARKER
-
MARKER
12.0 GHz
19.8 dBm
MARKER A
20.0 MHz
-
12.4 dB
MARKER ZOOM
12.0 GHz
-
32.8 dBm
MARKER
12.0 GHz
140.4 dBm (1 Hz)
DISPLAY LINE
-
45.0 dBm
THRESHOLD
-
90.0 dBm
eactivates the active function and
bk$!s the
30 Manual Operation
active readout.
RF ATTEN
10
dB
CF STEP
100 MHz
SCALE
El
KEY FUNCTION
(See
[,,,I
KEY FUNCTIONS,
Chapter 11.)
LOG
10
dB/
Page 32

CRT DISPLAY
CRT DISPLAY OVERVIEW
Gralicule
The display graticule is an internally generated 10 division by 10 division rectangle for referencing frequency, time,
and amplitude measurements. Double markings at the left, right, and bottom designate the center axes.
The graticuleThe graticule
aspect ratioaspect ratio
ylx
= 1:1.3
ylx
= 1:1.3
Center line
Center line
The graticule may be blanked from the display with KEY FUNCTION
-b
-b
4
4
Center lineCenter line
[
[unl
m and restored with
n.
For CRT photography, the graticule may be intensified independent of the annotation and trace by pressing the
following sequence:
For more intensity, repeat the last two number entries, 1163 Hz and 2115 Hz. I’;:1 returns the graticule.to
normal.
Traces
Three separate traces, A, B, and C, can be written onto the display. Each trace consists of 1000 separate
straight-
line elements drawn between 1001 fixed points across the CRT X and Y axis coordinates designate the particular
points between which the elements are drawn. Terms used to describe trace composition are defined as follows:
Point
A “point” in the context of this manual is a fixed location on the CRT display. There are
1,001 points along the X (horizontal) axis of the CRT graticule, numbered from 0 on the far left
graticule line to 1000 on the far right graticule line. Similarly, there are 1,001 points along the Y
(vertical) axis of the CRT graticule, numbered from 0 on the bottom graticule line to 1000 on the top
graticule line. An additional 22 points of overrange available above the top graticule line provide the
Y axis with a total of 1,023 points.
Manual Operation
3 1
Page 33

CRT DISPLAY OVERVIEW
CRT DISPLAY
Display Unit
One display unit is the distance between two points (see above) along an X or Y
axis. The distance along the X axis between the far left graticule line and the far right graticule line is
1000 display units. The Y axis length between the bottom graticule line and the top graticule line is
also 1000 display units. Although the Y axis can be extended another 22 display units above the top
graticule line, the extended area is not calibrated.
X, Y coordinates to a particular point on the display are given in display units relative to X, Y
coordinates
Element
0,O
at the junction of the far left and bottom graticule lines.
An element is a distinct portion of the trace drawn on the CRT It comprises a point and
the visible straight line drawn to it from the preceding point. An element drawn parallel with a vertical
or horizontal graticule line is one diplay unit long. An element drawn at an angle to the graticule lines
is longer, its actual length depending on the angle.
Vector
A vector is identical with an
Point of
x, y coordinates
Overrange = 22 point
element,
A
I
.r
x
m
a.
except that it can be either visible or blanked.
Point of
x, y coordinates
su
t
-cr
R_
1000.1000
Manual Operation
32
Point of
x, y coordinates
0.0
f
TRACE DISPLAY TERMS
Graticule center
x, y coordinates
500,500
Point of
x, y coordinates
1000,0
NOTE
When the analyzer is operated manually (i.e., with its front-panel controls), the display
size remains constant and the above definitions are fully applicable. When it is operated
remotely with a controller, however, three additional larger display sizes are available
through the display-size programming commands. For these larger-than-normal display sizes the lower left reference coordinates and the upper right trace limit expand
beyond the CRT’s outer graticule lines. For further information on remotely-controlled
(i.e., programmed) display sizes, refer to commands
Dl,
D2, and D3 under Program-
ming Commands in Section II of this manual.
Page 34

CRT DISPLAY CRT DISPLAY OVERVIEW
Locations of Permanent Readouts
The vertical and horizontal graticule axes are scaled by these readouts:
(iF
-5.4
k
1s 4”
;4
Vertical
scale
Center frequency
(or
start freq.)
\
CeNrm 4aa.e -
no3 I
1,.
h”l
vml 30 LHX
PIN
I...
PQ 3e I)..=
Frequency span
(or stop freq.)
/
beI*
The COUPLED FUNCTIONS that describe the swept receiver characteristics of the spectrum analyzer are:
ATTEN ,a
RF attenuation
I
I,,
*
,
RerolLtion
bandwidth
V&e0
bandwidth
To blank all the character readouts, press KEY FUNCTION
Full\scale
svnep
time
(
o. To restore, press m p.
Manual Operation 33
Page 35

CRT DISPLAY OVERVIEW
Other Readouts
CRT DISPLAY
Title (see
Detection
Mode\,‘,’ deI
Amplitudeoffset
s”l”
KEY
(see
FUNCTION)
Display line
Threshold
\-=’
.-2L; ~
level
KEY
FUNCTION)
\
AEc....b<...,23.
REF .?3.8 dam
SAMYE
de
*a-
(see
Frequency offset
5~:;
KEY FUNCTION)
-
Marker amplitude and
frequency
(s_ee
MARKER)
Amplitude and/or
frequency
uncalibrated
A number of other special function readouts can be activated. These are covered in Chapter 11.
scales
34 Manual Operation
Page 36

TRACE
TRACE IDENTIFICATION
CHAPTER 5
TRACE
GENERAL DESCRIPTION
This chapter describes the use of the TRACE functions for writing, storing, and manipulating trace data.
G--
‘P
TRACE Controls
TRACE
‘Trace
B
Trace A
Trace C
TRACE IDENTIFICATION
Traces are differentiated by intensity. Trace A is bright, trace B and trace C are dim. i and m allow positive
identification.
Manual Operation 35
Page 37

TRACE MODES TRACE
TRACE MODES
Four mutually exclusive functions or modes for trace A and trace B determine the manner in which the traces are
displayed. Indicator lights by the keys show the current modes.
WRITE Modes (sweeping):
m
m
Displays the input signal response in trace selected.
Displays and holds th
e maximum responses of the input signal in trace selected.
STORE Modes (not sweeping):
[.,,.
[,,,.,
Stores the current trace and displays it on the CRT display.
Stores the current trace and blanks it from the CRT display.
Trace Memory
An understanding of the TRACE modes requires a description of the trace memory and trace data transfer within
the analyzer.
Display traces are not written onto the CRT directly from the spectrum analyzer’s IF section. Instead, the analog
signal response is converted to digital information and stored in one trace memory which can then be transferred
to
the CRT display. The way in which the information is displayed depends upon the TRACE mode selected.
RF
Input
Memories
Analyzer
Video
Response
b
RF/IF
Sections
/
Data Updated at
Analog
to
Digital
Sweeptime
Rate
TRACE MODES DETERMINE HOW DATA IS ENTERED INTO
AND DISPLAYED FROM TRACE MEMORIES
’
I
Data Displayed at
Refresh
Rate
I
I
I
I
The analyzer’s response is transferred into the trace memory at the sweep rate of the analyzer; that is, its sweep
time. The trace memory is written onto the CRT display at a refresh rate of about 50 Hz, rapid enough to prevent
flickering of the trace on the CRT Trace intensities remain constant as analyzer sweep times are changed.
36 Manual Operation
Page 38

TRACE
NOTE
TRACE MODES
It is important to understand the difference between sweep and refresh.
Sweep
refers to the spectrum analyzer sweeping from a start frequency to a
stop frequency and storing measured amplitude data into a trace
memory.
Refresh
refers to the transfer of display memory data to the CRT display.
WRITE Modes
For the write modes, the analyzer signal response is written into trace memory during the sweep and the memory
contents are displayed on the CRT
m
A(B)
Sets all the values in the trace memory A(B) to zero when first activated (bottom line graticule) , then
displays the signal response.
a
A(B)
Latest signal response is written into the trace A(B) memory only at the horizontal positions where
the response is greater than the stored response.
When both m A and m B modes are selected, the analyzer writes into (sweeps) A and B
alternately.
STORE Modes
In the STORE modes, no updating of the trace memory is made. The current memory data is saved.
(,,,,
A(B)
(,,1.. A(B)
The trace A(B) data are displayed on the CRT (that is, the refresh is enabled).
The trace A(B) data are not displayed on the CRT (that is, the refresh is disabled).
Example
With TRACE modes, signals can be observed as the analyzer sweeps, can be stored for comparison, erased, or
monitored for frequency drift.
Center and zoom in on a 20 MHz signal:
Press
Since
(Eiq
[F-
[‘s::l
p-J (-i-J @
@
has set m A and
(g
pJ
(,,,.,1
B, only A is
displayed.
Manual Operation
37
Page 39

TRACE
This response can be stored:
Press
(,,,.
A.
TRACE MODES
Write the same signal with B and change its position
relative to trace A:
Press m B.
[iii%-> a
Blank trace A;
Press @ A.
This trace can be recalled with m A as long as
m
A or
[21
A is not used first.
*
1
L
A
II\
t
i
i i
j iii
i
IIIIiI
l
/\
: \
: !
‘I-, i i
; /
I
NOTE
The l on the top right corner of the CRT indicates that the CRT readouts may not correspond to the trace(s). In this case, the readouts
apply only to TRACE B and not TRACE A.
38 Manual Operation
Page 40

TRACE
TRACE EXCHANGE
To display the drift of a signal, press a
(Simulate frequency drift with
(ZEC)
0.1
&
hp
1e .”
liF .e &
ATlD4 10 Y
PI L !
Trace B sweeping Trace A
/
i
TRACE EXCHANGE
m
exchanges trace A and B, changing their relative intensities and storage memory locations and enables A
and B
[,..
. For example, in the trace display above, the modes and display appear.
4
1.
.
Trace
B
Clear Write
Trace A
Max Hold
Press
@
Manual Operation
39
Page 41

TRACE C MODES
TRACE
TRACE C MODES
A third trace, C, can be used to store a signal response. Trace C is not swept from the analyzer IF section as are
+
traces A and B, but is input using a trace B into C function (B
Access to the trace C modes is through KEY FUNCTION @ The modes are:
C) or a B and C exchange function (B z C).
View C:
Blank C:
B-C:
mj
(,,.,
(,,,,,
Displays trace C.
k
Blanks trace C from CRT display.
1
Writes trace B into trace C. Trace A and B modes are not changed. If trace C is not
displayed, it remains undisplayed.
B*C:
m
i
Exchanges traces B and C. If trace B is displayed before the exchange, trace C is
now displayed. If trace B is not displayed before the exchange, trace C is not displayed.
TRACE ARITHMETIC
TRACE arithmetic allows one trace to be modified by another trace or a display line position.
A-B
A-B
B
[
m
Example
Trace arithmetic with the display line can be used to correct for the frequency response characteristics (flatness) of a
measurement
swept
Trace B amplitude (measured in divisions from the bottom graticule) is subtracted from
trace A and the result written into trace A from sweep to sweep. Trace B is placed or
kept in a STORE mode.
Turns
[.-,-,I
off.
Subtracts the amplitude of the display line from trace B and writes the result into trace
B. Trace B is placed or kept in B Details on display line are in Chapter 7, REFERENCE LINE.
system typified by this setup:
where the device under test is to be characterized for insertion loss over a specific frequency range.
The analyzer and source are set to the proper amplitude level and frequency span with the source output
connected directly to the analyzer input.
m
(,,.
sweep source then
B,
B.
t:
l
40 Manual Operation
i i i
I
Page 42

TRACE
The display line is activated and set below the source/
analyzer response.
DL[tlgll a.
The difference between the display line (in display
units) and the source/analyzer response is stored in
trace B with I’;:’
TRACE ARITHMETIC
Negative values of the
[‘;:II
line are stored even
though not displayed.
Now the device under test is connected between
source and analyzer and its response is corrected for
source flatness uncertainty by using
BA@.
1”“““’
sr- ..Y -
rnmllwo
w-s-
-
7.Y n
- 2e.. -me.
Manual Operation 41
1
Page 43

TRACE PRIORITY
TRACE
TRACE PRIORITY
Functions which act upon a trace always act upon the highest priority trace. Priority is defined by the trace modes
as follows:
Highest priority
EB
view C
[,,..,]A
a
Lowest priority
Marker functions, for example, use trace priority to decide which trace to mark. See Chapter 6.
[.,,.,)B
blank C
42 Manual Operation
Page 44

MARKER
GENERAL DESCRIPTION
Chapter 6
MARKER
GENERAL DESCRIPTION
This chapter describes the use of the MARKER and DATA controls for making many measurements faster and
with greater accuracy. Markers can be displayed only on TRACE A and TRACE B.
Two types of functions make up the MARKER group; MARKER MODES, which enable or disable markers and
their related functions; and MARKER ENTRY functions, which allow the scaling of the display frequency and
amplitude using marker information.
Markers are bright spots which lie directly on the display trace. The horizontal position of an activated marker is
controlled by the DATA controls. The marker can be positioned at a specific frequency with the DATA number/
units keyboard.
Readout of marker amplitude and frequency appears in the upper right of the display outside the
graticule.
When
a MARKER MODE is active, its amplitude and frequency readout also appears in the active function area of the
MARKER CONTROLS
Manual Operation
43
Page 45

MARKER OVERVIEW
MARKER
MARKER OVERVIEW
FUNCTION
l Direct readout of the amplitude and frequency of a point along the trace.
l Direct readout of amplitude and frequency differences between points on the trace.
l
Expansion of a span about a specific frequency.
l Placing a single marker at the highest response.
l
Automatic peaking of preselector.
l
Direct noise level readout.
l
Analysis of stored traces.
l Amplitude and frequency display scaling.
MARKER with
EEI
ZOOM
E
@
El
(,,,lM
ENTRY
[,,,.
I”c”l-1
p!&jm
MARKER ON BUT NOT ACTIVE
An activated marker mode can be deactivated by activating another function, such as display line, or by DATA
I*OLD)
. This does not erase the marker itself nor the upper right display readout.
DATA control and active function readout will continue from its last position.
If the marker mode is reactivated,
If a marker mode is deactivated by a function (other than MARKER ENTRY) where a value change of the new
function results in a
resealing
of the amplitude or frequency axes, the marker will not stay on the trace. Reactivating
the marker will start it at the display center.
MARKER OFF
[
disables any marker mode, and blanks the marker readout from the CRT display. DATA controls are
disabled if the marker was active.
MARKER IN VIEW
MARKER m and a may be used on traces A or B in the view mode. This allows detailed analysis of
responses which are nonperiodic or unstable.
The markers will be placed on a viewed trace according to the priority defined in Chapter 5, TRACE PRIORITY
SINGLE MARKER - NORMAL
@
activates a single marker at the center of the display on the trace of highest priority. Trace priority is defined in
Chapter 5. The marker will not activate on the TRACE modes
m
A,
[--I
B, view C or blank C.
Measurement and Readout Range
Marker frequency has one digit more resolution than center frequency, and marker amplitude has one digit more
resolution than reference level.
44 Manual Operation
Page 46

MARKER
DATA Entry
SINGLE MARKER-NORMAL
Moves the marker continuously along the trace at about 5 horizontal divisions each full turn. The marker moves in display unit increments.
Moves the marker along the trace one tenth of the total width per step.
moves marker to the right.
Places the marker at the frequency entered. An out-of-range entry results in
placement of the marker at a graticule edge.
Example
Reading frequencies and amplitudes of signals is greatly simplified using MARKER
For a given display, activate the single marker with
B
then tune the marker with 0 to position it at
the signal peak.
The frequency and amplitude is read out in two display areas.
(--I
0
0
.
To read the left-hand signal’s parameters, move the
marker to the signal peak with 0 .
The signal’s amplitude and frequency is read out
directly.
Manual Operation
45
Page 47

DIFFERENTIAL MARKERS-A
MARKER
DIFFERENTIAL MARKERS -
a
activates a second marker at the position of a single marker already on the trace. (If no single marker has
A
been activated, m places two markers at the center of the display.) The first marker’s position is fixed. The
second marker’s position is under DATA control.
The display readout shows the difference in frequency and amplitude.
y(R 309.32 wz
Example
‘f/J
10 d”
-10.0
-2o.*
Measuring the differences between two signals on the
same display.
First ss the marker on one of the signal peaks with
(-IIo.
.h
Activate m , movAthe second marker to the other
signal peak with 0 ,
and read their differences
directly.
-
Fractional Differences
When the reference level is calibrated in voltage, marker m amplitudes are given as a fraction, the voltage ratio
of two levels.
With logarithmic amplitude scale and the reference level in voltage, the fraction is based on the equation:
dB ddlerence
-(
20 )
fraction = 10
Since this equation yields the harmonic distortion due to a single harmonic, its distortion contribution can be read
directly from the display.
46 Manual Operation
Page 48

MARKER
DIFFERENTIAL MARKERS-A
Example
Set up m on the peaks of a fundamental (left) and
its harmonic (right).
With the display referenced and scaled as shown, the
readout
content. Percent is calculated as 100 x
“.0100X”
designates the fractional harmonic
(.OlOO)
= 1 .O%.
With a linear amplitude scale and a reference level
calibrated in voltage, the fractional amplitude readout
is the simple linear ratio of the two markers.
Example
To measure % AM modulation from a spectra1 display, calibrate the display with the reference level in voltage and
the amplitude scale in voltage.
Place the single marker on the carrier peak,
, and the second marker on one of the side-
0
band peaks, m 0 The fractional amplitude
readout gives one half the modulation index .283.
%AM =
100x2x
.28 = 56%.
[--J
L INSR
. ..-.--
Measurement and Readout Range
The m function formats the amplitude readout according to reference level units and scale.
Reference
Level Units Logarithmic
SCALE
SCALE
Linear
dBm
dBmV
Amplitude in
dB
Amplitude in dB
dBpV
I
t
Voltage
Amplitude ratio
dB d,lferencr
-(
20 )
10
AMPLITUDE READOUT FORMAT FOR MARKER
Ratio of marker amplitudes
a
Manual Operation 47
Page 49

DIFFERENTIAL MARKERS-A
MARKER
The frequency readout for all MARKER
of span measured.
The amplitude readout in dB has a resolution of f
depends upon the LOG m value:
DATA Entry
The minimum incremental change for m frequency is 0.1% of the frequency span.
E--JO
m
conditions has up to 4 significant digits, depending upon the portion
.Ol
dB for linear scale. The resolution for logarithmic scale
LOG SCALE
dB PER DIV
One full turn moves the active marker about one tenth of the horizontal
span.
RESOLUTION
EI@@
One step moves the marker one tenth of the horizontal span.
Positive entry places marker higher in frequency than the stationary marker,
negative entry places marker lower in frequency. Larger entries than allowable will place the marker on the adjacent graticule border,
Negative frequencies can be entered using a i m prefix as the minus
sign. For example, to set a m span of 10 MHz with the second marker
positioned to the left of the first, press
MARKER ZOOM
@
activates a single marker on the trace of highest priority (see TRACE
In
Ilo0.J
, the DATA knob and STEP keys change the values of different functions.
Positions Marker
0
PRIORIn
-
Chapter 5).
48 Manual Operation
Changes FREQUENCY SPAN
and sets CENTER FREQUENCY
equal to MARKER frequency
Page 50

MARKER
DIFFERENTIAL MARKERS-A
DATA Control Use for
[,,,.
The marker can be moved along the trace with the DATA knob 0 ,
about the marker with DATA step @ and @ .
Each step also sets center frequency equal to the marker
frequency.
and the frequency span can be changed
Measurement and Readout Range
The measurement and readout range for marker zoom is the same as marker
DATA Entry
Moves the marker continuously along the trace. Rate dependent on speed
of rotation. The marker moves in display unit increments.
Changes the frequency span to the next value in the sequence and sets the
El @J(g)
@a
center frequency equal to the marker frequency.
Places the marker at the frequency entered. An out-of-range entry places
the marker at a graticule border.
Example
(UL)
.
In wide frequency spans, it is often necessary to expand a portion of the frequency span about a specific signal in
order to resolve modulation sidebands or track frequency drift.
Manual Operation 49
Page 51

DIFFERENTIAL MARKERS-A
From a full span, select a signal using the marker with
Eli.
To center the marker and signal and expand the frequency span in one step, press
c)
0
Expanding twice more with @ @ shows that the
marker requires recentering on the signal.
50 Manual Operation
I
!!
i
i
I
Page 52

MARKER
AUTOMATIC ZOOM
Recenter
with
0
Continue using @ (and recentering the marker on
the signal when necessary) until the desired resolution
is achieved.
AUTOMATIC ZOOM
The analyzer can automatically zoom in on a signal specified by a marker. The desired frequency span is input
from the DATA number/units keyboard.
To use the automatic zoom function:
entify the signal to be zoomed in on.
and enter the desired span with the DATA number/units keyboard.
When the units key is pressed, the zooming process will begin.
Example
A single carrier needs to be examined in a 200
function automatically maintains the signal on the center of the CRT you can zoom automatically from a very wide
span to a narrow span to look close-in at the signal.
kHz
span to see the sidebands. Because the SIGNAL TRACK
Manual Operation 51
Page 53

PEAK SEARCH
MARKER
Place a marker on the carrier with B
Press @FJ (,,:,,,I
.
Enter the span.
F’;;ls
m @ B , and auto zoom will be
0
-Aid
1 I 1 A 1 I I
200 kt-42
/I
I I I
i
I
PEAK SEARCH
Peak Search
Peak search places a single marker at the highest trace position of the highest priority trace. The active function is
not changed.
Example
Use PEAR SEARCH to position the marker at the peak
of the signal response.
In a narrow span, the marker may be placed at the
signal peak.
Press m .
52 Manual Operation
Page 54

MARKER
MARKER ENTRY
Note that the marker seeks the maximum trace response, no matter what the cause of the response. A larger
signal, or the local oscillator feedthrough, would have attracted the marker.
MARKER to Next Peak
The marker can also find the next highest peaks by
successively pressing
[,.,,,I
K
@
Marker to Minimum
The minimum trace value can be located by pressing
[
N.
MARKER ENTRY
m
, m and marker m into span. Immediately set the corresponding FUNCTION value equal to the
readout of the active marker or markers:
ENTRY
/
marker frequency into
marker m frequency into i
marker amplitude into
( ~&%%I j
(-1
RESULT
i
(IIIou(Iclj
spa”
or
@/;@
m
immediately records the single or the differential marker frequency in COUPLED FUNCTION
with
[z)
DATA @
@
I”.‘::‘]
for use
Manual Operation 53
Page 55

MARKER ENTRY
A marker entry can be made any time a marker is on the trace. ( @ “r;;? with only one marker displayed takes
0 Hz as the lower frequency.) The active function will not be changed.
Example
MARKER
One of the fastest, most convenient ways to bring a signal to the center of the display is by using
Activate a
nal:
Change the center frequency to the marker frequency.
l”c:-]
will also work if start/stop frequencies are read out.
(,,,I 0
single
marker and tune it to the desired
.
sis-
l”r:-)
Example
One way to tune to a particular portion of a spectrum
being displayed is to use the A + span function.
Activate the single marker and place it at either end of
the desired frequency span with
54 Manual ODeration
I--] 0
.
I
i
i i i
i
i i i
I
i
Page 56

MARKER
Activate the second marker and place it at the other
end of the span with m
0
MARKER ENTRY
Set the start and stop frequencies
right marker frequencies with B
squal
to the left and
a
Marker m is activated.
A + span will work the same with start/stop frequency readout. Note that the markers can be placed at either end
of the span.
Example
Here is a technique for viewing a fundamental and its harmonics (or any evenly spaced portions of the spectrum)
with high resolution.
Narrow the span about the fundamental as necessary
with m , centering the carrier.
Set the center frequency step size with
Now enable center frequency. With each 0 ,
m
L7
suc-
cessive harmonics will be displayed.
Manual Operation 55
Page 57

SIGNAL TRACK -AUTOMATIC FREQUENCY CONTROL
MARKER
70 e.
SECOND
0
0
-am-..
HARMONIC
0
0
a?“-“.
THIRD HARMONIC
+a ” e
FOURTH HARMONIC
0
0
Similar stepping can be accomplished using marker a into step size for intermodulation products or other
evenly spaced signals such as communication channels.
SIGNAL TRACK - AUTOMATIC FREQUENCY CONTROL
The analyzer is capable of automatically maintaining a drifting signal at the center of the display To operate
SIGNAL TRACK:
Press
[--1
, and place the marker on the signal to be tracked with
Press B to initiate the tracking. The light above the key indicates tracking. (Press again to turn off
.)
As the signal drifts, the center frequency will automatically change to bring the signal, and marker to the center of
the display.
MARKER m , any other MARKER mode or the instrument preset turns the tracking function off.
L
Al-lVdl@-
I
I I
I I I I I
The upper sideband of a transmitter is to be monitored
4
I. ad
R
. .
as the carrier frequency is tuned.
Locate the sideband with [--y)
56 Manual Operation
Page 58

MARKER
PRESELECTOR PEAK
The upper carrier sideband is tracked with m then
zoomed in with
[T]
Q m (%1.
As the carrier frequency is changed, the sideband response will tend to remain in the center of the display. The
center frequency and marker frequency reads out the sideband’s frequency.
A combination of
(::GKw:l
and a allows the “real time” signal frequency drift to be read on the display.
PRESELECTOR PEAK
Preselector peak automatically adjusts the preselector tracking to peak the signal at the active marker. When the
marker is tuned to a signal and m is pressed, an internal routine searches for the peak response of the
preselector and adjusts the tracking accordingly. Using preselector peak prior to measuring a signal yields the most
accurate amplitude reading.
Preselector peak operates with the
peak search routine and then peak the response at that marker. A “PEAKING!” message appears on the active
graticule area to indicate operation of the peaking routine. PRESELECTOR PEAK only operates in the 2 - 22
GHz
preselected band.
Example
Peak the signal for accurate amplitude measurement.
Tune marker to signal of interest.
Press @ 0 .
I--]
,
(,,,.
, or m markers. If the marker is OFF pressing m will initiate a
Manual Operation
57
Page 59

NOISE
LEVEL MEASUREMENT
Press m to peak preselector tracking. Measure
amplitude by reading marker.
MARKER
The specific preselector correction factor applied in the example above is stored. A
[15::)
INSTRUMENT PRESET
will not erase the correction factor; however, another PEAKING routine in the same band will store a new
correction factor in that band.
The factory set preselector tracking can be recalled with
by pressing
(,,, / (“:::1
(See Chapter 11.)
[,,,
= @ The preselector can be manually adjusted
How It Works
The internal preselector peaking routine automatically searches and sets the peak response of the YIG filter at the
marker frequency. Each peaking operation only affects the frequency band in which the signal is located (four
possible bands). A correction factor, representing the tracking offset, is stored in memory for that particular band
each time the peaking routine is used. Correction factors (one per band) remain in memory unless a new peaking
routine is initiated that may result in a different number. The last m correction factors are saved along with
control settings in the internal storage registers upon execution of a
I-11
followed by a number from 1 to 6. Thus,
up to six correction factors could be saved for any of the frequency ranges listed in the chart below:
(
BAND 1 FREQUENCY RANGE
1
1
2
3
4
2.0 - 5.8
5.8 - 12.5
12.5 - 18.6
18.6 - 22
GHz
GHz
GHz
GHz
NOISE LEVEL MEASUREMENT
When noise level is activated and the marker is placed in the noise, the rms noise level is read out normalized to a
1 Hz noise power bandwidth.
58 Manual Operation
Page 60

MARKER
NOISE LEVEL MEASUREMENT
Noise level enabled: @
Noise level disabled:
b
[,,,,, b
The noise level measurement readout is corrected for the analyzer’s log amplifier response, and the detector
response. The value is also normalized to a 1 Hz bandwidth.
Measurement and Readout Range
Noise level measures noise accurately down to 10 dB above the spectrum analyzer’s noise level. The readout
resolution is in steps of +- 0.1 dB.
DATA Entry
See MARKER @ ,
[8)
, and
m.
Example
In a communication system, the baseband noise level as well as signal to noise ratio measurements are required.
Select a frequency in the baseband spectrum clear of
signals with a single marker. Press
IUI] 0
Page 61

NOISE LEVEL MEASUREMENT
MARKER
Read the noise at the marker by pressing
The noise at 64 MHz is - 134 dBm in a 1 Hz bandwidth. This corresponds to - 134 dBm + 36
-
98 dBm in 4
kHz
voice channel bandwidth.
OBrl) b
dB/4
kHz =
Signal to noise measurements require the measurement of the noise level, as the example above, and the measurement of the absolute signal level.
Measure the power level of the
turn the noise level off, press
fxiFJm
adp
*
signal. To
and read the
power level.
The signal to noise ratio referenced to 4
kHz
bandwidth is - 32 dBm - ( - 98
dBm)
= 66 dB.
*Normalization to a desired bandwidth uses the equation 10 log,0
60 Manual Operation
desired BW
(
1Hz
)
Page 62

SCALE AND REFERENCE LINE
SCALE
Chapter 7
SCALE AND
REFERENCE LINE
GENERAL DESCRIPTION
This chapter describes the use of SCALE and REFERENCE LINE control groups for setting the amplitude scale,
and for making amplitude level measurements more conveniently.
REFERENCE LINE
DISPLAY LINE
1:
THRESHOLD
E
SCALE
SCALE keys allow the scaling of the vertical graticule divisions in logarithmic or linear units without changing the
reference level value.
LOG.
m
(DATA entry) scales the amplitude to 1 dB, 2 dB, 5 dB, or 10 dB per division.
If m is pressed when the scale is linear, 10 dB per division will be automatically entered. The subsequent
(DATA), if any, will then replace the automatic 10 dB/div.
Press
Manual Operation 61
Page 63

SCALE SCALE AND REFERENCE LINE
LIN
0.
d’l
imme
late
y scales the amplitude proportional to input voltage. The top graticule remains the reference
level, the bottom graticule becomes zero voltage. Reference level, and all other amplitudes, are read out in
voltage. However, other units may be selected. See AMPLITUDE UNITS SELECTION, Chapter 11.
If m is pressed when the scale is linear, 10 dB per division will be automatically entered.
LIN
Press
(
In LINEAR, a specific voltage per division scale can be set by entering a voltage reference level value. For
example, to set the scale to 3 mV/division, key in 30 mV reference level, (Voltage entries are rounded to the
nearest 0.1
dB,
so the 30 mV entry becomes 30.16 mV which equals - 17.4 dBm.)
DATA Entry
m(-j
Changes scale in allowable increments (1, 2, 5, or 10 dB per division).
pq @
Enables direct scale selection of allowed values. Other entries are rounded
to an adjacent value.
LIN
No DATA entry will be accepted with the linear SCALE selection key,
Example
0
It is convenient to observe AM sidebands in linear as well as logarithmic scales for analysis of both modulation
percentages and distortion products.
6.2 Manual Operation
Page 64

SCALE
AND
REFERENCE
LINE
Modulated AM signal displayed in the 10 dB/division
scale shows the carrier, its sidebands, and distortion
products.
Linear scaling enables the observation of the sidebands proportional to the carrier.
LIN
Press
(-J
SCALE
As in the MARKER m example, Chapter 6, a
direct readout of the percent modulation can be
made.
The fractional readout is one -half the modulation
index (only one sideband is measured).
%AM = 2(.25) x 100 = 50%.
Note that the carrier signal need not be placed at the
reference level for an index ratio measurement.
LOG
Change to a logarithmic scale with m and change
the dB/division with @ @ .
The sidebands are 12 dB down from the carrier, verifying the earlier measurement results.
t
I
I
I
I III I
I
I
1
Manual Operation 63
Page 65

REFERENCE LINE SCALE AND REFERENCE LINE
Harmonic distortion of the modulating signal can be
measured as in MARKER m , Chapter 6.
The modulation frequency is 18.8
kHz
and the distortion caused by the second harmonic is 2.4% (read out
as .024X).
REFERENCE LINE
The reference line functions, DISPLAY LINE (DL) and THRESHOLD (TH), place horizontal reference lines on
the display. Their levels are read out in absolute amplitude units.
DISPLAY LINE uses
l
measure signal levels with direct readout.
l
establish a standard for go/no-go test comparisons.
eliminate or reduce amplitude errors due to system frequency response uncertainty
0
THRESHOLD provides:
a base line clipper whose level is read out.
l
a minimum threshold level that can be set.
0
DISPLAY LINE
DISPLAY LINE
amplitude, in reference level units, is read out on the left-hand side of the CRT display.
64 Manual Operation
[1.1113
(DATA entry) places a horizontal reference line at any level on the graticule. The line’s
Page 66

SCALE AND REFERENCE LINE
DISPLAY LINE
The DISPLAY LINE can be positioned anywhere within the graticule. When activated after LINE power ON or
m
, the display line is placed 4.5 divisions down from the reference level.
DISPLAY LINE
display line is activated again before LINE power ON or
DISPLAY LINE position is always accessible for HP-IB and TRACE m ,
m
erases the line and readout from the CRT display but does not reset the last position. If the
[a;l:l
, it will return to its last position.
even if never activated. See Chapter 5,
TRACE ARITHMETIC.
The DISPLAY LINE readout has the same number of significant digits as reference level.
DATA Entry
t
(go
m @@
@iiJH
I
Moves the line about one division for each full turn. The line moves in
display unit increments.
Moves the line one-tenth of the total amplitude scale per step.
Positions the line to the exact entry level. Entry may be in
+
dBmV,
or f
dB&
depending upon which units are selected.
mV, FV -I-
1
dBm,
Example
When the amplitude of a number of signals in the same span require a quick readout, the DISPLAY LINE can be
used.
Activate the DISPLAY LINE with
With
0
0
, place the line through the peak of a signal
and read out its absolute amplitude level.
@
a
-94.9
d%“V
Moving the DISPLAY LINE to each signal reads out its amplitude.
Manual Operation 65
Page 67

THRESHOLD
THRESHOLD
SCALE AND REFERENCE LINE
THRESHOLD
writing CRT spectrum analyzers. The boundary’s absolute amplitude level, in reference level units, is read out on
The THRESHOLD can be positioned anywhere within the graticule. It operates on TRACE m ,
for TRACES A, B, and C simultaneously. When activated after LINE power ON or
(,.,,.
(DATA entry) moves a lower boundary to the trace, similar to a base line clipper on
1’6::]
, the THRESHOLD is
m,
direct-
or
The THRESHOLD level does not influence the trace memory; that is, the threshold level is not a lower boundary
for trace information stored and output from the trace memories through the HP-IB. TH [ removes the
THRESHOLD boundary and readout from the CRT display but does not reset the position. If threshold is activated again before LINE power ON or I’d::] , it will resume at its last level.
The THRESHOLD readout has the same number of significant digits as reference level.
DATA Entry
Moves the THRESHOLD about one division per rotation. The line moves in
Moves the THRESHOLD one-tenth of the total amplitude scale per step.
Positions the THRESHOLD to the exact entry level. Entry may be in
k
dBm, f dBmY or +
dB&
depending upon units selected.
mV,
I
(,.,.io
(t*ll.l
l pJ
66 Manual Operation
Page 68

SCALE AND REFERENCE LINE
Example
The THRESHOLD can be used as a go/no-go test limit.
A series of signals can be tested for a specific
THRESHOLD level by placing the THRESHOLD at
the test level.
THRESHOLD
Press THRESHOLD
(,.,,,I
55.2 dBm. Only those sig-
nals > - 55.2 dBm will be displayed.
Manual Operation 67
Page 69

COUPLED FUNCTION
GENERAL DESCRIPTION
Chapter 8
COUPLED
FUNCTION
GENERAL DESCRIPTION
This chapter describes the COUPLED FUNCTION group and its use in various measurements. The COUPLED
FUNCTIONS control the receiver characteristics of the spectrum analyzer.
The values of the COUPLED FUNCTION are automatically selected by the analyzer to keep absolute amplitude
and frequency calibration as frequency span and reference level are changed. * The functions are all coupled with
LINE power ON, a m or I”;‘:) FULL SPAN key, or when their individual
couples
Function
[1u10)
is activated.
COUPLED FUNCTION
Ill
I
L
=Q
i
RES
BW {
Er
ri
ulLo”ples
Function
j
1
E
I
Center Frequency
Step Size
RF Attenuation
OFF
I
MANUAL
Light
I
ON
Sweeptime, full scale
Video Bandwidth
Resdution Bandwidth
For each COUPLED FUNCTION:
AUTO
Ll
MA UAL
-:&s
Sets the function to the preset value dictated by the analyzer’s current state. The function is
coupled.
Function value will not change with instrument state. DATA entry changes value. The MANUAL light goes on and stays on until the function is placed in m once again.
I[
In most cases, the
[-1
coupled functions will change values to maintain amplitude calibration when one or more
of the others are manually set. If the amplitude or frequency becomes uncalibrated,
the right-hand side of the graticule.
*Center frequency step size does not affect amplitude or frequency calibration.
“MEAS UNCAL”
Manual Operation 69
appears in
Page 70

DATA ENTRY FOR COUPLED FUNCTIONS
COUPLED FUNCTION
Coupled
Function
i::‘1
ml
(::::‘I
[,1,,1
I’::::‘]
3 dB resolution bandwidth (IF filter) which largely determines the ability of the analyzer to
resolve signals close together in frequency.
3 dB bandwidth of the post detection low pass filter that averages noise appearing on the
trace.
The total time for the analyzer to sweep through the displayed frequency span or display a
detected signal in zero frequency span.
The setting of the input RF attenuator which controls signal level at the input mixer.
Selects center frequency change for each DATA @
Selects
@
when
I=]
is activated.
DATA ENTRY FOR COUPLED FUNCTIONS
and
(.,,,.
Discrete values are entered for
selects these values sequentially from the current value. A DATA entry from the keyboard which is not exactly
equal to an allowable value will select an adjacent value. For example,
bandwidth, the next higher IF bandwidth.
[:;‘I
,
[‘:“;“J
,
[‘I:::‘1
,
. The DATA entry from DATA
[::‘1
QQ@
and @j
a
will select 30
;,&J
kHz
RESOLUTION BANDWIDTH
[:;‘I
(DATA entry) sets bandwidth selection to MANUAL and changes the analyzer’s IF bandwidth. The band-
30
widths that can be selected are
1 MHz, and 3 MHz.
Example
10 Hz,30Hz,
100 Hz,
Hz,1kHz, 3 kHz, 10 kHz,
300
kHz, 100
kHz,
300
kHz,
A measurement requiring manual resolution bandwidth selection is the zero span (time domain) observation of
modulation waveforms. An example can be found in Chapter 3, ZERO FREQUENCY SPAN - FIXED TUNED
RECEIVER OPERATION.
70 Manual Operation
Page 71

COUPLED FUNCTION
Another use of manual resolution bandwidth is for better sensitivity over a given frequency span.
The low level intermodulation products of a signal
needs to be measured. With the functions coupled,
the analyzer noise may mask the distortion products.
Reduction of the noise level by 10 dB (increased sensitivity) is achieved by decreasing the bandwidth by a
factor of 10.
--
VIDEO BANDWIDTH
(THRESHOLD has been activated to clarify the dis-
play.
1
lu
4l.B
k
The sweep time automatically slows to maintain absolute amplitude calibration if m is coupled.
VIDEO BANDWIDTH
[.;“.“)
(DATA entry) sets the video bandwidth selection to manual and changes the analyzer’s post detection filter
bandwidth. The bandwidths
kHz,
30
kHz,
100
kHz,
that can be selected are 1
300
kHz,
1 MHz, and 3 MHz.
hp
19
.
Hz,
3
Hz, 10 Hz,30Hz,
100 Hz,
300 Hz, 1
kHz,
3
kHz,
10
Manual Operation
7 1
Page 72

VIDEO BANDWIDTH
COUPLED FUNCTION
Example
Signal responses near the noise level of the analyzer will be visually masked by the noise. The video filter can be
narrowed to smooth this noise.
A low level signal at this center frequency can just be
discerned from the noise.
Narrowing the video bandwidth clarifies the signal and
allows its amplitude measurement.
Press m @I @I @l
@I
The sweep time will increase to maintain amplitude calibration.
NOTE
The video bandwidth must be set wider or equal to the resolution bandwidth when
measuring pulsed RF or impulse noise levels.
Video Averaging
Narrowing the video filter requires a slower sweep time to keep amplitude calibration, since the narrower filter must
have sufficient time to respond to each signal response. Video averaging is an internal routine which
djgjtalfy
averages a number of sweeps, allowing a more instantaneous display of spectra1 changes due to center frequency,
frequency span, or reference level changes. See Chapter 11.
72 Manual Operation
Page 73

COUPLED FUNCTION
SWEEP TIME
m
(DATA entry) sets the sweep time selection to manual and changes the rate at which the analyzer sweeps the
displayed frequency or time span.
SWEEP TIME
The sweep times that can be selected are:
FREQUENCY SPAN
(~100
ZERO FREQUENCY
SPAN (0 Hz)
Hz)
SWEEP TIME
20 msec to 1500
1
psec
to 10
msec
20 msec to 1500
set
set
SEQUENCE
continuously
1,2,5,
and 10
continuously
Example
To identify signals quickly in a very narrow frequency span (where the resolution bandwidth would be narrow), the
sweep time can be temporarily reduced (e.g., speed up sweep rate).
A frequency span of 10
kHz
will have a selected reso-
lution bandwidth of 100 Hz and a sweep time of 3
seconds.
Page 74

INPUT ATTENUATION
To quickly see signals present in the span, press
and 0 several times. When the sweep completes
0
its span, couple sweep time again with
m
I::::‘1
COUPLED FUNCTION
ATID I.
10 al
Note that the
MEAS
UNCAL message appears automatically as the faster sweep time causes some distortion of the spectral response.
CEmn-
R1 By
1 ml*
lee H,
ve* 3.e H*
51p
PIN
I”
I...
Wm.0
INPUT ATTENUATION
I11111]
(DATA entry) sets the attenuation function to MANUAL and changes the analyzer’s RF input attenuation.
The levels of attenuation that can be selected are 10 dB to 70 dB in 10 dB steps, or 0 dB under special conditions.
Generally, the reference level does not change with attenuator settings.
.“Z
I
aam .Y M.
¶=ud 2” .*,
When the RF input attenuator function is coupled (AUTO), the value selected assures that the level at the input
mixer is less than - 10 dBm (the 1 dB compression point) for on-screen signals. For example, if the reference level
is + 28 dBm, the input attenuator will be set to 40
dB:
+ 28 dBm - 40 dB = - 12 dBm at the mixer.
The input mixer level can be changed to assure maximum dynamic range. See EFFECTIVE MIXER LEVEL,
Chapter 11.
CAUTION
Greater than + 30 dBm total input power will damage the input attenuator and the
input mixer.
74 Manual Operation
Page 75

COUPLED FUNCTION INPUT
Zero Attenuation
As a precaution to protect the spectrum analyzer’s input mixer, 0 dB RF attenuation can only be selected from the
number/units keyboard, press
Reference Levels I - 100 dBm and > + 30 dBm
Reference levels 5 - 100 dBm or between + 30 dBm and + 60 dBm can be called when the reference level
extended range is activated. Low reference level limits depend upon resolution bandwidth and scale.
I
Press
m (,1,.1
to extend the reference level range.
(,,,.1
@(x-
Al7ENUATlON
See Chapter 3, FUNCTION
Determining Distortion Products
If the total power to the analyzer is overloading the input mixer, distortion products of the input signals can be
displayed as real signals. The RF attenuator can be used to determine which signals, if any, are internally generated
distortion products.
Example
The two main signals shown are producing intermod-
ulation products because the analyzer’s input mixer is
overloaded.
(F)
,
and Chapter 11,
(,.,,,
KEY FUNCTIONS.
To determine whether these intermod products are
generated by the analyzer, first save the spectrum displayed in B with @I B B B.
t i
- ,lb..l. LWS
lis L 1 h”Z
i
i ii i
VI 100
“a
Manual Operation
i
i i 1
9*H 1” .)u
JIP 1... .
.
75
Page 76

CENTER FREQUENCY STEP SIZE
Increase the RF attenuation by 10
(If the reference level changes, it will be necessary to
return it back to its original value.)
dB.
Press m
0
0
hp
1. .”
COUPLED FUNCTION
e -I..8 h
cwa-rm 1m.114 Y(*
- I I LCIX
Since some of the signal responses decrease as the attenuation increases (by comparing the response in A with the
stored trace in B) , distortion products are caused by an overloaded input mixer. The high level signals causing the
overload conditions must be attenuated to eliminate this condition.
1 I
1
YI 1.. “1
I
1
I
WIN 1” LHI
op 2.. ..*
1 ]
CENTER FREQUENCY STEP SIZE
m
(DATA entr ) sets step size to MANUAL, changes and stores the step size entered into a register. While
and
0
is in MANUAL,
functions can be used to enter step size value to the register. When a CF STEP SIZE is AUTO, the center
frequency steps will be 10% of the frequency span, even though the CF STEP SIZE register contains another
value.
step size
SPAN or LINE power ON
I”::::il
&E-]
[,,,,
, [ FULL
(DATA entry)
change center frequency by the step size value stored in the register. Several
0
m
Entry Value
100 MHz
DATA entry value
uncoupled (MANUAL)
State
coupled (AUTO)
[“::::‘)
MARKER
The step size can be varied from 0 Hz to greater than 20 GHz with 1 Hz resolution. It is displayed with the same
resolution as center frequency.
76 Manual Operation
@
marker frequency readout
uncoupled (MANUAL)
Page 77

COUPLED FUNCTION
CENTER FREQUENCY STEP SIZE
When the center frequency is activated with step size in MANUAL, the active function readout includes both the
center frequency and the step size value.
-En
Ii
I.25
-^ -
L)(s
i
i i i i
.-..
.“_
i
i
WAN
- 19. ---_
i I
2.5.
M,
DATA Entry
(TFJQ
fig lF5[@
Changes the step size in display unit increments.
Changes the step size in steps equal to one-tenth of the frequency span.
Selects a specific step size to a resolution equal to the current center frequency readout.
Example
Surveillance of a wide frequency span sometimes requires high resolution. One fast way to achieve this is to take
the span in sequential pieces using a tailored center frequency step. This example looks from 0 Hz to 2.5
GHz
50 MHz spans.
in
First set the span and center frequency: For a span of
50 MHz, press
center frequency to 25 MHz with
(5)
m
m @
Set the
[z)
@
Q(ul.
.-
t i 1 i1 I I
I
m 25..
-IlLHI
ml=
I I
1
vml 3ee
I 1
I I
LIHZ
Manual Operation 77
I
¶w 2e
I I
WAN
se.. ma=
I)...
J
Page 78

CENTER FREQUENCY STEP SIZE
COUPLED FUNCTION
Set the step size to 50 MHz,
reactivate center frequency with
(‘::::‘I
[Zg)
and step to
hp
225 MHz.
cwnw
f---3
Now each u sets the center frequency to the next 50 MHz span for a span by span surveillance of the
spectrum. (Center frequency = 25 MHz, 75 MHz, 125 MHz, etc.) Center frequency step size can also be defined
by the marker. See the MARKER ENTRY portion of Chapter 6.
78 Manual Operation
Page 79

SWEEP AND TRIGGER
Chapter 9
SWEEP AND TRIGGER
This chapter describes the use of SWEEP and TRIGGER control functions.
SWEEP controls enable:
m
continuous, or repetitive sweeping (sweep time L 20 msec) .
B
a single sweep which will repeat only on demand (sweep time I 20 msec) .
TRIGGER controls select the function which will begin a sweep:
B
as soon as possible,
[.,,
line voltage passes through zero on a positive swing,
m
an external signal voltage passes through - 1.5V on a positive swing.
[,,,I
the level of a detected RF envelope reaches up to the level on the CRT display determined by the
LEVEL knob.
SWEEP
TRIGGER
i
SWEEP AND TRIGGER CONTROLS
SWEEP
The spectrum analyzer frequency sweep (sweep times
from the start frequency to the stop frequency unless new data entries are made to the analyzer from the front
panel or the HP-IB. With faster sweeps, changes to center frequency, for example, appear continuous. With long
sweep times, a change in center frequency noticeably suspends the sweep while the analyzer updates its state and
readout, then the sweep continues from where it was, tracing out the new spectrum.
220
msec), once triggered, continues at a uniform rate
Manual Operation 79
Page 80

TRIGGER
SWEEP
AND
TRIGGER
The SWEEP light indicates that a sweep is in progress. The light is out between sweeps and during data entry. (The
light is out for sweep times
110
msec.)
After a sweep, the next sweep will be initiated only if:
continuous sweep mode is selected or a single sweep demand is made,
0
the trigger conditions are met,
0
l data is not entered continuously from the front panel DATA controls or the HP-IB.
Continuous Sweep
[-1
enables the continuous sweep mode. Provided the trigger and data entry conditions are met, one sweep will
follow another as soon as triggered. Pressing m initiates a new sweep.
Single Sweep
@
enables the single sweep mode. Each time
[,,,,,,I
is pressed, including when the SWEEP mode is changed
from continuous, one sweep is initiated provided that the trigger and data entry conditions are met. A sweep in
progress will be terminated and restarted upon (,,.,,, .
Zero Frequency Span Sweep
In zero frequency span, sweep times from 1 psec to 10 msec are also available. In these sweep times, the SWEEP
[,,,)
, @ are disabled. The video signal response is not digitally stored (trace modes also disabled), but multiplexed directly onto the display along with the graticule and readouts. The graticule and readouts are refreshed
following each fast sweep.
To avoid flicker of the display when external or video triggers are less frequent than 25 msec, the analyzer will
trigger internally. If triggers dependent only on external or video trigger are required, press
or
[,nl) ‘(d’
11.111) ‘[,,,,
b]
isa
es “auto” external trigger feature
disables “auto” video trigger feature
For zero frequency span sweep times
NOTE
110
msec and
11*111)
x or @ y, the CRT
display graticule and readout depend upon triggering. If no trigger is present, the CRT
display will be blank.
TRIGGER
The analyzer sweep is triggered by one of four modes selected.
l
(:2:.,
allows the next sweep to start as soon as possible after the last sweep.
l
i
allows the next sweep to start when the line voltage passes through zero, going positive.
l
[
allows the next sweep to start when an external voltage level passes through =
The external trigger signal level must be between OV and +
80 Manual Operation
5V
1.5V,
going positive.
Page 81

SWEEP AND TRIGGER
l
B
allows the next sweep to start if the detected RF envelope voltage rises to a level set by the LEVEL
EXTERNAL TRIGGER INPUT
TRIGGER
knob. The LEVEL corresponds to detected levels displayed on the CRT between the bottom graticule (full
CCW) and the top graticule (full CW).
An RF envelope will trigger the sweep only if it is capable of being traced on the CRT display-that is, the
resolution bandwidth and video bandwidth are wide enough to pass the modulation waveform of an input signal.
Example
A zero span display of this video waveform will trigger
for all LEVEL knob settings.
If the video signal lowers on the display, the LEVEL
must be set towards the minus side.
t
i
I
I
1
If the level does not cause a trigger within 25 msec, the sweep will be triggered anyway to ensure a display. Note
that this is true only for sweep times
~10
msec.
Manual Operation 81
Page 82

INSTRUMENT STATE
FULL SPAN INSTRUMENT PRESET (2 - 22
GHz)
Chaper 10
INSTRUMENTSTATE
GENERAL DESCRIPTION
This chapter describes the INSTRUMENT STATE keys. Each key allows access to or activation of a specific set of
functions and their values. Some of the sets are built into the
analyzerand
some are user defined.
INSTRUMENT STATE
Instrument states that can be selected:
FULL SPAN
@
FULL SPAN
@
m(TJ
@(TJ
m
FULL SPAN INSTRUMENT PRESET (2
m
provides a convenient starting point for making most measurements. That is, it calls for a full 2 - 22 GHz
span, coupled functions, and a 0 dBm reference level, to name a few. LINE power ON automatically calls for an
instrument preset.
A full 2-22 GHz span with coupled operation and all the functions set to known states and
values.
A full 0 Hz to 2.5 GHz span with coupled operation and all the functions set to known states and
values.
Saves the complete set of current front panel function states and values for later recall. Registers 1
through 6 are available for storage.
Recalls the complete instrument state saved in the register called.
Calls for front panel control after the analyzer has been placed in a remote state by an HP-IB
controller.
-
22 GHz)
The states that are set include all the functions and values of
l front panel functions, and
l
[,.,,11
KEY FUNCTIONS, and
l functions accessible only by the HP-IB.
Manual Operation 83
Page 83

FULL SPAN INSTRUMENT PRESET (2 - 22
GHz)
INSTRUMENT STATE
Front Panel Preset
m
enables all the front panel functions designated by keys with white lettering. It will save a trace response in
TRACE B, but not A or C.
To be precise:
FUNCTION:
DATA:
COUPLED FUNCTION:
TRACE:
,m,
FUNCTIONS ACTIVATED WITH FULL SPAN KEY
Start Frequency
Stop Frequency
Reference Level
2 GHz
22
GHz
0 dBm
Hold
All set to a which corresponds to the following values:
Resolution Bandwidth
Video Bandwidth
Sweep Time
Attenuator
3 MHz
1MHz
500
msec
10
dB,
full scale
coupled to maintain < - 10 dBm
at input mixer
Center Frequency Step Size
A
B
100 MHz entered in register
Clear-Write
Blanked, but information in memory
saved
A-B
off
MARKER:
INSTRUMENT STATE
I,.,and@:
SCALE:
REFERENCE LINE:
84 Manual Operation
off
States are saved including the current state. See @ a below.
Logarithmic, 10 dB/division
Display line off
Threshold off
5.5 divisions up
1 .O divisions up
Page 84

INSTRUMENT STATE
FULL SPAN 0
-
2.5
GHz
SWEEP:
TRIGGER:
INSTR CHECK:
KEY FUNCTION:
[auto] FUNCTIONS:
HP-IB FUNCTIONS:
Continuous
Free run
An internal instrument check is made. If the check is false, lights will stay on.
Normal
m
Chapter 11,
instrument preset during
KEY FUNCTIONS, discusses the implications of activating
[,.,,
FUNCTION use.
If the key is activated (shift light on), m unshifts the key. This is equivalent to
pressing
“Dl”
“EM”
“03”
“PD”
“DA’
Graphic information or control language written into the analyzer memory by
[--I
Display size-normal
Erase trace C memory
Output format ASCII absolute
Pen down
Display address set to 3072
HP-
IB functions such as graph (GR) , plot (PA), label (LB), or display write (DW) will
be erased unless stored in trace memory B. Instrument preset also rewrites all the
display graticule and character readouts into the appropriate section of the display
memory.
FULL SPAN 0 - 2.5
The 0 - 2.5
GHz
FULL SPAN key selects a start/stop frequency of 0 Hz and 2.5 GHz respectively, a reference
GHz
level of 0 dBm, and sets all the COUPLED FUNCTIONS to AUTO. Basically, B is the equivalent of an
instrument preset in the low band. It presets everything that m does except that m will not execute the
instrument check sequence.
SAVING AND RECALLING INSTRUMENT STATES
[
(DATA keyboard entry) and @ (DATA keyboard entry) save and recall complete sets of user-defined
front panel function v lues. The DATA entry from the keyboard names the register which stores the instrument
0
state. Six registers,
The registers contain their last states even with a loss of line power (power failure). The registers are maintained
with an internal battery supply for about a 30-day period after line power failure.
@gr;7
is a special recall function which recalls the instrument state prior to the last instrument preset or single
function value change, whichever has most recently occurred. It aids in recovering from inadvertent entries.
Registers 8 and 9 contain preset control settings that are used for calibration purposes. (See Calibration procedure
under GENERAL INFORMATION at the beginning of this section.) Register 0 restores the current state of the
analyzer, which is useful for servicing.
through @ ,can be saved and recalled. Only another [ will erase a saved register.
The current instrument state, if the POWER switch is turned to STANDBY
can be recovered at POWER ON if
is activated previous to a power loss.
m
or a short-term loss of ac line power),
(
Manual Operation 85
Page 85

SAVING AND RECALLING INSTRUMENT STATES
Some
[,..,
KEY FUNCTION values or states cannot be saved. Neither can information in the display memories,
INSTRUMENT STATE
such as a title or trace.
Example
When a test sequence is used over and over, the instrument states can be set up in the registers prior to testing for
recall during the procedure.
Keying in a specific state:
(ZE--@p-J@
[~](gYi-J~~
[y)@
LIN ( SCALE
Then save with
Press
a
[,., Q
(06::)
And recall the last state with
(llellll
[1]
Once the
state has been recalled, any function can be used for
more detailed measurements.
Note that in this case, the state could also have been
recalled by
(.,,.rrl
[1] .
Registers 1 - 6 can also be locked to prevent any loss
or change in the contents of the storage registers.
[,.lrl
I-11
locks the registers and
(,.,,, (..cLLL
unlocks the
registers.
86 Manual Operation
Page 86

INSTRUMENT STATE
LOCAL OPERATION
LOCAL OPERATION
@
enables front panel control after an HP-IB remote LISTEN or TALK command has been executed. An HP-IB
local lockout will disable
STANDBY
then ON again.
@
until an HP-IB return to local command is executed or the LINE power is turned to
Indicates instrument has been addressed through
HP-
IB.
Indicates instrument is in remote operation.
The addressed light remains on until an HP-IB device clear command or any unlisten command is executed.
Manual Operation 87
Page 87

(,,,rr
KEY FUNCTIONS
GENERAL DESCRIPTION
Chapter 11
I
KEY
FUNCTIONS
GENERAL DESCRIPTION
This chapter describes access and use of the B KEY FUNCTION.
Shift functions supplement a front panel function or provide unique measurement capabilities. The @ functions
are not named on the front panel but are coded by the blue characters beside the keys.
frequency offset function is designated by the code V On the front panel the code V is found in the FUNCTION
section :
V
For-
example, the
The shift functions are activated by pressing
complete summary of shift FUNCTIONS is in this chapter under FUNCTION SUMMARY There is an index to all
shift functions at the end of this chapter.
Example
Activate the shift function V (frequency offset) with
press
press
The shift light can always be turned off with
m
DATA Entry
An active shift function value is read out and identified in the active function area of the display the same as any
other function using DATA entry Once the data has been entered, any other function can be activated. The shift
function will retain its last value until the a key is pressed, or the LINE switch is switched to STANDBY
[
does not disable the selected shift function (except for title).
shift light on
shift light off and offset function activated
(WTII
and then the front panel key with the appropriate blue code. A
I--u]
,
which returns the front panel keys to their designated function.
Manual Operation 89
Page 88

FUNCTION SUMMARY
FUNCTION SUMMARY
k&
KEY FUNCTIONS
General
r HP-IB Service request
P Enter HP-IB address
f
Power on in last state
z
Display Address
j
Display Write
Amplitude
Z Amplitude offset
A Units: dBm
B
C
dBmV
dB@
D voltage
I Extended reference level
range
-
Negative entry
, Mixer level
Marker
K
Marker to next peak
N Marker to minimum
0 Enter A+ span
M Noise level on
L Noise level off
u
Stop single sweep at marker
= Factory preselector setting
/
Manual preselector setting
Display
o Annotation blanked
p Annotation on
w Display correction data
g CRT beam off
h CRT beam on
m Graticule blanked
n Graticule on
E
Title
Trace
c
A+B-+A
Detection:
normal
Fl
positive peak
d negative peak
e
sampling
Trace C:
k
blank trace C
i
B?t,C
1
B-C
view trace C
j
G Video averaging on
H Video averaging off
Trigger-Zero Span
x
1
without 25 msec triggering
y
B
without 25 msec triggering
Instrument State
( Save registers locked
) Save registers unlocked
T
Fast preset 2 - 22
U
Fast preset external mixer
GHz
S Fast HP-IB operation
t Band lock
Q Band unlock
Error Correction
W Execute routine
X Use correction data
Y
Do not use correction data
w Display correction data
Diagnostics
w Display correction data
q Disable step gain
R Frequency diagnostic on
F YTO pretest mode
J Manual DACS control
#
Turns off YTX self-heating
correction
Frequency
V Frequency offset
-
Negative entry
v
Signal identifier ext. mixer
ALPHABETICAL KEY CODE SUMMARY
*A Amplitude in dBm
B Amplitude in dBmV
C Amplitude in dBpV
D Amplitude in voltage
E
Title
F Removes IF Offset for YTO
preset
G Video averaging on
l
H
Video averaging off
I Extended reference level
range
J Manual DACS control
K
Marker to next peak
l
L
Noise level off
M Noise level on
N Marker to minimum
0 Enter A + span
P Set HP-IB address
*
Q Band unlock
R Frequency diagnostic on
S Fast HP-IB operation
T
Fast preset 2 - 22 GHz
U
Fast preset external mixer
V Frequency offset
*n
*p
W Execute error correction
routine
X Use correction data
*Y
Do not use correction data
Z Amplitude offset
*a Normal detection
b Positive peak detection
c
A+B-‘A
d Negative peak detection
e Sample detection
f
Power on in last state
g CRT beam off
*h
CRT beam on
i
BsC
j View trace C
*k
Blank trace C
I
B-C
m Graticule blanked
‘These functions selected with [‘a.‘:l INSTRUMENT PRESET
Graticule on
o Annotation blanked
Annotation on
q Disable step gain
r HP-IB service request
t Band lock
u
Stop single sweep at marker
v
Signal identifier ext. mixer
w Display correction data
111
without 25 msec triggering
X
y
ll=o
without 25 msec triggering
El
z
Display address
-
Negative entry
= Factory preselector setting
/
Manual preselector setting
( Save registers locked
) Save registers, unlocked
I Display write
Mixer level
i
Turns off YTX self-heating
correction
I
90 Manual Operation
Page 89

151111
KEY FUNCTIONS
DATA entries to shift functions are made only from the number/units keyboard. The ENABLED light remains off
even though data may be entered.
Data is entered (that is, changes the instrument state) only when a units key is pressed. If the entry has no units (an
address, for example), use the0p!!.
key as the terminator.
(,.,,, -,v,z
NEGATIVE DATA KEYBOARD ENTRY
Entering negative data from the DATA keyboard requires the use of a negative symbol prefix on the number entry.
Negative entry:
For example, to enter a negative 100 MHz offset frequency:
Press &
Press (,..I] (-I
Not all values can be entered with a negative prefix. For example, a negative entry to a voltage reference level will
result in entering the positive value.
Negative entries in dB can be made with the - dBm units key or the negative prefix with the + dBm units key. If
both negative prefix and
[,.,,, (
[z)
to activate frequency offset.
0
-7;:
0
m
m @
are used, the value will be entered as positive.
to enter a negative frequency.
FREQUENCY AND AMPLITUDE OFFSET
The CRT display amplitude and frequency readout can be offset. Entering an offset does not affect the trace.
V
Frequency offset:
Amplitude offset:
Offset entries are added to all the frequency or amplitude readouts on the CRT display, including marker, display
line, threshold, start frequency, and stop frequency.
FUNCTION
To eliminate an offset, activate the offset and enter zero. A FULL SPAN key also sets the offsets to zero.
Offsets are stored with the
(,,,,I [=I
[,,,
functions for recall with
(DATA keyboard entry)
(DATA keyboard entry
@
.
Manual Operation 91
Page 90

When an offset is entered, its value is displayed on the CRT
iji
ii
i”“;?
KEY FUNCTIONS
I
i
I
i i
DATA entry from the keyboard can be in Hz,
amplitude. The amplitude offset readout is always in dB. An entry in voltage can be made and will be converted to
dB
offset.
The offset range for frequency is - 99.999999990 to + 99.999999999 GHz in 1 Hz steps. The amplitude offset
range is greater than f 100 dB in 0.1 dB steps. Least significant digits will be truncated for frequency and
amplitude offset entries.
Example
An 102.6 MHz up converter with 12.7 dB attenuation is placed between a signal source and the spectrum
analyzer. The offsets can be set so that the CRT display shows the trace referenced to the signal as input to the
converter.
Amplitude offset is entered as a positive value to com-
pensate (offset) the loss of the converter.
kHz,
MHz, or GHz for frequency and dB, - dB, mV and FV for
Note that the original REF LEVEL of 0 dBm is now
changed to 12.7 dBm also.
92 Manual Operation
Page 91

m
KEY FUNCTIONS
(,.,,, V -,
A, B, C, D
Frequency offset is entered as a negative value since
the input frequency to the converter is lower than the
output.
EFFECTIVE MIXER LEVEL
The effective mixer level is equal to the REFERENCE LEVEL minus the INPUT ATTENUATOR setting. It specifies the maximum signal level that will be applied to the input mixer for a signal that is equal to or below the
REFERENCE LEVEL. A FULL SPAN key (0 - 2.5 GHz or 2 - 22
is 5 dB below the analyzer’s 1 dB compression point. The effective mixer level can be manually set from - 10
dBm * to - 70 dBm in 10 dB steps by pressing [ , (comma sign) and entering the desired
numeric keyboard. For instance, to set a mixer level at -40 dBm, press: (,,IIl ,
analyzer’s REFERENCE LEVEL is changed, the coupled input attenuator will automatically change to limit the
maximum signal at the mixer to - 40 dBm for signals I REFERENCE LEVEL.
GHz)
sets the mixer level to - 10 dBm, which
eve1
through the
m d
(zl
. As the
AMPLITUDE UNITS
The following shift key codes immediately select the corresponding units for all the amplitude readouts: reference
level, marker, display line, and threshold.
When a units change is made, all readouts are converted so as to preserve the absolute power levels of all the
readouts. For example, a 0 dBm threshold level converts to 47.0 dBmV (50 ohm input) when dBmV units are
called.
SHIFT KEY
FUNCTION
i
A. . . . . .
@
B . . . . . . . . . . . . . . . . . . . . . . . . . . . . . . . .
[,,,,,
C . . . . . . . . . . . . . . . . . . . . . . . . . . . . dBpV
m
D . . . . . . . . . . . . . . . . . . . . . . . . . volts
(or FULLSPAN key) . . . . . . . dBm
The keys for these functions are located in the COUPLED FUNCTION group.
AMPLITUDE
UNITS
dBmV
‘In the Extended Reference Level Range (Shift I, under EXTEND REFERENCE LEVEL RANGE in this chapter), the effective mixer
level can be set to 0 dBm.
Manual Operation
93
Page 92

H I, =,/
k&
KEY FUNCTIONS
EXTEND REFERENCE LEVEL RANGE
Normally, the reference level can be set from - 89.9 dBm to + 30.0 dBm in coupled operation. The limits of the
range can be extended to a maximum of - 139.9 dBm and + 60 dBm.
I
press B
The lower limit of reference level depends upon resolution bandwidth and scale.
Scale
m
Resolution
Bandwidth
Minimum reference level
with extended reference level
10 dB attenuation
0 dB attenuation
h
lo9
linear
linear
11 kHz
23 kHz
sl kHz
>3kHz
-
129.9 dBm
-
109.9 dBm
-
109.9 dBm
-
89.9 dBm
-
139.9 dBm
-
119.9 dBm
-
119.9 dBm
-
99.9 dBm
When the reference level is set at a minimum, the level may change if either scale or resolution bandwidth is
changed. The extended range is disabled with instrument preset.
FACTORY PRESELECTOR SETTING
Activating
provides a preset adjustment for each of the four frequency bands in the 2 - 22 GHz range. These preset adjust-
ments optimize the preselector tracking over the full 2 - 22 GHz frequency range. The tracking can be optimized at
any single frequency with the
the other three bands. (See Chapter 6 for more information.)
(,,t
= will reset the internal preselector to a factory set 2 - 22 GHz tracking range. The factory setting
()::::LJ
key. A @ adjustment in one band will not affect the preselector tracking in
MANUAL PRESELECTOR TRACKING
The internal preselector can be manually adjusted for a peak response in the 2-22 GHz band. m /
enables manual entry of a DAC number from 0 - 63 with the DATA knob, step keys, or numeric keyboard. The
DAC reading corresponds to a voltage which sets a particular preselector tracking offset. The location of the
MARKER determines the band (four independently adjustable bands) to be adjusted.
The Manual Preselector Tracking function is useful for peaking the preselector at locations where a stable CW
signal is absent. For instance, drifting signals or pulse modulated signals do not easily lend themselves to the use of
@
. The automatic preselector peak routine depends on a stable CW signal. In this situation, a means for
manually tracking the preselector may provide a more reliable setting.
94 Manual Operation
@
Page 93

kd
kd
KEY FUNCTIONS
u, K, N
MARKER SWEEPS
Stop Sweep at Marker, TALK after Marker
To stop the sweep at the marker,
press MARKER
press
11*0
A marker must be activated to enter this sweep function.
Each time a sweep is triggered, it will stop at the marker, even if the marker has been moved. A marker being
moved when the sweep passes may not stop the sweep.
To disable the stop sweep at marker functions
press MARKER m or
In remote operation, the analyzer will not TALK until the trace sweep stops at the marker. TALK is suspended by
keeping the HP-IB Data Valid line not true until the marker is placed.
u
I--]
and
I’a::]
.
MARKER TO NEXT PEAK/MARKER TO MINIMUM
Successive peaks can be identified by continuously using
m
can be used to find the largest signal. Then m K can be used successively to find the next largest signal.
Example
Press @ to find largest signal.
@
K to find next largest signal.
[
K. If a trace displays many different signal levels, a
I
! ! ! ! ! ! ! ! ! 1
Marker to Minimum
The minimum data value in a trace can be quickly located with B N.
Manual Operation 95
Page 94

k2
m, n, o, p, g, h, w
m
KEY FUNCTIONS
GRATICULE
AND ANNOTATION ON/OFF
The graticule and character readouts can be selectively blanked with key functions. This is valuable when alterna-
tive graphics are drawn on the CRT through the HP-IB.
Graticule
Blank:
On:
press
[,,,,
m
press B n
Annotation
Blank:
On:
press
press
(,.,,,
[,.,,,
0
p
CRT BEAM ON/OFF
The CRT beam power supply can be turned off to avoid unnecessary wear of the CRT if the analyzer is operated
unattended.
Beam off:
Beam on:
Reducing intensity
press
[,.,,, g
press
(,.,,,1
h
or
blanking
the traces does
not
reduce wear on the CRT
CRT beam power off does not affect HP-IB input/output of instrument function values or trace information.
DISPLAY CORRECTION DATA
The correction data generated from the error correction routine can be displayed.
Display correction data:
Do not display correction data:
The readout is detailed in this chapter under ERROR CORRECTION ROUTINE.
press m w
press
[)b:;IJ
96 Manual Operation
.1 II* -5,
CORRECTION DATA DISPLAYED
.h” .*.. .*.,
.* .‘S n -..
Page 95

I
KEY FUNCTIONS
(,.lrll
E, c, a, e, b, d
TITLE
The user can write a message in the top CRT display line. When the title is activated, the front panel blue
characters, number keyboard numbers, decimal, backspace, and space can be typed onto the top line starting at
the left of the display. The full width of the display can be used (total of 58 characters); however, marker readout
may interfere with the last 16 characters of the title.
(,,,,
Activate title:
Enter text:
To end a title:
E (shift light on)
abcdefghijklmnopqrstuvwxyz
ABCDEFGHIJKLMNOPQRSTUVWXYZ
/4?L
= ()
,><
0123456789. [space]
press
I--]
(shift light off)
A title will remain on the display until the title function is activated again,
la;l:]
is pressed, or an instrument state is
recalled with @ .
To erase a title without changing the instrument state, end the title function if still active, then press ( E
B.
A + B + A enables the restoration of the original trace A after a a has been activated. A + B + A is executed
with both Trace A and Trace B in
[,,,,
:
press m c.
When executed, m is turned off and the amplitude in trace B is added to the amplitude in trace A (in display
units) and the result is written into trace A.
Additional A + B * A executions will each add another trace B response to the cumulative trace A
TRACE DETECTION MODES
One of four detection techniques can be selected for displaying trace information.
Mode
normal
sample
positive peak
negative peak
Access
FULL SPAN key
or [,,lrr a
me
(,.,,,jb
md
Use
l Most measurements
l Noise Level measurements
0
Zero frequency span waveforms for sweep times
2
20
msec
l Video averaging
l
Diagnostic aids for servicing
Manual Operation
97
Page 96

(,,,,,
a, e, b, d
L%
KEY
FUNCTIONS
Video
Signal
Track
Hold
AID CRT
COtlV~rtW
\
Memory
_
Display
During a sweep, only a specified amount of time is available for writing data into each of the 1001 trace memory
addresses. In two of these time periods, the positive and negative peak detectors obtain the maximum and
minimum video signal excursions, respectively, and store these values in
ahernate
trace memory addresses. This
technique allows a graphic presentation of noise on the CRT display.
Normal Mode
In normal mode, a detection algorithm selectively chooses between the positive and negative peak values to be
displayed. The choice is made dependent upon the type of video signal present.
Data from the positive peak detector (signal maximums) will alway be displayed in the odd-addressed trace
memories (1, 3, . . . 1001). If, within the time period following the storage of a value in an odd-addressed memory,
there is no change in video signal level, the positive peak detector value will also be stored in the even address. In
other words, the even-addressed memory will also contain positive peak detection data if the signal during that
time period is monotonic. Negative peak detector data (video signal minimum) will be stored in the even-
addressed trace memory if the signal has a point of inflection during the time period.
’
Normal mode is selected with instrument preset.
Sample Mode
In the sample mode, the instantaneous signal value of the final analog-to-digital conversion for the time period is
placed in memory. (As sweeptime increases, many analog-to-digital conversions occur in each time period, but
only the final, single value can be stored.)
Sample mode is selected automatically for video averaging and noise level.
Positive and Negative Peak Modes
Positive and negative peak modes store signal maximums and minimums, respectively, in all trace memories.
98 Manual Operation
Page 97

m
KEY FUNCTIONS
Readout
Here, the same signal response is displayed with each trace detection mode.
k!Yd
j, k, I
NORMAL
POSITIVE PEAK
SAMPLE
NEGATIVE PEAK
TRACE C
A third trace memory is available for the storage and display of trace information. Only the storage modes (view
and blank) can be used.
View C:
BlankC: (,,,
(,,,1
j
k
These are analogous to the TRACE A and B modes discussed in Chapter 5.
Trace C cannot be written into directly from the analyzer except when video averaging is used.
Trace information from B can be transferred to C. To transfer from TRACE B to TRACE C, use
B-,C:
B
b
Manual Operation 99
Page 98

(,,,,1
i, I, B, j,
m
KEY FUNCTIONS
The sweep will be suspended, the trace in memory B will be read and written into trace C from left to right in about
20 msec. Trace C is viewed. Sweeping will then resume from where suspended. The trace information in B is not
changed.
To exchange traces B and C
The trace information in B and C is interchanged point for point from left to right in about 20 msec. If trace B is not
displayed, it remains undisplayed. If trace C is not displayed, it remains undisplayed.
To store TRACE A into trace C. the trace A data must first be transferred into trace B:
press
or press m
m
(I*(rl
1 (which also erases last trace
(,.,,,1
i (which also saves last trace C in
C)
B)
Example
Comparisons of up to three different signal traces can be made simultaneously using traces A, B, and C. In this
example, the modulation level of a signal will be changed for each trace. To start, clear the display with
and
[,,,.,
B.
(,,,,
A
The signal with the desired level of modulation will be
stored in trace C:
Press
m
B and allow one sweep.
Press
(,,,,
1 which writes the trace from B into C.
Change the modulation level, allow one sweep and
store in B with m B.
To view C, press m j.
100 Manual Operation
Page 99

a
KEY FUNCTIONS
m
A, ‘2, H
Change the modulation level again and press m A,
and store with
(,,,.
A. The three traces are differenti-
.
ated by intensity.
VIDEO AVERAGING
Video averaging is a trace display routine that averages trace responses from sweep to sweep without requiring a
narrow video bandwidth. (Averaging with the video bandwidth is discussed in Chapter 8, COUPLED FUNCTION
m .)
Both video averaging and reducing video bandwidth are primarily used to improve the analyzer’s ability to
measure low-level signals by smoothing the noise response.
To activate video averaging (and sample detection mode),
G
press
(z] [??I
(DATA keyboard entry)
H
To disable video averaging, press
(,, @
CAUTION
Video averaging may result in an uncalibrated amplitude display when
frequency span
Resolution Bandwidth
Readout in the active function display area is “VID AVG
> 1000
100”.
The number represents the maximum number of
samples (or sweeps) for complete averaging. The DATA entry can be used to change the maximum sample
number in integers from 0 to 1000. A unity sample limit allows direct writing of analyzer response into Trace C (see
Trace C below). A 100 sample limit is selected upon instrument preset. The higher the sample limit, the more
smoothing possible. Averaging with high sample limits can provide more smoothing than the 1 Hz video bandwidth.
During video averaging, the current sample being taken is read out at the left of the display.
Manual Operation 101
Page 100

@G
I”;;!
KEY FUNCTIONS
The advantage of video averaging over narrowing the video filter is the ability of the user to see changes made to
the amplitude or frequency scaling of the display while smoothing the noise response. For example, when a 100
Hz video bandwidth is used with a 200
kHz
frequency span, the sweeptime is 2 sec. Almost a full sweeptime
duration would have to pass before any center frequency change effect on the trace could be seen. If video
averaging is used instead of the narrow video bandwidth, any change to center frequency will be seen immediately, even though full averaging will take roughly 6 sec. (Any change to control settings such as CENTER
FREQUENCY FREQUENCY SPAN, etc., will cause the video averaging process to be restarted.)
Example
To display very low-level signal responses, very narrow resolution and video bandwidths are required. The accompanying increase in sweep time can make measurements cumbersome. Video averaging allows the display of
level signals without the long sweep time.
RD=
“P
10 dW
-13.1
de*
.TTEN 18 dB
low-
Viewing a low-level signal with a video bandwidth of 1
Hz requires a 150-second sweep.
Disable the narrow video filter by pressing the
(wr(ll
key that is above the m key.
Start video averaging by pressing
(,.,,, h
Now the low-level signals begin to show quickly.
Changes to the frequency range or amplitude scale
will restart the sampling to show the signals quickly,
without having to wait 150 seconds. In fact, the video
averaging shown took 42 x 300 msec = 12.6 sec.
Video Averaging Algorithm
The averaging of each amplitude point depends upon the number of samples already taken and last average
amplitude.
n-l
Y”=y
_
1
’ Y(n-l) +TYn
102 Manual Operation
 Loading...