

Page 1

Advanced Test Equipment Rentals
www.atecorp.com 800-404-ATEC (2832)
®
E
s
t
a
b
l
i
s
h
e
d
1
9
8
1
About this Manual
We’ve added this manual to the Agilent website in an effort to help you support
your product. This manual is the best copy we could find; it may be incomplete
or contain dated information. If we find a more recent copy in the future, we will
add it to the Agilent website.
Support for Your Product
Agilent no longer sells or supports this product. Our service centers may be able
to perform calibration if no repair parts are needed, but no other support from
Agilent is available. You will find any other available product information on the
Agilent Test & Measurement website,
www.tm.agilent.com.
HP References in this Manual
This manual may contain references to HP or Hewlett-Packard. Please note that
Hewlett-Packard's former test and measurement, semiconductor products and
chemical analysis businesses are now part of Agilent Technologies. We have
made no changes to this manual copy. In other documentation, to reduce
potential confusion, the only change to product numbers and names has been in
the company name prefix: where a product number/name was HP XXXX the
current name/number is now Agilent XXXX. For example, model number
HP8648A is now model number Agilent 8648A.
Page 2

User and Service Guide
Publication Number 54620-97011
October 1995 (pdf version Dec 1998)
For Safety Information, Warranties, and Regulatory information,
see the pages behind the Index.
© Copyright Hewlett-Packard Company 1994, 1995
All Rights Reserved
HP 54620A/C Logic Analyzer
Page 3

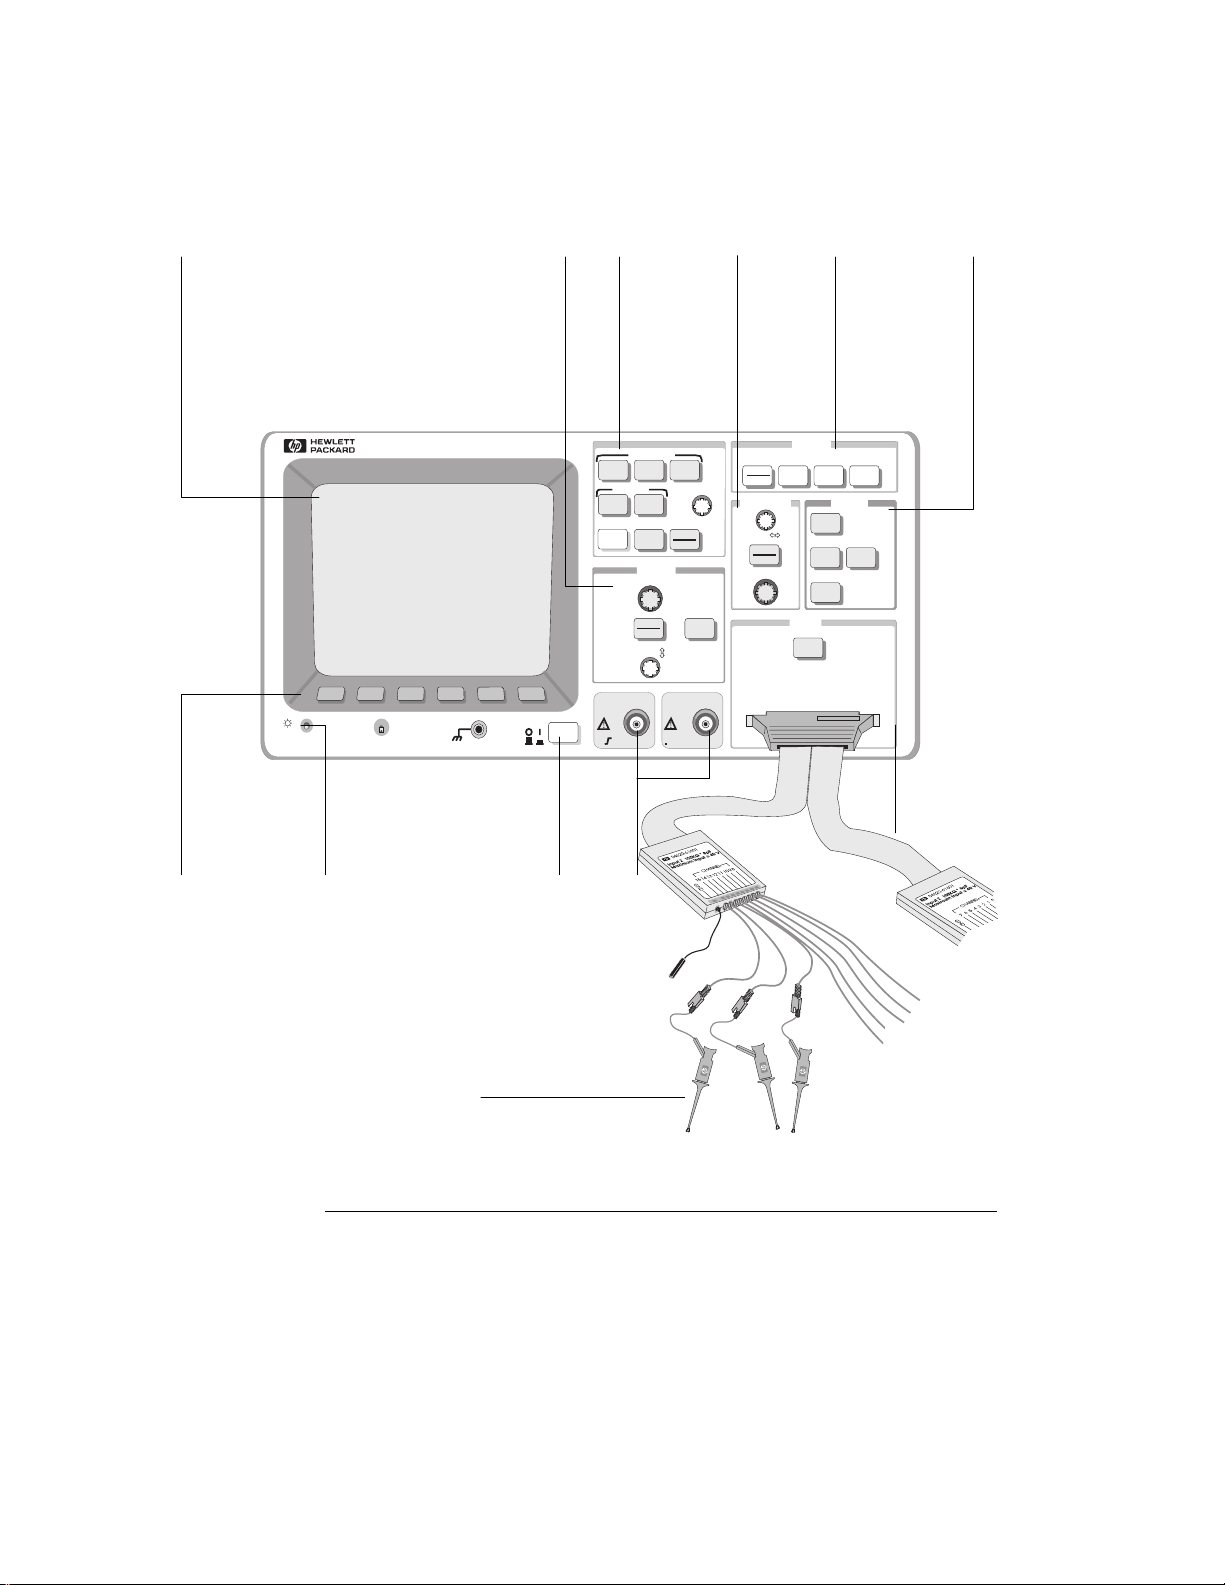
The HP 54620A/C at a Glance
Display sh ows the current input s ignals
and much more
Up to sixteen (16) channels in normal
•
or delayed m ode
Indicators f or gl i tch or normal
•
acquisition, time base, channel
activity, trigger and acquisition status
Softkey labels
•
Measureme nt results
•
Color Palettes
•
Channel Cont rols select, position, and
label in puts
Turn channels on or off individuall y
•
or in groups of 8
Rearrange order of channels to
•
group relat ed signals
Create and dis pl ay labels to ident i fy
•
channels, and set channel col ors
General Controls measure, sav e and
restore res ult s, and configure the
analyzer
Measureme nt k eys provide
•
automatic si ngle or dual-chann el
time and fre quency measurement s,
or use cursors to make manual
measurements
Save or reca l l m easurement
•
configurati ons or previous results
Autoscale performs simple
•
one-button s etup of the analyzer
Horizontal Controls select sweep speed
and delay parameters
Sweep speeds from 5 ns/div to 1 s/div
•
Delay control moves waveform
•
display to point of interest
Delayed mo de and delay allow
•
zooming in t o show a portion of
waveform in detail (split screen)
Storage Keys begin and end data
acquisition
Run/Stop start s and stops continu ous
•
acquisitions
Single perform s one acquisition
•
Autostore accum ulates and displays
•
the results of multiple acquisit i ons
(like persistence on an oscilloscope)
Erase clears the current acquisi tion
•
and all accum ul ated data
Trigger Keys define what data will be
captured by th e analyzer
Edge mode all ow s triggering on a
•
positive or negative edge (or both) of
any single channel
Pattern mode a l l ow s triggering on a
•
pattern of cha nnel s either high, lo w ,
or don’t care , w i th a single edge
qualifier
Advanced mode allows sequential
•
triggers, c om bi ned patterns, patte rns
and edges, p att ern durations, and
edge occurre nce counts
Softkeys extend the functionality of
command keys
Select measurement types, operating
modes, trigger specifications, l abel data,
and more
Trigger Input/Output
Trigger the HP 54620A/C from other
instruments or use the HP54620A/C to
trigger other i nstruments
Channel Inputs through a flexible
probing system
Sixteen chan nel s through a dual
•
8-channel c abl e w i th micro-grabbers
Set logiclevel s as TTL, CMOS , EC L, or
•
to a user-def i nabl e voltage
2
Page 4
Display Channel
Controls
General
Controls
Horizontal
Controls
Storage
Keys
Trigger
Keys
Softkeys
54620A
16 CHANNEL 500 MSa/s
Brightness
Control (for
HP 54620A
only)
LOGIC ANALYZER
Line
Power
Single
channel
Trace
Auto
scale
Trigger out
~5V
ov
Trigger
Input /
Output
Measure time
Save/Recall
Dual
channel
Setup
Display
CHANNEL
Select
On
Off
Position
Cursors
Print
Utility
150
Ext trigger in
1 MQ
+
40 V Max
STORAGE
Run
Single
Auto-
Erase
Stop
Entry
HORIZONTAL
Delay
Main
Delayed
Time/Div
Label
store
TRIGGER
Edge
Mode
Pattern
Adv
5 ns1 s
INPUTS
Logic
levels
Channel
Inputs
Micro-grabbe rs
3
Page 5

In This Book
The
HP 54620A/C User and Service Guide
features of the Logic Analyzer in the design and troubleshooting of digital
system circuitry.
Chapter 1
basic measurements. It also gives an overview of basic analyzer operational
concepts including use and interpretation of the front panel and display.
Chapter 2
instrument configuration features, measure waveform data, control data
acquisition, examine captured data in more detail, set up analyzer trigger
conditions, and shows how to use the analyzer with other instruments.
Chapter 3
kinds of problems that might occur when you begin operating the analyzer.
Chapter 4
between the analyzer time base and other time-dependent functions,
discusses the effect of probes on measurement accuracy, and explains the
glitch detection system. After you have made a few measurements with the
HP 54620A/C, it is a good idea to read this chapter.
Chapter 5
explains how to test the HP 54620A/C to ensure that it operates correctly.
The chapter also shows how adjust and troubleshoot the analyzer.
Chapter 6
various assemblies in the analyzer. The chapter also lists the replaceable
parts for the analyzer and gives ordering information.
Chapter 7
performance standards to which the instrument is tested.
Chapter 8
displayed by the analyzer, explains their causes, and tells what to do to
correct the problem.
If you want to automate HP 54620A/C measurements using a programmable
controller such as an IBM-compatible PC or an HP 9000 Series 700 controller,
see the
Programmer’s Reference
help file on a 3.5" diskette. The diskette includes a help file viewer for
Microsoft Windows 3.1, and Microsoft Write editor versions of the files. ASCII
files are also supplied.
, “Getting Started,” explains how to set up the analyzer and make
, “Making Analyzer Measurements,” shows you how to use the
, “Solving Problems,” shows you how to fix the most common
, “Ensuring Accurate Measurements,” explains the relationships
, “Testing, Adjusting, and Troubleshooting the Logic Analyzer,”
, “Replaceable Parts,” explains how to remove and replace the
, “Performance Characteristics,” lists the measurement
, “Messages,” lists the status and error messages that may be
HP 54620A/C Programmer’s Guide
. The
Programmer’s Reference
is your guide to using the
and the
HP 54620A/C
is supplied as a
4
Page 6
Getting Started
1
Making Analyzer
2
Measurem ents
Solv ing Proble ms
3
Ensuring A ccurate
4
Measurem ents
Testing, A djusting, and
5
Troubleshooting the Analyzer
Replaceab le Parts
6
Performance Characteristics
7
Messages
8
Glossary
Index
5
Page 7

6
Page 8

Contents
1 Getting Started
Preparing the Analyzer 21
To check package contents 22
To check optional accessories 24
To power-on the logic analyzer 27
To adjust the handle 28
To adjust display brightness 29
Using Color 30
To select the color palettes and observe colors 31
To assign colors to channels 33
To print in color 34
Making Measurements 35
Learn the front panel 35
To probe a circuit 42
To set up an acquisition using Autoscale 44
To start and stop an acquisition 46
To define a simple edge trigger 47
To adjust the time base (sweep speed) 48
To turn channels on and off 49
To rearrange the channels 50
2 Making Analyzer Measurements
Setting Logic Levels 53
To change the logic threshold for input signals 54
Controlling Data Acquisition 55
To take a single acquisition 56
To use Auto Glitch Detect 57
To accumulate the results of every acquisition 58
To erase the waveform display 58
7
Page 9

Contents
Using Labels 59
To turn the label display on or off 59
To assign a label to a channel 60
To define a new label 62
To initialize the label list 64
Triggering the Analyzer 65
Trigger types 65
To define the trigger mode 70
To define an edge trigger 72
To define a pattern trigger 73
To define an advanced trigger 74
Examining the Captured Data 80
Viewing acquired data with delayed sweep 80
To show both main and delayed sweep displays 82
To change the time reference position 83
To pan the display 86
To modify the graticule 87
To print the display 88
Measuring Waveform Data 89
Ways to measure data 89
To use the cursors 94
To measure waveform parameters on a single channel 96
To measure channel-to-channel delay 98
To measure setup time 100
To measure hold time 102
Using the Analyzer with Other Instruments 104
Extending trigger capabilities 104
To use the external trigger input 108
To use the trigger output 110
8
Page 10

Saving and Recalling the Configuration 111
Using memories to save and recall configurations 111
To save a trace waveform 114
To recall a trace waveform 115
To clear a previously saved trace 116
To save the instrument setup 117
To recall the instrument setup 118
To reset the instrument setup 119
3 Solving Problems
If there is no trace display 123
If the trace display is unusual or unexpected 124
If you can’t see a channel 125
Contents
4 Ensuring Accurate Measurements
Time base and Acquisition 129
Probing the Circuit Under Test 139
Glitch Detection 143
5 Testing, Adjusting, and Troubleshooting the Analyzer
Testing the Analyzer 151
To perform self-tests 152
To test the keyboard 153
To test the display 154
To test the acquisition system 154
Building Test Accessories 155
To make the test connectors 156
To make the dummy load 158
9
Page 11

Contents
Adjusting the Logic Analyzer 159
To adjust the power supply 160
To adjust the display (HP 54620A only) 162
Troubleshooting the Logic Analyzer 164
To troubleshoot the logic analyzer 165
To check the LVPS 168
Testing Threshold Accuracy 169
Step 1. To set up the equipment 170
Step 2. To connect the logic analyzer 171
Step 3. To test the thresholds 172
Testing Time Interval Accuracy 173
Step 1. To connect the logic analyzer 174
Step 2. To set up the equipment 175
Step 3. To set up the logic analyzer 176
Step 4. To make the measurement 177
6 Replaceable Parts
Removing and Replacing Assemblies 181
To remove the cabinet 182
To remove the fan 183
To remove the front panel 184
To remove the display 185
To remove the system board 186
To remove the power supply 187
To remove the keyboard 188
To remove the handle 189
Replaceable Parts 190
To order a replacement part 191
10
Page 12

7 Performance Characteristics
8 Messages
Messages 209
Contents
Glossary
Index
217
225
HP 54620 Documentation
239
11
Page 13

12
Page 14

Figures
Figure 1. Using the Logic Analyzer 19
Figure 1A. Refining the Trigger Specification 20
Figure 2. Items Supplied with the HP 54620A/C Logic Analyzer 23
Figure 3. Optional Accessories for the HP 54620A/C Logic Analyzer 25
Figure 4. HP 54620A Brightness Control 29
Figure 5. HP 54620C with Label Menu Selected and Single Channel
Highlighted 34
Figure 6. HP 54620A Logic Analyzer Front Panel 36
Figure 7. HP 54620A/C Display 38
Figure 8. Sample Autoscale Measurement 44
Figure 9. Edge Trigger on Channel 0 47
Figure 10. Logic Threshold Setup 53
Figure 11. Waveform Display with Auto Glitch Detect Enabled 57
Figure 12. HP 54620A/C Label Definition Display 61
Figure 13. Pattern Trigger Setup 67
Figure 14. Advanced Trigger Setup (with Overview On) 68
Figure 15. Advanced Trigger Softkeys for Operators with Two Sources 69
Figure 16. Acquisition Memory 70
Figure 17. Pulse Train with Constant-Duration Pulse 77
Figure 18. Sequential Output from State Machine 77
Figure 19. System Failure on Third Keystroke 78
Figure 20. Delayed Sweep 81
Figure 21. Time Reference at Center, Delay of 15 µs on Main Sweep 84
Figure 22. Delayed Sweep with Delay of 8 µs 85
Figure 23. Measuring the Period of an Irregular Waveform 90
Figure 24. Single-Channel Measurements 91
Figure 25. Channel-to-Channel Delay Measurement 92
Figure 26. Measurement Within the Delayed Sweep Window 93
Figure 27. Setup Time Measurement 101
Figure 28. Hold Time Measurement 103
Figure 29. Connections for External Trigger from an Emulator 105
Figure 30. Connections for External Trigger using an Oscilloscope Probe 106
Figure 31. Connections for Triggering an Oscilloscope 107
Figure 32. Using the External Trigger Input as an Edge Trigger 109
13
Page 15

Contents
Figure 33. Trace Memory Save/Recall 112
Figure 34. Setup Memory 113
Figure 35. Relationship Between Time base and Analyzer Functions 129
Figure 36. Acquisition Memory 131
Figure 37. Memory Bar 132
Figure 38. Single Acquisition, Time Reference Center, Positive
Delay of 75 µs 134
Figure 39. Panning the Display to View the Start of Acquisition 135
Figure 40. Single Acquisition, Time Reference Right, Negative
Delay of 80 µs 136
Figure 41. Panning the Display to View the Trigger Point 137
Figure 42. DC and Low-Frequency Probe Equivalent Circuit 139
Figure 43. High-Frequency Probe Equivalent Circuit 140
Figure 44. Impedance versus Frequency for Both Probe Circuit Models 140
Figure 45. Common Mode Input Voltage Model 141
Figure 46. Glitch Display 144
Figure 47. Aliasing 144
Figure 48. Reconstruction of Waveform with Glitch Capture 145
Figure 49. Waveform Display with Sampling Rate Too Low 146
Figure 50. Waveform Display with Sufficient Sampling Rate 147
Figure 51. Data Output Relative to Clock 148
Figure 52. 8-by-2 Connector Setup 156
Figure 53. 1-by-2 Connector Setup 157
Figure 54. Power Supply Adjustment 161
Figure 55. Display Adjustment 163
Figure 56. Threshold Test Setup 171
Figure 57. Time Interval Accuracy Setup 174
Figure 58. Front Panel Removal 184
Figure 59. Unhooking the Power Switch Shaft 187
Figure 60. Exploded View of Logic Analyzer 192
14
Page 16

Tables
Table 1. Power Cords 26
Table 2. Color Palettes and Mapping of Colors to Display Components 32
Table 3. Threshold Voltage Settings 54
Table 4. Trigger Operators and Sources 75
Table 5. Readout Settings 95
Table 6. HP 54620A/C Factory-Preset Default Configuration Settings 119
Table 7. Sweep Speed and Sampling Interval 130
Table 8. Materials Required (Making Test Connectors) 156
Table 9. Equipment Required (Adjusting Power Supply) 160
Table 10. Equipment Required (Adjusting Display) 162
Table 11. Equipment Required (Troubleshooting Logic Analyzer) 164
Table 12. Display Signals 166
Table 13. Equipment Required (Testing Threshold Accuracy) 169
Table 14. Threshold Test Settings 172
Table 15. Equipment Required (Testing Time Interval Accuracy) 173
Table 16. HP 54620A/C Replaceable Parts 193
Table 17. Input channels 197
Table 18. Horizontal System 198
Table 19. Acquisition System 199
Table 20. Trigger System 200
Table 21. Display System 202
Table 22. Measurement Functions 202
Table 23. Setup Functions 203
Table 24. Power Requirements 203
Table 25. General Characteristics for HP 54620A Only 204
Table 26. General Characteristics for HP 54620A and HP 54620C 205
Table 27. General Characteristics for HP 54620C Only 206
15
Page 17

16
Page 18

1
Getting Started
Page 19

Getting Started
When you use the logic analyzer to help test and troubleshoot your
systems, you will follow the general process shown in figure 1:
• Prepare the analyzer by connecting it to power and setting up the
handle and screen brightness as desired.
• Define the measurement problem by understanding the parameters
of the system you wish to test and the expected system behavior.
• Set up channel inputs by connecting the data probes to the
appropriate signal and ground nodes in the circuit under test.
• Define the trigger condition by setting the analyzer configuration to
capture only the system events you wish to view.
• Use the analyzer to acquire data, either in continuous or single-shot
fashion.
• Examine the data and make measurements on it using various
analyzer features.
• Save the measurement or configuration for later re-use or
comparison with other measurements.
The process is repeated as necessary until you verify correct
operation or find the source of the problem.
18
Page 20
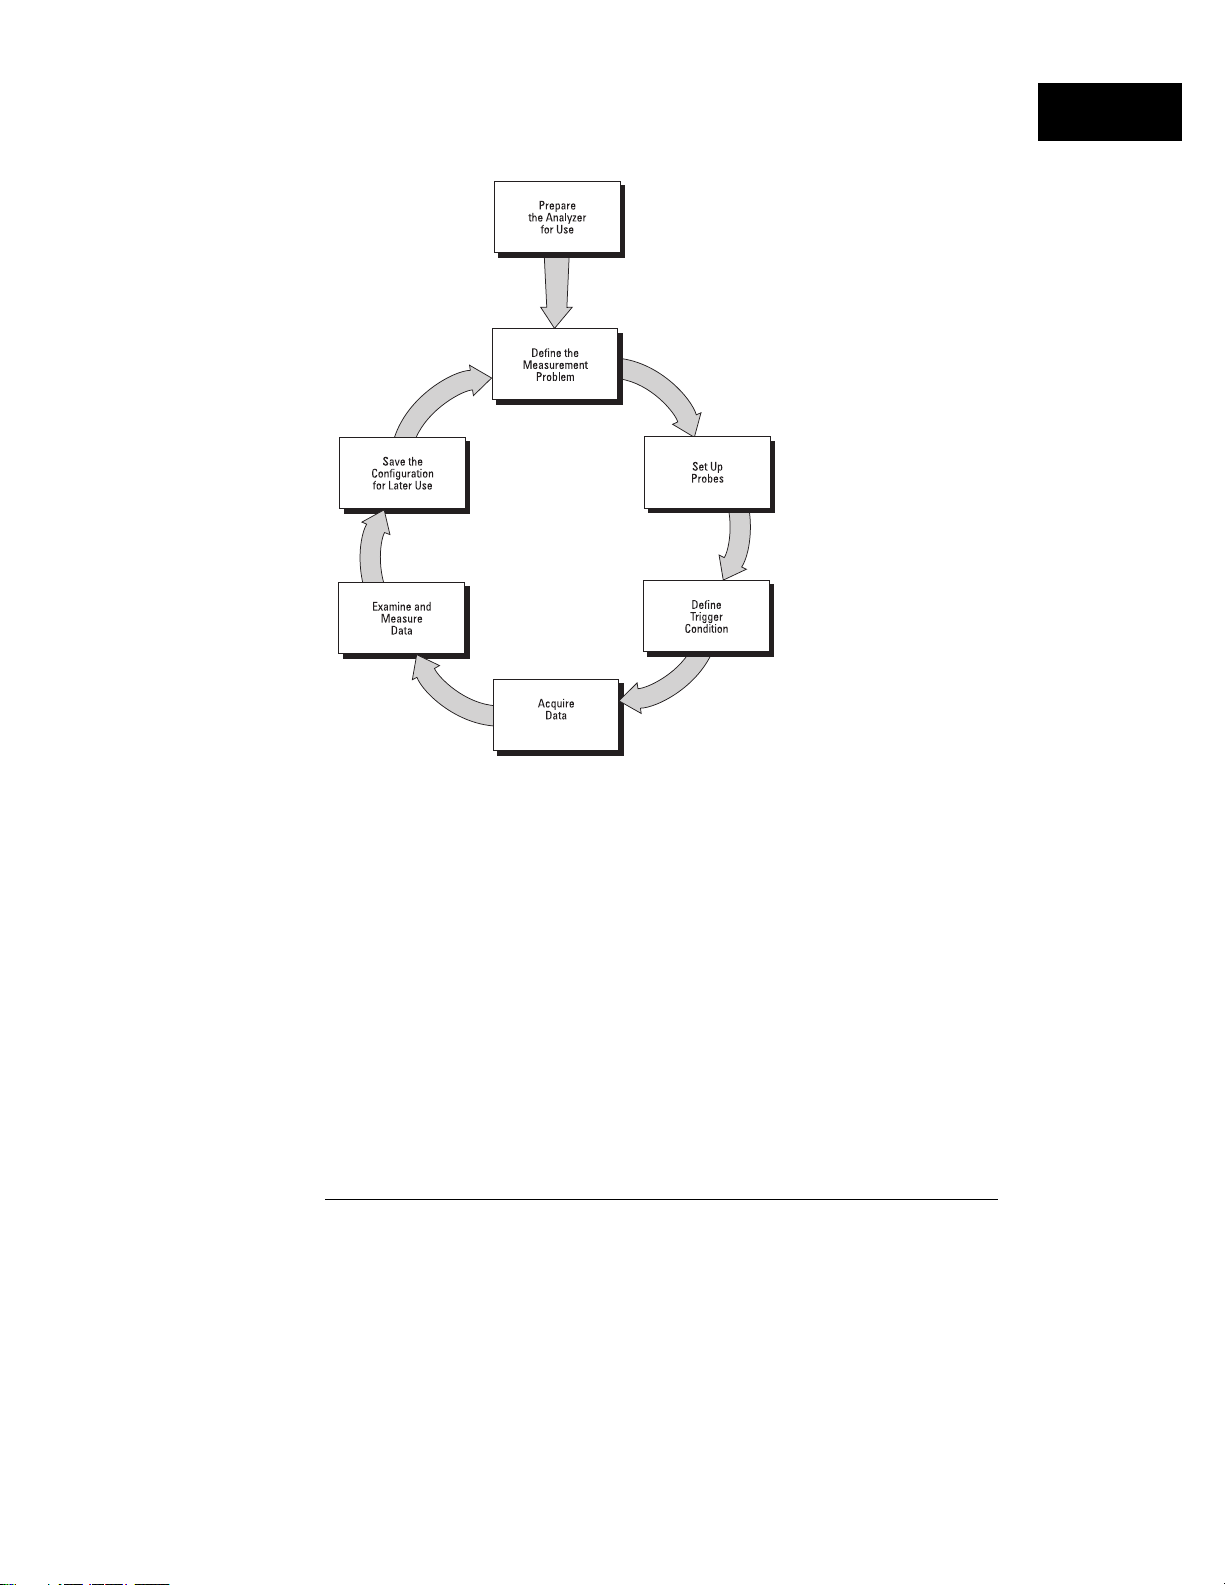
Figure 1
Getting Started
Using the Logic Analyzer
19
Page 21
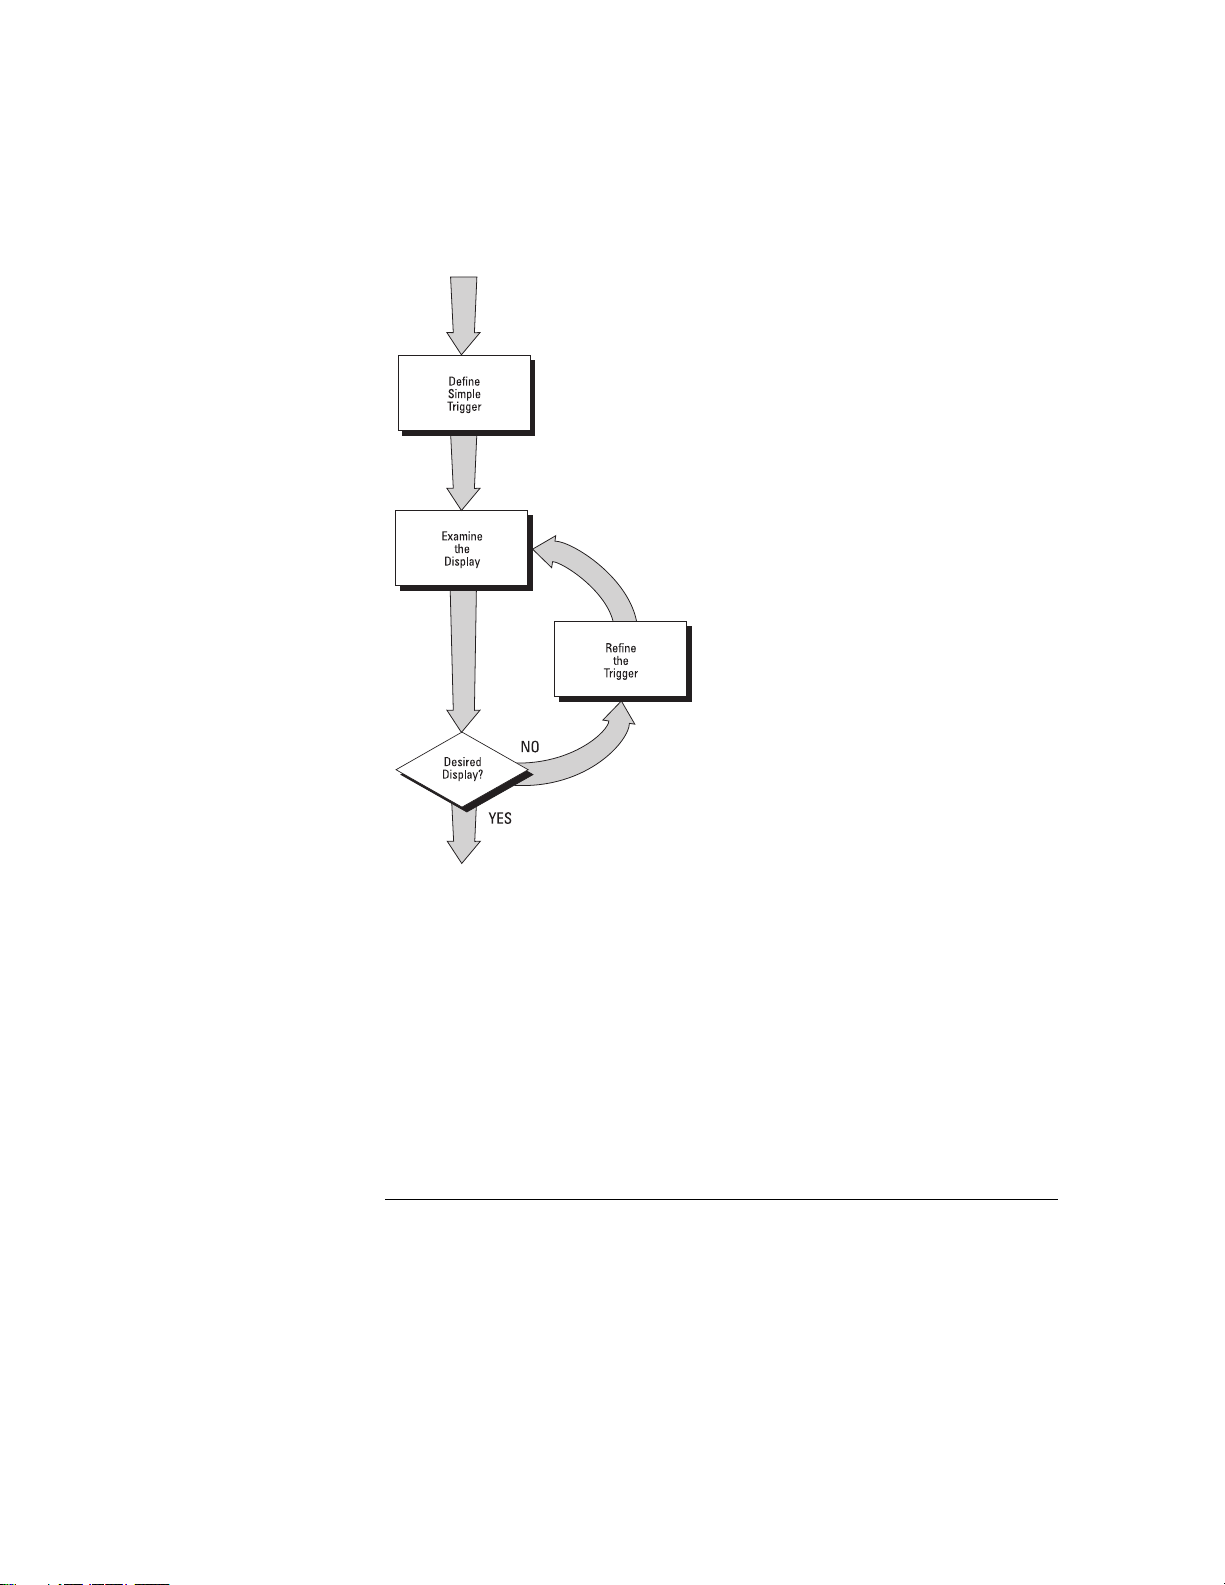
Figure 1A
Getting Start ed
The high-speed display of the HP 54620A/C can be used to isolate
infrequently changing signals. You can then use the characteristics of
these signals to help refine the trigger specification. See the figure
below.
Refining the Tr i gger Specification
This chapter discusses analyzer preparation and probe setup, and
contains a general introduction to trigger definition and data
acquisition. For more information on triggering, data acquisition, data
examination and measurement, and configuration, see chapter 2,
“Making Analyzer Measurements.”
20
Page 22

Preparing the Analyzer
To prepare your logic analyzer for use, you need to do the following:
1
Check to ensure that you received everything that is supplied with
the analyzer.
2
Connect the analyzer to power and switch it on.
3
Connect the probe cable to the analyzer and connect probes to the
circuit of interest. (You can use the front panel calibration test point
as a stimulus while learning to use the analyzer.)
The following pages show you how to do each of these tasks. After you
have completed them, you will be ready to use the analyzer.
21
Page 23

Getting Start ed
To check pack age contents
To check package contents
•
Verify that you received the following items in the HP 54620A/C
packaging.
See figure 2. If anything is missing, contact your nearest Hewlett-Packard
Sales Office. If the shipment was damaged, contact the carrier, then contact
the nearest Hewlett-Packard Sales Office.
HP 54620A/C Logic Analyzer.
Power cord (see table 1).
HP 54620-61801 16-channel probe cable.
HP 5090-4356 grabbers (in resealable plastic bag; quantity 20).
HP 5959-9334 2" ground lead set (quantity 5).
HP 54620A/C User’s Guide.
HP 54620A/C Programmer’s Guide.
HP 54620A/C Programmer’s Reference (3.5" diskette).
22
Page 24

Figure 2
HP 54620A/C
Logic Analyzer
HP 54620-61801
16-Channel Cable
(leads attached; with labels)
Getting Started
To check pac kage contents
!
HP 5959-9334
2" Ground Lead Set (5)
Power Cord
(Varies depending on country)
HP 5090-4356
Grabber (20)
HP 54620A/C User's Guide
HP 54620A/C Programmer's Guide
Items Supplied with the HP 54620A/C Logic A nal yzer
HP 54620A/C
Programmer's Reference
pkg-cnts.cdr
23
Page 25

Getting Start ed
To check optional accessories
To check optional accessories
•
Verify that you received the optional accessories you ordered.
See figure 3. If anything is missing, contact your nearest Hewlett-Packard
Sales Office. If the shipment was damaged, contact the carrier, then contact
the nearest Hewlett-Packard Sales Office.
Option 101—Front panel dust cover and accessory pouch.
Option 103—HP 54654A Operator’s self-paced Training Kit, including
case, manual, and circuit board with battery.
Option 104—HP 5041-9409 Carrying Case (useful for protecting the
instrument in shipment or when checked as airline baggage).
Option 106—HP 34801A BenchLink software for Microsoft Windows
(provides an interface to the instrument from any Windows-compatible
PC, allowing the user to save and restore setups and capture
measurements for further review).
Option 001—RS-03 Magnetic Shielding for CRT (HP 54620A only)
(not shown in figure 3).
Option 1CM—Rackmount kit (allows mounting the HP 54620A/C in an
EIA-standard rack). This kit is not shown in figure 3.
24
Page 26
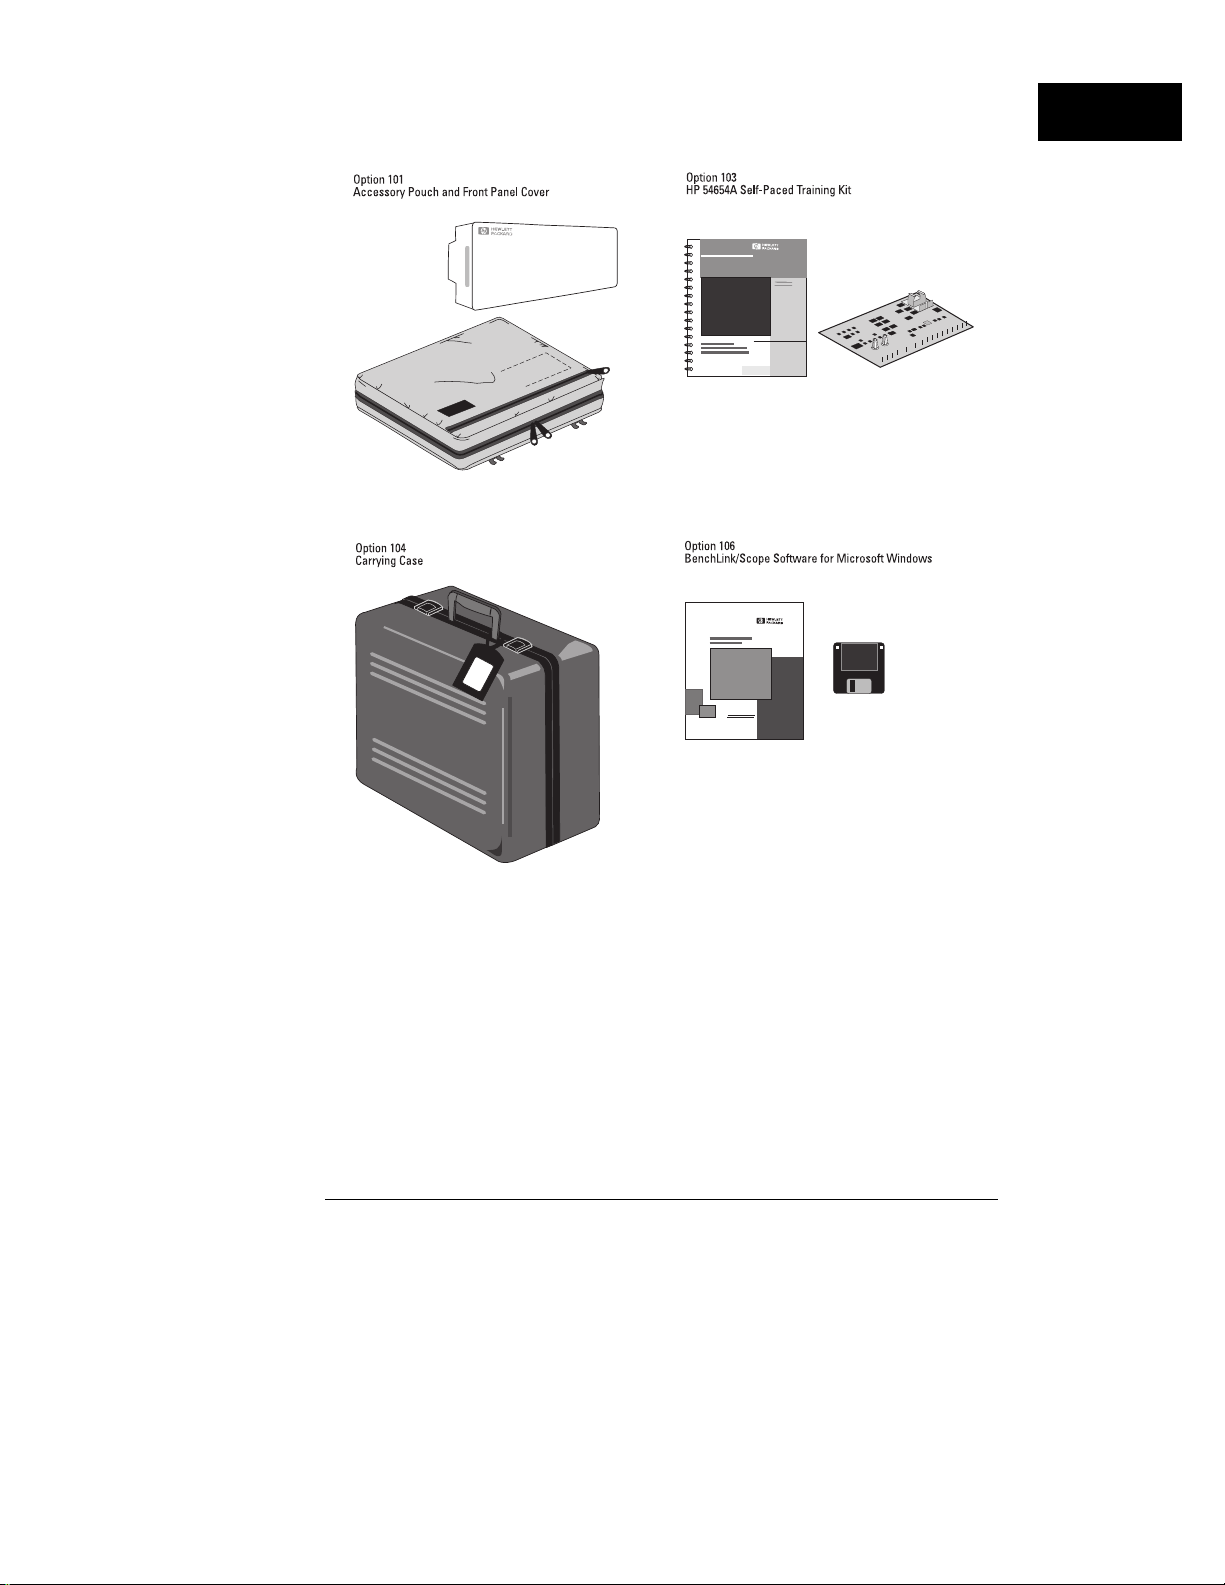
Figure 3
Getting Started
To check optional accessories
Optional Accessories for the HP 54620A/C Logic Analyzer
25
Page 27

Table 1
Power Cords
Getting Start ed
To check optional accessories
Plug Type Cable Part
No.
Opt 903 (U.S.A.)
124V **
Opt 900 ( U.K.)
250V
Opt 901 (A ustralia)
250V
Opt 902 (Eur ope)
250V
Opt 906 (S w i tz erland)
250V
Opt 912 (D enm ark)
220V
8120-13 78 Straight (NEMA5-15P*) 90/228 Jade Gray
8120-1351 Straight (BS136A*) 90/228 Gray
8120-1369 Straight
8120-1689
8120-2857
8120-2104 Straight (SEV1011*) 79/200 Mint Gray
8120-29 57 Straight (DHCK107*) 79/200 Mint Gray
Plug Description Length
in/cm
(NZSS198/ASC*)
Straight (CEE7-Y11*)
Straight (S hi el ded)
79/200 Gray
79/200
79/200
Color
Mint Gray
Coco Brown
Opt 917 (Africa)
250V
Opt 918 (Japan)
100V
* Part number shown for plug is industry identifier for plug only.
Number shown for cable is HP part numb er for comple te cable including plug.
** These cords are included in the CSA certi fication approval for the equipment.
8120-4600 Straight (SABS164) 79/200 Jade Gray
8120-4753 Straight Miti 90/230 Dark Gray
26
Page 28
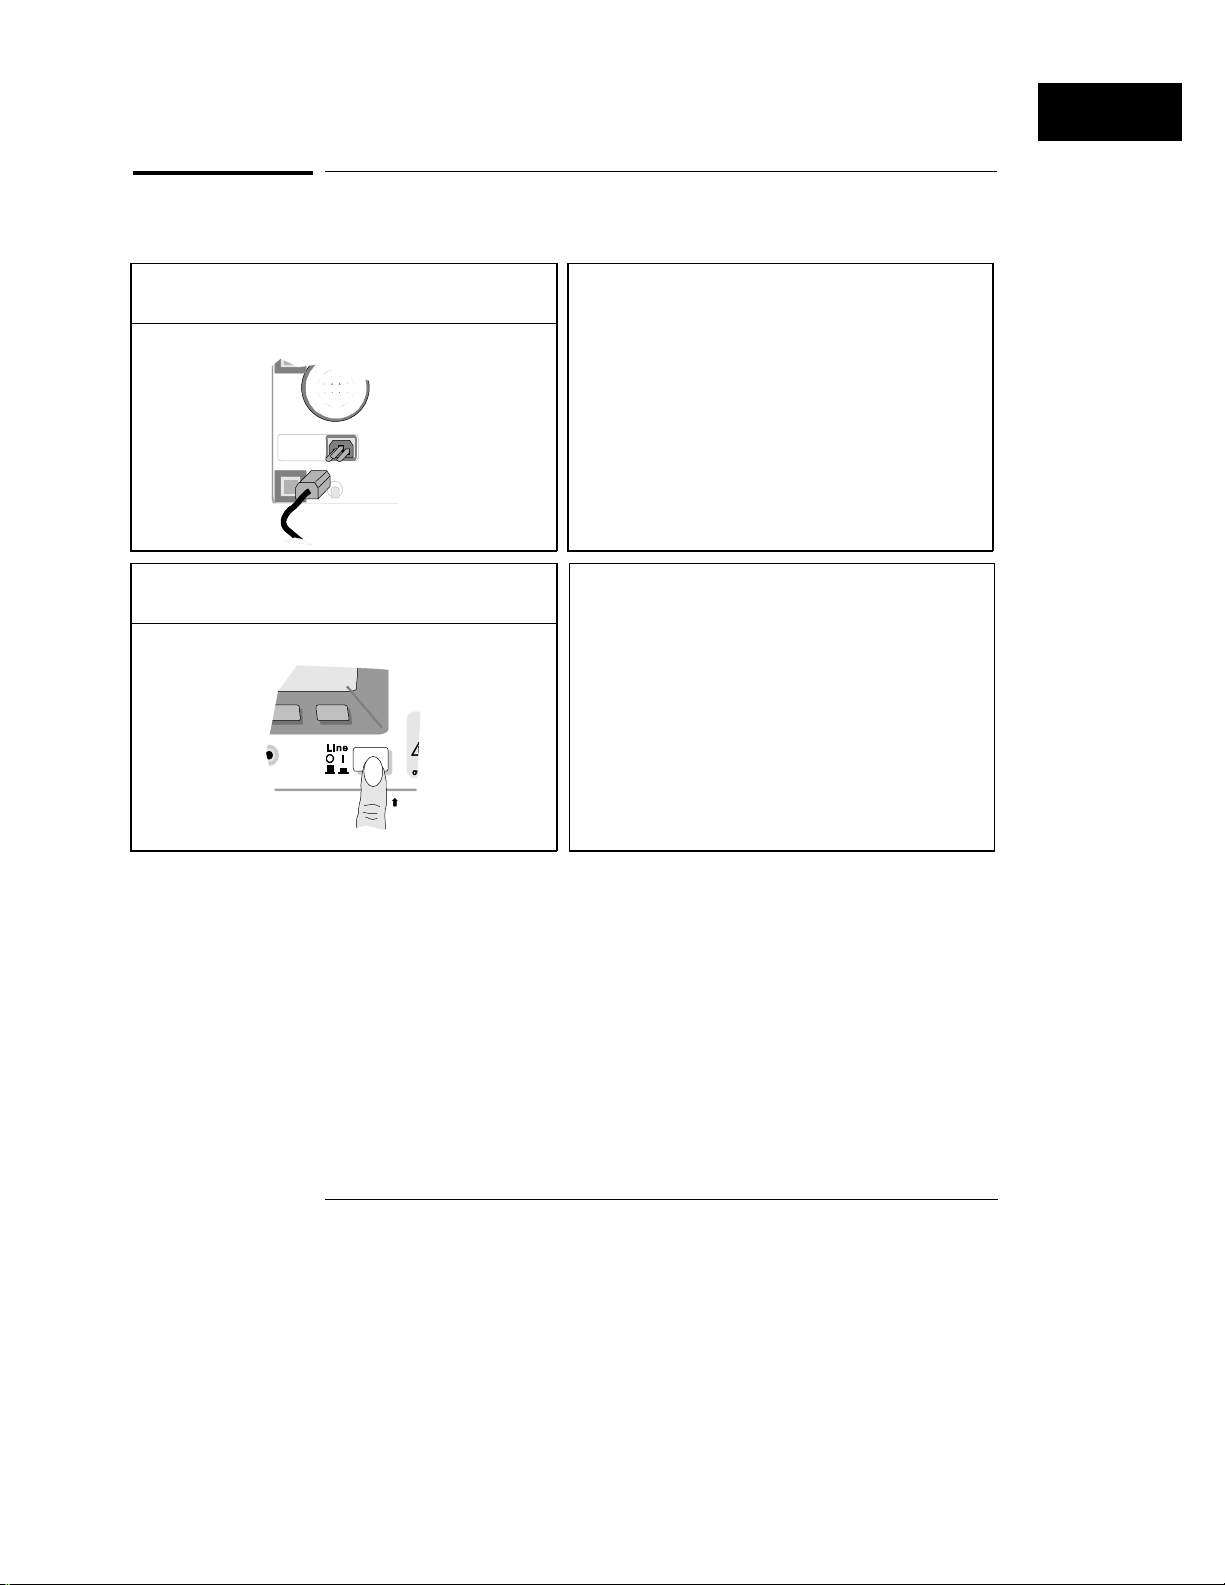
To power-on the logic analyzer
1
Connect the power cord to the rear of the
HP 54620A/C, then to a suitable ac voltage source.
2
Press the power switch.
Getting Started
To power-on the logic analyzer
The HP 54620A/C power supply
automatically adjusts for input line voltages
in the range 100 to 240 VAC. Therefore, you
do not need to adjust the input line voltage
setting. The line cord provided is matched
by HP to the country of origin of order.
Ensure that you have the correct line cord.
See table 1.
The HP 54620A/C performs a self-test, then
shows the display. The instrument is ready
to use.
27
Page 29
Getting Start ed
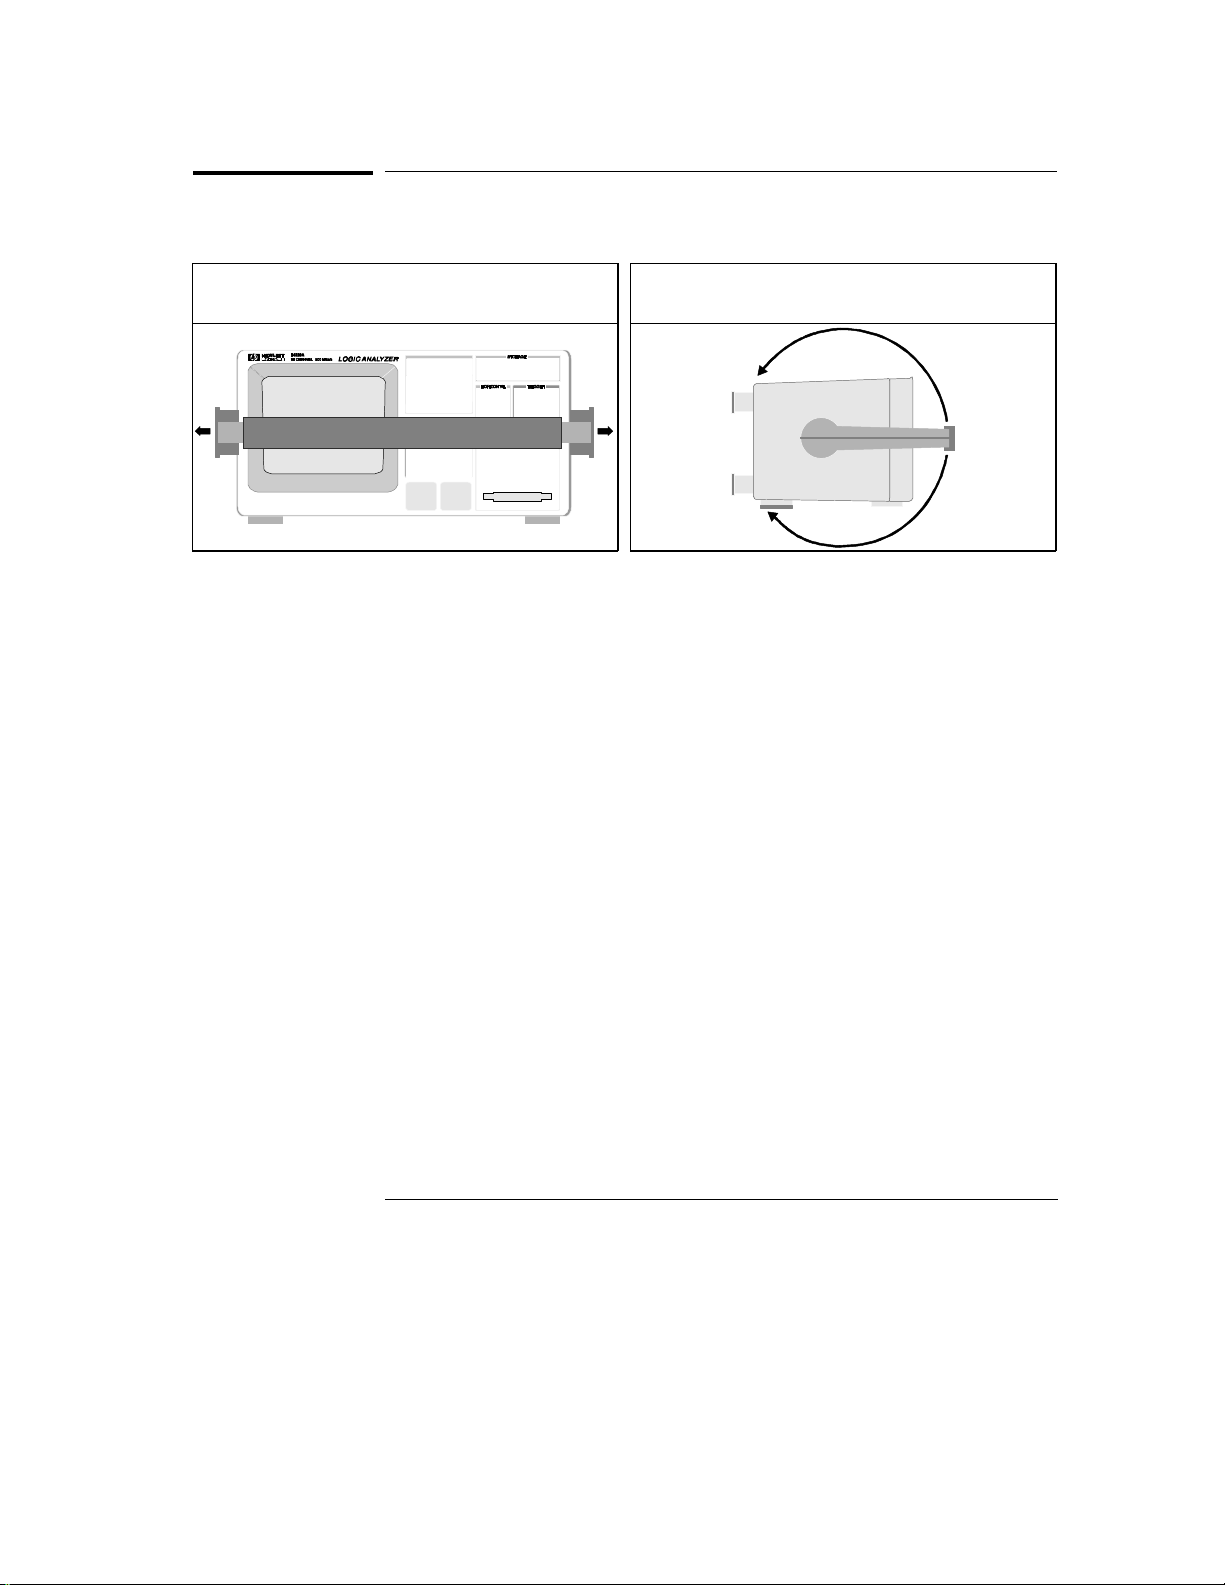
To adjust the handle
To adjust the handle
1
Grasp the handle pivot points on each side of the
instrument and pull the pivot out until it stops.
2
Without releasing the pivots, swivel the handle to
the desired position. Then release the pivots.
28
Page 30

Figure 4
Getting Started
To adjust d is play brightness
To adjust display brightness
•
To decrease display brightness, rotate the brightness control
counterclockwise.
•
To increase display brightness, rotate the brightness control
clockwise.
The brightness control is at the lower left corner of the display. See figure 4.
HP 54620A Brightness Control
The "A" model includes a brightness control. There is no brightness control
on the HP 54620C.
29
Page 31

Using Color
With the HP 54620C color logic analyzer, you can select any of the
seven available color palettes to assign colors to channels, cursors,
stored waveforms, and text. You can assign each channel one of four
waveform colors.
The seven color palettes allow additional customization, which allows
you to easily distinguish between channel waveforms. In addition,
when making measurements on a channel, wherever the channel
number appears on screen, it is highlighted in the selected color.
The color palettes are individually named, and you can choose the
palette that best suits your needs. You can change from the Default
palette to any of the following:
• Alternate 1 works well for people who are colorblind.
• The colors in Alternate 2 are compatible with those used in
HP 545XX-series oscilloscopes.
• Alternate 3 sets the cursors to yellow.
• Inverse 1 works well for hard copies.
• Inverse 2 works well for overhead transparencies.
• A Monochrome palette is also available.
In each palette, different colors are used for cursors, waveforms,
softkeys, and Autostore. The background is always black, unless you
select the Inverse palettes, which use a white background. Softkeys
and the grid are always in white, except in the Inverse palettes, which
set them to black.
This section shows you how to:
Select the color palettes and observe colors
•
Assign colors to channels
•
Print in color
•
30
Page 32

To select the color palettes and observe colors
To select the color palettes and observe colors
Getting Started
Press
Displa y
The name of the palette appears under the softkey. For example, Default.
Press the
Palette
. Look at the
softkey. Continue to cycle through the palettes
1
2
Palette
softkey.
and observe colors applied to the cursors, waveforms, and softkeys.
Notice that the softkeys are white in all palettes, except the Inverse palettes,
where they are black.
3
Press the
The graticule is always white, except in the Inverse palettes, where it is black.
4
Press
A single color shows cursors in the display area, the active cursor selected,
and the cursor measurement Time and Hex readouts.
5
Press
The current measurement readout is displayed in the cursor color whenever
the Show Meas softkey is On in single-channel measurement Next Menu, or
in the dual-channel measurement menu. You can toggle the Show Meas keys
and see the current measurement change between the cursor color and white.
6
Press
The autostored waveforms are displayed in blue when using the Default and
Alternate color palettes, and in cyan in the Inverse color palettes.
7
Press
Grid
softkey and set the grid to
Cursor s
Single channel
Autost or e
Autost or e
. Press
.
to turn it off. Then press
Active Cursor t2
. Press the
Full
.
Freq
softkey, then
.
Erase
Period
.
.
Press
Edge
The activity indicator for each channel is displayed is in the same color
assigned to the channel. Channel indicators for channels not displayed are
white, except in the Inverse palettes, where they are black. If you define an
edge trigger, the channel and trigger edge are displayed in the channel color
in the upper-right corner of the screen.
. Look at the channel activity indicators.
Rotate the Select knob to cycle through through the channels.
The channel number and corresponding activity indicator are both
highlighted in the color applied to the channel. For a channel not displayed
on the screen, as you rotate the Select knob, that channel number appears in
the upper-left corner in the same color applied to the corresponding selected
activity indicator.
8
9
31
Page 33

Getting Start ed
To select the color palettes and observe colors
The following table shows the color palettes and the palette colors mapped to
the display components.
Table 2
Color Palettes and Mapping of Colors to Display Components
Palette Color Display
Component
Default
Alternat e 1
Alternate 2
green
yellow
magenta
cyan
red
white
white
blue
black
red
cyan
yellow
magenta
green
white
white
blue
black
cyan
yellow
green
magenta
red
white
white
blue
black
cursors
waveform1
waveform2
waveform3
waveform4
softkeys
graticule
autostore
background
cursors
waveform1
waveform2
waveform3
waveform4
softkeys
graticule
autostore
background
cursors
waveform1
waveform2
waveform3
waveform4
softkeys
graticule
autostore
background
Palette Color Display
Component
Alternat e 3
Inverse 1
Inverse 2
yellow
magenta
cyan
green
red
white
white
blue
black
cyan
red
blue
green
magenta
black
black
cyan
white
black
red
blue
magenta
green
black
black
cyan
white
cursors
waveform1
waveform2
waveform3
waveform4
softkeys
graticule
autostore
background
cursors
waveform1
waveform2
waveform3
waveform4
softkeys
graticule
autostore
background
cursors
waveform1
waveform2
waveform3
waveform4
softkeys
graticule
autostore
background
In the monochrome palette, all of the display components are in white, except the background, which is black.
32
Page 34

To assign colors to channels
Getting Started
To assign colors to channels
Press
Label
The single channel softkey is highlighted in color. This softkey is used to
assign one color to a single channel. The softkey just to the left is used to
assign one color to a group of channels. The activity indicator for each
displayed channel has the same color assigned to the channel.
. Look at the
Press the single channel softkey, labeled
1
2
Assig n Ch an ne l Colors
X CHXX
(where X is the
softkeys.
selected channel number). Press it again, and rotate the Select knob
to cycle through the channels and select the one you want.
Pressing this softkey increments the channel number.
Press
Next Color
.
3
The channel highlights in the selected color. Continue to set as many
channels to the colors you want.
4
5
Chan 0-3
Press
it changes to
If all four channels in a group are assigned the same color, the softkey shows
that color when you select it. If the channels in the group vary in color, the
softkey is white.
Next Color
Press
. The softkey highlights. Press it a few more times and
Chan 4-7, Chan 8-11
, and
Chan 12-15
.
. Continue to press this softkey to view the
waveform colors currently available.
The channel group softkey appears in the selected color, and the channels in
the group, if displayed on the screen, also display in the selected color.
Changing the color for a channel group will change the color for all channels
in the group, even if not all of the channels are displayed on the screen.
Colors Coord inate to Display Activity and Selections
When using colors on the HP 54620C color Logic Analyzer, all of the activity for a
specific cha nnel , i ncluding the channel color assignment softkey, chann el
waveform, channel activity in di cator, and trigger condition indicato r (when
defined for the s am e channel) are displayed in the same col or on screen.
The following figure shows the HP 54620C with the Label menu selected and
the Assign Channel Colors softkeys displayed.
33
Page 35

Getting Start ed
To print in color
Figure 5
Channel
labels
Channel
activity
indicator
Softkeys
HP 54620C w ith Label Menu Selected and Single Channel Hi ghl ighted
Trigger condi tion
To print in color
1
Press
Steps 2-4 are valid if you are using the HP 54652B Interface Module. The
HP 54652B is the recommended module for non-HP-IB applications. The
HP 54659B will function as a hardcopy and computer I/O, but none of its
advanced features are active in the logic analyzer. The HP 54652B and
HP 54659B each have dual interfaces (a parallel port and RS-232). If you are
using these modules, you can set the Destination to either Parallel or RS232.
Because there are no color printers with an HP-IB Interface, the HP 54650A
module is not recommended for color printing.
2
Press
This selects the HP DeskJet Color Printer format.
3
Set the Destination to
4
Press
The current display will be sent out the parallel port to the HP DeskJet color
printer attached to your logic analyzer, and printed in color.
34
Print
Hardcopy Menu
Previous Menu
.
. Then press
Parall el
.
. Then press
Format
Print Sc re en
until it displays
HP DJCo lor
.
.
Page 36

Making Measurements
To make measurements using the HP 54620A/C, you set up the
instrument using front-panel controls, then read the display results.
Learn the front panel
The HP 54620A front panel is shown in the following figure. The HP 54620C
differs only in that it does not have intensity control.
Front-Panel Functions
The front panel has several functional groups:
Display
settings, and shows color palettes (HP 54620C).
Channel Controls
add descriptive labels to them, and assign colors (HP 54620C).
General Controls
configuration and measurement result save/recall, printing, and autoscale
functions.
Horizontal Controls
delayed sweep functions.
Storage Keys
acquisition, and screen erasure.
Trigger Keys
Softkeys
dynamically depending on the required function.
Trigger Input / Output
instruments or use the HP 54620A/C to trigger another instrument.
Signal Inputs
probes.
Shows measurement results, some instrument configuration
Move or rearrange channels, turn them on or off,
Includes various measurement functions,
Adjusts the time base, horizontal mode, and
Controls start and stop of acquisition, persistent
Sets up analyzer trigger mode and trigger conditions.
Sets up various options for each major function, varying
Trigger the HP 54620A/C from external
Connects the HP 54620A/C acquisition system to the
35
Page 37

Figure 6
Getting Start ed
Learn the fro nt panel
Display Channel
Controls
General
Controls
Horizontal
Controls
Storage
Keys
Trigger
Keys
HP 54620C
does not have
display
intensity
HP 54620A Logic Analyzer Front Panel
36
Softkeys
Trigger
Input /
Output
Signal
Inputs
Page 38

Getting Started
Learn the fron t panel
Keypad and Softkeys
There are three types of keys on the front panel:
White keys have an immediate action, such as starting or stopping the
•
analyzer. There are no menus associated with white keys.
Gray keys bring up softkey menus, allowing you to modify the instrument’s
•
measurement configuration.
Softkeys under the display dynamically change to indicate currently valid
•
menu selections. Softkeys that are blank (that is, for which there is no
corresponding label) have no function in the selected menu.
Some keys, such as
while in the menus that they activate.
Control Knobs
The HP 54620A has six control knobs. The HP 54620C has five control knobs;
it does not have an intensity control knob.
The Time/Div knob changes the current time base setting (sweep speed)
•
of the analyzer in Main or Delayed sweep. The setting of the timebase
affects sample rate and other analyzer functions as well. See chapter 4,
“Ensuring Accurate Measurements,” for more information.
The Delay knob sets the delay time with respect to the time reference in
•
either Main or Delayed sweep.
The Select knob chooses the channel on which the next action will operate.
•
The Position knob moves the selected channel to a new vertical position
•
on the display.
The Entry knob selects from multiple choices in menus. It also
•
occasionally duplicates the function of the Select knob.
The display intensity knob (HP 54620A only—marked only with an
•
intensity symbol) adjusts display brightness.
On/Off
and
Label
, also have special functions
37
Page 39

Figure 7
Getting Start ed
Learn the fro nt panel
Display
This figure shows the HP 54620A/C display.
Status
Indicators
Channel
numbers
Waveform
display area
Memory bar
Measurement
field
Softkeys
HP 54620A/C Display
Channel
labels
interval
Glitch
mode
DelaySampling
Time/Div
Setting
Trigger
Condition
The display is divided into five regions:
Status indicators are along the top of the display.
•
Channel numbers and labels are along the left edge of the display.
•
Waveforms are in the center of the display.
•
Measurement results and messages are just below the waveform display
•
area.
Softkey labels are along the bottom of the display.
•
Acquisition
Indicator
38
Page 40

Getting Started
Learn the fron t panel
Status Indicators
Status indicators include the following:
Channels that are turned off; these are visible only if you select a channel
•
that is off by using the Select knob.
Sampling interval is a function of the Time/Div setting and varies from 2 ns
•
to 8 ms.
Glitch mode is indicated by “GL”, and indicates that glitch detection is
•
enabled. This is automatically enabled for sampling intervals greater than
8 ns. At time base speeds faster than 1 µs/div (sampling intervals of 4 ms
and faster) glitch mode is disabled.
Delay includes the time reference indicator, the offset markers, and the
•
delay measurement. The time reference indicator is a left arrow (←) if the
trigger event is at the beginning of acquisition memory, a right arrow (→)
if the event is at the end of acquisition memory, and a down arrow (↓) if it
is at the center. The offset markers and delay measurement work together
when you adjust the delay knob and Horizontal Mode is set to Main, to
indicate how far you have delayed the trigger event from the initial time
reference position.
Time/Div shows the time base setting. Time per division is variable from
•
5 ns/div to 1 s/div.
Trigger condition shows the current trigger mode. For edge trigger mode,
•
it will also show the trigger condition. If the last acquisition was initiated
by pressing the Single key, the letters “Sngl” appear in this position
(unless the last single acquisition was auto triggered).
Acquisition indicator shows the current acquisition condition, that is,
•
whether the acquisition system is running, stopped, or in autostore mode.
When the analyzer is in Normal trigger mode, the Trigger condition indicators
flash while the analyzer is searching for the trigger condition, which occurs
after the pre-trigger buffer is full. When the analyzer is in Auto trigger mode,
the word “Auto” flashes to the left of the Trigger condition indicator if the
analyzer did not find the trigger and was therefore triggered automatically
after a time-out.
The trigger condition indicators might also flash if the analyzer is stopped.
This indicates that the analyzer is finding a trigger condition and is driving
the trigger out port.
39
Page 41

Getting Start ed
Learn the fro nt panel
Channel Numbers and Labels
The channel numbers are always shown along the left edge of the display.
You can assign channel labels to help you remember the function of each
channel in your circuit, or disable the labels to increase the waveform display
area. See chapter 2, “Making Analyzer Measurements,” for more information
on using labels.
When using the HP 54620C color logic analyzer, you can assign colors to
channels using the Label menu. See “Using Color” in this chapter for more
information about assigning colors to channels.
Waveform Display
The waveform display area shows all acquisition results. You can change the
graticule or turn it off entirely using the Display menu. See chapter 2,
“Making Analyzer Measurements.”
When using the HP 54620C color logic analyzer, the waveform display shows
all activity and selections pertaining to a particular channel in the color
assigned to that channel. See “Using Color” in this chapter for more
information about assigning colors to channels.
40
Page 42

Getting Started
Learn the fron t panel
Memory Bar and Measurement Field
The memory bar is a horizontal line below the waveform display area which
shows what fraction of acquisition memory is displayed and the position of
the display with respect to acquisition memory. When the analyzer is
stopped, you can change the size of the display with respect to acquisition
memory using the Time/Div control, allowing you to zoom in on a specific
portion of memory.
Below the memory bar is the measurement field. This area is used to display
results for single- and dual-channel measurements, activity indicators, trigger
settings, error messages, and status messages.
Softkeys
Softkeys are shown along the bottom of the display. Some softkeys have an
immediate action, such as taking you to another menu or initiating a
measurement.
Other softkeys allow you to scroll through a list of choices, such as channels
or trigger operators. You can scroll through the choices by pressing the
softkey repeatedly. For some softkeys, you can use the Entry knob to scroll
through the choices. For channel lists, you can always use the Select knob or
Entry knob to scroll through the choices.
Occasionally a softkey label is displayed with two choices below it, one of
which is highlighted. The highlighted choice is the one that is currently
active. Pressing the softkey toggles the highlight to the other choice.
When several softkeys are displayed with a labeled bar over them, it means
that either the softkeys are related or that the choices are mutually exclusive.
When using the HP 54620C color logic analyzer color palettes, some
channel-specific softkeys display the color assigned to the particular channel.
See “Using Color” in this chapter for more information about assigning colors
to channels.
41
Page 43

Getting Start ed
To probe a circuit
To probe a circuit
1
Turn off the power supply to the circuit under
test.
Turning off power to the circuit under test
prevents damage that might occur if you
accidentally short two lines together while
connecting probes. You can leave the
HP 54620A/C powered on because no
voltage appears at the probes.
2
Connect the probe cable to the HP 54620A/C.
The cable is indexed so you can connect it only
one way. You do
HP 54620A/C.
4
Connect the grabber to a node in the circuit you
want to test.
not
need to power-off the
3
Connect a grabber to one of the probe leads.
(Other probe leads are omitted from the figure
for clarity.)
5
For high-speed signals, connect a ground lead to
the probe lead, connect a grabber to the ground
lead, and attach the grabber to ground in the
circuit under test.
42
Page 44

Getting Started
To probe a circuit
6
Connect the ground lead on each set of channels,
using a probe grabber. The ground lead improves
signal fidelity to the analyzer, ensuring accurate
measurements.
8
If you need to remove a probe lead from the
cable, insert a paper clip or other small pointed
object into the side of the cable assembly, and
push to release the latch while pulling out the
probe lead.
7
Repeat steps 3 through 6 until you have
connected all test points of interest.
See “Probing the Circuit Under Test” in
chapter 4 for information on how probing
affects measurement accuracy.
43
Page 45

Getting Start ed
To set up an acquisition using Aut oscale
To set up an acquisition using Autoscale
Example
Figure 8
•
To configure the analyzer quickly, press
•
To undo the effects of autoscale, press
Undo Autoscale
•
To set the instrument to the factory-default measurement
configuration, press
softkey in the Setup menu.
Setup
, then press the
Autosc ale
Setup
, then press the
Default Setup
.
softkey in the Setup menu.
Connect the probes for channels 0, 1, 2, and 3 to the calibration output
on the front panel of the logic analyzer. Set the analyzer to the factory
default configuration by pressing
Autosc ale
press
Notice that the default trigger condition is a rising edge trigger on
channel 0.
. You should see a display similar to the following.
Setup
Defaul t Se tu p
, then
. Then
Sample Aut oscale Measureme nt
44
Page 46

Getting Started
To set up an acquisition using Auto scale
How Does Autoscale Work?
If there is at l east one channel with an active signal, t he analyzer turns o ff al l
other channel s having no activity, that is, where no t ransitions through the logic
threshold are occurring, and turns on all channels having activity. TTL, ECL, and
variable thr esholds are used wh i l e testing for signal activity.
Channels not previously displayed will be added below t hose channels already
being displayed with the lowest num bered channel at th e top. Higher numbered
channels will be displayed in order down the di splay. The channels that ar e on
are scaled vertically to best fit the screen.
The analyzer checks for activi ty using a window of 20 ms, allowing it to
recognize signals as slow as 50 Hz for autoscalin g. C hannels that are turned off
will have blank activity indicators in the display. If the analyzer does not find any
channel with an active signal, i t restores the setup to t he pre-autoscale state.
Sweep speed is set to give an opti m al l y scaled display of all the active cha nnel s.
Autoscaling attempts to find a Time/div setting su ch that the slowest si gnal has
between 1 and 3 periods display ed, w i th no more than 125 periods of the fastes t
signal displayed. If these crit eri a cannot be satisifed, then a Time/div setting is
selected that i s as slow as possible, yet shows le ss than 125 periods of the
fastest signal.
Triggering (ex cept for auto/normal m ode) and channel label s are not affected,
unless an ext ernal trigger is found. Delay is set t o z ero. The analyzer is set to
Run mode (cont i nuous acquisition) .
The Undo Auto scale function returns the instrument to the setup that existe d
prior to Autos cal e being activated .
When using th e HP 54620A/C, pressing Autoscale returns t he Auto Glitch Detec t
capability in the Display menu to the enabled status.
45
Page 47

Getting Start ed
To start and stop an acquisition
To start and stop an acquisition
•
To begin an acquisition, press the
The analyzer begins acquiring data while searching for a trigger condition.
The RUN indicator is shown in the upper-right corner of the display. If a
trigger occurs, the acquired data is shown in the display.
•
To stop an acquisition in process, press the
The analyzer stops acquiring data, and the STOP indicator is shown in the
upper-right corner of the display. If the analyzer was triggered (even by auto
triggering) and the acquisition buffer is full, the results are displayed on the
screen. If the acquisition buffer is not full, the waveform display area will be
blank.
See “To define the trigger mode” in chapter 2 for information on how the
analyzer trigger mode affects the search for the trigger condition.
Run/St op
key.
Run/St op
key.
46
Page 48

To define a simple edge trigger
Getting Started
To define a s imple edge trigger
Example
Figure 9
Press
Edge
.
Do one of the following:
Press the
•
input as the trigger source.
Trg In
softkey under
Source
to choose the External Trigger
1
2
or
Select a channel as the trigger source using either the Select knob, the
•
Entry knob, or the softkey.
You can choose a channel that is turned off as the source for the edge
trigger.
3
Press one of the
Edge
softkeys to choose whether the trigger will
occur on the rising edge, falling edge, or either edge of the input
signal.
Connect the probe for channel 0 to the front-panel calibration test point.
Then set up a falling edge trigger on channel 0. You should see a stable
display of the channel, as shown below.
Edge Trigger on Channel 0
47
Page 49

Getting Start ed
To adjust the ti m e base (sweep speed)
To adjust the time base (sweep speed)
•
To increase the sweep speed (decrease the amount of time per
division on the display), turn the Time/Div knob clockwise.
•
To decrease the sweep speed (increase the amount of time per
division on the display), turn the Time/Div knob counterclockwise.
The sweep speed is adjustable from 5 ns/div to 1 s/div in 1, 2, 5 increments.
Turning on
When using the HP 54620A/C, and Auto Glitch Detect is disabled, you can
adjust the sweep speed to 2 s/div and 5 s/div. "GL" is not displayed if the logic
analyzer Auto Glitch Detect is disabled.
The current sweep speed setting affects other instrument operating
parameters. For example:
The sampling period is a function of the Time/div setting, but changes only
•
when a new acquisition begins.
To avoid missing fast events or short pulses, the analyzer automatically
•
switches to glitch mode at all time base settings slower than 1 µs/div. The
glitch mode indicator “GL” will appear in the status line.
Vernier
in the Main/Delayed menu gives finer increments.
In advanced triggering, the minimum limit for a pattern duration trigger is
•
two sample periods. Because the sampling rate depends on the Time/Div
setting and Auto Glitch Detect setting, the minimum duration and
resolution of the duration will change as the Time/Div setting changes, or
as the Auto Glitch Detect setting changes.
See chapter 4, “Ensuring Accurate Measurements,” for more information.
48
Page 50

To turn channels on and off
Getting Started
To turn channels on and off
•
To turn off a specific channel, press
using the Select knob, then press the leftmost softkey until
On/Off
, select a channel
Off
highlighted.
•
To turn on a specific channel, press
using the Select knob, then press the leftmost softkey until
On/Off
, select a channel
On
is
highlighted.
If you are already in the
key to toggle a particular channel on or off. The list of channels that are
off is in the upper-left corner of the display. You can also use the first
softkey to select a channel when the On/Off softkey menu is present.
•
To turn channels 0 through 7 on, press
On
softkey under “Chan 0 - 7.”
•
To turn channels 0 through 7 off, press
Off
softkey under “Chan 0 - 7.”
A corresponding set of On and Off softkeys is available for channels 8 through
15.
The analyzer does not disable input for channels that are off. It simply does
not display those channels. So, you can assign labels to channels that are off
or use them in a trigger specification. Also, if you turn a channel on after an
acquisition, the data acquired for that channel will be displayed. A channel
must be on, though, if you wish to make measurements using the single- or
dual-channel measurement features.
On/Off
menu, you can press the
On/Off
On/Off
On/Off
, then press the
, then press the
is
49
Page 51

Getting Start ed
To rearrange the channels
To rearrange the channels
1
Turn the Select knob to choose the channel you want to move.
Only channels that are currently on may be moved.
2
Turn the Position knob to choose a new location for the selected
channel.
Turning the Position knob counterclockwise moves the channel down;
turning the knob clockwise moves the channel up.
The combination of the Select and Move knobs gives you a feature similar to
that of a waveform position control on an oscilloscope, except that you can
only move the waveform to certain discrete locations.
You can also change the general order in which channels are displayed. Press
On/Off or Display, then press Order to toggle between 0-15 and 15-0
orderings.
50
Page 52

2
Making Analyzer Measurements
Page 53

Making Analyzer Measurements
The HP 54620A/C provides a full set of features to help automate your
measurement tasks. You can:
• Set up the analyzer for different logic thresholds, allowing
simultaneous timing measurements on sets of signals from different
logic families.
• Modify the way the analyzer acquires data.
• Label input signals to make it easier to relate the display to the
circuit under test.
• Set up simple or complex trigger conditions, as needed, to capture
only the sequence of events you want to examine.
• Use delayed sweep to examine the waveforms of interest.
• Make measurements on a single waveform or on one waveform with
respect to another.
• Trigger the analyzer from other instruments or use the analyzer to
trigger other instruments.
• Save the measurement for comparison with others or save the
analyzer configuration for later use in making the same
measurement.
This chapter explains how to do all these things and more. If you are
not familiar with basic analyzer operations, see chapter 1, “Getting
Started.”
52
Page 54

Figure 10
When threshold is set
correctly, the activity
indicators s how
double-heade d arr ow s
for rapidly-changing
signals, or high or low
for static or very
low-frequency signals
Setting Logic Levels
You can adjust the logic threshold levels used by the analyzer for
three independent groups of input signals: channels 0-7, channels
8-15, and the external trigger. Because of this, you can make
simultaneous measurements on signals from different logic families.
For example, you could connect channels 0-7 to TTL signals, channels
8-15 to ECL signals, and the external trigger to an analog signal. Then,
you can set the threshold voltages to the appropriate value for each
group.
Selects the gro up of
channels for which
threshold will be set
Choose from preset TTL,
CMOS, or ECL thresholds, or
set a user- defined threshold
Logic Thresh old Setup
Shows the thr eshold
for the selected
family, or sets a
user-defined
threshol d usi ng the
Entry knob
53
Page 55

Making Anal yzer Measurement s
To change the logic threshold for in put signals
To change the logic threshold for input signals
Table 3
1
Press
2
Press the
Logic Le ve ls
Set
softkey to highlight the range of channels for which
.
you want to set the logic threshold.
User
.
Chan 0-7
, or
(channels 0 through 7),
TRIG IN
User
(the external trigger input).
to select the threshold.
, set the threshold voltage using the Entry knob.
Ranges available are
(channels 8 through 15), and
3
4
5
TTL, CMOS, ECL
Press
If you selected
Turning the Entry knob while in this menu automatically sets the Threshold
option to
User
Repeat steps 2 through 4 for each group of channels for which you
Chan 8-15
want to set the threshold.
You can exit the threshold setting menu by pressing any other front-panel
key.
The threshold voltage setting is used by the input comparators to determine
whether an input signal is a logic low or logic high. The settings for each
option are shown in table 2.
Threshold Voltage Settings
Option Voltage
TTL 1.50 V
CMOS 2.50 V
ECL -1.30 V
User Continuous ly variable from –6.00 V to +6.00 V
54
Page 56

Controlling Data Acquisition
During an acquisition, the logic analyzer examines the input voltage
at each input probe at a sampling rate defined by the time base setting
(Time/Div knob). At each sample, it compares the input voltage to the
logic threshold. If the voltage is above the threshold, the analyzer
stores a “1” in sample memory; otherwise, it stores a “0.” When sample
memory is full, the display logic reconstructs the input waveform from
the pattern of bits stored in sample memory. To control the
HP 54620A/C acquisition process, you can
• perform continuous acquisitions by pressing the Run/Stop key, and
stop them by pressing it again,
• make one acquisition, then stop, by pressing the Single key,
• store the results of several acquisitions by pressing Autostore, or
• erase the results of all acquisitions by pressing Erase.
Chapter 1, “Getting Started,” explains how to use the Run and Stop
functions. The others are explained in this section.
Auto Glitch Detect
The HP 54620A/C automatically enables Auto Glitch Detect upon
powerup. When the Auto Glitch Detect feature is enabled, it puts the
instrument in glitch detect mode at all sweep speeds of 1 µs/div and
slower where the sampling speed must be reduced, thereby
preventing aliases from being displayed.
When Auto Glitch Detect is disabled, the HP 54620A/C acquisition
system has a record length of 8K samples at all sweep speeds. In
addition, you can extend the sweep speed to 2 s/div and 5 s/div in the
Main display mode. See “Glitch Detection” in chapter 4.
When Auto Glitch Detect is enabled, a waveform display that contains
glitches, separated by the sampling intervals, is an indication that the
waveform is being undersampled. A faster Time/Div setting is needed
to obtain a correct display of the waveform. This easy indication of
undersampling is not available when Auto Glitch Detect is disabled.
55
Page 57

Making Anal yzer Measurement s
To take a sing le acquisition
You can detect the presence of aliases in the analyzer’s display simply
by selecting a faster sweep speed. If the waveform display changes
more than expected, it is an alias being caused by undersampling.
Whenever a waveform is being displayed as a solid bar, it is highly
likely that when you expand the waveform the display will contain
aliases.
Aliasing Produces Misleading Inf orm ation
Aliasing produces misleading i nformation. The gl i tch detect circuitry helps
prevent alia sing by identifyin g additional transitions that occur between
samples.
Whenever the w aveform display is not as expected, it mi ght be an alias—t he
result of undersampling. Alway s try to use a sweep speed that produces a
sampling interval that is at least 1/2 of the shortest time interval to be acquired.
To take a single acquisition
•
Press
The analyzer starts the acquisition system and begins searching for the
trigger condition.
When the analyzer is in Autostore mode (see “To accumulate the results of
every acquisition”) pressing Single adds the results of the new acquisition to
the current display contents.
See “To define the trigger mode” in this chapter for more information on how
the analyzer’s trigger mode affects handling of the trigger condition.
56
Single
.
Page 58

To use Auto Glitch Detect
Making Anal yzer Measurement s
To use Auto Glitch Detect
Figure 11
1
Press
Make sure the
Auto Glitch Detect feature is enabled upon powerup, and puts the logic
analyzer in glitch detect mode for all time base speeds slower than 1 µs/div.
When Auto Glitch Detect is disabled, aliasing can occur, which produces
misleading information for data reconstruction. See “Glitch Detection” in
chapter 4.
The following display shows no aliasing with Auto Glitch Detect enabled; the
waveform appears as expected when expanded.
Displa y
Preferred Mo de of Operation
The preferred m ode of HP 54620A /C operation is Auto Glitch Detect enabled.
However, there might be a situat i on that requires the us e of the instrument’s full
8K memory to capture the waveform of interest. This can be accomplished by
selecting Auto Glitch Detect Disable mode. In this mode you will have no
indication that the waveform mig ht be undersampled.
.
Auto Glitch Detect Enable
softkey is highlighted. The
Waveform D i splay with Aut o Glitch Detect Enab le d
57
Page 59

Making Anal yzer Measurement s
To accumulate the results of ever y acquisition
To accumulate the results of every acquisition
•
Press
When Autostore is on, the analyzer updates pixel memory (display memory)
with new acquisitions, but does not erase the results of previous acquisitions.
Instead, for each pixel memory location turned on by a previous acquisition,
the analyzer changes the display brightness to half-bright (or to the
Autostore color for HP 54620C). Thus, the results of each new acquisition are
displayed at full brightness (or to the Autostore color for HP 54620C), and
the results of all previous acquisitions are displayed at half brightness.
The indicator “STORE” is displayed at the right end of the status line when
Autostore is selected.
When the analyzer is in Autostore mode, pressing
result of the new acquisition to the current display contents.
To turn off Autostore while in Run mode, press
Autost or e
.
Single
Autost or e
adds the
again.
To erase the waveform display
•
Press
Acquisition memory and the current display are immediately erased. If the
instrument is in Run or Autostore mode, however, and the analyzer finds a
trigger condition, the display will be quickly updated after the erasure.
Erase
.
58
Page 60

Using Labels
The HP 54620A/C allows you to define and assign labels to each input
channel. Or, you can turn labels off to increase the waveform display
area.
In addition, the HP 54620C allows you to assign colors to channels.
This makes it easy to associate input channels with their functions in
the system under test.
To turn the label display on or off
•
To display channel labels, press
Label
, then press the
Labels
softkey until On is highlighted.
•
To turn off channel labels display, press
Labels
•
To toggle the channel labels display, press
softkey until
Off
is highlighted.
Label
Label
, then press the
repeatedly
until the labels are on or off as desired.
The following figure shows the HP 54620C color logic analyzer label menu.
You can highlight an individual channel or a set of channels.
59
Page 61

Making Anal yzer Measurement s
To assign a label to a channel
To assign a label to a channel
1
Press
2
Press the
The following figure shows the label maker. A label definition menu is shown
on the right-hand side of the display.
3
Select the channel for which you want to assign a label using the
Label
.
Define Labels
softkey.
Select knob.
You can assign labels to channels that are off and to channels that are on.
4
Use the Entry knob to choose the label you want to assign from the
list of labels.
The Entry knob moves the cursor through the label list, then through the
character list. You can also define custom labels. The label list includes all
predefined labels, and custom labels you have defined, unless it is
re-initialized. See “To define a new label.”
5
Press the
The selected label is transferred to the entry field.
6
Press the
The label is assigned to the selected channel.
Label display is automatically enabled when you enter the Define Labels
menu. Thus, if the labels were off, they are turned on while you define labels.
If you exit the Define Labels menu, and the labels were off before you
entered the menu, they are turned off when you exit.
Copy
softkey.
Assign Label
softkey.
60
Page 62

Figure 12
Making Anal yzer Measurement s
To assign a label to a channel
If you defined a new label, it is added to the label list and will be saved with
the analyzer configuration.
Shows what
will be put in
the entry
field when
you press
Copy
Press to delete
the character at
the cursor in th e
entry field
Scroll through the label
and character lists
using the Entry knob
Press to i nsert
a space in the
entry field at
the cursor
Press to copy
the selected
label/character
to the entry f ield
The entry field
shows you w hat
will be assigned to
the channel
Press to move the
cursor through the
entry field
Select
the
channel
with the
Select
knob
Pres s t o assign
the label to the
channel
HP 54620A/C Label Definition Display
61
Page 63

Making Anal yzer Measurement s
To define a new label
To define a new label
1
Press
2
Press the
A label definition menu is shown on the right-hand side of the display.
3
To use an existing label as the basis for the new label, use the Entry
knob to choose a label from the list of labels. Then press the
Label
.
Define Labels
softkey.
Copy
softkey.
The Entry knob moves the cursor through the label list, then through the
character list. The label list includes all predefined labels, and custom labels
you have defined, unless it is re-initialized. When you press the Copy softkey,
the selected label is transferred to the entry field.
4
To enter characters into the new label:
a
Press the
corresponds to the point where you want to replace a character.
b
Enter or delete a character.
To enter a character, use the Entry Knob to choose a character from
•
the character list. Then press the
To insert a space, press the
•
To delete the current character, press the
•
Delet e Character
moves successive characters forward by one position.
5
Press the
The label is assigned to the selected channel.
Label display is automatically enabled when you enter the Define Labels
menu. Thus, if the labels were off, they are turned on while you define labels.
If you exit the Define Labels menu, and the labels were off before you
entered the menu, they are turned off when you exit.
Position
Assign Label
softkey until the cursor position in the entry field
softkey.
Copy
Insert Space
deletes the character under the cursor and
softkey.
Delet e Ch ar ac ter
softkey.
softkey.
62
Page 64

Making Anal yzer Measurement s
To define a new label
Label Assig nm ent Auto-Increment Features
When you assign a label ending in a digit, such as A DDR0 or DATA0, the
analyzer aut om atically increment s the digit and disp l ays the modified label in the
entry field. Then, the analyzer changes the selected channel to the next c hannel
down on the dis pl ay that is on. This m akes it easier to as sign successive l abel s
to numbered co ntrol lines and data bus lines.
Label List M anagement
The label lis t contains 75 of the most recently used l abel s. The list does not save
duplicate label s, nor does it save multiple labels that differ by, at m ost, two
trailing num eri c characters.
The label lis t is non-volatile. Thus, after you us e the label list for awhi l e, your
labels will predominate, mak i ng it easier to customize the analyzer display for
your needs.
When you first begin using the an al yzer, there are seven blank entries a t t he
beginning of the label lis t. A s you define custom labels, these spaces are filled.
One blank space is always retai ned to allow entry of a new label. When you
initialize the label list, all of your custom labels will be cleared, and the label lis t
will be returned to its factory configuration.
63
Page 65

Making Anal yzer Measurement s
To initialize t he label list
To initialize the label list
1
Press
2
Press the
A message appears, warning you that this operation will overwrite the
current label list.
•
•
When you first begin using the analyzer, there are seven blank entries at the
beginning of the label list. As you define custom labels, these spaces are
filled. One blank space is always retained to allow entry of a new label. When
you initialize the label list, all of your custom labels will be cleared.
Label
To confirm the operation, press the
press Yes again to initiate the operation.
To cancel the operation, press the No softkey.
.
Initialize Label List
softkey.
softkey. You will be prompted to
Yes
64
Page 66

Triggering the Analyzer
The HP 54620A/C allows you to synchronize the analyzer display to
the actions of the circuit under test by defining a trigger condition.
The analyzer offers three types of triggering, allowing you to match
the complexity of the trigger to that of the data you want to capture.
Trigger types
These trigger types are as follows:
Edge trigger
•
Pattern trigger
•
Advanced trigger
•
Changes to the current trigger specification are handled in real-time. If
the analyzer is stopped when you change a trigger specification, it uses
the new specification as soon as you press
Autost ore
or
triggering specification, it immediately begins a new acquisition using the
new trigger definition.
. If the analyzer is in Run mode when you change a
Run/St op , Single
,
Edge Trigger
In edge trigger, you define a single rising or falling edge (or either) that must
be recognized on an input channel to satisfy the trigger condition.
Edge trigger is best when there is a unique waveform edge that defines the
events you wish to capture. For example, a gate signal that defines the
beginning of a pulse train on another channel will often make a good edge
trigger. Edge trigger is less useful when the set of events that occur after the
edge change dramatically after every edge, or when the edges occur very
frequently in relation to other signals.
65
Page 67

Making Anal yzer Measurement s
Trigger type s
Pattern Trigger
In pattern trigger, you define a pattern of highs, lows, and don’t care inputs
that must be recognized across the input channels during any given input
sample. The pattern may be combined with one edge on any input channel to
form the complete trigger specification.
Pattern trigger is best when there is a unique pattern that occurs across a
group of signals, and the pattern defines the events you want to capture. For
example, suppose you have a state machine that outputs a series of hex
digits, and only outputs the digit ‘A’ once in every sequence. You can use a
pattern trigger to capture this event.
Pattern trigger is less useful when the same pattern occurs many times, and
most of those occurrences have little to do with the events you wish to
capture. For example, suppose that this same state machine generates
hundreds of states, and the state “C” occurs several times in the sequence,
with a different sequence of states after each occurrence. A pattern trigger
will not provide a stable waveform display.
The pattern trigger occurs when the pattern is entered; that is, the trigger
condition is satisfied as soon as the input waveforms have transitioned from a
state not matching the pattern to a state matching the pattern. You can use
the single edge to further qualify the trigger condition. For example, you may
want the analyzer to trigger when a certain pattern is present and a clock
edge occurs.
66
Page 68

Figure 13
Making Anal yzer Measurement s
Trigger typ es
Choose the
channel for
which you will
set the level or
edge required
Pattern Trigger Setup
Set the
required
level to high
or low
Clear a level
or edge
requirement
for a
particular
channel
Set one channel
to require a
rising or falling
edge (or either
by pressing bo th
keys
simultaneo usl y)
to satisfy the
pattern
Advanced Trigger
In advanced trigger, you define up to two pattern and edge sources that are
combined with a variety of operators to form the complete trigger
specification.
Advanced trigger is best when the events you want to capture are defined by
a complex series of waveform events in the system, and neither pattern mode
nor edge mode are capable of clearly resolving the necessary sequence. For
example, suppose the events you want to capture are defined by the nth
occurrence of an edge, by a pattern with a certain minimum duration, or by a
pattern followed by another pattern. Advanced trigger gives you this and
more.
Figure 14 shows an advanced trigger setup, with the overview display turned
on. The display shows a pattern duration trigger.
67
Page 69

Making Anal yzer Measurement s
Trigger type s
Figure 14
Shows the current
definitions of al l
pattern and edge
terms, and input
activity
Shows the first
source selection
Select
the first
source
Advanced Trigger Setup (with Overview On)
Define the
required
pattern or
edge
qualifier
Choose
the
trigger
operator
Shows the
currently s el ect ed
source opera tor
For unary operators,
you set the operator
parameters (duration
or occurrenc e count)
here— for binary
operators, you select
the second source and
define pattern or edge
requirements.
Shows the se cond
source selection (valid
only with operat or s
requiring two sources)
Toggles
the
trigger
overview
window
68
Page 70

Figure 15
Making Anal yzer Measurement s
Trigger typ es
When the
operator is
AND, OR, or
Then...
Advanced Trigger Softkeys for Operators with Two Sources
You can select
and define a
second sou rce
using these
softkeys.
Sharing of Sources
The source definitions for the simple pattern trigger are shared with the
Pattern 1 and Edge 1 sources of the advanced trigger specification. Thus,
changes to the simple pattern trigger will affect that specification, and
changes to Pattern 1 and Edge 1 in the advanced trigger specification will
affect the simple pattern trigger. Defining patterns for the two trigger types
differs. See “To define a pattern trigger” and “To define an advanced trigger.”
Logical Combination within Terms
In the pattern trigger, all settings within the pattern are logically ANDed; that
is, all conditions on the pattern, and the edge if specified, must be satisfied
before the analyzer will trigger.
In the advanced trigger, settings within pattern terms are logically ANDed.
Settings within edge terms are logically ORed. This is only important for the
Edge 2 term, where you can define different edge specifications for each
channel. Thus, only one of those edge specifications must be satisfied to
satisfy the edge term.
69
Page 71

Making Anal yzer Measurement s
To define the trigger mode
To define the trigger mode
Figure 16
1
Press
2
Select the mode using the
You can select either Normal mode or Auto mode.
Trigger Mode
The trigger mode affects the way in which the analyzer searches for the
trigger. Figure 16 shows the conceptual representation of acquisition
memory. You can think of the trigger event as dividing acquisition memory
into a pre-trigger and post-trigger buffer. The position of the trigger event in
acquisition memory is defined by the time reference point and the delay
setting.
Acquisition Memory
Normal mode
behavior whether the acquisition was initiated by pressing Run/Stop or
Single. The analyzer begins filling the pre-trigger buffer with data. As
soon as that buffer is full, the analyzer will begin searching for the trigger
event, and will flash the trigger condition indicator on the status line to
indicate it is doing so. While searching for the trigger, the analyzer
overflows the pre-trigger buffer, with the first data put into the buffer
being the first pushed out (FIFO).
Mode
.
Trigger Mode
In Normal trigger mode, the analyzer has the same
softkeys.
When the trigger event is found, the analyzer will fill the post-trigger
buffer and display the acquisition memory. If the acquisition was initiated
Run/St op
by
Auto mode
the trigger event for a predetermined interval. This interval is a function
of the Time/Div setting, but is never less than 40 ms. If no trigger is
found, the analyzer forces a trigger and displays the data as though a
trigger had occurred.
70
, the process repeats.
The analyzer fills the pre-trigger buffer, then searches for
Page 72

Making Anal yzer Measurement s
To define the tri gger mode
The subsequent behavior depends on whether the acquisition was initiated
by pressing Single or Run:
Single—the analyzer will fill acquisition memory, stop, and display the
•
results.
Run—the analyzer will fill the pre-trigger buffer after drawing a trace.
•
When the pre-trigger buffer is full, the analyzer repeats the search for a
trigger. If no trigger is found, a free-running trace is displayed, much like
that of an oscilloscope on auto trigger.
In either Auto or Normal mode, the trigger may be missed completely under
certain conditions. This is because the analyzer will not recognize a trigger
event until the pre-trigger buffer is full. Suppose you set the Time/Div knob
to a slow sweep speed, such as 500 ms/div. If the trigger condition always
occurs before the analyzer has filled the pre-trigger buffer, the trigger will not
be found.
Some measurements you want to make will require you to take some action
in the circuit under test to cause the trigger event. Usually, these are
single-shot acquisitions, where you will use the Single key. If you use Normal
mode and wait for the trigger condition indicator to flash before causing the
action in the circuit, the analyzer will always find the trigger condition
correctly.
See chapter 4, “Ensuring Accurate Measurements,” for more information on
the acquisition process and the relationships between time base and sampling
rate.
Trigger Mode versus Trigger Type
The trigger mode (Auto or Normal) is independent of the t ri gger type (Edge,
Pattern, or Advanced). The mode s etting applies for a ny trigger type.
71
Page 73

Making Anal yzer Measurement s
To define an edge trigger
To define an edge trigger
1
Press
2
Do one of the following:
•
Edge
Press the
input as the trigger source.
.
Trg In
softkey under
Source
to choose the External Trigger
or
Select a channel as the trigger source using the Select knob, the Entry
•
knob, or the softkey.
You can choose a channel that is turned off as the source for the edge
trigger.
3
Press one of the
Edge
softkeys to choose whether the trigger will
occur on the rising edge, falling edge, or both edges of the input
signal.
Rotating Select K nob does not Affect Tri gger Channel
Continuously ro tati ng t he Select knob will not affect the channel used for the
trigger condit i on, after the
softkey has been pressed to se t t he condition.
Edge
72
Page 74

To define a pattern trigger
Making Anal yzer Measurement s
To define a pattern trigger
Press
Patter n
.
Do the following for each channel in the desired pattern (including
1
2
the external trigger input):
a
Select a channel for the external trigger input either by pressing the
Source
b
Press a softkey to set the condition the analyzer will recognize as part
of the pattern for that channel:
•
•
•
•
Source Defini ti ons for Simple Pattern Trigger Affect Advanced Trigger
The source definitions for the sim pl e pattern trigger are shared with the
Pattern 1 and Edge 1 source definitions of the advanc ed trigger specificat i on.
Thus, changes to the simple pattern trigger will affect tha t specification, and
changes to Pattern 1 and Edge 1 in the advanced trig ger specification will affect
the regular pa tt ern trigger. However, defining pattern s f or an advanced trigg er
is different. S ee “To define an advanced trigger.”
softkey, or by rotating the Select knob or Entry knob.
for a logic low.
Low
for a logic high.
High
Don’t Ca re
Rising, falling, or both edges.
Only one edge term is allowed in the pattern. If you define an edge
term, then select a different channel in the pattern and define
another edge term, the previous edge definition is changed to a
don’t care.
to ignore this channel.
73
Page 75

Making Anal yzer Measurement s
To define an adv anced trigger
To define an advanced trigger
1
Press
2
Press the
The trigger overview display simplifies the trigger setup by allowing you to
see the current source and operator selections and source definitions
(pattern and edge definitions).
3
Choose the trigger operator by pressing the
Adv
.
Overview
softkey to turn on the trigger overview, if desired.
Operator
softkey until
the desired operator is shown.
Table 3 lists the trigger operators and the sources with which they can be
used. Notice that the sources specified (in step 5) can limit your choice of
trigger operators, and your choice of trigger operators can limit which
sources are available.
4
Set the parameters for the trigger operator, if necessary.
For the Duration > and Duration < operators, press the duration value
softkey or turn the Entry knob to set the duration. You can set the minimum
duration available by pressing the
For the Occurrence operator, press the
Entry knob to set the number of occurrences. You can reset the number of
occurrences to 1 by pressing the
5
Choose the source(s) for the trigger operator by pressing the leftmost
Minimu m Duration
Occurrence
Minimu m Occurrence
softkey.
softkey or turn the
softkey.
softkey under each “Source” heading until the desired source is
highlighted.
Table 3 lists the sources and the operators with which they can be used. Note
that the analyzer will allow you to choose combinations of sources that are
redundant, such as “Pat_1 AND Pat_1,” or that will create a null trigger
condition, such as “Pat_1 AND Not = Pat_1.”
6
Set up the source(s) by pressing the
Define
softkey under the
“Source” heading for the desired source.
If you have combined patterns and edges in the same source term, you will
need to separately select each as the source (step 5), set up the source
(step 6), then re-select the combined pattern and edge.
To set up an edge source:
a
Select a channel using the Select knob or the Entry knob.
To choose whether the trigger will occur on the rising edge, falling
•
edge, or both edges of the input signal, press one of the
Edge
softkeys.
74
Page 76

Making Anal yzer Measurement s
To define an adv anced trigger
To set a channel to don’t care (not part of the trigger specification),
•
press the
To clear all edge settings, press the
•
Don’t Ca re
softkey.
Clear Ed ge (s )
softkey.
In Edge1, only one edge can be selected. Multiple edges may be
selected in Edge2; they are logically ORed.
b
Repeat step a for all channels you want to change.
c
Press Previous Menu to return to the Advanced Trigger menu.
To set up a pattern source:
a
Select a channel using the Select knob or the Entry knob.
To set the condition for that channel, press one of the
•
Don’t Ca re
To clear the condition settings for all channels, press the
•
Pattern
b
Repeat step a for all channels you want to change.
c
Press
Previous Menu
softkeys.
softkey.
to return to the Advanced Trigger menu.
Low, High
, or
Clear
Table 4
Trigger Operators and Sources
Operator # of Sources Valid Sources
Duration One Pat_1, Not = Pat_1, Pat_2, Not = Pat_2
Occurs One Edge1, Edge2 , Pa t_1 AND Edge1, Pat_2 A N D
Edge2
Entered, Exited One Pat_1, Not = Pat_1, Pat_2, Not = Pa t_ 2
AND, OR, Then Two Pa t_ 1, N ot = P at _1, Pat _2, Not = Pat_2,
Edge1, Edge2 , Pa t_1 AND Edge1, Pat_2 A N D
Edge2
In the table, entered means that the trigger qualifier is satisfied as soon as
the input waveforms have transitioned from a state not matching the pattern
to a state matching that pattern. Exited means that the trigger qualifier is
satisfied when the input waveforms transition out of a state matching the
pattern to a state not matching the pattern.
Advanced trigger can help you solve difficult data acquisition problems.
There are two things to remember when setting up an advanced trigger: first,
follow the setup rules; second, have a clear picture of the event sequence you
75
Page 77

Making Anal yzer Measurement s
To define an adv anced trigger
are trying to capture and understand how the advanced trigger capabilities
relate to those events.
Setup rules
Remembering the following rules will make it easier to work with the
advanced triggering capabilities:
Duration operators are valid when only pattern terms are involved.
•
Duration is not selectable when any edge terms are selected as a source.
Occurrence operators are valid only when at least one edge term is
involved. Occurrence is not selectable when only pattern terms are
selected as a source.
When you have selected a combination source, like Pat_1 AND Edge1, you
•
cannot directly define the pattern or edge. You must instead select Pat_1
as the source, define the pattern, then select Edge1 as the source and
define the edge. The softkeys change to reflect this.
Understand the waveform events and relate them to analyzer capabilities
The key to setting up a useful waveform display is picking a known sequence
of waveform events to which you can apply the advanced trigger capabilities
of the HP 54620A/C.
To find these events, you can ask a series of questions about the waveform,
keeping in mind the capabilities of the analyzer.
Does the input data always repeat with respect to a particular waveform’s
•
high or low period of constant duration?
Is there a sequence of waveform events that define the data of interest?
•
For example, is there a state machine, where the hypothetical sequence
“aac” leads to the events of interest, where “aab” does not?
Are the events of interest defined by a certain number of iterations of a
•
circuit? For example, does the circuit fail (producing the events of
interest) on the 38th iteration of a data pattern and edge combination?
Usually, you will want to set the analyzer to Normal trigger mode so that you
see a display only when the trigger condition occurs. However, you might
want to use Auto trigger mode while experimenting with the trigger
definition so you can see a display of the data that is captured by the analyzer.
76
Page 78

Making Anal yzer Measurement s
To define an adv anced trigger
Example
Figure 17
Example
Figure 18
Suppose you have a pulse train where one of the pulses is of constant
duration (4 µs) and all other signals of interest are repeated with that pulse
train. See figure 17.
µ
Pulse Train with Constant-Duration Pulse
To trigger the analyzer on that pulse, you can use the trigger setup in the
following table:
Source Operator and
Parameters
Pattern 1 Durat i on > 3. 9 µs H on channel 0, others don’t care
Pattern/Edg e
Suppose you have a state machine whose three outputs, Q0 through Q2,
output the decimal sequence 0-1-6-0-6-1. Q2 is the most significant bit. See
figure 18.
Sequential O ut put from State Machin e
If you try to trigger on any of the single output patterns 0, 1, or 6, the display
will not be stable. However, you can use the “Then” operator to trigger on the
sequence of pattern “0” followed by pattern “1.” If Q2, Q1, and Q0 are
connected to channels 2, 1, and 0 respectively, you can use the setup in the
following table to trigger the analyzer.
77
Page 79

Making Anal yzer Measurement s
To define an adv anced trigger
Example
Figure 19
Source Operator and
Parameters
Pattern 1 Then L on channels 2 , 1 , an d 0, ot hers don’t care
Pattern 2 N/A L on channels 2 and 1, H on channel 0,
Pattern/Edg e
others don’t care
Suppose you have a microcontroller-based system that consistently fails the
third time you push a particular front-panel switch when a particular system
display menu is active. If M1 and M0 represent the particular data lines that
indicate menu state, and the system menu in question is active when both
these lines are high, then figure 19 represents a combination of events
leading to the failure condition.
System Fa ilure on Third Keystroke
If input lines M1, M0, and SWITCH are connected to input channels 2, 1, and
0 respectively, the following trigger configuration will trigger the analyzer
when the failure condition occurs. The occurrence count is incremented each
time the edge occurs when the associated pattern is true.
Source Operator and
Parameters
Pattern 1 & Edge 1 Occurs 3 times H on channels 2, 1 i n Pattern 1; Rising Ed ge
Pattern/Edg e
on channel 0 in Edge 1
78
Page 80

Making Anal yzer Measurement s
To define an adv anced trigger
All Qualifiers m ust be Satisfied to Tr igger the Analyzer
When setting up an advanced trigg er, you must remember t hat all required
events must be satisfied to trigger the analyzer. F or example, if you set up an
occurrence tri gger using Pattern 1 and Edge 1, and the o ccurrence count is 3,
then Edge 1 must be satisfied three times, with the pattern valid each ti m e,
before the trigger will occur.
Pattern 1 and Edge 1 are Shared Sources
The source definitions for Pattern 1 and Edge 1 are shared with the pattern
trigger specification. Thus, changes here will affect that specificatio n, and
changes to the simple pat tern trigger specification will a ffect the definitions of
Pattern 1 and Edge 1. Defining pa tt erns for a pattern trig ger i s different. See “To
define a pattern trigger.”
79
Page 81

Examining the Captured Data
The HP 54620A/C has features to make viewing acquired data easier.
These include delayed sweep, the graticule, and printing.
Viewing acquired data with delayed sweep
Delayed sweep is an analyzer display function that magnifies the
contents of sample memory. Using the delayed sweep, you can zoom
in on a portion of the waveform and examine it in greater detail.
Figure 20 shows a display with delayed sweep.
Because delayed sweep magnifies the contents of sample memory, the
data used by both main and delayed sweep windows was acquired on
a single acquisition—and, they both correspond to the same trigger
event.
Using the delay setting, you can pan through the waveform in either
main or delayed mode.
80
Page 82

Making Anal yzer Measurement s
Viewing acqui red data with delayed s weep
Figure 20
Main sweep
window
These mark ers def i ne
the beginning and
end of the del ayed
sweep windo w
Delayed swe e p
window
Here, the time
reference is s et to
“left,” the delay
is 0
Delayed Swe ep
Select either
main or delayed
sweep
Delayed-sweep
indicator
Time/Div
for delayed
sweep
Set the posit io n of
the trigger in
acquisiti on m em ory
Time/Div for
main sweep
Increase
the number
of Time/Div
settings
Graticule
The graticule on the HP 54620A/C has three settings, Full, None, and Frame,
allowing you to change the pattern of hash marks on the display. This can
make it easier to view or measure waveform events.
Printing
You can print the status line and the waveform display to an HP- or
Epson-compatible printer attached to one of the optional interface modules
(HP 54650A—HP-IB, or HP 54651A or HP 54652A/B—RS-232). These
printouts can be used for analysis, publication, test reports, and so on.
81
Page 83

Making Anal yzer Measurement s
To show both m ain and delayed sweep displays
To show both main and delayed sweep displays
1
Press
2
Press the
The display is divided into a main and delayed sweep. The delayed sweep is
shown in the bottom half and represents the portion of the waveform
indicated by the vertical lines outlining a window in the upper half.
The Time/Div setting for the delayed sweep is independent of the main
sweep, except that it can be no slower than twice the speed of the main
sweep. It is adjusted using the Time/Div knob. Figure 20 shows the Time/Div
indicator for the delayed sweep. If you need to change the Time/Div for the
main sweep, you must change back to Main before using the Time/Div knob.
Main/D el ay ed
Delayed
softkey.
.
82
Page 84

Making Anal yzer Measurement s
To change the ti m e reference position
To change the time reference position
Press
Main/D el ay ed
.
Choose the time reference position from the
Time Reference
1
2
softkeys:
To set the time reference so that most of the acquired data follows the
•
trigger, press the
The time reference indicator will be one division in from the left side
of the display. The trigger event will be at the same location unless the
delay is set to a value other than 0.
To set the time reference so that the acquired data is centered around the
•
trigger, press the
The time reference indicator will be at the middle of the display. The
trigger event will be at the same location unless the delay is set to a
value other than 0.
To set the time reference so that most of the acquired data precedes the
•
trigger, press the
The time reference indicator will be one division in from the right side
of the display. The trigger event will be at the same location unless the
delay is set to a value other than 0.
The time reference position sets the initial position of the trigger event within
acquisition memory and on the display, with delay set to 0. The delay setting
sets the specific location of the trigger event with respect to the time
reference position. The time reference setting affects the delayed sweep as
described in the following ways.
The point about which the delayed sweep is expanded changes (as Time/Div
is varied):
For a time reference setting of Left, the sweep expands from the
•
left-hand side of the display.
softkey.
Left
Center
Right
softkey.
softkey.
For a time reference setting of Center, the sweep expands about the
•
center of the display.
For a time reference setting of Right, the sweep expands from the
•
right-hand side of the display.
83
Page 85

Making Anal yzer Measurement s
To change the ti m e reference position
The delay time reference point changes:
For a time reference setting of Left, the delay time is measured from
•
the trigger to the left-hand edge of the delay window (the marker
location).
For a time reference setting of Center, the delay time is measured from
•
the trigger to the center edge of the delay window.
For a time reference setting of Right, the delay time is measured from
•
the trigger to the right-hand edge of the delay window.
Figure 21 shows the time reference position set to Center, with horizontal
mode set to Main and a delay setting of 15 µs. Thus, the trigger position is
just slightly before the middle of acquisition memory.
Figure 21
Solid triangle
shows the
trigger position
Empty triangle
mark s the point
on the display
that is delayed
15.0 µs from
the trigger.
Delay valueTime
reference
set to
Center
Time Referenc e at Center, Delay of 15 µs on Main Sweep
84
Page 86

Making Anal yzer Measurement s
To change the ti m e reference position
Figure 22 shows the same acquisition with the horizontal mode set to
Delayed. Again, the time reference is set to Center. Though the marker (the
▼
solid triangle
) points to the trigger event in both the main and delayed
sweep, the delay values themselves are independently adjustable. The delay
value for the delayed sweep is set to 8 µs. This is different than the setting
for the main sweep, which remains at 15 µs in this figure, and is not
adjustable with the delay knob (while the delayed sweep is active). In both
the main and delayed sweep, the hollowed triangle (
) indicates the part of
∇
the waveform that is delayed by the respective value from the trigger event.
Figure 22
The trigger posi tion in
main and delayed
sweeps
Empty triangle in main sweep
shows the part of th e
waveform that is delayed
15 µs from the trigger
Delayed Sweep with Delay of 8 µs
Empty triangl e i n del ayed
sweep shows the part of
the waveform that is
delayed 8 µs from the
trigger
85
Page 87

Making Anal yzer Measurement s
To pan the dis play
To pan the display
•
Turn the Delay knob.
The Delay knob adjusts the amount of time between the trigger event and the
time reference point on the display. When the delay value is positive, the
time reference point represents the end of the delay time; when it is negative,
the time reference point represents the beginning of the delay time.
Subsequent acquisitions are adjusted to capture sufficient data to fill the
Main display; the delayed window is limited to that data available in the Main
display.
See “To change the time reference position” in this chapter. Also see “Time
base and Acquisition” in chapter 4 for more information about the function of
the Delay knob.
86
Page 88

To modify the graticule
Making Anal yzer Measurement s
To modify the graticule
1
2
Press
Displa y
Press one of the
.
Grid
softkeys to define the graticule used for the
waveform area on the display.
has a set of hash marks through the center of the waveform display
Full
•
area, with major divisions indicated by a full-height dotted line through the
waveform display.
has only a border around the waveform display area.
None
•
has a set of hash marks along the top and bottom of the display
Frame
•
only. Major divisions are indicated by longer hash marks.
Each major division in the graticule corresponds to the time given by the
Time/Div setting, shown to the right of the delay value on the display.
87
Page 89

Making Anal yzer Measurement s
To print the display
To print the display
1
Press
2
Press
The current display is copied to the attached printer. You can stop printing
by pressing the
See the documentation for the interface module for information on installing
and configuring module interface parameters.
Print/ Ut il it y
Print Screen
Cancel Print
.
.
softkey.
88
Page 90

Measuring Waveform Data
The HP 54620A/C has three features for measuring waveform
parameters:
• Cursors
• Single-channel measurements
• Dual-channel measurements
Ways to measure data
Cursors
The cursors provide a manual way to measure either time between particular
points on the display (usually associated with waveform events) or the
numeric value of the currently displayed waveforms. Two cursors, t1 and t2,
are available. You position these cursors with the Entry knob and read the
results, in time or value, from the measurement field.
89
Page 91

Figure 23
Cursor t1
Cursor t2
Making Anal yzer Measurement s
Ways to measure data
Figure 23 shows the cursors used to measure the period of an irregular
waveform on channel 4; the period can be read from the ∆t display in the
measurement field as 28.50 µs.
Set which curso r is
controlled by t he
Entry knob—p res s
both to move c urs ors
simultaneo usl y
Measurin g the Per io d of an Irre gula r Waveform
90
Choose the form of
readout of cursor
position
Turn off
cursors on
the display
(the menu
remains)
Page 92

Figure 24
Making Anal yzer Measurement s
Ways to measure data
Single-Channel Measurements
All five of the single-channel measurements in the HP 54620A/C—period,
frequency, duty cycle, positive width, and negative width—are concerned
with measuring the time between sets of events on the same channel, then
calculating the appropriate values based on the definition of the
measurement.
Figure 24 shows frequency, period, and duty-cycle measurements on channel
3 of the input.
Select the
waveform to be
measured using
the softkey, or
the Select or
Entry knobs
Single-Channel Measurements
Choose the
measurement
to be made
Erases the
measurement
field
Access th e
positive and
negative
width
measurements,
and the Show
Measurements
On/Off softkey
91
Page 93

Figure 25
The measure m ent shown
here measures the time
from the rising edge of
channel 0...
to the rising edge of
channel 1
Making Anal yzer Measurement s
Ways to measure data
Dual-Channel Measurements
All three of the dual-channel measurements in the HP 54620A/C—
channel-to-channel delay, setup time, and hold time—are concerned with
measuring the time between edges on two different channels.
Figure 25 shows a channel-to-channel delay measurement. Other
dual-channel measurements have similar softkey menus.
The measure m ent
field show s the delay
is 8 ns
Starts the
measurement
Channel-to-Channel Delay Meas urement
Select the start
channel and
edge
Select the
end channel
and edge
Measurement Process
To make a measurement, the analyzer searches across the displayed
waveform from the left side of the screen to the right until it finds a set of
edges that can be used to make the measurement. Thus, you can only
measure things that are displayed (except that Autostore data cannot be
measured). Parts of the waveform not on screen cannot be measured.
92
Returns to
the main
dual-channel
measurement
menu
Page 94

Figure 26
Making Anal yzer Measurement s
Ways to measure data
A glitch is counted as having a rising and a falling edge, so if a glitch appears
as the first set of edges on screen, it will be treated as part of the waveform
for single-channel measurements. For dual-channel measurements, the glitch
will be used as a representative edge for either channel in the
channel-to-channel delay measurement, and for the data channel in either
the setup or hold measurements. It will not be used for a clock edge in the
setup or hold measurements. The measurement field will show either “>” or
“<” instead of “=” if a glitch was used to calculate the results.
In Delayed mode, if the analyzer can find a set of edges within the delayed
sweep window that will satisfy the measurement criteria, then those edges
are used for the measurement. Otherwise, edges both inside and outside the
window are used to make the measurement. Thus, you can use delayed
sweep to window a specific part of the display where you want to make a
measurement. To include the desired edges, adjust the delay (Delay knob)
and sweep speed (Time/Div) knob for the delayed sweep. See the following
figure.
Measurement Wi thin the Delayed Sweep Window
93
Page 95

Making Anal yzer Measurement s
To use the curs ors
To use the cursors
1
Press
2
Push the t1 or t2 softkey to choose which cursor is active.
Either t1 or t2 is always active when the cursors are on. To move both
cursors simultaneously, press both the t1 and t2 softkeys simultaneously.
3
Set the position of the active cursor using the Entry knob.
4
Select the type of readout by pressing
The cursors allow you to make measurements on waveforms when a standard
single- or dual-channel measurement will not achieve the desired results. You
can position the t1 and t2 cursors anywhere on the visible display and see the
time from trigger, ∆t between the cursors, and the frequency represented by
1/∆t in the message line of the display. If you want to turn off the cursors,
press the
Cursor s
Clear Cu rs or s
When a Single- C hannel Measurement W il l Not Work
If the input wav eform has an irregular pattern that repea ts , you can accurately
measure the frequency or period b y positioning the cu rsors at the beginning of
the first and second cycles. Then, read the frequency or period in the
measurement fiel d.
.
Time, Binary
softkey.
, or
Hex
.
94
Page 96

Making Anal yzer Measurement s
To use the cursors
Table 5
Readout Settings
Setting Indicator Meaning Application
Time t 1 Time at cursor t1 with respect to tr i gger. Measure del ta t of w aveform events wit h
t2 Time at cursor t2 with res pect to trigger.
delta t Time betwe en t 1 and t2.
1/delta t Frequency cor responding to the meas ur ed
delta t.
Binary Bin (t1) Binary value of all channels i n the order
15-0 (where 15 is MSB) at cursor t1, plus
edge information where applicable.
Bin (t2) Binary value of al l channels in the order
15-0 (where 15 is MSB) at cursor t2, plus
edge information where applicable.
Hex hex (t1) Hexadecim al val ue of channels that are on
in the order the y ar e di spl ayed, at cursor t1,
plus edge infor m at i on w here applicable.
The MSB is th e channel at the top of the
display. I f any edges are found, the
character is di splayed as an up arrow,
down arrow, or do ubl e arrow for rising,
falling, or both edges respectively.
hex (t2) Hexadecim al val ue of channels that are on
in the order the y ar e di spl ayed, at cursor t2,
plus edge infor m at i on w here applicable.
The MSB is th e channel at the top of the
display. I f any edges are found, the
character is di splayed as an up arrow,
down arrow, or do ubl e arrow for rising,
falling, or both edges respectively.
respect to trigger event, or measure per i od
or frequency for irregular waveforms.
Gather binary state information f or a group
of signals at a pa rticular waveform event.
Gather hexadecimal state informat i on f or a
group of signal s at a particular waveform
event.
95
Page 97

Making Anal yzer Measurement s
To measure waveform parameter s on a single channel
To measure waveform parameters on a single channel
1
Press
2
Select the channel on which you want to make a measurement by
using the Entry knob or Select knob, or by pressing the
Single Channel
.
Source
softkey.
If you want to measure a parameter for a channel that is off, first turn the
channel on.
3
Select a measurement.
To measure frequency, press the
•
To measure period, press the
•
To measure duty cycle, press the
•
To measure positive width, press the
•
+Width
The positive width of a waveform is the time for which that waveform
is high (logic 1).
To measure negative width, press the
•
–Width
The negative width of a waveform is the time for which that
waveform is low (logic 0).
The selected measurement appears in the measurement field of the display.
The measurement field shows a maximum of three measurements. If you
select additional measurements beyond those three, the left-hand
measurement is deleted and others are moved left to make room for the new
measurement. If you select a measurement that is already displayed, it is
moved to the rightmost position in the measurement field.
You must select the desired channel before pressing the softkey to start the
measurement.
You may repeat the above steps as desired to measure parameters of
different input channels. The three most recent single- or dual-channel
measurements (of any kind) will be shown on the message line of the display.
softkey.
softkey.
Period
softkey.
Freq
softkey.
Duty Cy
Next Menu
Next Menu
softkey.
softkey, then press the
softkey, then press the
96
Page 98

Making Anal yzer Measurement s
To measure waveform parameter s on a single channel
The measurement algorithms are as follows:
To calculate input frequency, the analyzer selects the first and third
•
transitions at the left side of the visible display, measures the delta time
between these two transitions, then calculates the frequency as 1/∆ time.
To calculate input period, the analyzer selects the first and third
•
transitions at the left side of the visible display and measures the ∆ time
between these two transitions.
To calculate the duty cycle, the analyzer measures the period and positive
•
width. It then calculates duty cycle by dividing the period into the pulse
width, multiplying the result by 100%.
To calculate the positive width, the analyzer measures the time between
•
the first set of transitions that begin and end a logic high from the left side
of the visible display.
To calculate the negative width, the analyzer measures the time between
•
the first set of transitions that begin and end a logic low from the left side
of the visible display.
To show the parameters of the most recent measurement, which is the
rightmost one in the measurement results line, press the
until
transitions were selected for that measurement. To clear the current
measurement results, press the
the tracked measurement results will be displayed in the cursor color.
is highlighted. The analyzer will activate the cursors to show which
On
Clear Me as
softkey. With the HP 54620C,
Show Meas
softkey
Ensuring Trans itions for Input Wav eforms having Irregu lar Patterns
For input waveforms having an irregular pattern (s uch as PCM signals), you
must ensure t hat the transitions for w hich you want to measure a parameter are
at the left sid e of the display. For some waveforms o f t hi s type, using the cursors
to make the measurement may be a b ett er solution. See “To use the cursors.”
97
Page 99

Making Anal yzer Measurement s
To measure c hannel-to-channel del ay
To measure channel-to-channel delay
Channel-to-channel delay is the time between a particular event on one
channel and another event on another channel. For example, you might use
this measurement to check skew between two signals in your circuit; in this
case, you would measure the time between the same event occurring on each
channel.
1
Press
Dual Channel
.
2
Press the
3
Press the leftmost
The start channel is the reference point for the delay measurement. That is,
the delay time is the time between the first transition on the start channel
and the first transition on the end channel. (Each transition must meet the
rising- or falling-edge specification as defined by the setup.)
4
Select the start channel by using the Entry knob or Select knob, or by
repeatedly pressing the leftmost
5
Select whether the measurement should be referenced to the rising
or falling edge of the start signal by pressing the leftmost
Ch Delay
softkey.
Channel
softkey to highlight the start channel.
Channel
softkey.
Edge
softkey to highlight the rising or falling edge symbol.
6
Press the rightmost
The end channel is the channel for which you want to measure delay time.
7
Select the end channel by using the Entry knob or Select knob, or by
repeatedly pressing the rightmost
8
Select whether the measurement should be referenced to the rising
or falling edge of the end signal by pressing the leftmost
Channel
softkey to highlight the end channel.
Channel
softkey.
Edge
softkey
to highlight the positive or negative edge symbol.
You must select the desired channels and clock edge before pressing the
Measure Chan Delay
softkey to start the measurement in the next step.
98
Page 100

Making Anal yzer Measurement s
To measure c hannel-to-channel del ay
9
Measure Chan Delay
Press
The channel-to-channel delay time appears on the message line of the display.
You may repeat the above steps as desired to measure the delay time
between different sets of input channels. The three most recent single- or
dual-channel measurements (of any kind) will be shown on the message line
of the display.
To calculate the delay time, the analyzer measures the time between the first
transition of the selected type (rising or falling) on the start channel and the
first transition of the selected type (rising or falling) on the end channel.
When looking for the transition on the start channel, the analyzer begins at
the left side of the visible display. So, if the correct transition is found first on
the start channel, the result will be positive; otherwise, it will be negative. In
delayed mode, the analyzer uses the part of the waveform shown by the
delayed sweep.
.
99
 Loading...