

Page 1
LC-MS Sample Preparation Proteomics
High-Throughput Automation of the PreOmics iST
Technology for Proteomics LC-MS Sample Preparation
Authors: 1 Russell Golson, 1 Nils A. Kulak, 2 Piotr Soczynski, 2 Thomas Howe, 2 Andreas Essig
1
PreOmics GmbH, Am Klopferspitz 19, D-82152 Planegg/Martinsried, Germany, info@preomics.com
2
Hamilton Bonaduz AG, Via Crusch 8, 7402 Bonaduz, Switzerland, infoservice@hamiltonrobotics.com
Introduction
Proteomics workflows are becoming increasingly important in the clinical diagnostics and biotech industries, such as in therapeutic drug monitoring or biomarker detections. Liquid Chromatography Mass Spectrometry (LC-MS)-based assays in particular offer the great advantage of measuring multiple analytes at once (and is quantitative).
Proteomics workflows have been traditionally limited by LC-MS measurement time and sample preparation throughput. While
advances in LC-MS instrument technologies and workflows have now significantly increased the number of samples that can
be processed on a weekly basis, the bottleneck has shifted to efficient, robust, and reliable high-throughput sample preparation.
In this Application Note we demonstrate for the first time a completely automated high-throughput LC-MS sample preparation
workflow, combining the Hamilton liquid handling technology with the PreOmics iST workflow.
n Save time and costs with a maximized walk away time for 96-Well
LC-MS sample preparation
n Full flexibility to process 1 to 96 samples with minimal tip usage
n Standardized workflow with high data reproducibility and process safety
Workflow Description
Automated iST workflow
Microlab® VANTAGE Liquid Handling System
Figure 1: The Hamilton
®
1.3 m
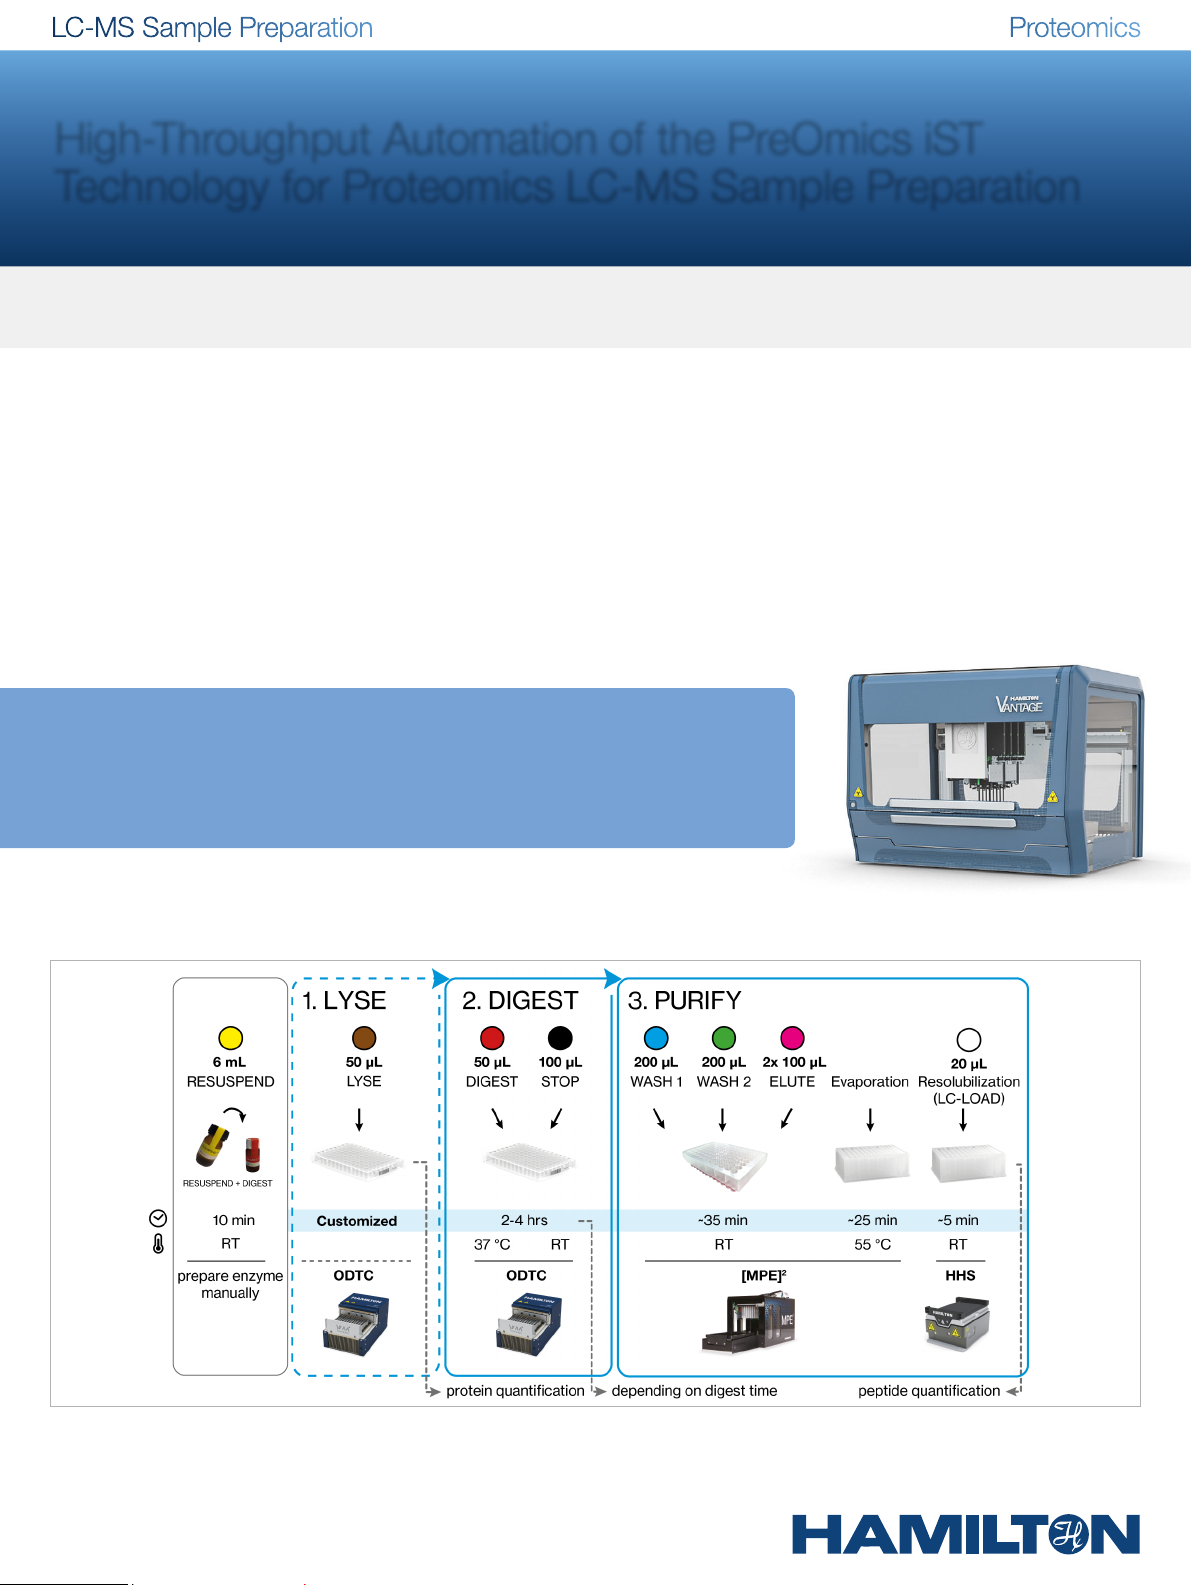
Figure 2: Automated iST workflow – In this figure, the reagents, labware and modules are described for processing 96 samples on a Hamilton liquid handling platform. The temperature and run time on the robot are displayed for each step. The conditions for lysis may var y, according to the sample material. After resolubilization of the digested peptides,
the 96-well plate can be directly loaded onto a LC-MS autosampler.
Page 2
Deck Layout Description
Results
2
7
8
3
6
13
4
9
11
1
5
10
12
1. [ M P E ]2 (Monitored Multi-Flow Positive Pressure Evaporative
Extraction module)
2. ODTC (On-Deck Thermo Cycler)
3. Tube module (reagents)
4. DWP (Deep-Well Plate) module (collection plate)
5. MTP (Micro-Titer Plate) module (sample plate)
6. Tip Waste (2 Tracks)
7. HHS (Hamilton Heater Shaker)
8. [MPE]2 Evaporator module parking position
9. QCG (Quad CO-RE Gripper) & 60 ml trough module (buffers)
10. MTP module (PCR Comfort lid)
11. 60 ml trough module (buffers)
12. DWP module (frame for filter plate)
13. Tip carrier (50 µl and 300 µl Tips)
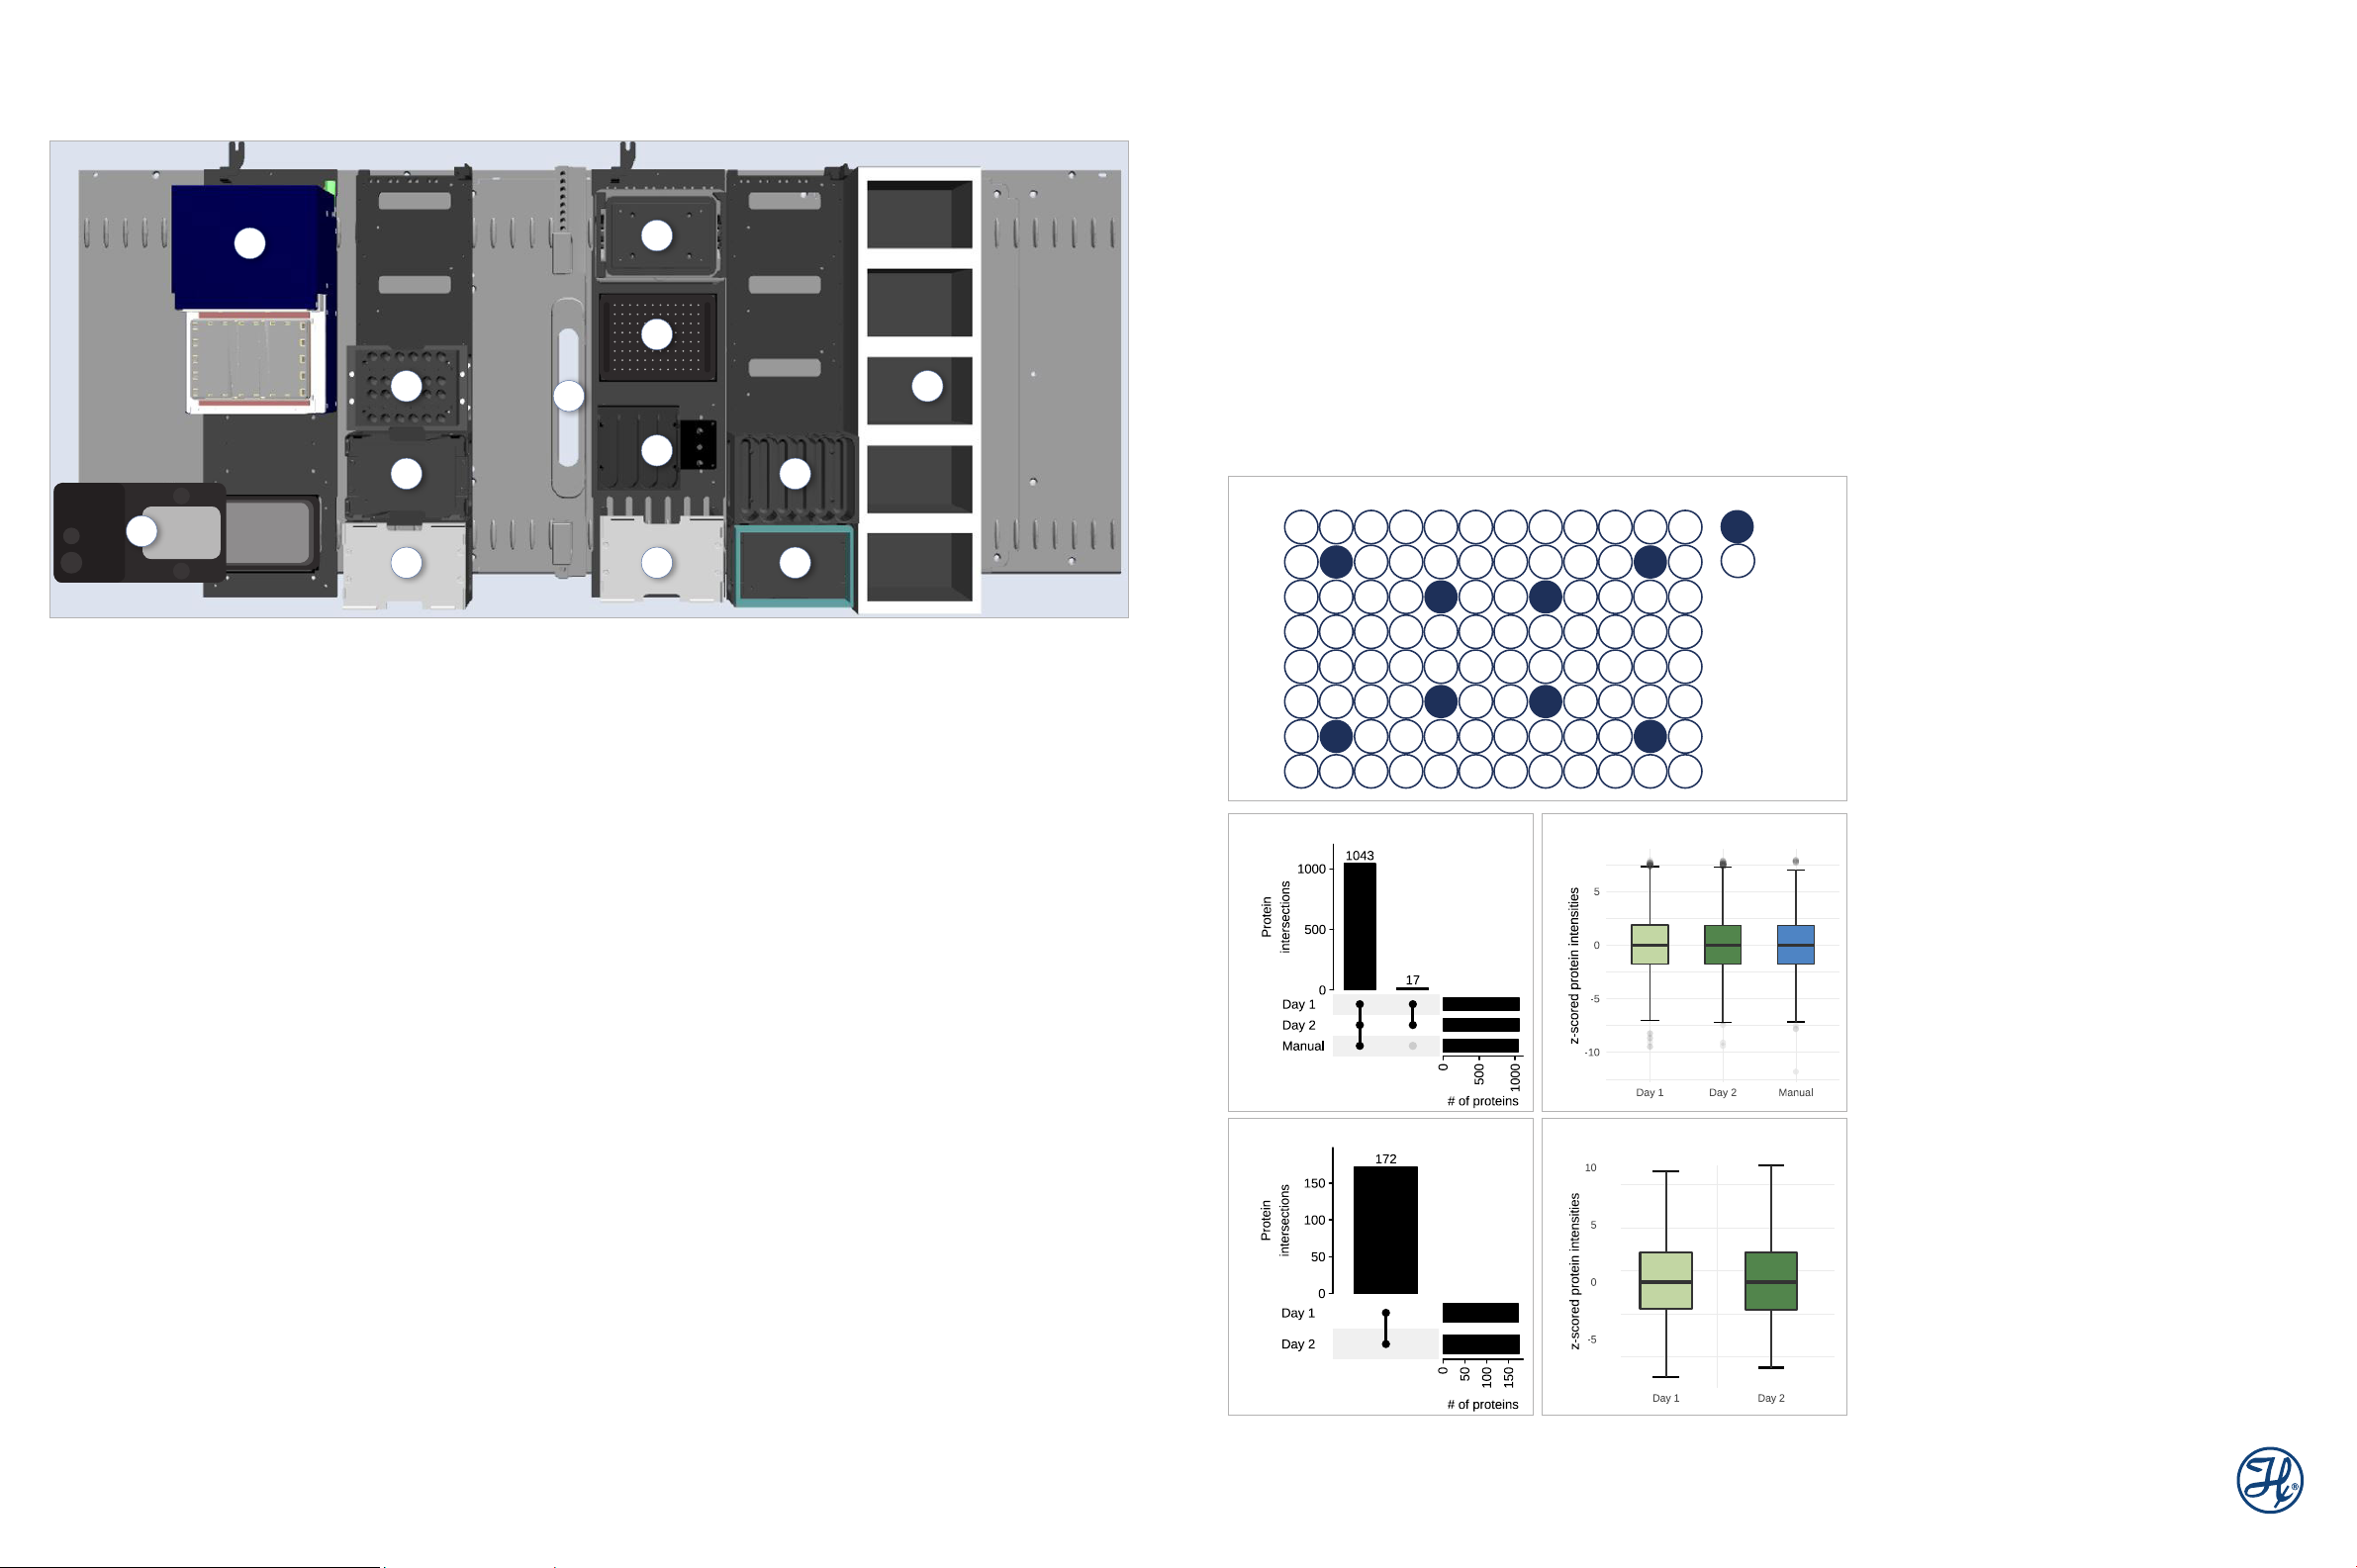
Figure 3: De ck layout
Application Software
Via a Graphical User Interface, an operator can define the parameters of each run, such as the digest time or the volume for
resolubilization, prior to LC-MS.
Kit Description
The PreOmics iST kit contains proprietary reagents to denature, reduce and alkylate proteins in one step, as well as the enzymes to perform a tryptic digestion. The final peptide clean-up includes two positive-pressure 96-well plates (iST-REG-PSI
96HT (192 samples): P.O. 00108; iST-REG-PSI 96HT (384 samples): P.O. 00112).
Technology
LC-MS sample preparation assays, such as the PreOmics iST kit, often use organic and volatile liquids in their workflows. A
distinct pressure system in the Hamilton channels allows for the reliable monitoring and control of such liquids with, for example,
Anti-Droplet Control (ADC).
Four experiments were performed to assess the reproducibility and the robustness of the automated workflow (Fig. 2):
(I) A cross-contamination test was performed with
Saccharomyces cerevisiae
protein extracts, demonstrating that there is
no cross-contamination occurring during the [MPE]2 procedure or any other step in the workflow (Fig. 4).
(II) Proteins from
a single experiment. A 100% inter-day overlap of identified proteins was achieved for both
Pichia pastoris
and commercial human plasma were digested on two different days and the data was acquired in
P. pastoris
and human plasma
(Fig. 5).
(III) Aliquots of
P. pastoris
samples were also digested, following the standard manual protocol. 98% of the identified proteins
were detected in both the manual and inter-day runs (Fig. 5A).
(IV) To test a full 96-well plate automation run, aliquots from 48
P. pastoris
and 48 commercial human plasma protein extracts
were processed. The normalized protein intensities obtained demonstrated a mean correlation of 0.97 and 0.98 for
ris
and human plasma, respectively (Fig. 6).
1 5 93 7 112 6 104 8 12
A
B
C
D
E
F
G
H
A)
P. pastoris P. pastoris
C)
570
540
553 579
568547
B)
D)
Human PlasmaHuman Plasma
577
580
S. cerevisiae
Blank
Figure 4: Cross-contamination – 8 aliquots of
tracts (manually prepared, 5 µg) and 88 blank samples (only LYSE
buffer) were arranged as shown and processed according to a customized procedure: 100 µl of protein extract or buf fer, respectively, and 10 µl
of DIGEST were incubated for 1.5 h in the ODTC.
The dried samples were dissolved in 20 µl LC-LOAD and 2 µl was injected on a UPLC, coupled with an Orbitrap Fusion Lumos (Thermo
Scientific). A 20 min gradient of 5-35% acetonitrile was applied to separate the peptides. Protein identification and visualization were performed
using Mascot (Matrix Science) and Scaffold (Proteome Software).
After filtering for 0.1% peptide/1% protein False Discovery Rate (FDR) and
3 peptides/protein, the result showed 540 to 580 proteins identified in the
S. cerevisiae
Figure 5: Inter-day reproducibility and comparison to manual processing
– (A and B) 8 aliquots of manually prepared
(50 µg each) we re processed on t wo different days, and 4 additional
samples were digested with the manual procedure. The automation was
customized as follows: 50 µl of proteins, 50 µl of DIGEST, and 10 µl of
additional RESUSPEND were incubated for 1.5 h in the ODTC.
The LC-MS measurement was performed as described for the cross-contamination assay with 1 µl injected on the LC-MS system. Protein identification and quantification was per formed using MaxQuant 1 (5% protein
FDR; 2 peptides/protein). 1060 proteins we re identified for the automated
runs and 1043 for the manually processed samples (A) with a mean value
of 0.12 for day 1, 0.10 for day 2 and 0.07 for manual when considering the
protein intensitie s (median-normalized scaled) (B). Day 1 and 2 revealed
an intersection of 100% and 98%, as compared to the manual run (A).
(C and D) 8 samples of commercially available human plasma (each
~70 µg; Sigma-Aldrich, P9523) were processed on day 1 and 2. The
LC-MS measurement and analysis were executed as described for the
P. pastoris
for days 1 and 2, with an intersection of 100% (C) and a mean value of
0.22 for day 1 and of 0.25 for day 2 with regard to the protein intensities
(median-normalized scaled) (D). All plots were generated in R 2.
samples and no proteins detected in the blanks.
proteins, with a gradient of 35 min. 172 proteins were identified
S. cerevisiae
P. pastoris
protein extracts
P. pasto-
protein ex-
The CO-RE (Compressed O-Ring Expansion) technology integrated in the channels permits the transport to-and-from each
module on-deck without the need for an additional transport tool.
The ODTC, in combination with the proprietary Hamilton PCR Comfort lid, controls the temperature during protein digestion with
high-precision and uniformly, without the loss of liquid, due to evaporation. The [MPE]2 provides the positive-pressure functionality to process filter plates and the evaporator module to rapidly dry down samples, eliminating the need for a centrifuge.
Page 3

Figure 6: 96 sample run – (A and B) 48 aliquots of manually extracted
teins were processed together with 48 samples of commercially available human plasma. For the automation run and LC-MS measurement, the same parameters were used
as for the inter-day experiments, except for a 1 to 10 dilution of the plasma samples
prior to the LC-MS measurement. The normalized protein intensities exhibited Pearson
correlation values between 0.94 and 0.98 for the
0.93 and 0.99 for the plasma samples (B). All plots were generated in R.
P. pastoris
samples (A) and between
P. pastoris
pro-
A)
P. pastoris
41
31
21
11
B) Human Plasma
41
1.0 01.0 0
31
0.980.98
0.960.96
21
0.940.94
11
Summary
2
1
42322212
2
1
42322212
The qualification experiments and results demonstrate that the PreOmics iST technology effectively runs on a Hamilton liquid
handling platform. The user is supported with a fully automated standardized and reproducible workflow, ultimately resulting in
LC-MS grade peptides in less than 4 hours of total sample processing time. Successful processing of yeast, human plasma and
cerebrospinal fluid (CSF) samples (not shown), demonstrates the applicability in clinical, biotech and research settings.
System Requirements Part Number
Microlab VANTAGE 1.3m, INSTINCT V Sof tware v1.9
(the power cord must be ordered for the specific country)
818 0 5 0 A13
Arm Channel/IPG 81800 9
8x Standard Pipetting Channels 196 0 05
2T waste block 818047
Ejector plate for 2T waste 10088368
System Dimensions
Width: 1448 mm (including left extension [MPE]2)
Height: 1360 mm (door open)
De pt h: 1010 m m
Labware Requirements Part Number
[MPE]2 with evaporator module
(mounted on base plate with ODTC)
ODTC 96 kit left VANTAGE
(mounted on base plate with [MPE]2)
96160 - 04
100 67561
Integration Kit [MPE]2 and ODTC left VANTAGE (This kit is
based on 95952-01 and 10066706. Panel for cosmetic is
10 113 023
included)
2x MultiFlex Carrier Base Plate 188039
MultiFlex Tube / Cup Module 188048
2x MultiFlex DWP Module 188042
2x MultiFlex MTP Module 188228
Shaker Carrier Base 1870 01
HHS 3.0 mm orbit flat bottom 10068482
Consumables Part Number/ Provider
iST-REG-PSI 96HT (192 samples) 00108 / PreOmics
iST-REG-PSI 96HT (384 samples) 00112 / PreOmics
50 µl Conductive Tips without Filter 235966
300 µl Conductive Tips without Filter 235902
96 Well PCR FramePlate 814302
60 ml Reagent Container 1940 51
PCR Comfor t Lid 814300
1.5 ml Eppendorf Tubes 0030123328 / Eppendorf
DWP (Collection plate) 186005837 / Waters
To find a subsidiary or distributor in your area,
please visit, www.hamiltoncompany.com/support.
Web:
www.hamiltoncompany.com/robotics
Email: infoservice@hamiltonrobotics.com
MFX Trough Module QCG Pos 1 0113 3 03
QCG on MFX position 96006-01
MultiFlex Module Bracket 7T 18 813 3
MultiFlex Reagent Trough Module 188404
Frame for filter plate 182712
Tip Carrier 18208 5
Citations:
1) Cox, J. and Man n, M. MaxQu ant enable s high pepti de identifi cation rate s, individu alized p.p.b.-rang e
mass ac curaci es and proteome-w ide prote in quant ificati on. Nat Bio techno l, 2008, 26, pp 1367-72.
2) R Core Team (2020). R: A la nguag e and environme nt for statistical comput ing. R Foun dation fo r
Statistical Computing, Vienna, Austria.
Acknowledgments:
Mass spectrometry measurements and data analysis were performed at the Functional Genomics
Center Zurich (ETH Zurich and University of Zurich, Switzerland). Special thanks go to Antje Dittmann,
Claudia Fortes and Paolo Nanni.
United States
+1-775-858-3000
United Kingdom, Ireland
+44 121 272 92 80
Brazil
+55 11 95914 5000
China
+86 21 6164 6567
All trademarks are owned and/or registered by Hamilton Company in the U.S. and/or other countries.
Denmark, Norway,
Sweden, Finland
+46 8410 27 373
France
+33 184 008 420
Germany, Switzerland,
Austria, Benelux
+49 89 248 804 804
© 2021 Hamilton Company. All rights reserved.
Lit. No. AN-2102-03 — 02/2021
Italy
+39 039 930 06 06
Japan
+81 3 6435 6850
Spain, Portugal
+34 930 186 262
 Loading...