

Furuno NAVNET 1734C, NAVNET 1724C, color video plotter GD1720C, NAVNet VX2 1724C, NAVNet VX2 1734C Operator's Manual
...Page 1

Page 2

i
Ni-Cd Pb
IMPORTANT NOTICES
General
• The operator of this equipment must read and follow the descriptions in this manual.
Wrong operation or maintenance can cancel the warranty or cause injury.
• Do not copy any part of this manual without written permission from FURUNO.
• If this manual is lost or worn, contact your dealer about replacement.
• The contents of this manual and equipment specifications can change without notice.
• The example screens (or illustrations) shown in this manual can be different from the
screens you see on your display. The screens you see depend on your system
configuration and equipment settings.
• Save this manual for future reference.
• Any modification of the equipment (including software) by persons not authorized by
FURUNO will cancel the warranty.
• All brand and product names are trademarks, registered trademarks or service marks of
their respective holders.
How to discard this product
Discard this product according to local regulations for the disposal of industrial waste. For
disposal in the USA, see the homepage of the Electronics Industries Alliance
(http://www.eiae.org/) for the correct method of disposal.
How to discard a used battery
Some FURUNO products have a battery(ies). To see if your product has a battery, see the
chapter on Maintenance. Follow the instructions below if a battery is used. Tape the + and terminals of battery before disposal to prevent fire, heat generation caused by short circuit.
In the European Union
The crossed-out trash can symbol indicates that all types of
batteries must not be discarded in standard trash, or at a trash site.
Take the used batteries to a battery collection site according to your
national legislation and the Batteries Directive 2006/66/EU.
In the USA
The Mobius loop symbol (three chasing arrows) indicates that
Ni-Cd and lead-acid rechargeable batteries must be recycled.
Take the used batteries to a battery collection site according to
local laws.
In the other countries
There are no international standards for the battery recycle symbol. The number of symbols
can increase when the other countries make their own recycling symbols in the future.
Cd
Page 3

SAFETY INSTRUCTIONS
ii
SAFETY INSTRUCTIONS
WARNING
ELECTRICAL SHOCK HAZARD
Do not open the equipment.
Only qualified personnel
should work inside the
equipment.
Turn off the radar power
switch before servicing the
antenna unit. Post a warning sign near the switch
indicating it should not be
turned on while the antenna
unit is being serviced.
Prevent the potential risk of
being struck by the rotating
antenna and exposure to
RF radiation hazard.
Wear a safety belt and hard
hat when working on the
antenna unit.
Serious injury or death can
result if someone falls from
the radar antenna mast.
Do not disassemble or modify the
equipment.
Fire, electrical shock or serious injury can
result.
Turn off the power immediately if water
leaks into the equipment or the equipment is emitting smoke or fire.
Continued use of the equipment can cause
fire or electrical shock.
Use the proper fuse.
Fuse rating is shown on the power cable.
Use of a wrong fuse can result in damage
to the equipment.
Keep heater away from equipment.
Heat can alter equipment shape and melt
the power cord, which can cause fire or
electrical shock.
A warning label is attached to the
equipment. Do not remove the label.
If the label is missing or damaged,
contact a FURUNO agent or dealer.
WARNING
To avoid electrical shock, do not
remove cover. No user-serviceable
parts inside.
Name: Warning Label (1)
Type: 86-003-1011-0
Code No.: 100-236-230
WARNING
Radio Frequency
Radiation Hazard
The radar antenna emits electromagnetic
radio frequency (RF) energy which can be
harmful, particularly to your eyes. Never
look directly into the antenna aperture from
a close distance while the radar is in
operation or expose yourself to the transmitting antenna at a close distance.
Distances at which RF radiation levels of
100 and 10 W/m
2
exist are given in the
table below.
Note: If the antenna unit is installed at a
close distance in front of the wheel house,
your administration may require halt of
transmission within a certain sector of
antenna revolution. This is possible - Ask
your FURUNO representative or dealer to
provide this feature.
MODEL
Distance to
100 W/m
2
point
Distance to
10 W/m
2
point
MODEL
1834C
Nil
Worst case
1.80 m
MODEL
1934C
MODEL
1944C
Worst case
0.20 m
Worst case
3.00 m
Nil
Worst case
2.50 m
MODEL
1954C
Nil
Worst case
2.50 m
Worst case
2.30 m
XN-12A
XN-13A
MODEL
1824C
Nil
Worst case
0.50 m
Warning Label
Page 4

iii
TABLE OF CONTENTS
FOREWORD................................................................................................................. viii
SYSTEM CONFIGURATIONS........................................................................................ ix
1. OPERATIONAL OVERVIEW.................................................................................1-1
1.1 Operating Controls............................................................................................................. 1-1
1.1.1 Display unit controls............................................................................................... 1-1
1.1.2 Remote controller................................................................................................... 1-3
1.2 Inserting a Chart Card........................................................................................................ 1-4
1.3 Turning the Unit On/Off...................................................................................................... 1-5
1.4 Display Brilliance, Panel Brilliance, Hue............................................................................. 1-6
1.4.1 Display brilliance, panel brilliance .......................................................................... 1-6
1.4.2 Hue......................................................................................................................... 1-7
1.5 Selecting a Display.............................................................................................................1-8
1.5.1 Display modes........................................................................................................ 1-8
1.5.2 Selecting a display................................................................................................. 1-9
1.5.3 Switching control in combination and overlay screens.........................................1-10
1.5.4 Selecting image source.........................................................................................1-11
1.6 Cursor pad, Cursor........................................................................................................... 1-12
1.7 Entering the MOB Mark, Setting MOB as Destination ..................................................... 1-13
1.8 Data Boxes....................................................................................................................... 1-14
1.8.1 Showing, hiding data boxes with soft key ............................................................ 1-14
1.8.2 Rearranging data boxes....................................................................................... 1-14
1.8.3 Temporarily erasing a data box............................................................................ 1-14
1.9 Function Keys...................................................................................................................1-15
1.10 Simulation Display............................................................................................................ 1-16
2. RADAR OPERATION ............................................................................................2-1
2.1 Radar Display..................................................................................................................... 2-1
2.2 Transmitting, Stand-by........................................................................................................ 2-2
2.3 Tuning................................................................................................................................. 2-2
2.4 Adjusting the Gain..............................................................................................................2-2
2.5 Reducing Sea Clutter......................................................................................................... 2-3
2.5.1 How the A/C SEA works......................................................................................... 2-3
2.5.2 Adjusting the A/C SEA ........................................................................................... 2-4
2.6 Reducing Precipitation Clutter............................................................................................ 2-4
2.7 Range Scale....................................................................................................................... 2-5
2.8 Pulselength......................................................................................................................... 2-6
2.9 Presentation Mode............................................................................................................. 2-7
2.9.1 Selecting a presentation mode............................................................................... 2-7
2.9.2 Description of presentation modes......................................................................... 2-8
2.10 Measuring the Range......................................................................................................... 2-9
2.10.1 Measuring range by range rings ............................................................................ 2-9
2.10.2 Measuring range by cursor .................................................................................... 2-9
2.10.3 Measuring range by VRM .................................................................................... 2-10
2.10.4 Various VRM operations........................................................................................ 2-10
2.11 Measuring the Bearing ......................................................................................................2-11
2.11.1 Measuring bearing by cursor.................................................................................2-11
2.11.2 Measuring bearing by EBL....................................................................................2-11
2.11.3 Various EBL operations ..........................................................................................2-11
2.12
Erasing the Heading Line, North Marker.......................................................................... 2-12
Page 5

TABLE OF CONTENTS
iv
2.13 Reducing Noise Interference.............................................................................................2-12
2.14 Rejecting Radar Interference ............................................................................................2-13
2.15 Zoom .................................................................................................................................2-14
2.15.1 Zooming radar targets...........................................................................................2-14
2.15.2 Zooming ARP , TTM targets...................................................................................2-14
2.16 Shifting the Picture............................................................................................................2-15
2.16.1 Manual shift...........................................................................................................2-15
2.16.2 Automatic shift.......................................................................................................2-15
2.17 Using the Offset EBL.........................................................................................................2-16
2.17.1 Predicting collision course.....................................................................................2-16
2.17.2 Measuring range & bearing between two targets..................................................2-17
2.18 Echo Trails.........................................................................................................................2-18
2.18.1 Trail time................................................................................................................2-18
2.18.2 Starting echo trails.................................................................................................2-19
2.18.3 Trail gradation .......................................................................................................2-20
2.18.4 Trail color...............................................................................................................2-20
2.19 Echo Stretch......................................................................................................................2-21
2.20 Echo Averaging.................................................................................................................2-22
2.21 Outputting TLL Data..........................................................................................................2-23
2.22 Guard Alarm......................................................................................................................2-24
2.22.1 Setting a guard alarm zone...................................................................................2-24
2.22.2 When the alarm is violated…................................................................................2-25
2.22.3 Cancelling the guard alarm...................................................................................2-25
2.23 Watchman.........................................................................................................................2-25
2.23.1 How watchman works...........................................................................................2-25
2.23.2 Turning on/off watchman.......................................................................................2-26
2.23.3 Setting watchman stand-by interval......................................................................2-26
2.24 Waypoint Marker...............................................................................................................2-27
2.25 ARP, TTM Operation .........................................................................................................2-28
2.25.1 Activating/deactivating ARP , TTM.........................................................................2-29
2.25.2 Acquiring and tracking targets (ARP)....................................................................2-29
2.25.3 Displaying target number (ARP, TTM) ..................................................................2-31
2.25.4 Terminating tracking of ARP targets......................................................................2-31
2.25.5 Setting vector attributes (ARP)..............................................................................2-32
2.25.6 Displaying past position (ARP)..............................................................................2-33
2.25.7 ARP, TTM target data............................................................................................2-34
2.25.8 CPA/TCPA alarm (ARP)........................................................................................2-35
2.25.9 Lost target alarm (ARP) ........................................................................................2-36
2.26 Interpreting the Radar Display ..........................................................................................2-37
2.26.1 False echoes.........................................................................................................2-37
2.26.2 SART (Search and Rescue Transponder)............................................................2-38
2.26.3 Racon (Radar Beacon) .........................................................................................2-39
3. PLOTTER OPERATION.........................................................................................3-1
3.1 Plotter Displays ...................................................................................................................3-1
3.1.1 Full-screen plotter display.......................................................................................3-1
3.1.2 Nav graphic display.................................................................................................3-3
3.1.3 Highway display......................................................................................................3-6
3.1.4 Nav data display......................................................................................................3-7
3.2 Presentation Mode..............................................................................................................3-8
3.3 Shifting the Display..............................................................................................................3-9
3.4 Chart Scale..........................................................................................................................3-9
3.5 Chart Cards.........................................................................................................................3-9
3.5.1 Chart card overview................................................................................................3-9
3.5.2 Indices and chart enlargement..............................................................................3-10
3.5.3 Navionics
charts....................................................................................................3-11
Page 6

TABLE OF CONTENTS
v
3.5.4 C-MAP charts....................................................................................................... 3-14
3.6 Working with Track........................................................................................................... 3-18
3.6.1 Displaying track.................................................................................................... 3-18
3.6.2 Stopping, restarting plotting of own ship track...................................................... 3-19
3.6.3 Changing track color............................................................................................ 3-19
3.6.4 Track plotting method and interval for own ship track.......................................... 3-20
3.6.5 Changing own ship track/mark distribution setting............................................... 3-21
3.6.6 Erasing track........................................................................................................ 3-22
3.7 Marks, Lines..................................................................................................................... 3-24
3.7.1 Entering a mark, line............................................................................................ 3-24
3.7.2 Changing mark attributes..................................................................................... 3-24
3.7.3 Selecting line type................................................................................................ 3-25
3.7.4 Erasing marks, lines............................................................................................. 3-26
3.8 Waypoints......................................................................................................................... 3-27
3.8.1 Entering waypoints............................................................................................... 3-27
3.8.2 Editing waypoint data........................................................................................... 3-30
3.8.3 Erasing waypoints................................................................................................ 3-32
3.8.4 Changing waypoint mark size (Navionics GOLD)................................................ 3-33
3.8.5 Searching waypoints............................................................................................ 3-34
3.9 Routes.............................................................................................................................. 3-35
3.9.1 Creating routes..................................................................................................... 3-35
3.9.2 Connecting routes................................................................................................ 3-38
3.9.3 Inserting waypoints............................................................................................... 3-39
3.9.4 Removing waypoints from a route........................................................................ 3-40
3.9.5 Erasing routes...................................................................................................... 3-41
3.10 Navigation
........................................................................................................................ 3-41
3.10.1 Navigating to a “quick point”................................................................................. 3-41
3.10.2 Navigating to waypoints ....................................................................................... 3-42
3.10.3 Navigating to ports, port services......................................................................... 3-43
3.10.4 Following a route.................................................................................................. 3-45
3.10.5 Cancelling route navigation.................................................................................. 3-48
3.11 Alarms .............................................................................................................................. 3-49
3.11.1 Audio alarm on/off................................................................................................ 3-49
3.11.2 Arrival alarm......................................................................................................... 3-50
3.11.3 Anchor watch alarm ............................................................................................. 3-51
3.11.4 XTE (Cross-Track Error) alarm............................................................................ 3-52
3.11.5 Speed alarm......................................................................................................... 3-52
3.11.6 Proximity alarm..................................................................................................... 3-53
3.11.7 Trip alarm............................................................................................................. 3-53
3.11.8 Grounding alarm (C-MAP specification)............................................................... 3-54
3.11.9 Alarm information................................................................................................. 3-55
3.12 Resetting Trip Distance.................................................................................................... 3-57
4. VIDEO SOUNDER OPERATION...........................................................................4-1
4.1 Sounder Displays............................................................................................................... 4-1
4.1.1 Selecting a sounder display................................................................................... 4-1
4.1.2 Description of sounder displays............................................................................. 4-2
4.1.3 Selecting screen split method in combination displays.......................................... 4-6
4.2 Automatic Sounder Operation............................................................................................ 4-6
4.2.1 How the automatic sounder works......................................................................... 4-6
4.2.2 Types of automatic sounder modes ....................................................................... 4-6
4.2.3 How to enable automatic sounder operation..........................................................4-7
4.3 Manual Sounder Operation................................................................................................ 4-7
4.3.1 Selecting the manual mode.................................................................................... 4-7
4.3.2 Selecting display range.......................................................................................... 4-7
4.3.3 Adjusting the gain................................................................................................... 4-8
Page 7

TABLE OF CONTENTS
vi
4.3.4 Shifting the range....................................................................................................4-8
4.4 Measuring Depth, Time.......................................................................................................4-9
4.5 Reducing Interference.........................................................................................................4-9
4.6 Reducing Low Level Noise................................................................................................4-10
4.7 Erasing Weak Echoes.......................................................................................................4-11
4.8 White Marker.....................................................................................................................4-12
4.9 Picture Advance Speed.....................................................................................................4-12
4.9.1 Advancement independent of ship’s speed ..........................................................4-12
4.9.2 Advancement synchronized with ship’s speed......................................................4-13
4.10 Display Colors...................................................................................................................4-14
4.11 Alarms ...............................................................................................................................4-15
4.11.1 Audio alarm on/off.................................................................................................4-15
4.11.2 Bottom alarm.........................................................................................................4-16
4.11.3 Fish alarm .............................................................................................................4-16
4.11.4 Fish alarm (B/L).....................................................................................................4-17
4.11.5 Water temperature alarm......................................................................................4-17
4.11.6 When an alarm setting is violated.........................................................................4-18
4.12 Water Temperature Graph.................................................................................................4-19
4.13 Changing Pulse Repetition Rate.......................................................................................4-19
4.14 Saving Sounder Picture to an SD Card.............................................................................4-20
4.15 Interpreting the Sounder Display.......................................................................................4-20
4.15.1 Zero line ................................................................................................................4-20
4.15.2 Bottom echo..........................................................................................................4-21
4.15.3 Fish school echoes ...............................................................................................4-22
4.15.4 Surface noise/Aeration..........................................................................................4-22
5. AIS OPERATION ...................................................................................................5-1
5.1 Turning AIS Feature On/Off.................................................................................................5-1
5.2 AIS Symbols........................................................................................................................5-3
5.3 Setting Number of AIS Targets to Display...........................................................................5-3
5.4 Activating Targets................................................................................................................5-4
5.5 Displaying Target Data........................................................................................................5-4
5.6 Lost Target...........................................................................................................................5-5
5.7 Setting CPA and TCPA........................................................................................................5-5
5.8 Proximity Alarm ...................................................................................................................5-6
5.9 Showing, Hiding AIS Target Tracks.....................................................................................5-7
5.10 Choosing Vector Time.........................................................................................................5-7
5.11 Displaying Past Positions of AIS Targets.............................................................................5-8
6. DATA TRANSFER..................................................................................................6-1
6.1 Memory Card Operations....................................................................................................6-1
6.1.1 Deleting all data from memory cards (other than chart data)..................................6-1
6.1.2 Saving data to a memory card................................................................................6-2
6.1.3 Playing back data from a memory card...................................................................6-3
6.2 Uploading, Downloading Data.............................................................................................6-4
6.2.1 Setting communication software on the PC............................................................6-4
6.2.2 Uploading or downloading data...............................................................................6-4
6.3 Loading Waypoint Data from Yeoman.................................................................................6-7
6.4 Receiving Data Via Network Equipment.............................................................................6-8
6.5 Outputting Data Through the Network.................................................................................6-9
7. CUSTOMIZING YOUR UNIT..................................................................................7-1
7.1 General Setup.....................................................................................................................7-1
7.2 Radar Setup........................................................................................................................7-4
7.2.1 Radar display setup................................................................................................7-4
7.2.2 Radar range setup..................................................................................................7-7
Page 8

TABLE OF CONTENTS
vii
7.2.3 Function key setup................................................................................................. 7-8
7.3 Plotter Setup..................................................................................................................... 7-10
7.3.1 Navigation options................................................................................................ 7-10
7.3.2 Function key setup................................................................................................7-11
7.4 Chart Setup ...................................................................................................................... 7-14
7.4.1 Chart offset........................................................................................................... 7-14
7.4.2 Navionics GOLD chart attributes..........................................................................7-15
7.4.3 C-MAP chart attributes......................................................................................... 7-16
7.5 Data Boxes Setup ............................................................................................................ 7-22
7.6 Hot Page Setup................................................................................................................ 7-23
7.7 Navigator Setup................................................................................................................ 7-24
7.7.1 Navigation data source......................................................................................... 7-24
7.7.2 FURUNO BB GPS receiver setup........................................................................ 7-26
7.7.3 TD display setup.................................................................................................. 7-29
7.8 Nav Data Display Setup................................................................................................... 7-32
7.9 Sounder Setup ................................................................................................................. 7-33
7.9.1 System setup........................................................................................................7-33
7.9.2 Sensor setup........................................................................................................ 7-36
7.9.3 Sounding range, zoom range, bottom lock range................................................ 7-37
7.9.4 Function key setup............................................................................................... 7-38
7.10 Nav Graphic Display Setup .............................................................................................. 7-40
8. MAINTENANCE, TROUBLESHOOTING..............................................................8-1
8.1 Preventive Maintenance..................................................................................................... 8-1
8.2 Replacement of Batteries................................................................................................... 8-2
8.3 Replacement of Fuse......................................................................................................... 8-2
8.4 Replacing the Magnetron................................................................................................... 8-3
8.5 Simple Troubleshooting...................................................................................................... 8-3
8.5.1 General...................................................................................................................8-3
8.5.2 Radar......................................................................................................................8-4
8.5.3 Plotter..................................................................................................................... 8-4
8.5.4 Sounder.................................................................................................................. 8-5
8.6 Diagnostics......................................................................................................................... 8-6
8.6.1 Memory I/O test...................................................................................................... 8-6
8.6.2 Test pattern............................................................................................................. 8-8
8.6.3 Keyboard, remote controller test.......................................................................... 8-10
8.7 GPS Status Display...........................................................................................................8-11
8.8 Clearing Memories........................................................................................................... 8-12
8.9 Error Messages................................................................................................................ 8-13
APPENDIX.................................................................................................................AP-1
Menu Overview.........................................................................................................................AP-1
Geodetic Chart List .................................................................................................................AP-10
Icons ........................................................................................................................................AP-11
SPECIFICATIONS ..................................................................................................... SP-1
INDEX......................................................................................................................... IN-1
Declaration of conformity
Page 9

viii
FOREWORD
A Word to the Owner of the Model 1724C/1734C Series
Marine Radar, GD-1720C Color Video Plotter
FURUNO Electric Company thanks you for purchasing the Model 1724C/1734C Series
Marine Radar, GD-1720C Color Video Plotter. We are confident you will discover why the
FURUNO name has become synonymous with quality and reliability.
For over 60 years FURUNO Electric Company has enjoyed an enviable reputation for
quality and reliability throughout the world. This dedication to excellence is furthered by our
extensive global network of agents and dealers.
Your equipment is designed and constructed to meet the rigorous demands of the marine
environment. However, no machine can perform its intended function unless properly
installed and maintained. Please carefully read and follow the operation and maintenance
procedures set forth in this manual.
We would appreciate feedback from you, the end-user, about whether we are achieving our
purposes.
Thank you for considering and purchasing FURUNO.
Features
The 1724C/1734C Radar Series and the GD-1720C Video Plotter work within our network
system called the “NavNet.” Each product has an IP address to communicate with NavNet
compatible products within the network, using TCP/IP protocol through an Ethernet
10BASE-T network.
The main features are as follows:
• Bright 7” screen visible even under direct sunlight.
• User friendly operation with combination of discrete keys, soft keys, and cursor pad.
• Accepts the following SD chart cards: NAVIONICS GOLD or C-MAP NT+/NT MAX charts,
depending on specification. All names mentioned above are registered trademarks of their
respective companies.
• Fast chart redraw.
• Built-in NavNet interface circuit board.
• Highly accurate, WAAS-capable 12-channel FURUNO BB GPS Receiver GP-320B/330B
and Weather Station WS-200 optionally available. (Hereafer these models are collectively
referred to as FURUNO BB GPS receiver.)
• User programmable function keys.
• Video sounder picture available with connection of the optional Network Sounder.
• ARP function (when connecting with MODEL 1824C series)
Page 10
ix
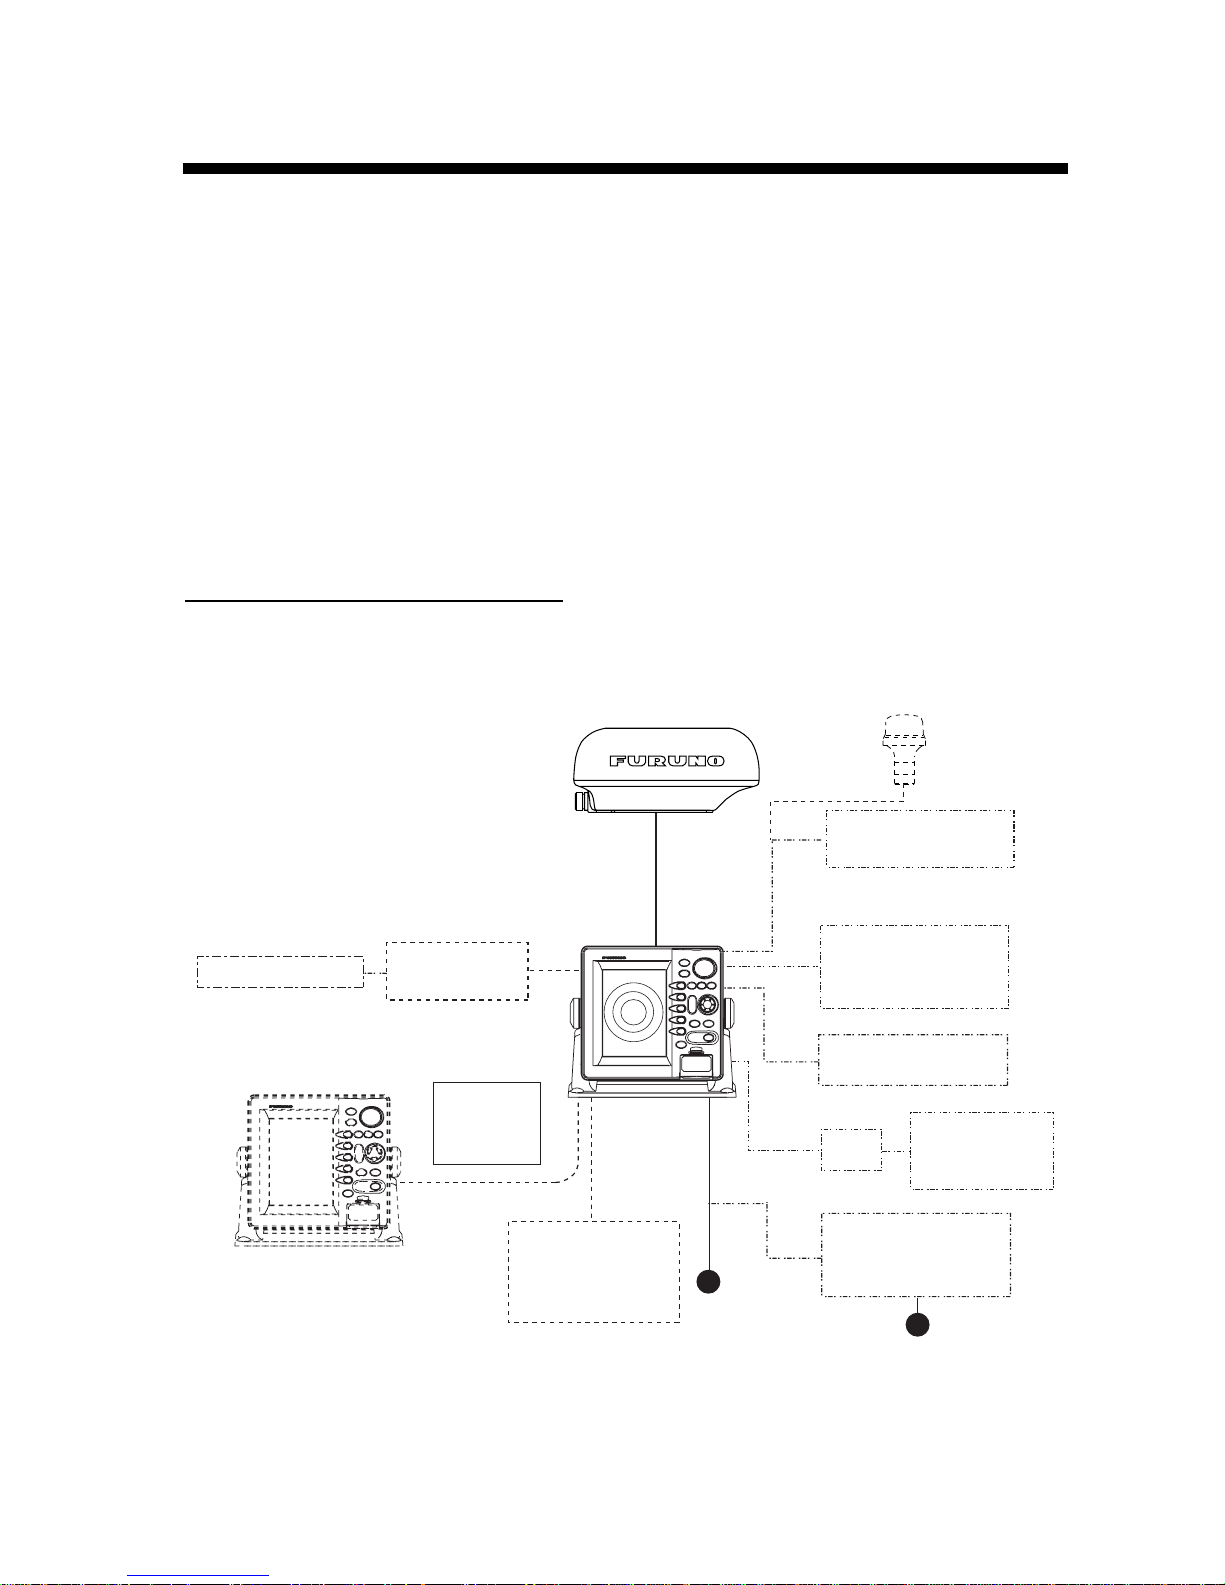
SYSTEM CONFIGURATIONS
All NavNet products incorporate a “network circuit board” to integrate each NavNet product
on board through an optional LAN cable (Ethernet 10BASE-T). Each NavNet product is
assigned an IP address to enable transfer of images between other NavNet products. For
example, video plotter pictures can be transferred to a radar and vice versa. Pictures
received via the NavNet may be adjusted at the receiving end.
The number of display units which may be installed depends on the number of network
sounder connected. For a system incorporating three or more products, a “hub” is required
to process data.
For one network sounder: one radar and three plotters, or four plotters
For two network sounder: one radar and two plotters, or four plotters
NavNet system (Model 1724C/1734C)
Antenna Unit
(ex. MODEL 1724C)
Network sounder
ETR-6/10N
ETR-30N
Heading
sensor
External buzzer
PC
Echo sounder
Echo sounder
Navigator
GPS Receiver
GP-320B/330B or Weather
Station WS-200
12-24 VDC
Other NavNet unit
(GD-1720C, etc.)
Rectifier
PR-62
100/110/115/220/230 VAC
1φ, 50/60 Hz
Display Unit
RDP-148
Remote
Controller
RMC-100
AIS transponder
AIS Interface
IF-1500AIS*
* Not required
for AIS Transponder
FA-150.
HUB
FA-30
AIS RECEIVER
NavNet system (Model 1724C/1734C)
Page 11
SYSTEM CONFIGURATIONS
x
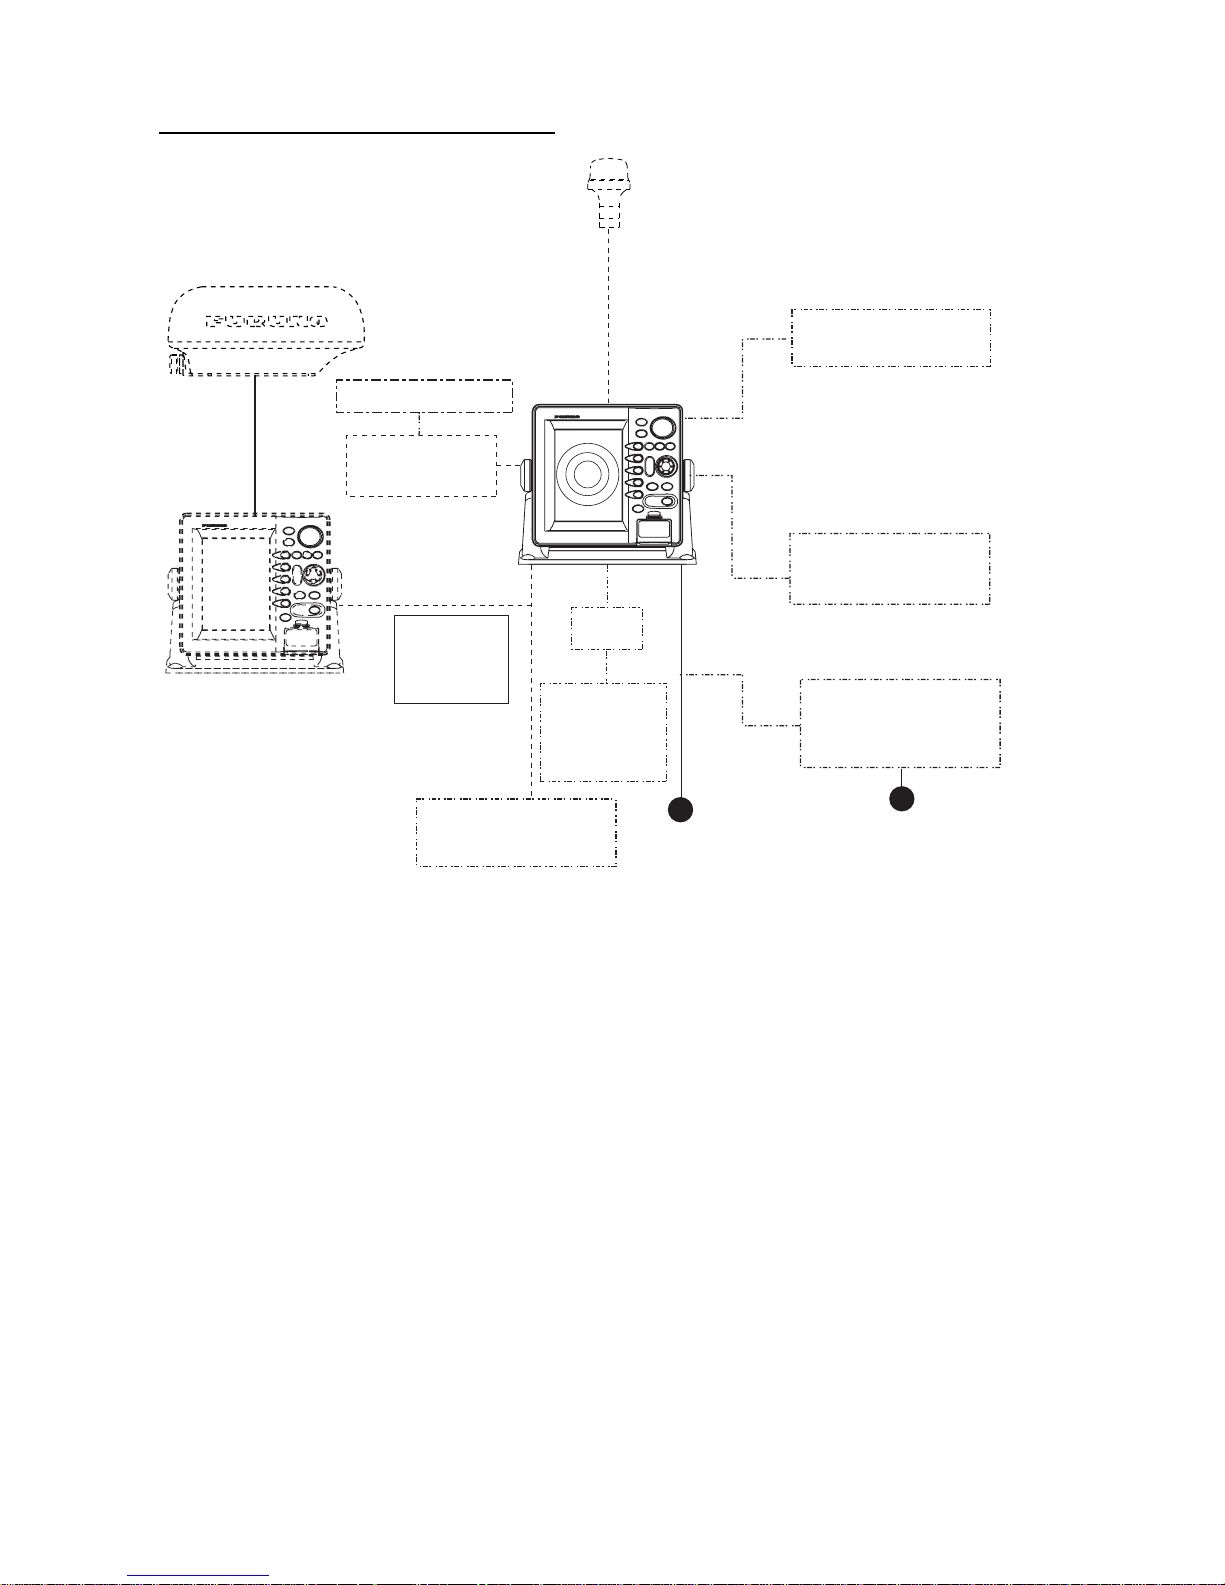
Single-unit NavNet system (GD-1720C)
Echo sounder
Heading sensor
External buzzer
GPS Receiver
GP-320B/330B or Weather
Station WS-200
12-24 VDC
Other NavNet unit
(MODEL 1724C etc.)
Rectifier
PR-62
100/110/115/220/230 VAC
1φ, 50/60 Hz
Display Unit
RDP-148
Remote
Controller
RMC-100
Network sounder
ETR-6/10N
AIS transponder
AIS Interface
IF-1500AIS*
* Not required
for AIS Transponder
FA-150.
HUB
FA-30
AIS RECEIVER
Single-unit NavNet system (GD-1720C)
Page 12
SYSTEM CONFIGURATIONS
xi
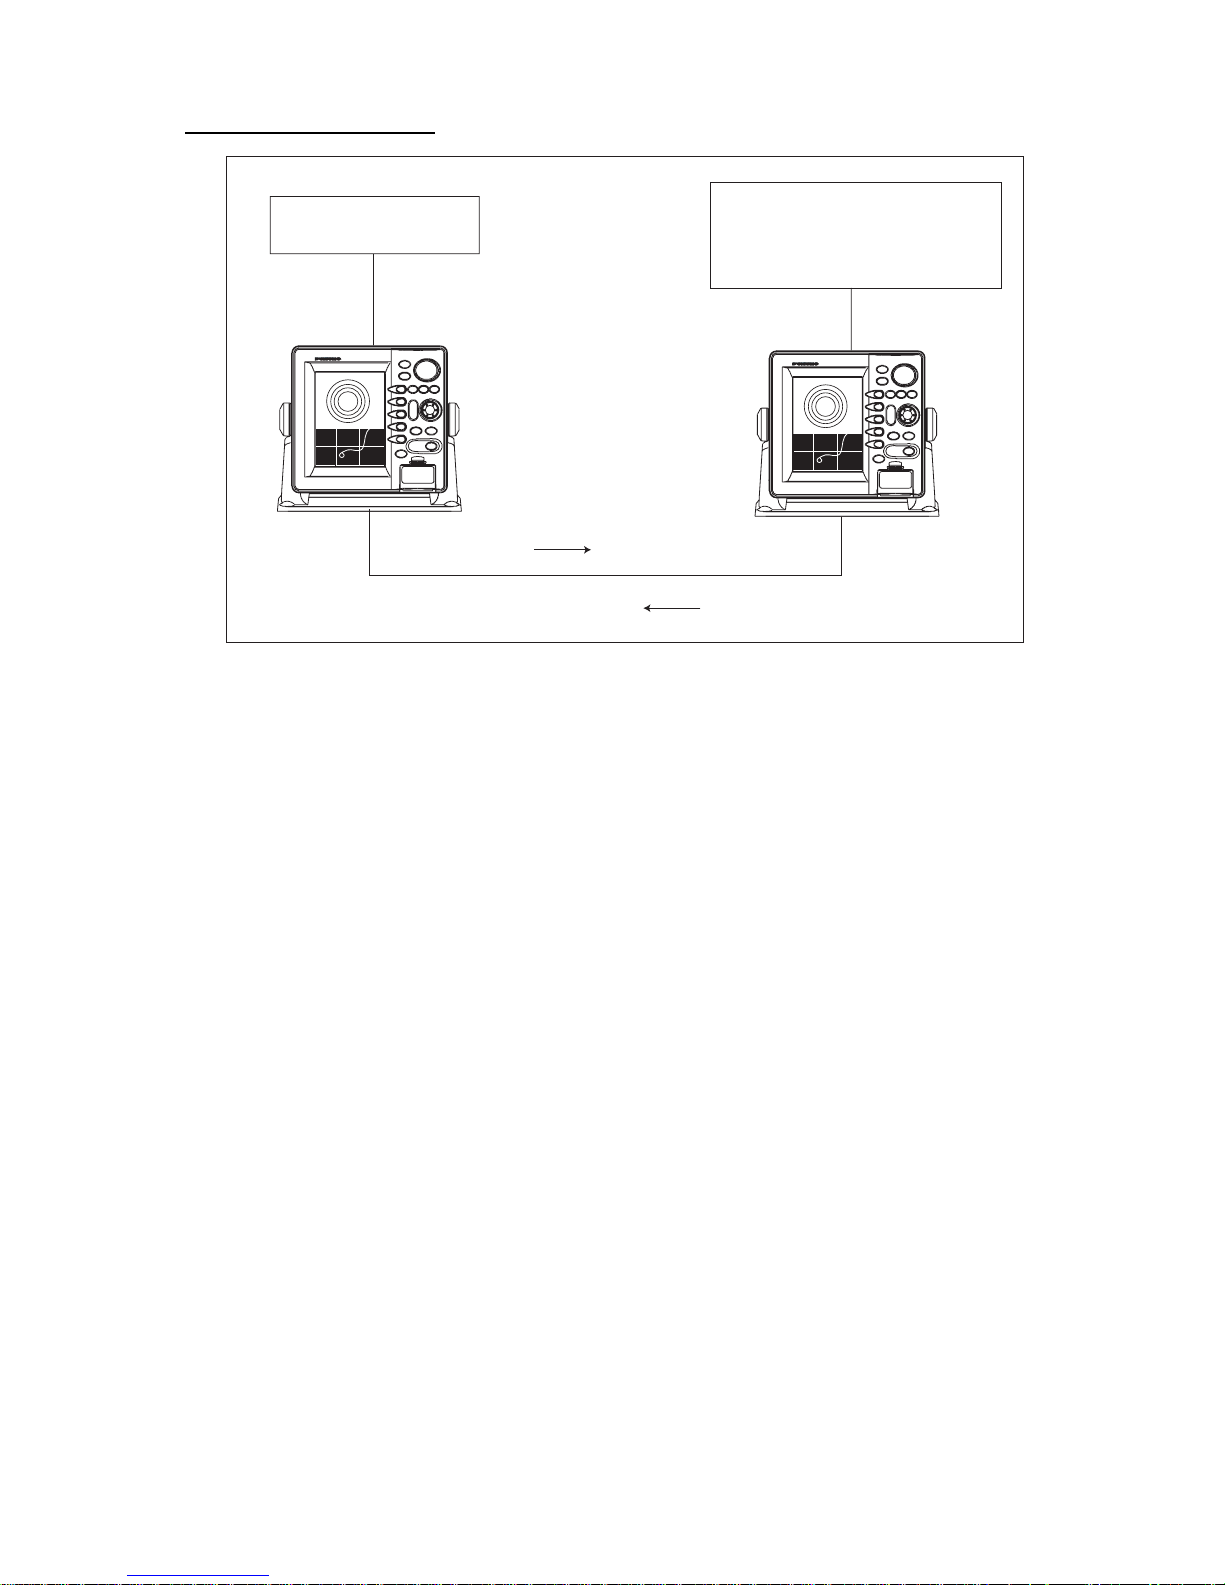
Two-unit NavNet system
Antenna Unit
GPS Receiver
GP-320B/330B or Weather
Station WS-200
Radar data
Plotter data
Two-unit NavNet system
Page 13
SYSTEM CONFIGURATIONS
xii
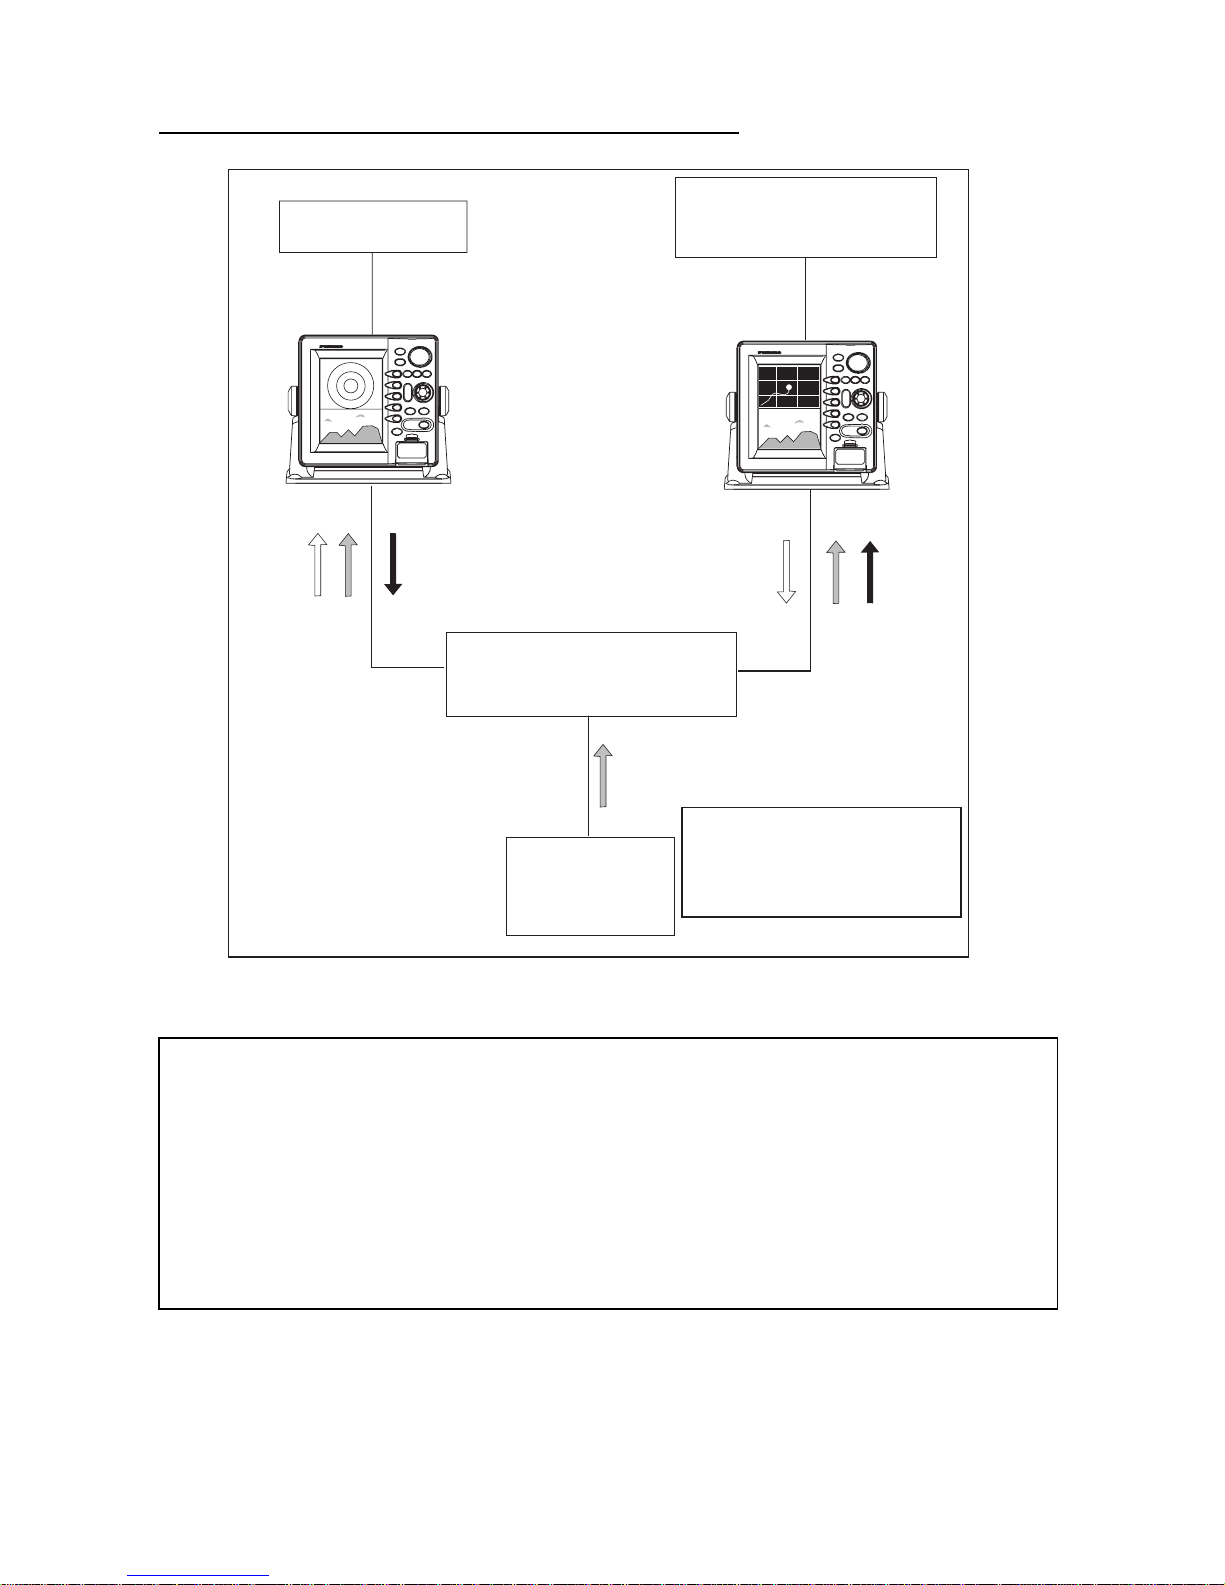
Three-or-more-unit NavNet system (Max. 4 display units)
Antenna Unit
GPS Receiver
GP-320B/330B or Weather
Station WS-200
HUB
Network sounder
ETR-6/10N
Sounder data
Radar data
Plotter data
Note: The picture disappears
10 seconds after the NavNet
cable is disconnected from a
"sub" NavNet display unit.
Three-or-more-unit NavNet system
COMPLIANCE WITH R&TTE DIRECTIVE
1999/5/EC This radar complies with the R&TTE Directive 1999/5/EC. In accordance with
Article 6-3 of this directive, FURUNO intends to put this radar on the market of the
following countries in EU as well other markets.
A
ustria, Belgium, Cyprus, Denmark, Estonia, Finland, France, Germany, Greece, Hungary,
Ireland, Italy, Latvia, Lithuania, Malta, Poland, Portugal, Slovenia, Spain, Sweden, The
Netherlands, United Kingdom, Iceland, Norway.
Page 14
1-1
1. OPERATIONAL OVERVIEW
This chapter provides the basic information nee ded to get you started using your radar,
video plotter.
1.1 Operating Controls
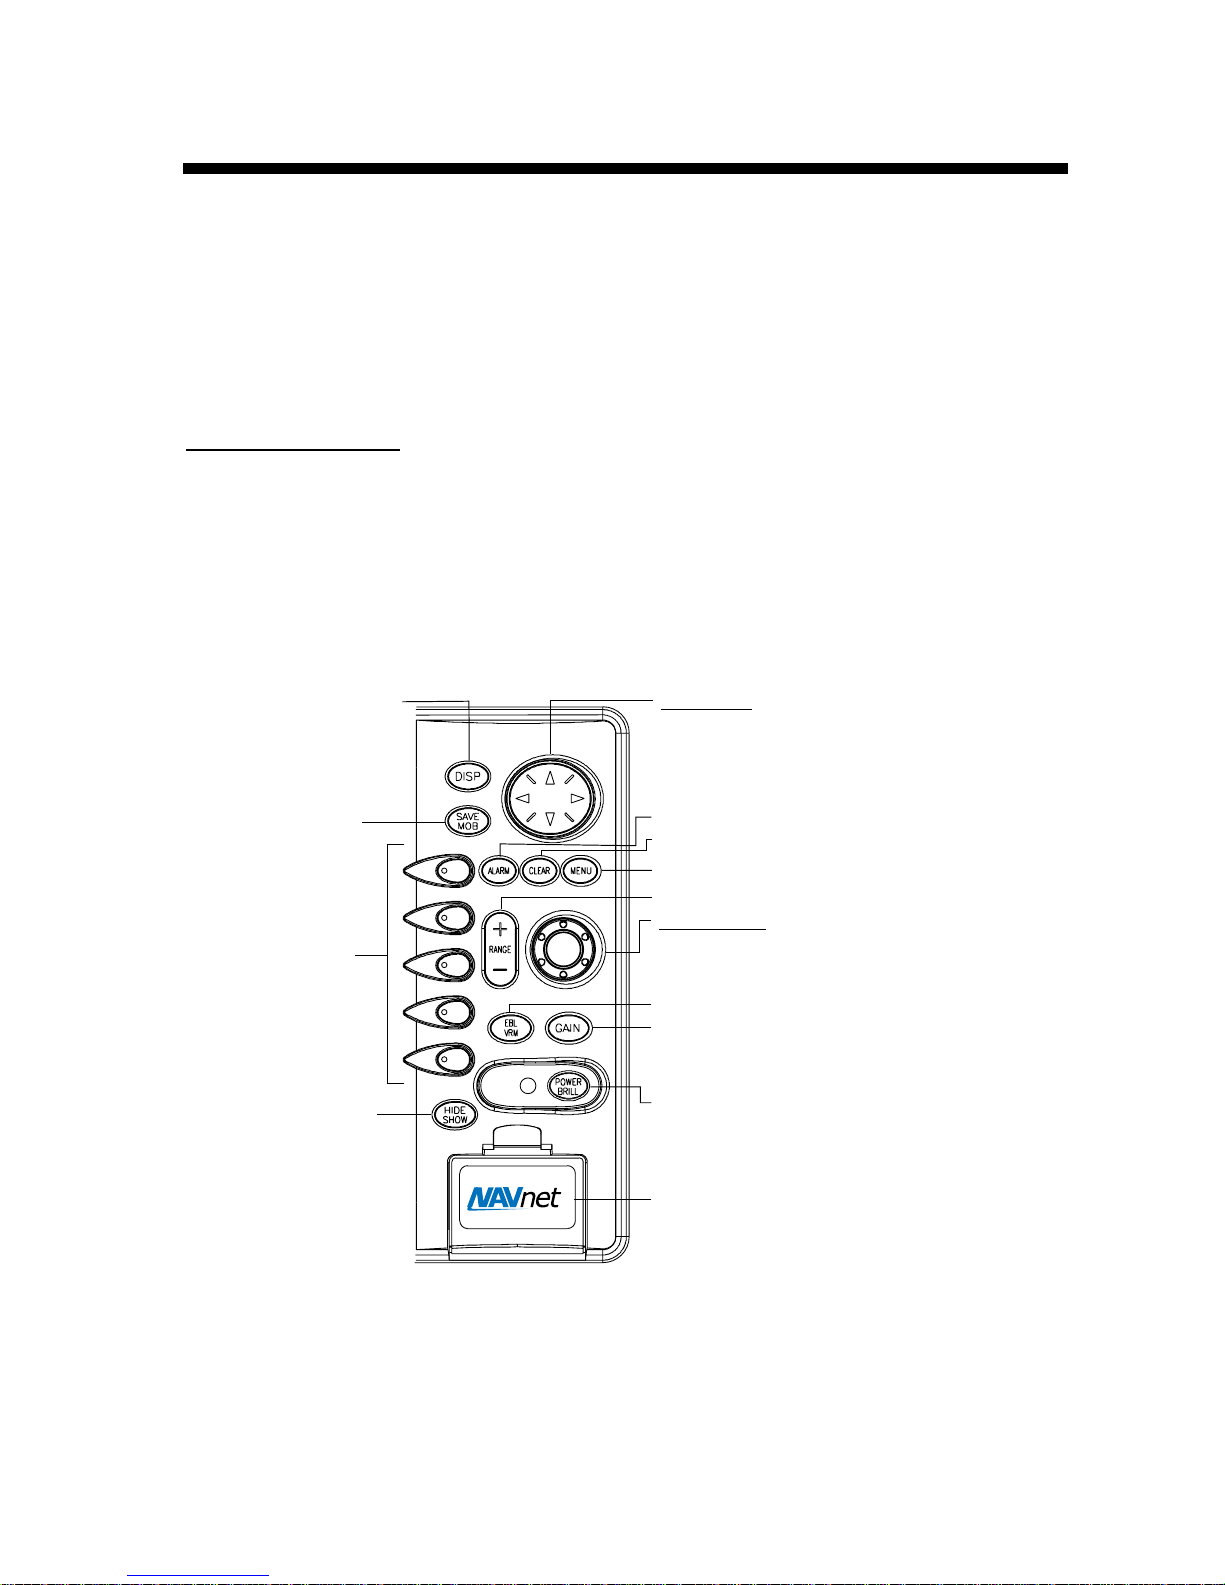
1.1.1 Display unit controls
Display unit controls
The radar, video plotter, sounder and chart systems are operated with the controls of the
display unit (and the remote controller). Ten keys are labeled and they provide the function
shown on their labels. The five soft keys provide various f unctions according to current
operating mode. The ENTER knob mainly funct ions t o register selections on the menu and
adjust the EBL, VRM and gain. The Cursor pad’s main function is to move the cursor
across the screen. When you correctly execute an operation, the unit generates a beep.
Invalid operation causes the unit to emit three beeps.
Cursor pad
Selects menu items and options;
shifts cursor. Press, release and
press again to change setting
consecutively.
Selects display mode.
Soft keys
Momentary press:
Registers own ship’s
position as a waypoint.
Press three seconds:
Marks man overboard
position.
Opens/closes the main menu.
Displays the soft keys for EBL/VRM.
Radar: Displays the soft keys for adjustment of
gain, A/C SEA, A/C RAIN and FTC.
Sounder: Adjusts gain.
Long press: Turns power on/off.
Momentary press: Opens the
display for adjustment of brilliance,
etc. For radar, switches STBY and TX.
ENTER knob
Push: Registers options on menus.
Rotate: Selects character; adjusts sensitivity
(sounder, radar); chooses menu items and options.
Clears data; erases selected mark.
Opens/closes the alarm menu.
Shows or hides the soft
keys, function keys,
nav data alternately.
Chart slot
Selects a range.
Page 15
1. OPERATIONAL OVERVIEW
1-2
Soft keys
The funct ion of the five soft keys changes accordi ng to the operation. Their labels for their
current funct ions are show n on the screen to the left of the keys. To hide or show the soft
keys, pres s the HIDE/SHOW key. Each press of the key shows preset soft keys, user
function keys or turns off navi gation information (at the top of the s c reen) .
SOFT
KEYS
Display unit
Some soft keys show the current s et ting of a soft key in r everse video as show n below.
BRIDGE
FISH
WPT 002
34° 22. 3456'N 359.9°M TRIP NU
080° 22. 3456'E
19.9 kt 99.9 nm
Current option
shown in reverse video
MODE
NTH UP
NAV
POS
MARK
ENTRY
D.BOX
ON/OFF
16.0nm
Plotter displays
Page 16

1. OPERATIONAL OVERVIEW
1-3
1.1.2 Remote controller
SAVE
RANGE
DISP
MOB
ABC
1
DEF
2
GHI
MNO
4
JKL
STU
7
VWX
65
98
YZ&
PQR
0
GAIN
’#
EBL / VRM
ENT
WPT
MARK
ENT
CNTL
CENTER
ALARM
SK3SK1 SK2
HIDE /SHOW
SK4 SK5
TX /STBY
BRILL
CLEAR
TONE
MENU
ACQ
3
Operating distance
90°: Up to 5 m
±45°: Up to 3 m
Replace the batteries (AA) when the
distance from which the display
unit can be operated shortens.
Note: The remote controller may
become damaged if dropped.
Mishandling of the remote
controller is not covered by
the warranty.
Remote controller
.
Key Function Key Function
RANGE Same as RANGE key on
display unit.
ENT Same as ENTER knob on
display unit.
DISP Same as DISP key on
display unit.
CLEAR Same as CLEAR key on
display unit.
SAVE MOB Same as SAVE/MOB key on
display unit.
MENU Same as MENU key on
display unit.
Ten keys Enter alphanumerics. BRILL Adjusts display brilliance.
EBL/VRM Same as EBL/VRM key on
display unit.
TONE Not used.
GAIN Same as GAIN key on
display unit.
TX/STBY Toggles radar between
standby and transmit.
WPT Displays “alphabet” WPT list
on plotter display.
ACQ Acquires radar target.
(Requires radar source
equipped with ARP.)
MARK ENT Same as MA RK ENTRY soft
key.
ALARM Same as ALARM key on the
display unit.
CENTER Returns own ship to screen
center on plotter display.
HIDE/SHOW Same as HIDE/SHOW key
on display unit.
CNTL Switches control between
displays on combination
displays.
SK1 – SK5
(soft keys)
Same as soft keys on display
unit.
Page 17

1. OPERATIONAL OVERVIEW
1-4
1.2 Inserting a Chart Card
Your unit r eads S D c ar ds , in the following formats: Navi onics GOLD Chart car ds or C-MAP
NT+/NT M AX chart cards, depending on the type of display unit you have. I ns er t the
appropriat e c har t card for your area as follows :
1. Open the chart drive.
Chart slot
Display unit
2. Insert chart c ard label side up.
3. Close the lid.
To remove char t card, follow the steps shown below.
1. Press the MENU key to show the menu.
2. Press the SHOW/HIDE soft key.
3. Open the chart dr ive lid, and t hen push the card once an d then pull it out .
Note 1: Do not remove a c ar d while the chart is being drawn. This may cause the
equipment to freeze.
Note 2: Do not insert or remove a card while the pow er is on. This may cause t he
equipment to freeze.
Note 3: For multiple display units, do not use the sam e c har t c ard type in m or e t han one
display unit.
Note 4: Remove the card with care; rough handling can damage the card and destroy i t s
contents.
Page 18

1. OPERATIONAL OVERVIEW
1-5
1.3 Turning the Unit On/Off
Press the POWER/BRILL key to turn the unit on. A beep sounds and then the equipment
shows the startup NavNet screen (about 20 seconds), the product information screen,
startup test results and chart usage disclaimer. During this period t he equipment is
inoperative. The startup test checks the ROM, RAM, internal bat tery and backup data for
proper operation, displaying the results for each as OK or NG (No Good). If NG appears an
appropriate message appears on the screen. For any NG, tr y to press any key to go to t he
chart disclaimer screen, then perform the diagn ostic test as shown in the paragraph “8.6
Diagnostics.”
For start up with the radar display, the magnetron takes from 60 seconds to 90seconds
(depending on radar model) to warm up before the radar can be operated. The time
remaining for warming up of the magnetron is counted down at the center of the display.
You may press any key at the chart disclaimer screen to show the last-used display, or wait
several seconds to let the equipment do it for you.
To turn the unit off, press and hold down the POWER/BRILL key until the screen goes dark
(approx. 3 sec.). To protect the LCD attach the hard cover. Note that the network sounder
will be turned off approx. three minutes after turning off the power. This is due to the
system’s electrical characteristics.
Note: The first time you turn on the power (or any time the power is applied after a memory
reset), you are asked if you want to start the simulation mode, which provides simulated
operation of the equipment after the installation mode selection. Push the ENTER knob to
start the simulation mode, or press the CLEAR key to start normal operation. F or f urt her
details about the simulation mode, see the paragraph “1.10 Simulation Display.”
Page 19

1. OPERATIONAL OVERVIEW
1-6
1.4 Display Brilliance, Panel Brilliance, Hue
You can adjust display brilliance, panel brilliance and hue as shown below.
1.4.1 Display brilliance, panel brilliance
1. Press the POWER/BRILL key momentarily. A set of sof t keys for adjustment of
brilliance and hue appear.
.250/ 319.9
°
M
.125nm
SP
H-UP
PANEL
BRILL
HUE
RETURN
DISPLAY BRILLIANCE
8
Current selection is higtlighted.
DISPLY
BRILL
RADAR
STBY
BRILL
CONTST
Brilliance adjustment soft keys
2. Press the DISPLY BRILL or PANEL BRILL soft key as appropriate. An adjustment
window appears at the bottom of the screen. This window shows the name of the item
selected for adjustment plus current brilliance l evel, by bar graph.
DISPLAY BRILLIANCE
8
PANEL BRILLIANCE
8
Display brilliance Panel brilliance
Display brilliance and panel brilliance windows
3. Adjust the ENTER knob, clockwise to raise the setting or counterclockwis e t o decrease
it. You may also use the soft key pressed at step 2. Eight levels of display brilliance and
panel brilliance are available.
4. Hit the RETURN soft key to finish.
Note 1: If the unit is turned off with m inimum brilliance, the screen will be dark at the next
power-up. Press the POWER/BRILL key consecutively to adjust the brilliance.
Note 2: This equipment does not have a contrast cont rol.
Page 20

1. OPERATIONAL OVERVIEW
1-7
1.4.2 Hue
You may select the colors for the radar, plotter and overlay displays as below.
1. Press the POWER/BRILL key momentarily.
2. Press the HUE soft key to show the hue setting window.
HUE
▲
¡
DAY
¡
NIGHT
¡
TWILIGHT
¤
MANUAL SET
▼
Hue window
3. Operate the Cursor pad to select hue desired, referring to the table below. MANUAL
SET follows the color settings on the CHART DETAI LS menu for the plotter and the
RADAR DISPLAY SETUP menu for the radar.
Night Day Twilight
Characters Red Black Green
Radar ring Red Green Green
Radar echo Orange Multi Orange
Background Black White Blue**
Landmass (plotter) Orange* Light-orange Orange
* = Beige and light-beige on C-MAP display unit.
**= Black for Overlay screen
4. Hit the RETURN soft key to finish.
Note: When using the overlay screen, the own ship track will be hidden if the radar
background and own ship track are blue and the “MANUAL SET” hue sett ing is used. In this
case, set HUE to other position and then return to “MANUAL” to show the own ship track in
black.
Page 21
1. OPERATIONAL OVERVIEW
1-8
1.5 Selecting a Display
1.5.1 Display modes
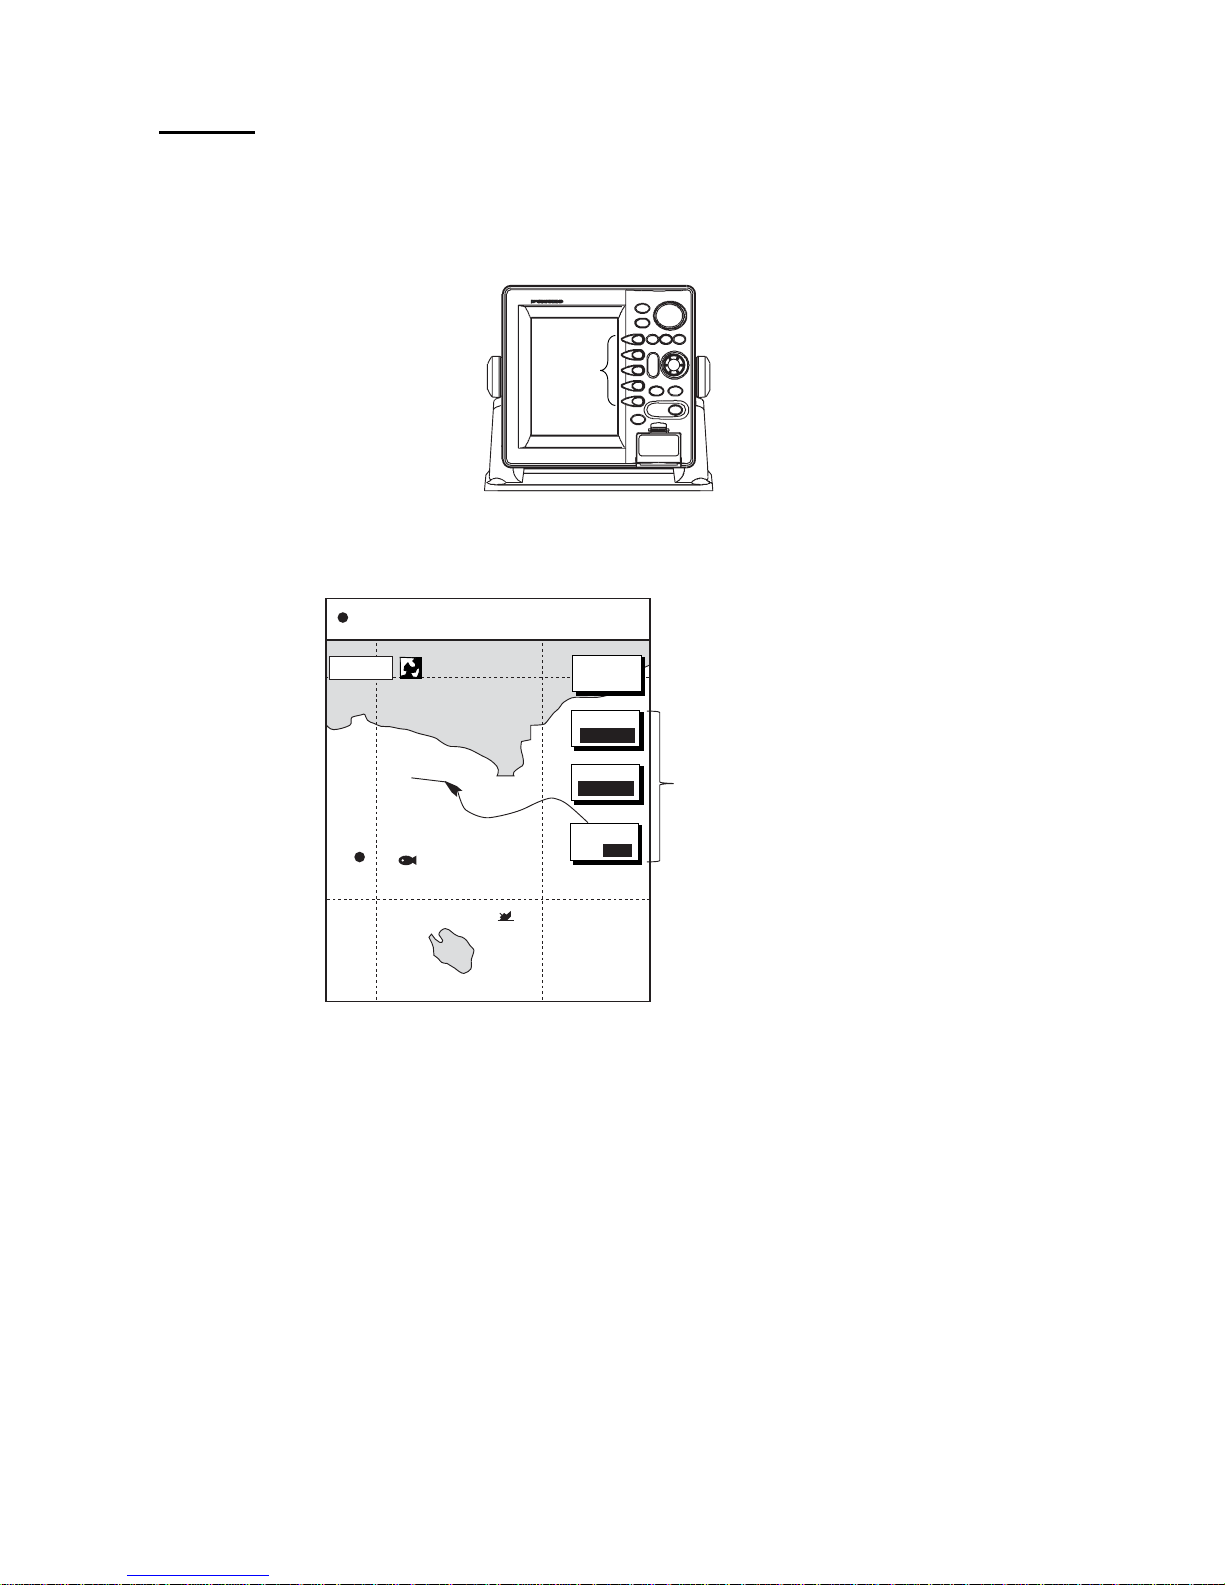
If you have a radar, navigator and network sounder five full-screen displays are available:
radar, plotter, echo sounder, nav data and overlay. In addit ion to the full-screen display, you
can divide the screen into halves and thirds to show two and three sets of images on a
combination display.
Full screen
(Ex. radar)
Combination screen
(Ex. radar + sounder)
Overlay screen
(Radar and plotter,
color model only.
Requires L/L data)
Display screens
The table below shows the displays available with each screen type.
Screen type and available display screen
Full screen Combination scr een options
(half- or thirds-screen)
Overlay screen
options
Plotter, radar, sounder,
nav data, overlay
Plotter, radar, sounder,
compass (or wind), highway,
compass (or wind)/highway ,
nav data, overlay
Radar + plotter
Page 22
1. OPERATIONAL OVERVIEW
1-9
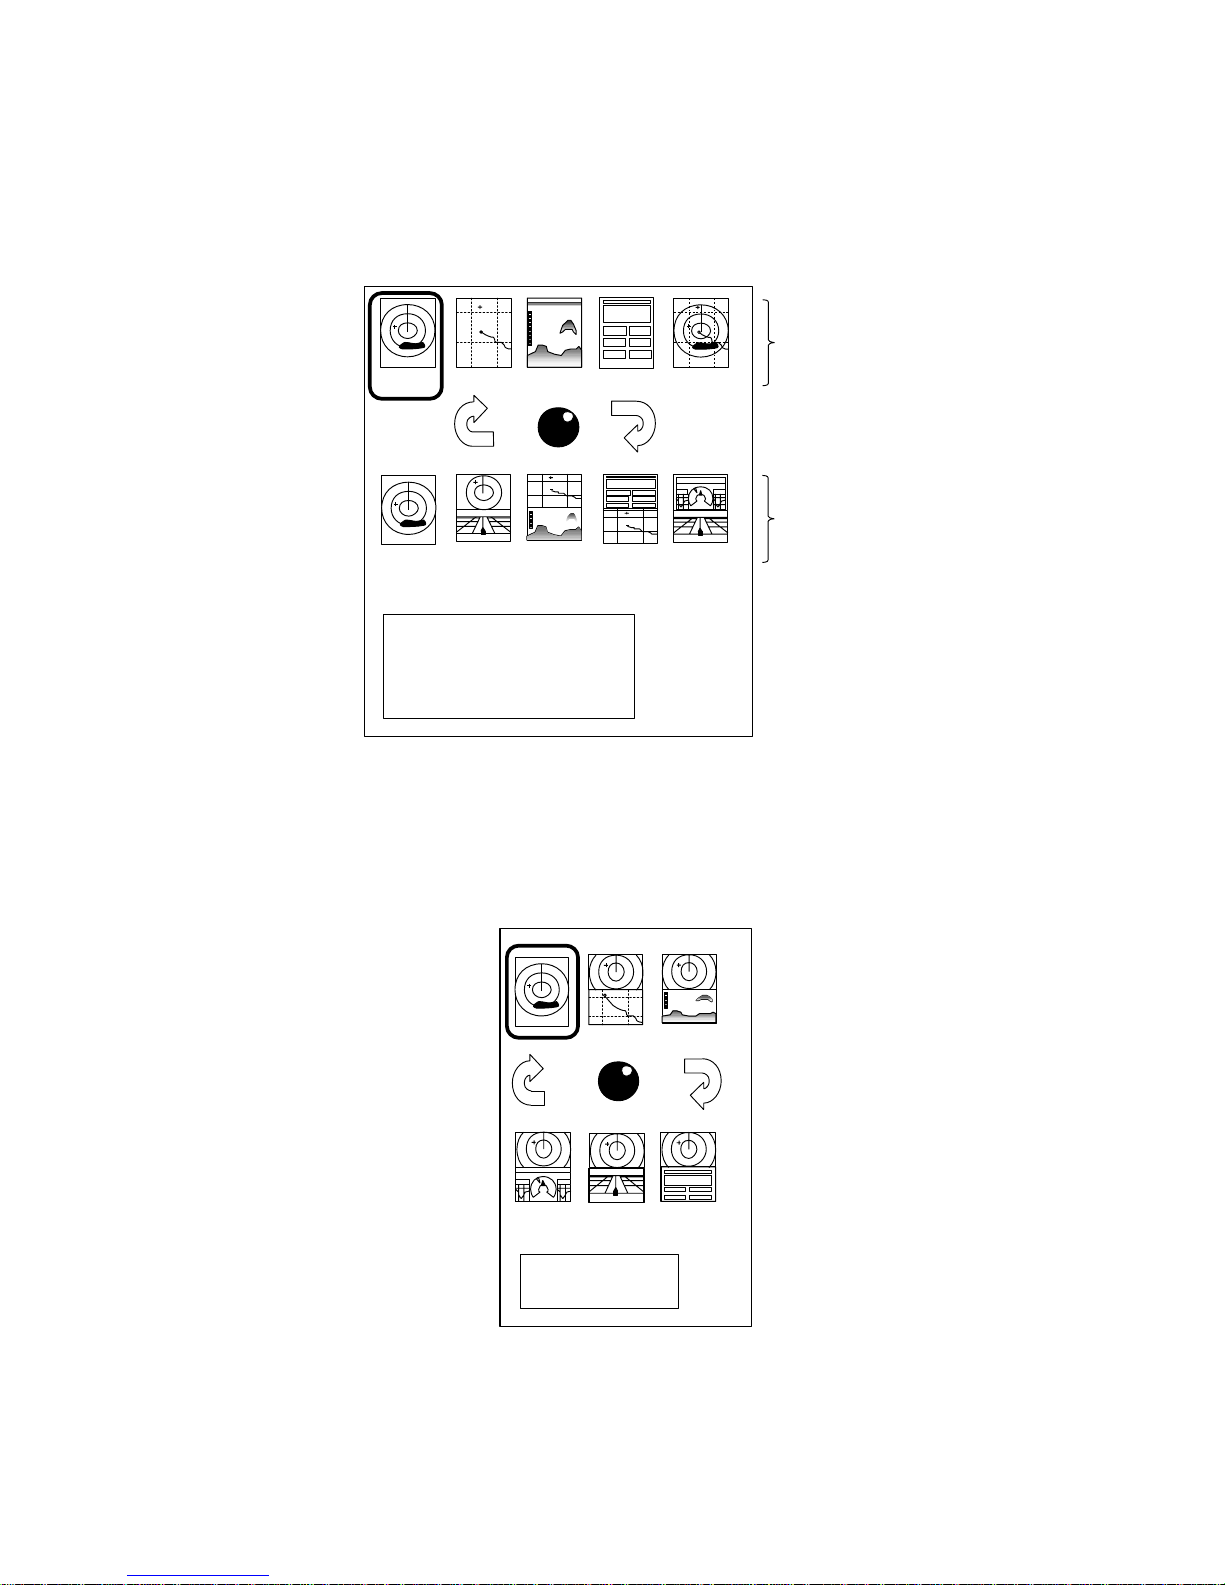
1.5.2 Selecting a display
1. Press the DISP key to show the display screen selection window. The icons of modes
not available are shaded. HOTPAGE 1-HOTPAGE 5 are user-arrangeable displays
called “hot pages,” which you can configure as you like. For further details, see the
paragraph “7.6 Hot Page Setup.”
HOTPAGE1 HOTPAGE2 HOTPAGE3 HOTPAGE4 HOTPAGE5
RADAR PLOTTER SOUNDER NAV DATA OVRLAY
· TURN KNOB TO SELECT MODE
AND PUSH KNOB TO ENTER.
· PUSH ANY SOFT KEY TO
SELECT IMAGE SOURCE.
Basic display
screens
Hot pages
Display screen selection window
2. Rotate the ENTER knob to select a basic display screen or a hot page screen.
3. Push the ENTER knob.
4. If you select a basic display screen, a group of appropriate combination displays appear.
In the example below, the radar combination screens are shown.
PUSH ENTER KNOB.
Radar combination screen selection window
5. Rotate the ENTER knob to select display desired.
6. Push the ENTER knob to finish.
Page 23

1. OPERATIONAL OVERVIEW
1-10
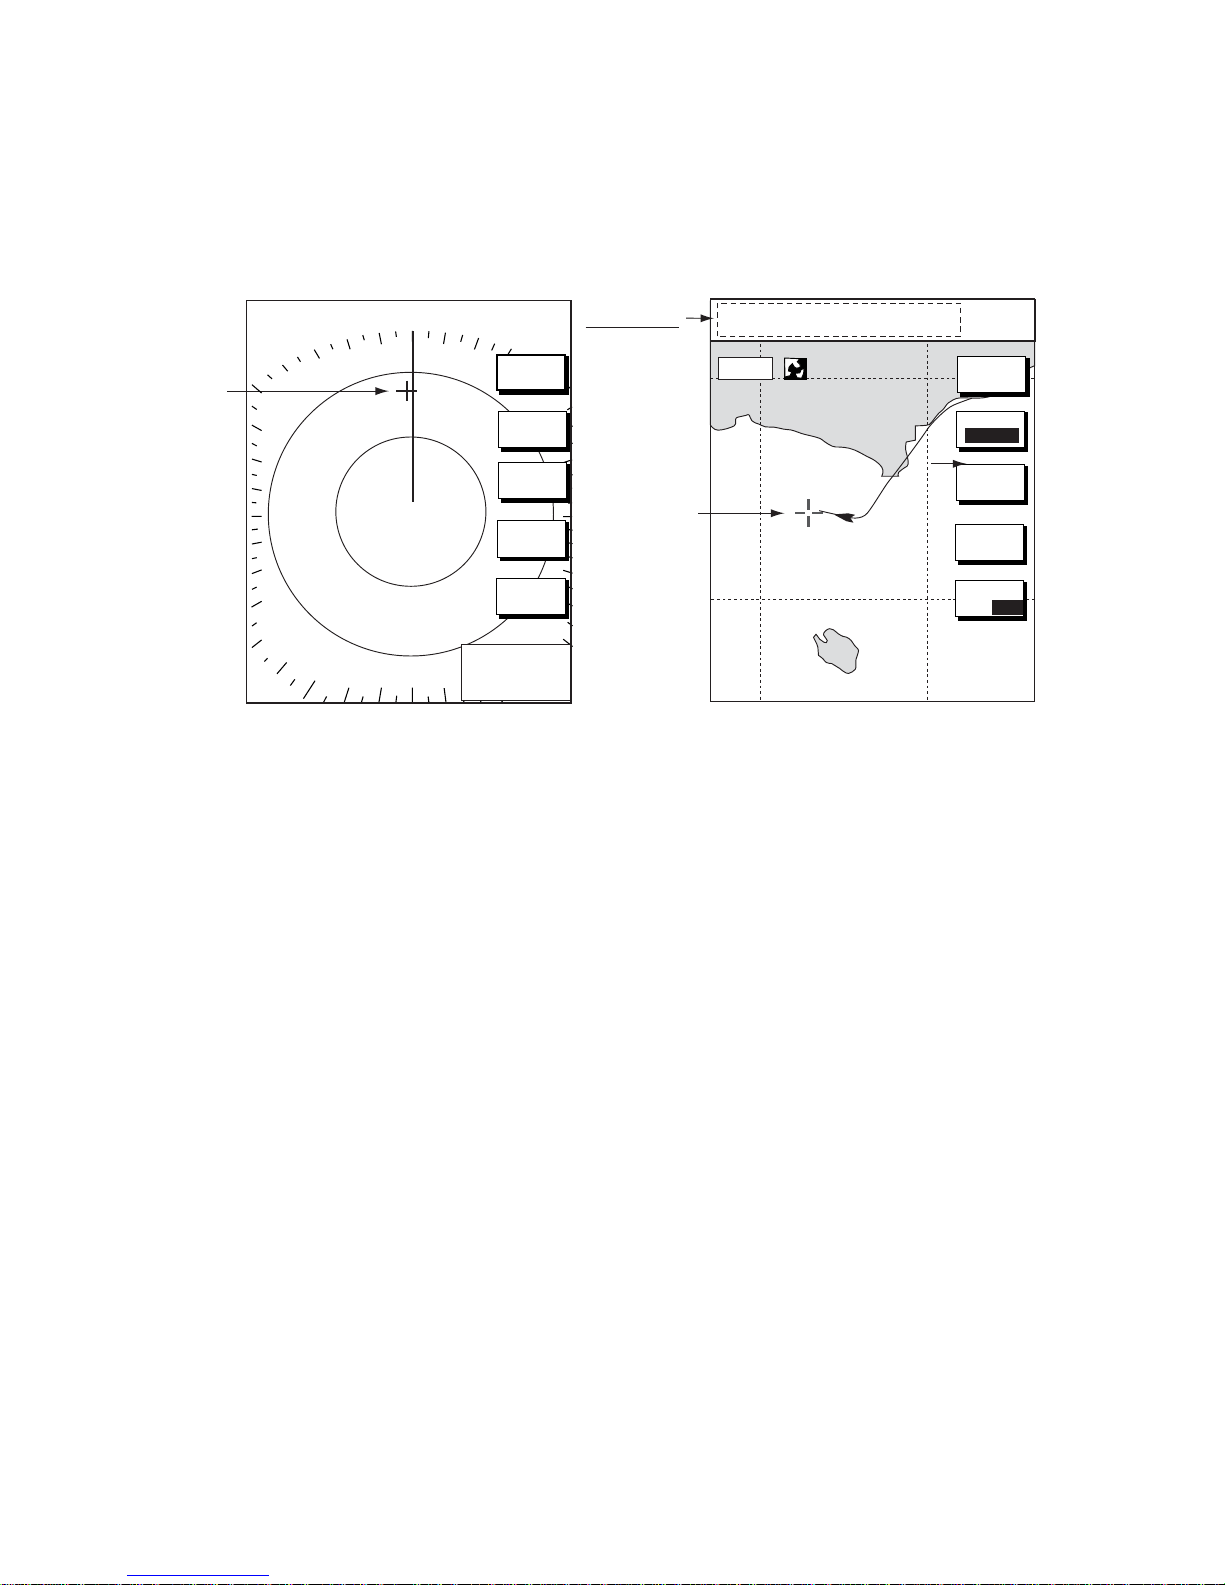
1.5.3 Switching control in combination and overlay screens
A soft key is provided in relevant c om bination and overlay screens to switch control
between displays. In the example below, the CNTRL PLOTT R and CNTRL RADAR soft
keys enable switching control between the plot ter and sounder screens in the
plotter/ s ounder combination display.
+
359.9
°
R
11.7nm
FISH
WP-002
34° 22. 3456'N 359.9°M
TRIP
NU
080° 22. 3456'E
19.9 kt 99.9 nm
MARK
ENTRY
MODE
NTH UP
NAV
POS
CNTRL
PLOTTR
CNTRL
PLOTTR
CNTL
RADAR
CNTRL
RADAR
To adjust
plotter
To adjust
radar
Radar display selected Plotter display selected
16.0nm
12
3nm
LP
H-UP
+
359.9
°
R
11.7nm
FISH
WP-002
34° 22. 3456'N 359.9°M
TRIP
NU
080° 22. 3456'E
19.9 kt 99.9 nm
16.0nm
12
3nm
LP
H-UP
SIGNAL
PROC.
CNTRL
RADAR
RADAR
DISPLY
NAV
FUNC
TARGET
ST-BY
ST-BY
How to switch control between modes in the plott er /sounder combination display
Page 24

1. OPERATIONAL OVERVIEW
1-11
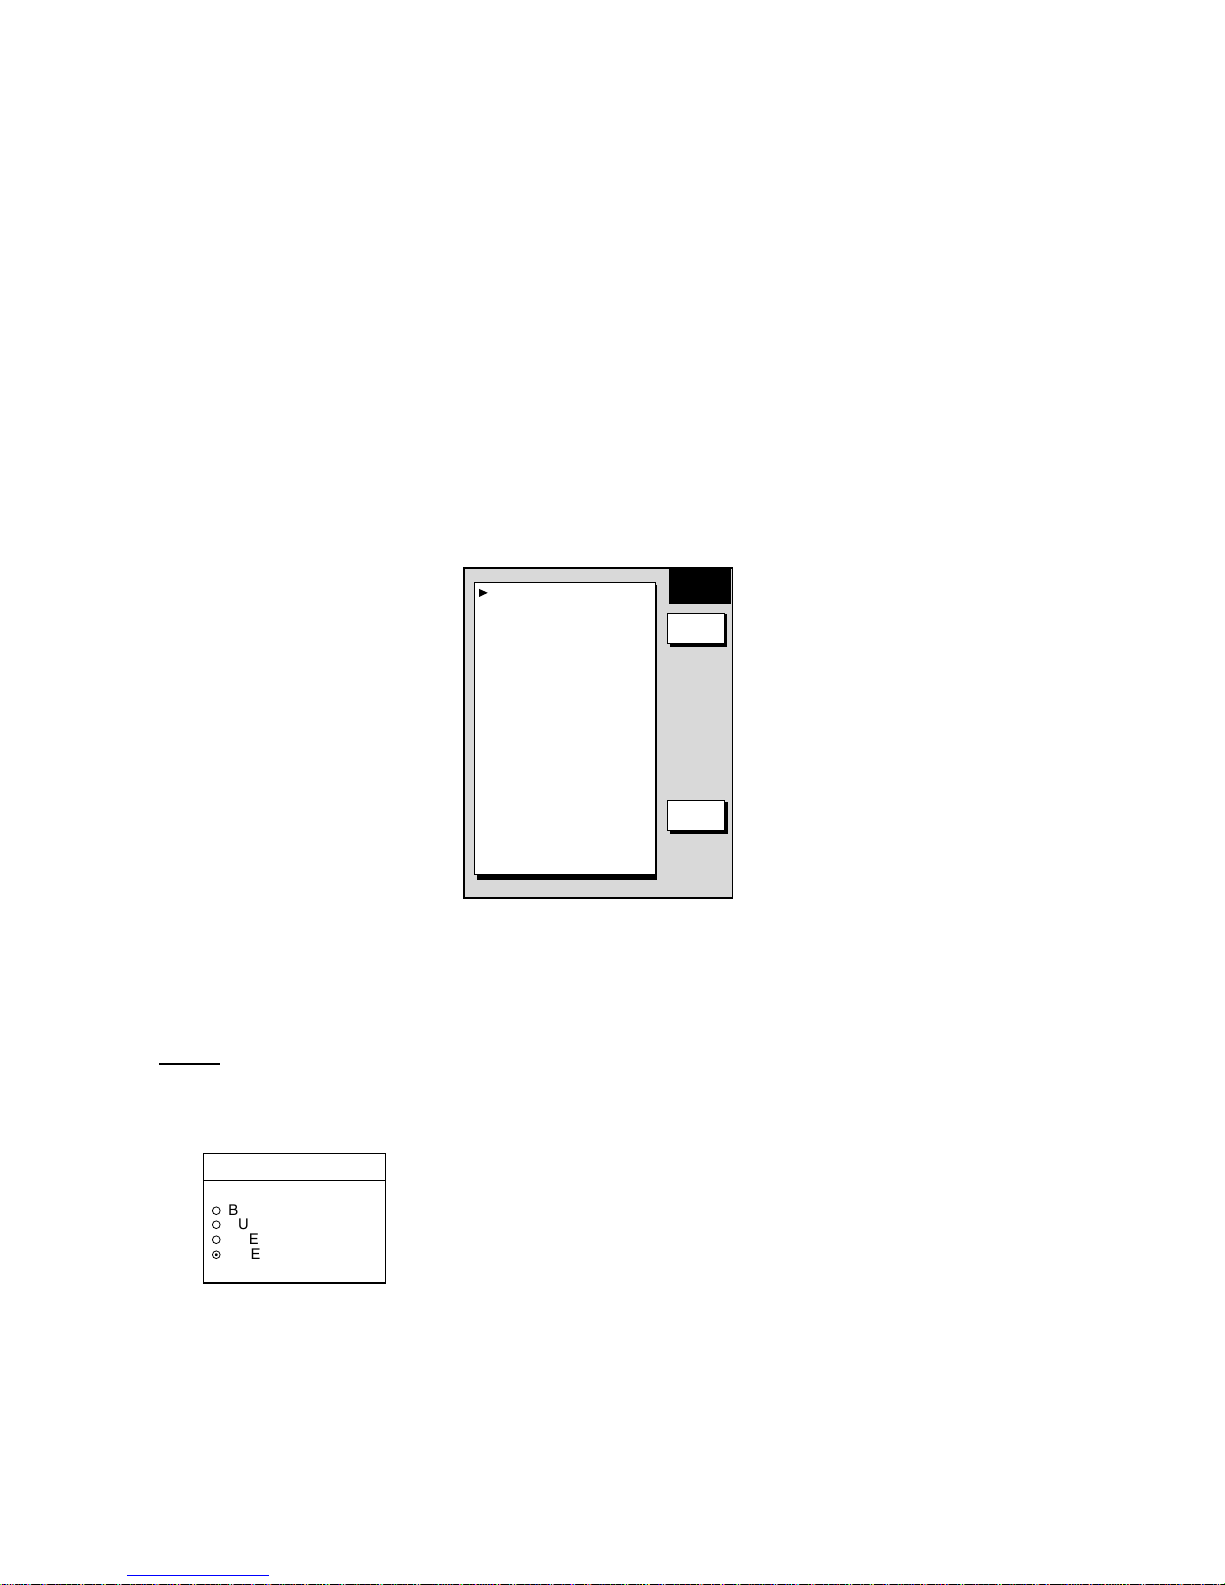
1.5.4 Selecting image source
When more than one network radar or network sounder is connecte d t o t he equipment, you
may select an image source for each as shown below. This is not necessary when onl y on e
network radar or network sounder is connected.
1. Press the DISP key.
2. Press any soft key to show the following display.
RADAR SOURCE
1 (HOST NAME: NAVNET1)
SOUNDER SOURCE*
SOUNDER _
IP ADDRESS
172.031.003.003
DEVICE NUMBER
2 (HOST NAME: NAVNET2)
▲
SELECT
SOURCE
EDIT
RETURN
IF THERE IS MORE THAN
ONE NETWORK RADAR OR
ECHO SOUNDER, YOU MAY
SELECT THE IMAGE
SOURCES FOR DISPLAY.
*: Do not change this setting.
Select source menu
3. Use the Cursor pad to select RADAR SOURCE, SOUNDER SOURCE or AUX
SOURCE as appropriate, then press the EDIT key.
Radar source
RADAR SOURCE
▲
¤
1 (NAVNET1)
¡
2 (NAVNET2)
¡
3 (NAVNET3)
¡
4 (NAVNET4)
▼
SOUNDER SOURCE
▲
¤
ETR0 (SOUNDER)
¡
ETR1 (SOUNDER1)
¡
ETR2 (SOUNDER2)
¡
ETR3 (SOUNDER3)
¡
ETR4 (SOUNDER4)
¡
ETR5 (SOUNDER5)
¡
ETR6 (SOUNDER6)
¡
ETR7 (SOUNDER7)
¡
ETR8 (SOUNDER8)
¡
ETR9 (SOUNDER9)
▼
Sounder source
Radar source and sounder source windows
4. Use the Cursor pad to choose source.
5. Push the ENTER knob to set.
6. Press the DISP key to finish.
7. Turn the power off and on again.
Page 25
1. OPERATIONAL OVERVIEW
1-12
1.6 Cursor pad, Cursor
The Cursor pad functions to shift the cursor, for measurement of range an d bear ing to a
location ( r adar ) and latitude and longitude position (plotter). Roll the Cursor pad to shift the
cursor. The cursor moves in the direction of Cursor pad rotation.
34° 22. 3456'N 272.4°M
TRIP
NU
080° 22. 3456'E
15.9 nm 99.9 nm
GOTO
CURSOR
MODE
NTH UP
CENTER
MARK
ENTRY
+
Cursor data
L/L position,
Range and
bearing from
own ship to
cursor
Cursor
16.0nm
D. BOX
ON/ OFF
Cursor
Radar display
Plotter display
.250/ 319.9
°
M
.125nm
SP
H-UP
+
359.9°R
0.24nm
RADAR
DISPLY
NAV
FUNC
ZOOM &
D. BOX
SIGNAL
PROC
TARGET
Cursor, cursor data
Page 26

1. OPERATIONAL OVERVIEW
1-13
1.7 Entering the MOB Mark, Setting MOB as
Destination
The MOB m ar k functions to mark man
overboard pos ition. You c an inscribe the
mark from any mode except nav data,
when play ing back data or conduct ing
any test. Note that this function requires
position data.
Note: The function of the SAVE/MOB
key depends on the set ting of SAVE
MOB KEY FUNCTION in the GE NE RA L
SETUP menu. The descripti on below
shows t he pr oc edur e us ing the default
setting. For further details, see Save
MOB Key Function on page 7-2.
1. Pres s and hold down t he SAVE/MOB key for about three seconds when someone falls
overboard. The display shows the waypoint num ber being saved (youngest empty
waypoi nt number, 001-999) followed by the M OB c onfirmation wi ndow.
Time remaining is counted down while pressing the SAVE/MOB key.
MAN OVER BOARD!
GO TO MOB?
YES ... PUSH ENTER KNOB
NO ... PUSH CLEAR KEY
WAYPOINT SAVED!
XXXWPT
CONTINUE PUSHING
FOR MOB!
XXX = Waypoint number
CONTINUE PUSHING
FOR MOB!
XX SEC
XX = Time remaining is counted down.
MOB mark messages
2. Push the ENTER knob to select the MOB position as the dest ination, or press the
CLEAR key to only mark current ship’s position as a waypoint. If y ou s elect the MOB
position as des tination;
• A full - s cr een r adar , plotter or overlay appears depending on the display in use. (If the
MOB key function is “M OB Without Confirmat ion” the range is automatically set to
0.5 nm.) Further, the waypoint marker appears on the radar display.
• The MOB m ar k “MOB” appears at the MOB position and a light-blue line runs
between it and current positi on. This line show s the shor t es t course to the MOB
position.
• Range and bearing to the MO B pos ition are shown in t he M OB data box.
To erase an MOB mark from the plotter display, you must first erase its corresponding
waypoint. Place the cursor on the MOB mark, then press the CLEAR key followed by
pushing the ENTER knob to erase the w aypoint. Then, repeat to er ase the MOB mar k .
Man
overboard
Range, bearing
Current
position
MOB
mark
MOB Data Box
Bearing and range
to MOB position
M
(MOB)
M
O
B
162.5°
M
0.49 nm
MOB concept
Page 27
1. OPERATIONAL OVERVIEW
1-14
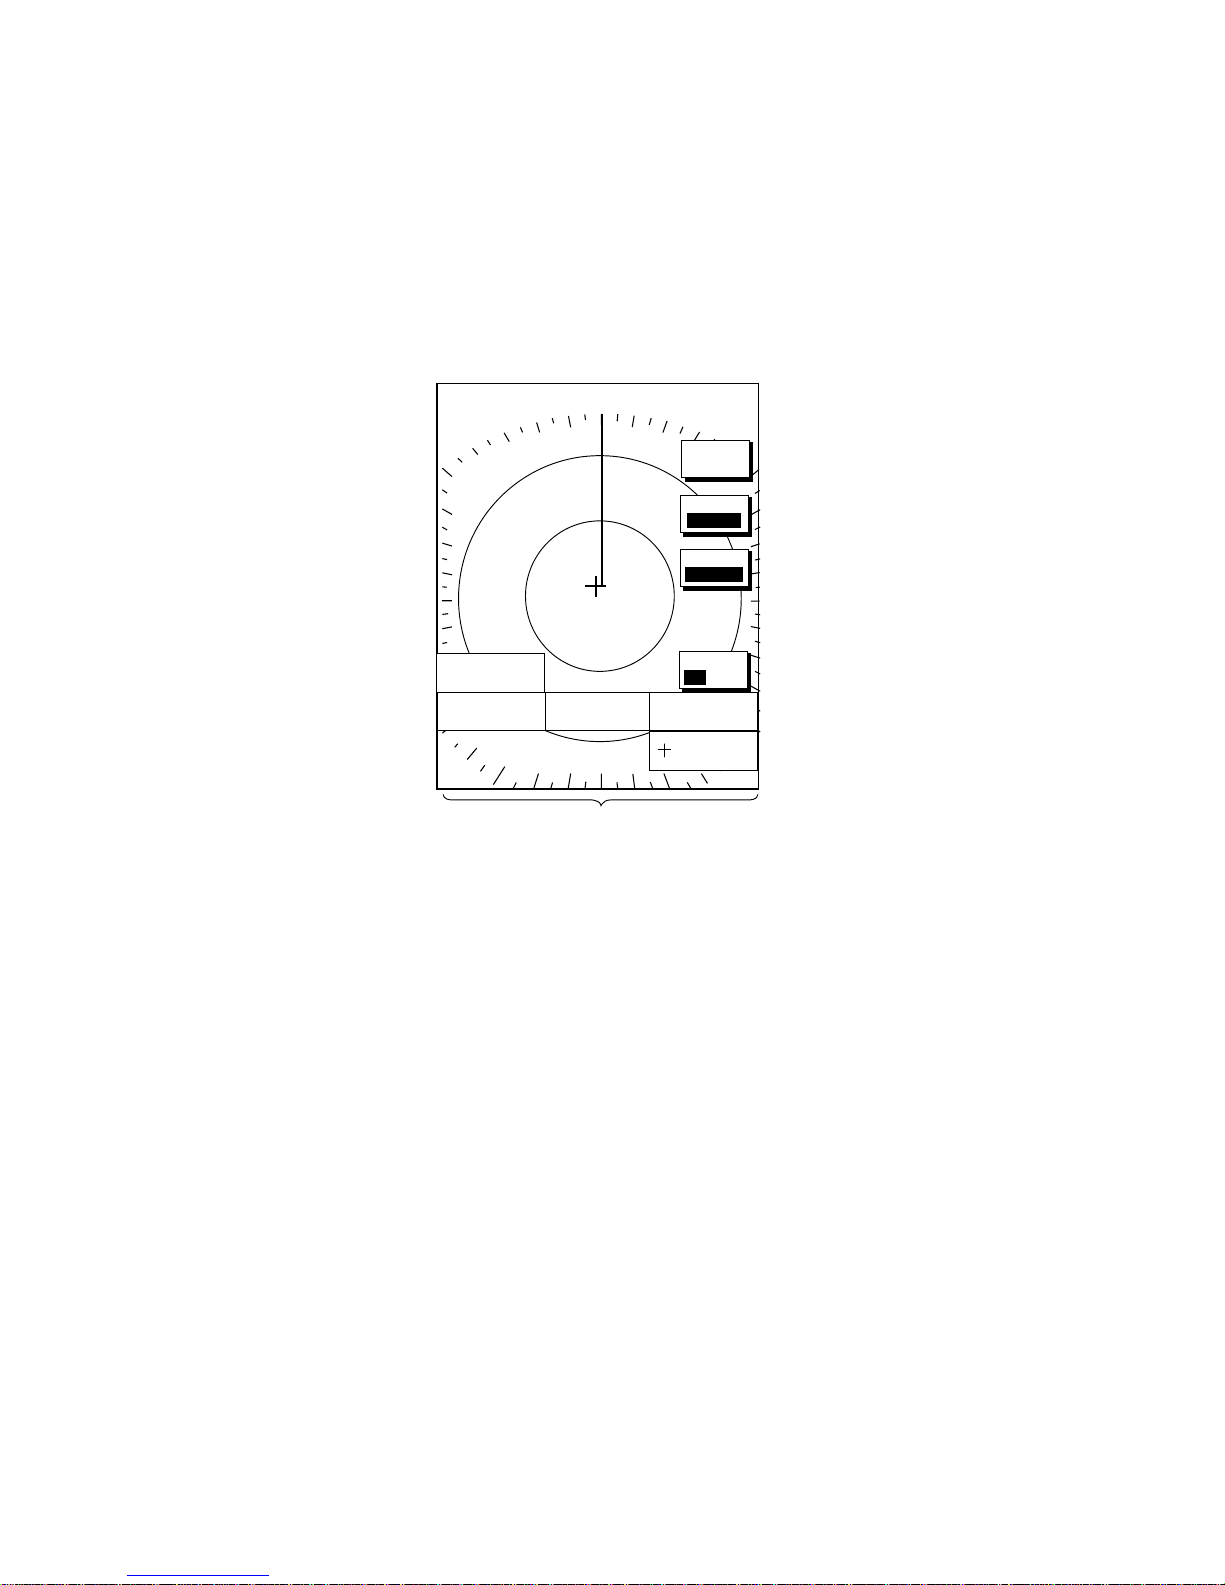
1.8 Data Boxes
Data boxes, providing navigation data, may be shown on any full-screen display. Up to six
data boxes (two in case of large characters) may be shown, and the default data boxes are
position (in latitude and longitude), course over ground, speed over ground and trip log. The
user may choose which data to display, where to locate it, and show or hide it as desired. In
addition, data boxes may be set independent ly for each display mode (plotter, radar,
sounder). For how to select data for the data boxes, see the paragraph “7.5 Data Boxes
Setup.”
.250/ 319.9
°
M
.125nm
SP
H-UP
Data boxes
MODE
NTH UP
NAV
POS
MARK
ENTRY
D.BOX
ON /OFF
TRIP LOG
177nm
POSITION
47
°
58.535'N
122
°
36.496'W
COG
323.6
°
M
SOG
20.0
kt
350.4
°
M
0.000 nm
Data boxes
1.8.1 Showi ng, hiding data boxes with soft key
Plotter: D. BOX ON/OFF
Radar: ZOOM & D. BOX
→
D. BOX ON/OFF (EBL/VRM data box, cursor data
box also shown/hidden)
Sounder: AUTO/D. BOX
→
D. BOX ON/OFF
1.8.2 Rearranging data boxes
You may select the location for data boxes as follows:
1. Using the Cursor pad, place the cursor inside the data box you wish to move. As the
cursor enters the box it changes to a “hand”. Push the ENTER knob, and the hand
changes to a fist, meaning the box is correctly selected.
2. Use the Cursor pad to move the data box to the location desired, then push the ENTER
knob.
1.8.3 Temporarily erasing a data box
If a data box is obscuring a desired object, you may temporarily erase the box. Use the
Cursor pad to place the cursor inside the data box you wish to erase, then press the
CLEAR key. To redisplay the box, press the D. BOX soft key twice to display it.
Page 28

1. OPERATIONAL OVERVIEW
1-15
1.9 Function Keys
The funct ion keys provide for one- touch execution of a des ired function. The default
function key settings are as shown in the tabl e below.
Default Setting, Key Label
Function
Key
Radar Plotter Sounder
#1 Heading line on/off, HL Track on/off, TRK TLL output, TLL
#2 Rings on/off, RNG Edit mark/l ine, EML Clutter, CLT
#3 Echo t rail, TRL Ruler, RUL Signal level, SLV
#4 Offcenter, OFC
Add new waypoint,
ADD
Noise limiter, NL
#5 STBY/TX, TX
Waypoint
alphanumeric list, ALP
Picture advance, PA
1. Press the HIDE/SHOW key to replace the preset soft key label s with the functi on k ey
labels.
34° 22. 3456'N 359.9°M
TRIP
NU
080° 22. 3456'E
19.9 kt 99.9 nm
BRIDGE
FISH
002WP
Function
keys
T
R
K
E
M
L
R
U
L
A
D
D
A
L
p
Plotter
16.0nm
.250/ 319.9
°M
.125nm
SP
H-UP
Function
keys
TARGET
+
359.9°R
0.24nm
H
L
R
N
G
T
R
L
S
F
T
D
B
X
Radar
Function key s
2. Pres s function key desired.
Note: Function keys can be individually progr am m ed for the plotter, r adar and sounder
displays. For further details see the following:
Radar: paragraph 7.2.3
Plotter: paragraph 7.3.2
Sounder: paragraph 7.9.4
Page 29
1. OPERATIONAL OVERVIEW
1-16
1.10 Simulation Display
The simulation display, for use by service technicians f or demonstration purposes, provides
simulated operation to help acquaint you with the many features your unit has to offer. It
allows you to view and control a simulated plotter, radar and sounder picture, without
position-fixing equipment, network radar or a network sounder. Most controls are operative,
thus you may practice setting destination, ent er waypoints, measure range and bearing to a
target, etc. Three simulation displays are provided for both the radar and echo sounder.
The simulation icon (SIM) appears when any simulation mode is active.
To start the simulation display;
1. Press the MENU key.
2. Press the SYSTEM CONFIGURATION, SYSTEM SETUP and SIMULATION SETUP
soft keys in that order.
SIM
SETUP
EDIT
RETURN
RADAR
LIVE
PLOTTER
LIVE
SOUNDER
LIVE
SPEED
00.0kt
COURSE
000.0°
LATITUDE
45°35.000’N
LONGITUDE
123°00.000’W
START DATE & TIME
00:00 01.APR.01
GET RADAR SIMULATION DATA
NO
Simulation setup menu
3. Follow appropriate procedure on the next several pages. To stop the simulation mode
and return to normal operation, choose LIVE for radar, sounder or plotter.
Radar
NavNet display unit-generated echoes or user data
1. Select RADAR, then press the EDIT soft key.
RADAR
▲
¡
BUILT IN DATA 1
¡
BUILT IN DATA 2
¡
USER DATA
¤
LIVE
▼
2. Select BUILT IN DATA 1 or 2 for internally generated echoes or USER DATA for
user-saved radar data. Push the ENTER knob.
3. Press the MENU key to close the menu.
Page 30

1. OPERATIONAL OVERVIEW
1-17
NavNet radar antenna-gener at ed echoes (not available with t he GD-1720C)
1. Select GET RADAR SIMULATION DATA, then press the EDIT soft key.
2. Select YES, then push t he ENTER knob to erase simulation data and get new data. The
message “NOW GETTING SIMULATION DATA. Do not turn off display unit.” appears
while the unit is receiving radar data.
Note: If the network radar could not be found “Radar source is not found. Cannot get
demo data.” appears. And if the radar is not active, the message “Radar is not active.
Cannot get demo data.” is displayed. Check that the radar is plugged in and its signal
cable is fi r m ly fastened.
3. Select RADAR, then press the EDIT s oft key.
4. Select BUILT IN DAT A 2, then push the ENTER knob.
5. Press the MENU key to close the menu.
Plotter
1. Select PLOTTER, then press the EDIT soft key.
2. Select SIMULATION, then push the ENTER knob.
3. Sel ect SPEED, t hen press the EDIT soft key.
4. Ent er s peed (setting range, 0-99 kt, default speed, 0 kt) with
the alphanumer ic keys, then pus h the ENTER knob.
5. Select COURSE, t hen pres s the EDIT s oft k ey .
6. Select “8 FIGURE” to trace the simulated ship’s track i n a
figure-ei ght course, or enter your own course at DIRECTION. T o enter course, use the
Cursor pad to selec t digit, and enter value with the alphanum er ic keys.
7. Press the ENTER soft key.
8. Select LATITUDE, then press the EDIT soft key.
9. Ent er latitude (setting range, 85
°
N-85°S, default setting, 45°35.000’N), then push the
ENTER knob.
10. Select LONGITUDE, then press the EDIT soft key.
11. Enter longitude (sett ing range, 180
°
E-180°W, default setting, 125°00.000’W), then push
the ENTER knob.
12. Select START DATE & TIM E , then press the EDIT soft key.
13. Enter start date and tim e, then push the ENTER knob.
14. Press the MENU key to cl os e the menu.
Sounder
1. Select SOUNDER, t hen press the EDIT soft key.
2. Select BUILT IN DAT A ( internally generated echoes) or
ETR (network sounder-gener ated echoes), then push the
ENTER knob.
Note: The depth, shift, bott om - z oom , bottom-loc k and
bottom disc r imination cannot be s hown in the BUILT IN
DATA mode.
3. Press the MENU key to close the menu.
PLOTTER
▲
{
SIMULATION
~
LIVE
▼
{
SOUNDER
▲
{
BUILT IN DATA
{
ETR
~
LIVE
▼
Page 31

1. OPERATIONAL OVERVIEW
1-18
This page intentionally left blank.
Page 32

2-1
2. RADAR OPERATION
This chapter covers radar operation, including the ARP (Auto Plotter) function. ARP
requires a Model 18x4C/19x4C series network radar equippe d with the ARP circuit board as
radar source.
2.1 Radar Display
Cursor
359.9°R
0.18nm
H-UP
. / 319.9
°M
.125nm
SP
TRAIL 30m
02m30s
G1 IN
G2 OUT
ES L
IR L
.250
Range/
range ring
interval
Presentation
mode
Alarm icon
Battery icon
Zoom area
Zoom
window
Guard zone 1
Trail time
Trail elapsed time
Guard zone 1
Guard zone 2
Echo stretch
Interference rejector
Guard zone 2
VRM2
EBL1
VRM1
EBL2
Range ring
Pulselength
Heading
M: Magnetic
T: True
Heading line
EBL1 range
VRM1 range
Cursor range
and bearing
(Cursor position may
also be shown, in
L/L or Loran C TD.)
EBL2 bearing, VRM2 range
EBL1
27.0°R
VRM1
0 .158nm
EBL2
327.1°R
VRM2
0 .225nm
* = Radar source
Model 1834/1834C
series radar
Own ship vector*
(ARP-equipped model,
true vector mode)
North marker
Radar display
Page 33
2. RADAR OPERATION
2-2
2.2 Transmitting, Stand-by
1. Confirm that the network radar is plugged in.
2. Press the DISP key to select a radar display.
3. Press the POWER/BRILL key momentarily.
4. Press the RADAR STBY soft key to highlight TX on its label.
5. Press the RETURN soft key.
When the radar picture is not required, but you want keep it in a st ate of readiness, press
the RADAR TX soft key to highlight STBY on its label.
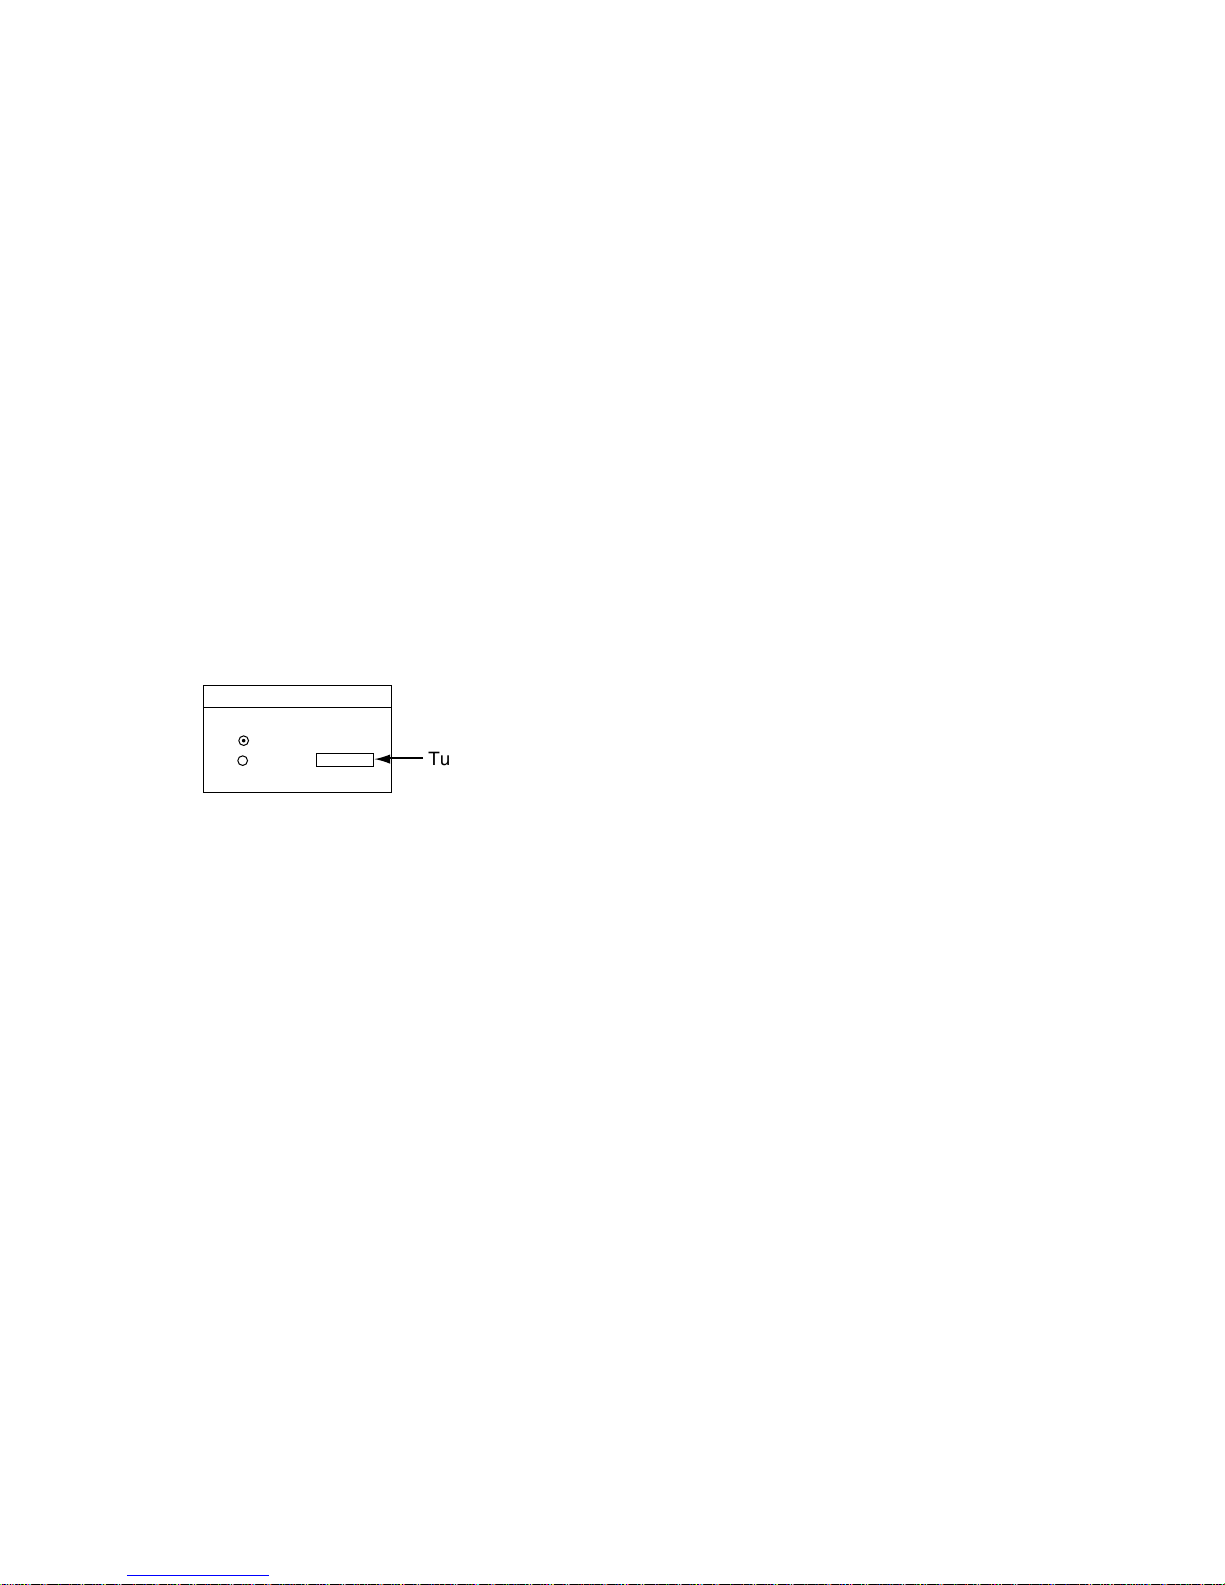
2.3 Tuning
The radar receiver can be tuned automatically or manually, and the default tuning method is
automatic. If you require manual tuning, do the following:
1. Press the MENU key to display the main menu.
2. Press the RADAR DISPLAY SETUP soft key.
3. Select TUNING, then press the EDIT soft key.
AUTO
MAN
TUNING
¡
¤
Tuning bar
Tuning window
4. Choose MAN.
5. Adjust the ENTER knob until the tuning bar is at its longest position.
6. Press the MENU key to close the menu.
Note: If the auto setting does not provide satisfactory tunin g, ask your dealer how to
re-adjust tuning.
2.4 Adjusting the Gain
The GAIN key adjusts the gain sensitivity of the radar receiver. It works in a manner similar
to that of volume control of a broadcast receiver, which am plifies received signals.
The proper setting is such that the background noise is just visibl e on the screen. If your
gain setting is too low, weak echoes may be missed. On the ot her hand, excessi ve gain
yields too much background noise; strong targets m ay be missed because of the poor
contrast between desired echoes and the background noise on the display.
To adjust the receiver sensitivity, transmit on long range, and then do the following:
Page 34

2-3
1. Press the GAIN key to show the “gain adjustment”
soft keys, and the last-used adjustment window
appears. The example below shows the gain
sensitivity adjustment window. T he gain soft keys
shown depend on radar source as shown below.
2. If the gain sensitivity window is not displayed, press
the GAIN soft key to show the gain sensitivity setting
window.
3. Use the Cursor pad to select AUTO ROUGH, AUTO
MODERATE, AUTO CALM, or MAN (manual) as
appropriate. Select an AUTO option according to the sea state.
4. For manual adjustment, rotate the ENTER knob to adjust, while observing the radar
echo. The range of adjustm ent is 0-100.
5. Press the GAIN key on the front panel or the RETURN soft key to finish.
Adjusting the FTC
To suppress rain clutter from heavy storms or scattered rain clutter, adjust t he FTC.
In addition to reducing clutter, t he FTC can be used in fine weather to clarify the picture
when navigating in confined waters. However, with the circuit active the receiver is less
sensitive.
1. Press the GAIN key.
2. Press the FTC soft key, and then rotate the ENTER knob toadjust.
3. Press the GAIN key on the front panel or RETURN soft key to finish.
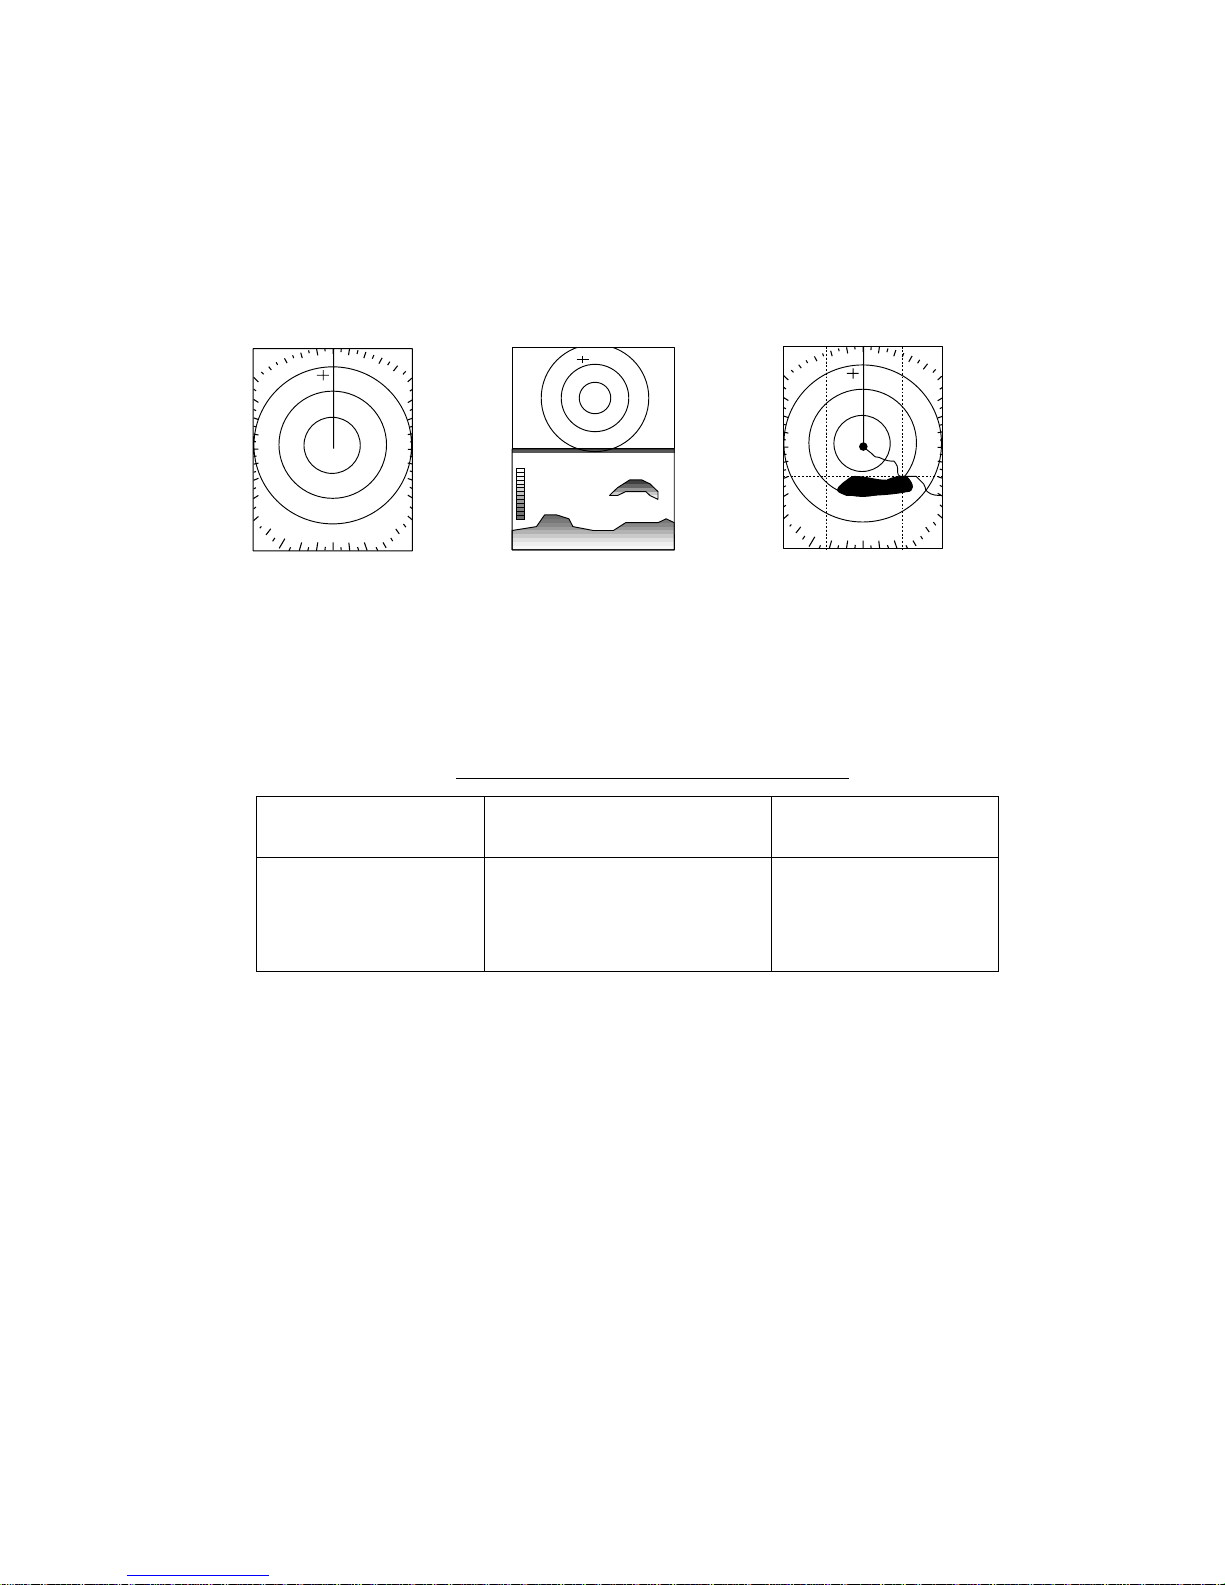
2.5 Reducing Sea Clutter
2.5.1 How the A/C SEA works
Echoes from waves can be troublesome, covering the central part of the display with
random signals known as “sea clutter”. The higher the waves and the h igher t he antenna
above the water, the further the clutter will extend. Sea clutter may affect radar performance
because real targets are sometimes hidden by the echoes of sm all waves. (See the
left-hand figure in the figure below.) When sea clutter masks the picture, adjust the A/C
SEA to reduce the clutter.
The A/C SEA reduces the amplification of echoes at short ranges (where clutter is the
greatest) and progressively increases amplificat ion as the range increases, so amplification
will be normal at those ranges where there is no sea clutt er.
A/C SEA adjusted;
sea clutter suppressed
Sea clutter at
screen center
Effect of A/C SEA
GAIN SENSITIVITY
¤
AUTO ROUGH
¡
AUTO MODERATE
¡
AUTO CALM
¡
MAN
0
Gain sensitivity window
Page 35

2. RADAR OPERATION
2-4
2.5.2 Adjusting the A/C SEA
A/C SEA should be adjusted so that the clutter is broken up into small dots, and small
targets become distinguishable.
1. Press the GAIN key.
2. Press the A/C SEA soft key to show the A/C SEA setting window.
A/C SEA
¡
AUTO ROUGH
¡
AUTO MODERATE
¡
AUTO CALM
¤
MAN
0
A/C SEA setting window
3. Use the Cursor pad to select AUTO ROUGH, AUTO MODERATE, AUTO CALM, or
MAN (manual) as appropriate. Select an AUTO option according t o t he sea st ate.
4. For manual adjustment, rotate the ENTER knob to adjust . T he range of adjustment is
0-100. Do not overadjust – weak echoes m ay be missed.
5. Press the GAIN key on the front panel or RETURN soft key to finish.
2.6 Reducing Precipitation Clutter
The vertical beamwidth of the antenna is designed to see surface targets even when the
ship is rolling. However, by this design the unit will also detect precipitation clutter (rain,
snow, hail, etc.) in the same manner as normal targets. Precipitation clutter shows as
random dots on the screen.
When echoes from precipitation mask solid targets, adjust the A/C RAIN to split up these
unwanted echoes into a speckled pattern, making recognition of solid targets easier.
1. Press the GAIN key.
2. Press the A/C RAIN soft key to show the A/C RAIN window.
A/C RAIN
0
A/C RAIN setting window
3. Rotate the ENTER knob to adjust the A/ C RAIN. The current level is shown on the A/C
RAIN level bar in the A/C RAIN window, and the range of adjustment is 0 to 100(%). Do
not overadjust – weak echoes may be missed.
4. Press the GAIN key on the front panel or RETURN soft key to finish.
Page 36
2. RADAR OPERA TION
2-5
2.7 Range Scale
The range setting determines t he s ize of the area (in nautical mil es ) that will appear on your
display. In addition, the range setting will also automatical ly adjust the range ring interval so
that accurate r ange measurement s m ay be made while operating on any range s etting.
The range, range ring interval and pulselength appear at the top l eft-hand corner of t he
display.
Press the [RANGE (+ or -)] key to change t he range scale.
Range scales (nm, sm)
Range 0.125 0.25 0.5 0.75 1 1.5 2 3 4 6 8 12 16 24 36 48 64 72
Ring
Interval
0.0625 0.125 0.125 0.25 0.25 0.5 0.5 1 1 2 2 3 4 6 12 12 16 18
No. of
Rings
2 2 5 4 5 4 5 4 5 4 5 5 5 5 4 5 5 5
Range scales ( k m)
Range 0.25 0.5 0.75 1 1.5 2 3 4 6 8 12 16 24 36 48 64 72
Ring Interval 0.125 0.25 0.25 0.25 0.5 0.5 1 1 2 2 3 4 6 12 12 16 18
No. of Rings 2 2 4 5 4 5 4 5 4 5 5 5 5 4 5 5 5
Note 1: Maximum range depends on the network radar as shown below.
Model 1724C, 1734C, 1824C: 24 nm
Model 1834C: 36 nm
Model 1934C: 48 nm
Model 1944C: 64 nm
Model 1954C, 1964C: 72 nm
Note 2: You m ay choose which ranges to use from the RADAR RANGE SETUP menu. For
details s ee par agraph 7.2.2. T his function is not avai lable with the G D-1720C.
Page 37

2. RADAR OPERATION
2-6
2.8 Pulselength
The pulselength in use is displayed at the upp er left corner of the display. Appropriate
pulselengths are preset to individual range scales. Therefore, you are not usually required
to select them. If you are not satisfied with the current pulselength setting, however, it is
possible to change it for the ranges shown below. General ly, select a longer pulse for
longer detection range and shorter pulse for better range discrimination.
1.5 nm, 1.5 sm, 3 km: Short pulse, medium pulse
3 nm, 3 sm, 6 km: Medium pulse, long pulse
1. If not displayed, press the HIDE/SHOW key to show the radar soft keys.
2. Press the SIGNAL PROC. soft key.
1.5/ 319.9
°
M
.500nm
SP
H-UP
SIGNAL
PROCESS
+
359.9°R
1.40nm
RETURN
I. REJ
LOW
PULSE
SHORT
E. STR
LOW
Signal process soft keys
3. Choose the 1.5 nm or 3 nm with the RANGE key.
4. Press the PULSE soft key to select the pulselength setting. SHORT or MEDIUM for 1.5
nm, 1.5 sm, 3 km and MEDIUM or LONG for 3 nm, 3 sm,
6 km.
5. Press the RETURN soft key to finish.
Page 38

2. RADAR OPERATION
2-7
2.9 Presentation Mode
This unit provides four radar presentation modes: head-up, course-up, north-up and true
motion.
Heading data is required for modes other than head-up.
2.9.1 Selecting a presentation mode
1. If not displayed, press the HIDE/SHOW key to show the radar soft keys.
2. Press the RADAR DISPLY soft key to show the RADAR DISPLAY soft keys.
3. Press the MODE soft key. Each pressing of the key changes the presentation mode and
the presentation mode indicatio n in t he sequence of North-up, True Motion, Head-up,
and Course-up.
Function Indicator on display Soft key label
North-up N-UP NTH UP
True Motion TR-M TRUE M
Head-up H-UP HD UP
Course-up C-UP CSE UP
4. Press the RETURN soft key to finish.
Note: When heading data is lost, the present ation mode automatically goes to head-up, the
heading indication at the screen top shows “- - -.-°” and the audio alarm sounds. Press the
ALARM ke y to acknowledge the alarm. The message “HEADING DATA MISSING” appears.
Restore compass signal to show heading indication. Use the CLEAR key presentation
mode if necessary. The audio alarm may be silenced with the CLEAR key.
Page 39

2. RADAR OPERATION
2-8
Heading Line
North Marker
Head-up display
Heading Line
North Marker
Course-up display
Heading Line
North
North-up display
Heading Line
North
True motion display
2.9.2 Description of presentation modes
Head-up
A display without azimuth stabilization in which the line
connecting the center with the top of t he display
indicates own ship’s heading. Targets are painted at
their measured distances and in their directions
relative to own ship’s heading.
The short line on the bearing scale is the north m arker.
Course-up
The radar picture is stabilized and displayed with the
currently selected course at the top of the screen. As
you change heading, the ship’s heading line moves. If
you select a new course, the picture resets to display
the new course at the top of the display.
Targets are painted at their measured distances and in
their directions relative to the intended course which is
maintained at the 0-degree position. The heading line
moves in accordance with ship’s yawing and course
changes.
North-up
In the north-up mode, targets are painted at thei r
measured distances and in their true (compass)
directions from own ship. North is maintained at the
top of the screen. The heading line changes its
direction according to ship’s heading.
True motion
Fixed radar targets maintain a constant position on the
screen, while your own ship moves across the radar
image at the correct speed and heading. A m ap-like
image is displayed, with all moving vessels traveling in
true perspective to each other and to fixed landmasses.
As your ship’s position approaches the edge of t he
screen, the radar display is automatically reset to
reveal the area ahead of your ship. You can manuall y
reset your ship’s position at any time by pressing the
RADAR DISPLY soft key followed by the SHIFT soft
key.
Page 40
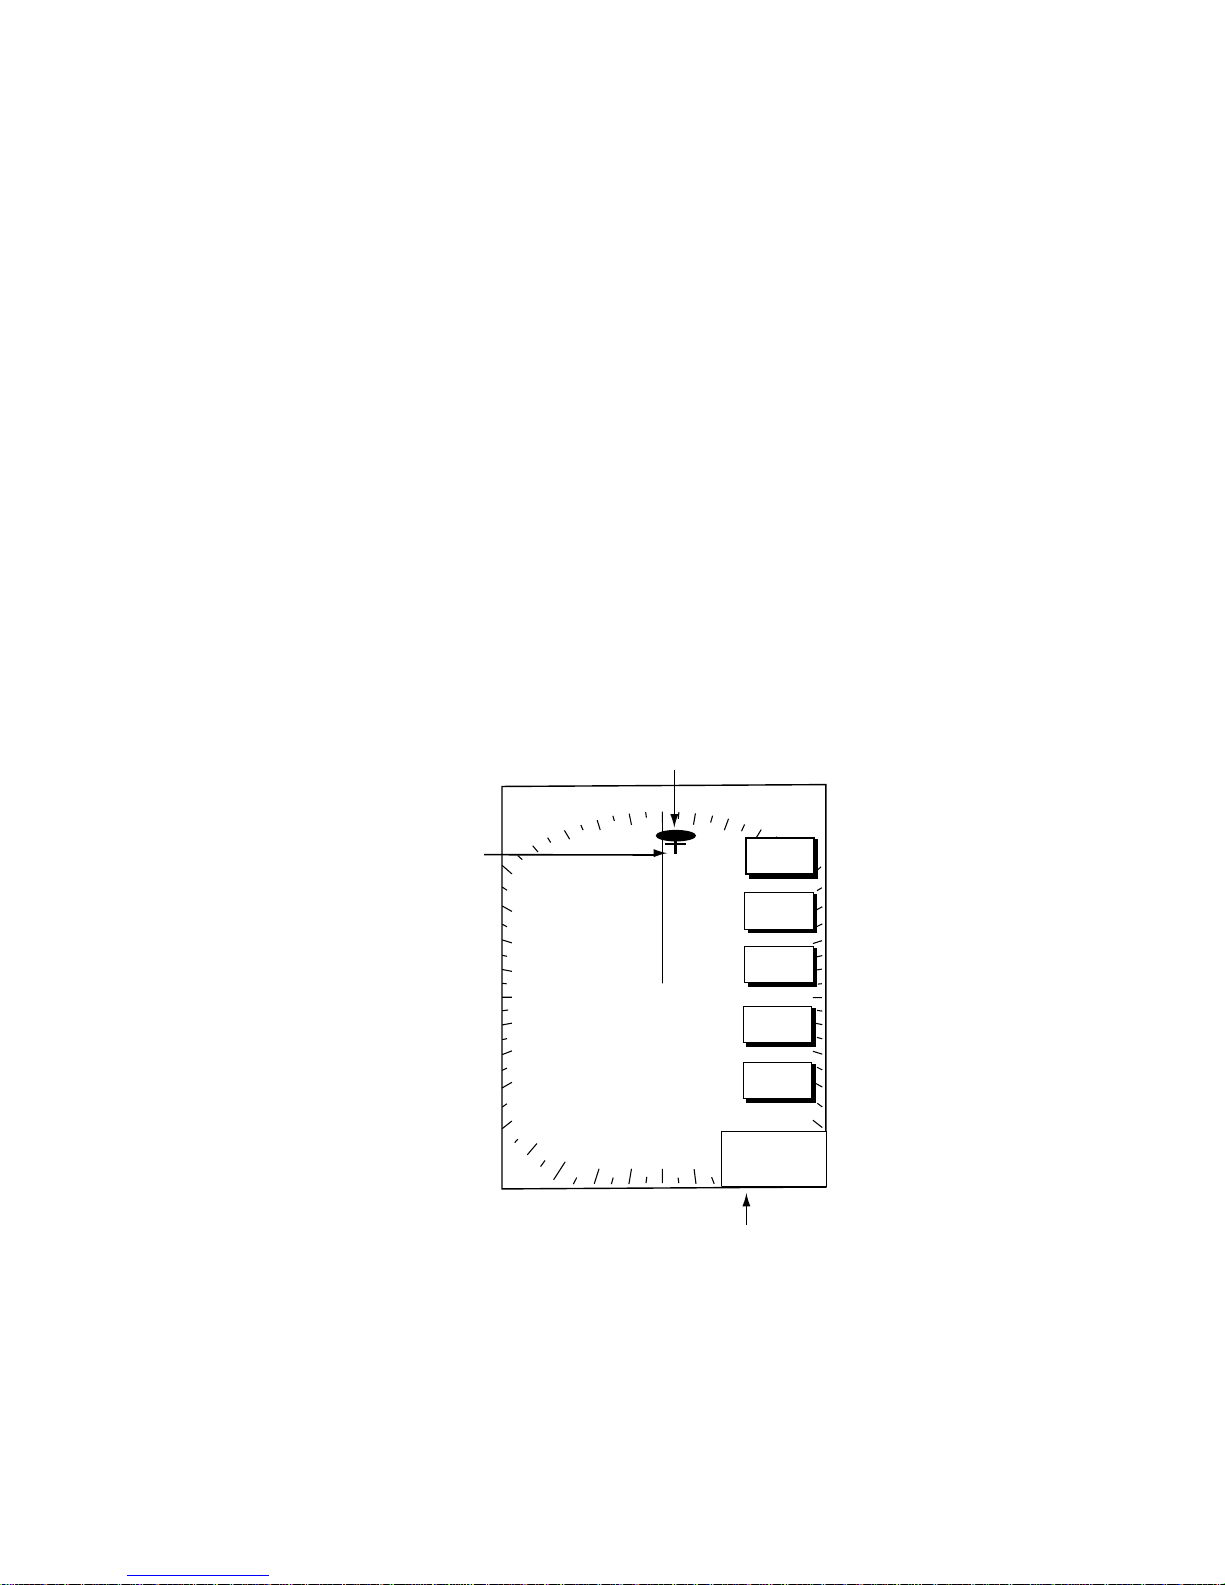
2. RADAR OPERATION
2-9
2.10 Measuring the Range
You can measure the range to a radar target three ways: by the range rings, by the cursor,
and by the VRM (Variable Range Marker).
2.10.1 Measuring range by range rings
Count the number of rings between the center of the display and the target. Check the
range ring interval and judge the distance of the echo from the inner edge of the nearest
ring.
To turn the range rings on, do the following:
1. If not displayed, press the HIDE/SHOW key to show the radar soft keys.
2. Press the RADAR DISPLY soft key.
3. Press the RINGS soft key to turn the rings on and select desired brilliance.
4. Press the RETURN soft key to finish.
2.10.2 Measuring range by cursor
Operate the Cursor pad to place the cursor intersection on the inside edge of the radar
target. The range to the target, as well as the bearing, appears to the right of “+” at the
bottom of the display.
.250/ 319.9
°
M
.125nm
SP
H-UP
+
4.3°R
0.240nm
SIGNAL
PROC.
RADAR
DISPLY
NAV
FUNC
TARGET
ZOOM &
D. BOX
Cursor
Target
Bearing and range from own
ship to cursor position
How to measure range to a target with the cursor
Page 41

2. RADAR OPERATION
2-10
2.10.3 Measuring range by VRM
1. Press the EBL/VRM key to display the EBL/VRM soft keys.
2. Press the VRM1 ON (dotted ring VRM) or VRM2 ON (dashed ring VRM) soft key to
select the desired VRM. The selected VRM’s indication, at the bot tom of the screen, is
highlighted.
3. Rotate the ENTER knob then place the VRM on the inside edge of a radar target. Read
the VRM indication to find range to the target.
.250/ 319.9
°
M
.125nm
SP
H-UP
VRM1
(Dotted line)
VRM2
(Dashed line)
VRM1 range
VRM2 range
Active marker is highlighted.
+
359.9°R
0.240nm
EBL
VRM
EBL1
ON
EBL1
---.-°R
VRM1
0.119nm
EBL2
---.-°R
VRM2
0.242nm
VRM1
ON
OFFSET
EBL2
ON
VRM2
ON
How to measure range with the VRM
4. You may hide the EBL/VRM soft keys by pressing the EBL/VRM key.
2.10.4 Various VRM operations
Erasing a VRM, VRM indication: Press appropriate VRM soft key, then press the CLEAR
key. The VRM is erased and its indication becomes blank.
Erasing EBL/VRM data boxes: Press the EBL or VRM soft key associated with the
EBL/VRM data box you wish to erase. Press the CLEAR key once or twice to erase the
data box.
Hiding EBL/VRM data boxes: Press the ZOOM & D. BOX and D. BOX ON/OFF soft keys
to show or hide the EBL/VRM data boxes.
Moving EBL/VRM data boxes: When an EBL/VRM data box is obscuring a target you
want to see, you can move it to another location as shown below. This cannot be done
when the EBL/VRM soft keys are shown.
1. Press the EBL/VRM key to turn off the EBL/VRM soft keys.
2. Using the Cursor pad, place the cursor inside the data box you wish to move. As the
cursor enters the box it changes to a “hand.” Push the ENTER knob, and the hand
changes to a fist, meaning the box is correctly selected.
3. Use the Cursor pad to move the data box to the location desired, then push the ENTER
knob.
Page 42
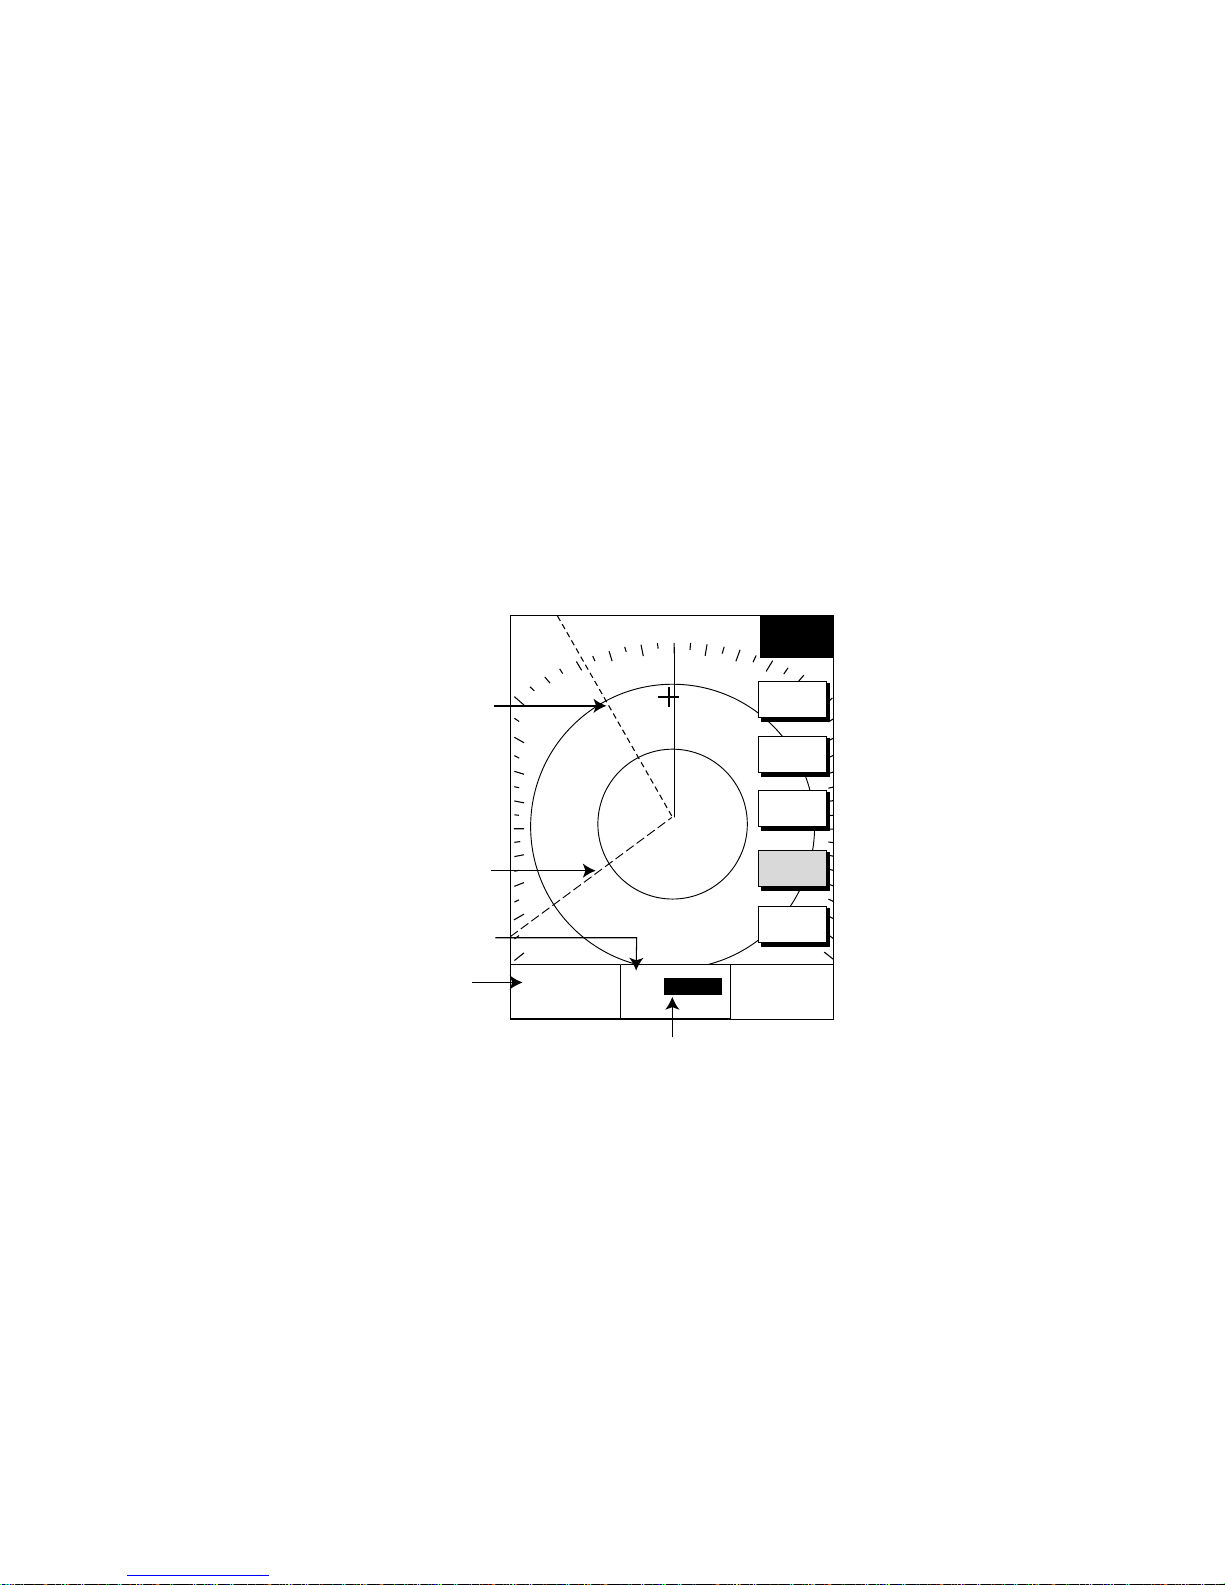
2. RADAR OPERATION
2-11
2.11 Measuring the Bearing
There are two ways to measure the bearing to a target: by the cursor, and by the EBL
(Electronic bearing Line).
2.11.1 Measuring bearing by cursor
Use the Cursor pad to place the cursor at the center of the target. The bearing to the target
appears in the range and bearing box at the bott om right-hand corner on the screen.
2.11.2 Measuring bearing by EBL
1. Press the EBL/VRM key.
2. Press the EBL1 ON (dotted line EBL) or EBL2 ON (dashed line EBL) soft key to select
the desired EBL. The selected EBL’s indication, at the bottom of the screen, is
highlighted.
3. Rotate the ENTER knob to bisect the radar t arget with the EBL. Read the EBL indication
to find the bearing to the target.
.250/ 319.9
°
M
.125nm
SP
H-UP
EBL1
(Dotted line)
EBL2
(Dashed line)
EBL2 bearing
Active marker is highlighted.
+
359.9°R
0.24nm
EBL1 bearing
R: Relative
T: True
EBL
VRM
EBL1
330.1°R
VRM1
-.---nm
EBL2
234.1°R
VRM2
-.---nm
EBL1
ON
VRM1
ON
OFFSET
EBL2
ON
VRM2
ON
How to measure bearing with the EBL
4. You may hide the EBL/VRM soft keys by pressing the EBL/VRM key.
Note: The bearing to a target may be shown relative to own ship’s heading (Relative) or
True bearing (requires heading data). This may be done with “EBL REFERENCE,” which is
in the RADAR DISPLAY SETUP menu.
2.11.3 Various EBL operations
Erasing an EBL, EBL indication: Press appropriate EBL soft key, then press the CLEAR
key. The EBL is erased and its indication becomes blank.
Erasing, hiding, moving EBL/VRM data boxes: See paragraph 2.10.4.
Page 43

2. RADAR OPERATION
2-12
2.12 Erasing the Heading Line, North Marker
The heading line indicates the ship's head ing in all presentation modes. It is a line fr om the
own ship position to the outer edge of the radar display area and appears at zero degrees
on the bearing scale in head-up mode; it changes its orientation in the north-up, course-up
and true motion modes with ship’s movement.
The north marker appears as a short dashed line. In the head-up and course-up modes the
north marker moves around the bearing scale as the ship’s heading moves.
To temporarily erase the heading line and north marker, press the RADAR DISPLY soft key
followed by the HL OFF soft key. Release the key to redisplay the markers. (If the radar soft
keys are not shown, hit the HIDE/SHOW key to display them.)
2.13 Reducing Noise Interference
Noise, appearing on the displays as random “speckles,” can be reduced as follows:
1. Press the MENU key to open the menu.
2. Press the RADAR DISPLAY SETUP soft key.
3. Select NOISE REJECTION, then press the EDIT soft key.
4. Select OFF, LOW or HIGH as appropriate.
5. Press the ENTER soft key.
6. Press the MENU key to close the menu.
Page 44

2. RADAR OPERATION
2-13
2.14 Rejecting Radar Interference
Radar interference may occur when near another shipborne radar that is operating in the
same frequency band as your radar. Its on-screen appearance looks like many bright dots
either scattered at random or in the form of dotted lines extending from the center to the
edge of the display. Interference effects are distinguishable from normal echoes because
they do not appear in the same place on successive rotations of the scanner.
Be sure to turn off the interference rejector when no interference exists – weak targets may
be missed.
Radar interference
1. If not displayed, press the HIDE/SHOW key to show the radar soft keys.
2. Press the SIGNAL PROC. soft key.
1.5/ 319.9
°
M
.500nm
SP
H-UP
SIGNAL
PROCESS
+
359.9°R
1.40nm
RETURN
E. AVG
OFF
I. REJ
LOW
PULSE
SHORT
E. STR
LOW
SIGNAL PROCESS soft keys
3. Press the I. REJ soft key successively to choose the interference rejection level desired;
LOW, MED, HIGH or OFF.
4. Press the RETURN soft key to finish.
The display shows IR L (Low), IR M (Medium) or IR H (High) when the interference rejector
is on.
Page 45

2. RADAR OPERA TION
2-14
2.15 Zoom
The zoom feature allows you to double the size of the area s elected with the “zoom
square.” I t is available on any r ange but is inoperat ive in true motion and when the display
is shifted.
2.15.1 Zooming radar targets
This function is available when TARGET ID NUMBER is ON.
1. If not displayed, pr es s the HIDE/SHOW key to show the radar s oft keys.
2. Use the Cursor pad to set the cursor where you want to zoom.
3. Press the ZOOM & D. BOX soft key to show ZOOM & D. BOX soft keys.
4. Press the ZOOM ON/OFF soft key to select ON. A hollow square, called the “zoom
area,” appears on the display.
5. To release the cursor, press the CURSOR F LOAT soft key. (The hollow square chan ges
to a dashed one.) To relocate the z oom c ircle, select location with the Cursor pad, then
press the CURSOR LOCK key.
6. To quit the zoom function, press the ZOOM ON/OFF soft key to select OFF.
.250/ 319.9
°
M
.125nm
SP
H-UP
Zoom circle
Zoom window
+
001.0°R
0.160nm
ZOOM
D. BOX
ARPA
TGT ZM
RETURN
ZOOM
ON /OFF
D. BOX
ON/OFF
CURSOR
FLOAT
Requires optional
ARP Board in
18x4C/19x4C series
network radar.
Not shown when
radar source is
otherwise.
Zoom
2.15.2 Zooming ARP, TTM targets
You may z oom in on TTM (Tracked Target Message) and ARP targets. TTM targets can
come from a Nav Net connected radar, or from other ARP r adar that is outputting the TTM
message. (TTM is a NMEA 0183 data s entence that is an available output f r om s om e A RP
capable radar.) Target numbers must be turned on t o us e this function. This can be done by
enabling the t ar get ID number option in the ARP SETUP menu.
1. If not displayed, pr es s the HIDE/SHOW key to show the radar s oft keys.
2. Press the ZOOM/D. BOX soft key to show ZOOM & D. BOX soft keys.
3. Press the ZOOM ON/OFF soft key to select ZOOM ON.
4. Press the ARP TGT ZM soft key.
Page 46
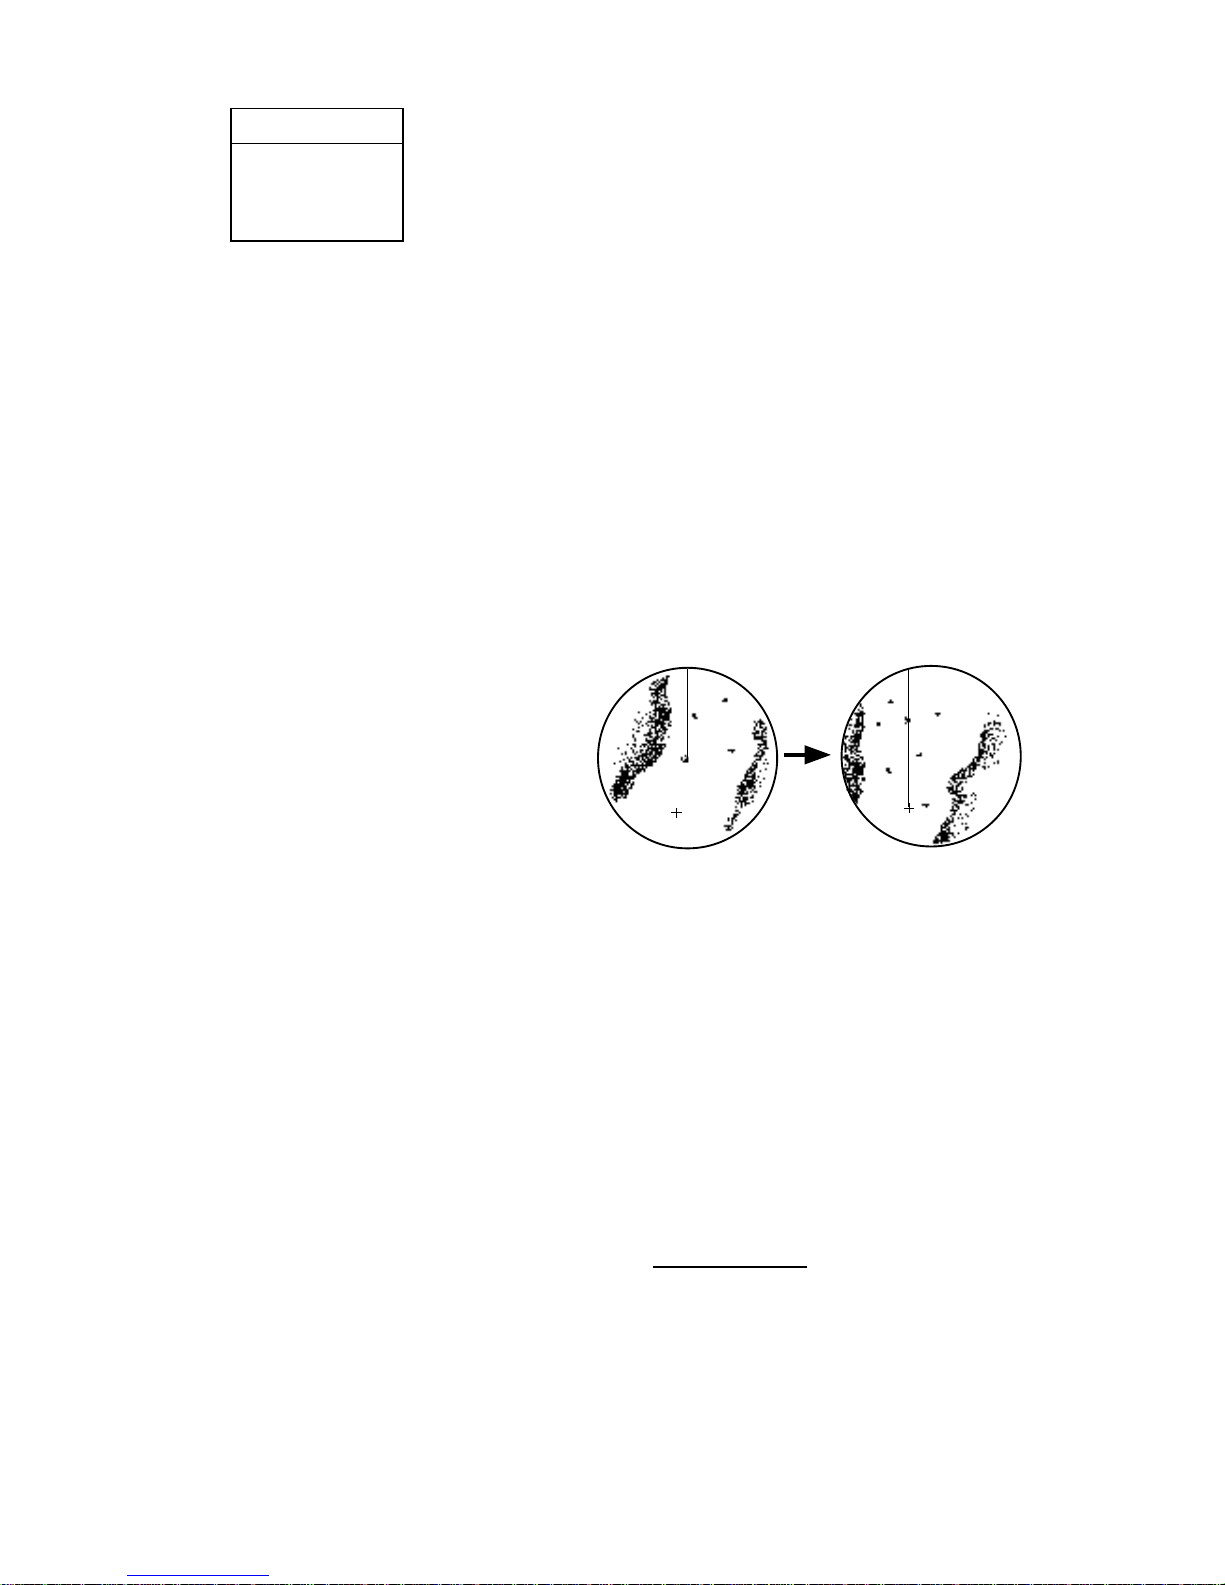
2. RADAR OPERATION
2-15
Cursor
Place cursor
where desired.
Press the MANUAL soft key.
SHIFT
Manual shift
▲
▼
1
SELECT TARGET NO.
Target no. selection window
5. Use the ENTER knob to select number (1-10), then push the ENTER knob. If the target
number does not exist several beeps sound and t he zoom function is cancelled.
To cancel, press the CURSOR LOCK soft key.
Note: The zoom window blends in with the background when the background color for the
radar picture is white. If the window is difficult to see, change the background color.
2.16 Shifting the Picture
Own ship position, or sweep origin, can be displaced manually or automatically to expand
the view field without switching to a larger scale. Zoom is not available when the display is
shifted.
2.16.1 Manual shift
The sweep origin can be shifted in
any presentation mode to a point
specified by the cursor by up to 50%
of the range in use in any direction.
1. Locate the cursor anywhere within
the effective radius of the display.
2. If not displayed, press the
HIDE/SHOW key to show the
radar soft keys.
3. Press the RADAR DISPLY soft key.
4. Press the SHIFT soft key.
5. Press the MANUAL soft key to shift. The heading line shifts to the cursor location.
SHIFT appears at right-hand corner of the display.
To cancel shift, press the RADAR DISPLY, SHIFT and OFF soft keys.
2.16.2 Automatic shift
The amount of automatic shift is calculat ed
according to ship’s speed, and the amount of
shift is limited to 50% of the range in use. F or
example, if you set the shift speed setting for 15 knots and the ship is running at 10 knots
the amount of shift will be about 34%. The formula for determining shift amount is as shown
above. Automatic shift mode is only availabl e in the head-up mode.
Ship's speed
Shift speed setting
X 0.5 = Amount of shift(%)
Page 47

2. RADAR OPERA TION
2-16
AUTO SHIP SPEED
15
Setting automatic shift maximum speed
1. If not displayed, pr es s the HIDE/SHOW key to show the radar s oft keys.
2. Press the RADAR DISPLY soft key.
3. Press the SHIFT soft key to show the shift soft keys.
4. Pres s the AUTO S.SP D s oft key to display the auto s hip
speed setting window.
5. Adjust the Cursor pad or ENTER knob to set t he
maximum speed of your vessel, and then push the
ENTER knob or the ENTER soft key to set. The setting
range is 1-99 k t and the default s etting is 15 kt.
Automatic shift
Press the AUTO soft key. To c anc el, press the RADAR DISPLY, SHIFT and OFF soft keys.
2.17 Using the Offset EBL
The offs et EBL can be used to predict a potential collision course. It can also be used to
measure the range and bearing between two t argets .
2.17.1 Predic ting collision co ur se
The procedure below may be used to check if a radar targ et is on a potential collision
course with your vessel.
1. Press the EBL/VRM key to show the EBL/VRM soft keys.
2. Pres s the EBL1 ON soft key to turn on the EBL1.
3. Pres s the OFFSET sof t key. The origin of E B L1 mo ves t o the cursor posit ion, which is
marked with an “X.”
4. Use the Cursor pad to pl ac e the cursor on the radar t ar get which l ook s like it might be
on a collision course with own ship.
5. Push the ENTER knob to fix the origin position.
6. Af ter waiting for a few minutes (at least three minutes), rotate the ENTER knob so the
EBL bisects the target at the new position. If the target tracks along the EBL towards the
center of the display (your ship’s position), the target may be on a collision course with
your vessel.
To cancel the offset EBL, press t he OFFSET soft key.
Page 48

2. RADAR OPERATION
2-17
.250/ 319.9
°
M
.125nm
SP
H-UP
Initial target
position
Target tracked
here
+
359.9°R
.0.240nm
EBL
VRM
EBL1
ON
VRM1
ON
OFFSET
EBL2
ON
VRM2
ON
EBL1
45.0°R
VRM1
-.---nm
Predicting collision course with the offset EBL
2.17.2 Measuring range & bearing between two targets
The procedure which follows shows how to measure t he range and bearing between two
targets, using the targets “A” and “B” in the figure below as an exam ple.
1. Operate the Cursor pad to place the cursor on the target “A.”
2. Press the EBL/VRM key to show the EBL/VRM soft keys.
3. Press the EBL1 ON soft key to turn on the EBL1.
4. Press the OFFSET soft key. The origin of EBL1 moves to the cursor position, which is
marked with an “X.”
5. Rotate the ENTER knob so the EBL bisects the target “B.”
6. Push the ENTER knob, then press the VRM1 ON soft key.
7. Rotate the ENTER knob to place the VRM1 on t he inner edge of the target “B.”
8. Look at the indications for VRM1 and EBL1 to find the range and bearing between the
two targets.
Page 49
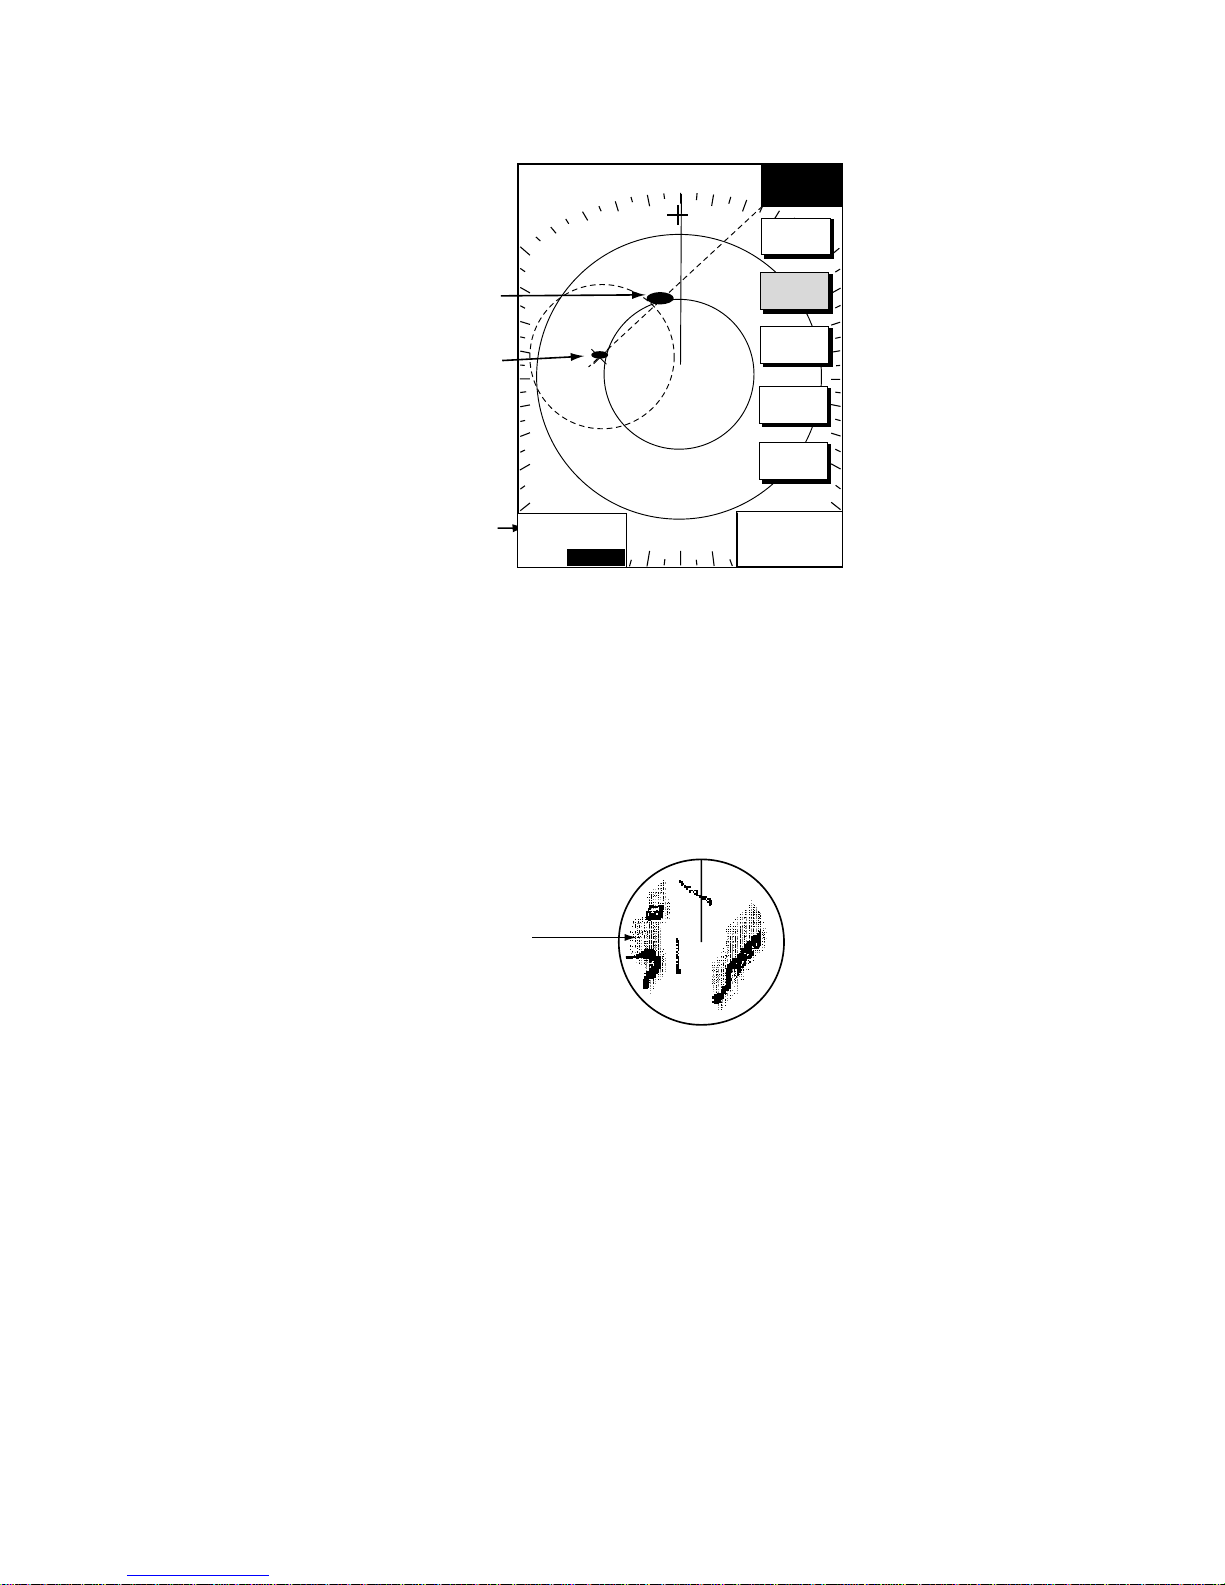
2. RADAR OPERATION
2-18
To cancel the offset EBL, press the OFFSET soft key.
.250/ 319.9
°
M
.125nm
SP
H-UP
+
359.9°R
0.24nm
Target A
Target B
Bearing and range
between target A
and target B
EBL
VRM
EBL1
ON
VRM1
ON
OFFSET
EBL2
ON
VRM2
ON
EBL1
45.0°R
VRM1
0.125nm
Measuring range and bearing between two targets
2.18 Echo Trails
Echo trails are simulated afterglow of target echoes that represent their movements relative
or true to own ship. This function is useful f or alerting you past possible collision situations.
Echo trail
Sample echo trails
2.18.1 Trail time
1. If not displayed, press the HIDE/SHOW key to show the radar soft keys.
2. Press the TARGET soft key.
3. Press the TRAIL soft key to show the trail soft keys.
Page 50

2. RADAR OPERATION
2-19
.250/ 319.9
°
M
.125nm
SP
H-UP
HIGH
+
359.9°R
0.24nm
TRAIL
TRAIL
TIME
TRAIL
COLOR
RETURN
GRAD
SINGLE
TRAIL
ON /OFF
Trail soft keys
4. Press the TRAIL TIME soft key to show the trail time window.
TRAIL TIME
▲
~
15 seconds
{
30 seconds
{
1 minute
{
3 minutes
{
6 minutes
{
15 minutes
{
30 minutes
{
CONTINUOUS
▼
Trail time window
5. Use the Cursor pad to select time desired.
6. Press the ENTER soft key.
7. Press the RETURN soft key twice to finish.
2.18.2 Starting echo trails
1. If not displayed, press the HIDE/SHOW key to show the radar soft keys.
2. Press the TARGET soft key.
3. Press the TRAIL soft key.
4. Press the TRAIL ON/OFF soft key to select ON.
5. Press the RETURN soft key twice to finish.
“TRAIL,” the echo trail time selected and elapsed time appear at the top right-hand corner
of the display. Then, afterglow starts extending from all targets. Trails are restarted when
the range or mode is changed and zoom or shift is turned on.
For continuous trails, the maximum continuous trail time is 99 minutes and 59 seconds.
When the elapsed time clock counts up to that time, the elapsed time display resets to zero
and trails begin again.
To turn off echo trail, press the TRAIL ON/OFF soft key to select OFF at step 4 in the above
procedure.
Trails are restarted when the range or mode is changed and zoom or shift is activated.
Page 51

2. RADAR OPERATION
2-20
2.18.3 Trail gradation
The echo trails can be shown in single or multiple gradat ions. Multiple gradation paints the
trails thinner with time, like the afterglow on an analog PPI radar.
1. If not displayed, press the HIDE/SHOW soft key to show the radar soft keys.
2. Press the TARGET and TRAIL soft keys.
3. Press the GRAD soft key to select SINGLE or MULTI as appropriate.
4. Press the RETURN soft key twice to finish.
Multitone Monotone
2.18.4 Trail color
Trails may be shown target trails in blue, yellow, green or white.
1. If not displayed, press the HIDE/SHOW key to show the radar soft keys.
2. Press the TARGET, TRAIL and TRAIL COLOR soft keys in that order.
TRAIL COLOR
BLUE
YELLOW
GREEN
WHITE
Trail color window
3. Use the Cursor pad to select the color desired, then press the ENTER soft key.
4. Press the RETURN soft key twice.
Page 52

2. RADAR OPERATION
2-21
2.19 Echo Stretch
Normally, the reflected echoes from long range targets appear on the display as weaker
and smaller blips even though they are compensated by the radar’s internal circuitry. The
echo stretch function magnifies these small blips in all ranges. Two types of echo stretch
are available: ES LOW which stretches echoes in bearing directio n and ES HIGH which
stretches them in both range and bearing directions.
"LOW" Echo stretch "HIGH" Echo stretch
Bearing
direction
Bearing
direction
Range
direction
Echo Stretch OFF
Target
Types of echo stretch
This function magnifies not only targets but also sea clutter and radar interference. For this
reason, be sure sea clutter and radar interference are properly suppressed before activating
the echo stretch.
1. If not displayed, press the HIDE/SHOW key to show the radar soft keys.
2. Press the SIGNAL PROC. soft key.
3. Press the E. STR soft key to select HIGH, LOW or OFF as appropriate.
4. Press the RETURN soft key to finish.
The display shows ES H (High) or ES L (Low) when the echo stretch is on.
Page 53

2. RADAR OPERATION
2-22
2.20 Echo Averaging
The echo average feature, which requires a Model 18x4/19x4 series network radar as radar
source, effectively suppresses sea clutter. Echoes received from stable targets such as
ships appear on the screen at almost the same position during every rotation of the ant enna.
On the other hand, unstable echoes such as sea clutter appear at random positions.
To distinguish real target echoes from sea clutter, echo average performs scan-to-scan
correlation. Correlation is made by storing and averaging echo signals over successive
picture frames. If an echo is solid and stable, it is presented in its normal intensity. Sea
clutter is averaged over successive scans resulting in the reduced brilliance, making it
easier to discriminate real targets from sea clutter.
To properly use the echo average function, it is recommended to first suppress sea clutter
with the A/C SEA control and then do the following:
1. If not displayed, press the HIDE/SHOW key to display the radar soft keys.
2. Press the SIGNAL PROC. soft key.
3. Press the E. AVG soft key to select desired echo averaging.
OFF: No averaging
LOW: Helps distinguish targets from sea clut ter and suppresses brilliance of unstable
echoes.
MED: Distinguishes small stationary targets such as navigation buoys.
HIGH: Stably displays distant targets.
4. Press the RETURN soft key to finish.
(a) Echo average OFF (b) Echo average ON
Effect of echo averaging
Page 54

2. RADAR OPERATION
2-23
2.21 Outputting TLL Data
Target position data can be output to units of the network and shown on their plotter screen
with the TLL mark (X). This function requires position and h eading data.
1. Operate the Cursor pad to place the cursor on the target whose position you wish to
output.
2. If not displayed, press the HIDE/SHOW key to display the radar soft keys.
3. Press the TARGET soft key.
.250/ 319.9
°
M
.125nm
SP
H-UP
+
359.9°R
0.240nm
TARGET
TRAIL
TLL
OUTPUT
ACQ
TARGET
INFO
RETURN
Shown with selection of
18x4C/19x4C series network
radar equipped with ARP
function as source.
Not shown otherwise.
T ARGET soft keys
4. Press the TLL OUTPUT soft key to output target position data. The TLL mark appears
on the plotter screen at the target’s position the moment the TLL OUTPUT soft key was
pressed. Further, that position is recorded as a waypoint on all NavNet units, under the
youngest empty waypoint number on each NavNet unit.
5. Press the RETURN soft key to finish.
Note: The screen of the TLL recipient may be temporarily interrupted when receiving TLL
from another NavNet display unit. Press any key to restore normal operation.
Page 55

2. RADAR OPERATION
2-24
2.22 Guard Alarm
The guard alarm allows the operator to set the desired range and bearing for a guard zone.
When ships, islands, landmasses, etc. violate the guard zone, an audio alarm sounds and
the offending target blinks to call the operator’s attention.
CAUTION
• The alarm should not be relied upon as
the sole means for detecting possible
collision situations.
• A/C SEA, A/C RAIN and GAIN controls
should be properly adjusted to be sure
the alarm system does not overlook
target echoes.
2.22.1 Setti ng a guard alarm z one
To set a guard alarm zone, set the radar to tr ansmit and do the following:
1. Press the ALARM key.
2. Use the Cursor pad to set the cursor on the top left corner (or top right corner) of the
guard zone you want to set, then press the SET GUARD1 or SET GUARD2 sof t key,
depending on which guard zone you want to se t.
3. Use the Cursor pad to set the cursor on the bottom right corner (or top left corner) of
the guard zone area, then push the ENTER knob.
4. Press the RETURN soft key to finish.
.250/ 319.9
°
M
.125nm
SP
H-UP
.250/ 319.9
°
M
.125nm
SP
H-UP
317.2°R
0.230nm
ALARM
39.9°R
.0.230nm
V
R
M
.125n
m
.032nm
E
B
L
19.9
T
NO ALARM
(1) Drag cursor to top (or bottom) corner
for guard zone and press the SET
GUARD1 or SET GUARD2 soft key.
(2) Drag cursor diagonally to bottom (or top)
corner for guard zone and press the [ENTER]
knob.
MOVE +CURSOR TO
ANOTHER CORNER OF
GUARD1 AND PUSH KNOB
TO SET.
ALARM
GUARD 1
SET
GUARD1
ERASE
GUARD1
SET
GUARD2
RETURN
+
+
SET
GUARD1
SET
GUARD2
RETURN
1
2
How to set a guard alarm zone
Page 56
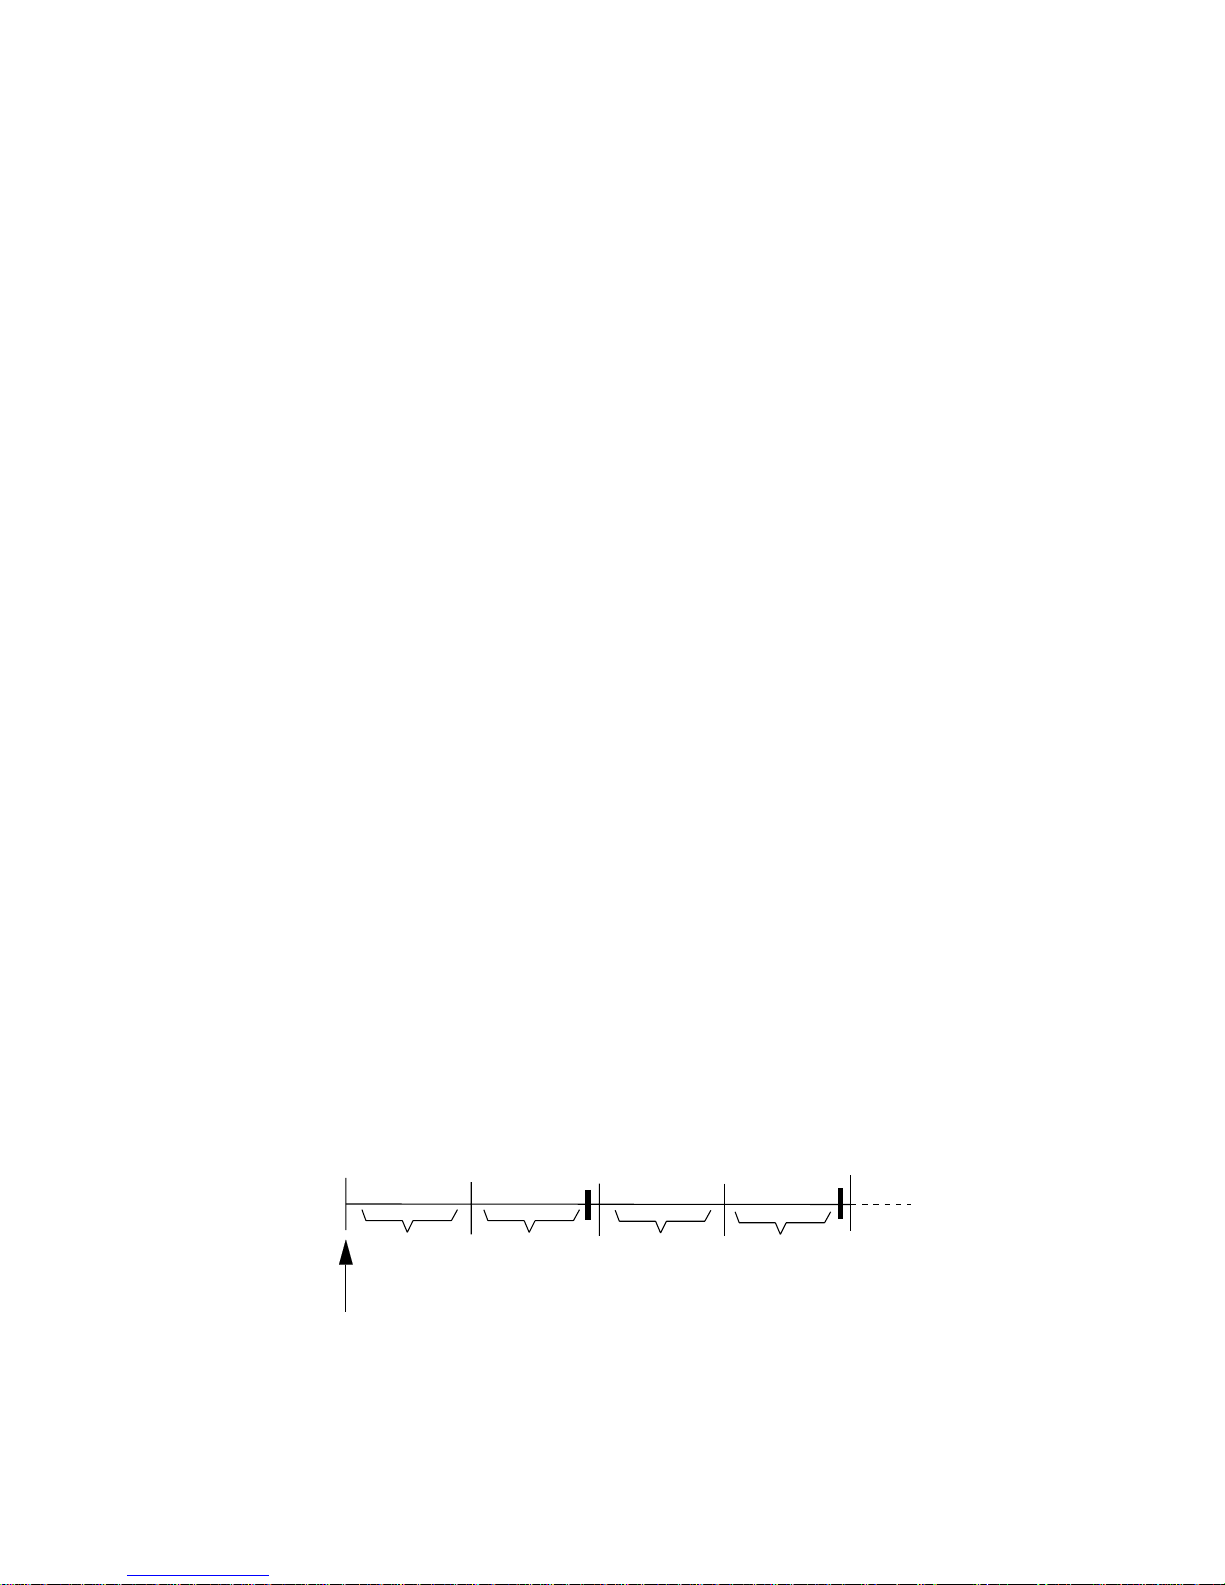
2. RADAR OPERATION
2-25
The equipment then searches for targets inside the guard zone to determine guard alarm
type. If a target is found inside the guar d zone, the guard zone type becomes an “Outward
guard alarm,” and any target exiting the guard zone will trigger the audio alarm. If no target
is found, the guard zone type becomes an “Inward guard alarm,” and any targets entering
the guard zone will trigger the audio alarm. The guard alarm type is shown as G1(G2) IN or
G1(G2) OUT.
Note 1: When the radar range is less than the guard zone range “G1 (G2) IN” or “G1 (G2)
OUT” changes to “G1 (G2) ***.” The guard alarm function is not available while this
indication appears.
Note 2: If the network radar is set to standby while the guard alarm is active, the guard
alarm is cancelled. The guard alarm is redisplayed when the rad ar is set to transmit again.
2.22.2 When the alarm is violated…
Any radar target violating the guard zone will f lash, the audio alarm sounds, and the alarm
icon appears in red. Additionally the message “TARG E T ENTERED INTO
GUARD1(GUARD2)” or “TARGET LEFT FROM GUARD1(GUARD2)” is displayed at the
bottom of the screen. Press the CLEAR key to silence the alarm.
2.22.3 Cancelling the guard alarm
1. Press the ALARM key to show the ALARM menu.
2. Press the ERASE GUARD1 or ERASE GUARD2 soft key as appropriate.
3. Press the RETURN soft key to finish.
2.23 Watchman
2.23.1 How watchman works
The watchman function periodically transmits radar pulses for one minute to check for
targets in a guard zone. If a target is found in t he zone, watchman is cancelled, the audio
alarm sounds and the radar continues transmitting. If no target is found the radar goes into
standby for the number of minutes specified on the RADAR DI SPLAY SETUP m enu. This
feature is useful when you do not need the rada r ’s function continuously but want to be
alerted to radar targets in a specific area. “WTCH” appears at the t op left corner when
Watchman is active.
ST-BY
5,10
or
20 min
Tx
1 min
Tx
1 min
Watchman
starts
5,10
or
20 min
ST-BY
*
*
* Beeps emitted just before radar transmits.
How watchman works
Page 57

2. RADAR OPERATION
2-26
2.23.2 Turning on/off watchman
1. Set a guard zone. (See the paragraph 2.22.)
2. If not displayed, press the HIDE/SHOW key to display the radar soft keys.
3. Press the NAV FUNC soft key.
4. Press the W. MAN ON/OFF soft key to select ON or OFF as appropriate.
5. Press the RETURN soft key to finish.
Note: When the watchman is activated and no guard zone is active, the message “PLEASE
SET GUARD ZONE. PUSH ANY KEY TO CONTINUE.” appears. Press any key and then
set a guard zone.
2.23.3 Setting watchman stand-by interval
The watchman standby interval, that is, the number of minutes the radar is in standby, can
be set to 5, 10 or 20 minutes as follows:
1. Press the MENU key.
2. Press the RADAR DISPLAY SETUP soft key.
3. Select WATCHMAN TIME, then press the EDIT soft key.
WATCHMAN TIME
¡
¡
¤
5 minutes
10 minutes
20 minutes
Watchman time window
4. Select time desired, then press the ENTER soft key.
5. Press the MENU key to close the menu.
Page 58

2. RADAR OPERATION
2-27
2.24 Waypoint Marker
A waypoint marker, showing the location of the destination waypoint set on the plotter, may
be inscribed on the radar display.
.250/ 319.9
°
M
.125nm
SP
H-UP
+
359.9°R
0.24nm
NAV
FUNC
RETURN
W. MAN
ON/OFF
WPT MK
ON /OFF
Waypoint
marker
+
Waypoint marker
1. If not already shown, press the HIDE/SHOW key to display the radar soft keys.
2. Press the NAV FUNC soft key.
3. Press the WPT MK ON/OFF soft key to select ON or OFF as appropriate.
4. Press the RETURN soft key to finish.
Page 59

2. RADAR OPERATION
2-28
2.25 ARP, TTM Operation
When the radar source is an ARP-equipped Model 18x4/19x4 series network radar, you can
manually and automatically acquire and track ten targets. Once a target is acquired
automatically or manually it is automatically tracked within 0.1 to 16 nm. If the FURUNO
heading sensor PG-1000 is used, the data sentence “RMC” is necessary.
Alternatively, you can display the tracks of other ships by receiving the data sentence TTM
(Tracked Target Message) via the NETWORK or NMEA port on the display unit. However,
targets cannot be acquired.
Note: When using your unit as remote display, you cannot change the range of the main
radar at the remote display. For the target acquisition, set the range individually.
Usage precautions for ARP
No one navigational aid should be relied
upon for the safety of vessel and crew.
The navigator has the responsibility to
check all aids available to confirm
position. Electronic aids are not
a substitute for basic navigational
principles and common sense.
• This auto plotter automatically tracks an
automatically or manually acquired radar
target and calculates its course and
speed, indicating them by a vector. Since
the data generated by the auto plotter
are based on what radar targets are
selected, the radar must always be
optimally tuned for use with the auto
plotter, to ensure required targets will not
be lost or unwanted targets such as sea
returns and noise will not be acquired
and tracked.
• A target does not always mean a land mass, reef, ships or other surface vessels
but can imply returns from sea surface
and clutter. As the level of clutter changes
with environment, the operator should
properly adjust the A/C SEA, A/C RAIN
and GAIN controls to be sure target
echoes are not eliminated from the
radar screen.
CAUTION
The plotting accuracy and response of
this auto plotter meets IMO standards.
Tracking accuracy is affected by the
following:
• Tracking accuracy is affected by course
change. One to two minutes is required to
restore vectors to full accuracy after an
abrupt course change. (The actual
amount depends on gyrocompass
specifications.)
• The amount of tracking delay is inversely
proportional to the relative speed of the
target. Delay is on the order of 15-30
seconds for high relative speed; 30-60
seconds for low relative speed.
Display accuracy is affected by the
following:
• Echo intensity
• Radar transmission pulsewidth
• Radar bearing error
• Gyrocompass error
• Course change (own ship or target)
CAUTION
Page 60
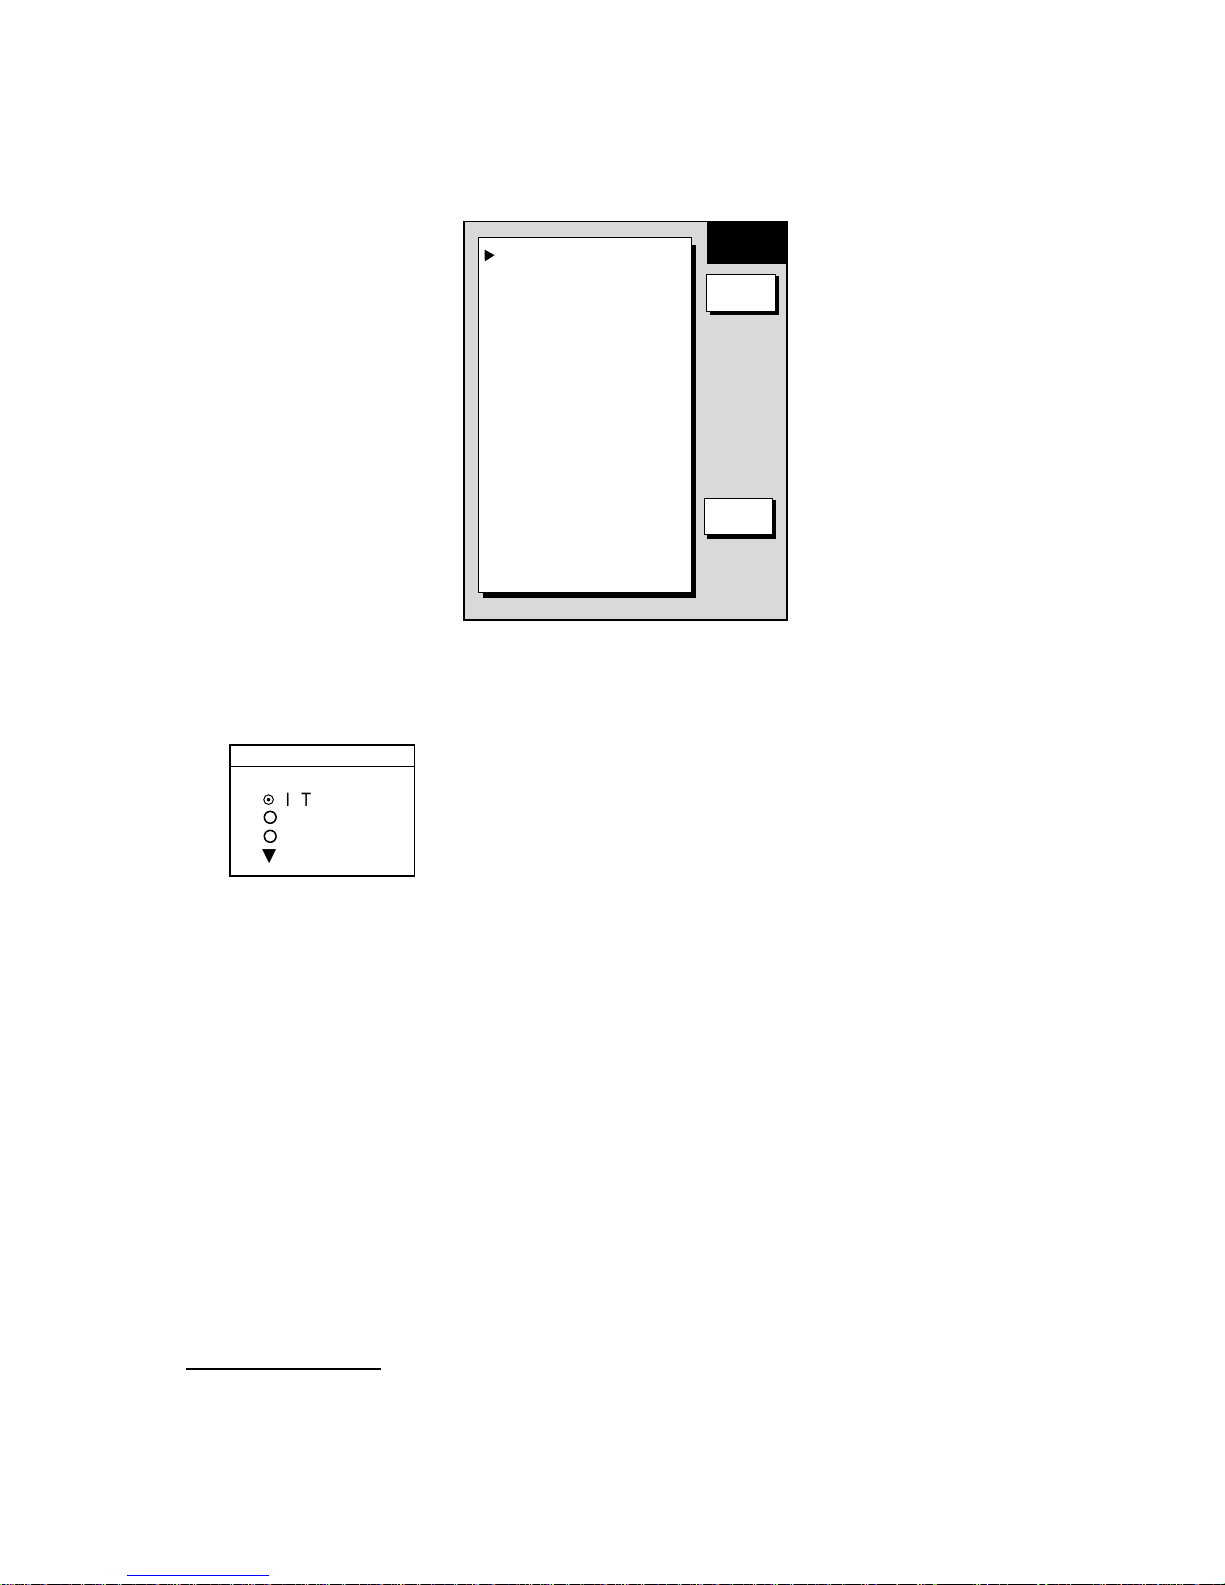
2. RADAR OPERATION
2-29
2.25.1 Activating/deactivating ARP, TTM
1. Press the MENU key followed by the ARP SETUP soft key to show the ARP SETUP
menu.
ARP TARGET INFO
INTERNAL ARP
CANCEL ALL TARGETS
ON
ARP VECTOR MODE
RELATIVE
ARP VECTOR TIME
30 minutes
HISTORY INTERVAL
OFF
CPA
OFF
TCPA
30 seconds
AUTO ACQUISITION AREA
OFF
TARGET ID NUMBER
OFF
ARP
SETUP
EDIT
RETURN
ARP setup menu
2. Select ARP TARGET INFO, then press the EDIT soft key to show the ARP TARGET
INFO window.
ARP TARGET INFO
▲
¡
¡
▼
¤
INTERNAL ARP
EXTERNAL ARP
OFF
ARP TARGET INFO window
3. Select INTERNAL ARP, EXTERNAL ARP or OFF as appropriate.
EXTERNAL ARP: Receive TTM data sentence via NMEA or NETWORK port. Target
tracks are shown but targets cannot be acquired.
OFF: Turns off the ARP or TTM display.
4. Press the ENTER soft key.
5. Press the MENU key to close the menu.
2.25.2 Acquiring and tracking targets (ARP)
Ten targets may be acquired and tracked m anually and automatically. When you attempt to
acquire an 11th target, the message “ARP FULL – ALREADY TRACKING 10 TARG ETS!”
appears for five seconds. To acquire another target, term inate tracking of an unnecessary
target as shown in the paragraph “2.25.4 Terminating tracking of ARP targets.”
Manual acquisition
When the automatic acquisition (AUTO ACQ. AREA) is set to on, up to five targets may be
acquired manually. If you attempt to acquire a sixth target, the alert message appears.
1. If not already shown, press the HIDE/SHOW key to show the radar soft keys.
Page 61
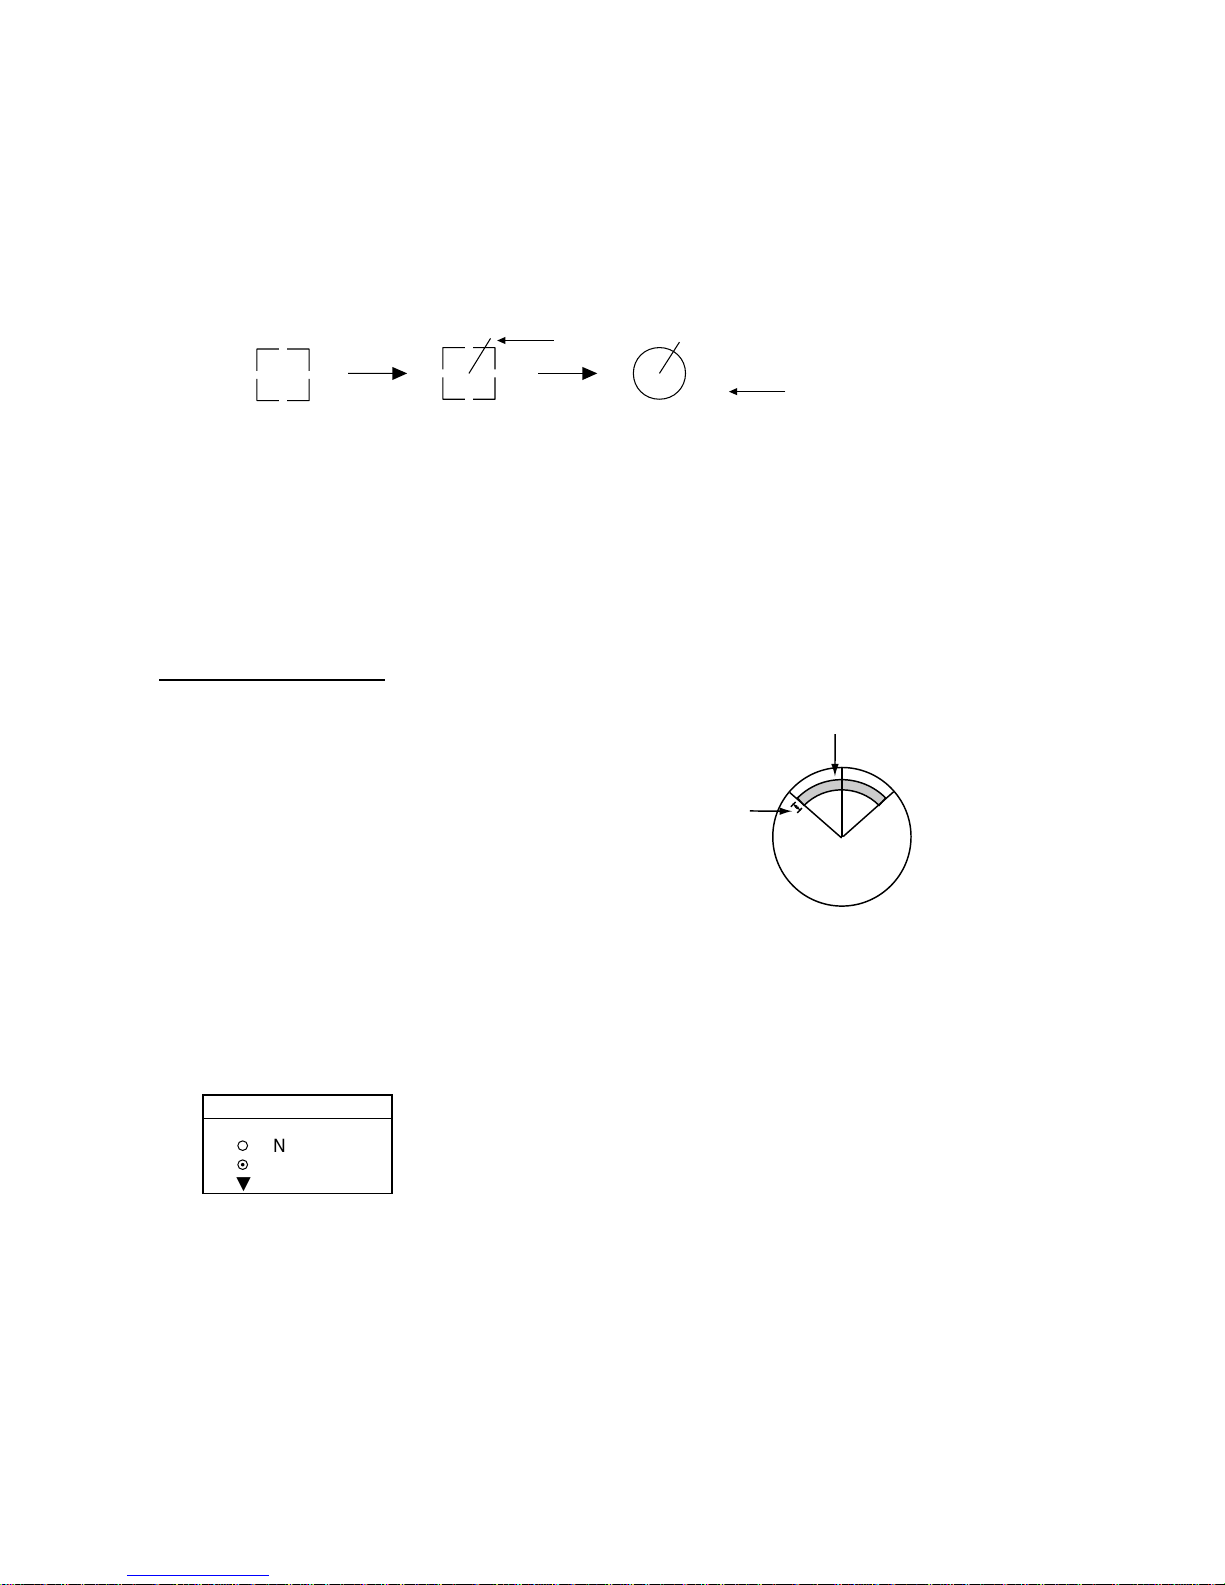
2. RADAR OPERATION
2-30
Automatic acquisition area
45° port
45° starboard
2.0 - 2.5 nm
Automatic acquisition area
2. Press the TARGET soft key.
3. Place the cursor on the target to acquire.
4. Press the ACQ soft key.
5. Press the RETURN soft key to finish.
The plot symbol changes over time as below. A vector appears about one minute after
acquisition, indicating the target ’s motion trend.
At acquisition 1 min. after
acquisition
3 min. after
acquisition
01*
01*
01*
Vector
* = Target number shown when TARGET ID NUMBER is
turned on in the ARP SETUP menu.
Target Number
ARP plot symbols
Note: In case of the acquisition by an external ARP, the acquisition circle mark appears one
minute after acquisition.
Automatic acquisition
The ARP can acquire up to ten targets
automatically by setting an automatic
acquisition area. When automatic acquisition is
selected after acquiring targets manually, onl y
the remaining capacity for targets may be
automatically acquired. For example, if seven
targets have been manually acquired, three
targets may be automatically acquired.
1. Press the MENU key to show the main
menu.
2. Press the ARP SETUP soft key to show the ARP SETUP menu.
3. Operate the Cursor pad to select AUTO ACQUISITION AREA.
4. Press the EDIT soft key to show the automatic acquisition area window.
AUTO ACQ. AREA
▲
¤
▼
¡
ON
OFF
Automatic acquisition area window
5. Select ON, then press the ENTER soft key.
6. Press the MENU key to close the menu. An acquisition area of 2.0 to 2.5 miles in range
and ±45º on either side of the heading line in bearing appears.
Note: Targets being tracked in automatic acquisition are continuously tracked when
switching to manual acquisition.
Page 62
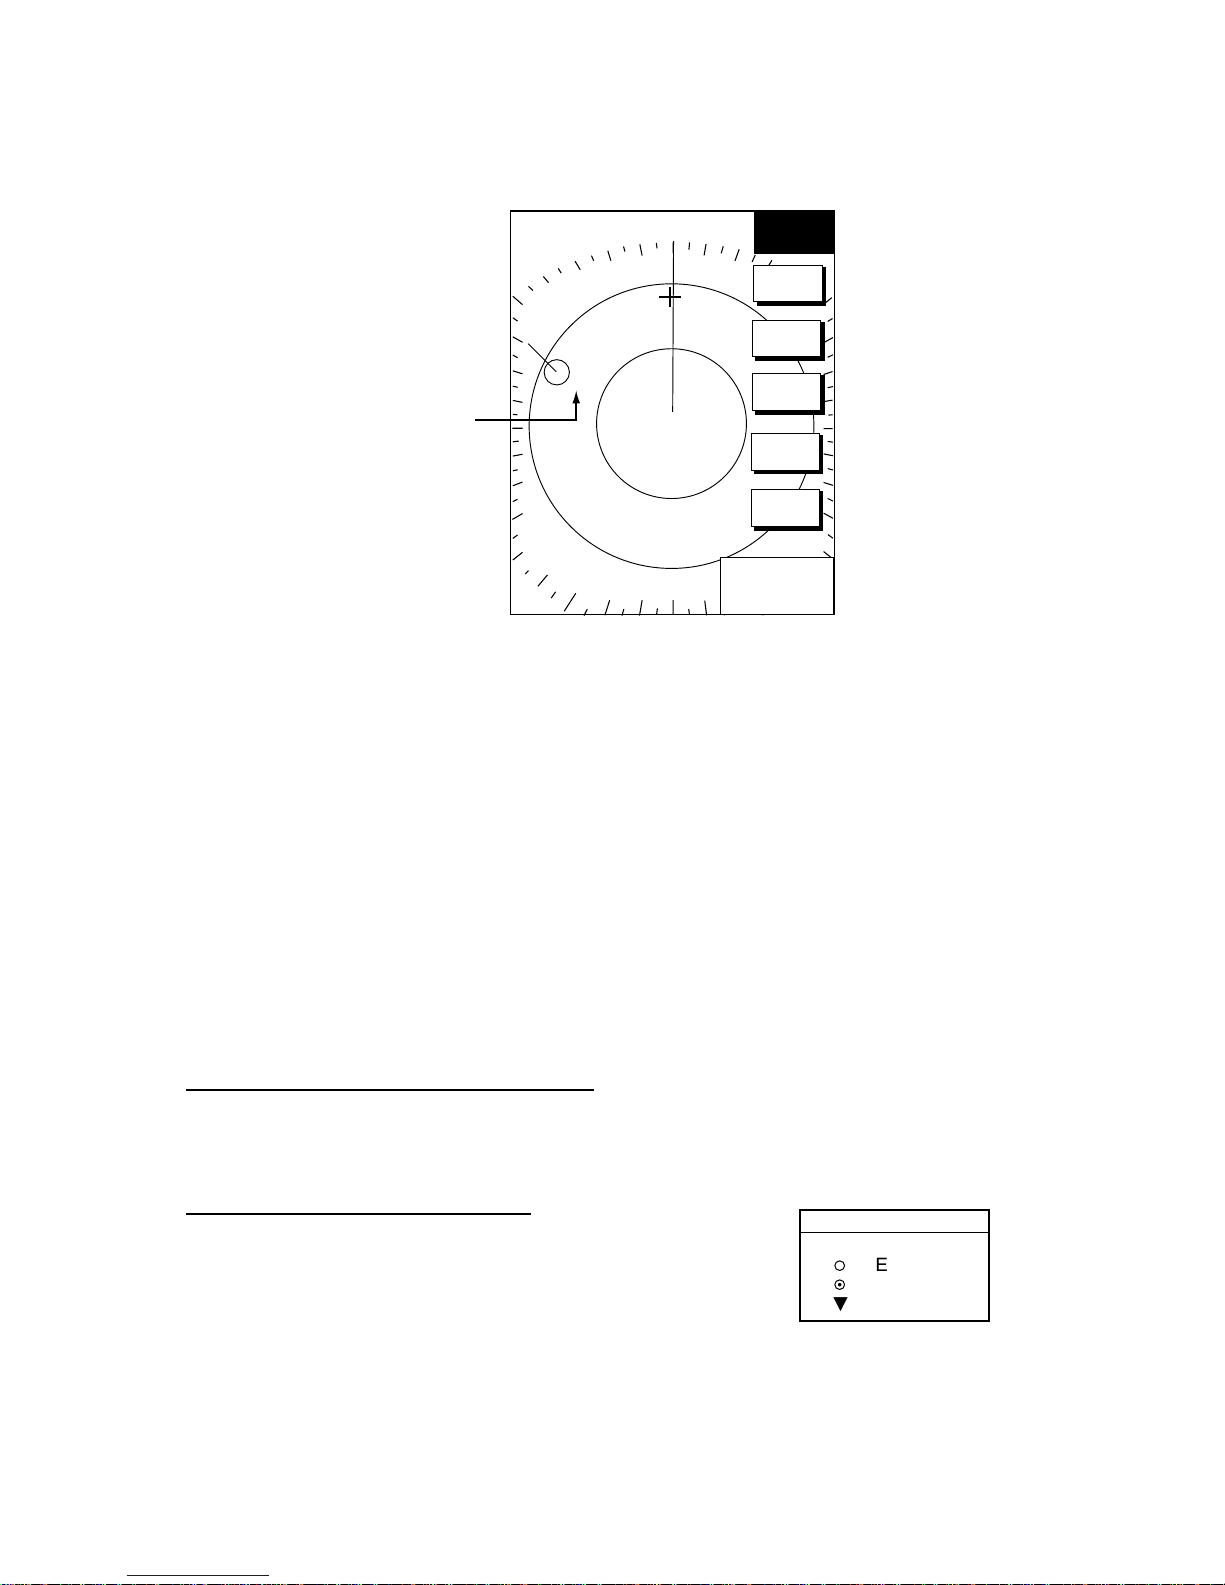
2. RADAR OPERATION
2-31
CANCEL ALL TARGETS
▲
¤
▼
¡
YES
NO
Cancel all targets window
2.25.3 Displaying target number (ARP, TTM)
Target number can be shown for ARP and TTM targets as below.
.250/ 319.9
°
T
.125nm
SP
H-UP
TARGET
TRAIL
TLL
OUTPUT
ACQ
TARGET
INFO
RETURN
ARP
Target
Number
01
+
359.9°R
0.240nm
ARP target number
1. Press the MENU key.
2. Press the ARP SETUP soft key.
3. Select TARGET ID NUMBER.
4. Press the EDIT soft key.
5. Select ON or OFF as appropriate.
6. Press the ENTER soft key.
7. Press the MENU key to close the menu.
2.25.4 Terminating tracking of ARP targets
When ten targets have been acquired, no m ore acquisition occurs unless targets are
cancelled. If you need to acquire additional targets, you must first cancel one or more
individual targets, or all targets, using one of the procedures below.
Terminating trackin g of sel ected targets
1. Place the cursor on the target to terminate tracking.
2. Press the CLEAR key to terminate tracking and erase the target.
Terminating tracking of all targets
1. Press the MENU key followed by the ARP SETUP
soft key.
2. Select CANCEL ALL TARGETS.
3. Press the EDIT soft key.
4. Select YES.
5. Press the ENTER soft key.
6. Press the RETURN soft key followed by the MENU key to close the menu.
Page 63
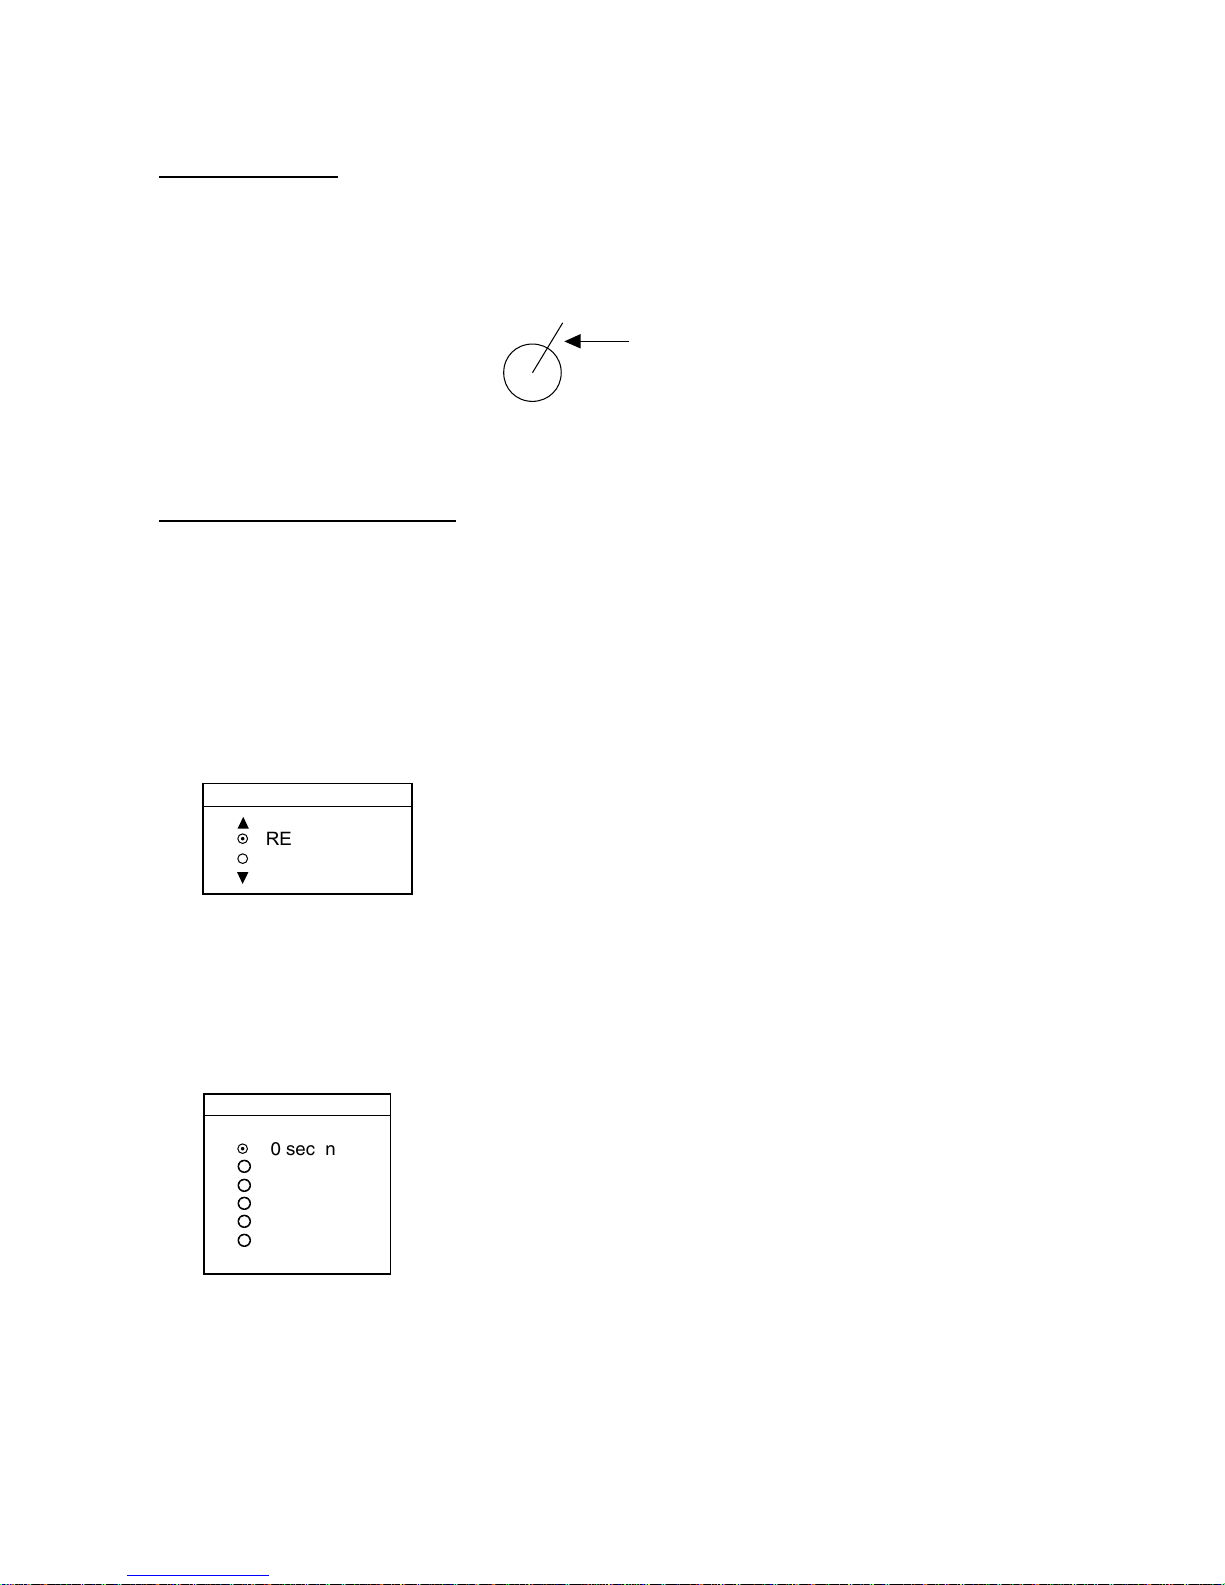
2. RADAR OPERATION
2-32
2.25.5 Setting vector attributes (ARP)
What is a vector?
A vector is a line extending from a tracked target which shows estimat ed speed and course
of the target. The vector tip shows an estimated position of the target after the selected
vector time elapses. It can be useful to extend the vector length (time) in order to evaluate
the risk of collision with any target.
Vector
Vector
Vector reference, vector time
You may reference the vectors to North (True, requires heading and speed dat a) or ship’s
heading (relative) as desired. Vector time can be set to 30 seconds, 1, 3, 6, 15 or 30
minutes.
1. Press the MENU key followed by the ARP SETUP soft key to show the ARP SETUP
menu.
2. Operate the Cursor pad to select ARP VECTOR MODE.
3. Press the EDIT soft key to show the ARP vector mode window.
ARP VECTOR MODE
¡
¤
RELATIVE
TRUE
ARP vector mode window
4. Select TRUE or RELATIVE as appropriate.
5. Press the ENTER soft key.
6. Select ARP VECTOR TIME, then press the EDIT soft key to show the ARP vector time
window.
ARP VECTOR TIME
▲
¡
¡
¡
¡
¡
▼
¤
30 seconds
1 minute
3 minutes
6 minutes
15 minutes
30 minutes
ARP vector time window
7. Operate the Cursor pad to select vector time among 30 sec, 1 min, 3 min, 6 min, 15
min and 30 min.
8. Press the ENTER soft key.
9. Press the MENU key to close the menu.
Page 64

2. RADAR OPERATION
2-33
2.25.6 Displaying past position (ARP)
This ARP can display time-spaced dots (maximum ten dots) m arking the past positions of
any targets being tracked. You can evaluate a target’s actions by the spacing between dots.
Below are examples of dot spacing and target movement.
(a) Ship turning
(b) Ship running
straight
(c) Ship reduced
speed
(d) Ship increased
speed
Past position displays
To turn the past position display on or off:
1. Press the MENU key followed by the ARP SETUP soft key.
2. Operate the Cursor pad to select HISTORY INTERVAL.
3. Press the EDIT soft key to show the history interval window.
HISTORY INTERVAL
▲
¡
¡
¡
¡
▼
¤
OFF
30 seconds
1 minute
3 minutes
6 minutes
History interval window
4. Operate the Cursor pad to select history interval among 30 sec, 1 m in, 3 m in and 6 min,
or select OFF to turn off the past position display.
5. Press the ENTER soft key.
6. Press the MENU key to close the menu.
Page 65

2. RADAR OPERATION
2-34
2.25.7 ARP, TTM target data
You can show motion trends (range, bearing, course, speed, CPA and T CPA) for ARP or
TTM targets.
1. Place the cursor on the target whose data you want to see.
2. If not already displayed, press the HIDE/SHOW key to show the radar soft keys.
3. Press the TARGET and TARGET INFO soft keys. The data of the selected target
appears at the bottom left-hand corner of the display. (If an EBL/VRM data box is
displayed the ARP (TTM) data box will be under it.)
4. Press the RETURN soft key to finish.
To erase ARP/TTM target data, select the corresponding target with the cursor, then press
the CLEAR key.
.250/ 319.9
°
T
.125nm
SP
H-UP
359.9°R
0.240nm
TARGET
TRAIL
TLL
OUTPUT
ACQ
TARGET
INFO
RETURN
ARP
Target
No.01 VECTOR TRUE 15min
CSE 359.9°T SPD 12.5kt
CPA 2nm TCPA 12.35
CPA and TCPA
Course and Speed
Target No., Vector Reference (True), Vector Time
01
Cursor
+
+
ARP target data
Page 66

2. RADAR OPERATION
2-35
2.25.8 CPA/TCPA alarm (ARP)
When the predicted CPA of any target becomes sm aller than a preset CPA alarm range or
its predicted TCPA less than a preset TCPA alarm limit, an audio alarm sounds and the
speaker icon appears (in red). In addition, the target plot symbol of the offending target
changes to a triangle and flashes toget her with its vector. You may silence the audio alarm
with the CLEAR key. Press the ALARM key and the message “COLLISION ALARM”
appears. Press the CLEAR ALARM soft key to acknowledge the alarm. The f lashing of the
triangle plot symbol continues until you intentionally terminate tracking of the target. The
ARP continuously monitors the predicted range at the Closest Point of Approach (CPA) and
predicted time to CPA (TCPA) of each track to own ship.
This feature helps alert you to targets which may be on a collision course with own ship.
However, it is important that gain, A/C SEA, A/C RAIN and other radar controls are properly
adjusted and the ARP is set up so that it can track targets effectively.
CPA/TCPA alarm ranges must be set up properly taking into consideration the size,
tonnage, speed, turning perform ance and other characteristics of own ship.
CAUTION
The CPA/TCPA alarm should never be
relied upon as the sole means for detecting the risk of collision. The navigator is
not relieved of the responsibility to keep
visual lookout for avoiding collisions,
whether or not the radar or other plotting
aid is in use.
Follow the steps shown below to set the CPA/TCPA alarm
range:
1. Press the MENU key followed by the ARP SETUP soft
key.
2. Operate the Cursor pad to select CPA.
3. Press the EDIT soft key to show the CPA window.
4. Select a CPA limit desired from 0.5 nm, 1 nm, 2 nm, 3
nm, 5 nm and 6 nm with the Cursor pad.
5. Press the ENTER soft key. The ARP SETUP menu
reappears.
6. Operate the Cursor pad to select TCPA.
7. Press the EDIT soft key to show the TCPA window.
8. Select a TCPA limit from 30 sec, 1 min, 2 min, 3 min, 4
min, 5 min, 6 min and 12 min.
9. Press the ENTER soft key.
10. Press the MENU key to close the menu.
CPA
▲
¡
¡
¡
¡
¡
¡
▼
¤
OFF
0.5nm
1nm
2nm
3nm
5nm
6nm
CPA distance
TCPA
▲
¡
¡
¡
¡
¡
¡
¡
▼
¤
30 seconds
1 minute
2 minutes
3 minutes
4 minutes
5 minutes
6 minutes
12 minutes
TCPA time
Page 67

2. RADAR OPERA TION
2-36
2.25.9 Lost target alarm (ARP)
When the sys tem detects a lost target, the target sy m bol becomes a diamond and tracking
is discontinued after one minute.
01
Lost target mark
Canceling a lost target
1. Place the cursor on the target.
2. Press the CLEAR key.
Page 68
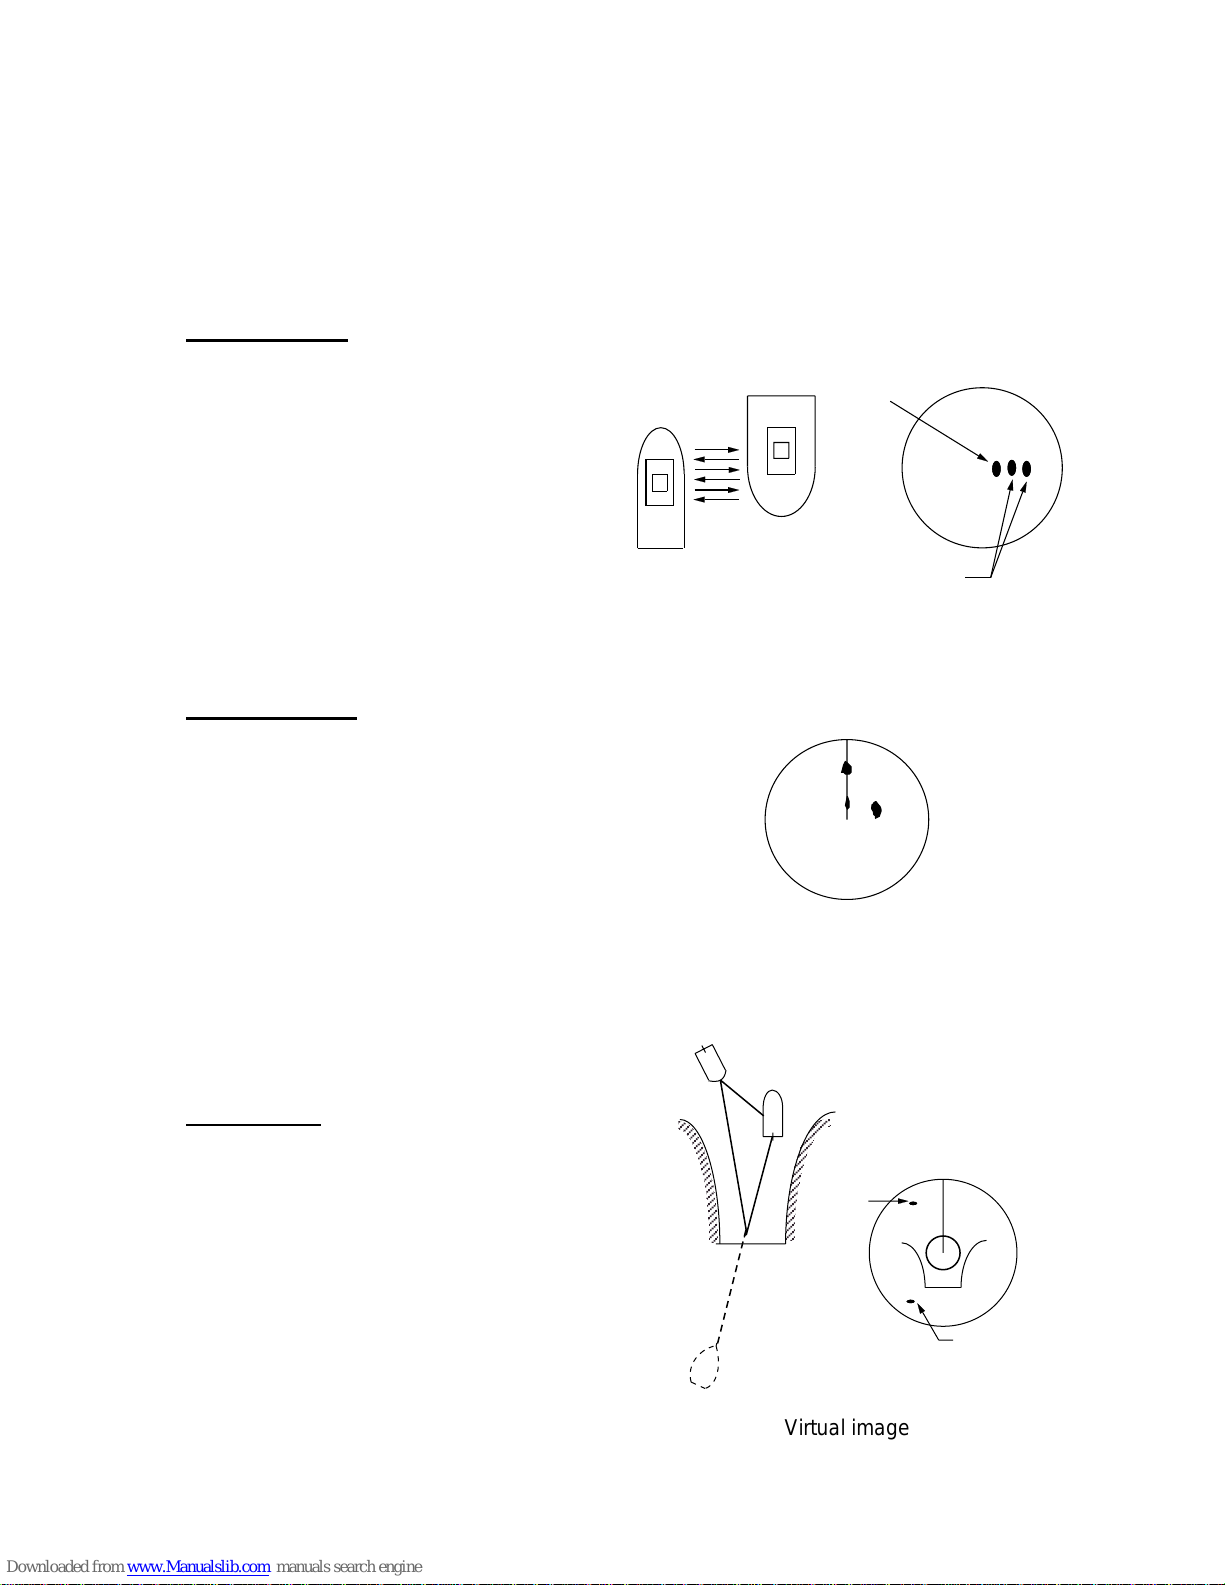
2. RADAR OPERATION
2-37
2.26 Interpreting the Radar Display
2.26.1 False echoes
Occasionally echo signals appear on the screen at positions where there is no target or
disappear even if there are targets. False t arget sit uations may be recognized, however, if
you understand why they are displayed. Typical false echoes are shown below.
Multiple echoes
Multiple echoes occur when a transmitt ed
pulse returns from a solid object like a
large ship, bridge, or breakwater. A
second, a third or more echoes may be
observed on the display at double, tr iple or
other multiples of the actual range of the
target as shown below. Multiple reflection
echoes can be reduced and often
removed by decreasing the gain
(sensitivity) or properly adjusting the A/C
SEA control.
Sidelobe echoes
Every time the radar pulse is transmitted,
some radiation escapes on each side of
the beam. This stray RF is called a
“sidelobe.” If a target exists where it can
be detected by the sidelobes as well as
the main lobe, the side echoes may be
represented on both sides of the true echo
at the same range. Sidelobes show
usually only on short ranges and from
strong targets. They can be reduced
through careful reduction of the gain or
proper adjustment of the A/C SEA control.
Virtual image
A relatively large target close to your ship
may show at two positions on the screen.
One of them is the true echo directly
reflected by the target and the other is a
false echo which is caused by the mirror
effect of a large object on or close to your
ship as shown in the figure below. If your
ship comes close to a large metal bridge,
for example, such a false echo may
temporarily be seen on the screen.
Virtual image
Own ship
Target
Tr u e
echo
Multiple
echo
Multiple echoes
Target B
(True)
Target B
(Spurious)
Target A
Sidelobe echoes
Tr u e
echo
False
echo
Own
ship
Target ship
Mirror image
of target ship
;
Virtual image
Page 69
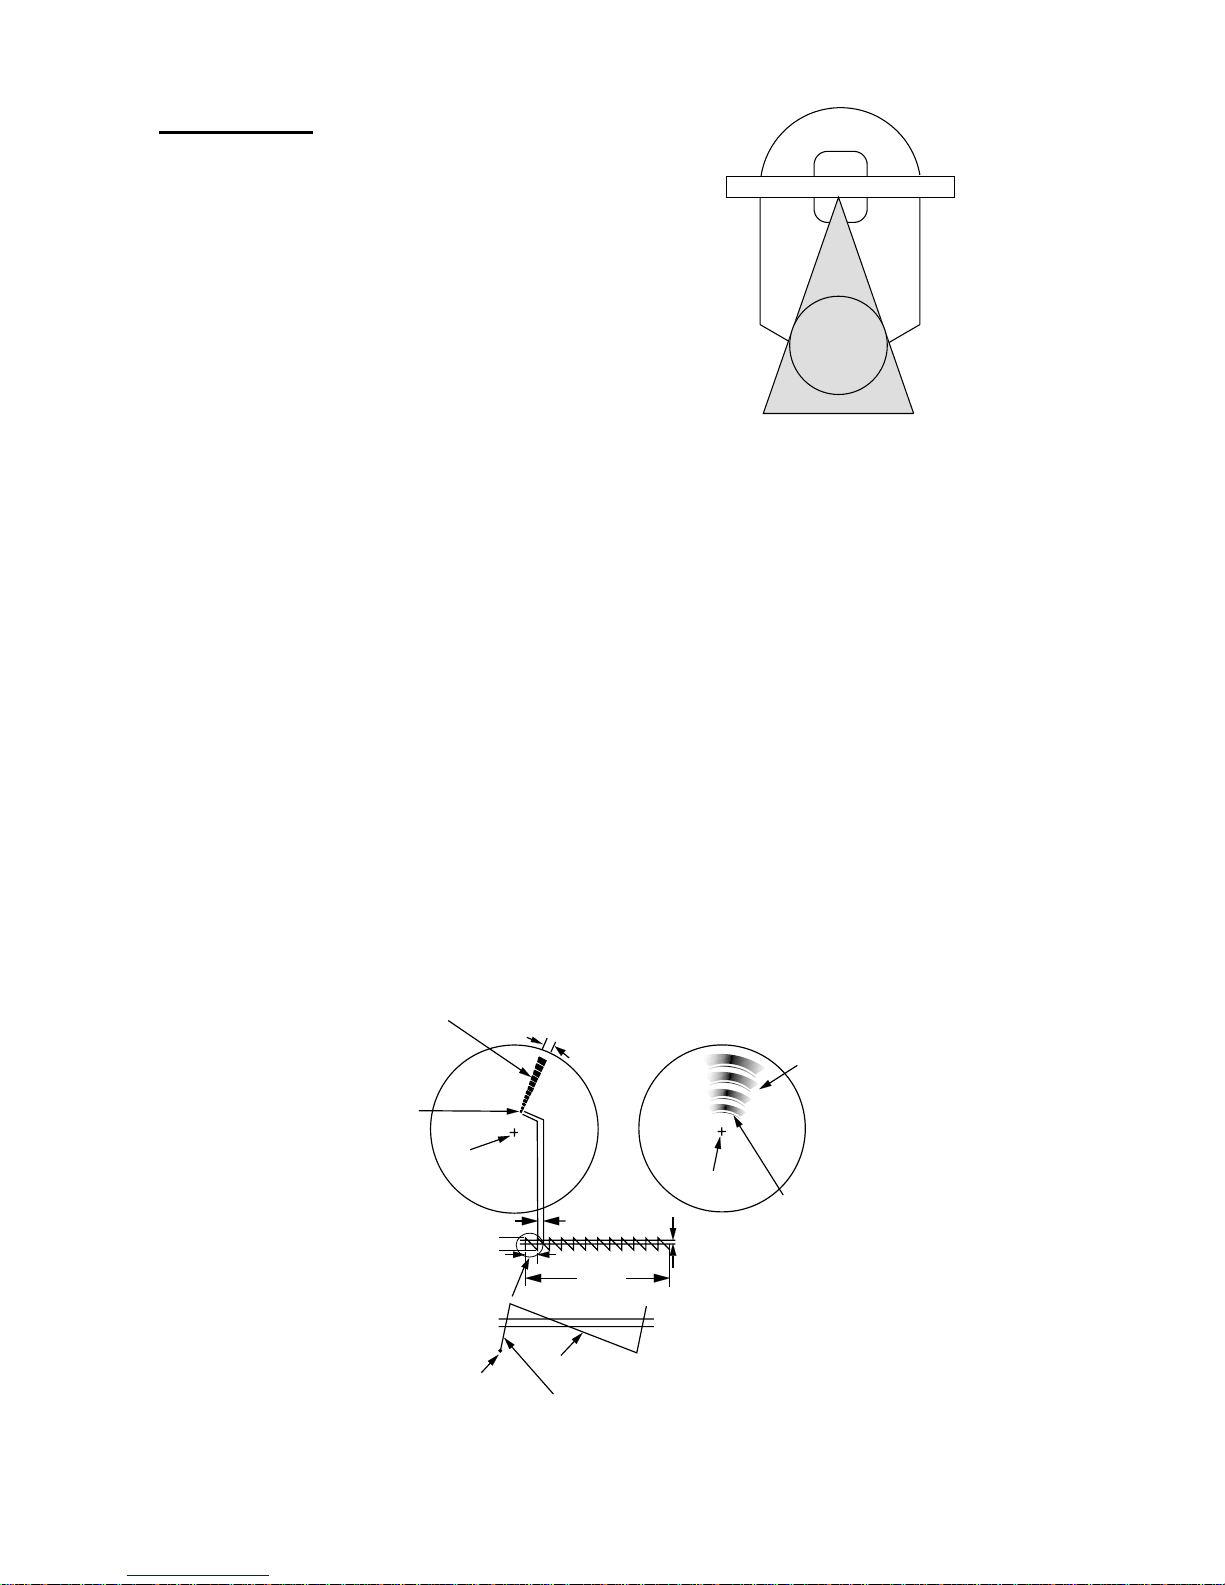
2. RADAR OPERATION
2-38
Radar
antenna
Radar
mast
Shadow sector
Funnels, stacks, masts, or derricks in the path of the
antenna block the radar beam. If the angle subtended
at the antenna is more than a fe w degrees, a
non-detecting sector or blind spot may be produced.
Within this sector, targets can not be detected.
2.26.2 SART (Search and Rescue Transponder )
A Search and Rescue Transponder (SART) may be triggered by any X-Band (3 cm ) radar
within a range of approximately 8 nm . Each radar pulse received causes it to transmit a
response which is swept repetitively across the complet e radar frequency band. When
interrogated, it first sweeps rapidly (0.4 µs) through the band before beginning a relatively
slow sweep (7.5 µs) through the band back to the starting frequency. This process is
repeated for a total of twelve complete cycles. At some point in each sweep, the SART
frequency will match that of t he interrogating radar and be within the pass band of the radar
receiver. If the SART is within range, the fr equency match during each of the 12 slow
sweeps will produce a response on the radar display, t hus a line of 12 dots equally spaced
by about 0.64 nautical miles will be shown.
When the range to the SART is reduced to about 1 nm, the radar display may show also the
12 responses generated during the fast sweeps. T hese additional dot responses, which
also are equally spaced by 0.64 nm, will be interspersed with the original line of 12 dots.
They will appear slightly weaker and smaller than the original dots.
9500 MHz
9200 MHz
Radar antenna
beamwidth
Screen A: When SART
is distant
Screen B: When SART
is close
Lines of 12
dots are
displayed in
concentric
Echo from SART
Position of
SART
Own ship
position
Own ship
position
SART mark
length
Radar receiver
bandwidth
Sweep time
7.5 µs
95 µs
Sweep start
High speed sweep signal
Low speed sweep signal
24 NM
1.5 NM
Position of
SART
Echo from
SART
Appearance of SART signal on the radar display
Page 70

2. RADAR OPERATION
2-39
General procedure for detecting SART response
1. Use the range scale of 6 or 12 nm as the spacing between the SART responses is
about 0.6 nm (1125 m) to distinguish t he SART.
2. Turn off the automatic clutter suppression (if applicable).
3. Turn off the Interference Rejector.
2.26.3 Racon (Radar Beacon)
A racon is a radar transponder which emits a characteristic signal when tr iggered by a
ship’s radar (usually only the 3 centim eter band). The signal may be emitted on the same
frequency as that of the triggering radar, in which case it is superimposed on the ship's
radar display automatically.
The racon signal appears on the PPI as a radial line origi nating at a point just beyond the
position of the radar beacon or as a Morse code signal (see figure below) displayed radially
from just beyond the beacon.
Racon
Appearance of racon signal on the radar display
Page 71

INDEX
2-40
This page is intentionally left blank.
Page 72
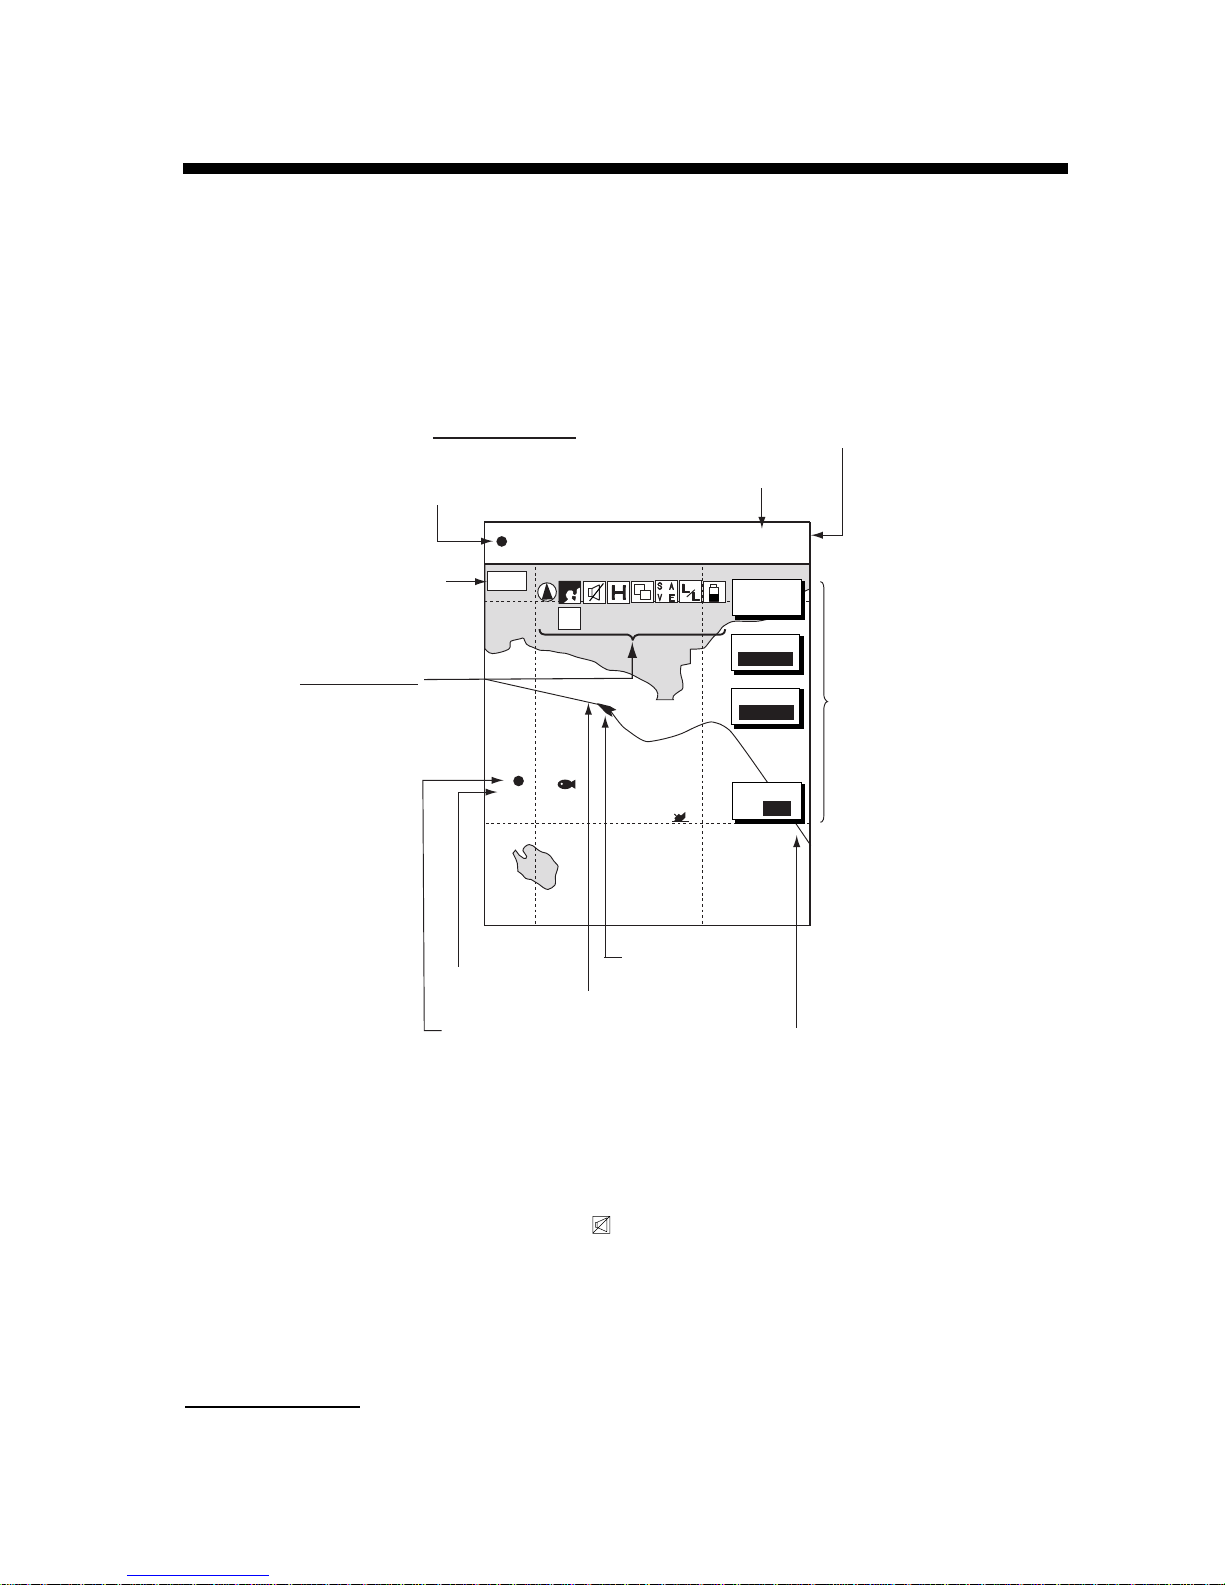
3-1
3. PLOTTER OPERATION
3.1 Plotter Displays
You may show the plotter display over the entire screen, in the overlay screen with the
radar display, or in a combination screen.
3.1.1 Full-screen plotter display
BRIDGE
FISH
002WP
34° 22. 3456'N 359.9° M
TRIP
NU
080° 22. 3456'E
19.9 kt 99.9 nm
MODE
NTH UP
NAV
POS
MARK
ENTRY
D. BOX
ON/ OFF
16.0nm
S
I
M
Nav data window
(Data changes with NAV soft
key setting and cursor
status. For details see next page.)
Course bar
Functions for
soft keys
Own ship
track
Own ship
marker
Presentation mode
(North-up)
Icon (from left)
North Marker
Chart
Alarm
Track Hold
Chart Offset
Save
L/L Offset
Battery
Simulation
(See icon
table on
appendix
for details.)
Waypoint name
Waypoint marker
Scale
Trip distance
Full-screen plotter display
Note: When GPS signal error is found, the following occurs depending on the device
feeding position data:
FURUNO BB GPS Receiver: Alarm icon (
) appears and the aural alarm sounds. Own
ship marker blinks faster.
Other navigator: The message “NO GPS FIX” appears and is accompanied by the aural
alarm and alarm icon. If the GPS signal is missing for more than 90 seconds, the message
“NO POSITION DATA” appears.
Nav data window
The data shown in the nav data window depends on the status of the NAV soft key and the
cursor.
Page 73

3. PLOTTER OPERATION
3-2
359. 9°M 359. 9 °M 79. 9°F NU
19. 9kt 99. 9nm 345 ft
Bearing to Waypoint
Course, Speed
Range
to
Waypoint
Water Temp.*,
Depth*
CSE
SOG
BRG
RNG
TMP
DPT
NAV
S/C
soft key
Presentation
Mode
Own Ship Mark Speed
Trip Distance
NAV
POS
soft key
34°24. 3456'N 359. 9°
M
TRIP
NU
124°24. 3456'W 19. 9kt 99. 9nm
CourseLatitude, Longitude
Presentation
Mode
Own ship
position
Own ship
speed and
course
NAV
OFF
soft key
Turns off
nav data
window
* Requires appropriate
sensor.
34°24. 3456'N 359. 9°
M
TRIP
NU
124°24. 3456'W 59.9nm 99. 9nm
Bearing to Cursor
Latitude, Longitude
Trip Distance
Presentation
Mode
+
Cursor Mark
Latitude and longitude
of cursor intersection
Range to
Cursor
359. 9°M TTG4D02H23M NU
19. 9nm
ETA1st 13:45
Bearing to WaypointWaypoint Name
Estimated Time of
Arrival
Range to Waypoint
Waypoint Mark
001WPT
Presentation
Mode
NAV
WPT
soft key
Destination
waypoint
data
Time-to-Go
to Destination
359. 9°M359. 9°
M
TRIP
NU
19. 9nm 19. 9kt 99. 9nm
CourseBearing to WaypointWaypoint Name
001WPT
Waypoint data
(waypoint selected
with cursor)
Presentation
Mode
SpeedRange to WaypointWaypoint Mark Trip Distance
Contents of nav data window
Page 74
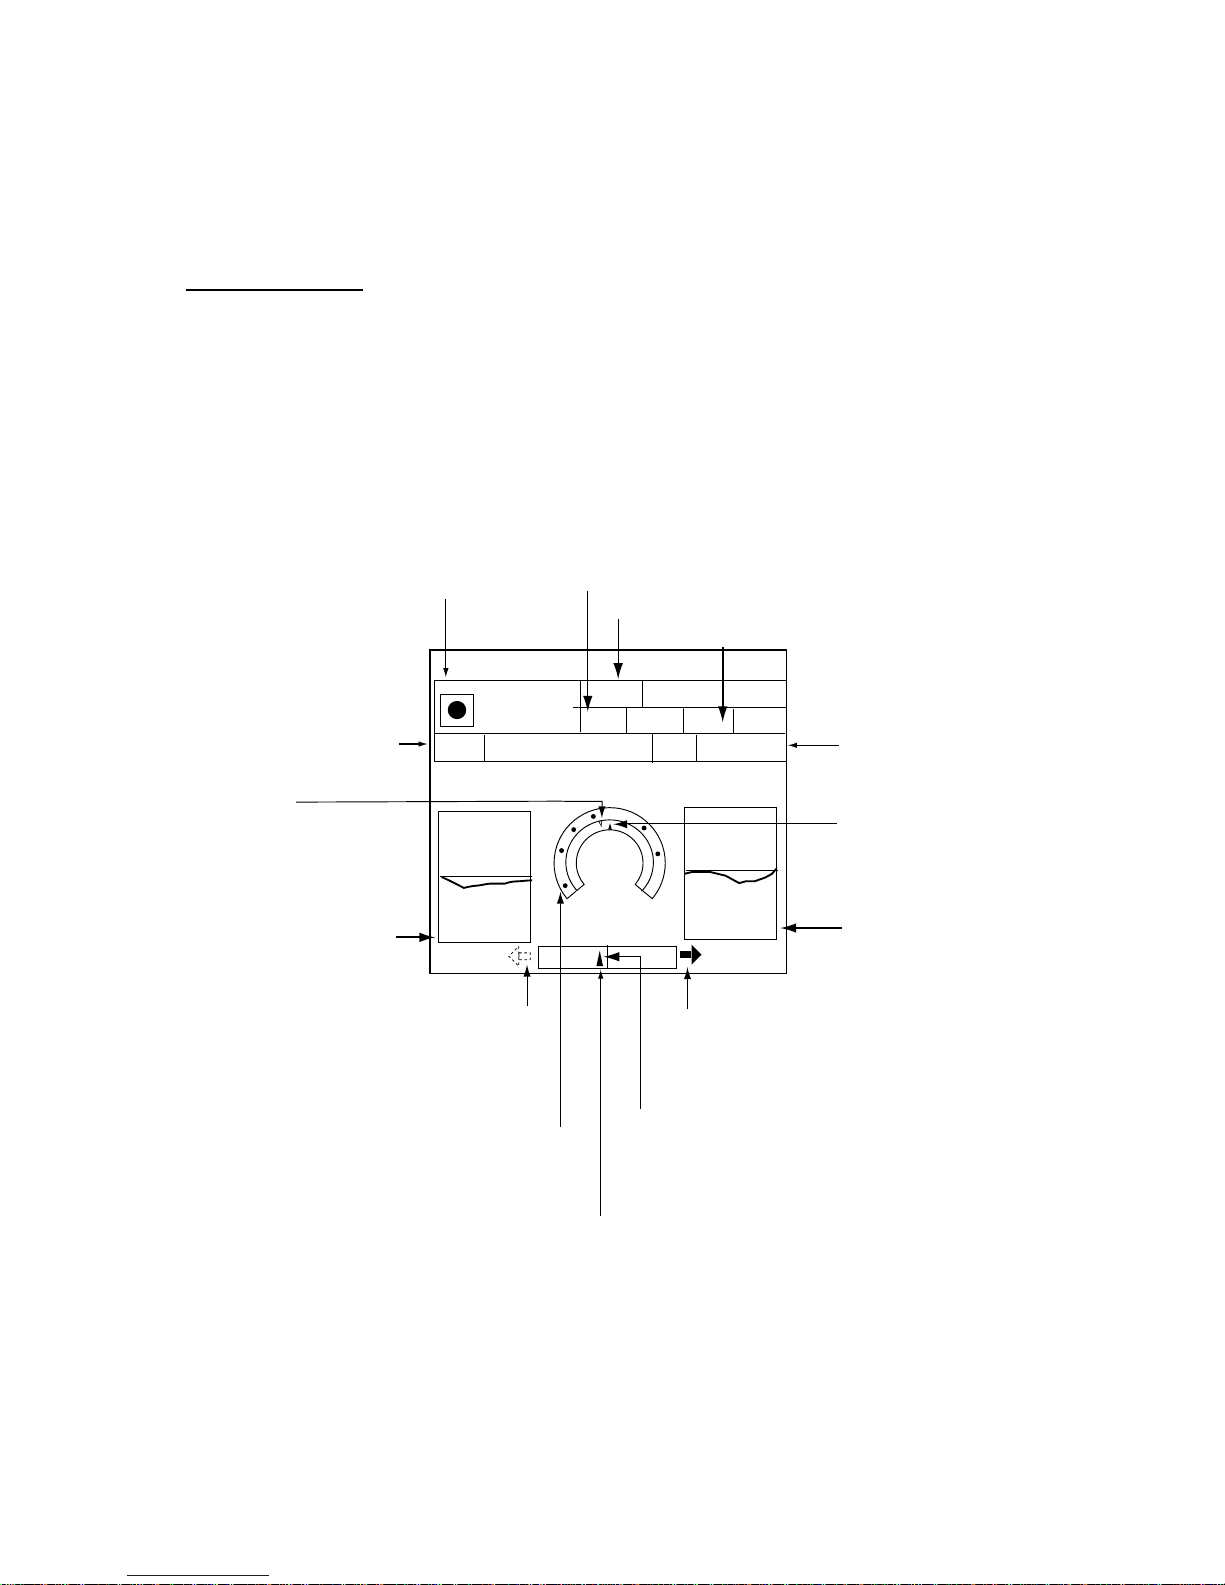
3. PLOTTER OPERATION
3-3
3.1.2 Nav graphic display
The nav graphic display shows the compass display or the wind display depending on the
setting of GRAPHIC METER in the NAV GRAPHIC DISPLAY SETUP menu. For further
details see paragraph 7.10.
Compass display
The compass display, shown in combination displays, provides steering information. The
compass rose shows two triangles: the red triangle shows own ship’s course and the black
triangle, which moves with ship’s course, shows the bearing to destination waypoint.
The water temperature and depth graphs, which require appropriate sensors, show the
latest 10 minutes of water temperature and depth data. The range of the depth graph is 50
feet and it is automatically adjusted with depth. You may adjust the update interval for these
graphs on the NAV GRAPHIC DISPLAY SETUP menu.
Bearing scale
XTE monitor (See next page for description.)
Depth
graph*
Water
temperature
graph*
Time-to-go
to destination
Estimated time of
arrival at destination
Ship's course
(red and filled
on
color model, filled
on monochrome model
)
Destination
waypoint
Range to destination waypoint
Speed over ground
* = Requires appropriate
sensor.
Destination
waypoint bearing
(black and filled
on color model,
hollow on monochrome model)
0
50
20
10
BRG
DPT
TMP
359.9°M
45.2ft
16.2°F
359.9°M
003WPT
0D 9H 59MTTG 23th23:59
ETA
SOG
10.0
kt
10.0
kt
STW
RNG
99.9nm
N
w
E
Speed through water
CSE
Direction to steer
(green on color model)
Shown (in red on
color model) when
direction to steer
is "left."
Own ship marker
(For color model, black when within XTE range,
yellow when over; flashes when over XTE range
on monochrome model)
Compass display
Page 75

3. PLOTTER OPERATION
3-4
Reading the XTE (cross-track error) monito r
The XTE monitor, located below the compass rose, shows the distance you are off course
and the direction to steer to return to course. The own ship marker moves according to
direction and distance off course. It is shown in black when the amount of cross-track error
is within the XTE monitor range and yellow when it is over. An arrow appears at the right or
left side of the XTE monitor and it shows the direction to steer to return to intended course.
It is shown in red when you should steer left, and green when you should steer right. In the
example on the previous page you would steer right to return to course. To maintain course,
steer the vessel so the own ship marker stays at the center of the XTE monitor.
Soft keys
You can show the soft keys for the compass display by pressing the HIDE/SHOW key.
EDIT XT-LMT: Sets the range for XTE monitor scale. See the procedure below for how to
set.
RESET XTE: This soft key may be operated to restart navigation, when a destination is set.
Press the EDIT XT-LMT soft key followed by the RESET XTE soft key. The following
message is displayed.
RESTART NAVGATION TO
CURRENT WPT.
ARE YOU SURE?
YES ... PUSH ENTER KNOB
NO ... PUSH CLEAR KEY
Setting the range for the XTE monitor
1. With the compass (or highway) display shown, press the EDIT XT-LMT soft key to
display the following window.
XTE LIMIT
0 .1nm
XTE range setting window
2. Use the Cursor pad to select digit to change. Note that all digits may be cleared by
pressing the CLEAR key.
3. Enter value with the ENTER knob.
4. Push the ENTER knob to set, or press the CANCEL soft key to cancel.
Page 76

3. PLOTTER OPERATION
3-5
Anemometer display
The anemometer display shows mostly the same data as the compass display. The wind
meter in the center of the display shows wind speed in the bow direction, in graphic and
analog forms.
QP<01>
RNG
4259nm
4259nm
SOG
20.0kt
STW
20.2kt
TTG
*D *H *M
ETA
* *: *
DPT
TMP
WIND SPEED
12.3kt
123ft 12.3°C
45°S
WIND APPARENT
Anemometer display
Page 77
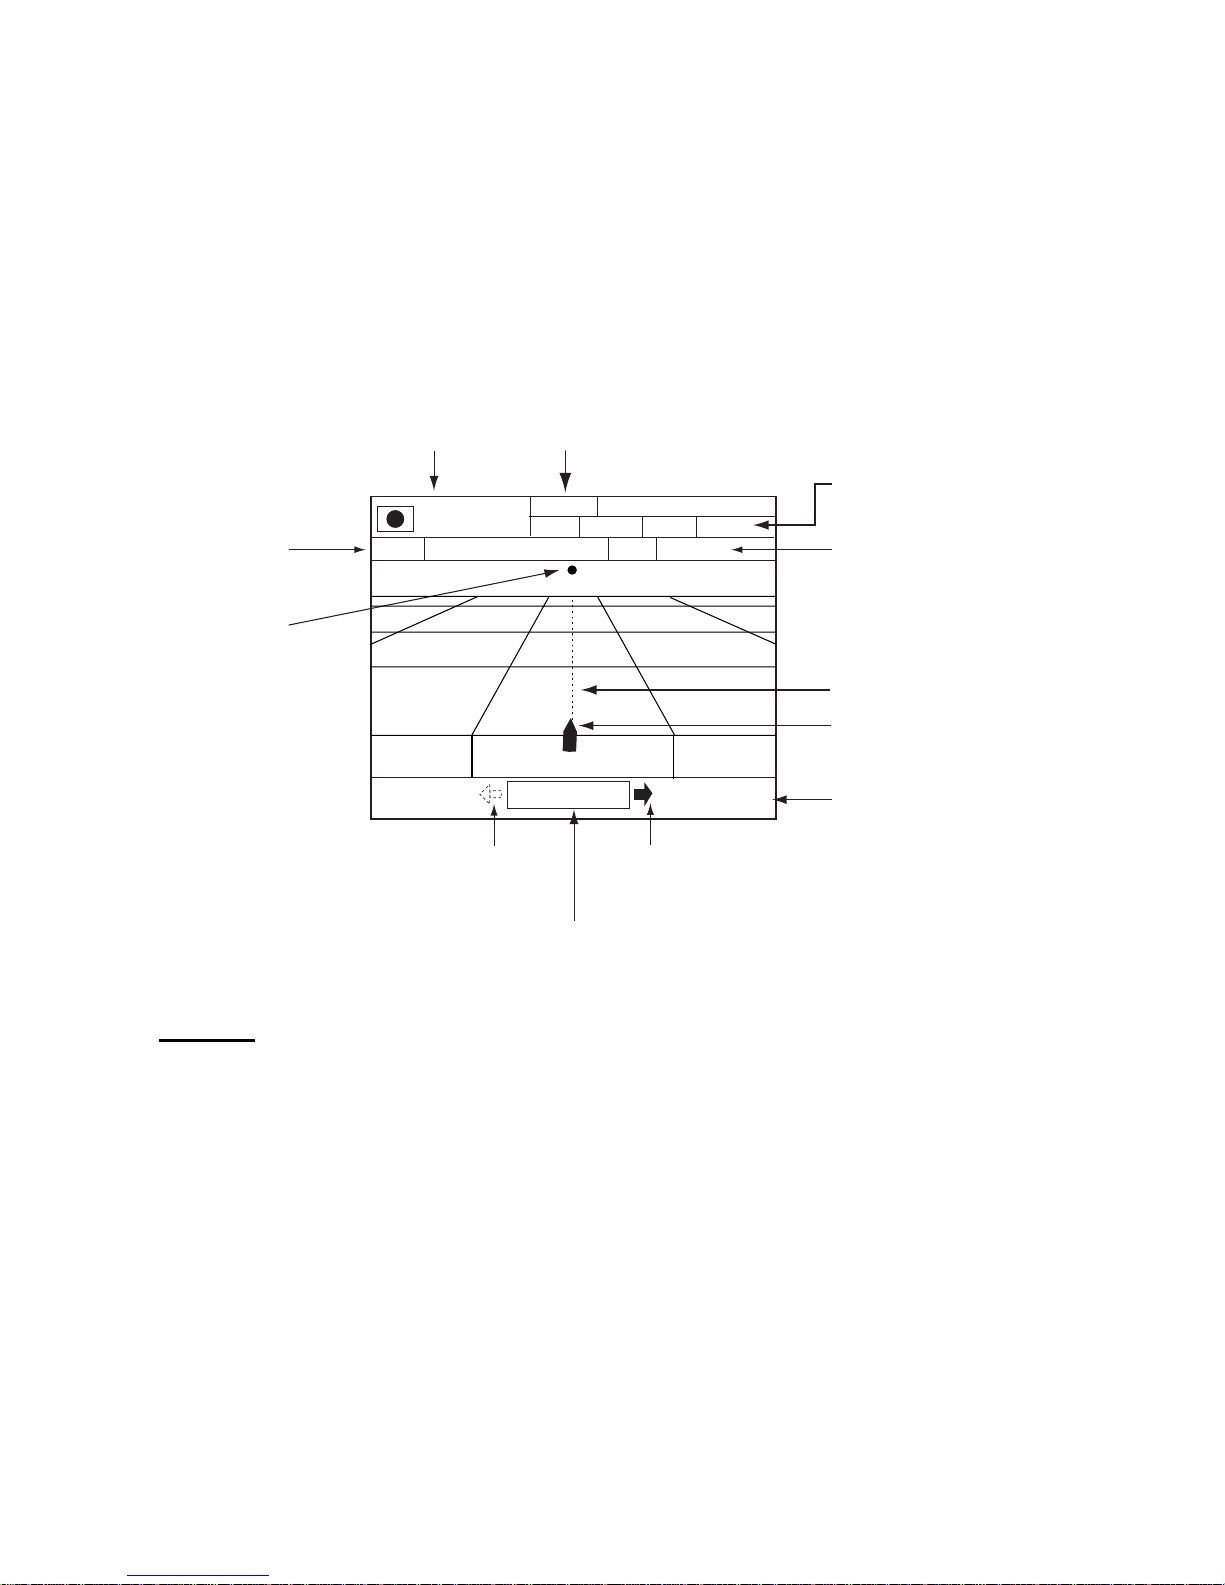
3. PLOTTER OPERATION
3-6
3.1.3 Highway display
The highway display, shown in the combinati on display of radar/c om pass/highway and
plotter/ c om pas s/highway, provides a graphic presentation of ship’s track along intended
course. I t is useful for monitor ing ship’s progress toward a waypoint. The own ship mark er
shows t he r elation between ship and intended cours e. The XTE monitor shows the direc tion
and amount y our v es s el is off course – t he ar r ow shows the direc tion to steer to return to
your course and the numeric t he distance you are off course. Using the f igure below as an
example, you would steer right 0.009 nm to return t o c our se. To maintain course, steer the
vessel so the own ship marker s tays aligned with the intended course line.
Time-to-go
to destination
Range to destination waypoint
Estimated time of
arrival at destination
Destination
waypoint
XTE monitor
XTE range
0.9 nm
WPT001
WPT001
0D 9H 59MTTG 23th23:59ETA
SOG
10.0
kt 10.0 ktSTW
RNG 99.9 nm
0.009nm
0.9 nm
Intended course
Speed over ground,
speed through water
Destination
waypoint
Direction to steer
(green)
Own ship marker
Shown (in red) when
direction to steer
is "left."
Highway di s play
Soft keys
You can show the soft keys for t he highway display by pressing the HIDE/SHOW key.
HIWAY CNTRL: On the radar/plotter/compass combination di s play you can swit c h c ont r ol
to the highway display by pressing the CNTRL soft k ey to show HIWAY.
EDIT XT-LMT: Sets the range f or X TE monitor scal e. See the procedure on the previous
page for how to set.
RESET XTE: This soft k ey m ay be oper ated to restart navigation, when a des tination is s et.
Press the EDIT XT-LMT soft key followed by the RESET XTE soft key. See the previous
page for details.
Page 78
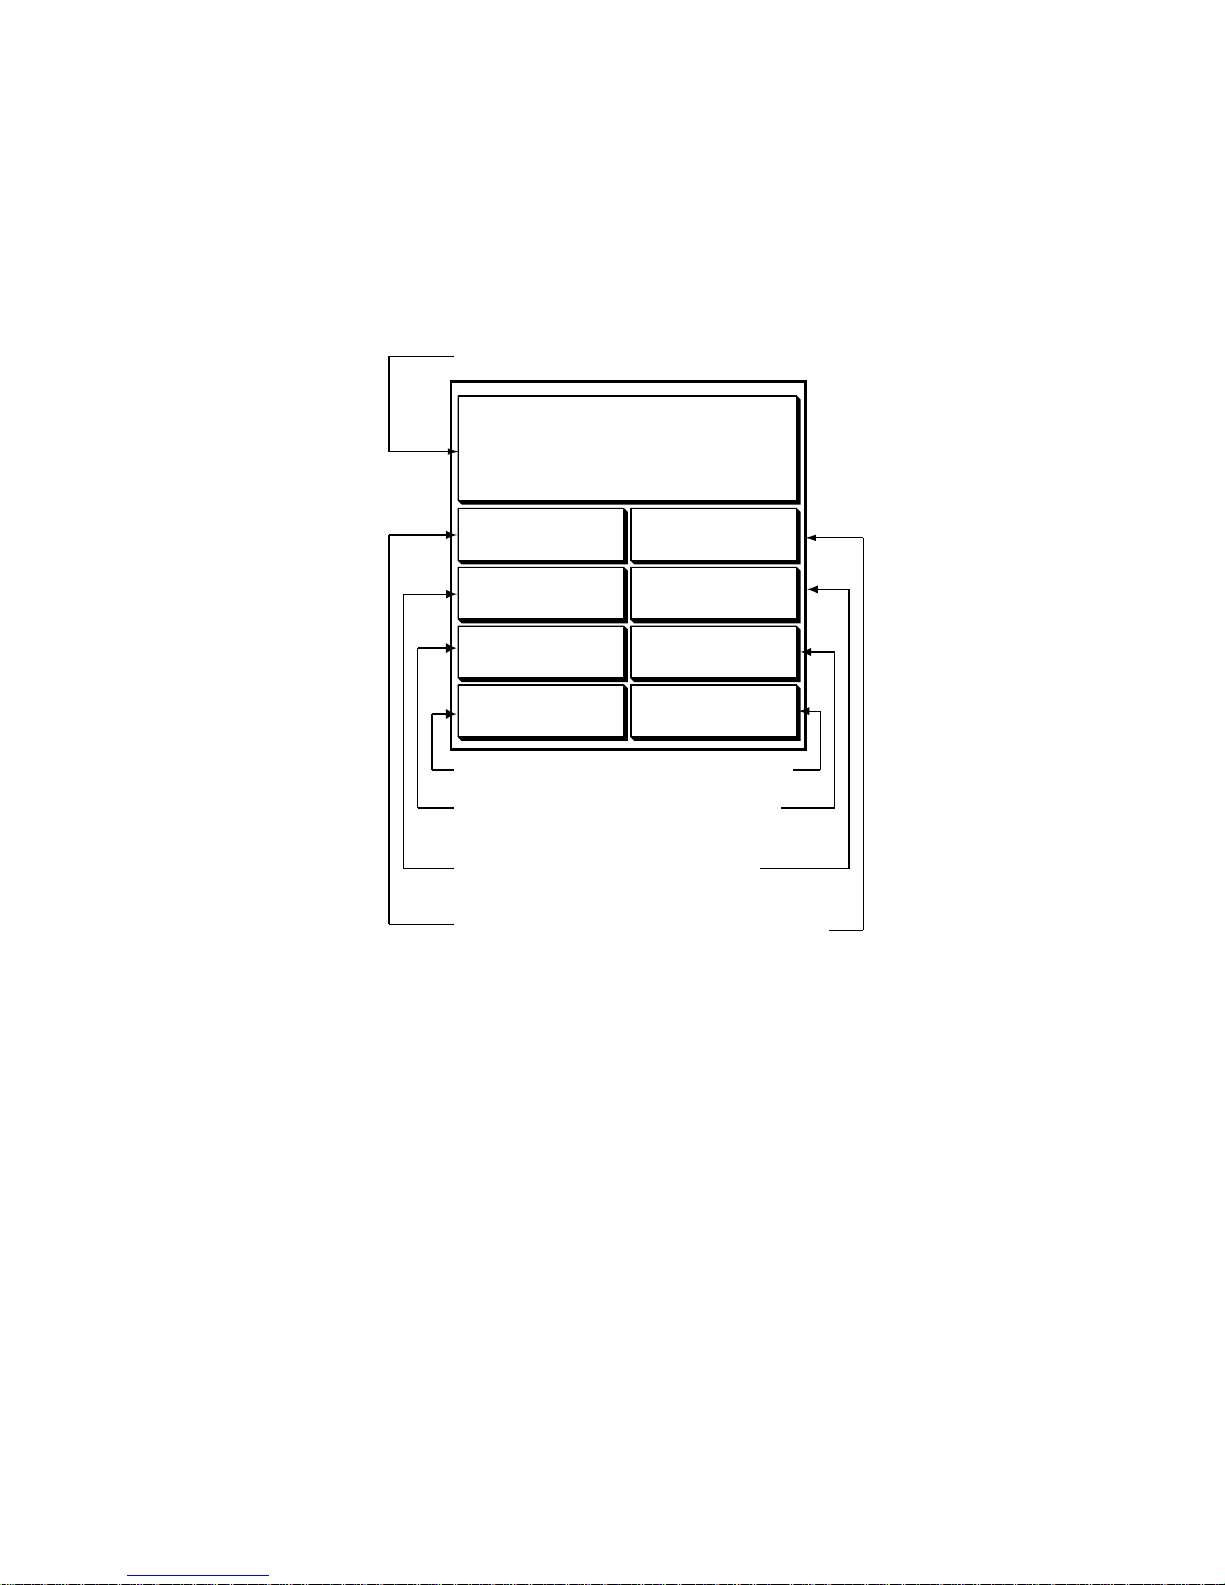
3. PLOTTER OPERATION
3-7
3.1.4 Nav data display
The nav data display provides comprehensive navigation data, and it is shown in a
three-screen combination display. The user may select what data to display and where to
display it. For details see the paragraph “7.8 Nav Data Display Setup.”
Appropriate sensors are required. Bars ( - -) appear when corresponding sensor is not
connected.
POSITION
34° 34. 5678' N
120° 34. 5678'
W
SOGWPT POSITION
COURSESTW
10.0
kt
RANGEBEARING
9.2°
M
TEMPDEPTH
Speed over ground
Position
Water temperature
Range to
waypoint
Course
Speed through
water
Bearing to
Waypoint
Waypoint
Position
Depth
34° 14. 5678' N
120° 14. 5678'
W
10.0
kt
101.6°
M
0.18
nm
1324.1
ft
18.2 °
C
Nav data displays
Page 79
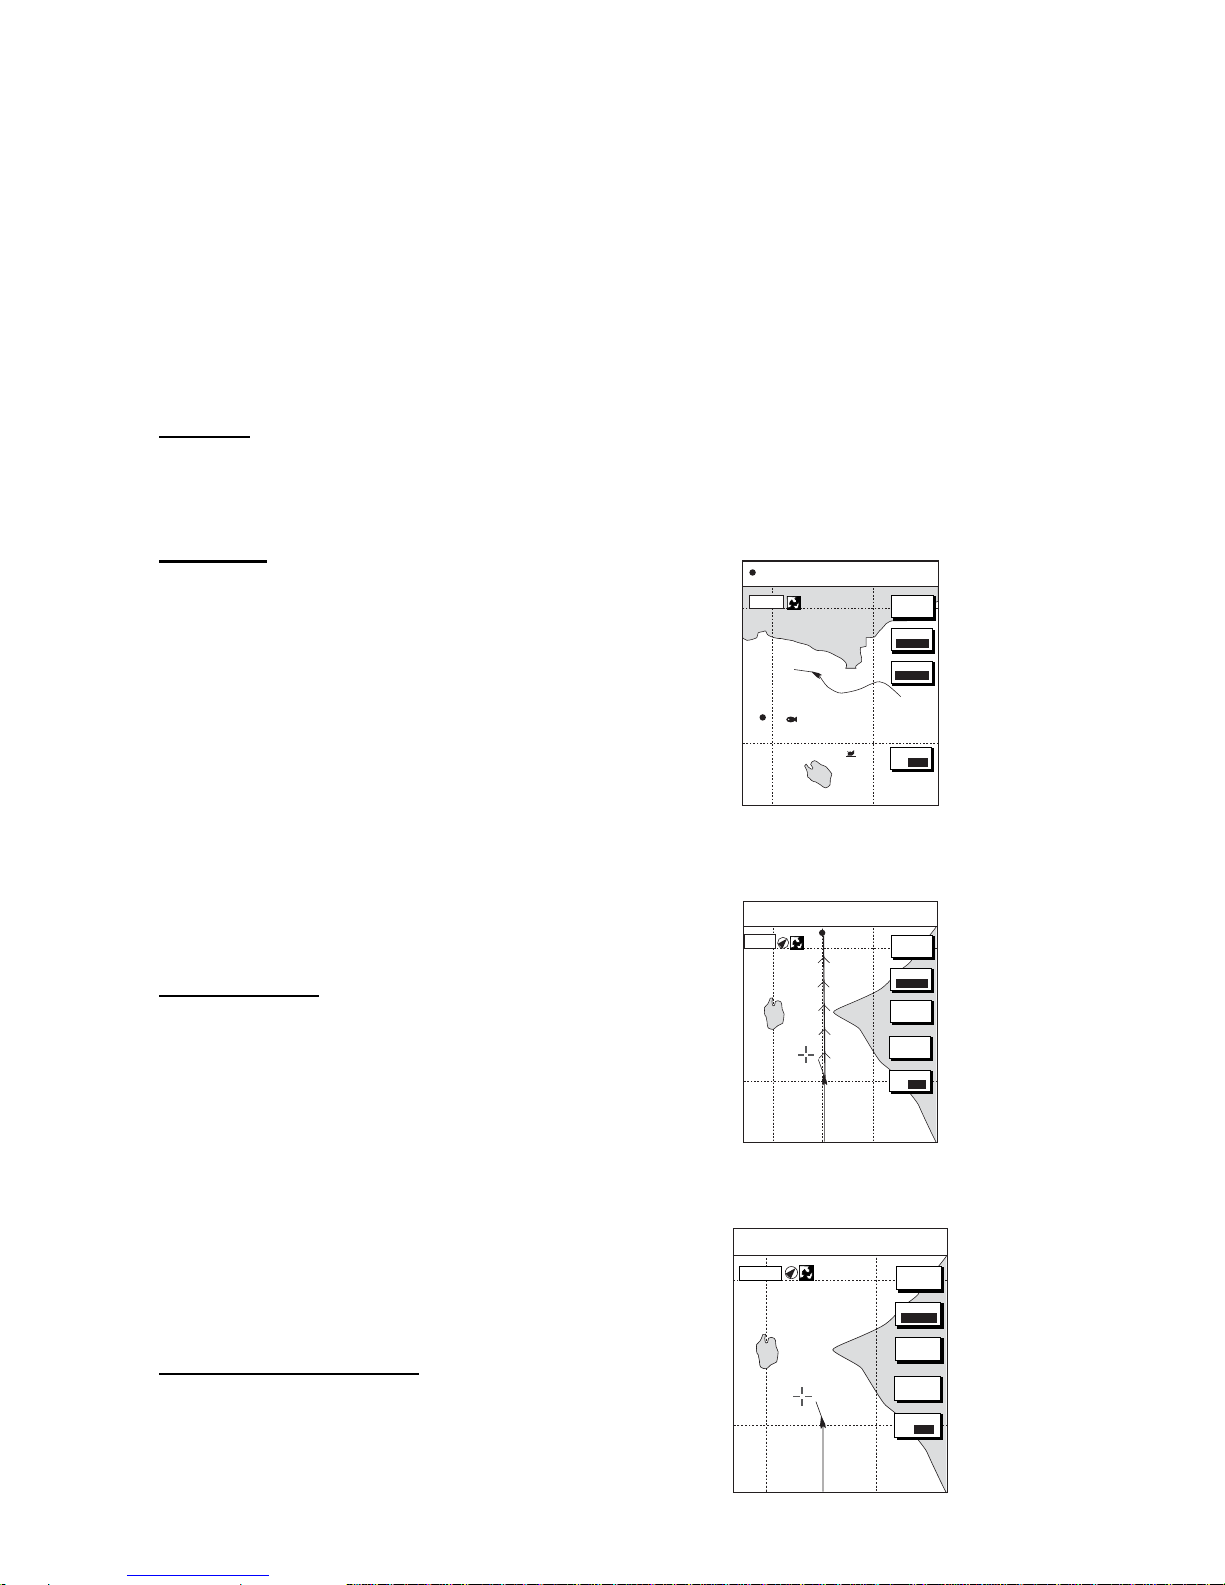
3. PLOTTER OPERATION
3-8
3.2 Presentation Mode
Three types of presentation mod es ar e provided for the plotter display: north-up, cours e- up
and auto course-up. To change the presentati on m ode, pr es s the HIDE/SHOW key followed
by the MODE s oft key. Each press of the key changes the presentation mode and
presentation mode indication (top right-han d c orner of the scree n) c yclically in t he s equence
of North-up, Course-up and Auto c ourse-up.
For C-map model, the sequence i s Nor th-up, Perspective, Course-up an d A uto course-up
when PERSPECTIVE DISPLAY is set to ON, on the CHART DETAILS menu. (See Chapt er
7.)
North-up
North (zero degree) is at the t op of the display and ow n s hip is shown with a fil led circle.
This mode i s us eful for long-range navigation.
Course-up
The course-up m ode is useful f or m onitoring
ship’s progr es s towards a waypoint. The
destination is at the top of the sc r een when a
destination is set. When no destination is set,
the course or heading is at the top of the screen
at the moment t he c our se-up mode is selected.
A filled triangle marks own ship’s position.
Note: The data sentences GGA and V TG must
be output fr om the NavNet display unit
connected to the GPS navigator in order to
correctly orient the own ship marker in the
course-up mode on other NavNet display uni t s .
Auto course- up
The course is at the top of screen at the moment
the auto cours e- up mode is select ed. In this
mode, the current course is kept at the top of the
screen when the change is wit hin 22.5 degrees.
For example, if your vessel turns larger than
22.5 degrees to port or starboar d, the chart
display will rotate so that y our c ours e is pointing
towards the top of the screen agai n. A filled
triangle m ar k s own ship’s position.
Perspective ( C-map only)
Chart data is projected in perspective mode, for 3D
simulation, duri ng nav igation.
BRIDGE
FISH
WP-002
34° 22. 3456'N 359.9°
TRIP
NU
080° 22. 3456'E
19.9 kt 99.9 nm
MODE
NTH UP
NAV
POS
MARK
ENTRY
16.0nm
D.BOX
ON/ OFF
North-up
34° 22. 3456'N 359.9° M
TRIP
CU
080° 22. 3456'E
19.9 kt 99.9 nm
GO TO
CURSOR
MODE
CSE UP
CENTER
MARK
ENTRY
+
WPT 001
16.0nm
D. BOX
ON/ OFF
Course-up
34° 22. 3456'N 359.9° M
TRIP
CU
080° 22. 3456'E
19.9 kt 99.9 nm
GOTO
CURSOR
MODE
AT CU
CENTER
MARK
ENTRY
+
16.0 nm
D. BOX
ON/ OFF
Auto course- up
Page 80

3. PLOTTER OPERATION
3-9
3.3 Shifting the Display
The plot ter display can be shif ted as below.
1. Use the Cursor pad to l oc ate the cursor at a screen edge. The screen shifts in the
directi on oppos ite of cursor loc at ion.
2. To turn off the cursor, pr es s t he CE NTER soft key. This also retur ns the own ship
marker to the sc reen center.
3.4 Chart Scale
Chart scale (range) may be selected with the [RANGE -] or [RANGE +] key. The [-] key
shrinks the c har t r ange (image is expanded); the [+] key expands the cart range (image is
shrunk). The available ranges ar e as below.
Charts scales
nm 0.125 0.25 0.5 1 2 4 8 16 32 64 128 256 512 1024 2048*
km 0.23 0.46 0.93 1.85 3.70 7.41 14.8 29.6 59.3 119 237 474 948 1896 3792
sm 0.144 0.29 0.58 1.15 2.30 4.60 9.21 18.4 36.8 73.7 147 295 589 1178 2356
*: 2046 or 2047 in high latitudes.
3.5 Chart Cards
3.5.1 Chart card overview
Your sy stem r eads NA V IONICS GO LD or
C-MAP NT M AX charts, depending o n the
type of display unit you have.
When you ins er t a suitable chart c ar d in
the slot and own ship is near any
cartographic object, a chart appears. If a
wrong card is inserted or a wr ong c har t
scale is s elected, landmasses will appear
hollow. Chart icons appear at t he top of the
display to help you select a suitable chart
scale. The table below show s the chart
icons and thei r m eanings.
Icon Meaning
Chart scale is too large.
Operate the RANGE key to
adjust chart scale.
Suitable chart scale is
selected.
Proper card is not inserted or
chart scale is too small. Press
the ZOOM IN soft key to adjust
chart scale.
Chart icons and their meani ngs
Page 81

3. PLOTTER OPERATION
3-10
3.5.2 Indices and chart enlargement
When the RANGE key is operated, you will see several frames appear on the chart. These
frames are called indices and they show you what parts of the chart can be enlarged in the
current range.
Sample chart (Japan), showing indices
When a chart cannot be displayed:
A chart will not be displayed in the following conditions:
• When the chart scale is too large or too small.
• When scrolling the chart outside the indices.
• When this happens, select proper chart scale.
Note: Indices can be turned on or off. For further details see “Chart border line” on page
7-15 for NAVIONICS charts and page 7-19 for C-MAP charts.
Page 82

3. PLOTTER OPERATION
3-1 1
3.5.3 Navionics
charts
Data for aids to navigation
Selected Na vi onics charts can sh ow buoy and lighthou s e data. Simply place the cursor on
the light hous e or buoy mark.
Lighthouse Buoy
Place the cursor on
a lighthouse or buoy mark.
Lighthouse mark
Port service icons
Selected Na vi onics GOLD charts s how services avai lable at ports, with icons.
1. Use the Cursor pad to pl ac e the cursor on the sai lboat icon (denotes a port or harbor)
desired.
2. Push the ENTER knob.
3. Roll the Cursor pad horizontally to select icon desired at the top of the display. The
services available appear directly below the icon selected.
4. Pr es s the RETURN soft key to finish.
Emergency
medical service
Water
supply station
Customer
service station
Information center
Fueling station
Traveler's
service station
Marine
equipment service
Port
Sailboat icon (Port)
Detailed information of service
selected
List of services
at the port selected
34° 22. 3456'N 359.9°M
TRIP
NU
080° 22. 3456'E
19.9 kt 99.9 nm
+
CANCEL
FIRST AID
16.0nm
Plotter dis play, showing port s er v ice display
Page 83
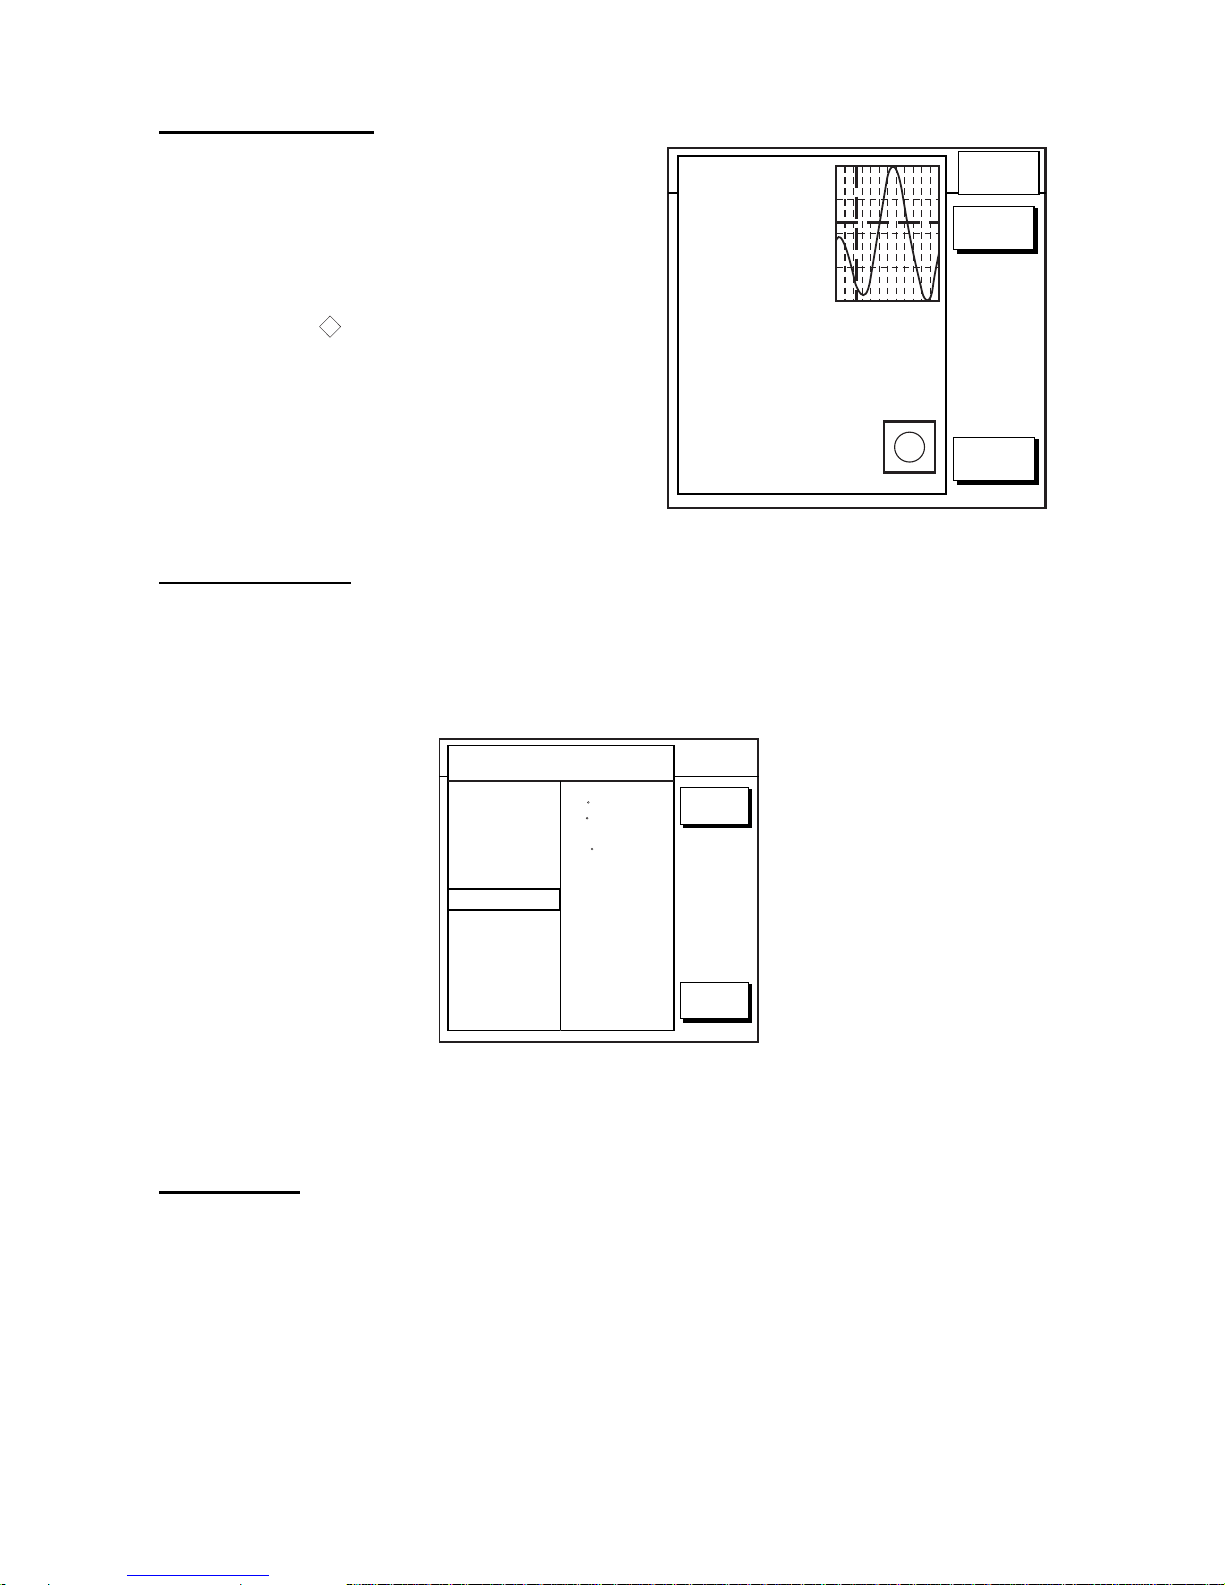
3. PLOTTER OPERATION
3-12
34 24. 3456 N 359.9 NU
124 24. 3456 W 59.9kt 024nm
+
Time: 04:35
Speed (KT): 0.45ft
Angle ( ): 142
21/08/02 +00
Moonphase: FULLY IN 1 DAY
Sunrise: 05:03 Moonrise: 14:06
Sunset: 19:10 Moonset: 02:15
0.86
0.74
0.61
0.48
0.35
0481216 20 24
RETURN
DATE
Current
Max. Time Speed Aug. Slack
KT AT
Flood 4:58 1.2 323 7:58
Ebb 23:15 1.2 323 20:15
Flood 17:15 1.1 145 15:15
Ebb 23:15 1.2 323 20:15
Current data display
Current (or tide) data
Some Navionic s GOLD charts provide for
calculat ion of the current (or tide) data for any
date. Addit ionally it displays the time of sunrise
and sunset, m oon s hape (on current data.)
1. Use the Cursor pad to pl ac e the cursor on a
current icon (
T
).
2. Press the ENTER knob to show t he c ur r ent
window.
3. Pres s the DATE soft k ey , and then enter the
date desired.
4. Press the ENTER soft key.
Object information
You can see detailed information about a place selected by the curs or as below.
1. Use the Cursor pad to pl ac e the cursor on the location you desire to k now more about.
2. Press the ENTER knob to show the OBJECT INFORMATION window.
34 24. 3456 N 359.9 NU
124 24. 3456 W 59.9kt 024nm
+
RETURN
FIND
OBJECT INFORMATION
ROCKS
BLOCK AND TACKLE
BOATYARD
LAND AREA
DERDGED AREA
DEPTH AREA
POSITION
47 16.461'N
122 25.153'W
BRG. & RNG.
191 T 0.549nm
VALUE OF SOUNDING
62.2m
VERTICAL DATUM
MEAN SEA LEVEL
MOVE TRACKBALL <-/->)
Object inf or mation window
When there are two or more pages, r oll the Cursor pad ri ghtward to show the next page.
FIND function
When the OBJECT INFORMATION window is shown, objects can be li s ted according to
their categor ies.
1. Pr es s the FIND soft k ey with the OBJECT INFORMATION wi ndow shown.
Page 84

3. PLOTTER OPERATION
3-13
34 24. 3456 N 359.9 NU
124 24. 3456 W 59.9kt 024nm
+
CANCEL
ENTER
FIND ...
PORT LIST
PORT SERVICE
TIDE STATIONS
CURRENT STATIONS
OBSTRUCTION
ROCKS
FIND wi ndow
2. Operate the Cursor pad to choose the c ategory to li s t, and then press the ENTER soft
key or ENTE R k nob.
Note: You can s how the select ed object on the plott er display by pressi ng the SHOW soft
key.
Page 85

3. PLOTTER OPERATION
3-14
3.5.4 C-MAP charts
Cursor and data display
Besides its fundamental functions of providing position data, the cursor can also show
information about caution area, depth area, source of data, etc. on C-MAP charts. In
addition, you can display information about an icon by placing the cursor on it.
1. Move the Cursor pad to turn the cursor on.
2. Use the Cursor pad to place the cursor on the position desired.
3. Push the ENTER knob to open the Objects window.
Objects
Spot Sounding
Depth area
Exclusive economic zone
Military practice area
Restricted area
Source of data
Objects window
4. Use the Cursor pad to select the item desired.
5. Push the ENTER knob to display details for object selected.
Depth area
Depth range value1
0.00 Meters
Depth range value2
1829.00 Meters
Example of caution area window
6. Press the CANCEL soft key to close the window.
7. Press the CANCEL soft key to finish.
Icon data
You may place the cursor on any icon to find information about the selected icon.
1. For example, place the cursor on a lighthouse icon.
Page 86
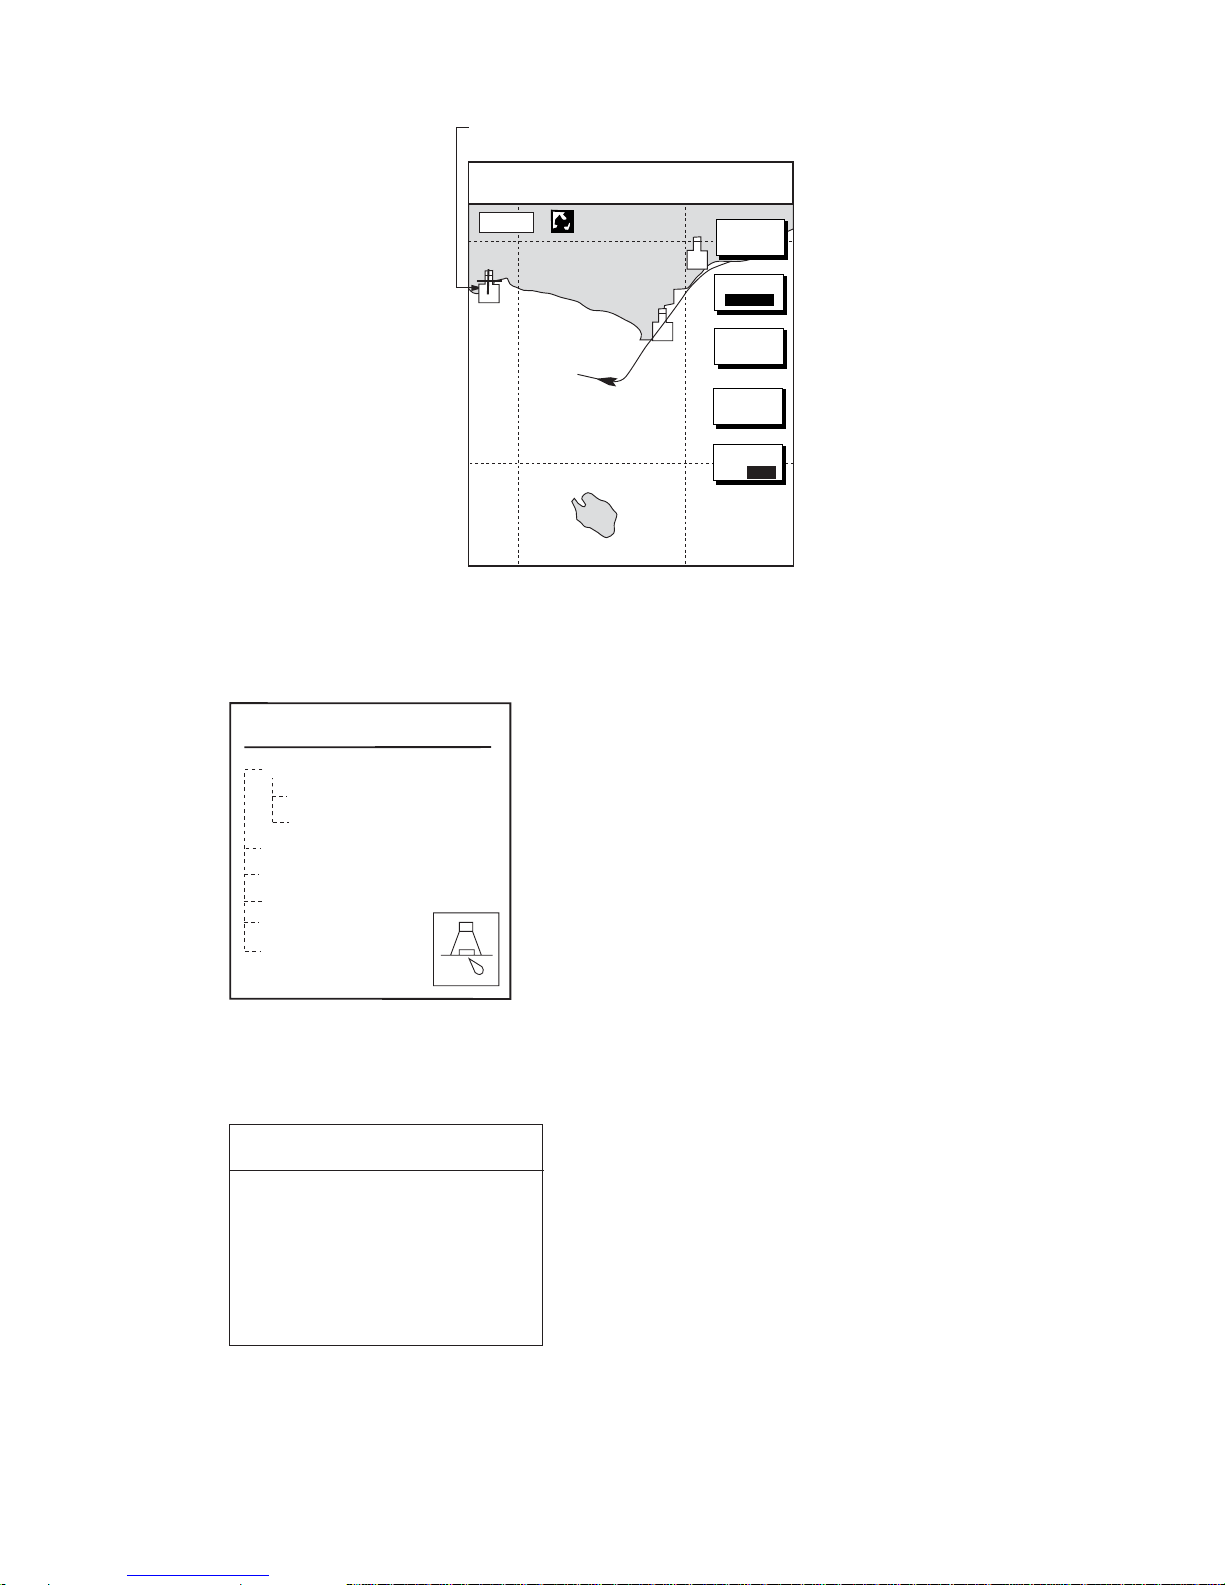
3. PLOTTER OPERATION
3-15
Place the cursor on a lighthouse icon.
34° 22. 3456'N 359.9°M
TRIP
NU
080° 22. 3456'E
19.9 kt 99.9 nm
GO TO
CURSOR
CENTER
+
MARK
ENTRY
16.0nm
D. BOX
ON /OFF
MODE
NTH UP
Lighthouse icon
2. Push the ENTER knob to show data. For example, t he following window appear s for a
lighthouse.
Objects
Lighthouse
To we r
Light
Underwater Rock
Depth contour
Depth contour
Depth area
Source of data
Object windows
3. Use the Cursor pad to select the item desir ed.
4. Push the ENTER knob to display detailed information.
Color
white
Height
7. 00 Meters
Light characteristic
occulting
XXXXXXXX
XXXXXXXX
Navigation mark, fixed
Light.
Sample light house data
5. If necessary, move the Cursor pad downward or upward to sc r oll the window.
6. Press the CANCEL soft key twice to finish.
Page 87

3. PLOTTER OPERATION
3-16
C-map, port s er v ice displa
y
Tide information
The C-M A P NT c har t card provides for calculation of the t ide heights for any date.
Additionally it displays the times of sunrise and s uns et .
1. Use the Cursor pad to pl ac e the cursor on a Tide ic on (
T
).
2. Push the ENTER knob to open the Obj ects window.
OBJECTS
Tide height
Cartographic area
Source of data
Objects window
3. Use the Curso r pad to select Ti de height.
4. Push the ENTER knob to open the TIDE wi ndow.
Objects
Port area
Port/Marine
Fuel station
Water
Electricity
Showers
Pubric toilets
Pubric telephone
34 24. 3456 N 359.9 NU
124 24. 3456 W 59.9kt 024nm
+
Time: 04:35L
Height: 0.45ft
Draught: 0.65ft
28/10/98 -
UTC
05
43° 32.860N
010° 18.022E
Port information
LIVORNO (LEGHORN)
High Water(max)
0.86ft(13:30 L)
Low Water(min)
0.35ft(21:00 L)
Sunrise
07:52L
Sunset
16:53 L
0.86
0.74
0.61
0.48
0.35
0481216 20 24
RETURN
DATE
V
ertical
C
ursor
TIDE
Tide window
5. Pres s the DATE soft k ey to open the DATE wi ndow.
6. Use the Cursor pad to position the cursor where
desired, then enter date with the ENTER knob.
Repeat to enter complete date.
7. Push the ENTER knob to show the ti dal graph for
entered date.
8. Use the Cursor pad to locate the vertical cursor on
the hour desi r ed.
9. Use the Cursor pad to shift the horizontal c ur s or t o
select draught .
10. See the time, height and draught indicat ions in left of t he
tide graph for tide information.
11. Press the CANCEL soft key twice to close the TIDE
window.
CHANGE DATE
(DAY. MONTH. YEAR)
2 8. 03. 2005
LIMIT: 31.12.2099
Page 88

3. PLOTTER OPERATION
3-17
Port service icons
Selected C-MAP shows services available at ports, with lists.
1. Use the Cursor pad to place the cursor on the sailboat
icon (denotes a port or harbor) desired.
2. Push the ENTER knob.
The services available appear.
3. Press the CANCEL soft key.
Note: When “Port/Marine” is selected, you can show a
picture of the port selected, provided such data is available
on the chart card.
FIND function
When the Objects window is shown, objects can be listed according to their categories.
1. Press the FIND soft key with the Object window.
2. Operate the Cursor pad to choose the category to list, and then press the ENTER soft
key or ENTER knob.
A list appears.
3. Press the CANCEL key twice to finish.
Objects
Port area
Port/Marine
Fuel station
Water
Electricity
Showers
Public toilets
Public telephone
Page 89

3. PLOTTER OPERATION
3-18
3.6 Working with Track
Your ship’s track is plotted on the screen using navigation data fed from position-fixing
equipment. This section shows you what you can do with track, from turning it on or off to
changing its plotting interval. In the default setting, own ship’s track is turned on and is
displayed in red.
3.6.1 Displaying track
Own ship track
1. Press the MENU key followed by the CHART SETUP and TRACKS & MARKS
CONTROL soft keys to open the TRACK CONTROL menu.
OWN SHIP TRACK DISP
ON
OWN SHIP TRACK COLOR
RED
TARGET TRACK DISPLAY
OFF
TARGET TRACK COLOR
WHITE
INTERVAL
TIME
TIME INTERVAL
00m10s
DISTANCE INTERVAL
00.10nm
MEMORY(TRACK & MARK)
2000POINTS
(MARK MEMORY)
(6000)POINTS
SHIP’S TRACK STATUS
TRACKING
TRACK: 1234/2000
MARK : 9/6000
TRACK
CONTROL
EDIT
ERASE
T & M
MARK
SETUP
RETURN
TRACK
RESUME
Track control menu
2. Use the Cursor pad to select OWN SHIP TRACK DISP.
3. Press the EDIT soft key to show the track display window.
4. Use the Cursor pad to select ON (default setting) or OFF as appropriate.
5. Press the ENTER soft key.
6. Press the MENU key to close the menu.
Note: The number of track and mark points used appears at the SHIP’S TRACK STATUS
window on the TRACK CONTROL menu. Using the figure above as an example, 1234
points of track and 9 marks have been recorded.
Target track
Target track, NMEA format TTM (Tracked Target Message) data sentence, may be turned
on or off as desired. The default setting is ON.
1. Press the MENU key followed by the CHART SETUP and TRACKS & MARKS
CONTROL soft keys to open the TRACK CONTROL menu.
2. Use the Cursor pad to select TARGET TRACK DISPLAY.
3. Press the EDIT soft key to show the target track display window.
Page 90

3. PLOTTER OPERATION
3-19
4. Use the Cursor pad to select one of the following:
ON or OFF (no ARP or AIS): Turn on or off target tracks
ARP ONLY (ARP equipped): Show only ARP tracks.
AIS ONLY (AIS equipped): Show only AIS tracks.
BOTH: Show both ARP and AIS tracks.
5. Press the ENTER soft key.
6. Press the MENU key to close the menu.
3.6.2 Stopping, restarting plotting of own ship track
When your boat is at anchor or returning to port you probably won’t need to record its track.
You can stop recording the track, to conserve the track memory, as follows:
1. Press the MENU key followed by the CHART SETUP and TRACKS & MARKS
CONTROL soft keys to open the TRACK CONTROL menu.
SHIP’S TRACK STATUS
NOT TRACKING
TRACK: 1234/2000
MARK : 9/6000
▲
SHIP’S TRACK STATUS
TRACKING
TRACK: 1234/2000
MARK : 9/6000
▲
TRACK
CONTROL
EDIT
ERASE
T & M
MARK
SETUP
RETURN
TRACK
RESUME
EDIT
ERASE
T & M
MARK
SETUP
RETURN
TRACK
HALT
TRACK
CONTROL
TRACK
HALT
TRACK
RESUME
Track is plotted
Track not plotted
OWN SHIP TRACK DISP
ON
OWN SHIP TRACK COLOR
RED
TARGET TRACK DISPLAY
OFF
TARGET TRACK COLOR
WHITE
INTERVAL
TIME
TIME INTERVAL
00m10s
DISTANCE INTERVAL
00.10nm
MEMORY(TRACK & MARK)
2000POINTS
(MARK MEMORY)
(6000)POINTS
OWN SHIP TRACK DISP
ON
OWN SHIP TRACK COLOR
RED
TARGET TRACK DISPLAY
OFF
TARGET TRACK COLOR
WHITE
INTERVAL
TIME
TIME INTERVAL
00m10s
DISTANCE INTERVAL
00.10nm
MEMORY(TRACK & MARK)
2000POINTS
(MARK MEMORY)
(6000)POINTS
Track control menu
2. Press the TRACK RESUME soft key. The soft key now shows “TRACK HALT” and the
indication “TRACKING” in the SHIP’S TRACK STATUS window changes to “NOT
TRACKING.” In addition, the icon “H” is displayed at the top of the plotter display and
own ship marker becomes a hollow circle. To restart plotting the track, press the TRACK
HALT soft key
3. Press the MENU key to close the menu.
3.6.3 Changing track color
Track can be displayed in red (default setting), yellow, green, light-blue, purple, blue and
white. It can be useful to change track color on a regular basis to discriminate between
previous day’s track, etc.
Page 91
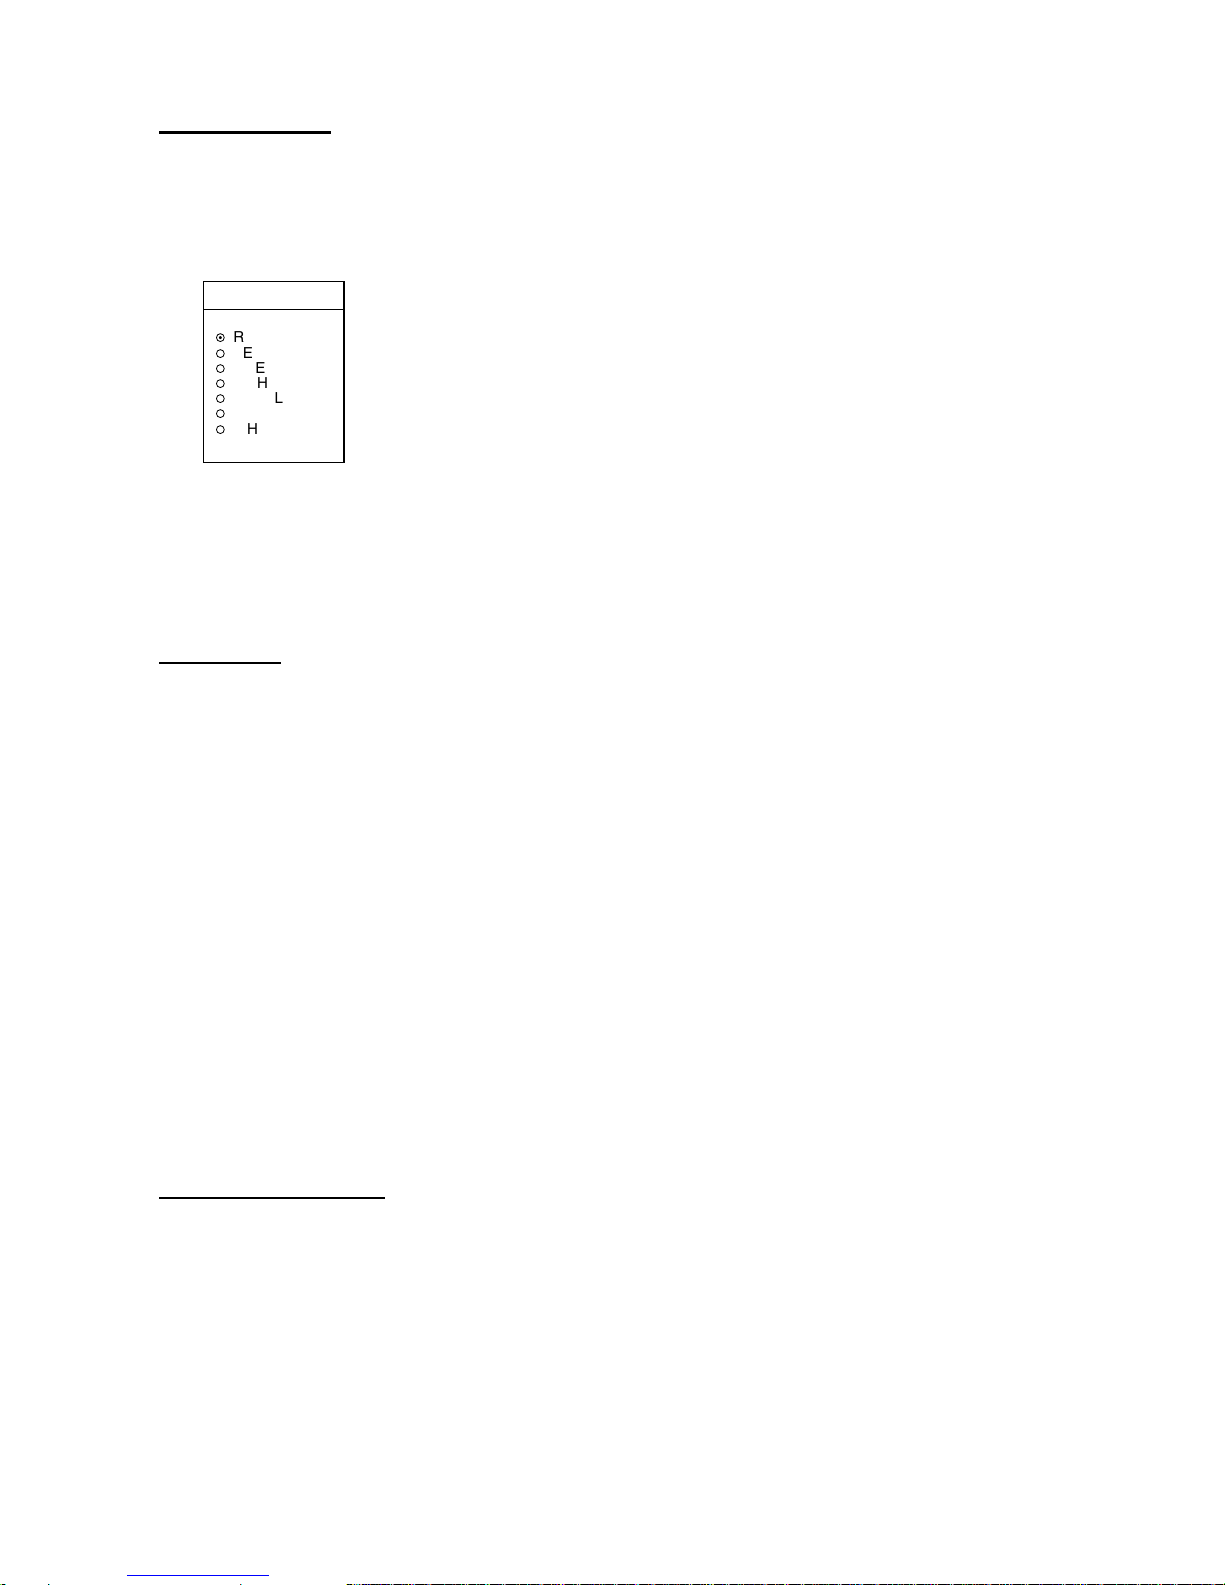
3. PLOTTER OPERATION
3-20
Own ship’s track
1. Press the MENU key followed by the CHART SETUP and TRACKS & MARKS
CONTROL soft keys to open the TRACK CONTROL menu.
2. Use the Cursor pad to select OWN SHIP TRACK COLOR.
3. Press the EDIT soft key to display the track color window.
TRACK COLOR
▲
¤
RED
¡
YELLOW
¡
GREEN
¡
LIGHT BLUE
¡
PURPLE
¡
BLUE
¡
WHITE
▼
Own ship track color window
4. Use the Cursor pad to select the color desired.
5. Press the ENTER soft key.
6. Press the MENU key to close the menu.
Target track
Like own ship’s track, target tracks can be displayed in red, yellow, green, light-blue, purple,
blue and white (default setting).
1. Press the MENU key followed by the CHART SETUP and TRACKS & MARKS
CONTROL soft keys to open the TRACK CONTROL menu.
2. Use the Cursor pad to select TARGET TRACK COLOR.
3. Press the EDIT soft key to display the track color window.
4. Use the Cursor pad to select the color desired.
5. Press the ENTER soft key.
6. Press the MENU key to close the menu.
3.6.4 Track plotting method and interval for own ship track
In drawing the own ship track, first the ship’s position fed from position-fixing equipment is
stored into the unit’s memory at an interval of time or distance. A shorter interval provides
for better reconstruction of the track, but the storage time of the track is reduced. When the
track memory becomes full, the oldest track is erased to make room for the latest.
Track plotting method
Track may be plotted by time or distance. The default setting is “time.”
1. Press the MENU key followed by the CHART SETUP and TRACKS & MARKS
CONTROL soft keys to open the TRACK CONTROL menu.
2. Use the Cursor pad to select INTERVAL.
3. Press the EDIT soft key to display the plot window.
Page 92

3. PLOTTER OPERATION
3-21
INTERVAL
▲
¤
TIME
¡
DISTANCE
▼
Interval window
4. Use the Cursor pad to select TIME or DISTANCE as appropriate. Distance is useful for
conserving track memory, since no track is recorded when the boat is stationary.
5. Press the ENTER soft key.
6. Press the MENU key to close the menu.
Track plotting interval
1. Press the MENU key followed by the CHART SETUP and TRACKS & MARKS
CONTROL soft keys to open the TRACK CONTROL menu.
2. Use the Cursor pad to select TIME INTERVAL or DISTANCE INTERVAL as
appropriate.
3. Press the EDIT soft key to display the time or distance interval window, depending on
what you selected at step 2.
00m10s
(When selecting TIME INTERVAL.)
00.10nm
(When selecting DISTANCE INTERVAL.)
Setting range: 0 min 1 sec (continuous) - 99 min 59 sec
Default setting: 10 sec
Setting range: 0.00 nm (continuous) - 99.99 nm (km, sm)
Default setting: 0.1 nm
TIME INTERVAL
DISTANCE INTERVAL
Interval windows
4. Use the Cursor pad to select digit and enter value with the ENTER knob. The CLEAR
soft key functions to clear an entire line of data.
5. Push the ENTER knob or ENTER soft key.
6. Press the MENU key to close the menu.
3.6.5 Changing own ship track/mark distribution setting
The equipment stores a total of 8000 points of track and marks. This amount may be
distributed as desired, and the default setting is 2000 points of track and 6000 points for
marks.
When you change the track memory setting, all tracks and marks in the memory are erased.
If necessary save the data to a memory card. For further details see the paragraph “6.1.2
Saving data to a memory card.”
1. Press the MENU key followed by the CHART SETUP and TRACKS & MARKS
CONTROL soft keys to open the TRACK CONTROL menu.
2. Use the Cursor pad to select MEMORY (TRACK & MARK).
Page 93
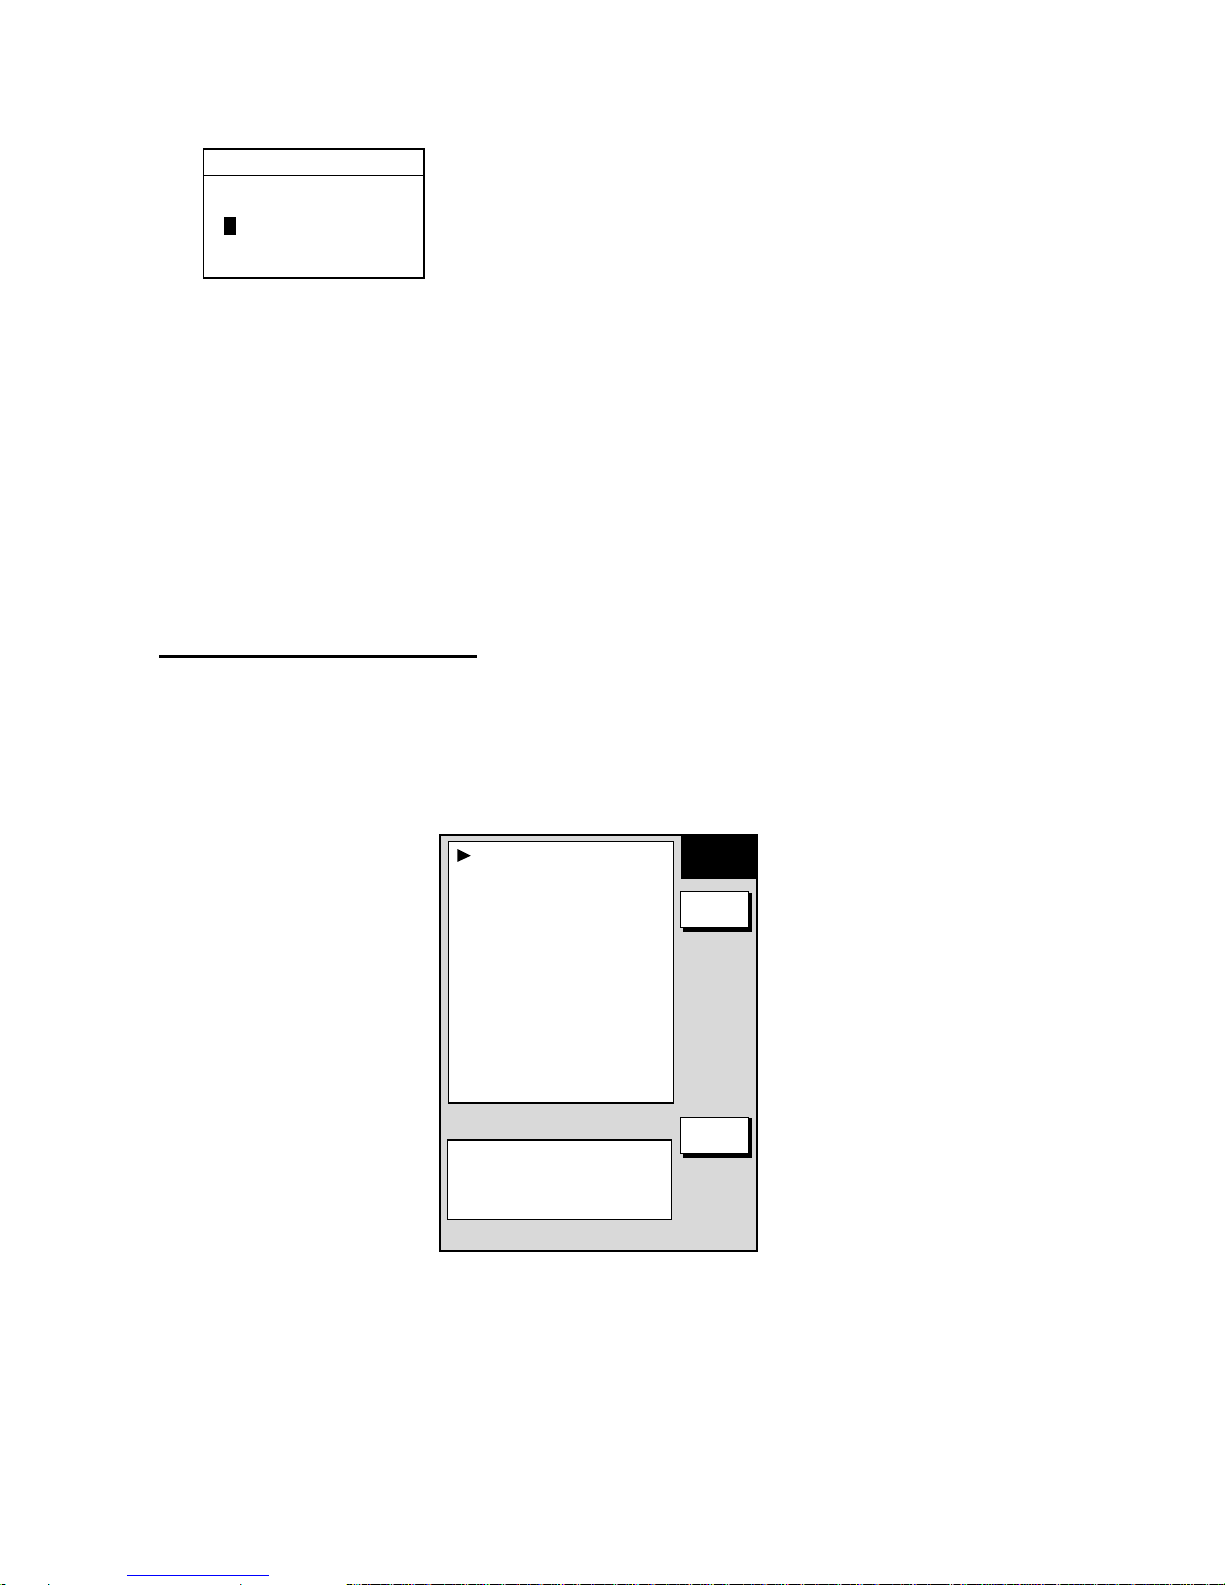
3. PLOTTER OPERATION
3-22
3. Press the EDIT soft key to display the track memory window.
2000/8000 POINTS
TRACK MEMORY
Track memory window
4. Use the Cursor pad to select digit and use the ENTER knob to enter value.
5. Push the ENTER soft key or the ENTER knob. You are asked if you are sure to change
the track memory capacity.
6. Push the ENTER knob.
7. Press the MENU key to close the menu.
3.6.6 Erasing track
This paragraph shows you how to erase own ship’s track and target tracks. You can erase
ship’s track three ways: collectively, by color and by area.
Erasing own ship track by area
You can erase own ship’s track by area as below. This feature is not available when the
overlay mode is in use.
1. Press the MENU key followed by the CHART SETUP, TRACKS & MARKS CONTROL
and ERASE T & M soft keys to show the ERASE menu.
ERASE ALL TRACKS
ERASE TRACKS BY AREA
ERASE TRACKS BY COLOR
ERASE TARGET TRACKS
ERASE ALL MARKS/LINES
ERASE MARKS BY AREA
ERASE
RETURN
EDIT
SHIP’S TRACK STATUS
TRACKING
TRACK: 1234/2000
MARK : 9/6000
Erase menu
2. Use the Cursor pad to select ERASE TRACKS BY AREA, then press the EDIT soft key.
The menu is erased and the plotter display appears.
3. Use the Cursor pad to place the cursor at the top left-hand corner of the area which you
want to ease track from.
4. Press the START soft key or the ENTER knob.
Page 94

3. PLOTTER OPERATION
3-23
5. Move the cursor to the bottom right-hand corner of the area which you want to ease
track from.
6. Press the END soft key or the ENTER knob. You are asked if you are sure to delete the
track.
7. Push the ENTER knob to delete the track selected.
8. Press the MENU key twice to close the menu.
Erasing own ship track b y color
You may erase own ship’s track by color as follows:
1. Press the MENU key followed by the CHART SETUP, TRACKS & MARKS CONTROL
and ERASE T & M soft keys to show the ERASE menu.
2. Use the Cursor pad to select ERASE TRACKS BY COLOR, then press the EDIT soft
key.
ERASE TRK BY COLOR
▲
¤
RED
¡
YELLOW
¡
GREEN
¡
LIGHT BLUE
¡
PURPLE
¡
BLUE
¡
WHITE
▼
Erase track by color window
3. Use the Cursor pad to select the color you want to erase, then push the ENTER knob.
4. Push the ENTER knob to erase the track color selected.
Press the MENU key twice to close the menu.
Erasing all own ship track
1. Press the MENU key followed by the CHART SETUP, TRACKS & MARKS CONTROL
and ERASE T & M soft keys to show the ERASE menu.
2. Use the Cursor pad to select ERASE ALL TRACKS, then press the EDIT soft key.
3. Push the ENTER knob to erase all own ship track.
Press the MENU key twice to close the menu.
Erasing all target tracks
1. Press the MENU key followed by the CHART SETUP, TRACKS & MARKS CONTROL
and ERASE T & M soft keys to show the ERASE menu.
2. Use the Cursor pad to select ERASE TARGET TRACKS, then press the EDIT soft key.
3. Push the ENTER knob to erase all target tracks.
4. Press the MENU key twice to close the menu.
Page 95
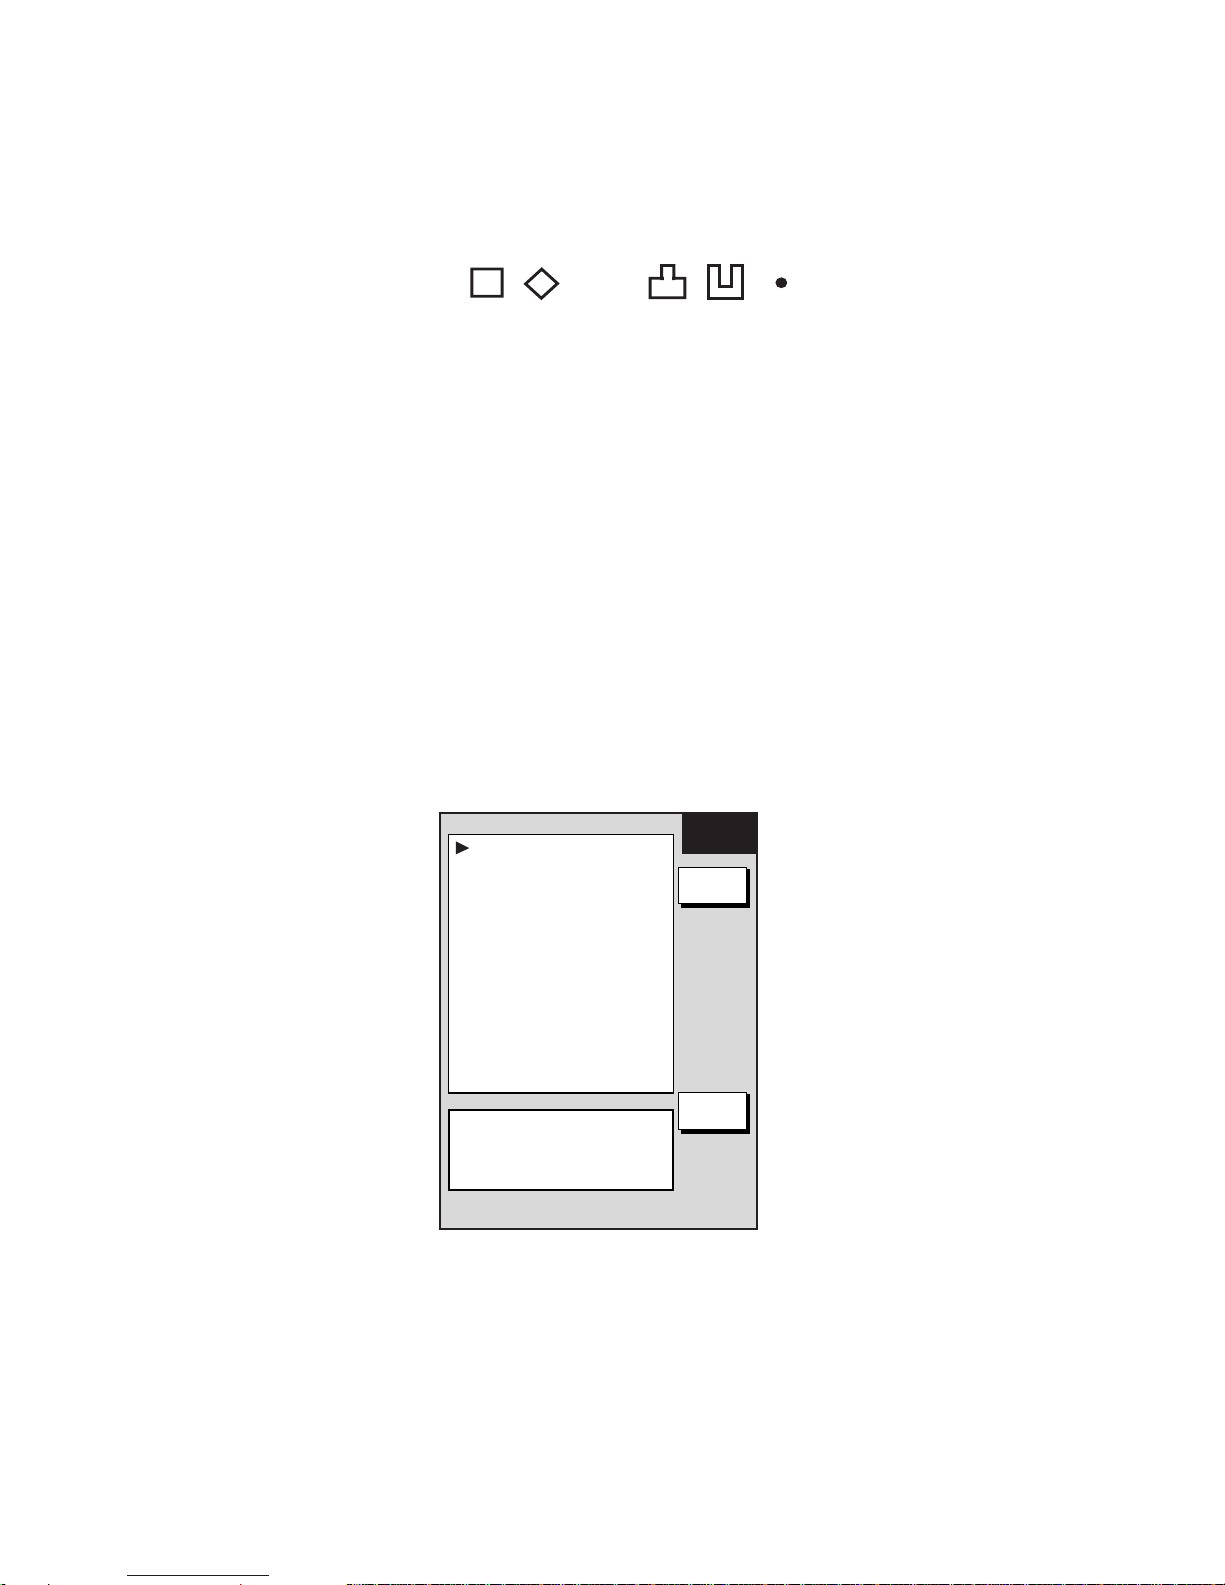
3. PLOTTER OPERATION
3-24
3.7 Marks, Lines
Marks are useful for denoting important points s uc h as a good fishing spot. Marks can be
inscribed in seven shapes and seven colors: Red, yellow, green, light-blue, purple, blue and
white.
{
✕
3.7.1 Entering a mark, line
1. Place the cursor w her e you want a mark to appear .
2. Press the SHOW/HIDE key (if nec es s ar y) followed by the MARK ENTRY soft key.
The mark is inscribed in the si z e, color and shape sel ec t ed on the mark & line menu. The
default mark attributes are size, large; col or, yellow, and shape, hol low circl e (
○
).
Note: This function can be changed to entering the quick point. For detail, see page 7-10.
3.7.2 Changing mark attributes
You can selec t the shape, size and color for marks on t he MARKS & LINES menu.
1. Press the MENU key to show the menu.
2. Press the CHART SETUP, T RACKS & MARKS CONTROL and MARK SETUP soft keys
to show the MARKS & LINES menu.
MARKS/LINES COLOR
YELLOW
MARKS SHAPE
{
LINES STYLE
MARKS SIZE
LARGE
MARKS &
LINES
RETURN
EDIT
SHIP’S TRACK STATUS
TRACKING
TRACK: 1234/2000
MARK : 9/6000
.
Marks & lines menu
3. Select MARKS/ LINES COLOR, then pres s the EDIT soft key .
4. Use the Cursor pad to choose c olor desired (default setting: yellow).
5. Press the ENTER soft key.
6. Sel ect MARKS SHAPE, then press the EDIT soft key.
Page 96

3. PLOTTER OPERATION
3-25
MARKS SHAPE
▲
¡
¡
¡
¡
¡
¡
▼
¤
¡
✕
Marks shape window
7. Use the Cursor pad to select mark shape desired, then press the ENTER soft key.
8. Select MARKS SIZE, then press the EDIT soft key.
9. Use the Cursor pad to select LARGE (default setting) or SMALL as appropriate.
10. Press the ENTER soft key.
11. Press the MENU key twice to close the menu.
3.7.3 Selecting line type
You may inscribe lines to denote good fishing spots, areas of special interest, etc. You can
even construct simple charts.
1. Press the MENU key followed by the CHART SETUP, TRACKS & MARKS CONTROL
and MARK SETUP soft keys to show the MARKS & LINES menu.
MARKS/LINES COLOR
YELLOW
MARKS SHAPE
¡
LINES STYLE
MARKS SIZE
LARGE
MARKS &
LINES
RETURN
EDIT
SHIP’S TRACK STATUS
TRACKING
TRACK: 1234/2000
MARK : 9/6000
.
Marks & lines menu
2. Select LINES STYLE, then press the EDIT soft key.
LINES STYLE
▲
¡
¡
¡
▼
¤
----
Lines style window
Page 97

3. PLOTTER OPERATION
3-26
3. Use the Cursor pad to select line style desired, then press the ENTER soft key. The
line style “dot” disables line drawing. Edge of lines is determined by mark shape. For
example, selecting the circle shape will join lines with a circle.
4. Press the MENU key twice to close the menu.
3.7.4 Erasing marks, lines
Erasing an individual ma r k
1. Operate the Cursor pad to place the cursor on the mark you want to erase.
2. Press the CLEAR key to erase the mark.
Erasing an individual l ine
Place the cursor on an end of the line to erase, then press the CLEAR key. Placing the
cursor at the intersecting point of two line segments will erase both line segments.
Erasing marks, lines by area
This feature is not available when the overlay mode is in use.
1. Press the MENU key followed by the CHART SETUP, TRACKS & MARKS CONTROL
and ERASE T & M soft keys to show the ERASE menu.
2. Use the Cursor pad to select ERASE MARKS BY AREA, then press the EDIT soft key.
The menu is erased and the plotter display appears.
3. Use the Cursor pad to place the cursor at the top left-hand corner of the area which you
want to erase marks and lines from.
4. Press the START soft key or the ENTER knob.
5. Move the cursor to the bottom right-hand corner of the area which you want to erase
marks and lines from.
6. Press the END soft key or the ENTER knob. You are asked if you are sure to delete the
marks/lines selected. Press the ENTER knob to delete.
7. Press the MENU key twice to close the menu.
Erasing all marks, lines
You can erase all marks and lines collectively. Be absolutely sure you want to erase all
marks and lines - erased marks and lines cannot be restored.
1. Press the MENU key followed by the CHART SETUP, TRACKS & MARKS CONTROL
and ERASE T & M soft keys to show the ERASE menu.
2. Use the Cursor pad to select ERASE ALL MARKS/LINES, then press the EDIT soft
key.
3. Push the ENTER knob to erase all marks and lines.
4. Press the MENU key twice to close the menu.
Page 98

3. PLOTTER OPERATION
3-27
3.8 Waypoints
In navigation terminology, a waypoint is a particular location on a voyage whether it be a
starting, intermediate or destination point. A waypoint is the simplest piece of information
your equipment requires to get you to a destination, in the shortest distance possible.
This unit has 999 waypoints into which you can enter position information. You may enter a
waypoint five ways: at own ship position, at MOB position (see page 1-13 for details), by
cursor, by range and bearing, and through the waypoint list (manual input of latitude and
longitude).
3.8.1 Entering waypoints
Entering a waypoint at own ship position
Press the SAVE/MOB key momentarily to store your position as a waypoint. This new
waypoint is saved to the waypoint list, under the youngest empty waypoint number.
Entering a waypoint with the cursor
1. Press the MENU key to open the menu.
2. Press the WAYPOINTS/ROUTES, WAYPOINTS and WAYPOINT BY CURSOR soft
keys. The plotter display appears.
3. Operate the Cursor pad to place the cursor where you want to enter a waypoint.
4. Press the NEW WPT soft key. The waypoint window appears and it shows waypoint
mark shape, waypoint name, comment (default: time and date), position of waypoint and
proximity alarm radius.
NEW
WPT
SELECT
MARK
COORD
TYPE
N < - -> S
E < - -> W
SAVE
RETURN
▲
34°44.000'N
135°21.000'W
359.9°
0.00nm
002WPT
00:00 01JAN00
34°44.000'N
135°21.000'W
359.9°
0.00nm
003WPT
00:00 01JAN00
34°44.000'N
135°21.000'W
359.9°
0.00nm
COMMENT
02:36 01JAN01
POSITION
LAT
34° 12. 134'N
LON
134° 12. 345'W
PROXIMITY ALARM RADIUS
0. 00nm
MARK
0 01WPT
NAME
Waypoint window
5. If you do not need to change the waypoint data, press the SAVE soft key to register
the waypoint. The steps which follow show you how to change waypoint data.
6. Press the SELECT MARK soft key.
7. Press the MARK SHAPE soft key to open the mark shape selection window.
Page 99

3. PLOTTER OPERATION
3-28
SELECT MARK
Waypoint mark shape selection window
8. Operate the Cursor pad to select shape desired.
9. Press the ENTER soft key.
10. Press the SELECT MARK and MARK COLOR soft keys in that order to open the
waypoint mark color selection window. Select the color desired, then press the ENTER
soft key.
SELECT COLOR
▲
¤
RED
¡
YELLOW
¡
GREEN
¡
LIGHT BLUE
¡
PURPLE
¡
BLUE
¡
WHITE
▼
Waypoint mark color selection window
Note: You cannot change the shape and color of a waypoint when the proximity alarm
radius for it is other than “zero.” To change shape or color, enter all zeroes as the
proximity alarm radius.
11. You can change the name (6 characters), comment (13 characters), L/L position and the
proximity alarm radius for a waypoint as follows:
Use the Cursor pad to select the NAME, COMMENT, position box or PROXIMITY ALARM
RADIUS field. (“Proximity alarm radius” provides for audio and visual alarms when your
boat nears a waypoint by the distance specified. The proximity alarm must be turned on
in the ALARM menu to use this feature. For details see the paragraph 3.11.6.)
Use the Cursor pad to select location.
Enter appropriate alphanumeric character with the ENTER knob.
12. Press the SAVE soft key to register the waypoint.
13. Enter another waypoint, or press the MENU key to close the menu.
Page 100

3. PLOTTER OPERATION
3-29
Entering a waypoint by range and bearing
This method is useful when you want to enter a waypoint using range and bearing to a
target found on a radar.
1. Press the MENU key to open the menu.
2. Press the WAYPOINTS/ROUTES, WAYPOINTS and WAYPOINT BY RNG & BRG soft
keys.
3. A red “X” appears at own ship position, and it is the origin point for range and bearing.
Operate the Cursor pad to place the cursor on the location desired. Range and bearing
from own ship to the cursor appear at the top of the display.
Note: The origin point of range and bearing can be shifted to the location desired.
Operate the Cursor pad to select location, then press the START POINT soft key.
4. Press the NEW WPT soft key. The waypoint window appears and it shows mark shape,
waypoint name, comment (default: date and time), position of waypoint and proximity
alarm radius.
NEW
WPT
SELECT
MARK
COORD
TYPE
N < - -> S
E < - -> W
SAVE
RETURN
▲
34°44.000'N
135°21.000'W
359.9°
0.00nm
002WPT
00:00 01JAN00
34°44.000'N
135°21.000'W
359.9°
0.00nm
003WPT
00:00 01JAN00
34°44.000'N
135°21.000'W
359.9°
0.00nm
COMMENT
02:36 01JAN01
POSITION
LAT
34° 12. 134'N
LON
134° 12. 345'W
PROXIMITY ALARM RADIUS
0. 00nm
MARK
0 01WPT
NAME
Waypoint window
5. If necessary, change waypoint data following the instructions from step 6 through 11 in
“Entering a waypoint with the cursor” on page 3-28.
6. Press the SAVE soft key to register the waypoint.
7. Enter another waypoint as above, or press the MENU key to finish.
Entering a waypoint from the waypoint list
You can manually enter waypoint position from the waypoint list as follows:
1. Press the MENU key to open the menu.
2. Press the WAYPOINTS/ROUTES and WAYPOINTS soft keys.
3. Press the LOCAL LIST (lists waypoints in order from nearest to furthest, maximum 32
points) or ALPHANUMERIC LIST (lists waypoints in ALPHANUMERIC order) soft key.
 Loading...