


Windwatch PRO
Pocket Weather Station
Operating Manual
26.01.2008
Flytec AG Switzerland
Ebenaustrasse 18
6048 Horw

2 Overview
Overview.....................................................................................................................................3
Summary of Functions ..............................................................................................................4
Operating Philosophy................................................................................................................4
Change Main function:........................................................................................................................ 4
Change Sub function: ......................................................................................................................... 4
Backlight .............................................................................................................................................. 4
Set-Mode for the Main Display Screen .............................................................................................. 5
Set-Mode for Secondary Functions................................................................................................... 5
Select Measuring Units....................................................................................................................... 5
Start - Stop - Reset .............................................................................................................................. 5
Chart of Functions .....................................................................................................................6
Barometer...................................................................................................................................8
Barometer Pressure Display QNH / QFE...........................................................................................8
Barometer Screens.............................................................................................................................. 9
Barometer display with time of day ......................................................................................9
Barometer display with temperature ....................................................................................9
Barometer display with max and min pressure ....................................................................9
Barometer Set-Mode ......................................................................................................................... 10
Setting the Barometer altitude ...........................................................................................10
Setting the time units for the pressure trend graph ............................................................10
Time and Alarm Clock..............................................................................................................11
Time and Alarm Clock Screens........................................................................................................ 11
Time and date display........................................................................................................11
Time with secondary time ..................................................................................................11
Alarm clock time, date and status ......................................................................................11
Time and Alarm Clock Settings........................................................................................................ 12
Setting time of day .............................................................................................................12
Setting the date..................................................................................................................12
Setting the time for a second time zone.............................................................................12
Setting the alarm time........................................................................................................13
Setting the alarm day(s).....................................................................................................13
Stopwatch and Timer...............................................................................................................14
Stopwatch and Timer Screens ......................................................................................................... 14
Stopwatch ..........................................................................................................................14
Timer .................................................................................................................................14
Race/Sail timer for regatta start
Timer Settings.................................................................................................................................... 15
.........................................................................................15
Setting the timer.................................................................................................................15
Setting the pre-alarm .........................................................................................................15
Wind Speed/Wind Chill............................................................................................................16
Measuring Wind Speed..................................................................................................................... 16
Using the protective slider..................................................................................................16
Wind Speed Screens......................................................................................................................... 16
Wind speed display............................................................................................................16
Wind chill display ...............................................................................................................16
Wind Speed Settings......................................................................................................................... 17
Setting the wind speed averager .......................................................................................17
Normal Average value .......................................................................................................17
Peak Average value...........................................................................................................17
Setting wind chill calculation method .................................................................................17
Altimeter....................................................................................................................................18
General Information about Altimeters............................................................................................. 18
Altimetry For the Ambitious User .................................................................................................... 19
Temperature of the air column...........................................................................................19
Overview 3
unctio
otective slider
Normal atmosphere Table.............................................Fehler! Textmarke nicht definiert.
Altimeter Screens...............................................................................................................................20
Absolute and relative altimeter display .............................................................................. 20
Cumulative ascent and descent display ............................................................................ 20
AutoSet display .................................................................................................................20
Altimeter Settings...............................................................................................................................21
Setting altimeter/ QNH pressure........................................................................................ 21
Setting the air column factor.............................................................................................. 21
Setting the reference altimeter (ALT 2) ............................................................................. 21
AutoSet................................................................................................................................................22
Setting the time and altitude for AutoSet ........................................................................... 22
Temperature and Humidity .....................................................................................................23
Temperature and Humidity Sensors.................................................................................................23
Dew Point .......................................................................................................................... 23
Temperature Measurement............................................................................................... 23
Temperature and Humidity Screens.................................................................................................24
Temperature and humidity display .................................................................................... 24
Temperature graph with minimum/maximum values ......................................................... 24
Humidity graph with minimum-/maximum values .............................................................. 24
Temperature and Humidity Screen Settings....................................................................................25
Setting the time units for the trend graph .......................................................................... 25
General information.................................................................................................................25
Battery.................................................................................................................................................25
Malfunction.........................................................................................................................................26
Care and Maintenance.......................................................................................................................26
Warranty................................................................................................................................... 26
Water Damage ....................................................................................................................................26
Disclaimer.................................................................................................................................26
Specifications ..........................................................................................................................27
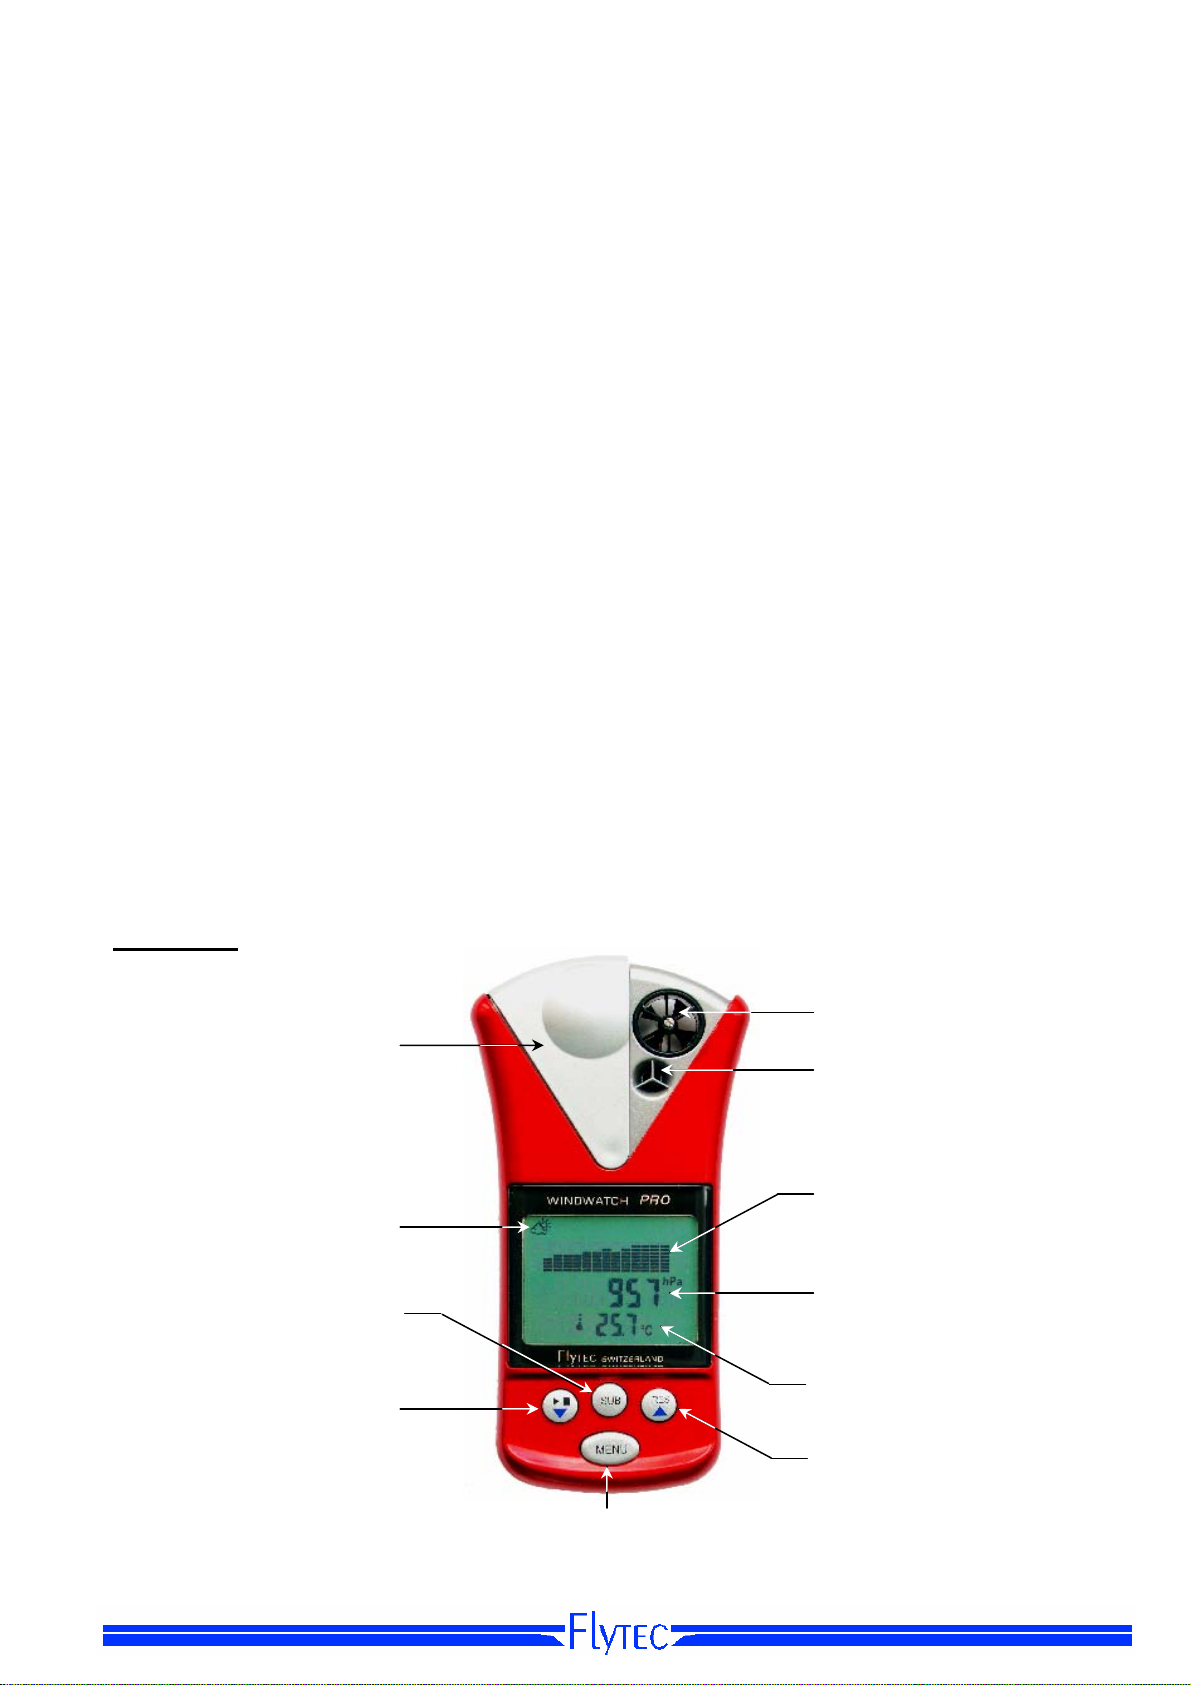
Overview
Pr
Sub Menu
Key
F
n Icon
Adjust
down
Start/Stop
key
Wind
vane
Temperature
&
Humidity
sensors
Upper
Display
Middle
Display
Lower
Display
Adjust up,
Reset
Menu
Key
4 Introduction
Congratulations!
on your purchase of the pocket weather station Windwatch PRO
This operation manual provides detailed information about the operating mode of the
Windwatch PRO instrument. By using your new, multi function instrument which is equipped
with four high precision sensors, you are able to measure wind, air pressure, altitude,
temperature and relative air humidity. Moreover, your pocket weather station provides the
feature of Windchill and dew point calculation, as well as very useful functions for timer, alarm
and alarm clock. The purpose of this operating manual is to make yourself familiar with the easy
handling of the instrument and to stimulate at the same time the comprehension for
meteorological correlation. Some more comments related to meteorology-physical conditions
are specifically addressed to the ambitious user.
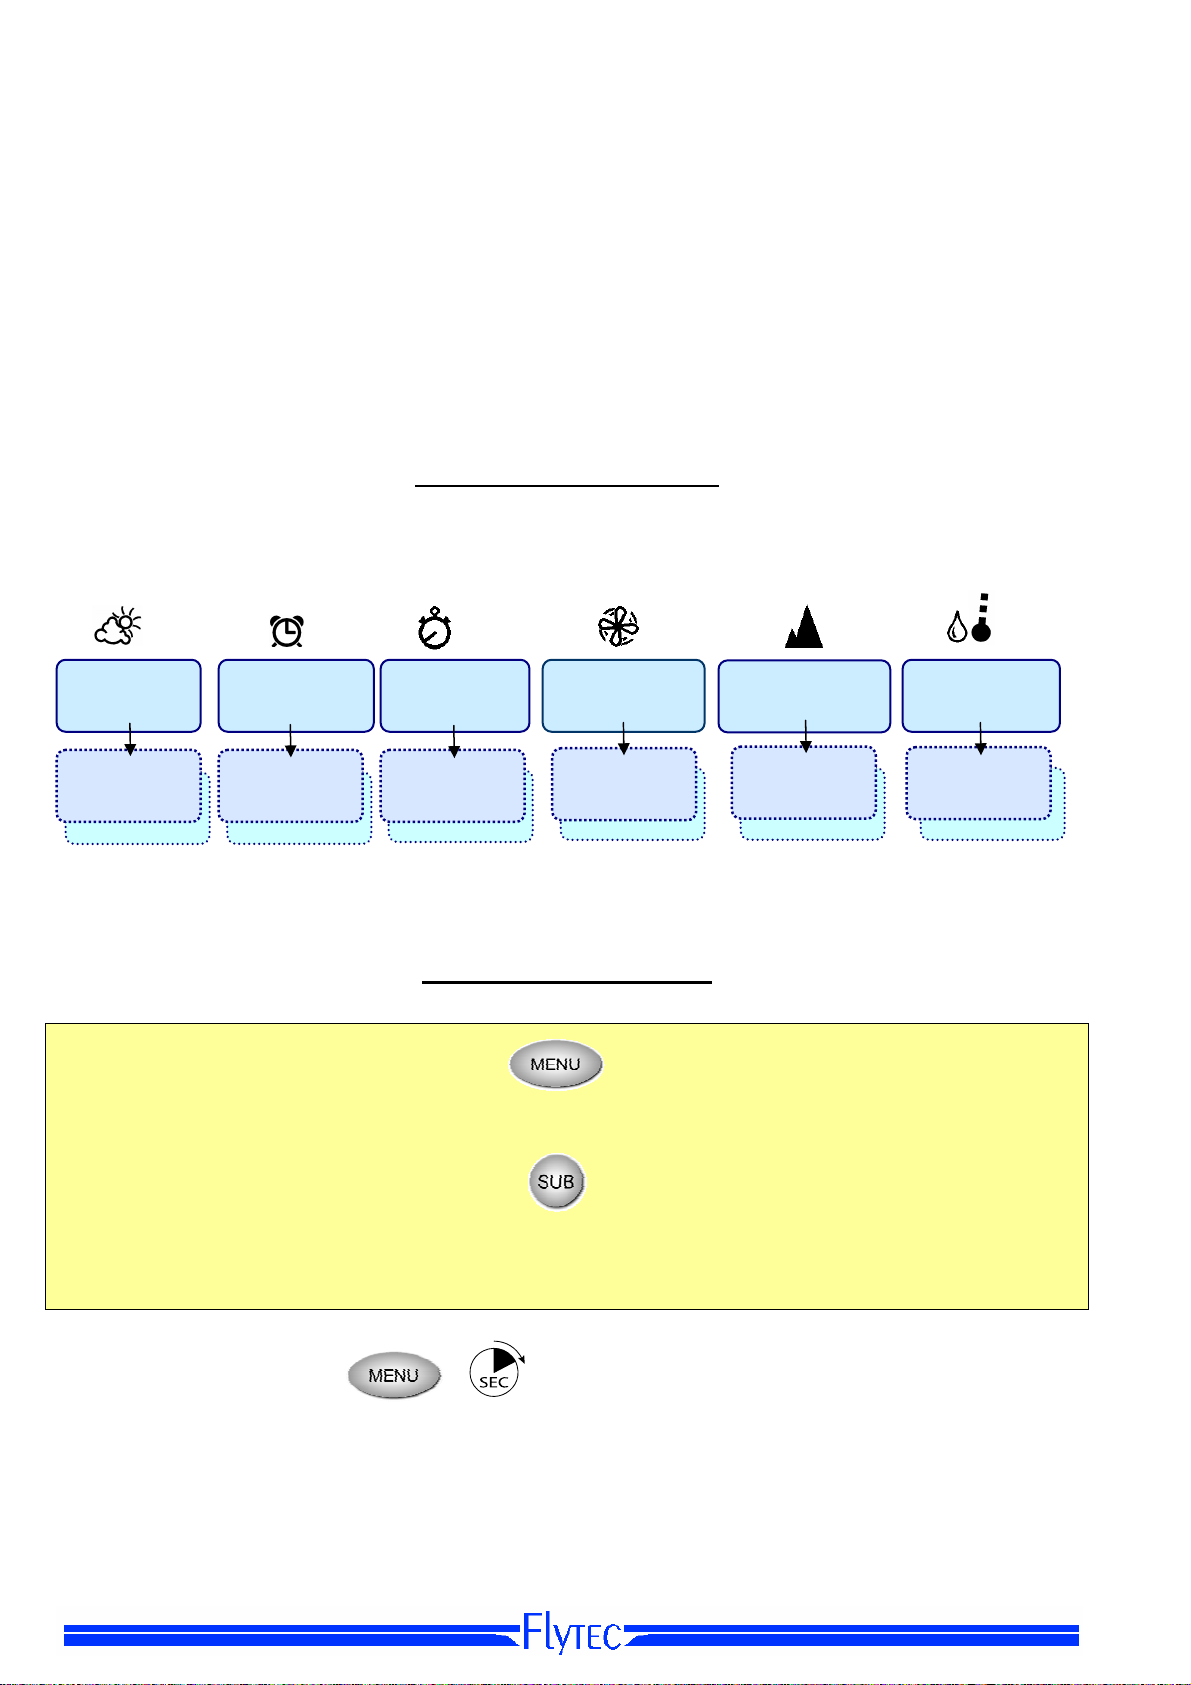
Summary of Functions
The Windwatch PRO provides the following
six main function screens
, shown with
corresponding symbols that are visible in the upper part of the display:
Barometer
Time
Alarm Clock
Stop Watch
Timer
Wind Gauge
Altimeter
Humidity
Temperature
function
Sub
Sub
function
Sub
function
Sub
function
Sub
function
Sub
function
Within any main function screen it is possible to access one or two
sub-screens
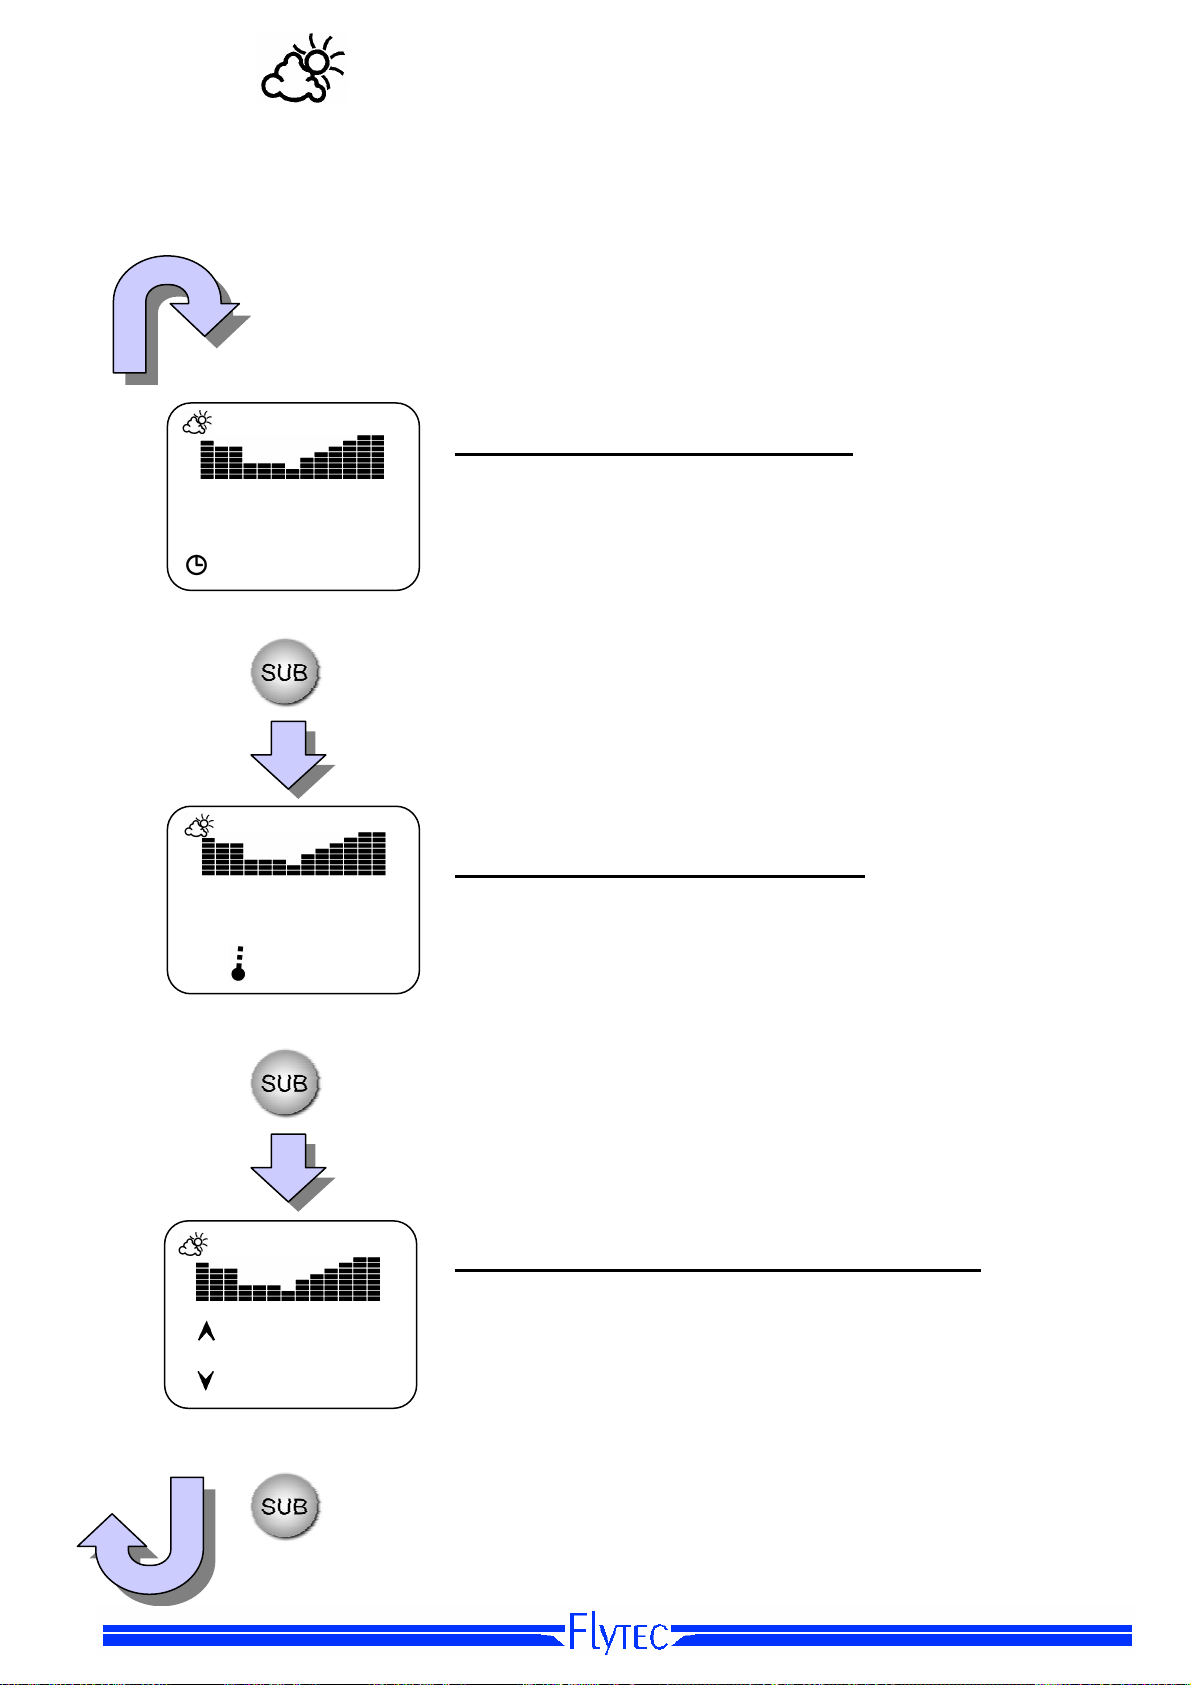
Operating Philosophy
Change Main function:
A
short press
screen (see page 6 chart of functions).
Change Sub function:
A
short press
screen.
Backlight
Long-press the MENU key for 2 seconds to activate the display backlight. The backlight
consumes higher-than-normal battery power; therefore it is recommended that it only be used
when the display could otherwise not be read. When the battery condition is weak, the backlight
function is automatically disabled and a “No Li” message is briefly shown in the display upon the
next menu change. All other functions of the instrument remain operative until the battery is
completely exhausted.
of the
of the
MENU
SUB
key scrolls, in a loop, from one
key scrolls through the possible
2
main screen
sub-screens
to the next main
within each main

Introduction 3
Set-Mode for the Main Display Screen
4
SEC
A long press (4 seconds) of the MENU key brings up the
set-mode
for the current main function
shown on the upper line of the display. With the WWP in set-mode, the value to be set will be
flashing and can be adjusted with the UP and DOWN keys.
Example: When the WWP is in the Altimeter screen, pressing the MENU key for 4 seconds
allows the altitude to be adjusted.
Use a short press of the MENU key to escape set-mode – or, if no key is pressed for 7 seconds,
set-mode is automatically escaped.
Set-Mode for Secondary Functions
4
SEC
A long press (4 seconds) of the SUB key gives access to the set-mode for that secondary
function (the values on middle and lower lines of the display). When in set-mode, the value to be
set will flash and can be adjusted with the
and T keys.
S
Example: When the WWP is in the Altimeter screen, pressing the SUB key for 4 seconds allows
the adjustment of the Relative Altimeter.
A short press of the SUB key will accept the value that is flashing and will cause the next value
that can be adjusted (if any) to flash. If there is no further value to be adjusted, a subsequent
press of the SUB key will escape set-mode – or, if no key is pressed for 7 seconds, set-mode is
automatically escaped.
Select Measuring Units
A short press of the S or T key in any display screen will change the measuring units. If there
are more than two possibilities, subsequent shot presses will scroll through the choices.
Example: In the Altimeter screen, a short press of either arrow key will change the display from
meters (m) to feet (ft).
Start - Stop - Reset
When the WWP is in the Stopwatch screen, the left key is used to start and stop the stopwatch.
A short press of the right key marks the interval time, whereas a long press resets the
stopwatch to zero.
A long press of the RES key resets the primary displayed value of the current function shown on
the display. Example: in the Altimeter screen, the reference altimeter can be reset to zero with a
long press of the RES key.
6 Introduction
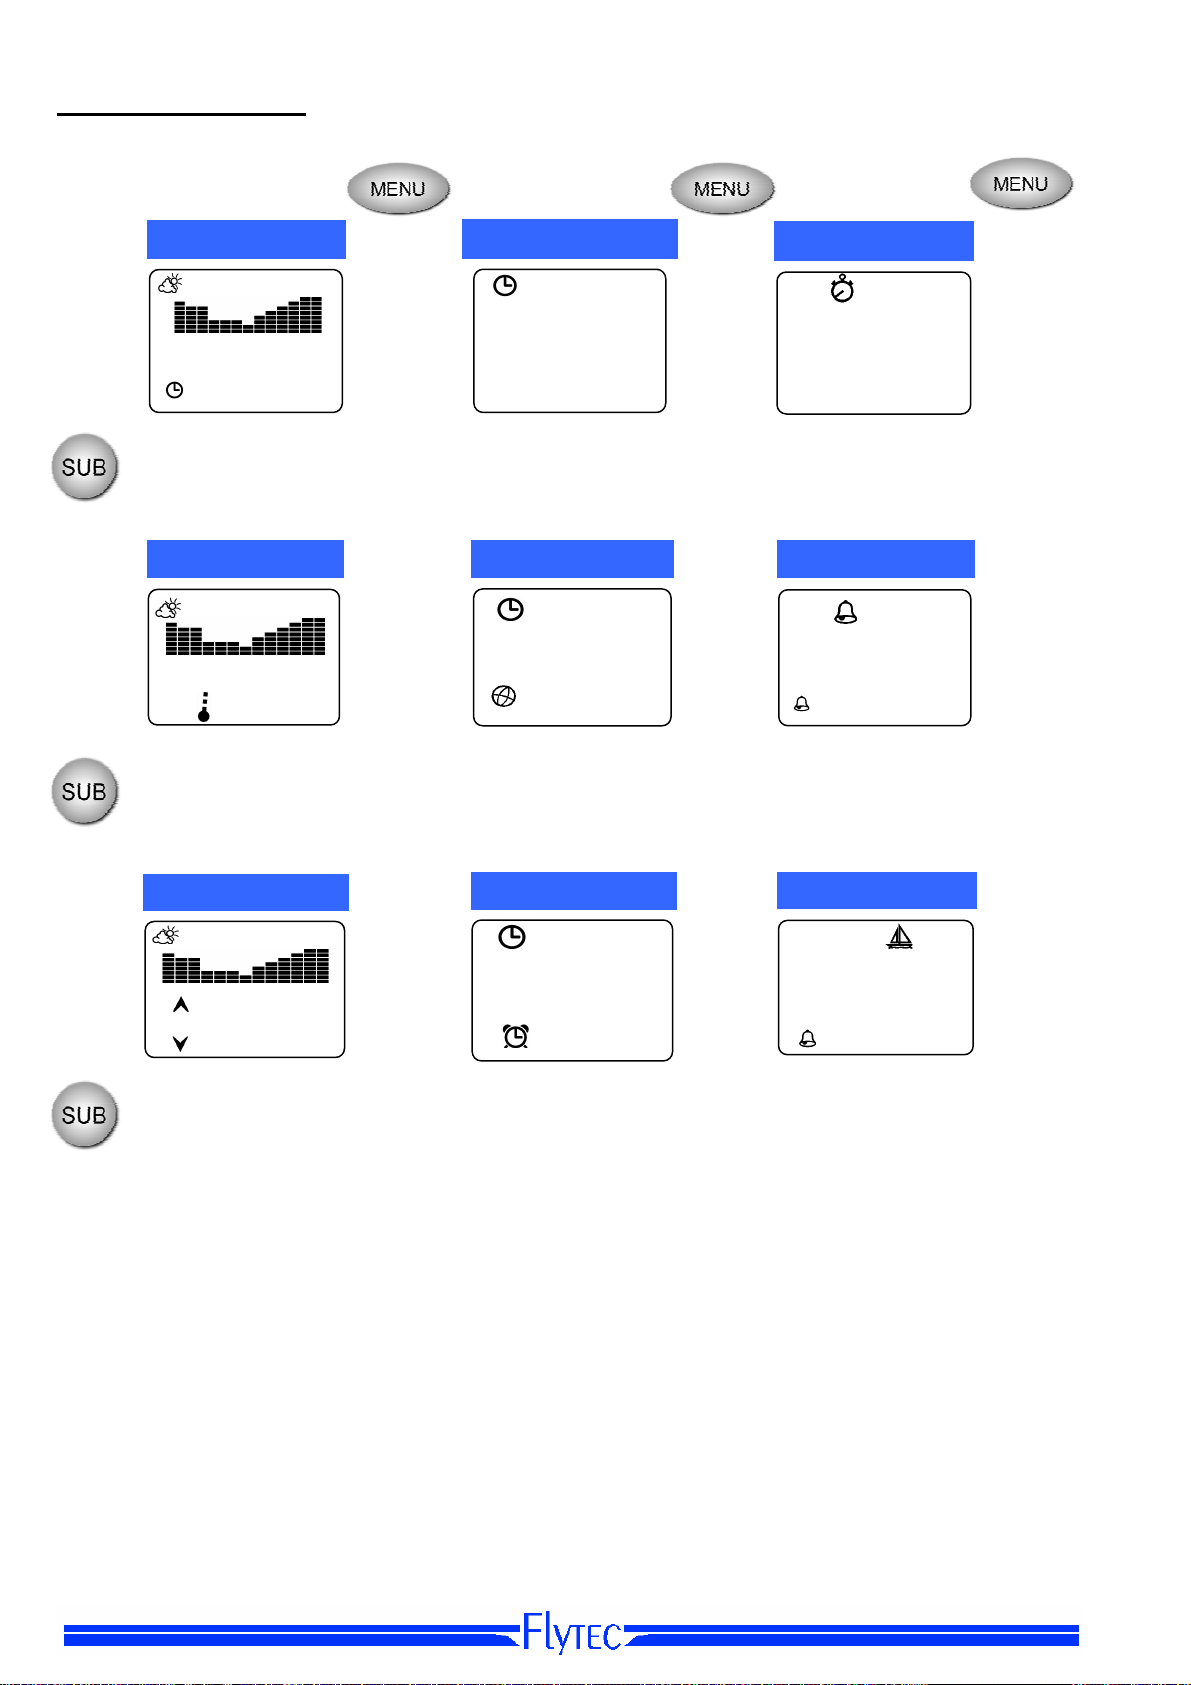
Chart of Functions
1
• Barograph • Time of day • Stopwatch
• Current air pressure • Date • Interval (lap) time
• Time • Year • 2nd Interval time
• Barograph • Time • Countdown timer
• Current air pressure • Remaining time
• Current Temperature • Secondary time • Pre-alarm interval
• Air pressure maximum • Alarm days or date • Remaining time
• Air pressure minimum • Alarm ON / OFF • Pre-alarm interval
Barometer / Time
1013.2
02:38:27
Barometer /Temp
1013.2
22.6°C
Barometer Max/Min
1018.6
• Barograph • Alarm time • Countdown timer
hPa
hPa
hPa
996.4
Time / Date/ Alarm
9:13:25
12 4
2008
Time / 2nd Time
9:13:25
15:13:25
Alarm Clock
6:00
1-7
ON
Stopwatch
14:23.2
9:23.4
4:15.5
Timer
20:00
13:23
2:00
Race Timer
1:00:00
56:18
10:00
Introduction 3
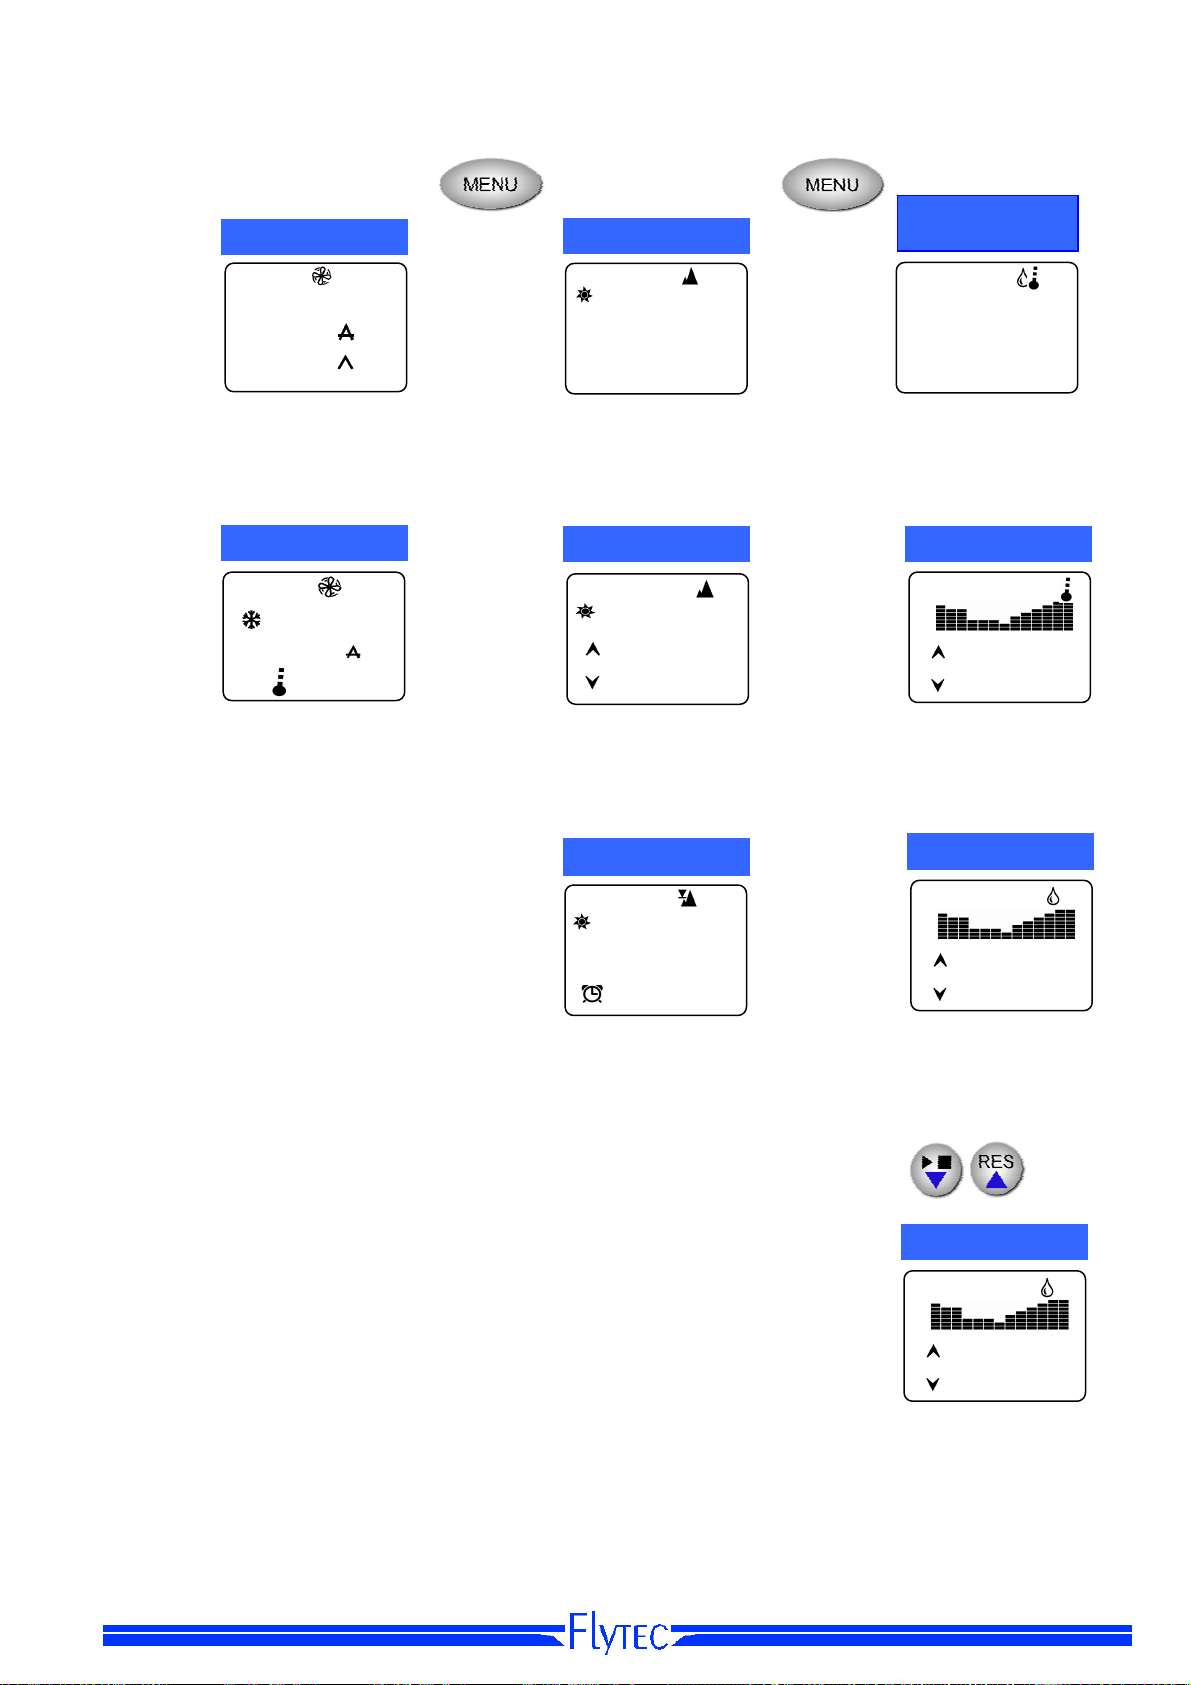
• Average • Relative alt. (AGL) • Relative humidity
• Peak • Rate of ascent/descent • Dew point
• Wind speed • Maximum altitude • Max. temperature
• Wind chill • Minimum altitude • Min. temperature
• Adjustment altitude • Max. dew point
• AutoSet time • Min. dew point
• Max. rel. humidity
• Min. rel. humidity
Wind Speed
2.5
4.8
6.2
• Current wind speed • Absolute alt. (MSL) • Temperature
Wind Chill
15
4.8
• Current temperature • Absolute alt. (MSL) • Temperature graph
m/s
°C
m/s
°C
Altimeter
2649
86
m/h
Alt. Max / Min
2649
2864
AutoSet
2649
1150
• Current alt. (MSL) • Dew point graph
Temperature
Moisture
24.5
DP
Temperature
Dew Point
DP
Rel. Humidity
• Rel. humidity graph
40
26.2
10.8
67
2
°C
%RH
°C
°C
(
%RH

8 Barometer
Barometer
By tracking air pressure trends at a given location it is possible to make predictions
about approaching weather conditions. The barograph on the WWP Barometer main
screen represents the air pressure progression over the past 3, 6, 12 or 24 hours (user
selectable where each bar represents 1/12
left to right so that the value on the left is the oldest and the value on the right is the most
recent. Each segment in a bar corresponds to a pressure change of 2 hPa. The WWP
measures and updates the digital air pressure display every 7.5 minutes.
If the diagram is ascending from left to right, it signifies an increasing barometric
pressure trend, which is generally associated with dry weather conditions, sunshine and
blue skies. Conversely, if the graph is decreasing from left to right it indicates decreasing
barometric pressure, generally associated with a warm or cold front. For alpinists, hikers,
pilots and other outdoor sportsmen this is a warning sign for the possibility of bad
weather and the need to watch for worsening conditions. These front systems very often
produce a change in the weather, combined with low clouds and the possibility of
persistent rains or snow.
th
of the period selected). The graph runs from
Barometer Pressure Display QNH / QFE
Because air pressure decreases with altitude, it is necessary to relate air pressure at a
given elevation to the air pressure at sea level. In meteorology this value is referred to as
QNH. The average pressure at sea level during one year over medium latitude is
1013.25 hPa; this was set as standard pressure by the ICAO for the flying sector in
1928.
To measure air pressure at an altitude other than sea level, you must enter the altitude
of your current position into the barometer. In the WWP this height value is entered in
the set-mode for the Barometer screen. This also means that if the instrument is moved
to a location with a different elevation, the new reference elevation must be entered. If
the altitude of the WWP changes by more than 50 meters within a short period of time,
the barometric graph is automatically cleared and restarted.
If the reference altitude is set to zero, the displayed pressure is the actual air pressure at
that elevation and is referred to as QFE (Absolute Pressure).
0
38
008
Barometer 9
Barometer Screens
Barometer display with time of day
This display shows the barometric pressure trend, current
pressure and time of day. The pressure can be changed to hPa
or inHg with a short press of the S or T keys.
2:
1013
:27
hPa
Barometer display with temperature
1013
hPa
23.1
1015
1
°C
hPa
This display shows the barometric pressure trend, current
pressure and temperature. The pressure units hPa or inHg can
be selected with a short press of the S or T keys. The units for
the temperature (°C or °F) can be set in the Temp/Humidity
screen.
Barometer display with max and min pressure
This display shows the barometric pressure trend, current
pressure and the maximum and minimum pressure value within
the graph period. This period can be set in the Barometer set-
mode. The pressure units hPa or inHg can be selected with a
short press of the S or T keys.

10 Barometer
Barometer Set-Mode
4
SEC
456
1013
m
hPa
4
SEC
1h00
Setting the Barometer altitude
A long press (4 seconds) of the MENU key gives access to the
Barometer set-mode and will cause the barometer reference
altitude to blink. Use the S and T keys to set the altitude for
your current location. This setting is necessary to obtain a
precise QNH indication (see barometer general information
above).
Setting the time units for the pressure trend graph
A long press of the SUB key allows the time period represented
by each bar on the pressure trend graph to be set. Use the S
or T keys to scroll through the values of 15 minutes, 30
minutes, 1 hour or 2 hours per bar. The WWP maintains the
barometric pressure values for the past 24 hours regardless of
the time period set for the graph. This means that you can
reduce the time period at any time to show greater detail, or
increase it to show the longer term trend.
Note:
display will show the graph interval for 2 seconds before the
graph appears, to remind you of the time period per bar of the
graph (1 hour 0 minutes per bar in the example above).
When you select a screen containing a trend graph, the

005
5
On
Time and Alarm Clock 11
Time and Alarm Clock
Time and Alarm Clock Screens
This menu provides the time in 24h or 12h format, with an alarm clock as well as the time in a
secondary time zone. The alarm clock can be set to a predetermined time of day, and to reoccur
daily, week-days only, week-ends only, or on a specific date.
Time and date display
This screen shows the time and date. A short press of
9:13:25
am
11 - 14
2
the S or
(am/pm) format. In 12h format the date is shown as mm-
dd-yyyy. In 24h format the date is shown in as dd-mmyyyy.
key will toggle the time between 24h or 12h
T
9:13:25
2:13:2
7:05
01-01-05
am
pm
am
Time with secondary time
This screen shows the time and a secondary time.
Normally the time shown in the upper line of the display
would be set to the local time, and the secondary time,
shown in the lower line, would be set to show the time in
another time zone. Both times can be displayed in either
24h or 12h format with a short press of the S or T key.
Alarm clock time, date and status
This screen shows the alarm clock time on the top line,
the alarm date on the second line (or recurring days as
programmed in the Alarm set-mode), and the status of
the alarm clock (On or Off) on the third line. The alarm
clock is enabled or disabled with a long press
of the S or T key.

005
12 Time and Alarm Clock
Time and Alarm Clock Settings
Setting time of day
4
SEC
am
am
9:13:25
9:13:25
A long press of the MENU key allows the current time to be set.
First the hour field will flash; adjust with the S and T keys,
then short-press the MENU or SUB key to accept the hour
setting and advance to the minutes field. Set the minutes with
the S and T keys, then short-press the MENU or SUB key to
accept the minutes setting and advance to the seconds field.
Short-press the S or T key to set seconds to zero. Short-press
the MENU key to return to the main screen – or, if no key is
pressed for 7-seconds, the WWP will automatically return to the
run mode.
4
SEC
1 - 1
2
4
SEC
-5:00
Setting the date
A long press (4 seconds) of the SUB key allows the current
date to be entered. The blinking values can be adjusted with
the S and T keys, and a short press of the SUB key accepts
the setting and advances to the next field to be set. In 12h
mode the date format is mm-dd-yyyy and in 24h mode the
format is dd-mm-yyyy.
Setting the time for a second time zone
The WWP must be in the Secondary Time screen (with the
globe symbol in the lower left corner of the display). Press the
SUB key for 4 seconds, then set the hour offset between local
time and the secondary time zone using the S and T keys.
The hour offset is positive for time zones east of your local time
zone and negative for time zones west of you local time zone.
Japan, for instance, is ahead of the Central European time by
eight hours (+8:00).

Time and Alarm Clock 13
4
SEC
07:05
4
SEC
01-01-05
Note:
must be in the Alarm sub-screen).
The alarm clock function is toggled ON/OFF with a long press of the ▼ or ▲ key (WWP
Setting the alarm time
The WWP must be in the Alarm sub-screen (alarm clock
symbol in lower left corner of display). Press the MENU key for
4 seconds; the hour field will blink and can be set with the S
and T keys. Short-press the MENU key to accept the hour
setting and advance to the minutes field, then set the minutes
and press MENU to accept the minutes and return to the run
mode.
Setting the alarm day(s)
The WWP must be in the Alarm sub-screen (alarm clock
symbol in lower left corner of display). Press the SUB key for 4
seconds to access the alarm day set-mode. The current setting
will blink and can be changed with S and T keys. The
following five alarm types are:
1-7
6-7
1-5
-dd123_
To set the WWP to ring on a recurring day of the week, select
“123_” as described above, short-press the SUB key and select
the desired day with the ▼ or ▲ keys (1 =Monday and
7=Sunday).
To set the WWP to ring on a specific day, select “
described above, short-press the SUB key, and enter the date.
The year will blink first and can be set with the▼ and ▲ keys,
short-press the SUB key to accept and advance to the month,
set the month and short-press the SUB key to accept and
advance to the day field. Set the desired day and short-press
the SUB key to return to the run mode.
alarm clock rings every day
alarm clock rings Saturday and Sunday only
alarm clock rings Monday through Friday only
alarm clock rings only on a pre-determined date
alarm clock can be set to any day of the week
-dd-
” as

8:15.5
3:00
14 Stop Watch and Timer
Stopwatch and Timer
Stopwatch and Timer Screens
The WWP features a full-function stopwatch with 1/10th second accuracy, a countdown timer
and a sailing/race timer. Both timers feature a
alarm for the racing timer was designed for regatta starts in sailing. If a pre-alarm is set, the
WWP will beep for 3 seconds at the pre-set interval before the end of the timer period.
Stopwatch
On this screen the top line shows the running time in minutes,
seconds and tenths of a second. The middle line shows the
new interval (lap) time and the bottom line presents the
previous interval time.
15:28.2
13:23.4
pre-alarm
Short-press to
Short-press to record interval (lap) time while the
stopwatch is running
A long press resets the stopwatch back to 0.0.
The lap times are maintained.
A long press resets the stopwatch and interval
times to 0.0.
warning that can be user set. The pre-
start
and
stopwatch
stop
Timer
15:00
13:25
The top line shows the user-set timer period, the second line
shows the remaining countdown time, and the bottom line
shows the period of time that the pre-alarm will sound in
advance of the timer alarm (countdown time=0). The timer is
started and stopped with the X key.
A long press of the RES key sets the countdown time (middle
line) back to the timer setting as shown on the top line of the
screen. When the countdown timer reaches the pre-alarm
value, the WWP will beep for 3 seconds. When the countdown
time reaches 0, a final alarm sounds and will continue until
any key is pressed

00
Stop Watch and Timer 15
1:00:00
56:18
10:
Timer Settings
The settings for the standard timer and the race timer are the same.
4
SEC
0:15:00
4
SEC
3:00
Race/Sail timer for regatta start
The race timer is differentiated from the normal countdown
timer by a sailboat icon in the top of the display. When the race
timer is selected, the WWP will beep once per second during
the last 5 seconds of the countdown period, followed by a
longer beep when the countdown reaches 0. The pre-alarm still
functions for the race timer in the same way as for the standard
timer.
Setting the timer
With either the bell or sailboat icon showing in the top of the
display, press the MENU key for 4 seconds to set the timer
period. The hour field will blink first and can be set with the▼
and ▲ keys; short-press the MENU key to accept and advance
to the minutes field, then set the minutes and short-press the
MENU key to accept and advance to the seconds field. Set the
desired value and short-press the MENU key to return to the
run mode. The maximum timer setting is 99 hours, 59 minutes
and 59 seconds. The timer is started with a short press of the X
key, which is also the stop key.
Setting the pre-alarm
The WWP must be in the Timer screen (bell or sailboat icon in
the top of display). Press the SUB key for 4 seconds, then set
the pre-alarm period in the same way as the timer period
(above). The maximum time for the pre-alarm is 99 hours, 59
minutes and 59 seconds and the minimum time is 10 seconds.
A setting of 0:00 deactivates the pre-alarm.

8
3
16 Wind Speed
Wind Speed/Wind Chill
Measuring Wind Speed
The Windwatch PRO is designed to precisely measure the wind
speed regardless of the prevailing air density. In order to obtain
SUB RES
MENU
optimal results, the instrument should be held vertically into the
wind with an outstretched arm. To insure the greatest accuracy,
measurements should be taken where there are minimal
obstructions upwind of your position that might cause turbulence.
m/s
Wind Speed Screens
Wind speed display
The top line shows the current measured wind speed, the
middle line shows the average wind speed, and the bottom line
shows the peak wind speed value during the measuring period.
The speed can be displayed in the units m/s, km/h, knt, beauf,
ft/s and mph. Scroll through the measuring units with the▼ or
▲ key.
Using the protective slider
The internal impeller in the WWP is precisely balanced and suspended
on two sapphire bearings and is sensitive to dust, dirt and impact. To
protect the impeller and the temperature and humidity sensors, the
WWP is equipped with a convenient protective slider that should be
closed whenever measurements are not being taken. Using the
protective slider will insure many years of reliable service from the
internal sensors.
15.4
18.2
22.
SUB RES
MENU
Wind chill display
Wind chill is the
applied to the
-10.8
15.4
-5.
°C
m/s
°C
wind chill temperature value, the middle line shows the average
wind speed, and the bottom line shows the ambient
temperature without the wind chill factor. The measuring units
for the wind speed can be scrolled with the▼ or ▲ key.
perceived
ambient
temperature when the wind speed is
temperature. The top line shows the

Wind Speed 17
Wind Speed Settings
Setting the wind speed averager
4
SEC
10 SEC
With the WWP in the Wind Speed screen (propeller icon shown
in the top of the display) press the SUB key for 4 seconds to
bring up the wind speed averaging period. Set the period
between 5 and 30 seconds (in 1-second increments) using the
▼ and ▲ keys. Press the SUB key to accept the setting and
advance to select the averaging method for the average wind
speed display. The options are
average
Normal Average value
This method displays a running average of the wind speed over
the selected period. Each second, the oldest wind speed value
is deleted and the average is recalculated with the most recent
wind speed reading.
, and are selected with the ▼ or ▲ key.
normal average
and
peak
Peak Average value
This method displays and maintains the maximum average
wind speed value with no time limit. The peak average value
display is reset by pressing the RES key for 4 seconds.
Setting wind chill calculation method
With the WWP in the Wind Chill screen (propeller icon shown in the top of the display and the
snowflake icon shown in the left of the display) press the SUB key for 4 seconds and select the
wind chill calculation method. In 2000 the formula for calculating wind chill was changed; use
the ▼ or ▲ key and select the OLD or NEW formula. The graph below shows the difference
between the two calculation methods. More detailed information on the two calculation methods
can be found on meteorological websites.
4
SEC
NEW

18 Altimeter
Altimeter
The Windwatch PRO has a state-of-the-art pressure sensor that, in addition to providing precise
barometric pressure readings, provides a fully developed and highly accurate altimeter. The
altimeter is fully temperature compensated so that the displayed altitude does not change when
the temperature of the WWP changes.
General Information about Altimeters
Barometric altimeters calculate altitude based on air pressure. Air pressure decreases as
altitude increases. Due to the fact that air is compressible, the pressure decrease is not linear,
but exponential. The calculation for deriving altitude from air pressure is based on an
international formula (Commision International de Navigation Aérienne) and assumes a
standard atmosphere
that the pressure at sea level is
temperature at the rate of
barometric aviation altimeter only displays the correct altitude if weather conditions are
consistent with the standard atmosphere.
In practice, these conditions are more likely to be an exception! The WWP incorporates a Flytec
innovation that significantly improves the altitude accuracy by correcting for air column
temperatures. If this feature is used, the correction is applied to the CINA altitude formula,
making the altitude readings on the WWP more accurate than standard altimeters. The
correction need not be used, in which case the altitude readings will coincide with aircraft
altimeters.
Atmospheric pressure also changes due to prevailing weather conditions. Depending on the
weather, the air pressure at sea level (QNH) may vary from 950 to 1050 millibars (mb). Even on
a stable day, temperature-induced differences in air pressure of ± 1 mb may occur, equivalent to
with idealized characteristics. The CINA standard atmosphere assumes
1013.25 hPa (Hektopascal) at 15°C
0.65 °C per 100 meters
of ascent is also assumed. Consequently, a
. A continuous decrease in
a height difference of ± 8 meters. During rapid weather changes, such as the passage of a cold
front, the air pressure may change up to 5 mb within one day, corresponding to an altitude
change up to 40 meters. Consequently, an altimeter must be calibrated prior to each use. This
means the altimeter must be set to a known benchmark altitude (e.g., airport, launch site, topo
map, elevation marker, etc.). An alternate method for setting an altimeter is to enter the current
QNH pressure reported by local aeronautical weather reports or reliable meteorological
institutions.
The Windwatch PRO features another Flytec innovation (patented), called
feature is enabled, the instrument automatically factors out changes in the altitude reading that
were caused by changes in the weather. For more information on this feature see the AutoSet
heading later in this section.
AutoSet
. When this

Altimeter 19
Altimetry For the Ambitious User
Temperature of the air column
The standard altimetry formula was developed for aircraft in 1928. It is based upon an average
temperature of 59ºF (15°C) at sea level and an average temperature drop of 0.65°C per 100
meters. In the case where the actual air column is warmer, the air will be packed less densely. If
you are standing on top of a mountain, there will be more air particles above you than normal
and the air pressure will be somewhat higher. Therefore the altitude calculated according to the
standard formula will be too low. In the case where the actual air column is colder, the cold air
will be more dense and concentrated at ground level with fewer air particles above. Therefore
on top of a mountain the air pressure will be slightly lower at your position and the altitude
displayed will be higher than actual. On top of a 14,000 ft peak this situation can result in a 500
ft error!
Example:
meter error (this empirical formula is valid for up to 4000m). At an altitude of 2000m during
summer where the air mass is 16°C warmer compared to the standard atmosphere, a standard
altimeter will display 2 x 4 x 16 = 128m lower than actual.
Note about correcting air column temperature
to increase altimeter accuracy by compensating for air column temperatures that deviate from
standard, total compensation is not always possible due to the layered structure of the
atmosphere. When setting a correction, the WWP proposes a +8ºC setting for warmer than
standard and -8ºC setting for colder than standard. This is based on the typical temperature
deviation for the summer and winter months in geographical mid-latitudes. If you suspect that an
air column correction other than the proposed ± 8ºC should be used, ambient temperature
measurements should be taken outside in the shade and compared to the table below. Note
also that the measured air temperature may be warmer than the overall air mass due to
localized thermal activity, and that should be factored out. If the air column temperature
correction is properly applied, a significant increase in accuracy can be achieved.
A temperature gradient deviation of 1°C per 1000 meters induces approximately a 4-
: While the Windwatch PRO makes it possible
Table normal atmosphere
Alt. Meter Temperature ºC Pressure hPa
0 15.0 1013.2
1000 8.5 898.7
2000 2.0 794.9
3000 -4.5 701.1
4000 -11.0 616.4

8
5
20 Altimeter
Altimeter Screens
Absolute and relative altimeter display
The top line shows the current altitude (elevation). The middle
ALT2
70
21
m/h
m
line shows the altitude difference since the last reset of
This
relative altimeter
of the RES key so that a vertical ascent/descent can be easily
measured. The bottom line shows the rate of ascent/descent
per hour. The units for this screen can be toggled between m
and m/h or ft and ft/h with a short press of the ▼ or ▲ key.
can quickly be zeroed with a long press
ALT2
.
13965
-1782
m
m
Cumulative ascent and descent display
The top line shows the current altitude (elevation). The middle
line shows the accumulated ascent and the bottom line shows
the accumulated descent since the last reset. Reset of the
ascent and descent totals is performed by a long press of the
RES key. Units (ft or m) can be toggled with a short press of the
▼ or ▲ key.
AutoSet display
The top line shows the current altitude (elevation). The middle
line indicates the altitude that will be set by the
function (if enabled). The bottom line shows the time when
AutoSet will set the altitude shown on the middle line (if
enabled). See the detailed instructions in section on AutoSet
below. AutoSet is toggled on/off with a long press of the ▼ or
▲ key.
AutoSet

6
0
Altimeter 21
Altimeter Settings
Setting altimeter/ QNH pressure
With the WWP in the Altimeter screen (mountain icon shown in
4
SEC
1021
-
m
hPa
°C
the top of the display) press the MENU key for 4 seconds and
the altitude and QNH will blink. Set your current altitude or QNH
with ▼ and ▲ keys. Note that these two values are
interdependent and will change together. Alternatively, a long
press of the MENU key will set the reference altitude/QNH to
the standard pressure of 1013.25 hPa, or a long press of the
SUB key will set to the altitude to the AutoSet altitude. W
the WWP is in set-mode (altitude/QNH flashing) a short press
of the MENU key allows the
correction to be set (see below). If no key is pressed, the WWP
will briefly show the air column temperature correction factor
(default is Stnd 0ºC) and will then automatically escape set-
mode.
air column temperature
hen
ALT2
Stnd
4
SEC
20
°C
m
m
Setting the air column factor
The default is no correction, which means the WWP will display
altitudes consistent with normal aviation altimeters. If greater
accuracy is desired, and if consistency with aircraft altimeters is
not a concern, a correction factor can be set as follows. Enter
the Altimeter set-mode as described above. When the altitude
and QNH is blinking, short-press the MENU key. This will cause
the display to go to the air column correction set-mode, and the
current setting will blink (default is Stnd 0ºC). One press of the
key will set the correction to
S
icon); conversely, a short press of the T key will set the
correction to Cold -8°C (shown with a snowflake icon). The
8ºC shift is the typical deviation for the summer and winter
months in geographical mid-latitudes. However, further presses
of the S and T keys allow the correction to be set precisely in
1°C increments. If a correction has been entered, the sun icon
or snowflake icon will be shown on the Altimeter screens in the
run mode.
Setting the reference altimeter (ALT 2)
With the WWP in the Altimeter/Relative Altitude screen
(mountain icon and ALT2 shown) press the SUB key for 4
seconds and the ALT2 value will blink. Use the S and T keys
to set the desired value. A long press of the SUB key sets
ALT2 to 0; a long press of the MENU key sets the value of
ALT2 to the current absolute altitude.
Hot +8°C
(shown with a sun
±

3:00
22 Altimeter
AutoSet
This Flytec exclusive function allows the WWP to automatically rectify, every day at a predetermined time, altitude discrepancies that are due to changes in weather conditions. For
example, the AutoSet feature can be programmed so that the altimeter will be set every morning
at 05:00h to a predetermined altitude such as your home, base camp, airport, ski lodge, hang
glider/paraglider launch, etc. The WWP only performs the AutoSet function if the change in air
pressure is realistic for a change in weather conditions, meaning that the discrepancy does not
exceed plus or minus 100m. In a case where the change in pressure results in a change in
altitude reading greater than 100m, the instrument assumes you have changed elevation.
Setting the time and altitude for AutoSet
With the WWP in the AutoSet screen (mountain icon and clock
icon shown in the display) press the SUB key for 4 seconds
4
SEC
m
553
and the AutoSet time will blink. Use the S and T keys to set
the desired hour; press the SUB key and set the desired
minutes; press the SUB key once more and set the desired
altitude. A long press of the MENU or SUB key sets the
AutoSet altitude to the international standard pressure of
1013.25 hPa. After you have set the AutoSet time and altitude
and returned the WWP to the run mode (by pressing the SUB
key or by automatic escape), the AutoSet function is enabled
and is confirmed by the addition of a down arrow on the
mountain icon (shown left) at the top of the Altimeter screen.
AutoSet can be toggled on/off with a long press of the S or T
key in the AutoSet screen.

Temperature and Humidity 23
Temperature and Humidity
Temperature and Humidity Sensors
The Windwatch PRO is equipped with rapid-reacting, high-sensitivity and digitally-synchronized
humidity and temperature sensors that are located in the small opening below the wind speed
impeller opening. Therefore the protective slider must be open to perform accurate temperature
and humidity measurements. Since the accuracy of the relative humidity reading depends on
the temperature of the sensor, and the temperature of the sensor is influenced by the
temperature of the instrument’s housing, the difference between housing temperature and
ambient temperature must be compensated electronically. To perform this compensation, the
current temperature of the sensor is taken into account. You will achieve the most accurate and
conclusive readings by allowing air to flow freely though the sensor openings. This is
accomplished by holding the Windwatch PRO in the same way as when taking wind
measurements (i.e., WWP held vertically, upwind, and with an outstretched arm).
See the section below on Temperature Measurement.
Dew Point
The
dew point
is the temperature at which 100 percent relative humidity is reached
and fog or clouds begin to form. The difference between the current temperature and the dew
point is an important indicator in determining the likelihood of fog developing. Based upon the
altitude-related cooling formula (0.65 °C per 100 m height), it is also possible to predict the
altitude at which fog or clouds will form. A rule of thumb with respect to fog is that is that if,
during evening hours, the air temperature and dew point value move towards each other, there
is a high likelihood of fog during the night.
Temperature Measurement
The measurement of air temperature is one of the most difficult challenges in meteorology. The
official measurement setup for meteorological temperature measurement is as follows: the
sensor is mounted inside a test tube 2 meters above a freshly mown grass field. For ten minutes
before the measurement is to be taken, air is aspirated by a ventilator through the test tube and
directed at the sensor; only then is the temperature value read.
The Windwatch PRO was designed to approximate this procedure as closely as possible using
a handheld instrument. The small opening with three protective ribs is used to channel the air
and to direct its flow at the sensor. The sensor is thermally decoupled from the housing as much
as is possible inside a narrow housing.
To obtain precise and rapid temperature measurements, hold the WWP with the slider open,
facing the prevailing breeze. If there is no wind, wave the WWP back and forth several times, or
swing it in circles by its lanyard. This step helps to equalize the temperature of the WWP
housing with the ambient air. The housing temperature will be in equilibrium with the ambient air
when moving the WWP through the air no longer changes the temperature reading. The
temperature reading at that point will be the actual air temperature.

3
24 Temperature and Humidity
Temperature and Humidity Screens
Temperature and humidity display
The top line shows the current temperature, the middle line
shows the current relative humidity, and the bottom line shows
24.1
°C
the current dew point (based on the temperature and humidity
readings).
53
DP
18.4
°C
Note:
the SUB key is pressed to access these sub-screens, the
display will show (for 2 seconds) the time period corresponding
to one bar of the graph, reminding you of the time period
represented by one bar.
the following sub-screens contain trend graphs. When
24.8
19.
53
47
°C
%RH
Temperature graph with minimum/maximum values
This screen shows the temperature trend over time. The middle
line shows the maximum temperature captured
by the graph and the bottom line shows the minimum value of
the graph. Select temperature units (ºC or ºF) with a short press
of the S or T key. The time span for the graph can be set in
the Temperature/Humidity set-mode.
Humidity graph with minimum-/maximum values
This screen shows the relative humidity trend. The middle line
shows the maximum value of the graph and the bottom line
shows the minimum value. The graph and max/min values can
be toggled between relative humidity
(DP) with a short press of the
the graph can be set in the Temperature/Humidity set-mode.
S
(%RH) and dew point
or T key. The time span for

Temperature and Humidity 25
Temperature and Humidity Screen Settings
4
Setting the time units for the trend graph
SEC
1h00
With the WWP in the Temperature/Humidity screen (droplet or
thermometer icon shown in top of the display) press the SUB key
for 4 seconds. The time period represented by each bar on the
trend graph will blink and can be set to 15 minutes, 30 minutes, 1
hour or 2 hrs using the S and T keys. The WWP maintains
temperature and humidity values for the past 24 hours regardless
of the time period set for the graph. This means that, at any time,
the time period can be reduced to show greater detail or
increased to show the long term trend.
General information
Battery
The Windwatch PRO is supplied with a CR2032 3-Volt lithium battery installed. Because the
Windwatch PRO uses state-of-the-art technology, the battery should last through approximately
18 months of normal use. When the battery becomes weak, a low battery message “Lo Po” will
flash on the display and the battery should be replaced. After you replace the battery, the WWP
will be initialized with the factory configuration, consequently, you will need to reset the
barometer, time and altimeter. If the instrument is locked up after battery replacement, please
follow the instructions in the Malfunction section below.
The WWP is equipped with a backlight that turns on momentarily with a 2-second press of the
MENU key. However, the backlight has relatively high battery power consumption. When the
battery is at such a low level that reasonable operation of the backlight is no longer possible, the
backlight feature is disabled. However, the instrument is otherwise still operative because the
other functions are significantly less power consuming. If you press the MENU key for 2
seconds when the backlight feature is disabled, a no light message “No Li” will briefly appear on
the display.

26 General information
Malfunction
In case of malfunction, remove the battery and re-insert it upside-down for a short moment (this
will not damage the WWP). Then insert the battery again in the correct position. This will reset
the entire memory of the instrument. Following this reset the instrument will perform a self-test.
If this procedure does not remedy the malfunction, please return the instrument with a precise
description of the problem to your FLYTEC dealer or direct to the manufacturer: FLYTEC AG,
Ebenaustrasse 18, CH-6048 Horw, Switzerland.
Care and Maintenance
The sensors in the WWP are very accurate and are calibrated at the factory. If after time any of
the functions need to be recalibrated, this can be done by the user; it is not necessary to send
the WWP in for service. Please contact Flytec for the procedure.
Warranty
The Windwatch PRO is warranted against material and manufacturing defects for two years.
Physical damage such as a broken housing or display window, as well as damage resulting
from abuse, battery leakage, improper care, exposure to excessive heat or opening the housing
are excluded from this warranty. In the event a defect is encountered during the two-year
warranty period, please contact your FLYTEC dealer for service instructions.
read this operation manual before you contact FLYTEC for operation or service issues.
Water Damage
The Windwatch PRO is water resistant and can also withstand temporary immersion in water. If
the immersion is in salt water, precautions should be taken to prevent damage to the various
components: thoroughly rinse the sensor area with fresh water (no pressure) and then leave the
instrument to dry for 24 hours.
devices and never by using a microwave stove.
instrument!
Caution:
Never try to accelerate the drying process with heat
Microwave radiation will destroy the
Please carefully
Disclaimer
FLYTEC (Flytec AG and Flytec USA) accept no liability for faults arising from any abuse or
unapproved use of the Windwatch PRO. Outdoor weather-dependent activities are generally
hazardous by nature. In rare cases, it may happen that the WWP provides incorrect data or
does not provide any data at all. FLYTEC is not responsible for any damages or injury due to
the incorrect functioning of the instrument. When engaging in weather-dependent activities, the
responsibility for safety lies solely with the participant.

Specifications 27
Specifications
Barometer
Format: 0.00 inHg or 0 hPa
Range: 6.49 inHg to 37.80 inHg or 220 hPa to 1280 hPa
Resolution: 0.03 inHg or 1 hPa
Barograph
Resolution: 1 hPa in Min/Max sub-screen, 2 hPa in Time & Temp sub-screens
Interval: 0h15, 0h30, 1h00, 2h00
Time scale: 195 min to 26 hrs
Altimeter
Range: -6,600 to 33,000 ft or -2,000 to 10,000 m
Resolution: 2 ft, 1m
Update Rate: Based on ascent/descent rate of user
Rapid Mode: Measuring 0.5s, Display 1s
Slow Mode: Measuring 2s, Display 2s
Ascent/descent
Range: ±93,750 ft/h or 28,575 m/h
Format: x ft/h or x m/h
Resolution: 10 ft/h or 10 m/h
Hygrometer
Format:
Humidity: x% RH
Dew Point: x.x° F or 0.0° C
Range
Humidity: 1% RH to 100% RH
Dew Point -76° F to 140°F or ±60 °C
Resolution
Humidity: 1% RH or
Dew Point: 0.1° F or 0.1° C
Graph
Resolution: 1 % RH or 0.2° C Dew Point
Interval: 0h01, 0h05, 0h15, 0h30, 1h00, 2h00
Display range: 13 min to 26 hrs
Accuracy: ± 3.5% RF (correctable)
Thermometer
Format: xx.xº
Range: -11.2° F to 140°F or -24°C to 60° C
Resolution: 0.1° F or 0.1° C
Graph
Resolution: min 0.2°C
Interval: 0h01, 0h05, 0h15, 0h30, 1h00, 2h00
Display range: 13 min to 26 hrs
Accuracy: ± 1.5° C (correctable)

28 Specifications
Clock
Format
Time: hh:mm:ss or h:mm:ss (pm)
Date: DD MM YYYY or MM DD YYYY
Resolution: 1 sec
Accuracy: Approx. 32 sec/yr
Alarm
Format
Time: hh:mm resp. h:mm PM
Date: DD MM or MM-DD or
Interval: Every day: 1-7
Week days only: 1-5
Week-ends only: 6-7
Recurring day of the week: 1, 2, 3, 4, 5, 6, 7
Resolution: 1 min
Stopwatch
Range: 0 to 99hrs 59min 59sec
Format: mm:ss:1/10s if time < 1hr
hh:mm:ss if time ≥1hr
Lap Display: mm:ss.1/10s if time < 1hr
hh:mm:ss if time ≥ 1hr
Resolution: 0.1 sec if time < 1hr
1 sec if time ≥1hr
Timer
Range: 10sec to 99hrs 59min 59sec
Pre-alarm range: 0, 10sec up to 99hrs 59 min 59sec
Display format: hh:mm:ss
Resolution: 1 sec
Speed
Range: 2 mph to 89 mph, 2.6 ft/s to 130.9 ft/s,0.8m/s to 39.9m/s,
3km/h to 144km/h, 2 kts to 78 kts, 0 to 12 beauf
Format: x.x if unit = ft/s or m/s, x if unit = mph or km/h or kts or beauf
Resolution: 1 mph, 0.1 ft/s, 0.1 m/s, 1 km/h, 1 kts, 1 beauf
Accuracy: ± 4% correctable
Update rate: 1/sec
Integration: 5 to 50 seconds (1s increments)
Physical
Weight: 2.3 oz or 67 g
Size: 4.68 x 2.28 x 0.75 in or 11.9 x 5.8 x 1.9 cm
Housing: ABS, water resistant
Battery type: 3V Lithium-Battery, Type CR2032
Battery life: ± 1.5 year, automatic with low battery warning
 Loading...