

Page 1

ProSim™ 6/8
Vital Signs Simulator
Users Manual
January 2011, Rev. 2, 9/11
© 2011 Fluke Corporation. All rights reserved. Specifications are subject to change without notice.
All product names are trademarks of their respective companies.
Page 2

Warranty and Product Support
Fluke Biomedical warrants this instrument against defects in materials and workmanship
for one year from the date of original purchase OR two years if at the end of your first
year you send the instrument to a Fluke Biomedical service center for calibration. You
will be charged our customary fee for such calibration. During the warranty period, we
will repair or at our option replace, at no charge, a product that proves to be defective,
provided you return the product, shipping prepaid, to Fluke Biomedical. This warranty
covers the original purchaser only and is not transferable. The warranty does not apply if
the product has been damaged by accident or misuse or has been serviced or modified by
anyone other than an authorized Fluke Biomedical service facility. NO OTHER
WARRANTIES, SUCH AS FITNESS FOR A PARTICULAR PURPOSE, ARE
EXPRESSED OR IMPLIED. FLUKE SHALL NOT BE LIABLE FOR ANY SPECIAL,
INDIRECT, INCIDENTAL OR CONSEQUENTIAL DAMAGES OR LOSSES,
INCLUDING LOSS OF DATA, ARISING FROM ANY CAUSE OR THEORY.
This warranty covers only serialized products and their accessory items that bear a
distinct serial number tag. Recalibration of instruments is not covered under the warranty.
This warranty gives you specific legal rights and you may also have other rights that vary
in different jurisdictions. Since some jurisdictions do not allow the exclusion or limitation
of an implied warranty or of incidental or consequential damages, this limitation of
liability may not apply to you. If any provision of this warranty is held invalid or
unenforceable by a court or other decision-maker of competent jurisdiction, such holding
will not affect the validity or enforceability of any other provision.
7/07
Page 3

Notices
All Rights Reserved
Copyright 2010, Fluke Biomedical. No part of this publication may be reproduced, transmitted, transcribed, stored in a
retrieval system, or translated into any language without the written permission of Fluke Biomedical.
Copyright Release
Fluke Biomedical agrees to a limited copyright release that allows you to reproduce manuals and other printed materials
for use in service training programs and other technical publications. If you would like other reproductions or distributions,
submit a written request to Fluke Biomedical.
Unpacking and Inspection
Follow standard receiving practices upon receipt of the instrument. Check the shipping carton for damage. If damage is
found, stop unpacking the instrument. Notify the carrier and ask for an agent to be present while the instrument is
unpacked. There are no special unpacking instructions, but be careful not to damage the instrument when unpacking it.
Inspect the instrument for physical damage such as bent or broken parts, dents, or scratches.
Technical Support
For application support or answers to technical questions, either email techservices@flukebiomedical.com or call 1-800648-7952 or 1-425-446-6945.
Claims
Our routine method of shipment is via common carrier, FOB origin. Upon delivery, if physical damage is found, retain all
packing materials in their original condition and contact the carrier immediately to file a claim. If the instrument is delivered
in good physical condition but does not operate within specifications, or if there are any other problems not caused by
shipping damage, please contact Fluke Biomedical or your local sales representative.
Standard Terms and Conditions
Refunds and Credits
Please note that only serialized products and their accessory items (i.e., products and items bearing a distinct
serial number tag) are eligible for partial refund and/or credit. Nonserialized parts and accessory items (e.g.,
cables, carrying cases, auxiliary modules, etc.) are not eligible for return or refund. Only products returned within 90
days from the date of original purchase are eligible for refund/credit. In order to receive a partial refund/credit of a product
purchase price on a serialized product, the product must not have been damaged by the customer or by the carrier
chosen by the customer to return the goods, and the product must be returned complete (meaning with all manuals,
cables, accessories, etc.) and in “as new” and resalable condition. Products not returned within 90 days of purchase, or
products which are not in “as new” and resalable condition, are not eligible for credit return and will be returned to the
customer. The Return Procedure (see below) must be followed to assure prompt refund/credit.
Restocking Charges
Products returned within 30 days of original purchase are subject to a minimum restocking fee of 15 %. Products
returned in excess of 30 days after purchase, but prior to 90 days, are subject to a minimum restocking fee of 20
%. Additional charges for damage and/or missing parts and accessories will be applied to all returns.
Return Procedure
All items being returned (including all warranty-claim shipments) must be sent freight-prepaid to our factory location. When
you return an instrument to Fluke Biomedical, we recommend using United Parcel Service, Federal Express, or Air Parcel
Post. We also recommend that you insure your shipment for its actual replacement cost. Fluke Biomedical will not be
responsible for lost shipments or instruments that are received in damaged condition due to improper packaging or
handling.
Use the original carton and packaging material for shipment. If they are not available, we recommend the following guide
for repackaging:
Use a double–walled carton of sufficient strength for the weight being shipped.
Use heavy paper or cardboard to protect all instrument surfaces. Use nonabrasive material around all
projecting parts.
Use at least four inches of tightly packed, industry-approved, shock-absorbent material around the
Returns for partial refund/credit:
Every product returned for refund/credit must be accompanied by a Return Material Authorization (RMA) number,
obtained from our Order Entry Group at 1-800-648-7952 or 1-425-446-6945.
Repair and calibration:
To find the nearest service center, go to www.flukebiomedical.com/service
In the U.S.A.:
Cleveland Calibration Lab
Tel: 1-800-850-4606
Email: globalcal@flukebiomedical.com
instrument.
or
Page 4

Everett Calibration Lab
Tel: 1-888-99 FLUKE (1-888-993-5853)
Email: service.status@fluke.com
In Europe, Middle East, and Africa:
Eindhoven Calibration Lab
Tel: +31-402-675300
Email: ServiceDesk@fluke.com
In Asia:
Everett Calibration Lab
Tel: +425-446-6945
Email: service.international@fluke.com
To ensure the accuracy of the Product is maintained at a high level, Fluke Biomedical recommends the product
be calibrated at least once every 12 months. Calibration must be done by qualified personnel. Contact your local
Fluke Biomedical representative for calibration.
Certification
This instrument was thoroughly tested and inspected. It was found to meet Fluke Biomedical’s manufacturing
specifications when it was shipped from the factory. Calibration measurements are traceable to the National Institute of
Standards and Technology (NIST). Devices for which there are no NIST calibration standards are measured against inhouse performance standards using accepted test procedures.
WARNING
Unauthorized user modifications or application beyond the published specifications may result in electrical shock hazards
or improper operation. Fluke Biomedical will not be responsible for any injuries sustained due to unauthorized equipment
modifications.
Restrictions and Liabilities
Information in this document is subject to change and does not represent a commitment by Fluke Biomedical.
Changes made to the information in this document will be incorporated in new editions of the publication. No
responsibility is assumed by Fluke Biomedical for the use or reliability of software or equipment that is not
supplied by Fluke Biomedical, or by its affiliated dealers.
Manufacturing Location
The ProSim™ 6/8 Vital Signs Simulator is manufactured at Fluke Biomedical, 6920 Seaway Blvd., Everett, WA, U.S.A.
Page 5

Table of Contents
Title Page
Introduction........................................................................................................ 1
Intended Use ...................................................................................................... 1
Safety Information ............................................................................................. 2
Symbols ............................................................................................................. 2
Unpack the Product............................................................................................ 3
Accessories ........................................................................................................ 3
Instrument Familiarization................................................................................. 5
How to Turn the Product On.............................................................................. 7
How to Connect a PC to the Product ................................................................. 7
Pre-Defined Simulations.................................................................................... 8
ECG Function .................................................................................................... 11
How to Set the ECG Parameters.................................................................... 11
How to View the ECG Waveform................................................................. 13
How to Simulate an ECG Artifact................................................................. 14
How to Simulate Arrhythmias....................................................................... 14
Supraventricular Arrhythmias................................................................... 16
Premature Arrhythmias ............................................................................. 17
Ventricular Arrhythmias ........................................................................... 17
Conduction Arrhythmias........................................................................... 18
Pacemaker Waveforms.................................................................................. 19
Advance Cardiac Life Support (ACLS) Waveforms (ProSim 8 only) .......... 20
ECG Performance Tests ................................................................................ 21
How to Set a Performance Wave .............................................................. 21
How to Set R Wave Detection Values (ProSim 8 only)............................ 22
How to Set QRS Detection Test Values (ProSim 8 only)......................... 23
How to Set Tall T Wave Rejection Test Values (ProSim 8 only)............. 24
Fetal Simulation (ProSim 8 only) ...................................................................... 25
How to Set Fetal Heart Values ...................................................................... 25
How to Simulate Intrauterine Pressure (IUP)................................................ 26
How to Set the Fetal Heart Rate Response ............................................... 28
How to Set the Intrauterine Contraction Simulation................................. 28
Invasive Blood Pressure Simulation and Tests.................................................. 29
How to Set the Invasive Blood Pressure Variables ....................................... 29
How to Simulate Invasive Blood Pressure Tests........................................... 31
How to Simulate a Swan-Ganz Procedure ................................................ 31
How to Simulate a Cardiac Catheterization Procedure (ProSim 8 only) .. 32
i
Page 6

ProSim™ 6/8
Users Manual
How to Simulate Temperature........................................................................... 35
How to Simulate Respiration............................................................................. 36
How to Simulate Cardiac Output....................................................................... 38
How to Set the Cardiac Output Waveform.................................................... 41
How to Set the Baseline Temperature ........................................................... 41
How to Set Injectate Temperature ................................................................. 41
How to Start a Cardiac Output Simulation.................................................... 41
Non-Invasive Blood Pressure Simulation and Tests.......................................... 41
How to Set the Non-Invasive Blood Pressure Variables ............................... 42
How to Do an NIBP Monitor Test................................................................. 45
How to Do a Pressure Leak Test ................................................................... 46
How to Do a Pressure Relief Test ................................................................. 48
How to Do a Pressure Source Test ................................................................ 49
How to Check a Manometer.......................................................................... 51
Oximeter SpO2 Optical Emitter and Detector ................................................... 52
How to Set the SpO2 Parameters .................................................................. 55
How to Test a Masimo Rainbow SpO2......................................................... 57
How to Perform an Oximeter Limits Test..................................................... 57
Oxygen Limits Test................................................................................... 57
Pulse Rate Test.......................................................................................... 58
Pulse Amplitude Test ................................................................................ 58
Autosequences ................................................................................................... 58
Table 14. Autosequences (cont.) ................................................................... 61
How to View the Steps of an Autosequence ................................................. 61
How to Do an Autosequence......................................................................... 62
How to Save and View Test Results (ProSim 8 only) ....................................... 62
How to Make an Operator ID........................................................................ 63
How to Make a Test ID ................................................................................. 64
How to Save Test Results.............................................................................. 65
How to View Test Results............................................................................. 66
How to Print Test Results.............................................................................. 68
How to Delete Saved Data ............................................................................ 68
Setup Features.................................................................................................... 69
How to Set the Time and Date....................................................................... 69
How to Set the Backlight Intensity................................................................ 70
How to Set the Beeper................................................................................... 70
How to Set the Pressure Units and IBP Sensitivity ....................................... 70
How to Set Battery Settings .......................................................................... 71
How to Set the Display Language ................................................................. 71
How to Control the Product Remotely............................................................... 72
Maintenance....................................................................................................... 72
How to Clean the Product.............................................................................. 73
Battery Maintenance...................................................................................... 73
How to Charge the Battery........................................................................ 73
Battery Removal........................................................................................ 74
General Specifications ....................................................................................... 75
Detailed Specifications ...................................................................................... 76
Normal-Sinus-Rhythm Waveform ................................................................ 76
Pacemaker Waveform ................................................................................... 76
Arrhythmia .................................................................................................... 76
ECG-Performance-Testing ............................................................................ 77
ECG Artifact.................................................................................................. 78
Fetal / Maternal-ECG (ProSim 8 only).......................................................... 78
Invasive Blood Pressure ................................................................................ 78
Respiration..................................................................................................... 79
ii
Page 7

Contents (continued)
Temperature................................................................................................... 79
Cardiac Output............................................................................................... 79
Non-Invasive Blood Pressure ........................................................................ 79
Oximeter SpO2 Optical Emitter and Detector (optional) .............................. 80
Pre-Defined Simulations ............................................................................... 81
Autosequences (default) ................................................................................ 81
Glossary ............................................................................................... A1
Introduction........................................................................................................ A1
iii
Page 8

ProSim™ 6/8
Users Manual
iv
Page 9

List of Tables
Table Title Page
1. Simulation Types ................................................................................................... 1
2. Symbols.................................................................................................................. 2
3. Standard Accessories ............................................................................................. 3
4. Optional Accessories.............................................................................................. 4
5. Top-Panel Controls and Connections..................................................................... 5
6. Back, Front, and Side-Panel Connections.............................................................. 6
7. Pre-Defined Patient Simulations ............................................................................ 9
8. ECG Wave Groups................................................................................................. 12
9. ECG Lead Amplitudes ........................................................................................... 13
10. Arrhythmias by Wave Group ................................................................................. 14
11. Pacemaker Waveforms........................................................................................... 19
12. Performance Wave Rates ....................................................................................... 22
13. Cardiac Output Waveforms.................................................................................... 41
14. Autosequences........................................................................................................ 58
v
Page 10

ProSim™ 6/8
Users Manual
vi
Page 11

List of Figures
Figure Title Page
1. Top-Panel Controls and Connections..................................................................... 5
2. Back, Front, and Side-Panel Connections.............................................................. 6
3. Power-Up Screen ................................................................................................... 7
4. Home Screen .......................................................................................................... 7
5. Laptop to PC Connection ....................................................................................... 8
6. ECG Connections................................................................................................... 11
7. ECG Screen............................................................................................................ 11
8. ECG Graph Screen................................................................................................. 13
9. ECG NSR Adult Screen ......................................................................................... 14
10. Performance Wave Screen ..................................................................................... 21
11. R-Wave Detection Screen ...................................................................................... 22
12. QRS Detection Screen............................................................................................ 23
13. Tall T Wave Rejection Screen ............................................................................... 25
14. Fetal ECG Screen................................................................................................... 26
15. Fetal Monitor Connections for Intrauterine Pressure Simulation........................... 27
16. Intrauterine Pressure Contractions Screen ............................................................. 28
17. Fetal ECG Intrauterine Pressure Screen................................................................. 29
18. Invasive Blood Pressure Screen ............................................................................. 29
19. IBP with Chambers Screen .................................................................................... 30
20. Invasive Blood Pressure Connections .................................................................... 31
21. Initial Swan-Ganz Procedure Simulation Screen ................................................... 32
22. Insert Step in Swan-Ganz Procedure Simulation ................................................... 32
23. Aortic Valve Catheterization Simulation Screen ................................................... 33
24. Pulmonary Valve Catheterization Simulation Screen ............................................ 34
25. Mitral Valve Catheterization Simulation Screen.................................................... 35
26. Temperature Simulation Connection ..................................................................... 35
27. Respiration Screen ................................................................................................. 36
28. Cardiac Output Injectate Cable Modification ........................................................ 39
29. Cardiac Output Connections .................................................................................. 40
30. Cardiac Output Screen ........................................................................................... 40
31. Non-Invasive Blood Pressure Test Connections .................................................... 42
32. Adjustments for Adult Blood Pressure Cuff Mandrel............................................ 42
33. Neonatal Blood Pressure Cuff Mandrel ................................................................. 43
34. Non-Invasive Blood Pressure Screen..................................................................... 43
35. Blood Pressure Measurement Graph...................................................................... 45
36. NIBP Summary Screen .......................................................................................... 46
vii
Page 12

ProSim™ 6/8
Users Manual
37. Pressure Leak Test Connections ............................................................................ 46
38. Leak Test Screen .................................................................................................... 47
39. Leak Test Pumping Screen..................................................................................... 47
40. Example Leak Test Result Screen.......................................................................... 48
41. Pressure Relief Valve Test Results Screen............................................................. 49
42. Pressure Source Connection................................................................................... 50
43. Pressure Source Pumping Screen........................................................................... 50
44. Manometer Connections ........................................................................................ 51
45. Manometer Screen ................................................................................................. 51
46. Oximeter SpO2 Optical Emitter and Detector Screen............................................ 52
47. Oximeter SpO2 Optical Emitter and Detector Connections .................................. 53
48. SpO2 Sensor Placement ......................................................................................... 54
49. Magnetic Holder for SpO2 Artificial Finger.......................................................... 55
50. Autosequence Start Screen..................................................................................... 61
51. Autosequence Step Screen ..................................................................................... 62
52. Memory Organization of Test Results ................................................................... 63
53. Operator ID Screen ................................................................................................ 63
54. Change Operator ID Screen ................................................................................... 64
55. Save Screen ............................................................................................................ 65
56. Observed Results Screen........................................................................................ 66
57. Saving Screen......................................................................................................... 66
58. Test ID Screen........................................................................................................ 67
59. Test Results Screen ................................................................................................ 67
60. Test Results Data Screen........................................................................................ 67
61. Setup Screen........................................................................................................... 69
62. External Battery Charging Connections................................................................. 74
63. Battery Removal..................................................................................................... 75
viii
Page 13

Introduction
The Fluke Biomedical ProSim™ 6 and ProSim™ 8 Vital Signs Simulators (hereafter the
Product) are full-featured, compact, portable simulators, used to measure the performance
of patient monitors. The Fluke Biomedical ProSim™ 8 is shown in all illustrations.
The Product simulates:
• ECG Functions
• Respiration
• Invasive and Non-Invasive Blood Pressure
• Temperature
• Cardiac Output
When the term simulation is used in connection with ECG, respiration, temperature, IBP,
NIBP, cardiac output, or SpO2, the simulation type shown in Table 1 is used in this
Product. Additionally, the Devices provide an optical signal to verify that the electronics
within the pulse oximeter probe are functional.
Table 1. Simulation Types
Parameter Simulation Type
ECG Electrical
Respiration Electrical
Temperature Electrical
IBP Electrical
NIBP Pneumatic
Cardiac Output Electrical
SpO2 Light Emission
Intended Use
The Product is intended to be used to test and verify the basic operation of patient
monitoring devices or systems used to monitor various physiological parameters of a
patient, including ECG, Respiration, Invasive blood pressure, Non-invasive blood
pressure, Temperature, and Cardiac output. Additionally, the Devices provide an optical
signal to verify that the electronics within the pulse oximeter probe are functional.
The intended user is a trained biomedical equipment technician who performs periodic
preventative maintenance checks on patient monitors in service. Users can be associated
with hospitals, clinics, original equipment manufacturers and independent service
companies that repair and service medical equipment. The end user is an individual,
trained in medical instrumentation technology.
This Product is intended to be used in the laboratory environment, outside of the patient
1
Page 14

ProSim 6/8
Users Manual
Safety Information
care area, and is not intended for use on patients, or to test devices while connected to
patients. This Product is not intended to be used to calibrate medical equipment. It is
inteneded for over the counter use.
In this manual, a Warning identifies hazardous conditions and actions that could cause
bodily harm or death. A Caution identifies conditions and actions that could damage the
Product, the equipment under test, or cause permanent loss of data.
WX Warnings
To prevent personal injury, use the Product only as specified,
or the protection supplied by the Product can be compromised.
To prevent possible electrical shock, fire, or personal injury:
• Do not use and disable the Product if it is damaged.
• The battery door must be closed and locked before you
operate the Product.
• Remove all probes, test leads, and accessories that are not
necessary for the measurement.
• Do not use the Product around explosive gas, vapor, or in
damp or wet environments.
• Do not use the Product if it operates incorrectly.
• Do not connect the Product to a patient or equipment
connected to a patient. The Product is intended for
equipment evaluation only and should never be used in
diagnostics, treatment, or any other capacity where the
Product would come in contact with a patient.
• Read all safety Information before you use the Product.
• Examine the case before you use the Product. Look for
cracks or missing plastic. Carefully look at the insulation
around the terminals.
• Carefully read all instructions.
2
Symbols
Table 2 describes symbols used in association with the Product.
Table 2. Symbols
Symbol Description Symbol Description
W
/
Risk of danger. Important information.
See manual.
This Product contains a Lithium-ion
battery. Do not mix with solid waste
stream. Spent batteries should be
disposed of by a qualified recycler or
hazardous materials handler per local
regulations. Contact your authorized
Fluke Service Center for recycling
information.
X
~
Magnetic Field. P Conforms to European Union directives.
Hazardous voltage. Risk of electric
shock.
Do not dispose of this Product as
unsorted municipal waste. Go to Fluke’s
website for recycling information.
Page 15

Vital Signs Simulator
Unpack the Product
Unpack the Product
Carefully unpack all items from the box and check that you have these items:
• ProSim™ 8 or ProSim™ 6
• Getting Started Manual
• Users Manual CD
• Carrying Case
• Power Cord
• AC/DC Power Supply
After you unpack and inspect the Product, fully charge the battery before the first use.
Afterwards, charge the battery when the Product shows the low battery message. See the
How to Maintain the Battery section in this manual.
Accessories
Available Product accessories are shown in Tables 3 and 4.
Item Fluke Biomedical Part Number
ProSim™ 6/8 Getting Started Manual
ProSim™ 6/8 Users Manual CD
AC/DC Power Supply
• USB Cable
• IBP Cable (unterminated)
• NIBP Cuff Mandrel set (adult and
neonate)
• NIBP Cuff Adapters
• Ansur Demostration Disk
Table 3. Standard Accessories
US
Schuko
3984515
3984526
2184298
2201455
2201437
AC Power Cord
USB Cable
IBP Cable, unterminated
Carrying Case
Set of NIBP Cuff Mandrels
Neonatal Cuff Mandrel
Set of NIBP Cuff Adapters
Ansur Demonstration CD-ROM
UK
Japan
Australia
Brazil
End blocks (2 required) 2392370
Space blocks (3 required) 2392381
2201428
2201419
2201443
3930831
4034393
2392173
4034597
2392328
2391882
2795488
3
Page 16

ProSim 6/8
Users Manual
Table 4. Optional Accessories
Item Fluke Biomedical Part Number
SpO2 Finger Module with cable
SpO2 Masimo RAINBOW cable
Battery pack
NIBP Test 500 mL rigid chamber
Simulation Cables:
IBP
Temperature
Cardiac Output Interface Box
Upgrade kit to ProSim™ 8
USB Wireless Dongle
Mini-DIN to DIN IBP Adapter
3985658
4034609
4021085
4034611
See your Fluke Biomedical Distributor
2392199
3987196
3341333
3408564
4
Page 17

Vital Signs Simulator
Instrument Familiarization
Instrument Familiarization
Table 5 is a list of Product top-panel controls and connections shown in Figure 1.
To p
1
2
3
18
17
16
4
5
15
F1 F2 F3 F4 F5
14
12
13 10
11
9
8
6
7
glh034.eps
Figure 1. Top-Panel Controls and Connections
Table 5. Top-Panel Controls and Connections
Item Name Description
1 ECG Posts Connection posts for Device Under Test (DUT) ECG leads.
2 ECG Function Accesses the ECG waveforms (adult, pediatric, and
arrhythmias), and ECG test functions (performance waves,
QRS detection, Tall T wave rejection, and R wave detection).
3 NIBP Button Accesses the Non-Invasive Blood Pressure (NIBP) functions.
4 Special Functions Accesses the temperature, respiration, cardiac output, fetal
simulation, autosequences, and view memory functions.
5 SETUP Button Accesses the setup controls.
6 IBP Button Accesses the Invasive Blood Pressure (IBP) functions.
7 Navigation Buttons Cursor control buttons for navigating menus and lists.
8 Enter Button Sets the highlighted function.
9 Backlight Button Turns the display backlight on and off.
10 Power Button Turns the Product on and off.
11 SpO2 Button Accesses the SpO2 functions.
12
Function Softkeys
Keys F1 through F5 are used to select from a number of
selections that appear in the LCD display above each function
softkey.
13 LCD Display Color display.
5
Page 18

ProSim 6/8
Users Manual
Table 5. Top-Panel Controls and Connections (cont.)
Item Name Description
14 SpO2 Connector Connector to the SpO2 accessory.
15 IBP Channel 2 Connector Connector to an IBP input of the patient monitor.
16 Cardiac Output Connector Connector to the Cardiac input of the patient monitor.
17 IBP Channel 1 Connector Connector to the IBP input of the patient monitor.
18 Temperature Connector Connector to the Temperature input of the patient monitor.
Back
1
2
3
Front
7 8
4
5 6
Right
glh035.eps
Figure 2. Back, Front, and Side-Panel Connections
Table 6. Back, Front, and Side-Panel Connections
Item Name Description
1 AC/DC Supply Connector Input jack for the DC output of the AC/DC supply connector.
2 Battery Charge LED Battery charges when LED shows red. Green shows battery
charge is complete.
3 Battery Latch Locks the battery pack into the Product. Push down to remove
the battery pack.
6
4 Mini B USB Device Port Used to connect to a PC for remote control or download test
results data to a PC.
5 USB A Controller Port For external keyboard, barcode reader, or printer.
6 ECG BNC Connector High-level output of ECG signal.
7 Air Port Connector Pressure port for NIBP cuff and monitor.
8 Magnetic Holder for SpO2 Finger
Module
Holds the SpO2 Optical Emitter and Detector finger module in
two orientations.
Page 19

Vital Signs Simulator
How to Turn the Product On
How to Turn the Product On
Push on the front panel to turn the Product on. The screen shown in Figure 3 shows
the power-up screen.
Figure 3. Power-Up Screen
glh002.bmp
When the self test is complete and no errors are sensed, the home screen in Figure 4
shows in the display.
Figure 4. Home Screen
glh001.bmp
From the home screen, a number of pre-defined patient simulations can be used to set all
the simulation functions at one time. See Pre-Defined Simulations to learn more on how
to use simulations. Waveform and ECG rate parameters are set through the ECG
function. See the ECG Function section to learn more on how to set these variables. The
respiration rate (Resp Rate), temperature parameter, cardiac output, and fetal simulation
are set through the special functions menu. The two Invasive Blood Pressure (IBP)
channels are set through the IBP function. The Non-Invasive Blood Pressure variables are
set through the NIBP function. See the Blood Pressure Simulations and Tests section to
learn more on how to set IBP and NIBP variables. The SpO2 variable is set through the
SpO2 function. See the Oximeter SpO2 Optical Emitter and Detector section to learn
more on how to set this variable.
How to Connect a PC to the Product
You can use a PC to store presets, auto sequences, and test results from the Product. You
must use the ProSim Mini Plug-In on the PC to communicate with the Product.
Note
You must have Ansur Test Executive version 2.9.6 on your PC to
communicate with the Product.
7
Page 20

ProSim 6/8
Users Manual
To connect the Product to a PC:
Connect a USB port on your PC or laptop to the Mini B USB device port of the
Simulator.
Or
For the ProSim 8 only, plug in an XStick USB dongle to your PC USB port. See
Figure 5.
8
Figure 5. Laptop to PC Connection
Pre-Defined Simulations
The pre-defined simulations are set through the softkeys along the bottom of the home
screen. See Figure 4. There are seven factory pre-defined simulations: normal,
hypertensive, hypotensive, tachycardic, bradycardic, heart attack, and asystole. A More
softkey shows in the display for more simulations. Table 7 lists the parameter values for
each pre-defined simulation.
gjp070.eps
Page 21

Vital Signs Simulator
Pre-Defined Simulations
Table 7. Pre-Defined Patient Simulations
Simulation Name Parameter Pre-Set Value
Wave Form NSR (Adult)
ECG Rate 60 bpm
Respiration Rate 20 brpm
Normal
Hypertensive
Temperature 37.0 °C
IBP Channel 1 120/80 mmHg (Art)
IBP Channel 2 28/15 mmHg (PA)
NIBP 120/80 (93) mmHg
SpO2 97 %
Wave Form NSR (Adult)
ECG Rate 130 bpm
Respiration Rate 40 brpm
Temperature 37.0 °C
IBP Channel 1 200/150 mmHg (Art)
IBP Channel 2 45/25 mmHg (PA)
NIBP 200/150 (166) mmHg
SpO2 94 %
Wave Form NSR (Adult)
ECG Rate 40 bpm
Respiration Rate 15 brpm
Hypotensive
Tachycardia
Temperature 37.0 °C
IBP Channel 1 60/30 mmHg (Art)
IBP Channel 2 15/10 mmHg (PA)
NIBP 60/30 (40) mmHg
SpO2 95 %
Wave Form NSR (Adult)
ECG Rate 180 bpm
Respiration Rate 50 brpm
Temperature 40.0 °C
IBP Channel 1 80/50 mmHg (Art)
IBP Channel 2 25/10 mmHg (PA)
NIBP 80/50 (60) mmHg
SpO2 88 %
9
Page 22

ProSim 6/8
Users Manual
Table 7. Pre-Defined Patient Simulations (cont.)
Simulation Name Parameter Pre-Set Value
Wave Form NSR (Adult)
ECG Rate 30 bpm
Respiration Rate 15 brpm
Bradycardic
Ventricular Fibrillition
Temperature 35.0 °C
IBP Channel 1 100/65 mmHg (Art)
IBP Channel 2 25/10 mmHg (PA)
NIBP 100/65 (77) mmHg
SpO2 85%
Wave Form Atrial Fibrillation (Coarse)
ECG Rate No bpm
Respiration Rate 70 brpm
Temperature 34.0 °C
IBP Channel 1 35/15 mmHg (Art)
IBP Channel 2 35/0 mmHg (LV)
NIBP 35/15 (22) mmHg
SpO2 80 %
Wave Form Asystole
ECG Rate 0 bpm
Respiration Rate 0 brpm
10
Asystole
Temperature 33.0 °C
IBP Channel 1 0 mmHg
IBP Channel 2 0 mmHg
NIBP 0/0 mmHg
SpO2 50 %
After you set one of the pre-defined simulations, you can change the parameters of one or
all of the vital signs. Changes are not kept in the Product. The pre-defined simulation
parameters can not be changed through the front panel.
There are seven custom pre-defined simulations in the Product. To set a custom
simulation:
1. From the Home screen, push the More softkey.
2. Push the Custom softkey.
Four custom simulation names show above the first four softkeys. The names are
Custom1, Custom2, Custom3, and Custom4. To show the next three names,
push the More softkey.
3. Push the softkey for a custom pre-defined simulation.
Page 23

Vital Signs Simulator
ECG Function
All the vital sign simulation parameters are set to the values contained in the pre-defined
simulation.
You can customize the seven factory simulations and seven custom simulations through
the Ansur functionality.
ECG Function
The Product simulates normal heart signals (ECG) as well as heart signals for a variety of
arrhythmias. Heart rate (beats per minute), signal amplitude, and ST segment elevation
are all controlled by the Product through the user interface. Artifacts can also be
simulated.
To measure the ECG performance of a monitor, connect the Product to the monitor as
shown in Figure 6. A maximum of ten ECG leads can be connected to Product.
Patient
Monitor
ECG
Cable
Figure 6. ECG Connections
How to Set the ECG Parameters
Whenever the Product is turned on, the display shows the defaults for heart rate
(60 BPM) with a patient type of Adult. Although not shown on the initial display, the
signal amplitude is 1 mV. To set any of the ECG parameters, push . The ECG
screen shown in Figure 7 shows in the display.
ProSim 8
Figure 7. ECG Screen
glh030.eps
glh004.bmp
11
Page 24

ProSim 6/8
Users Manual
To change the ECG waveform:
1. Push or to move the highlight to the Wave Group value.
2. Push .
3. Push or to move the highlight to a waveform group name. Table 8 is a list of
the wave groups available in the Product.
Table 8. ECG Wave Groups
Wave group
NSR (Adult) Adult Normal Sinus Rhythm
NSR (Pediatric) Child Normal Sinus Rhythm
Performance
R-Wave Detection (ProSim 8 only)
QRS Detection (ProSim 8 only)
Tall T Wave Rejection (ProSim 8 only)
Supraventricular
Premature
Ventricular
Conduction
TV Paced
ACLS (ProSim 8 only)
4. When the waveform group value is highlighted, push .
To change the heart rate:
1. Push or to move the highlight in the display to the Heart Rate value.
2. Push .
3. Push or to adjust the heart rate. Each push of a key moves the heart rate one
beat in the direction of the key pushed. The ProSim 8 simulates a heart rate of 10 to
360 beats/minute (BPM) set in 1 BPM intervals. The ProSim 6 simulates a heart rate
of 30 to 360 beats/minute (BPM) set in 10 BPM intervals.
Special waveforms for monitor tests. See the ECG
Tests section.
Arrhythmia waveforms. See the How to Simulate
Arrhythmias section.
12
4. Push to set the heart rate and go back to the ECG screen.
To change the axis:
1. Push or to move the highlight to the Axis value.
2. Push .
3. Push or to highlight Intermediate, Horizontal, or Vertical.
4. Push .
To set the ST Deviation:
1. Push or to move the highlight to the ST Deviation value.
2. Push .
Page 25

Vital Signs Simulator
ECG Function
3. Push or to adjust the deviation. Each push of a key moves the deviation 0.05 or
0.1 mV in the direction of the key pushed. The deviation range is ±0.80 mV
Note
When the ST Deviation value is set to 0.00 mV, the value in ECG screen
will show as Off.
4. Push to set the deviation and go back to the ECG screen.
To set the ECG signal amplitude:
1. Push or to move the highlight in the display to the Amplitude value.
2. Push .
3. Push or to adjust the amplitude. Each push of a key increases or decreases the
amplitude 0.05 mV between 0.05 and 0.50 mV and 0.25 mV above 0.50 mV to
5.00 mV in the direction of the key pushed.
4. Push to set the signal amplitude and go back to the ECG screen.
Table 9 shows the percentage of the signal amplitude value that is put on each ECG lead.
Table 9. ECG Lead Amplitudes
Waveform I II III V1 V2 V3 V4 V5 V6
Performance
Normal Sinus 70 % 100 % 30 % 24 % 48 % 100 % 120 % 112 % 80 %
Normal Sinus,
Horizontal Axis
Normal Sinus,
Vertical Axis
[1] Includes R-Wave Detection, QRS Detection, and Tall T-Wave Rejection waves.
[1]
70 % 100 % 30 % 100 % 100 % 100 % 100 % 100 % 100 %
100 % 30 % -70 % 20 % 40 % 70 % 100 % 80 % 50 %
30 % 130 % 100 % 20 % 30 % 40 % 60 % 80 % 100 %
How to View the ECG Waveform
As you adjust the ECG signal, you can see the signal in the display. To see the ECG
signal, from the ECG screen, push the Graph softkey. The graph screen in Figure 8
shows in the display.
Figure 8. ECG Graph Screen
The ECG signal is shown in the display in real time.
Push the Back softkey to go back to the ECG screen.
glh023.bmp
13
Page 26

ProSim 6/8
Users Manual
How to Simulate an ECG Artifact
The Product simulates a number of different ECG artifacts that can change the accuracy
of an ECG indication. ECG artifact simulations, which can be added to an ECG wave,
include line-frequency artifacts of 60 Hz (U.S. lines) and 50 Hz (European lines), as well
as artifacts for muscle movement, wandering baseline, and respiration.
All simulated ECG signals can have an artifact added to the ECG signal. To add an
artifact:
1. Push to show the ECG screen in Figure 9 in the display.
Figure 9. ECG NSR Adult Screen
2. Push or to highlight the Artifact Type value.
3. Push or to highlight 50 Hz, 60 Hz, Muscular, Baseline Wander, or
Respiration.
4. Push to enable the artifact and go back to the ECG screen.
To change the size of the artifact:
1. From the ECG screen, push or to highlight the Artifact Size value.
2. Push or to highlight 100%, 50%, or 25%.
3. Push to set the artifact size and go back to the ECG screen.
The artifact signal can be made to one ECG lead or all leads. To change which lead the
artifact is on:
1. From the ECG screen, push or to highlight the Artifact Lead value.
2. Push or to highlight RA, LL, LA, V1 – V6, or All Leads in the lead list.
3. Push to set the artifact lead and go back to the ECG screen.
How to Simulate Arrhythmias
All arrhythmia simulations are grouped into related wave groups. These arrhythmia wave
groups are Supraventricular, Premature, Ventricular, Conduction, TV Paced, and ACLS.
Table 10 shows all the arrhythmias the Product can simulate and identifies in which wave
group they can be found. The table also identifies which model can simulate the
arrhythmia.
Table 10. Arrhythmias by Wave Group
glh004.bmp
14
Arrhythmia Wave Group Available in
Asynchronous 75 BPM TV Paced ProSim 6 and 8
Asystole ACLS, Ventricular ProSim 6 and 8
Page 27

Vital Signs Simulator
ECG Function
Table 10. Arrhythmias by Wave Group (cont.)
Arrhythmia Wave Group Available in
Atr-Vent Sequential TV Paced ProSim 6 and 8
Atrial Fibrillation Supraventricular ProSim 6 and 8
Atrial Flutter Supraventricular ProSim 8 only
Atrial PAC Premature ProSim 6 and 8
Atrial Tach Supraventricular ProSim 8 only
Atrial 80 BPM TV Paced ProSim 6 and 8
Bigeminy Ventricular ProSim 6 and 8
Bradycardia ACLS ProSim 8 only
Demand Freq Sinus TV Paced ProSim 6 and 8
Demand Occ Sinus TV Paced ProSim 6 and 8
Freq Multi-focal PVCs Ventricular ProSim 8 only
Ischemic Chest Pain ACLS ProSim 8 only
Lt Bndl Branch Block Conduction ProSim 8 only
MIs with LBBB ACLS ProSim 8 only
MIs with RBBB ACLS ProSim 8 only
Missed Beat at 80 BPM Supraventricular ProSim 8 only
Missed Beat at 120 BPM Supraventricular ProSim 8 only
Mono V Tach Ventricular ProSim 6 and 8
Multi-focal PVCs Premature ProSim 6 and 8
Myocardial Infarctions ACLS ProSim 8 only
Narrow Complex Tach ACLS ProSim 8 only
Nodal PNC Premature ProSim 8 only
Nodal Rhythm Supraventricular ProSim 8 only
Non-Capture TV Paced ProSim 6 and 8
Non-Function TV Paced ProSim 6 and 8
Paroxysmal ATach Supraventricular ProSim 8 only
Poly V Tach Ventricular ProSim 6 and 8
Poly V Tach (unstable) ACLS ProSim 8 only
Pulseless Vent Tach ACLS ProSim 8 only
Pulseless Elect Tach ACLS ProSim 8 only
PVCs Ventricular ProSim 8 only
PVC1 Left Vent Premature ProSim 8 only
PVC1 LV Early Premature ProSim 8 only
15
Page 28

ProSim 6/8
Users Manual
Table 10. Arrhythmias by Wave Group (cont.)
Arrhythmia Wave Group Available in
PVC1 LV R on T Premature ProSim 8 only
PVC2 Right Vent Premature ProSim 8 only
PVC2 RV Early Premature ProSim 8 only
PVC2 RV R on T Premature ProSim 8 only
Rt Bndl Branch Block Conduction ProSim 6 and 8
Run of PVCs Ventricular ProSim 8 only
Sinus Arrhythmia Supraventricular ProSim 6 and 8
Stable Tachycardias ACLS ProSim 8 only
Supra VTach Supraventricular ProSim 8 only
Trigeminy Ventricular ProSim 8 only
Unstable Tachycardias ACLS ProSim 8 only
Ventricular Fibrillation Ventricular ProSim 6 and 8
Wide Complex Tach ACLS ProSim 8 only
1st Deg AV Block Conduction ProSim 8 only
2nd Deg AV Block T1 Conduction ProSim 6 and 8
2nd Deg AV Block T2 Conduction ProSim 8 only
3rd Deg AV Block Conduction ProSim 8 only
Supraventricular Arrhythmias
To set a supraventricular arrhythmia:
1. From the ECG screen, push or to highlight the Wave Group value.
2. Push .
3. Push or to highlight Supraventricular in the wave group list.
4. Push .
5. Push or to highlight the Waveform value.
6. Push .
7. Push or to highlight a waveform in the list.
8. Push to set the arrhythmia waveform and go back to the ECG:
Supraventricular screen.
16
The amplitude of all supraventricular arrhythmia waveforms can be adjusted. See the
How to Set the ECG Parameters section above. ECG signal artifacts can also be added to
each arrhythmia signal. See the How to Simulate an ECG Artifact section above.
The atrial fibrillation arrhythmia has one variable not available on the other
supraventricular arrhythmias. The type variable can be set to coarse or fine. To change
the type variable with the atrial fibrillation waveform set:
1. Push or to highlight the Type value.
2. Push .
Page 29

Vital Signs Simulator
ECG Function
3. Push or to highlight Coarse or Fine from the list.
4. Push to set the arrhythmia type and go back to the ECG: Supraventricular
screen.
Premature Arrhythmias
The premature wave group arrhythmias simulate premature contraction of muscle at
different nodes of the heart. To do a premature arrhythmia:
1. From the ECG screen, push or to highlight the Wave Group value.
2. Push .
3. Push or to highlight Premature in the wave group list.
4. Push .
5. Push or to highlight the Waveform value.
6. Push .
7. Push or to highlight a waveform in the list.
8. Push to set the arrhythmia waveform and go back to the ECG:
Supraventricular screen.
The amplitude of all premature arrhythmia waveforms can be adjusted. See the How
to Set the ECG Parameters section above. ECG signal artifacts can also be added to
each arrhythmia signal. See the How to Simulate an ECG Artifact section above.
Ventricular Arrhythmias
Ventricular arrhythmias are arrhythmias in the lower chambers of the heart, or ventricles.
To do a ventricular arrhythmia:
1. From the ECG screen, push or to highlight the Wave Group value.
2. Push
.
3. Push or to highlight Ventricular in the wave group list.
4. Push .
5. Push or to highlight the Waveform value.
6. Push .
7. Push or to highlight a waveform in the list.
8. Push to set the arrhythmia waveform and go back to the ECG: Ventricular
screen.
The amplitude of all ventricular arrhythmia waveforms can be adjusted. See the How to
Set the ECG Parameters section above. ECG signal artifacts can also be added to each
arrhythmia signal. See the How to Simulate an ECG Artifact section above.
The ventricular fibrillation and poly V tach arrhythmias have a variable not available on
the other ventricular arrhythmias. To change the type variable for the ventricular
fibrillation and poly v tach waveform set:
1. Push or to highlight the Type value.
2. Push .
3. Push or to highlight Coarse or Fine from the list.
4. Push to set the arrhythmia type and go back to the ECG: Ventricular screen.
17
Page 30

ProSim 6/8
Users Manual
The mono v tach arrhythmia has a heart rate variable. To change the heart rate:
1. Push or to highlight the Heart Rate value.
2. Push .
3. Push or to adjust the heart rate. Each push of a key moves the heart rate one
beat in the direction of the key pushed. A heart rate of 120 to 300 beats/minute
(BPM) can be set in 5 BPM intervals for this arrhythmia.
4. When the heart rate is set, push to set the arrhythmia heart rate and go back to
the ECG: Ventricular screen.
The PVCs arrhythmia has a rate variable to set the number of PVCs in a minute. To
change the rate of PVCs:
1. Push or to highlight the Rate value.
2. Push .
3. Push or to highlight 6/min, 12/min, or 24/min in the list.
4. Push to set the arrhythmia rate and go back to the ECG: Ventricular screen.
The Run of PVCs arrhythmia has a number variable to set the number of PVCs in a run.
To change the number of PVCs in a run:
1. Push or to highlight the Number value.
2. Push .
3. Push or to highlight 2 PVCs, 5 PVCs, or 11 PVCs.
4. Push
to set the arrhythmia number and go back to the ECG: Ventricular
screen.
Conduction Arrhythmias
Conduction arrhythmias are caused when conduction of electrical impulses are stopped or
blocked from their usual pathways around the heart. To simulate a conduction
arrhythmia:
1. From the ECG screen, push or to highlight the Wave Group value.
2. Push .
3. Push or to highlight Conduction in the wave group list.
4. Push .
5. Push or to highlight the Waveform value.
6. Push .
7. Push or to highlight a waveform in the list.
8. Push to set the arrhythmia waveform and go back to the ECG: Conduction
screen.
18
The amplitude of all conduction arrhythmia waveforms can be adjusted. See the How to
Set the ECG Parameters section above. ECG signal artifacts can also be added to each
arrhythmia signal. See the How to Simulate an ECG Artifact section above.
Page 31

Vital Signs Simulator
ECG Function
Pacemaker Waveforms
The Product can simulate ECG waveforms with a number of artificial-pacemaker
conditions. Table 11 shows the simulations in the waveform list of the Product with a
description of each.
Table 11. Pacemaker Waveforms
Pacemaker Waveform Label Waveform Description
Atrial 80 bpm Atrial pacemaker wave at 80 BPM, with a pacer pulse at the start of each
P wave.
Asynchronous 75 bpm Asynchronous pacemaker wave with continuous ventricular-paced beats
(75 BPM) and no P waves
Demand Freq Sinus A “demand” pacemaker wave with frequent sinus beats (forty normal
beats followed by twenty ventricular-paced beats, repeated)
Demand Occ Sinus A “demand” pacemaker wave with occasional sinus beats (twenty normal
beats followed by forty ventricular-paced beats, repeated)
Atr-Vent Sequential AV-sequential-pacemaker wave with continuous paced beats, each with
an atrial pulse and a P wave followed by a ventricular-paced pulse and
QRS response
Non-Capture Ventricular-paced beats, where one out of ten beats has no heart
response.
Non-Function Continuous pacer pulses at 75 BPM with no heart response.
To select a pacemaker waveform simulation:
1. From the ECG screen, push or to highlight the Wave Group value.
2. Push .
3. Push or to highlight TV Paced in the wave group list.
4. Push .
5. Push or to highlight the Waveform value.
6. Push .
7. Push or to highlight a waveform in the list.
8. Push to set the arrhythmia waveform and go back to the ECG: TV Paced
screen.
The amplitude of all TV Paced waveforms can be adjusted. See the How to Set the ECG
Parameters section above. ECG signal artifacts can also be added to each arrhythmia
signal. See the How to Simulate an ECG Artifact section above.
TV-Paced waveforms include the applicable pacer pulses. The pacer pulses can be
changed through the front panel. All but the Atrial 80 bpm waveform have ventricle
pacemaker variables that can be changed. The Atrial 80 bpm has an atrial pacemaker
value. The Atr-Vent Sequential waveform has an atrial pacemaker value and a ventricle
pacemaker value. To change the pacemaker values push the Atrial Settings or Vent.
Settings softkey.
You can change the amplitude, width, and polarity of the pacemaker signal. To change
the amplitude:
1. Push or to highlight the Amplitude value.
19
Page 32

ProSim 6/8
Users Manual
2. Push .
3. Push or to highlight an amplitude value in the list. Below is a list of the
pacemaker amplitude values.
0 mV 16 mV
2 mV 18 mV
4 mV 20 mV
6 mV 50 mV
8 mV 100 mV
10 mV 200 mV
12 mV 500 mV
14 mV 700 mV
4. Push to set the amplitude and go back to the TV Paced Settings screen.
To change the width value:
1. Push or to highlight the Width value.
2. Push .
3. Push or to highlight 0.1, 0.2, 0.5, 1.0, 1.5, or 2.0 mV in the list.
4. Push to set the width and go back to the TV Paced Settings screen.
To change the polarity:
1. Push or to highlight the Polarity value.
2. Push .
3. Push or to highlight + or - in the list.
4. Push to set the polarity and go back to the TV Paced Settings screen.
Push the Back softkey to go back to the ECG: TV Paced screen.
Advance Cardiac Life Support (ACLS) Waveforms (ProSim 8 only)
The Product can simulate Advanced Cardiac Life Support (ACLS) waveforms.
To simulate an ACLS waveform:
1. From the ECG screen, push or to highlight the Wave Group value.
2. Push
.
3. Push or to highlight ACLS in the wave group list.
4. Push .
20
5. Push or to highlight the Waveform value.
6. Push .
7. Push or to highlight a waveform in the list.
8. Push to set the waveform and go back to the ECG: ACLS screen.
The amplitude of all ACLS waveforms can be adjusted. See the How to Set the ECG
Parameters section above. ECG signal artifacts can also be added to each arrhythmia
signal. See the How to Simulate an ECG Artifact section above.
Page 33
Vital Signs Simulator
ECG Function
ECG Performance Tests
As well as physiological waveforms, the Product can supply signals to measure the
performance of an ECG monitor. A set of performance waveforms are used to measure
the frequency response (high and low), sensitivity, gain drift, internal calibration, stylus
damping, paper speed, linearity, and sweep speed of an ECG monitor. Three more
Product functions are used to measure R wave detection, QRS detection, and tall T wave
rejection of an ECG monitor.
How to Set a Performance Wave
The waveforms in the performance wave group are sine, square, triangle, and pulse.
Note
When a performance wave is set on the Product, outputs for respiration,
blood pressure, and temperature are disabled.
The four waveforms used for ECG performance tests are, sine, square, pulse, and
triangle. The rate and amplitude of these waveforms are adjustable to preconfigured
values. To output a performance wave:
1. Push to show the ECG screen in the display.
2. Push or to highlight the Wave Group value.
3. Push .
4. Push or to highlight the Performance value in the wave group list.
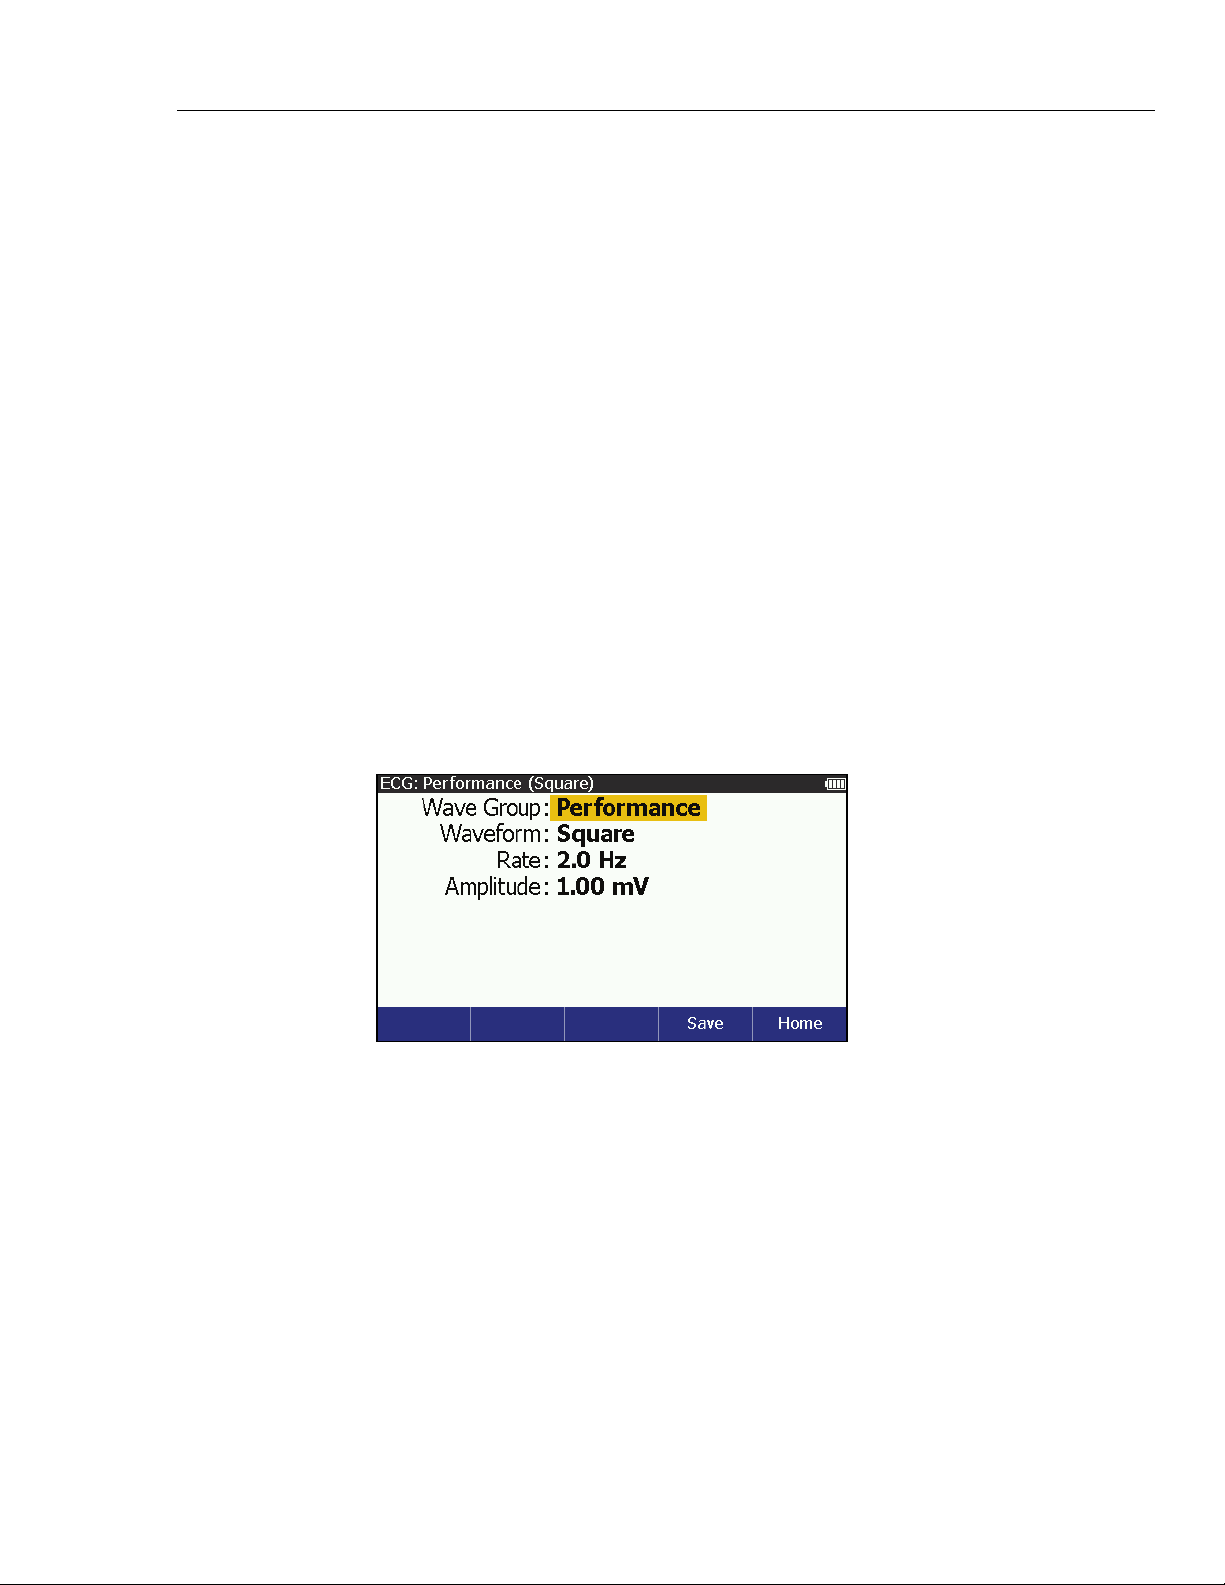
5. Push to show the ECG: Performance screen in Figure 10 in the display.
Figure 10. Performance Wave Screen
To change the waveform:
1. Push or to highlight the Waveform value.
2. Push .
3. Push or to highlight Square, Sine, Triangle, or Pulse in the list.
4. Push to set the performance waveform and go back to the ECG:
Performance screen.
glh019.bmp
All waveforms have the same two variables: Rate and Amplitude.
To change the rate:
1. Push or to highlight the Rate value.
2. Push .
3. Push or to highlight a value in the rate list. Table 12 lists the rates for each type
of wave.
21
Page 34

ProSim 6/8
Users Manual
Table 12. Performance Wave Rates
Performance Wave Rates
Square and Triangle 0.125, 2.0, and 2.5 Hz
Sine 0.05, 0.5, 1, 2, 5, 10, 25, 30, 40, 50, 60, 100, and 150 Hz
Pulse 30 and 60 bpm
4. Push to set the rate and go back to the ECG: Performance screen.
To change the amplitude:
1. Push or to highlight the Amplitude value.
2. Push .
3. Push or to adjust the amplitude. Each push of a key increases or decreases the
amplitude 0.05 mV between 0.05 and 1.00 mV and 0.25 mV above 1 mV to 5.00 mV
in the direction of the key pushed.
4. Push to set the rate and go back to the ECG: Performance screen.
How to Set R Wave Detection Values (ProSim 8 only)
To sense a heartbeat, a monitor looks for R waves. The sensed R wave is used to
calculate heart rate and other analysis. You adjust the R wave to find the range of values
a heart monitor can sense a heart beat. The R wave is a simple triangular pulse.
To output a signal for an R Wave detection test:
1. Push to show the ECG screen in the display.
2. Push or to highlight the Wave Group value.
3. Push .
4. Push or to highlight the R Wave Detection value in the wave group list.
5. Push to show the ECG: R Wave Detection screen in Figure 11 in the
display.
22
Figure 11. R-Wave Detection Screen
The rate, amplitude, and width of the R wave can be changed. To change the rate:
1. Push or to highlight the Rate value.
2. Push .
3. Push or to highlight 30, 60, 90, 120, 200, or 250 bpm in the list.
glh020.bmp
Page 35

Vital Signs Simulator
ECG Function
4. Push to set the rate and go back to the ECG: R Wave Detection screen.
To change the R wave amplitude:
1. Push or to highlight the Amplitude value.
2. Push .
3. Push or to adjust the amplitude. Each push of a key increases or decreases the
amplitude in the direction of the key pushed. The Product simulates a heart signal
amplitude of 0.05 to 0.25 mV by 0.05 mV intervals and 0.05 to 5.00 mV that is set in
0.25 mV intervals.
4. When the amplitude is set, push to enter the value and go back to the R Wave
Detection screen.
To change the width of the R Wave:
1. Push or to highlight the Width value.
2. Push .
3. Push or to adjust the width. Each push of a key increases or decreases the
width 20 ms for each key push when the value is 20 ms or above and 2 ms when the
value is 20 ms or less. The Product simulates an R Wave width of 8 to 200 ms.
4. When the amplitude is set, push to enter the value and go back to the R Wave
Detection screen.
How to Set QRS Detection Test Values (ProSim 8 only)
The QRS Detection wave group supplies a signal that you can adjust the width of the QT
interval. This QRS Detection wave includes the R and S waves with relative amplitudes
as specified in EC-13. The R wave is 0.875 of the waveform amplitude and the S wave is
negative at 0.125 of the waveform amplitude. The R wave up slope is 0.4375 of the
waveform width. The R wave down slope is 0.5 of the waveform width. The S wave up
slope is 0.0625 of the waveform width.
To generate a signal for an QRS detection test:
1. Push to show the ECG screen in the display.
2. Push or to highlight the Wave Group value.
3. Push .
4.
Push or to highlight the QRS Detection value in the wave group list.
5. Push to show the ECG: QRS Detection screen in Figure 12 in the display.
Figure 12. QRS Detection Screen
glh021.bmp
23
Page 36

ProSim 6/8
Users Manual
The rate, amplitude, and width of the QRS wave can be changed.
To change the rate:
1. Push or to highlight the Rate value.
2. Push .
3. Push or to highlight 30, 60, 90, 120, 200, or 250 bpm in the list.
4. Push to set the rate and go back to the ECG: QRS Detection screen.
To change the QRS Wave amplitude:
1. Push or to highlight the Amplitude value.
2. Push .
3. Push or to adjust the amplitude. Each push of a key increases or decreases the
amplitude in the direction of the key pushed. The Product simulates a heart signal
amplitude of 0.05 to 0.25 mV by 0.05 mV intervals and 0.50 to 5.00 mV that is set in
0.25 mV intervals.
4. Push to set the amplitude and go back to the ECG: QRS Detection screen.
To change the width of the QT interval:
1. Push or to highlight the Width value.
5. Push .
6. Push or to adjust the width. Each push of a key increases or decreases the
width 10 ms for each key push when the value is 20 ms or above and 2 ms when the
value is 20 ms or less. The Product simulates a QT width of 8 to 200 ms.
7. When the width is set, push to enter the value and go back to the ECG: QRS
Detection screen.
How to Set Tall T Wave Rejection Test Values (ProSim 8 only)
An ECG monitor must sense and reject a large T wave when it calculates the heart rate.
Use the Tall T Wave Rejection waveform for this test. This wave includes the QRS wave
per EC-13 with a 100 ms width and QT interval of 350 ms. The T wave has a sinusoidal
shape, 180 ms wide, and can be adjusted in amplitude to 0 to 150 % of the overall
waveform amplitude. The rate is set at 80 bpm. To output a tall T wave signal:
1. Push to show the ECG screen in the display.
2. Push or to highlight the Wave Group value.
3. Push .
4. Push or to highlight the Tall T Wave Rejection value in the wave group list.
5. Push to show the ECG: Tall T Wave Rejection in Figure 13 in the display.
24
Page 37

Vital Signs Simulator
Fetal Simulation (ProSim 8 only)
Figure 13. Tall T Wave Rejection Screen
The amplitude of the T Wave can be changed. To change the amplitude:
1. Push or to highlight the Amplitude value.
2. Push .
3. Push or to increase or decrease the T Wave amplitude. The amplitude is set as
a percentage of the voltage on the reference lead. The range is 0 to 150 % in 10 %
steps.
4. Push to enter the value and go back to the ECG: Tall T Wave Rejection
screen.
Fetal Simulation (ProSim 8 only)
The Product simulates a mixed fetal and maternal electrocardiogram (ECG) that occurs
during labor, as well as a selection of pressure waveforms made by uterine contractions.
The contraction period can be changed. There is also a manual contraction.
Note
The maternal heart rate is always a normal sinus rhythm at
80 beats/minute.
The Product does not provide simulations for all types of fetal heart rate tracings and
contraction patterns. A few examples of simulations not provided are:
glh022.bmp
• Variable decelerations
• Sinusoidal pattern
• Reactive tracing
• Variations in FHR variability
• Tachysystole
How to Set Fetal Heart Values
The Product simulates the fetal/maternal ECG on its regular ECG leads. The maternal
signal is a P-QRS-T wave at half the set ECG amplitude. The fetal signal is a narrow R
wave at full amplitude. Fetal and maternal signals are summed to make a composite
signal.
To do a fetal simulation:
1. Push .
2. Push , , , or to highlight Fetal Simulation and then push to show the
Fetal ECG screen in the display. See Figure 14.
25
Page 38

ProSim 6/8
Users Manual
Figure 14. Fetal ECG Screen
glh025.bmp
Push the softkey labeled Back to go back to the Special Functions screen.
To change the fetal heart rate:
1. Push or to highlight the Fetal HR value.
2. Push .
3. Push or to change the heart rate value in 1 bpm steps between 60 and 240 bpm.
Note
When you hold down the direction key, the step size will change to 10 bpm
until the key is released.
4. Push to set the heart rate and go back to the Fetal ECG screen.
To change the amplitude of the fetal waveform:
1. Push or to highlight the Amplitude value.
2. Push or to adjust the amplitude. Each push of a key increases or decreases the
amplitude in the direction of the key pushed. The Product simulates a fetal heart
signal amplitude of 0.05 to 0.25 mV by 0.05 mV intervals and 0.50 to 5.00 mV that is
set in 0.25 mV intervals.
3. Push to set the amplitude and go back to the Fetal ECG screen.
26
How to Simulate Intrauterine Pressure (IUP)
The simulated intrauterine-pressure (IUP) waveform shows a measurement read by an
intra-amniotic catheter connected to a pressure transducer. The Product simulates the IUP
on IBP channel 1, with a 5 or 40 μV/V/mmHg sensitivity (as has been setup for blood
pressure).
The Product sends waveforms to simulate intrauterine pressure during a contraction of
the uterus in childbirth. Each IUP wave goes for 90 seconds with a bellshaped pressure
curve that increases from zero to 90 mmHg and goes back to zero. In an IUP-wave
simulation, the fetal heart rate (which always begins at 140 BPM, regardless of the fetal
ECG rate.) changes with the blood pressure. The fetal heart rate and blood pressure
shows in the display.
The IUP period is adjustable to four preconfigured values: a manually started contraction,
and contractions that start at 2, 3, or 5 minute intervals.
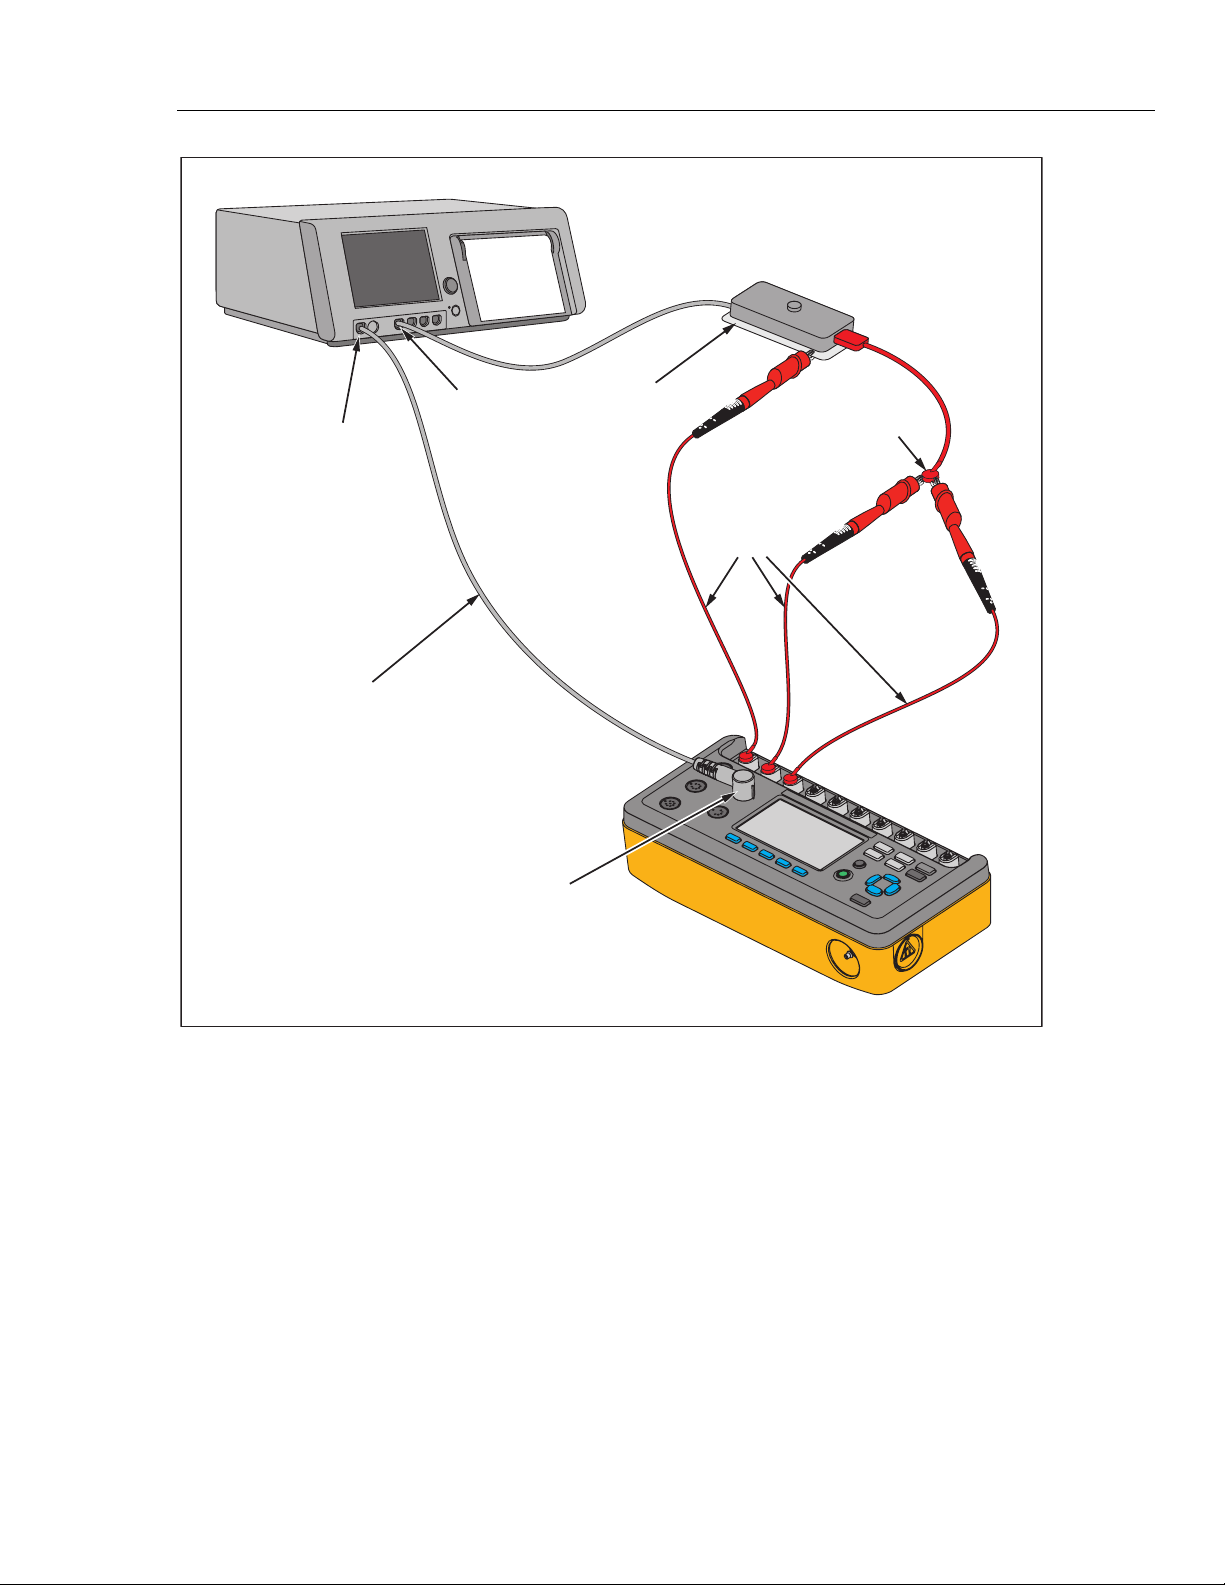
To do an Intrauterine pressure simulation, connect the fetal monitor to the Product as
shown in Figure 15.
Page 39
Vital Signs Simulator
Fetal Simulation (ProSim 8 only)
Fetal Monitor
Intrauterine
Blood Pressure
Input
BP Cable
Fetal ECG
Input
IBP Channel 1
Maternal Thigh
Reference Plate
Fetal Scalp
Electrode
Jumper
Wires
ProSim 8
Figure 15. Fetal Monitor Connections for Intrauterine Pressure Simulation
Note
The maternal thigh reference plate is an accessory provided by fetal
monitor OEM, not by Fluke Biomedical, for internal FHR and FECG
recording. The 3-lead leg plate employs a single skin electrode as a
reference, positioned on the mother's thigh.
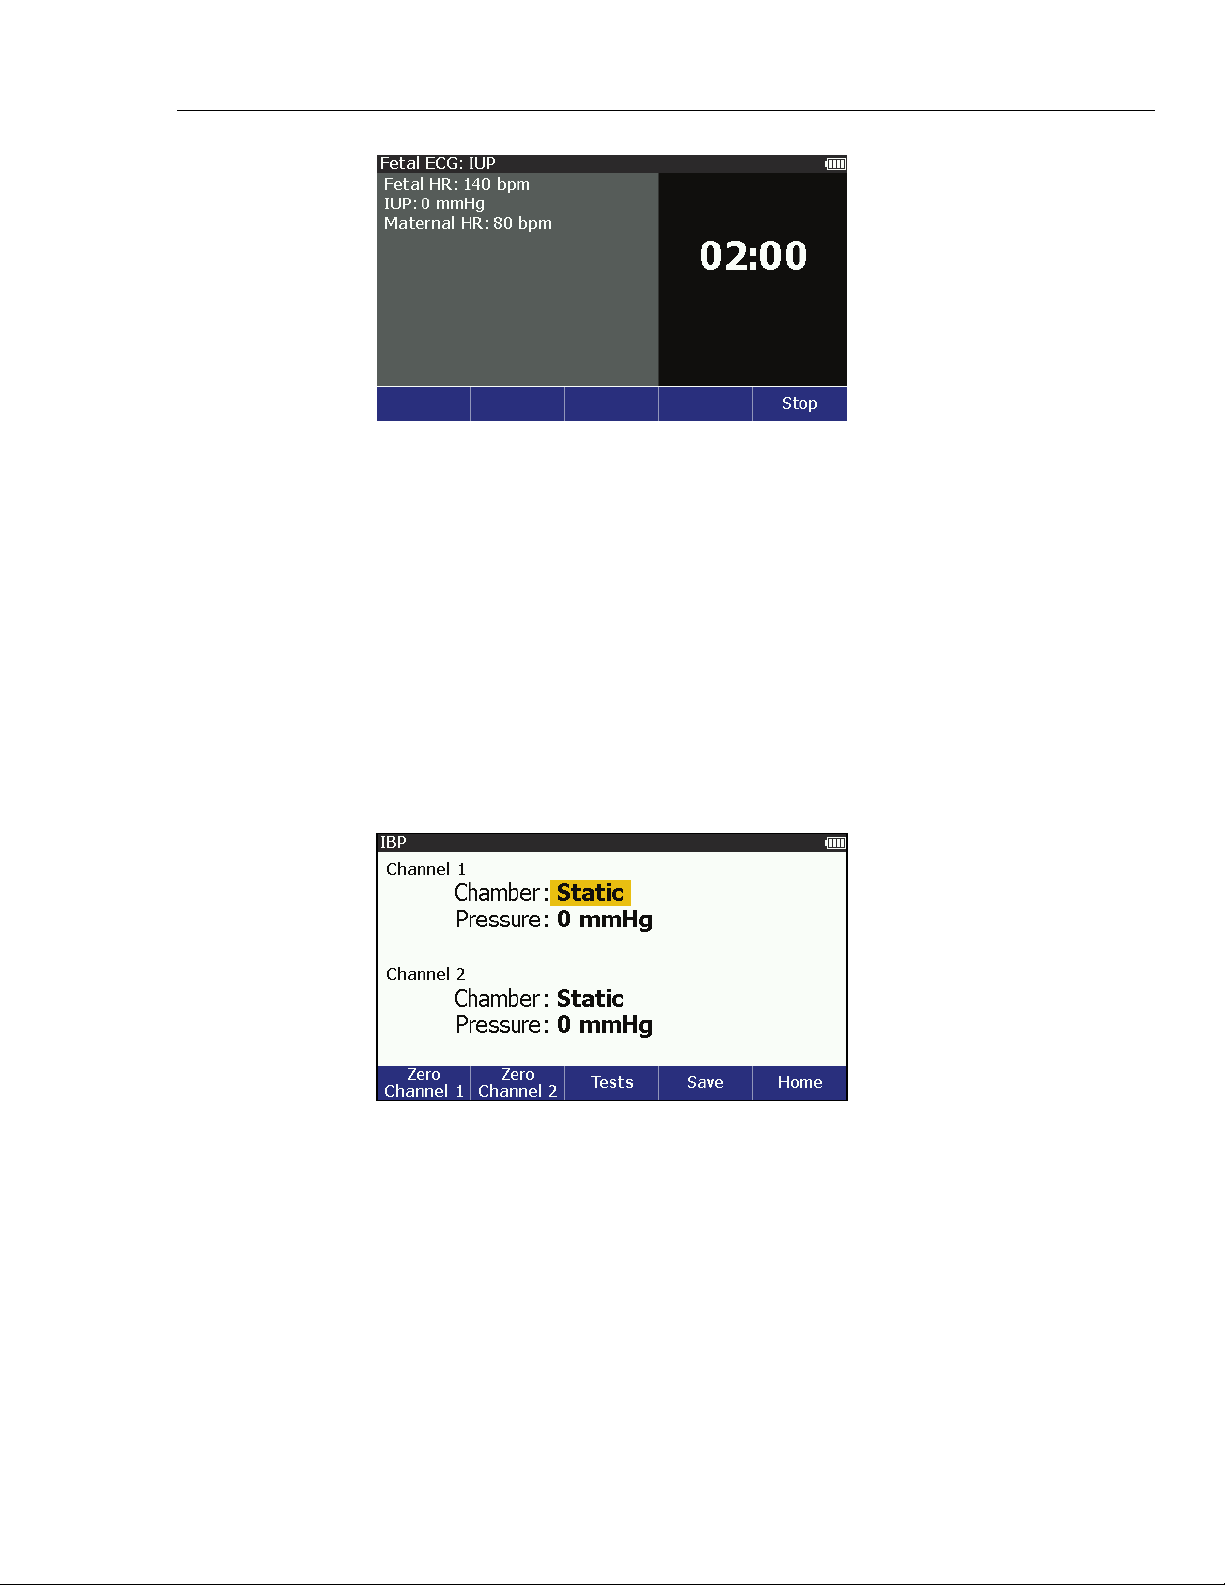
To simulate intrauterine pressure contractions push the IUP Contraction softkey to
show the Fetal ECG: IUP screen in the display. See Figure 16.
glh058.eps
27
Page 40

ProSim 6/8
Users Manual
Figure 16. Intrauterine Pressure Contractions Screen
How to Set the Fetal Heart Rate Response
The Product simulates three types of preconfigured waveforms for a periodic fetal heart
rate that is interactive with uterine contractions: early deceleration; late deceleration; or
acceleration:
With early deceleration, the fetal heart rate follows the intrauterine pressure (no lag). The
fetal heart rate starts at 140 BPM, slows to 100 BPM at intrauterine-pressure peak, and
then goes back to 140 BPM as the IUP falls back to zero.
With late deceleration, the change in fetal heart rate starts when IUP pressure is at its
peak and lags the change in intrauterine pressure by 45 seconds. The fetal heart rate starts
at 140 BPM, slows to 100 BPM, and then goes back to 140 BPM.
With acceleration, the change in fetal heart rate lags the change in intrauterine pressure
by 30 seconds. The fetal heart rate starts at 140 BPM, increases to 175 BPM, and then
goes back 140 BPM.
To set the fetal heart rate response:
1. Push or to highlight the HR Response value.
2. Push .
3. Push or to highlight Early Deceleration, Late Deceleration, or
Acceleration.
glh026.bmp
28
4. Push to set the response value and go back to the Fetal ECG: IUP screen.
How to Set the Intrauterine Contraction Simulation
The IUP (Intrauterine Pressure) period is adjustable to four preconfigured values. These
are contractions that start manually or at 2, 3, or 5 minute intervals.
To set the contractions:
1. Push or to highlight the Contraction value.
2. Push .
3. Push or to highlight Manual Start, 2, 3, or 5 minutes.
4. Push to set the contraction value and go back to the Fetal ECG: IUP screen.
5. To start a contraction, push the Start softkey. The screen below shows in the display
and updates with real-time simulation data. The time until the contraction ends is also
shown in the display. See Figure 17.
Page 41
Vital Signs Simulator
Invasive Blood Pressure Simulation and Tests
Figure 17. Fetal ECG Intrauterine Pressure Screen
If the contraction value is set to Manual Start, only one contraction cycle is simulated.
The timer shows the time until the contraction ends and the subsequent contraction starts.
Push the Stop softkey to stop contractions and go back to the Fetal ECG: IUP screen.
Invasive Blood Pressure Simulation and Tests
The Product simulates blood pressure for Invasive blood pressure monitors. Each blood
pressure variable can be set through the front-panel controls. The Product also
simulations Swan-Ganz and cardiac catheterization procedures.
How to Set the Invasive Blood Pressure Variables
The Product can simulate two invasive blood pressure transducers at one time. The blood
pressure variables are set separately for each channel. To set these variables, push
to show the IBP screen in Figure 18 in the display.
glh027.bmp
Figure 18. Invasive Blood Pressure Screen
To set the chamber:
1. Push or to highlight the Chamber value on channel 1 or channel 2.
2. Push .
3. Push or to highlight a value in the chamber list. Below is a list of chamber
values in the Product.
Static Right Ventricle
Arterial Pulmonary Artery
Radial Artery PA Wedge
Left Ventricle Right Atrium (CVP)
Left Atrium
glh009.bmp
29
Page 42

ProSim 6/8
Users Manual
4. Push to set the chamber and go back to the IBP screen.
You must first zero the patient monitor when you connect to a new IBP transducer or
patient simulator. To set a channel to 0 mmHg and Static chamber, push the Zero
Channel 1 or Zero Channel 2 softkey. After you zero the product, do the zero
function on the patient monitor.
To set the pressure:
1. Push or to highlight the Pressure value on channel 1 or channel 2.
2. Push .
Systolic and diastolic pressures are set separately.
Note
If the chamber is set to static, only one pressure is set.
3. Push or to highlight the systolic or diastolic pressure value.
4. Push or to increase or decrease the pressure value in 1 mmHg steps. The range
is -10 to +300 mmHg.
Note
When you hold down the direction key, the step size will change to
10 mmHg until the key is released.
5. Push to set the pressure and go back to the IBP screen.
When the Chamber parameter is set to a value other than Static, the artifact parameter is
added to the display as shown in Figure 19.
Figure 19. IBP with Chambers Screen
glh051.eps
To set the artifact:
Note
Artifact value is not available when the chamber value is set to static.
1. Push or to highlight the Artifact value on channel 1 or channel 2.
2. Push .
30
3. Push or to highlight 5% or 10% if the chamber parameter is set to Arterial,
Radial Artery, or Left Ventricle. Highlight 5 mmHg or 10 mmHg for all other
chamber values. Highlight Off to turn off the artifact function
Page 43

Vital Signs Simulator
Invasive Blood Pressure Simulation and Tests
Note
The artifact values in the list can be in percent (%) or in mmHg. These units
are set by the chamber value.
4. Push to set the artifact value and go back to the IBP screen.
The IBP screen reappears in the display with the new artifact selection.
How to Simulate Invasive Blood Pressure Tests
The Product can simulate pressures that occur during a Swan-Ganz or Cardiac
Catheterization procedure. Figure 20 shows a monitor connected to the two IBP channel
jacks on the Product.
IBP Cables
Patient
Monitor
Figure 20. Invasive Blood Pressure Connections
How to Simulate a Swan-Ganz Procedure
To simulate IBP during a Swan-Ganz procedure:
1. Push the Tests softkey in the IBP screen.
2. Push or to highlight Swan-Ganz – Channel 1 or Swan-Ganz –
Channel 2.
3. Push . The details and steps in the procedure shown in Figure 21 are shown in
the display.
ProSim 8
glh028.eps
31
Page 44

ProSim 6/8
Users Manual
Figure 21. Initial Swan-Ganz Procedure Simulation Screen
glh012.bmp
You can do the Swan-Ganz procedure manually or automatically.
To step through the procedure manually, push the Manual softkey. Each procedure step
is shown in the display. To move to the subsequent step push the Next softkey.
After the first step, you push the Previous softkey to go back a step. You stop the
procedure when you push the Stop softkey.
To do the steps automatically, push the Start Automatic softkey. The display in
Figure 22 shows the Inserted (Right Atrium) step for the Swan-Ganz procedure.
Figure 22. Insert Step in Swan-Ganz Procedure Simulation
glh014.bmp
32
There is a 15 second period between steps. The remaining time for each step shows in the
right part of the display. You can push the Pause softkey to stop the countdown to the
subsequent step while the Product continues the patient simulation for that step.
Continue replaces Pause when the procedure step is paused. Push Continue to
continue the step.
You can go back a step when you push the Previous softkey. The Product simulates that
step for a full 15 seconds before it does the subsequent step. When you push the
Previous softkey while paused, the Product goes back a step, but stays paused and sets
the time to 15 seconds.
When you push the Stop softkey, the procedure simulation is stopped and the initial test
screen shown in Figure 21 shows in the display.
How to Simulate a Cardiac Catheterization Procedure (ProSim 8 only)
Note
The Cardiac Catheterization procedure is only available in the ProSim 8.
The Product simulates blood pressure measurements on both sides of a heart valve. The
pressure difference, or gradient across the valve is used to determine heart valve
condition.
Page 45

Vital Signs Simulator
Invasive Blood Pressure Simulation and Tests
To simulate a Cardiac Catheterization procedure:
1. Push the Tests softkey in the IBP screen.
2. Push or to highlight Cardiac Catheterization.
3. Push . The valve selection is shown in the display.
To change the valve value:
1. Push .
2. Push or to highlight Aortic, Pulmonary, or Mitral.
3. Push to go back to the IBP: Cardiac Catheterization screen.
To start the procedure simulation:
1. Push the Start softkey.
All the procedure steps are done manually.
2. Push the Insert softkey for the next step.
3. You simulate an increase and decrease of simulated pressure when you push the
Increase Pressure or Decrease Pressure softkeys.
4. Push the Pullback softkey to simulate the pressures when the catheter is pulled
back.
Push the Stop softkey to stop the procedure and go back to the IBP: Cardiac
Catheterization screen.
Aortic Valve Catheterization Simulation
The aortic valve controls flow from the left ventricle (LV) to the aorta (atrial pressure)
and prevents flow in the reverse direction. Both IBP channels are set the Arterial 120/80.
IBP channel 1 stays at arterial 120/80 for reference throughout the simulation.
1. Push the Insert softkey to simulate the insertion of IBP channel 2 catheter into the
left ventricle at 120/0. Figure 23 shows the screen for the aortic valve catheterization
simulation.
Figure 23. Aortic Valve Catheterization Simulation Screen
glh054.bmp
For a normal valve, when the heart beat starts, the LV pressure increases to 80
mmHg. Then, as the valve opens, both pressures increase to the systolic peak. Next,
the pressures fall until the valve opens. The LV pressure goes back down, but the
arterial stays at 80 mmHg.
2. Push the Increase Pressure or Decrease Pressure to simulate a bad aortic
valve. There are six pressure values between 120 and 180 mmHg. Each push of the
increase softkey sets the left ventricle pressure to 126 (+5 %), 132 (+10 %), 138
33
Page 46

ProSim 6/8
Users Manual
Pulmonary Valve Catheterization Simulation
(+15 %), 144 (+20 %), and 180 (+50 %). Each push of the decrease softkey sets the
pressure down from 180 to 120 mmHg with the same pressure steps.
3. Push the Pullback softkey to simulate the pull back of the IBP channel 2 catheter to
the left ventricle.
The pulmonary valve controls flow from the right ventricle (RV) to the pulmonary artery
(PA) and prevents flow in the reverse direction. Both IBP channels are set to PA 25/10.
IBP channel 1 stays at PA 25/10 for reference throughout the simulation.
1. Push the Insert softkey to simulate the insertion of the IBP channel 2 catheter into
the right ventricle at 25/0.
Figure 24. Pulmonary Valve Catheterization Simulation Screen
For a normal valve, when the heart beat starts, the RV pressure increases to
10 mmHg. Then, as the valve opens, both pressures increase to the systolic peak.
Next, the pressures fall until the valve opens. The RV pressure goes back down, but
the pulmonary artery stays at 10 mmHg.
2. Push the Increase Pressure or Decrease Pressure to simulate a bad pulmonary
valve. There are six pressure values between 25 and 38 mmHg. Each push of the
increase softkey sets the left ventricle pressure to 26 (+5 %), 28 (+10 %), 29 (+15 %),
30 (+20 %), and 38 (+50 %). Each push of the decrease softkey sets the pressure
down from 38 to 25 mmHg with the same pressure steps.
3. Push the Pullback softkey to simulate the pull back of the IBP channel 2 catheter to
the right ventricle.
Mitral Valve Cahteterization Simulation
The mitral valve controls flow from the left atrium (LA) to the left ventricle (LV) and
prevents flow in the reverse direction. A mitral valve test is done indirectly with pressure
measurements in the pulmonary artery (PA). There are two measurements: normal and
wedged. A wedged measurement is done with a inflated ballon (PAW) in the pulmonary
artery to measure the back pressure from the left ventricle through the left atrium and the
lungs. At the start of the procedure, IBP channel 1 is set to LV 120/0 and channel 2 is set
to pulmonary artery (PA) 25/10/. IBP channel 1 stays at LV 120/0 for reference
throughout the simulation.
glh055.bmp
34
1. Push the Insert softkey to simulate a change in IBP channel 2 catheter pressure to
the pulmonary artery wedge pressure (PAW) of 10/2.
Page 47
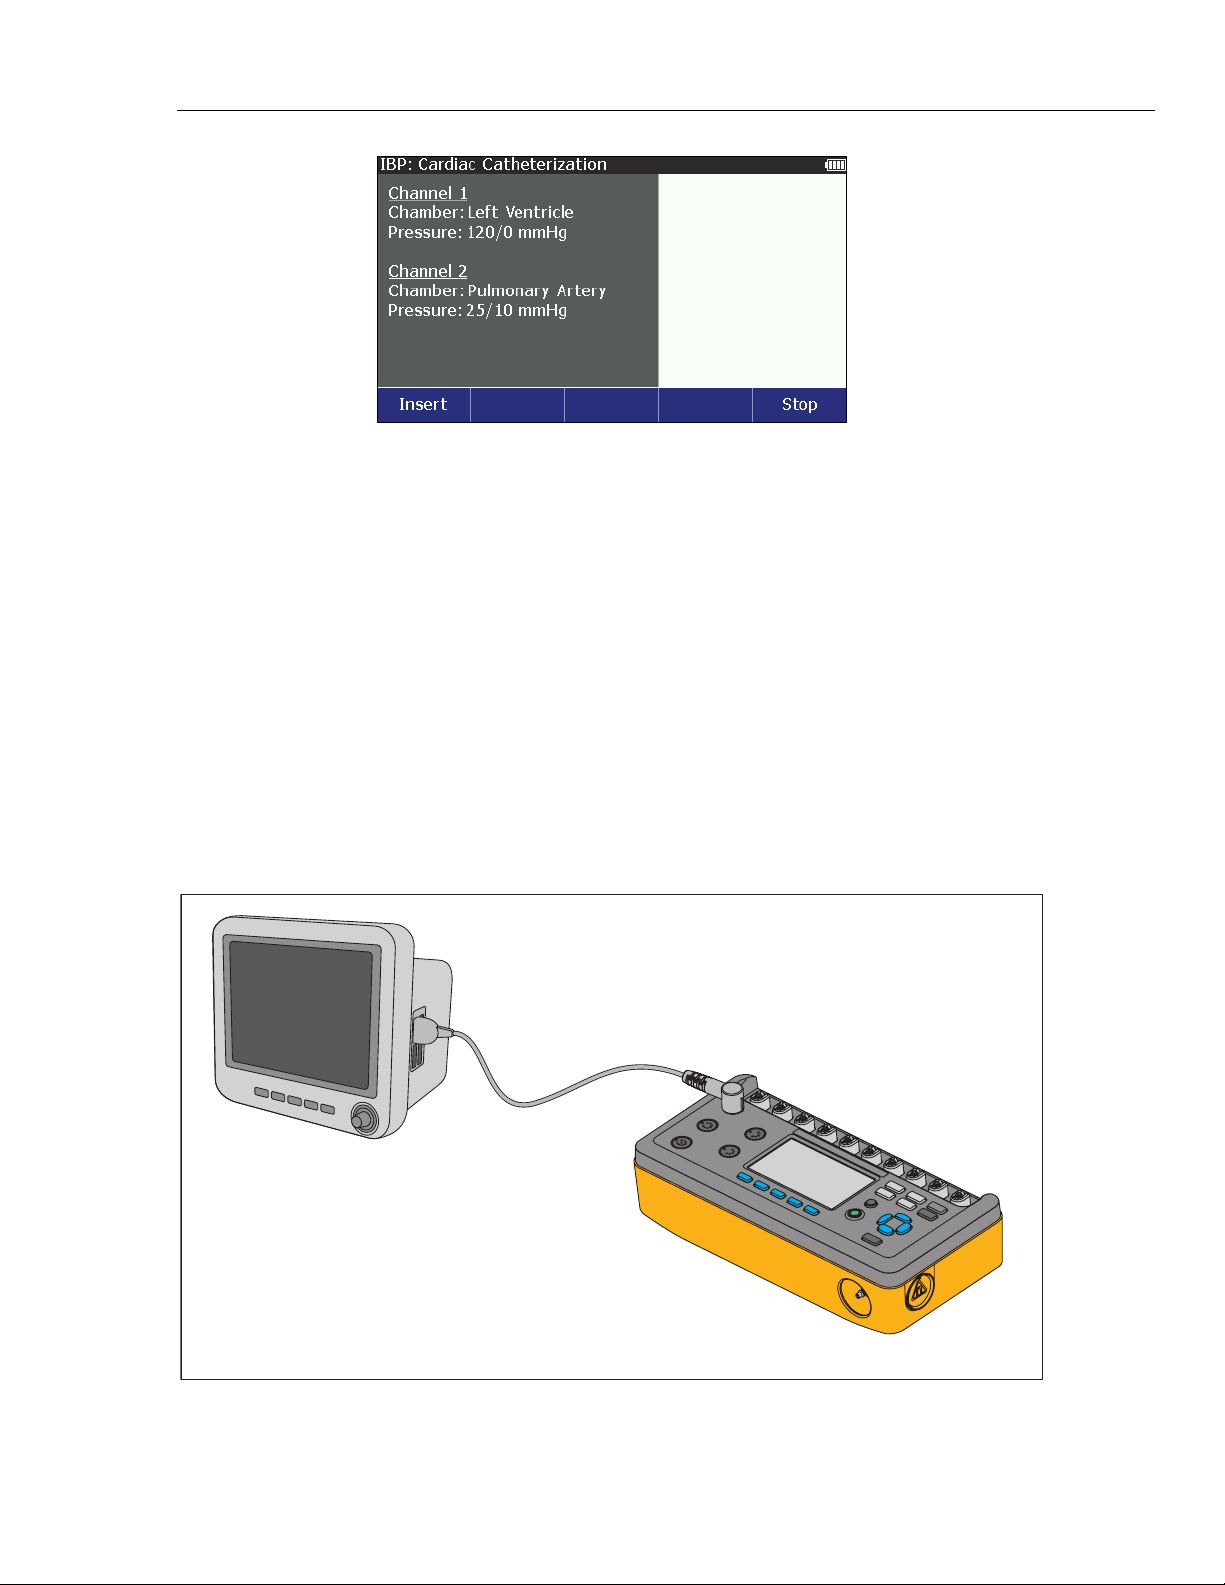
Vital Signs Simulator
How to Simulate Temperature
Figure 25. Mitral Valve Catheterization Simulation Screen
For a normal valve, the PAW pressure stays low because there is little back pressure
from the left ventricle through the left atrium and the lungs.
2. Push the Increase Pressure or Decrease Pressure to simulate a bad mitral
valve. There are six pressure values between 10/2 and 36/24 mmHg. Each push of the
increase softkey sets the left ventricle pressure to 26/18, 29/19, 31/21, 34/22, and
36/24. Each push of the decrease softkey sets the pressure down from 36/24 to 10/2
mmHg with the same pressure steps.
3. Push the Pullback softkey to simulate the pulmonary artery wedge (PAW) balloon
deflation. This changes IBP channel 2 back to the pulmonary artery.
How to Simulate Temperature
Temperatures simulated by the Product are compatible with Yellow Springs, Inc. (YSI)
Series 400 and 700 probes. The type of cable connected to the temperature jack sets the
type of temperature probe simulated. Connect the temperature input of the UUT to the
Temperature jack as shown in Figure 26.
glh056.bmp
Patient
Monitor
Temperature
Cable
Figure 26. Temperature Simulation Connection
ProSim 8
glh038.eps
35
Page 48

ProSim 6/8
Users Manual
How to Simulate Respiration
To set the simulated temperature:
1. Push .
2. Push , , , or to highlight the Temperature selection then push to
show the set temperature in the display.
3. Push .
4. Push or to change the temperature in 0.5 °C steps between 30.0 and 42.0 °C.
Note
When you hold down the direction key, the step size will change to 1.0
°
C
until the key is released.
5. Push to set the temperature and go back to the Temperature screen.
Respiration variables are set through the special functions. To set respiration:
1. Push .
2. Push , , , or to highlight Respiration.
3. Push . The Respiration screen in Figure 27, shows in the display.
Figure 27. Respiration Screen
glh013.bmp
You can choose between a normal or ventilated respiration waveform and change the
respiration rate. The respiration signal can be set to the left arm (LA) or left leg (LL)
ECG lead. The baseline impedance between the leads and the amplitude of impedance
variation (respiration amplitude) are set though the front panel as well. To set respiration
between normal and ventilated:
1. Push or to highlight the Wave value.
2. Push .
3. Push or to highlight Normal or Ventilated.
36
4. Push to set the wave and go back to the Respiration screen.
To set the respiration rate:
1. Push or to highlight the Rate value.
2. Push .
3. Push or to increase or decrease the rate of respiration in 1 brpm steps between
10 and 150 brpm.
4. Push to set the respiration rate and go back to the Respiration screen.
Page 49

Vital Signs Simulator
How to Simulate Respiration
To set the respiration ratio:
1. Push or to highlight the Ratio value.
2. Push .
3. Push or to highlight 1:1, 1:2, 1:3, 1:4, or 1:5.
4. Push to set the respiration ratio and go back to the Respiration screen.
To set the respiration amplitude:
1. Push or to highlight the Amplitude value.
2. Push .
3. Push or to change the amplitude in 0.05 Ω steps between 0.00 and 5.00 Ω.
4. Push to set the amplitude and go back to the Respiration screen.
To set the baseline resistance:
1. Push or to highlight the Baseline value.
2. Push .
3. Push or to highlight 500, 1000, 1500, or 2000 Ω
4. Push to set the baseline impedance and go back to the Respiration screen.
The baseline impedance is kept in memory and is non-volatile.
Baseline value is kept in memory and is non-volatile.
To set the respiration lead:
1. Push or to highlight the Respiration lead.
2. Push .
3. Push or to highlight LA or LL in the list.
4. Push to set the respiration lead and go back to the Respiration screen. The
respiration lead is kept in memory and is non-volatile.
Respiration lead value is kept in memory and is non-volatile.
How to Set Apnea Simulation
You can simulate an apnea period manually or for a specified time period. To control an
apnea period manually, push the Continuous Apnea softkey from the respiration
screen. The display shows a timer which shows the time since the apnea period started.
The respiration simulation is stopped when the Stop softkey is pushed.
To do a timed apnea period:
in the list.
Note
Note
1. Push the Timed Apnea softkey from the respiration screen.
2. Push or to highlight 12, 22, or 32 seconds.
3. Push .
The display shows a timer that counts down the apnea period. When the timer counts
down to zero, the apnea period ends and the display shows the respiration screen. Push
the Stop softkey to abort the apnea function.
37
Page 50

ProSim 6/8
Users Manual
How to Simulate Cardiac Output
The Cardiac Output function electronically simulates the dynamic temperature changes in
the blood of the patient during a thermal dilution cardiac output measurement.
Thermal dilution cardiac output measurements are given by the heat interchange between
the blood of the patient and a known volume of chilled saline put into the heart. Cardiac
output is expressed in liters per minute (L/min) and ranges between 3 L/min and 7 L/min
in normal adults.
Current cardiac output measurement devices can make sure you get the most accurate
measurements. This includes an average of a series of measurements to prevent variations
because of artifacts. This rejects measurements because of clinician technique or the
underlying cardiovascular disease in a patient.
Note
Cardiac output measurement devices that use different techniques (such as
Fick dye injection, Doppler ultrasonography and bioimpedance) are not
addressed or intended for this Product.
To simulate cardiac output, a CI-3 module/jack is necessary and connects to the cardiac
output jack of the Product. This module has connections for the cardiac output
measurement under test and simulates the injectate temperature (IT) thermistors at 0 °C
or 24 °C. Of the two connectors on the CI-3 module/cable, the smaller 3-pin connector is
for catheter blood temperature (BT) and is standard on most monitors.
Note
This 3-pin catheter BT connector is compatible with the standard Baxter
(Edwards) BT catheter and equivalent catheters available from other
manufacturers such as Viggo-SpectraMed and Abbott (Sorenson).
The larger 4-pin connector supplies the simulated injectate temperature. The 10-turn
100 kΩ potentiometer enables adjustment of the injectate temperature to 0 or 24 °C.
Although this 100 kΩ range of resistance has proven adequate to simulate the 0 or 24 °C
temperature for most brands of cardiac output measurement devices, the 4-pin IT
thermistors connector is not standard on all monitors. A general function connector that
you can connect to the device under test (DUT) injectate cable is also supplied.
Figure 28 shows the general-purpose connector assembly. Note that the injectate
temperature thermistor has to be cut off the EUT cable to install the general-purpose
connector.
Note
A DUT cardiac output cable changed for this test must not be used in a
clinical application.
If the DUT cardiac output cable includes an interconnection (or plug-in) for the injectate
temperature bath probe assembly, change the plug-in cable only.
38
Page 51

Vital Signs Simulator
How to Simulate Cardiac Output
Blood temperature (BT) connector
Injectate temperature (IT) thermistor connector
Injectate temperature (IT) 10-turn potentiometer
CI-3 module/cable
Injectate temperature (IT) thermistor connector
PIN
FUNCTION
INJECTATE THERMISTOR CONNECTION A
1
2
NO CONNECTION
3
INJECTATE THERMISTOR CONNECTION B
4
NO CONNECTION
Viewed from
the top of
the C1-3
2
1
4
3
Thermistor end of cable
ASSEMBLY of the GENERAL PURPOSE CONNECTOR
Crimp tube
Solder wires to pins 1 and 3
Pin3
Pin1
eic224.eps
Figure 28. Cardiac Output Injectate Cable Modification
Note
Fluke Biomedical offers optional adapter cables to connect the Product to
specified brands of cardiac output measurement devices.
• To examine Hewlett Packard Merlin systems, a cardiac output adapter
and a temperature adapter are necessary.
• A special adapter is necessary for Gould/SpectraMed Models SP1445
and SP1465 cardiac output devices.
Contact Fluke Biomedical for availability, price, and part number.
For cardiac output simulation, use the supplied CI-3 module/cable to connect the Product
to the DUT. (see Figure 29). If necessary, use the general-purpose connector.
39
Page 52

ProSim 6/8
Users Manual
Injectate
Temperature
Connection
Patient
Monitor
Blood
Temperature
Connection
7
0
0
4
6
0
0
5
6
ProSim 8
Cardiac Output
Adapter
Figure 29. Cardiac Output Connections
glh057.eps
Setup the DUT for the simulated parameters that follow:
• Catheter Size: 7 F
• Injectate Volume: 10 cc
• Computational Constant: 0.542 or 0.595, based on the injectate temperature.
To set the Product for a cardiac output test:
1. Push .
2. Push , , , or to highlight Cardiac Output and then push to show the
cardiac output parameters in the display. See Figure 30.
40
Figure 30. Cardiac Output Screen
Push the softkey labeled Back to go back to the Special Functions screen,
glh017.bmp
Page 53

Vital Signs Simulator
Non-Invasive Blood Pressure Simulation and Tests
How to Set the Cardiac Output Waveform
To set the cardiac output waveform:
1. In the Cardiac Output screen, use or to highlight the wave parameter.
2. Push .
3. Push or to highlight a waveform name in the list of waveforms.
Table 13 shows the cardiac output waveforms for the Product.
Table 13. Cardiac Output Waveforms
Waveform Description
2.5 L/min Normal waveform with accuracy of 2.5 L/min
5.0 L/min Normal waveform with accuracy of 5.0 L/min
10.0 L/min Normal waveform with accuracy of 10.0 L/min
Interrupted Injectable Interrupted injection waveform
LR Shunt Left to right ventricular shunt
Calibrated Pulse Calibrated square wave pulse
4. Push to set the wave and go back to the Cardiac Output screen.
How to Set the Baseline Temperature
To set the baseline temperature:
1. In the cardiac output screen, if not already highlighted, use or to highlight the
baseline temperature value.
2. Push .
3. Push or to highlight 36 °C, 37 °C, or 38 °C.
4. Push to set the baseline temperature and go back to the Cardiac Output
screen.
How to Set Injectate Temperature
To set the injectate temperature:
1. In the cardiac output screen, use or to highlight the injectate temperature value.
2. Push .
3. Push or to highlight 0 °C or 24 °C.
4. Push to set the temperature and go back to the Cardiac Output screen.
As you change the injectate temperature, the calibration coefficient necessary for the
monitor is shown in the display.
How to Start a Cardiac Output Simulation
After you set the parameters for a cardiac output simulation, push the Start softkey. The
simulation completes automatically. To stop the simulation, push the Stop softkey.
Non-Invasive Blood Pressure Simulation and Tests
The Product simulates blood pressure for Non-Invasive blood pressure monitors. Each
blood pressure variable can be set through the front-panel controls. The Product also does
leak, pressure source, and pressure relief tests. The manometer function sets the Product
to measure static pressure and shows the pressure in the display.
41
Page 54

ProSim 6/8
Users Manual
How to Set the Non-Invasive Blood Pressure Variables
For non-invasive blood pressure tests, connect the Product to the BP cuff and monitor as
shown in Figure 31.
ProSim 8
Must be connected closer
to the cuff than monitor.
Patient
Monitor
Mandrel
Blood Pressure Cuff
Wraps around mandrel.
Dual hose system: connect Cuff Adapter to
hose marked “Sense”. If both hoses are
unmarked, connect Cuff Adapter to either
hose.
Figure 31. Non-Invasive Blood Pressure Test Connections
There are two blood pressure cuff mandrels that are used with the Product: Adult and
Neonatal. Figure 32 shows the parts of an adult mandrel and how to assemble it for
different sizes.
glh031.eps
Adult Cuff Mandrel Sizes
Large Adult
Use 2 end blocks and
3 spacer blocks
Adult
Use 2 end blocks and
2 spacer blocks
Small Adult
Use 2 end blocks and
1 spacer blocks
Child
Use 2 end blocks and
no spacer blocks
Figure 32. Adjustments for Adult Blood Pressure Cuff Mandrel
fcv011.eps
42
Page 55
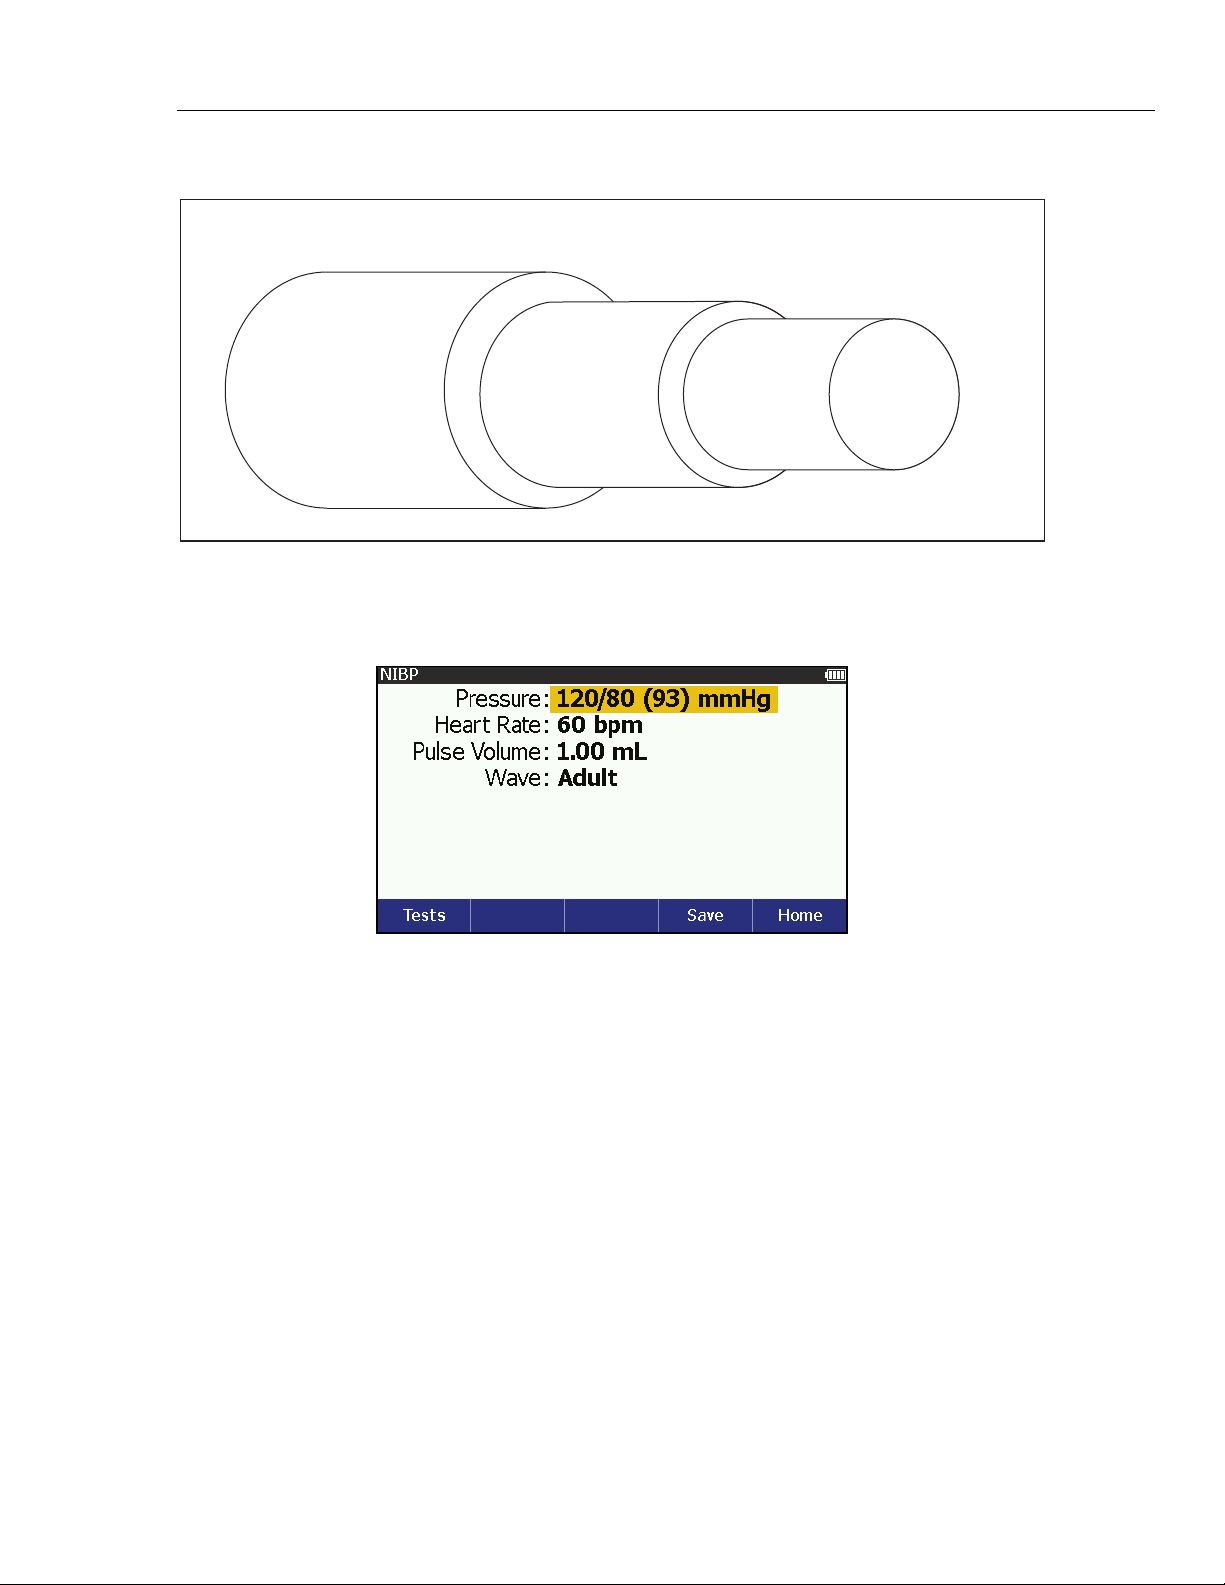
Vital Signs Simulator
Non-Invasive Blood Pressure Simulation and Tests
Figure 33 shows the neonatal blood pressure cuff mandrel.
Large
Medium
Small
fcv012.eps
Figure 33. Neonatal Blood Pressure Cuff Mandrel
To set the blood pressure simulation, push to show the NIBP screen in Figure 34 in
the display.
Figure 34. Non-Invasive Blood Pressure Screen
Pressure, heart rate, pulse volume, brand, and wave are set through the front-panel
controls to simulate different patient conditions. Arrhythmia waveforms are also
simulated in the NIBP simulation (set through ECG). To set the Blood Pressure:
1. Push or to highlight the Pressure variable.
2. Push .
Systolic and diastolic pressures are set separately.
3. Push or to highlight the systolic or diastolic pressure value.
4. Push or to increase or decrease the pressure value in 1 mmHg steps.
Note
When you hold down the direction key, the step size will change to
10 mmHg until the key is released.
5. Push to set the pressure and go back to the NIBP screen.
glh003.bmp
43
Page 56

ProSim 6/8
Users Manual
Note
Heart Rate may not be shown in the NIBP screen if an arrhythmia or
performance waveform is set.
To set the heart rate:
1. Push or to highlight the Heart Rate variable.
2. Push .
3. Push or to increase or decrease the heart rate in 1 bpm steps. The range is 30 to
240 bpm.
Note
When you hold down the direction key, the step size will change to 10 bpm
until the key is released.
4. Push to set the heart rate and go back to the NIBP screen.
Note
Arrhythmia may show in the display instead of Heart Rate when an
arrhythmia or performance waveform is set under the ECG function. The
Mono VTach waveform is the one exception. You can only change the heart
beat to normal sinus rhythm in the NIBP screen.
To set the heart beat waveform to normal sinus rhythm:
1. Push or to highlight the Arrhythmia variable.
2. Push .
3. Push or to increase or decrease the heart rate.
4. Push to set the heart rate and go back to the NIBP screen.
To set the pulse volume:
1. Push or to highlight the Pulse Volume variable.
2. Push .
3. Push or to increase or decrease the pulse volume in 0.05 mL steps. The pulse
volume range is 0.10 to 1.25 mL.
4. Push
to set the pulse volume and go back to the NIBP screen.
You can set the wave variable to Adult or Neonatal simulation. When set, the pulse
volume is set to the default for that simulation: 1.0 ml for Adult, 0.5 ml for Neonatal.
Afterwards, the pulse volume can be changed with its own control (see above). To set the
wave variable:
1. Push or to highlight the Wave variable.
2. Push .
3. Push or to highlight Adult or Neonatal.
44
4. Push to set the wave and go back to the NIBP screen.
When the NIBP monitor starts the blood pressure measurement cycle, the Product keeps
the measured parameters of the measurement cycle. If the NIBP screen is shown in the
display when the measurement cycle starts, a graph of pressure versus time shows in the
display. See Figure 35.
Page 57

Vital Signs Simulator
Non-Invasive Blood Pressure Simulation and Tests
Figure 35. Blood Pressure Measurement Graph
The Summary and Graph softkeys show in the NIBP screen after you do an
NIBP simulation.
To see the measured parameters of the last blood pressure measurement cycle, push the
Summary softkey in the NIBP screen. To see the graph of the last NIBP simulation,
push the Graph softkey in the NIBP screen,
How to Do an NIBP Monitor Test
To do an accuracy test on an NIBP monitor:
1. Connect the NIBP monitor to the Product as shown in Figure 37.
2. Start an NIBP pressure cycle on the monitor. Refer to the monitor manual as
necessary. After you start the blood pressure measurement cycle:
• The blood pressure cuff inflates around the mandrel.
• The Product starts the peripheral pulse simulation and shows the blood pressure
measurement graph in the display.
The graph shows in the display automatically only when the blood pressure
measurement cycle starts when the NIBP screen shows in the display.
Note
Note
glh005.bmp
• The Product starts blood pressure simulation when the pressure is 10 mmHg.
Heart beat simulation starts when the pressure equals the diastolic pressure set
into the Product.
• The Product stops the simulation when the pressure is 2 mmHg or below.
• The NIBP monitor interprets and shows the measured blood pressure values and
heart rate when the test stops.
3. Push the Summary softkey to show the blood pressure measurements in Figure 36
in the display.
45
Page 58

ProSim 6/8
Users Manual
Figure 36. NIBP Summary Screen
4. Compare the NIBP monitor values with the target values shown in the Product
display.
How to Do a Pressure Leak Test
The leak test measures leaks in a non-invasive blood pressure monitor, the hoses
connected to the monitor, and the pressure cuff.
Before you do a pressure leak test on a monitor, do the pressure leak test
without the monitor to identify the leak rate of the Product. Use this leak
rate to offset the rate of the full system with the monitor connected.
Put the NIBP monitor in “calibrate” or “service” mode to close the vent
valve, so the Product can inflate the pneumatic system. Refer to the service
manual for the NIBP monitor.
Connect the Product to the monitor and cuff as shown in Figure 37.
Blood Pressure Cuff
Wraps around mandrel.
Note
Note
ProSim 8
glh053.bmp
46
Patient
Monitor
Mandrel
Figure 37. Pressure Leak Test Connections
Must be connected closer
to the cuff than monitor.
Dual hose system: connect Cuff Adapter to
hose marked “Sense”. If both hoses are
unmarked, connect Cuff Adapter to either
hose.
glh008.bmp
Page 59

Vital Signs Simulator
Non-Invasive Blood Pressure Simulation and Tests
Note
If the NIBP device has an internal system leak test or one that vents the cuff
inflation pneumatic circuit to the atmosphere when idle, do not use the Leak
Test. Rather, do a Manometer check to test for internal system leaks. Refer
to the NIBP monitor operators manual for the recommended test protocol.
To perform a leak test:
1. Push to show the NIBP screen.
2. Push the Tests softkey.
3. Push or to highlight Leak Test.
4. Push to show the NIBP: Leak Test screen in Figure 38 in the display.
Figure 38. Leak Test Screen
The default target pressure is 300 mmHg. The target pressure can be set between 20
and 400 mmHg. To change the target pressure, push or to increase or decrease
the pressure value in 1 mmHg steps.
Note
When you hold down the direction key, the step size will change to
10 mmHg until the key is released.
5. Push the Start softkey to start the leak test.
The Product pressurizes the pneumatic system to the target pressure. While the
Product pumps air into the pneumatic system, the pressure and a graph of the
pressure is shown in the display. See Figure 39.
glh024.bmp
Figure 39. Leak Test Pumping Screen
glh006.bmp
47
Page 60

ProSim 6/8
Users Manual
The pump stops when the measured pressure is the same as the target pressure. The
Product waits for a time to let the pressure to become stable. Then the Product starts
to measure and monitor the pressure for the test period.
When the test is done, the test results are shown in the display. An example pressure
test result is shown in Figure 40.
Figure 40. Example Leak Test Result Screen
To set how long the test will run:
1. Push the Test Duration softkey.
2. Push or to adjust the time between 30 seconds and 5 minutes in 30 second
steps. The default time is 1 minute.
3. Push to set the test duration and go back to the NIBP: Leak Test screen.
How to Do a Pressure Relief Test
The pressure relief test pressurizes a pneumatic system until the Product senses a drop in
pressure, as occurs when the relief valve opens. Or the test stops if the pressure gets to
the target pressure and no relief is sensed.
Put the NIBP monitor in “calibrate” or “service” mode to close the vent
valve, so the Product can inflate the pneumatic system. Refer to the service
manual for the NIBP monitor.
To test the relief valve:
1. From the NIBP screen, push the Tests softkey.
2. Push or to highlight Pressure Relief Test.
Note
glh007.bmp
48
3. Push .
4. Push or to increase or decrease the target pressure between 100 and 400 mmHg
in 1 mmHg steps.
Note
When you hold down the direction key, the step size will change to
10 mmHg until the key is released.
5. Push the Start softkey to begin the test.
The Product pressurizes the pneumatic system to the target pressure with the pressure
measurement and a graph of the pressure shown in the display. See Figure 39. When the
Product senses the pressure valve has opened, the test stops and the results are shown in
the display. See Figure 41. It is recommended you do three pressure relief tests in case
the relief valve is intermittent.
Page 61
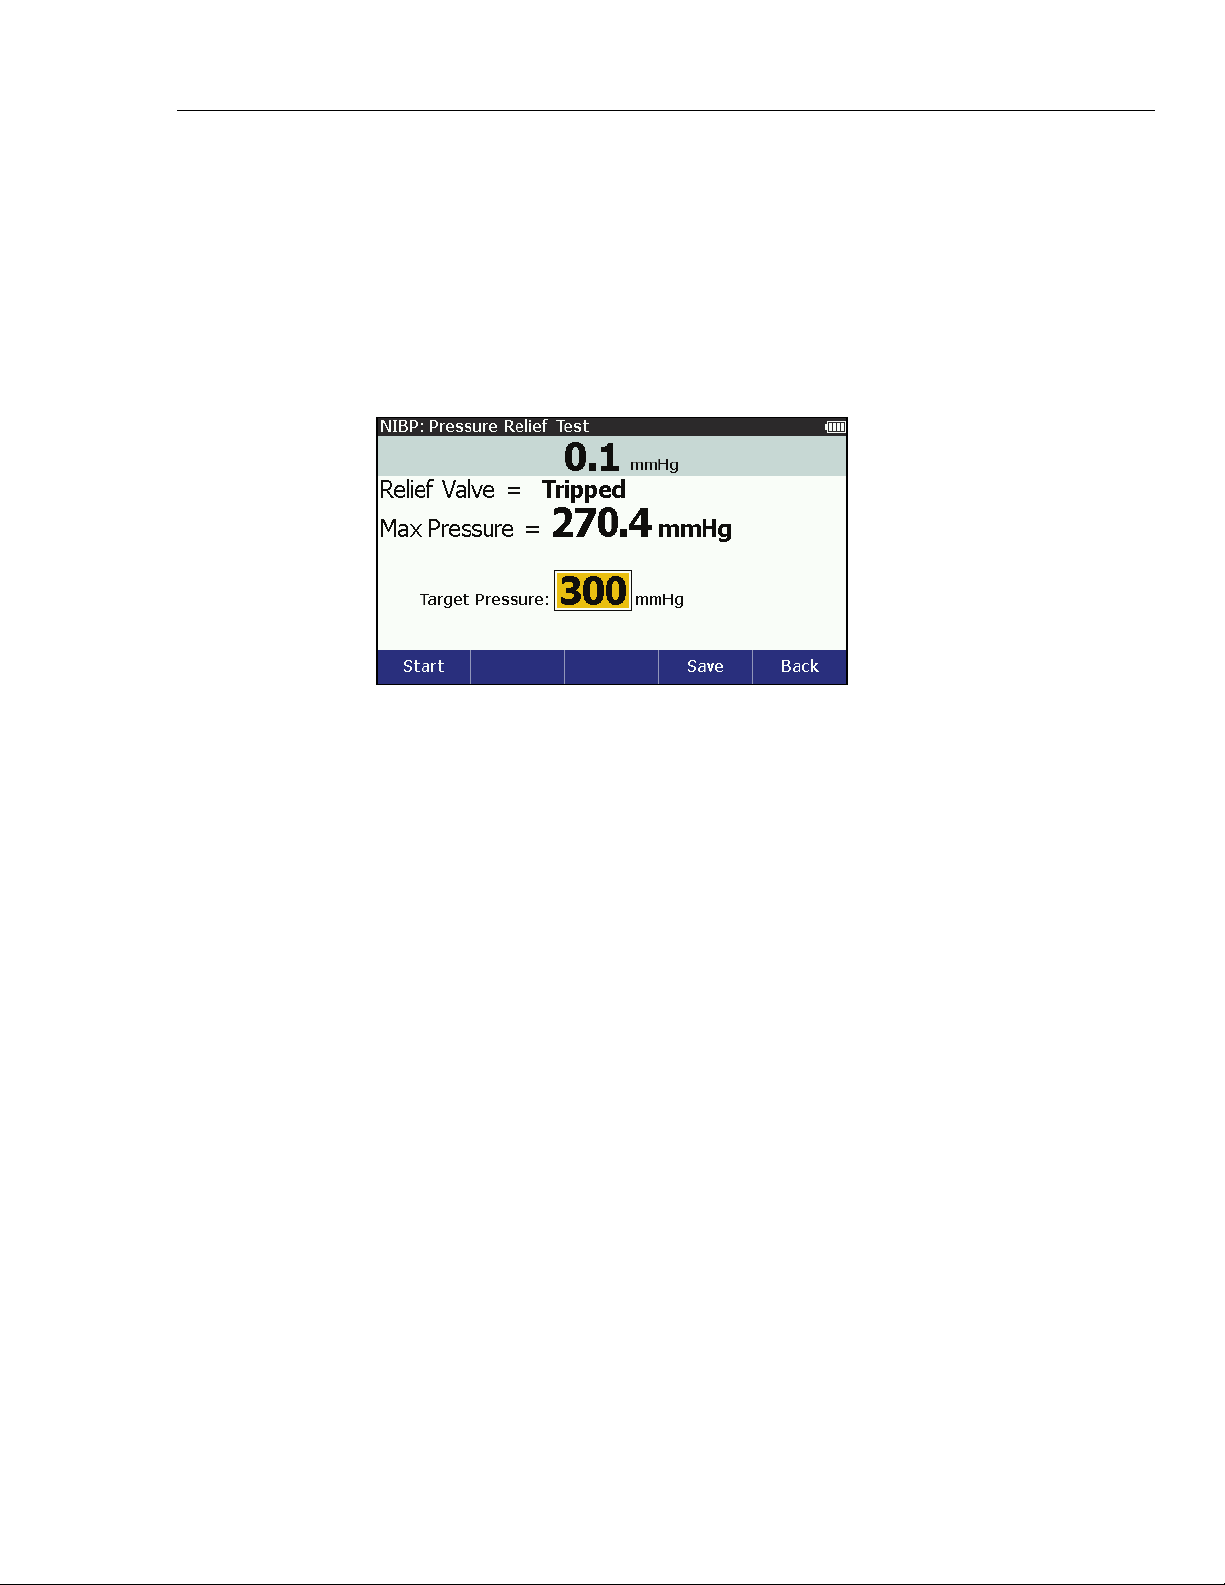
Vital Signs Simulator
Non-Invasive Blood Pressure Simulation and Tests
If there is no drop in pressure and the pressure climbs to the target pressure, the pump
stops and Not Tripped shows in the display.
Note
Some NIPB monitors do not let you access a “Service” mode. If you can
not close the vent valve, the system can not be pressurized by an external
pump. It is possible to start a blood pressure measurement with the monitor
(this closes the valve), then start the Pressure Relief tests, so that two
pumps inflate the system. The results can change, but the monitor usually
opens a relief valve at some high pressure.
Figure 41. Pressure Relief Valve Test Results Screen
See the How to Save Test Results section to learn more on how to save your test results
data.
How to Do a Pressure Source Test
The pressure source test is used to pressurize a pneumatic system while it measures the
pressure. This can be used for static calibration of non-invasive blood pressure
measurement systems, sphygmomanometer checks, and other devices that measure
pressure.
To do a pressure source test:
1. Connect the pressure port to pressure system as shown in Figure 42.
glh008.bmp
49
Page 62

ProSim 6/8
Users Manual
ProSim 8
Blood Pressure
Gauge
Blood Pressure Cuff
Wraps around mandrel.
Figure 42. Pressure Source Connection
Mandrel
glh051.eps
2. From the NIBP screen, push the Tests softkey.
3. Push or to highlight Pressure Source.
4. Push .
5. Push or to increase or decrease the target pressure between 20 and 400 mmHg
in 1 mmHg steps.
50
Note
When you hold down the direction key, the step size will change to
10 mmHg until the key is released.
6. Push the Start softkey to begin the test.
The Product pressurizes the pneumatic system to the target pressure. While the Product
pumps air into the pneumatic system, the pressure measurement and a graph of the
pressure is shown in the display. See Figure 43.
Figure 43. Pressure Source Pumping Screen
glh010.bmp
Page 63

Vital Signs Simulator
Non-Invasive Blood Pressure Simulation and Tests
Push the Stop softkey to stop the test. This will cause a Vent softkey to show in the
display. The pressure will remain at the level it was when the Stop softkey was pushed.
Either push the Vent softkey to vent the pressure system or change the pressure and push
the Start softkey to do another test.
How to Check a Manometer
The manometer function sets the Product up as a pressure gauge to measure pressure
supplied by an external source.
To measure pressure:
1. Connect the pressure port to a pneumatic system as shown in Figure 44.
ProSim 8
Blood Pressure
Gauge
Squeeze
Pressure Pump
Figure 44. Manometer Connections
2. From the NIBP screen, push the Tests softkey.
3. Push or to highlight Manometer.
4. Push .
The digital pressure screen in Figure 45 is shown in the display.
glh050.eps
Figure 45. Manometer Screen
glh011.bmp
As the external generator increases the pressure, the digital and analog pressure values in
the display shows the current pressure.
51
Page 64

ProSim 6/8
Users Manual
Oximeter SpO2 Optical Emitter and Detector
The subject device provides Oximeter SpO2 optical emitter and detector capability,
which is solely intended to generate an optical signal to verify that the electronics within
the pulse oximeter probe are functional. The subject device presents pulse oximeter
equipment with a signal having a predictable value of ratio so that the operator can
observe the resulting displayed value of SpO2, and compare it to the expected value
derived from the calibration curve for that particular pulse oximeter equipment.
W Warning
The pulse oximeter component of the device is not intended to
validate the SpO2 accuracy of pulse oximeter equipment.
The pulse oximeter component of this device is not intended to
confirm the SpO2 accuracy of the calibration curve of the pulse
oximeter monitor or to assess the optical characteristics of
representative pulse oximeter probes to determine their proper
calibration.
Not all functional testers and pulse oximeter equipment are
compatible. Functional testers can vary in pulse methods, pulse
contours, and amplitude. A functional tester might not
accurately reproduce the calibration of the pulse oximeter
equipment and can yield different results between pulse
oximeter equipment.
Note
When the Type value is set to Masimo Rainbow, there will be more SpO2
parameters shown in the display than other types of sensors. See the How to
Test a Masimo Rainbow SpO2 section to learn about these parameters.
To set oximeter SpO2 optical emitter and detector parameters, push to show the
screen in Figure 46 in the display.
Figure 46. Oximeter SpO2 Optical Emitter and Detector Screen
glh018.bmp
52
Page 65

Vital Signs Simulator
Oximeter SpO2 Optical Emitter and Detector
Connect the SpO2 artificial finger to the SpO2 jack on the front panel as shown in
Figure 47.
ProSim 8
Pulse
Oximeter
ProSim
Oximeter SpO
Emitter and Detector
Optical
2
Sensor
SpO
Cable
2
Figure 47. Oximeter SpO2 Optical Emitter and Detector Connections
Note
When you put the oximeter sensor on the artificial finger, make sure the red
LEDs (light emitting diodes) are on the bottom.
Patient
Monitor
glh029.eps
Put the SpO2 sensor on the artificial finger as shown in Figure 48. Place the sensor with
the LEDs on the bottom of the artificial finger. While you put the sensor on the artifical
finger, monitor the signal indicator along the bottom of the Product display. Adjust the
sensor on the finger for maximum signal strength.
53
Page 66

ProSim 6/8
Users Manual
ProSim 8
F1 F2
F3 F4 F5
ENTER
ProSim
Oximeter SpO
Optical
2
Emitter and Detector
Adjust finger on the display for maximum signal.
To
Patient
Monitor
SpO
2
Pulse
Oximeter
Sensor
Cable
54
Figure 48. SpO2 Sensor Placement
Attach the artificial finger to the magnetic holder on the right side of the Product as
shown in Figure 49.
glh048.eps
Page 67

Vital Signs Simulator
Oximeter SpO2 Optical Emitter and Detector
ProSim 8
SpO
Finger Module
2
Figure 49. Magnetic Holder for SpO2 Artificial Finger
How to Set the SpO2 Parameters
You can raise or lower the degree of oxygen saturation. To change the SpO2 value:
1. Push or to highlight the SpO2 value.
2. Push .
3. Push or to increase or decrease the SpO2 value in 1 % steps between 30 and
100 %.
4. Push to set that SpO2 value and go back to the SpO2 screen.
To change the pulse amplitude value:
1. Push or to highlight the Pulse Amplitude value.
2. Push .
3. Push or to change the pulse amplitude value between 0 and 20 %. Each push of
a key changes the value 0.01 % between 0 and 1 % in the direction of the key pushed.
The value changes 0.1 % between 1 and 10 %. The value changes 1 % between 10
and 20 %.
4. Push to set the pulse amplitude value and go back to the SpO2 screen.
To change the transmission value:
glh045.eps
1. From the SpO2 screen, push or to highlight the Transmission value.
2. Push .
3. Push or to highlight Dark, Thick Finger, Medium Finger, Light, Thin
Finger, and Neonatal Foot.
4. Push to set that transmission value and go back to the SpO2 screen.
55
Page 68

ProSim 6/8
Users Manual
You can change the simulated heart rate of the Product from the SpO2 screen. To change
the heart rate:
1. Push or to highlight the Heart Rate value.
2. Push .
3. Push or to adjust the heart rate. Each push of a key moves the heart rate one
beat in the direction of the key pushed. The range is 10 to 300 beats/minute (BPM).
4. Push to go back to the SpO2 screen.
To change SpO2 respiration:
1. From the SpO2 screen, push the or to highlight the Respiration value.
2. Push .
3. Push or to highlight 1%, 2%, 3%, 4%, 5% or off.
4. Push to set the respiration and go back to the SpO2 screen.
You can test SpO2 under different ambient light conditions. To change the ambient light
value:
1. From the SpO2 screen, push the or to highlight the Ambient Light value.
2. Push .
3. Push or to highlight an ambient light value. Below is the list of ambient light
values in the Product.
Sunlight Indoor – 4 kHz
Indoor – DC Indoor – 5 kHz
Indoor – 50 Hz Indoor – 6 kHz
Indoor – 60 Hz Indoor – 7 kHz
Indoor – 1 kHz Indoor – 8 kHz
Indoor – 2 kHz Indoor – 9 kHz
Indoor – 3 kHz Indoor – 10 kHz
4. Push to go back to the SpO2 screen with the new ambient light value.
The manufacturer must be known before you do a pulse oximeter test, optically through
an artificial finger. For Masimo, you need to know if the sensor is a 2 wavelength or
Rainbow sensor. You can configure the Product for the make of pulse oximeter(s) used
for the test. You change variables for each of the pulse oximeters through the type
variable. To change the oximeter sensor type:
1. From the SpO2 screen, push the or to highlight the Type value.
2. Push .
56
Page 69

Vital Signs Simulator
Oximeter SpO2 Optical Emitter and Detector
3. Push or to highlight a type value in the list. Below is the list of types in the
Product.
Nellcor Philips
Masimo Hihon Khoden
Masimo Rainbow Mindray
Nonin BCI
GE/Ohmeda
4. Push to set the type value and go back to the SpO2 screen.
To test other manufacturer types of oximeters, you must download R-Curve data into the
Product through the USB Port. Oximeter R-Curve design and data download is done
through the Ansur functionality.
How to Test a Masimo Rainbow SpO2
When you set the SpO2 type parameter to Masimo Rainbow, you must connect the
Product to the monitor with the optional SpO2 Masimo Rainbow cable. See the Optional
Accessories table for a part number. The SpO2 screen shows three more parameters than
what is shown for other types of sensors: SpMet, SpCO, and SpHb.
SpMet, SpCO, and SpHb can not be set through the Product. The special Masimo
Rainbow cable sets them based on the measured SpO2 percent. At 100 %, SpMet = 0 %,
SpCO = 0 %, and SpHb = 25 g/dl. A -1 % change in SpO2 changes SpMet +0.3 %, SpCO
by +0.7 %, and SpHb by -0.5 %. SpHb does not change for values of SpO2 above 90 %.
The ProSim 8 tests Masimo Rainbow technology with an optional adapter
supplied by Masimo that allows the ProSim two-wavelength to test the
Rainbow multiple wavelength system.
Since a special Masimo testing sensor is required to connect the ProSim 8
to Masimo Rainbow Oximeter, the ProSim 8 only validates performance of
Oximeter, not the Masimo Rainbow sensor (the SpHb, SpCO and SpMet
values from the Masimo technology are generated based on the SpO2 value
provided to the test sensor and are not able to be changed independently).
How to Perform an Oximeter Limits Test
Most oximeters have alarms that can be set for the parameters it measures. The Product
can be used to trip the alarm as a test. Connect the Oximeter to the Product as shown in
Figure 47.
Oxygen Limits Test
You do a sensitivity test on an oximeter through SpO2 value adjustments. To do an
oxygen limits test:
Note
Note
1. Set the oxygen alarm limit value(s) on the oximeter.
2. From the SpO2 screen, push or to highlight the SpO2 value.
3. Push .
4. Push to increase the oxygen saturation until the oximeter alarm sounds.
5. Push to decrease the oxygen saturation until the oximeter alarm sounds.
57
Page 70

ProSim 6/8
Users Manual
Pulse Rate Test
Pulse Amplitude Test
You can simulate different patient conditions while you monitor the effect of different
pulse rates on the SpO2 measurement. To do a pulse rate test:
1. Set the pulse rate alarm limit value(s) on the oximeter.
2. From the SpO2 screen, push or to highlight the Heart Rate value.
3. Push .
4. Push to increase the heart rate until the alarm sounds.
5. Push to decrease the heart rate until the alarm sounds.
You can decrease the heart rate to 0 bpm to simulate asystole or no pulse.
The peak-to-peak amplitude of the blood pressure wave tested by the Product can be
increased or decreased. You can decrease the amplitude to find where the oximeter fails
to sense a pulse. To do a pulse amplitude test:
1. From the SpO2 screen, push or to highlight the Pulse Amplitude value.
2. Push .
3. Push to decrease the pulse amplitude value until the oximeter no longer shows a
pulse or the oximeter alarm sounds.
Autosequences
Autosequences are a series of steps that change the output of the Product automatically.
For example, to do a temperature test on a monitor, you must change the temperature of
the temperature simulation a number of times for a specified time period. To do this
manually, you can go to the temperature function, push and then push or to
change the temperature and then push again. After some time period, you do these
same steps for the subsequent temperature change. The Temperature autosequence does
these changes for you automatically. Each step of the temperature autosequence sets the
temperature and after the allotted time period, it does the subsequent step.
Table 14 is a list of autosequences that are built into the Product.
Table 14. Autosequences
Autosequence Sequence Steps Run Time
ECG 200 BPM, IBP1 (Arterial, 200/150), IBP2 (PA,
45/25), SpO2 100 %, NIBP 200/150, Respiration 80
brpm and Temperature 42 °C
ECG 80 BPM, IBP1 (Arterial, 120/80), IBP2 (PA, 28/15),
Monitor Testing
SpO2 97 %, NIBP 120/80, Respiration 20 brpm and
Temperature 37 °C
01:30
01:30
58
ECG 30 BPM, IBP1 (Arterial, 60/30), IBP2 (PA, 20/10),
SpO2 85 %, NIBP 60/30, Respiration 10 brpm and
Temperature 32 °C
STOP Total Time 04:30
01:30
Page 71

Vital Signs Simulator
Autosequences
Table 14. Autosequences (cont.)
Autosequence Sequence Steps Run Time
ECG 80 bpm, IBP1 120/80 (Art), IBP2 120/0 (LV), SpO2
Medical Training
98 %, NIBP 120/80, Respiration 20 brpm, and
Temperature 37 °C
ECG 120 bpm, IBP1 250/150 (Art), IBP2 200/0 (LV),
SpO2 85 %, NIBP 200/150, Respiration 60 brpm, and
Temperature 40 °C
ECG 30 bpm, IBP1 60/30 (Art), IBP2 60/0 (LV), SpO2
50 %, NIBP 60/30, Respiration 10 brpm, and
Temperature 34 °C
REPEAT Total Time 03:00
01:00
01:00
01:00
Oximeter Testing
SpO2 100 %, Pulse Amplitude 20 %, Transmissivity:
normal adult, heart rate 60BPM
SpO2 95 %, Pulse Amplitude 15 %, Transmissivity:
normal adult, heart rate 60BPM
SpO2 90 %, Pulse Amplitude 10 %, Transmissivity:
dark/thick adult, heart rate 120BPM
SpO2 85 %, Pulse Amplitude 7 %, Transmissivity:
dark/thick adult, heart rate 30BPM
SpO2 84 %, Pulse Amplitude 5 %, Transmissivity:
normal adult, heart rate 60BPM
SpO2 83 %, Pulse Amplitude 4 %, Transmissivity:
normal adult, heart rate 60BPM
SpO2 82 %, Pulse Amplitude 3 %, Transmissivity:
dark/thick adult, heart rate 120BPM
SpO2 81 %, Pulse Amplitude 2 %, Transmissivity:
dark/thick adult, heart rate 30BPM
SpO2 80 %, Pulse Amplitude 1 %, Transmissivity:
normal adult, heart rate 60BPM
SpO2 79 %, Pulse Amplitude 0.5 %, Transmissivity:
normal adult, heart rate 60BPM
00:45
00:45
00:45
00:45
00:45
00:45
00:45
00:45
00:45
00.45
Cardiac Failure
STOP Total time 07:30
NSR (Adult) 80 BPM 00:45
Premature PVC1 Left Vent 00:30
Ventricular Mono VTach 00:30
Ventricular Ventricular Fibrillation 00:30
Ventricular Asystole 00:25
STOP Total Time 02:30
59
Page 72

ProSim 6/8
Users Manual
Table 14. Autosequences (cont.)
Autosequence Sequence Steps Run Time
NSR (Adult) 80 bpm 00:20
NSR (Adult) 120 bpm 00:20
Supraventricular Supra VTach 00:20
Ventricular Bigeminy 00:20
TV Paced Asynchornous 75 bpm 00:15
Arrhythmia Sequences
Exercise
Respiration Sequence
Ventricular Asystole 00:15
Conduction Lt Bndl Branch Block 00:15
Ventricular Run of PVCs 00:30
Supraventricular Atrial Fibrillation 00:15
Ventricular Ventricular Fibrillation 00:15
REPEAT Total Time 03:05
NSR (Adult) 50 bpm 00:30
NSR (Adult) 90 bpm 00:30
NSR (Adult) 120 bpm 00:30
NSR (Adult) 150 bpm 00:30
NSR (Adult) 90 bpm 00:30
NSR (Adult) 70 bpm 00:30
REPEAT Total Time 03:00
Respiration 110 brpm 00:30
Respiration 60 brpm 00:30
Respiration 20 brpm 00:30
60
Respiration 0 brpm 00:12
REPEAT Total Time 01:42
Waveform: Square; Rate: 2.0 Hz; Amplitude: 1.0 mV 00:05
Waveform: Sine; Rate: 0.05 Hz; Amplitude: 1.0 mV 00:05
Waveform: Sine; Rate: 0.5 Hz; Amplitude: 1.0 mV 00:05
Waveform: Sine; Rate: 1 Hz; Amplitude: 1.0 mV 00:05
Waveform; Sine; Rate: 10 Hz; Amplitude: 1.0 mV 00:05
NIBP Sequence
Waveform: Sine; Rate: 50 Hz; Amplitude: 1.0 mV 00:05
Waveform: Sine; Rate: 60 Hz; Amplitude: 1.0 mV 00:05
Waveform: Sine; Rate: 100 Hz; Amplitude: 1.0 mV 00:05
Waveform: Sine; Rate: 150 Hz; Amplitude: 1.0 mV 00:05
Waveform: Triangle; Rate: 0.125 Hz; Amplitude: 1.0 mV 00:05
Page 73

Vital Signs Simulator
Autosequences
Table 14. Autosequences (cont.)
Autosequence Sequence Steps Run Time
Waveform: Triangle; Rate: 2.0 Hz; Amplitude: 1.0 mV 00:05
NIBP Sequence (cont.)
IBP Sequence
Temperature Sequence
Waveform: Pulse; Rate: 60 bpm; Amplitude: 1.0 mV 00:05
REPEAT Total time 01:10
IBP 1: 120/80 mmHg (Art), 2: 120/0 mmHg (LV) 01:00
IBP 1: 25/0 mmHg (RV), 2: 120/80 mmHg (Art) 01:00
IBP 1: 25/10 mmHg (PA), 2: 10/2 mmHg (PAW) 01:00
REPEAT Total Time 03:00
Temperature 30.0 °C 00:20
Temperature 34.0 °C 00:20
Temperature 37.0 °C 00:20
Temperature 42.0 °C 00:20
STOP Total Time 01:20
How to View the Steps of an Autosequence
To view an autosequence:
1. Push .
2. Push , , , or to highlight Autosquences.
3. Push .
4. Push or to highlight an autosequence in the list. See Table 14.
5. Push .
The screen shown in Figure 50 is the Temperature Sequence in the autosequence list.
Figure 50. Autosequence Start Screen
glh032.eps
The details of the autosequence shows the sequence does each of the four steps and stops.
Although this example does not repeat, some autosequences do. The screen also shows
the four-step sequence will complete in 1 minute and 20 seconds.
Each sequence step is shown in the display. When there are more steps than can be
shown in one display screen, push or to go to the next or previous screen.
61
Page 74

ProSim 6/8
Users Manual
How to Do an Autosequence
To do an autosequence:
1. Push .
2. Push , , , or to highlight Autosquences.
3. Push .
4. Push or to highlight an autosequence in the list.
5. Push the Start softkey. The autosequence screen in Figure 51 shows in the display.
Figure 51. Autosequence Step Screen
The autosequence screen shows all the simulation parameters which are updated as the
Product steps through the sequence. The right part of the screen shows which step the
sequence is on and how much time is left to complete the step. The length of time left to
complete all steps of the autosequence is also shown in the display.
Push the Next softkey to abort the step and move to the subsequent step. When the
autosequence has moved to step two, a Previous softkey shows in the display. Push the
Pause softkey to pause the step. A Continue softkey shows in the display when the
auto sequence is paused. Push the Continue softkey to continue the step for the time left
when the step was paused.
To abort the autosequence, push the Stop softkey and go back to the Autosequence
view screen.
You can not change a pre-defined autosequence or rename it. But, you can use the Ansur
functionality to copy an autosequence, make changes, and then put it into the Product as a
new custom autosequence. You can change each step of the new autosequence and add
more steps as necessary.
How to Save and View Test Results (ProSim 8 only)
The data of test results can be saved in and recalled from the Product. Test results are
organized in memory first by operator ID, then by a test record ID, and then individual
test results. Figure 52 shows the memory organization of test results data.
glh033.bmp
62
Page 75

Vital Signs Simulator
How to Save and View Test Results (ProSim 8 only)
Operator: John Doe
Test Record ID: ABC123 1/20/2011
Test Results 001
Test Results 002
Test Results 003
•
•
•
Test Record ID: XYZ987 1/31/2011
Test Results 001
Test Results 002
Test Results 003
•
•
•
Figure 52. Memory Organization of Test Results
How to Make an Operator ID
Test results are kept in memory by an operator ID. To make a new operator ID:
1. Push .
2. Push or to highlight Test Record ID in the list.
Operator: Jane Doe
Test Record ID: ABC123 1/15/2011
Test Record ID: DEF456 1/15/2011
Test Results 001
Test Results 002
Test Results 003
•
•
•
Test Results 001
Test Results 002
Test Results 003
•
•
•
glh044.eps
3. Push to open the Test ID screen shown in Figure 53.
Figure 53. Operator ID Screen
glh036.bmp
4. Push the Change Operator softkey to open the change operator screen shown in
Figure 54.
63
Page 76

ProSim 6/8
Users Manual
5. Push , , , and to highlight a character for the operator ID.
6. Push to add the highlighted character to the operator ID.
7. Do steps 5 and 6 for each character in the operator ID. You can have the maximum
number of characters that fit in the test ID field in the display. If you use more of the
narrow characters like I and 1, you can have more characters in the operator ID than
when wider characters are used.
8. Push the Done softkey when you have all the characters in the operator ID.
If this is a new operator ID, the ID won’t exist until you save the first test
result.
Do these same steps when you change the operator ID to an ID that is already in memory.
After you type the ID in as it already is in memory, all saved results data are added to that
operator ID.
How to Make a Test ID
As shown in Figure 52, test results data is related to a Test Record ID. This test record ID
could identify the device under test. Some examples could be its model number, its serial
number, or its asset number. After you input the new Test ID, all results data saved after
that point is kept with that test ID until you change the test ID.
Figure 54. Change Operator ID Screen
Note
glh037.bmp
64
Note
When you type in a new test ID, the test ID that was open before is closed
and no more test results data can be added to that test ID. You can use the
same test ID name as one that is already in memory, but a date and time
stamp will always be appended to the name and its own test ID.
To make a test ID:
Note
These instructions use the setup function to make a test ID. You can also
make a test ID when a Save softkey label shows in the display. The New
Test ID softkey always shows in the display when you push the Save
softkey.
1. Push .
2. Push or to highlight Test Record ID in the list.
3. Push to open the Test ID screen.
4. Push the New Test ID softkey.
Page 77

Vital Signs Simulator
How to Save and View Test Results (ProSim 8 only)
5. Push , , , and to highlight a character for the test ID.
6. Push to add the highlighted character to the test ID.
7. Do steps 5 and 6 for each character in the test ID. You can have the maximum
number of characters that fit in the test ID field in the display. If you use more of the
narrow characters like I and 1, you can have more characters in the test ID than when
wider characters are used.
Additional characters are available when you push the Special Characters
softkey. To go back to the normal characters, push the Back Softkey.
Note
If you make a mistake, push the Back Space softkey to remove the last
character added. A Clear All softkey removes all characters in the test ID
field of the display.
8. Push the Done softkey when you have all the characters in the test ID.
How to Save Test Results
Note
Before you save test results, make sure the operator ID and test ID are set
correctly.
Each function of the Product lets you save test results data through a Save softkey. To
save test results:
Note
If the Save softkey label is not shown in the display, it means you can not
save data at this point.
1. Push the Save softkey to show the Save screen. The screen in Figure 55 is the save
screen for the temperature simulation function.
Figure 55. Save Screen
glh039.bmp
Note
The next step is valid only when the Enter Observed softkey appears in the
display.
2. To add measurements shown in the UUT display to the test results record, push the
Enter Observed softkey.
Note
If there is more than one simulation parameter, you have to highlight a
parameter and push before the next step.
65
Page 78

ProSim 6/8
Users Manual
3. Push or to set the parameter to the value observed on the UUT.
4. Push to set the observed value and show the save screen shown below in the
display.
Figure 56. Observed Results Screen
Note
If the observed value is incorrect at this point, you can push the Enter
Observed softkey and change the observed parameter.
5. Test results are saved with a Pass or Fail prefix in their label. Push the Save as
Pass or the Save as Fail softkey. The saving screen in Figure 57 shows in the
display.
Figure 57. Saving Screen
glh049.bmp
glh040.bmp
66
The three-digit number is the test result ID. Within the test ID, each saved test results
is assigned a number in sequence. When the save operation completes, the display
goes back to the screen for the function you just saved. In the case of this example,
the display goes back to the temperature screen.
How to View Test Results
To view the test results in memory:
1. Push .
2. Push , , , and to highlight View Memory.
3. Push .
Note
If no test results data is saved to memory, an error message shows in the
display when you push .
Page 79

Vital Signs Simulator
How to Save and View Test Results (ProSim 8 only)
4. Push or to highlight an operator.
5. Push .
Note
If there is only one operator, the operator list does not show in the display
and the Product skips steps 4 and 5.
6. The list of test IDs shows in the display. Figure 58 shows an example list of test IDs.
Figure 58. Test ID Screen
7. Push or to highlight a test ID record.
8. Push to show the test results data saved for the test ID. See Figure 59.
Figure 59. Test Results Screen
9. Push or to highlight a test results file.
10. Push to show the test results data shown in Figure 60.
glh041.bmp
glh042.bmp
Figure 60. Test Results Data Screen
glh043.bmp
67
Page 80

ProSim 6/8
Users Manual
How to Print Test Results
How to Delete Saved Data
With a PCL5 compatible printer connected to the USB A Controller Port, you can print a
test results record.
Note
A compatible printer must be connected to the Product before the Print
softkey appears in the view screen of a test results record.
1. Do the steps in the How to View Test Results section to show a test results record in
the display.
2. Push the Print softkey.
The data in the test results record shown in the display is transmitted through the printer
port.
Removal of data from memory is done through the View Memory feature. You can only
delete test ID records. When the test ID record is deleted, all saved test results data
connected to that test ID is deleted from memory. To remove a test ID record:
1. Push .
2. Push , , , and to highlight View Memory.
3. Push .
4. Push or to highlight an operator.
5. Push .
Note
If there is only one operator, the operator list does not show in the display
and the Product skips steps 4 and 5.
6. Push or to highlight a test ID record.
7. Push the Delete softkey to delete the test ID record.
A Confirm Delete screen shows in the display with a “Delete Record?” message.
When you push the Yes softkey, the test ID record is deleted from memory and the
display goes back to the View Memory screen. Push the No softkey to abort the
delete.
The Delete All softkey will delete all the test ID records associated with the operator. A
Confirm Delete screen shows in the screen with a “Delete ALL records for this
operator?” message.
68
Page 81

Vital Signs Simulator
Setup Features
Setup Features
The Product has several functions that are accessed through the SETUP key. Push
to show the setup variables shown below in the display.
The setup parameters are kept in memory and are non-volatile.
How to Set the Time and Date
The date and time can be set as well as the format in which they show in the display.
From the Setup screen, push or to highlight Date/Time Settings and then push
. To go back to the Setup screen, push the Back softkey.
To set the date:
1. Push or to highlight the Date value.
2. Push .
3. Push or to move to the month, day, or year.
4. Push or to increase or decrease the value.
5. Push to set the date and go back to the Date/Time Settings screen.
To set the time:
1. Push or to highlight the Time value.
2. Push .
3. Push or to move to the hour, minute, or second value.
Figure 61. Setup Screen
glh016.bmp
4. Push or to increase or decrease the value.
5. Push to set the time and go back to the Date/Time Settings screen.
To set the date format:
1. Push or to highlight the Date Format value.
2. Push
.
3. Push or to highlight the Date Format value.
4. Push to set the date and go back to the Date/Time Settings screen.
To set the time format:
1. Push or to highlight the Time Format value.
2. Push .
69
Page 82

ProSim 6/8
Users Manual
How to Set the Backlight Intensity
How to Set the Beeper
3. Push or to highlight the Time Format value.
4. Push to set the format and go back to the Date/Time Settings screen.
The backlight on the Product has two intensity levels: Low and High. Each intensity can
be set separately. From the Setup screen, push or to highlight Display Settings
and push . To go back to the Setup screen, push the Back softkey.
To set the backlight intensity:
1. Push .
2. Push or to highlight a backlight value.
3. Push or to increase or decrease the backlight intensity.
4. Push to set the backlight intensity and go back to the Display Settings
screen.
The Product beeper can be turned on and off and its volume set. From the Setup screen,
push or to highlight Sound Settings and push . To go back to the Setup
screen, push the Back softkey.
5. Push .
6. Push .
7. Push or to highlight On or Off.
When the beeper is set to on, two more variables appear in the Sound Settings screen.
To set the beeper type:
1. Push or to highlight the Beep Type value.
2. Push .
3. Push or to highlight the Beeper Type value.
The beeper can be set to beep at each key press or to beep only when an error occurs.
4. Push to go back to the Sound Settings screen.
To set the beeper volume:
1. Push or to highlight the Volume value.
2. Push .
3. Push or to highlight the Volume value.
4. Push to set the volume and go back to the Sound Settings screen.
How to Set the Pressure Units and IBP Sensitivity
The units of measure for pressure (IBP and NIBP) values and IBP sensitivity to simulate
are set through the pressure Settings. From the Setup screen, push or to highlight
IBP Settings in the setup list and push . To go back to the Setup screen, push the
Back softkey.
70
To set the IBP sensitivity:
1. Push or to highlight the IBP Sensitivity value.
2. Push .
3. Push or
to highlight a sensitivity value.
Page 83

Vital Signs Simulator
Setup Features
4. Push to set the sensitivity and go back to the Pressure Settings screen.
To set the Pressure units:
1. Push or to highlight the Units value.
2. Push .
3. Push or to highlight mmHg or kPa.
4. Push to set the units and go back to the IBP Settings screen.
How to Set Battery Settings
To help save battery life, the Product can be set to power down (Auto power off) when no
buttons are sensed as pushed for a set period of time. You can also set whether or not the
battery charges in the Product. From the Setup screen, push or to highlight
Battery Settings and push . To go back to the Setup screen, push the Back
softkey.
To set auto power off:
1. Push or to highlight the Auto Power Off value.
2. Push .
3. Push or to highlight an auto power off value.
When enabled, auto power of can be set to 10, 30, or 60 minutes.
4. Push to set auto power and go back to the Battery Settings screen.
To set the battery charger:
1. Push or to highlight the Charge Battery value.
2. Push .
3. Push or to highlight Yes or No.
4. Push to set the charger value and go back to the Battery Settings screen.
A 1-minute warning message will show in the display before the Product
turns off.
How to Set the Display Language
The Product can be set to show text and messages in the display in many different
languages. To set the language, push or to highlight Instrument Information in
the Setup screen and push . To go back to the Setup screen, push the Back
softkey.
The language already set in the Product, shows in the display. To change the language:
1. Push .
Note
2. Push or to highlight a language in the list. Below is a list of the display
languages.
English Spanish
French Japanese
Italian Chinese
German
3. Push .
71
Page 84

ProSim 6/8
Users Manual
How to Control the Product Remotely
Ansur test automation systems uses a solutions-based procedure for medical device tests.
Ansur helps you make standard work through test templates and/or sequences that use
your written test procedure. All test results are then integrated into one test report that can
be printed or archived. Ansur manages your test procedures through manual and visual
automated test sequences.
The software works hand-in-hand with Fluke Biomedical analyzers and simulators, that
integrates:
• Visual inspections
• Preventive maintenance
• Work procedures
• Performance tests
• Safety tests
Ansur software uses plug-in modules to interface with a wide array of Fluke Biomedical
instruments. The plug-in module is a software interface to the Ansur test program. Plugins supply test elements used by Ansur Executive that use the same user interface for all
analyzers and simulators supported by an Ansur plug-in.
When you purchase a new Fluke Biomedical analyzer or simulator, you can update your
existing Ansur software by installing a new plug-in. Each plug-in module allows you to
work only with the options and capabilities you need for the instrument you are testing.
Maintenance
The Product is a calibrated measurement instrument. Try to prevent mechanical abuse
that could change the calibrated values. The Product has no internal user-serviceable
parts.
For safe operation and maintenance of the Product:
• Do not keep cells or batteries in a container where the
terminals can be shorted.
• Connect the battery charger to the mains power outlet
before the Product.
• Repair the Product before use if the battery leaks.
• Remove batteries to prevent battery leakage and damage to
the Product if it is not used for an extended period.
• Keep cells and battery packs clean and dry. Clean dirty
connectors with a dry, clean cloth.
• Do not short the battery terminals together.
• Use only Fluke Biomedical approved power adapters to
charge the battery.
WX Warnings
72
To prevent personal injury:
• Do not disassemble the battery.
• Batteries contain hazardous chemicals that can cause burns
or explode. If exposure to chemicals occurs, clean with
water and get medical aid.
Page 85

Vital Signs Simulator
Maintenance
• Do not put battery cells and battery packs near heat or fire.
Do not put in sunlight.
• Do not disassemble or crush battery cells and battery
packs.
To prevent possible electrical shock, fire, or personal injury:
• Remove the input signals before you clean the Product.
• Use only specified replacement parts.
• Have an approved technician repair the Product.
How to Clean the Product
W Caution
Do not pour fluid onto the Product surface; fluid seepage into
the electrical circuitry may cause the Product to fail.
W Caution
Do not use spray cleaners on the Product; such action may
force the cleaning fluid into the Product and damage electronic
components.
Clean the Product occasionally with a damp cloth and mild detergent. Try to prevent the
entrance of liquids.
Clean the adapter cables with the same precautions. Examine them for damage and
deterioration of the insulation. Examine the connections for integrity. Keep the transducer
adapter clean and dry.
Battery Maintenance
For peak battery performance, charge the Product to maximum charge once a month. If
the Product is not to be used for more than a month, keep it connected to the charger.
To get the specified performance, use the specified battery charger that
comes with this Product.
When the battery gets low, a low battery message shows in the display.
When the battery discharges to 3 % of full charge, a different message shows and the
NIBP function is disabled.
How to Charge the Battery
The battery charge level is shown in the upper-right corner of the display when the
battery pack is installed in the Product. If the Product is plugged in, … shows in the
upper right corner of the display. When the battery charges, the status is updated in
Battery setting under . With the AC/DC power supply removed from the Product,
the battery icon shows the charge level.
Note
The battery can be charged while it is in or out of the Product. The charge rate is slower
when the Product is energized and the battery charger is on. To charge the battery:
1. As shown in Figure 62, connect the AC/DC power supply to the power connector on
the battery pack.
2. Connect the AC/DC power supply to a power source.
73
Page 86

ProSim 6/8
Users Manual
Note
When the battery pack is installed in the Product, ensure the battery
charger is enabled. See the How to Set Battery Settings section earlier in
the manual to enable and disable the battery charger.
The battery charge LED on the battery pack shows red or green when the battery charges.
When the LED is green, the battery is charged.
When you have two or more battery packs, you can charge one battery externally while
you use the other to energize the Product.
Battery Charge
Indicator
Battery LED
When the battery pack is removed from the Product, push the button below the charge
level indicators to see the battery charge level. See Figure 62.
Battery Removal
The battery pack is easy to remove and replace. To remove the battery pack:
1. Push down on the battery pack latch as shown in Figure 63.
2. Remove the battery pack from the Product.
Figure 62. External Battery Charging Connections
glh047.eps
74
Page 87

Vital Signs Simulator
General Specifications
Push
Pull Out
Down
Figure 63. Battery Removal
glh046.eps
To put the battery pack into the Product, align the battery pack with the guides on the
Product and push it into the Product until the latch locks.
The ProSim 6/8 battery is not compatible with the ProSim 4.
General Specifications
Temperature
Operating ............................................................ 10 °C to 40 °C (50 °F to 104 °F)
Storage ............................................................... -20 °C to +60 °C (-4 °F to +140 °F)
Humidity................................................................. 10 % to 90 % non-condensing
Altitude................................................................... 3,000 meters (9,843 ft)
Size (L x W x H) ..................................................... 30.22 cm x 14.48 cm x 8.64 cm (11.9 in x 5.7 in x 3.4 in)
Display ................................................................... LCD Color Display
Communication
USB Device Upstream Port ................................Mini-B connector for control by a computer
USB Host Controller Port.................................... Type A, 5 V output, 0.5 A max load. Connector for keyboard, barcode
Wireless (ProSim8 Only) .................................... IEEE 802.15.4 for control by a computer
USB Device Virtual COM Port Settings
Baud Rate....................................................... 115,200 bps
Data bits.......................................................... 8 data bits
Stop Bits ......................................................... 1 stop bit
Flow Control.................................................... Hardware (RTS/CTS)
Power .....................................................................Lithium-Ion rechargeable, 7.2 V, 31 Wh battery, 4300 mAh
Battery Charger..................................................... 100 to 240 V, 50/60 Hz input, 15 V/2.0 A output. For best performance,
Battery Life ............................................................ 9 hours (minimum), 100 NIBP cycles typical
Weight .................................................................... 1.81 kg (4 lb)
Safety Standards................................................... EN/IEC 61010-1:2001
Certifications .........................................................
Electromagnetic Compatibility (EMC)................. EN 61326-1:2006
reader, and printer
the battery charger should be connected to a properly grounded ac
receptacle
P, ),
75
Page 88

ProSim 6/8
Users Manual
Detailed Specifications
Normal-Sinus-Rhythm Waveform
ECG Reference...................................................... The ECG amplitudes specified are for Lead II (calibration), from the
Normal Sinus Rhythm .......................................... 12-lead configuration with independent outputs referenced to right leg
High-Level Output................................................. 0.5 V/mV ±5 % of the ECG amplitude setting available on a BNC
Amplitude .............................................................. 0.05 mV to 0.5 mV (0.05 mV steps); 0.5 mV to 5.0 mV (0.25 mV
Amplitude Accuracy ............................................. ±(2 % of setting + 0.05 mV)
ECG Rate
Rate Accuracy....................................................... ±1 % of setting
ECG Waveform Selection..................................... Adult (80 ms) or pediatric (40 ms) QRS duration
ST-Segment Elevation .......................................... Adult mode only. -0.8 mV to +0.8 mV (0.1 mV steps) Additional steps:
Power-On Default.................................................. 60 BPM, 1.0 mV, adult QRS and ST-segment elevation of 0 mV
baseline to the peak of the R wave. All other leads are proportional.
(RL). Output to 10 Universal ECG Jacks, color-coded to AHA and IEC
Standards.
connector.
steps). Other leads are proportional to Lead II (reference lead) in
percentage per:
Lead I.................................................................. 70
Lead II................................................................. 100
Lead III................................................................ 30
Lead V1 .............................................................. 24
Lead V2 .............................................................. 48
Lead V3 .............................................................. 100
Lead V4 .............................................................. 120
Lead V5 .............................................................. 112
Lead V6 .............................................................. 80
ProSim 8 ............................................................. 10 to 360 BPM in 1 BPM steps
ProSim 6 ............................................................. 30 to 360 BPM in 10 BPM steps
+0.05 mV and -0.05 mV
Pacemaker Waveform
Pacer-Pulse
Amplitude ..........................................................0 (off), ±2, ±4, ±6, ±8, ±10, ±12, ±14, ±16, ±18, ±20, ±50, ±100, ±200,
Accuracy
Reference lead II ............................................ ±(5 % setting + 0.2 mV)
All other leads ................................................. ±(10 % setting + 0.4 mV)
Pacer-Pulse Width ................................................ 0.1, 0.2, 0.5, 1.0, and 2.0 ms ±5 %
Paced Arrhythmias ............................................... Atrial 80 BPM
Power-On Default.................................................. Amplitude 10 mV, width 1.0 ms, atrial waveform
±500, and ±700 mV for lead II (reference lead)
Asynchronous 75 BPM
Demand with frequent sinus beats
Demand with occasional sinus beats
Atrio-Ventricular sequential
Noncapture (one time)
Nonfunction
Arrhythmia
Baseline NSR......................................................... 80 BPM
PVC Focus ............................................................. Left focus, standard timing (except where specified)
Supraventricular Arrhythmia
ProSim 8 ............................................................. Atrial fibrillation (coarse or fine); atrial flutter; sinus arrhythmia; missed
ProSim 6 ............................................................. Atrial fibrillation (coarse or fine) and sinus arrhythmia
Premature Arrhythmia
beat (one time); atrial tachycardia; paroxysmal atrial tachycardia; nodal
rhythm; and supraventricular tachycardia.
76
Page 89

Vital Signs Simulator
Detailed Specifications
ProSim 8 ............................................................. Premature atrial contraction (PAC); premature nodal contraction
ProSim 6 ............................................................. Premature atrial contraction (PAC) and multifocal PVCs
Ventricular Arrhythmia
ProSim 8 ............................................................. PVCs 6, 12, or 24 per minute; frequent multifocal PVCs; bigeminy;
ProSim 6 ............................................................. Bigeminy; mono-ventricular tachycardia (120 to 300 BPM in 5 BPM
Conduction Defect
ProSim 8 ............................................................. First-, second-, or third-degree heart block; and right- or left-bundle-
ProSim 6 ............................................................. Second-degree heart block, type 1, and right-bundle-branch block
Advanced Cardiac Life Support (ProSim 8 only)
Shockable Pulseless Arrest Rhythms................. Ventricular fibrillation (coarse), ventricular fibrillation (fine), unstable
Non Shockable Pulseless Arrest Rhythms .........Asystole
Symptomatic Bradycardia................................... Sinus Bradycardia (<60 BPM)
Symptomatic Tachycardia
Regular Narrow-complex Tachycardias (QRS <0.12 seconds)
Sinus Tachycardia ...................................... >150 BPM
Supraventircular Tachycardia ..................... SVT
Regular Wide-complex Tachycardias (QRS ≥0.12 seconds)
Sinus Tachycardia ...................................... >150 BPM
Supraventircular Tachycardia ..................... SVT with aberrancy
Irregular Tachycardia...................................... Atrial Fibrillation (Coarse and fine), Atrial Flutter, unstable
(PNC); PVC1 left ventricular; PVC1 left ventricular, early; PVC1 left
ventricular, R on T; PVC2 right ventricular; PVC2 right ventricular,
early; PVC2 right ventricular, R on T; and multifocal PVCs
trigeminy; multiple PVCs (one-time run of 2, 5, or 11 PVCs); monoventricular tachycardia (120 to 300 BPM in 5 BPM steps); polyventricular tachycardia (5 types); ventricular fibrillation (coarse or fine);
and Asystole
steps); poly-ventricular tachycardia (5 types); ventricular fibrillation
(coarse or fine); and Asystole
branch block
polymorphic ventricular tachycardia
nd
2
Degree AV Block, Mobitz Type I
nd
Degree AV Block, Mobitz Type II
2
Complete/3
Right Bundle Branch Block
Left Bundle Branch Block
monomorphic ventricular tachycardia (120 to 300 BPM), Torsade De
Pointes/Polymorphic ventricular tachycardia (long QT interval)
rd
Degree AV Block
ECG-Performance-Testing
Amplitude (peak-to-peak)..................................... 0.05 to 0.5 mV (0.05 mV steps)
0.5 to 5.0 mV (0.25 mV steps)
Other leads are proportional to Lead II (reference lead) in percentage
per:
Lead I.................................................................. 70
Lead II................................................................. 100
Lead III................................................................ 30
Lead V1 through V6............................................ 100
Pulse Wave ............................................................ 30, 60 BPM, with 60 ms pulse width
Square Wave ......................................................... 0.125, 2.0, 2.5 Hz
Triangle Wave........................................................ 0.125, 2.0, 2.5 Hz
Sine Wave .............................................................. 0.05, 0.5, 1, 2, 5, 10, 25, 30, 40, 50, 60, 100, and 150 Hz
R-wave Detection (ProSim 8 only)
Waveform............................................................ Triangular pulse
Rate .................................................................... 30, 60, 80, 120, 200, and 250 BPM
Width................................................................... 8 to 20 ms in 2 ms steps, and 20 to 200 ms in 10 ms steps
Width Accuracy................................................... ±(1 % of setting + 1 ms)
QRS Detection (ProSim 8 only)
Widths................................................................. 8 to 20 ms in 2 ms steps and 20 to 200 ms in 10 ms steps
Width Accuracy................................................... ±(1 % of setting + 1 ms)
77
Page 90

ProSim 6/8
Users Manual
Tall T-Wave Rejection (ProSim 8 only)
Rate Accuracy....................................................... ±1 % of setting
Amplitude Accuracy ............................................. ±(2 % of setting + 0.05 mV)
ECG Artifact
Type........................................................................ 50 Hz, 60 Hz, muscular, baseline wander, respiration
Size......................................................................... 25, 50, 100 % of the normal sinus R-Wave for each lead
Lead Select ............................................................ All, RA, LL, LA, V1, V2, V3, V4, V5, V6
Fetal / Maternal-ECG (ProSim 8 only)
Fetal Heart Rate (Fixed)........................................ 60 to 240 BPM in 1 BPM steps
Fetal Heart Rate (IUP) ...........................................140 BPM at beginning, then varies with pressure
Intrauterine-Pressure Waveforms .......................Early deceleration, late deceleration, and acceleration
Wave Duration....................................................... 90 seconds, bell-shaped pressure curve, from 0 to 90 mmHg and
IUP Period.............................................................. 2, 3, or 5 minutes; and manual
Default Settings..................................................... FHR 140 BPM, early deceleration wave, manual
Rate .................................................................... 30, 60, 80, 120, 200, and 250 BPM
R-Wave up slope ................................................0.875 amplitude, 0.4375 x width
R-Wave down slope............................................ Full amplitude, 0.5 x width
S-Wave up slope ................................................ 0.125 amplitude, 0.0625 x width
Waveform
QT Interval ...................................................... 350 ms
T-Wave width.................................................. 180 ms
T-Wave Shape................................................ ½ sinewave
Amplitude............................................................ 0 to 150 % reference lead amplitude in 10 % steps
Rate .................................................................... 80 BPM
returning to 0
Invasive Blood Pressure
Channels................................................................ 2, each independently settable with identical parameters and are
Input/output Impedance ....................................... 300 Ω ±10 %
Exciter Input Range ..............................................2.0 to 16.0 V peak
Exciter-Input Frequency Range ........................... DC to 5000 Hz
Transducer Sensitivity ......................................... 5 (default) or 40 μV/V/mmHg
Pressure Accuracy ...............................................±(1 % of setting + 1 mmHg) Accuracy guaranteed for DC excitation
Static Pressure...................................................... -10 to +300 mmHg in 1 mmHg steps
Pressure Units....................................................... mmHg or Kpa
Dynamic Waveforms
Types (default pressures) ................................... Arterial (120/80)
Pressure Variability............................................. Systolic and diastolic pressures are independently variable in 1 mmHg
Swan-Ganz Sequence........................................... Right atrium, right ventrical (RV), pulmonary artery (PA), pulmonary
Cardiac Catheterization (ProSim 8 only)
Chambers ........................................................... Aortic, Pulmonary valve, and Mitral valve
Respiration Artifact
Arterial, radial artery, and left ventricle ...............5 to 10 % multiplication
Other ................................................................... 5 or 10 mmHg
BP Output ..............................................................Circular DIN 5-Pin
Power-On Default.................................................. 0 mmHg
individually electrically isolated from all other signals
only
Radial artery (120/80)
Left ventricle (120/00)
Right ventricle (25/00)
Pulmonary artery (25/10)
Pulmonary-artery wedge (10/2)
Right atrium (central venous or CVP) (15/10)
steps.
artery wedge (PAW)
78
Page 91

Vital Signs Simulator
Detailed Specifications
Respiration
Rate ........................................................................ 0 (OFF), 10 to 150 BrPM in 1 BrPM steps
Waves..................................................................... Normal or ventilated
Ratio (inspiration:expiration)
Normal ................................................................ 1:1, 1:2, 1:3, 1:4, 1:5
Ventilated............................................................ 1:1
Impedance Variations (Δ Ω) ................................. 0.00 to 1.00 Ω in 0.05 Ω steps and 1.00 to 5.00 Ω in 0.25 Ω steps
Delta Accuracy ...................................................... ±(5 % of setting + 0.1 Ω)
Baseline ................................................................. 500, 1000 (default), 1500, 2000 Ω, Leads I, II, III
Baseline Accuracy ................................................ ±5 %
Respiration Lead................................................... LA or LL (default)
Apnea Selection.................................................... 12, 22, or 32 seconds (one-time events), or continuous (Apnea ON =
respiration OFF)
Power-On Default.................................................. 20 BrPM, delta 1.0 Ω
Temperature
Temperature .......................................................... 30.0 °C to 42.0 °C in 0.5 °C steps
Accuracy................................................................ ±0.4 °C
Compatibility .........................................................Yellow Springs, Inc. (YSI) Series 400 and 700
Output ....................................................................Circular DIN 4-pin
Cardiac Output
Catheter Type ........................................................ Baxter Edwards, 93a-131-7f
Calibration Coefficient.......................................... 0.542 (0 °C injectate), 0.595 (24 °C injectate)
Blood Temperature ............................................... 36 °C (98.6 °F) to 38 °C (100.4 °F) ±0.2 °C in 1 °C steps
Injectate Volume ................................................... 10 cc
Injectate Temperature........................................... 0 °C or 24 °C
Cardiac Output ...................................................... 2.5, 5, 10 liters per minute ±7.5 %
Faulty-Injectate Curve .......................................... Waveform for simulation available
Left-to-Right-Shunt Curve .................................... Waveform for simulation available
Calibrated Pulse.................................................... 1.5 ° for 1 second
Connector .............................................................. Circular DIN 7 pin
Power-On Default ................................................. 5 liters per minute, 0 °C injectate, 37 °C blood temperature
Non-Invasive Blood Pressure
Pressure Units....................................................... mmHg or kPa
Manometer (Pressure Meter)
Range ................................................................. 10 to 400 mmHg
Resolution........................................................... 0.1 mmHg
Accuracy
ProSim 8 ......................................................... ±(0.5 % reading +0.5 mmHg)
ProSim 6 ......................................................... ±(1 % reading +1 mmHg)
Pressure Source
Target Pressure Range ...................................... 20 to 400 mmHg
Resolution........................................................... 1 mmHg
NIBP Simulations
Pulse................................................................... 2 mmHg max into 500 ml NIBP system
Volume of air moved........................................... 1.25 ml max
Simulations .........................................................Systolic/diastolic (MAP)
Adult................................................................ 60/30 (40), 80/50 (60), 100/65 (77); 120/80 (93); 150/100 (117); and
200/150 (167) and 255/195 (215)
Neonatal ......................................................... 35/15 (22); 60/30 (40); 80/50 (60);100/65 (77);120/80 (93) and 150/100
(117)
Pressure variability ......................................... Systolic and diastolic pressures are variable by 1 mmHg
Repeatability ....................................................... Within ±2 mmHg (at maximum pulse size independent of device under
test)
79
Page 92

ProSim 6/8
Users Manual
Leak Test
Pressure Relief Test Range ................................. 100 to 400 mmHg
Oximeter SpO2 Optical Emitter and Detector (optional)
% O2
Heart Rate
Transmission (Ratio of detector current to LED current, expressed in parts per million (ppm))
Pulse Amplitude
Artifact
Masimo Rainbow Technology ............................. Masimo Rainbow technology with an optional adapter supplied by
Compatible Manufacturer Products
Synchronization
Normal Sinus heart rates ................................ 30 to 240 BPM
Maximum rate at 1 ml .................................240 BPM achievable with pulses up to 1 ml
Maximum rate at 1.25 ml ............................180 BPM
Arrhythmias..................................................... Premature atrial contraction (PAC), Premature ventricular contraction
(PVC), atrial fibrillation, and missed beat.
Target Pressure ..................................................20 to 400 mmHg
Elapsed time ....................................................... 0:30 to 5:00 minutes:seconds in 30 second steps
Range ................................................................. 0 to 200 mmHg/minute
Internal Leak rate................................................ <2 mmHg/min into 500 ml rigid volume
Range ................................................................. 30 to 100 %
Resolution........................................................... 1 %
Accuracy
With oximeter manufacturer’s R-curve
Saturation within UUT specific range.......... ±(1 count + specified accuracy of the UUT)
Saturation outside UUT specific range .......monotonic with unspecified accuracy
With Fluke Biomedical R-curves
91 to 100 %................................................. ±(3 counts + specified accuracy of the UUT)
81 to 90 %................................................... ±(5 counts + specified accuracy of the UUT)
71 to 80 %................................................... ±(7 counts + specified accuracy of the UUT)
Below 71 %................................................. monotonic with unspecified accuracy
Range ................................................................. 30 to 300 BPM in 1 BPM steps. Oximeter SpO2 Optical Emitter and
Detector is synchronized with ECG rate delayed by 150 ms.
Accuracy ............................................................. ±1 % of setting
Range ................................................................. 0 to 300.00 ppm
Resolution........................................................... 0.01 ppm
Accuracy ............................................................. +50 %/-30 % for compatible monitors, unspecified for others. Selected
by finger size and color: Dark, thick finger, medium finger, light, thin
finger, neonatal foot.
Range ................................................................. 0 to 20.00 %
Resolution........................................................... 0.01 %
Respiration
Range .............................................................0 to 5 % of transmission
Resolution....................................................... 1 %
Rate ................................................................all ProSim respiration simulation settings
Ambient Light
Range .............................................................0 to 5X transmitted light
Resolution....................................................... 1X
Frequency....................................................... DC, 50 Hz, 60 Hz, and 1 to 10 kHz in 1 kHz steps
Masimo that allows the ProSim two wavelength to test the Rainbow
multiple wavelength system
With manufacturer R-curve................................. Nellcor, Masimo, Nonin, and Nihon Kohden
With Fluke Biomedical R-curve........................... Mindray, GE-Ohmeda, Philips/HP, and BCI
80
Page 93

Vital Signs Simulator
Detailed Specifications
Pre-Defined Simulations
Normal
Hypertensive
Hypotensive
Tachycardic
Bradycardic
Ventricular Fibrillation
Asystole
Autosequences (default)
Monitor testing sequence
Medical training sequence
Oximeter testing sequence
Cardiac failure sequence
Arrhythmia sequence
Exercise sequence
Respiration sequence
Performance Wave Test
IBP testing sequence
Temperature sequence
81
Page 94

ProSim 6/8
Users Manual
82
Page 95

Introduction
The words in this glossary are common words used in this manual that may need further
explanation. Words in italics are words that are defined in this glossary.
AAMI
Acronym for the Association for the Advancement of Medical Instrumentation. A group
of physicians, biomedical and clinical engineers, nurses, manufacturers, and government
representatives who set industry guidelines for the performance and safety of biomedical
instrumentation.
Appendix A
Glossary
AC component
The pulse factors of the blood measured by oximetry.
Ampere
A unit of steady electrical current which, when flowing in straight parallel wires of
infinite length and negligible cross section, separated by a distance of one meter in free
space, produces a force between the wires of 2 × 10
Aorta
The main trunk of the systemic arteries, carrying blood from the left side of the heart to
the arteries of all limbs and organs except the lungs.
Apnea
Apnea is described as the cessation of breathing. In general there are three types of apnea:
central (often seen in infants, when there is no diaphragm movement and no air flow);
obstructive (where an object, such as food, is lodged in the trachea); and mixed (where
central apnea is followed immediately by obstructive apnea).
Artery
Any of a branching system of muscular tubes that carry blood away from the heart.
Artifact
An abnormal signal or structure produced by an external medium, such as a muscle or
electrical wiring. Artifacts are sometimes referred to as noise.
An ECG artifact can be caused by depolarization or contraction of the muscle which
depends on an electrical charge. These electrical charges can be detected by an
electrocardiogram. The electrical charges associated with the contractions of the heart
will be clear only if there is not interference by auxiliary signals from other muscle
movement. Electrical signals from power lines or local (in-wall) circuitry represent
-7
newtons per meter of length.
A-1
Page 96

ProSim™ 6/8
Users Manual
another kind of artifact (also called noise) that can be picked up by an ECG device. These
sources can cause minute electric currents through capacitive coupling or resistive
contacts. On an ECG readout, such electrical artifacts can cause a serious safety
condition. Even a relatively tiny current of 60 hertz (Hz) can be fatal. Therefore,
whenever line frequency in an electrocardiogram is noted, the cause of the signal should
be determined at once
Asynchronous
Signals sent to a computer at irregular intervals. Data is transmitted at irregular intervals
by preceding each character with a start bit and following it with a stop bit.
Asynchronous transmission allows a character to be sent at random after the preceding
character has been sent, without regard to any timing device.
Asystole (Cardiac Standstill)
No ECG activity whatsoever. Ventricular asystole is a critical condition characterized by
the absence of a heartbeat either in the ventricles or in the entire heart. This condition,
also referred to as cardiac standstill, is usually accompanied by loss of consciousness,
apnea, and—if not treated immediately—death.
Atrial Fibrillation
A rapid, irregular atrial signal, coarse or fine, with no real P waves; an
irregularventricular rate. Coarse and fine atrial fibrillation occurs when the electrical
signals in the atria are chaotic, and multiple, ectopic pacemakers are firing erratically.
Some impulses may conduct through to the AV node to stimulate the ventricles, causing a
quite-irregular and often-rapid ventricular rate. On the ECG there is an absence of P
waves, with an irregular R-R interval. Atrial-fibrillation waveforms are irregularly shaped
and usually rounded. The amplitude of the atrial signal is higher for coarse, and lower for
fine, fibrillation.
Atrial Flutter
A repeating sequence of large, irregular P waves at 300 BPM; an irregular ventricular
response. Atrial flutter occurs when a single, ectopic, atrial pacemaker that is non-SA
(usually low, near the AV node) fires repeatedly and (usually) regularly, producing large,
pointed P waves at an approximate rate of 400 BPM (between 240 and 480 BPM). Not all
of the atrial impulses conduct through to the ventricles. On the ECG readout the
waveform generally exhibits a “saw tooth” appearance. This type of arrhythmia can
reduce cardiac output by as much as 25 %, due in many cases to the lack of an atrial
“kick” and the accompanying failure of the ventricles to fill completely with blood prior
to ventricle contraction.
Atrial Tachycardia (AT)
Normal rhythm at a faster-than-normal rate of 160 BPM.
Atrial tachycardia occurs when an ectopic, atrial pacemaker (non-SA) fires repeatedly at
a rate between 150 and 250 BPM. AT may cause cardiac output to drop significantly (in
some cases by as much as 25 %), due to the inability of the ventricles to fill completely
during the typically short diastole. This condition may result from an atrioventricular
blockage or digitalis toxicity.
Atrium
(1) One of the two upper chambers of the heart. (2) Any chamber allowing entrance to
another structure or organ.
AV Junction
A junction consisting of the AV node and the bundle of His. Conducts the electrical
impulse sent from the SA node from the atria into the ventricles.
A-2
Page 97

Glossary
Introduction A
AV Node
Also called the atrioventricular node. Located in the right atrium near the septum.
Conducts the electrical impulse in the heart to the bundle of His, which passes it on to the
left- and right-bundle branches.
Baud
A unit of measurement that denotes the number of discrete signal elements, such as bits,
that can be transmitted per second. Bits-persecond (bps) means the number of binary
digits transmitted in one second.
Bigeminy
Two sequences: a PVC followed by a normal beat, or a PVC followed by two normal
beats. Bigeminy—also called a fixed coupling or bigeminal rhythm—is a type of PVC in
which a beat with a normal QRS complex alternates with a PVC; in other words, every
other beat is premature. In trigeminy, which is similar to bigeminy, a PVC appears after
every two normal QRS complexes.
Blood Pressure
The pressure of the blood within the arteries, primarily maintained by contraction of the
left ventricle.
BPM
Beats per minute. SEE pulse.
Bundle-Branch Block
Blockage in the right- or left-bundle branches, with beats exhibiting a wide QRS and a
PR interval of 160 ms. Bundle-branch blockage—also referred to as intraventricular
conduction defect, BBB or IVCD—is a form of heart block in which there is a
conduction delay or failure from one of the branches of the bundle of His (which start
about a centimeter below the bundle of His) to the Purkinje network. The blockage may
be complete or incomplete, transient, intermittent, or permanent. In most cases, the
electrical impulse travels through the normal bundle branch to stimulate one ventricle and
then passes through the cardiac septum to stimulate the other, resulting in one ventricle’s
depolarizing later than the other. (Both anatomically and functionally, the septum
separates the heart into its left and right halves.)
Bundle Of HIS
A collection of nerves (about 1 cm in length) that lies just below the AV node in the heart.
Part of the heart’s electrical conduction system. With the AV node, forms the AV
junction. Below the bundle, the nerves divide into left and right branches.
Computational Constant
Pertaining to cardiac output. Sometimes called calibration coefficient.
Cardiac
Of, near, or pertaining to the heart.
Cardiovascular
Of, pertaining to, or involving the heart and the blood vessels.
Capillary
One of the minute blood vessels that connect the arteries and veins.
DC component
See R-Value
ECG
An electrocardiogram (ECG) records the electrical signals of the muscles of the heart—
the depolarization and repolarization of the myocardium. Wires from an ECG machine
A-3
Page 98

ProSim™ 6/8
Users Manual
are connected to small plastic or metal cables called leads, or electrodes. Put on the chest,
the wrists of the right and left arms, and the left leg at the ankle, these electrodes transmit
signals to a recorder. The recorder makes lines in the shape of waves on graph paper in
the ECG machine, follow the heart's electrical activity (rate) and its rhythm (beat). Each
contraction of a normal heart causes a normal sinus rhythm (NSR) waveform, also
referred to as the P QRS T waveform.
Frequent Multifocal PVCS
A sequence that includes a left-focus PVC followed by normal beats, alternating with a
right-focus PVC followed by normal beats. Frequent multifocal PVCs are initiated by a
number of different ectopic pacemakers in the ventricles, with events occurring at least
five times per minute, and usually more often.
Gram
A metric unit of mass and weight, equal to one-thousandth of a kilogram, about 0.035
ounces.
Heart Block: First, Second, and Third Degree
Three heart-block simulations, running as repeating sequences. A heart block is a
condition wherein the signal generated by the SA node is delayed or is blocked (partially
or completely) in its journey to the ventricles. Because this condition typically occurs at
the AV (atrioventicular) junction, a more precise term for heart block is atrioventricular
block. When the conduction time from the atria to the ventricles becomes delayed
(usually resulting in a P-R interval greater than 0.20 seconds), it is referred to as a firstdegree block. When impulses from the atria occasionally do not reach the ventricles, the
block is considered partial or incomplete and is referred to as a second-degree block.
Finally, when no impulses whatsoever are able to enter the ventricles from the atria, the
heart block is complete and is referred to as a third-degree block. As a consequence of a
third-degree block, the atria and the ventricles beat at their own separate rates.
Hemoglobin
The oxygen-bearing, iron-containing conjugated protein in vertebrate red blood cells,
consisting of about 6 per cent heme and 94 per cent globin.
Hertz
A unit of frequency equal to one cycle per second. Used to measure electrical current and
light, especially ultraviolet radiation (as in fluorescent light).
Impedance
A measure of the total opposition to current in a circuit.
Infrared
Of, pertaining to, or being electromagnetic radiation having wavelengths greater than
those of visible light and shorter than those of microwaves.
Joule
A unit of energy, equal to the work done when a current of one ampere is passed through
a resistance of one ohm for one second.
Kilogram
The fundamental unit of mass in the International System, about 2.2046 pounds.
LCD
Liquid crystal display. A digital display consisting of a liquid crystal material between
sheets of glass that becomes readable in the presence of an applied voltage.
Meter
The fundamental unit of length, equivalent to 39.37 inches, in the metric system.
A-4
Page 99

Glossary
Introduction A
Millivolt
One-thousandth of a volt.
Missed Beat
A single missing beat, with the heart rate returning to normal. Missed beats, often present
in first-degree heart block, are symptomatic of other conditions as well.
Multifocal PVCS
A sequence that includes a left-focus PVC, followed by two normal beats, followed by a
right-focus PVC, followed by a normal rhythm at 80 BPM. Multifocal PVCs are
premature ventricular contractions that originate in different ectopic-pacemaker sites
throughout the ventricles. These PVCs, which exhibit different size and shape elements,
are characterized by the absence of a P wave (due to the lack of any atrial-pacemaker
activity).
Multiple PVCS: Paired PVCS; Run 5 PVCS; Run 11 PVCS
Three series of multiple PVCs run as one-time (nonrepeating) events. The term multiple
PVCs refers to any condition where two or more PVCs occur in a row. Standard PVCs of
this type include a pair of PVCs (also known as a couplet), a run of five PVCs in a row,
and a run of eleven PVCs in a row.
Myocardium
The thick muscular layer of the heart, located between the endocardium at the inside and
the epicardium at the outside walls of the heart.
Nanometer
One-billionth (10-9) of a meter.
Nanosecond
One billionth (10-9) of a second (one thousand-millionth of a second). Electricity travels
approximately one foot per nanosecond.
Nodal Rhythm
Normal rhythm, but with a P wave that originates in the AV node, and a P-R interval that
is very short. Nodal rhythm, also referred to as junctional rhythm or junctional escape, is
a condition where the predominant pacemaker is the AV node rather than the SA node.
Noninvasive
Not tending to spread; especially, not tending to invade healthy tissue.
Ohm
A unit of electrical resistance equal to that of a conductor in which a current of one
ampere is produced by a potential of one volt across its terminals.
PAP
Pulmonary arterial pressure.
Patient Leads
Cables that connect a patient directly with the monitor. Sometimes called applied parts.
Paroxysmal Atrial Tachycardia (PAT)
Normal rhythm at alternating rates. When atrial tachycardia occurs as a seizure-like
spasmodic event, it is called paroxysmal atrial tachycardia or PAT. PATs typically start
and stop suddenly, initiated by a premature atrial contraction (PAC). PAT spasms may
last for only a few seconds or for minutes or hours. A patient may experience ATs and
PATs over the course of many years.
PCWP
Pulmonary capillary wedge pressure. Also known as PAW.
A-5
Page 100

ProSim™ 6/8
Users Manual
Premature Atrial Contraction (PAC)
A beat that is 25 % premature but otherwise normal. Any part of the heart can depolarize
earlier than it should; the accompanying heartbeat is called extrasystole. This type of
depolarization is called a premature contraction; a premature contraction that originates
in the SA node is referred to as a PAC. An isolated PAC is relatively unimportant.
However, frequent PACs are a concern, because they could be the precursor of more
serious and potentially life-threatening conditions, including atrial flutter, atrial
fibrillation, and atrial tachycardia.
Premature Nodal Contraction (PNC)
A nodal beat that is 25 % premature, followed by a nodal rhythm at 80 BPM. A
premature nodal contraction—also called a premature junctional contraction, a PNC, or a
PJC—is an extra beat that occurs as a result of an electrical impulse sent from the
atrioventricular (junctional) node. The P-R interval is shorter than normal. PNCs, which
may occur in isolation or in groups, can appear sporadically for no obvious reason in an
otherwise-healthy person.
Premature Ventricular Contractions
Six PVC-type selections of focus and timing:
• a left-focus premature ventricular beat with standard timing, 20 % premature;
• a left-focus premature ventricular beat with early timing, 33 % premature;
• a left-focus premature ventricular beat with very early timing, 65 % premature,
which starts during the T wave of the previous beat;
• a right-focus premature ventricular beat with standard timing, 20 % premature;
• a right-focus premature ventricular beat with early timing, 33 % premature; or
• a right-focus premature ventricular beat with very early timing, 65 % premature,
which starts during the T wave of the previous beat.
A premature ventricular contraction or PVC is an extra beat consisting of an abnormally
wide and unusual QRS complex originating in an ectopic pacemaker in the ventricles.
Early ventricular PVCs occur close to the preceding beat. Moreover, R-on-T PVCs,
which are characterized by a beat that falls on the T wave of the preceding QRS-T
complex, are especially inauspicious because of their potential to cause ventricular
tachycardia or ventricular fibrillation.
Pulse
The rhythmical throbbing of arteries produced by regular contractions of the heart.
Pulse Oximeter
A non-invasive, arterial, oxygen-saturation monitor that measures the ratio of two
principle forms of hemoglobin in the blood.
Purkinje Network
The dense collection of Purkinje fibers, which are dispersed throughout the myocardium
and which represent the terminal portion of the heart's electrical conduction system.
A-6
PVCS
Premature ventricular contractions.
PVCS: 6, 12, or 24 Per Minute
PVCs scattered among normal beats AT 80 BPM, so that PVCs take place 6, 12, or 24
times every minute. Premature ventricular contractions may occur independently (even
in healthy individuals), as well as in groups and/or for a number of times every minute.
 Loading...