

Page 1

This manual pertains to instruments with serial number 6820XXX
or higher.
8060A
True-rms Multimeter
®
Instruction Manual
PN 609146
May 1997 Rev.3, 11/00
© 1997,1998,1999, 2000 Fluke Corporation, All rights reserved. Printed in U.S.A.
All product names are trademarks of their respective companies.
Page 2

LIMITED WARRANTY & LIMITATION OF LIABILITY
Each Fluke product is warranted to be free from defects in material and workmanship
under normal use and service. The warranty period is one year and begins on the date
of shipment. Parts, product repairs and services are warranted for 90 days. This
warranty extends only to the original buyer or end-user customer of a Fluke authorized
reseller, and does not apply to fuses, disposable batteries or to any product which, in
Fluke’s opinion, has been misused, altered, neglected or damaged by accident or
abnormal conditions of operation or handling. Fluke warrants that software will operate
substantially in accordance with its functional specifications for 90 days and that it has
been properly recorded on non-defective media. Fluke does not warrant that software
will be error free or operate without interruption.
Fluke authorized resellers shall extend this warranty on new and unused products to
end-user customers only but have no authority to extend a greater or different warranty
on behalf of Fluke. Warranty support is available if product is purchased through a
Fluke authorized sales outlet or Buyer has paid the applicable international price. Fluke
reserves the right to invoice Buyer for importation costs of repair/replacement parts
when product purchased in one country is submitted for repair in another country.
Fluke’s warranty obligation is limited, at Fluke’s option, to refund of the purchase price,
free of charge repair, or replacement of a defective product which is returned to a Fluke
authorized service center within the warranty period.
To obtain warranty service, contact your nearest Fluke authorized service center or
send the product, with a description of the difficulty, postage and insurance prepaid
(FOB Destination), to the nearest Fluke authorized service center. Fluke assumes no
risk for damage in transit. Following warranty repair, the product will be returned to
Buyer, transportation prepaid (FOB Destination). If Fluke determines that the failure
was caused by misuse, alteration, accident or abnormal condition of operation or
handling, Fluke will provide an estimate of repair costs and obtain authorization before
commencing the work. Following repair, the product will be returned to the Buyer
transportation prepaid and the Buyer will be billed for the repair and return
transportation charges (FOB Shipping Point).
THIS WARRANTY IS BUYER’S SOLE AND EXCLUSIVE REMEDY AND IS IN LIEU
OF ALL OTHER WARRANTIES, EXPRESS OR IMPLIED, INCLUDING BUT NOT
LIMITED TO ANY IMPLIED WARRANTY OF MERCHANTABILITY OR FITNESS FOR
A PARTICULAR PURPOSE. FLUKE SHALL NOT BE LIABLE FOR ANY SPECIAL,
INDIRECT, INCIDENTAL OR CONSEQUENTIAL DAMAGES OR LOSSES,
INCLUDING LOSS OF DATA, WHETHER ARISING FROM BREACH OF WARRANTY
OR BASED ON CONTRACT, TORT, RELIANCE OR ANY OTHER THEORY.
Since some countries or states do not allow limitation of the term of an implied
warranty, or exclusion or limitation of incidental or consequential damages, the
limitations and exclusions of this warranty may not apply to every buyer. If any
provision of this Warranty is held invalid or unenforceable by a court of competent
jurisdiction, such holding will not affect the validity or enforceability of any other
provision.
Fluke Corporation Fluke Europe B.V.
P.O. Box 9090 P.O. Box 1186
Everett, WA 98206-9090 5602 BD Eindhoven
U.S.A. The Netherlands
5/94
Page 3
Safety Information
This meter has been designed and tested in accordance with IEC
Publication 348. To ensure that the meter is used safely, follow all safety
and operating instructions in this manual. If the meter is not used as
described in this manual, the safety features of the meter might be
impaired.
•
Do not use the meter if the meter or test leads look damaged, or if you
suspect that the meter is not operating properly.
•
Turn off power to the circuit under test before cutting, unsoldering, or
breaking the circuit. Small amounts of current can be dangerous.
•
Do not apply more than 500V rms between a terminal and earth ground.
•
Use caution when working above 60V dc or 30V ac rms. Such voltages
pose a shock hazard.
•
When using the probes, keep your fingers behind the finger guards on
the probes.
•
Disconnect the live test lead before disconnecting the common test lead.
Symbols
The following international symbols are used in this manual:
Important Safety Information in Manual
AC
DC
Diode Test
Ground
Fuse
Indicates Terminals At Which Dangerous Voltages May Exist
Battery
Page 4

Page 5

Table of Contents
Chapter Title Page
1 Introduction and Specifications............................................. 1-1
1-1. Introduction.............................................................................. 1-3
1-2. Items Furnished with Equipment............................................. 1-4
1-3. Specifications........................................................................... 1-4
2 Operating Instructions............................................................ 2-1
2-1. Introduction.............................................................................. 2-3
2-2. Unpacking Your Instrument .................................................... 2-3
2-3. Battery Installation or Replacement......................................... 2-3
2-4. Fuse Replacement.................................................................... 2-5
2-5. Physical Features ..................................................................... 2-6
2-6. Front Panel........................................................................... 2-6
2-7. Display................................................................................. 2-8
2-8. Signal Input Limits .................................................................. 2-9
2-9. Operation ................................................................................. 2-10
2-10. Power-On Self-Test ............................................................. 2-10
2-11. AC/DC Voltage (V)............................................................. 2-11
2-12. True rms Measurement.................................................... 2-12
2-13. AC-Coupled AC Measurements...................................... 2-12
2-14. Waveform Comparison and Conversion.......................... 2-13
2-15. High Impedance DC Voltage........................................... 2-14
2-16. AC/DC Current (A).............................................................. 2-16
2-17. Resistance (Ω)...................................................................... 2-18
2-18. Autoranging Megohms .................................................... 2-20
2-19. Autoranging Kilohms....................................................... 2-21
2-20. Conductance (S)................................................................... 2-22
2-21. Diode Test (
2-22. Relative (REL)..................................................................... 2-27
2-23. Frequency (Hz).................................................................... 2-29
2-24. Decibel (dB)......................................................................... 2-32
2-25. dBV...................................................................................... 2-33
2-26. Continuity (
2-27. Initial Check-Out Procedure .................................................... 2-36
) ................................................................... 2-25
)........................................................... 2-34
i
Page 6

8060A
Instruction Manual
3 Applications............................................................................. 3-1
3-1. Introduction .............................................................................. 3-3
3-2. Determining Amplifier Bandwidth........................................... 3-3
3-3. Using the 8060A as a Q-Meter................................................. 3-4
3-4. Measuring Amplifier Stage Gain with Relative dB.................. 3-5
3-5. General Audio Uses.................................................................. 3-6
3-6. Using the 8060A to Measure Extremely Low Currents ........... 3-7
3-7. Making dBm or dBW Measurements with Other Reference
Impedances............................................................................... 3-7
3-8. Changing AC dB Reference Impedances with a DC Source.... 3-9
4 Theory of Operation ................................................................ 4-1
4-1. Introduction .............................................................................. 4-3
4-2. Functional Description ............................................................. 4-3
4-3. Microcomputer..................................................................... 4-4
4-4. Measurement Acquisition Chip (MAC) ............................... 4-5
4-5. A/D Conversion Cycle ......................................................... 4-6
4-6. Voltage Measurement........................................................... 4-8
4-7. Current Measurement........................................................... 4-10
4-8. Resistance Measurement ...................................................... 4-10
4-9. Conductance Measurement................................................... 4-11
4-10. Continuity Measurement ...................................................... 4-12
4-11. Frequency Measurement ...................................................... 4-13
5 Maintenance............................................................................. 5-1
5-1. Introduction .............................................................................. 5-3
5-2. Service Information.................................................................. 5-3
5-3. General Information ................................................................. 5-4
5-4. Handling Precautions for Using Static Sensitive Devices.... 5-5
5-5. Disassembly and Reassembly............................................... 5-5
5-6. Calibration and Backup Fuse Access ............................... 5-6
5-7. Main PCB Access............................................................. 5-8
5-8. LCD and Microcomputer PCB Disassembly and
5-9. Backup Fuse Replacement.................................................... 5-12
5-10. Cleaning................................................................................ 5-12
5-11. Performance Tests .................................................................... 5-13
5-12. Initial Procedure ................................................................... 5-13
5-13. Microcomputer and Display Test......................................... 5-13
5-14. Voltage Test.......................................................................... 5-13
5-15. Resistance Test..................................................................... 5-15
5-16. Continuity Test..................................................................... 5-16
5-17. Conductance Test ................................................................. 5-16
5-18. Current Test.......................................................................... 5-17
5-19. Diode Test ............................................................................ 5-18
5-20. Frequency Test ..................................................................... 5-18
5-21. Calibration Adjustment............................................................. 5-19
5-22. Troubleshooting........................................................................ 5-21
Assembly.......................................................................... 5-9
ii
Page 7

Contents
5-23. Self-Tests............................................................................. 5-21
5-24. Ratio Self-Test................................................................. 5-21
5-25. Switch Decoding Self-Test.............................................. 5-22
5-26. Troubleshooting Guide ........................................................ 5-23
6 List of Replaceable Parts........................................................ 6-1
6-1. Introduction.............................................................................. 6-3
6-2. How to Obtain Parts................................................................. 6-3
6-3. Manual Status Information ...................................................... 6-4
6-4. Newer Instruments................................................................... 6-4
6-5. Service Centers........................................................................ 6-4
7 Schematic Diagrams ............................................................... 7-1
(continued)
iii
Page 8

8060A
Instruction Manual
iv
Page 9

List of Tables
Table Title Page
1-1. 8060A Specifications............................................................... 1-5
2-1. Controls, Indicators and Connectors........................................ 2-7
2-2. Input Overload Limits.............................................................. 2-10
2-3. Resistance Function Autoranges and Resolution..................... 2-20
2-4. Frequency Function Autoranges and Resolution..................... 2-30
2-5. Sensitivity for the Frequency Function.................................... 2-31
2-6. Maximum Input Voltages for the Frequency Function............ 2-31
3-1. Equivalent Voltage Levels for Modifying the Reference
Impedance................................................................................ 3-8
4-1. Voltage Input Divider.............................................................. 4-10
5-1. Required Test Equipment ........................................................ 5-4
5-2. Voltage Test............................................................................. 5-14
5-3. Resistance Test ........................................................................ 5-16
5-4. Current Test ............................................................................. 5-18
5-5. Frequency Test......................................................................... 5-18
5-6. Switch Decoding Self-Test...................................................... 5-23
5-7. Troubleshooting Guide............................................................ 5-24
5-8. Troubleshooting the Resistance Function: Voltage Sources
for Ranges................................................................................ 5-29
5-9. U3 (MAC) Pin Descriptions .................................................... 5-29
6-1. 8060A Final Assembly ............................................................ 6-5
6-2. A1 Main PCB Assembly.......................................................... 6-9
6-3. A3 Rms PCB Assembly........................................................... 6-13
v
Page 10

8060A
Instruction Manual
vi
Page 11

List of Figures
Figure Title Page
2-1. Removal of Battery Compartment Cover................................ 2-4
2-2. Battery Removal and Fuses ..................................................... 2-4
2-3. Controls, Indicators and Connectors........................................ 2-6
2-4. 8060A Display......................................................................... 2-8
2-5. Overrange Indicator................................................................. 2-9
2-6. Voltage Operation.................................................................... 2-11
2-7. AC and DC Wafeform Components........................................ 2-13
2-8. Multiplication Factors for Converting Waveforms.................. 2-14
2-10. Current Operation .................................................................... 2-17
2-11. Calculating Burden Voltage Error ........................................... 2-18
2-12. Resistance Operation ............................................................... 2-19
2-13. Selection of Autoranging Kilohms .......................................... 2-22
2-14. Conductance Operation............................................................ 2-23
2-15. Conductance/Resistance Conversion....................................... 2-24
2-16. Diode Test................................................................................ 2-25
2-17. Relative (REL) Operation........................................................ 2-26
2-18. Frequency (Hz) Operation ....................................................... 2-29
2-19. Decibel (dB) Operation............................................................ 2-33
2-20. Continuity (
3-1. Measuring Amplifier Bandwidth............................................. 3-4
3-2. Measuring Q with the 8060A................................................... 3-6
3-3. Measuring Stage Gain with Relative dB.................................. 3-6
4-1. 8060A Block Diagram............................................................. 4-4
4-2. Analog Portion of the A/D Converter...................................... 4-7
4-3. A/D Measurement Cycle.......................................................... 4-7
4-4. Voltage Measurement.............................................................. 4-9
4-5. Current Measurement............................................................... 4-11
4-6. Resistance/Conductance/Continuity Measurement.................. 4-12
4-7. Frequency Measurement.......................................................... 4-13
5-1. Calibration and Backup Fuse (F2) Access) ............................. 5-7
5-2. Assembling/Disassembling the Microcomputer PCB and
LCD ......................................................................................... 5-10
5-3. Disassembling the LCD........................................................... 5-11
5-4. General Equipment Connection............................................... 5-15
5-5. Equipment Connection for Current Test.................................. 5-17
6-1. 8060A Final Assembly ............................................................ 6-7
) Operation ................................................... 2-35
vii
Page 12

8060A
Instruction Manual
6-2. A1 Main PCB Assembly .......................................................... 6-12
6-3. A3 Rms PCB Assembly ........................................................... 6-14
7-1. A1 Main PCB Component Locations....................................... 7-3
7-2. Test Point Locations................................................................. 7-4
7-3. A/D Measurement Cycle.......................................................... 7-5
7-4. Switch Detail............................................................................ 7-6
7-5. A1 Main PCB Schematic Diagram........................................... 7-7
7-6. A3 rms PCB Schematic Diagram............................................. 7-8
viii
Page 13

Chapter 1
Introduction and Specifications
Contents Page
1-1. Introduction ...................................................................... 1-3
1-2. Items Furnished with Equipment...................................... 1-4
1-3. Specifications ................................................................... 1-4
1-1
Page 14

8060A
Instruction Manual
1-2
Page 15

Introduction and Specifications
Introduction
1
1-1. Introduction
Your Fluke Model 8060A is a handheld, microcomputer-based 4½ digit
multimeter that is ideally suited for use in the field, laboratory, shop, or
home. The 8060A has all the features that have become accepted standards
for quality handheld multimeters, as well as some new features that have not
been offered before in a handheld multimeter. New features include the
following:
•
True rms measurements for ac signals up to 100 kHz.
•
Frequency measurements up to 200 kHz.
•
Voltage measurements in dBm referenced to 600Ω or in dB relative to
an operator-selected reference voltage.
•
Resistance measurements up to 300 MΩ.
•
Ability to store any input signal as an offset or relative reference value.
Other features include:
• Functions:
All standard DMM measurement functions, such as ac and dc volts and
ac and dc current, as well as resistance, conductance, continuity, and
diode test.
• Ranges:
Leading zero suppression.
Automatic polarity.
Overrange indication.
Protection from overloads and transients up to 1500V peak.
Dual-slope integration a/d conversion to ensure noise-free
measurements.
Autoranging MΩ resistance range (to 300 MΩ), as well as four fixed
resistance ranges from 200Ω to 200 kΩ.
• Operator Convenience:
4½ digit Liquid Crystal Display.
Software-controlled self-test routines for quick verification of internal
circuitry and operation.
1-3
Page 16

8060A
Instruction Manual
•
Power:
170 hours of continuous operation can be expected from a 9V alkaline
battery (NEDA 1604).
Low battery voltage is automatically detected and displayed. The low
battery indication, BT, appears on the display when about 20% of the
battery life remains.
A full line of accessories is available to enhance the capabilities of the
8060A.
1-2. Items Furnished with Equipment
Items shipped with your True rms Multimeter are as follows:
•
Battery
• DMM Accessory List
• Instruction Manual
• Operator Guide Card
• Registration Form
• Statement of Calibration
• Test Leads
1-3. Specifications
The specifications for the 8060A are listed in Table 1-1.
1-4
Page 17

Introduction and Specifications
Specifications
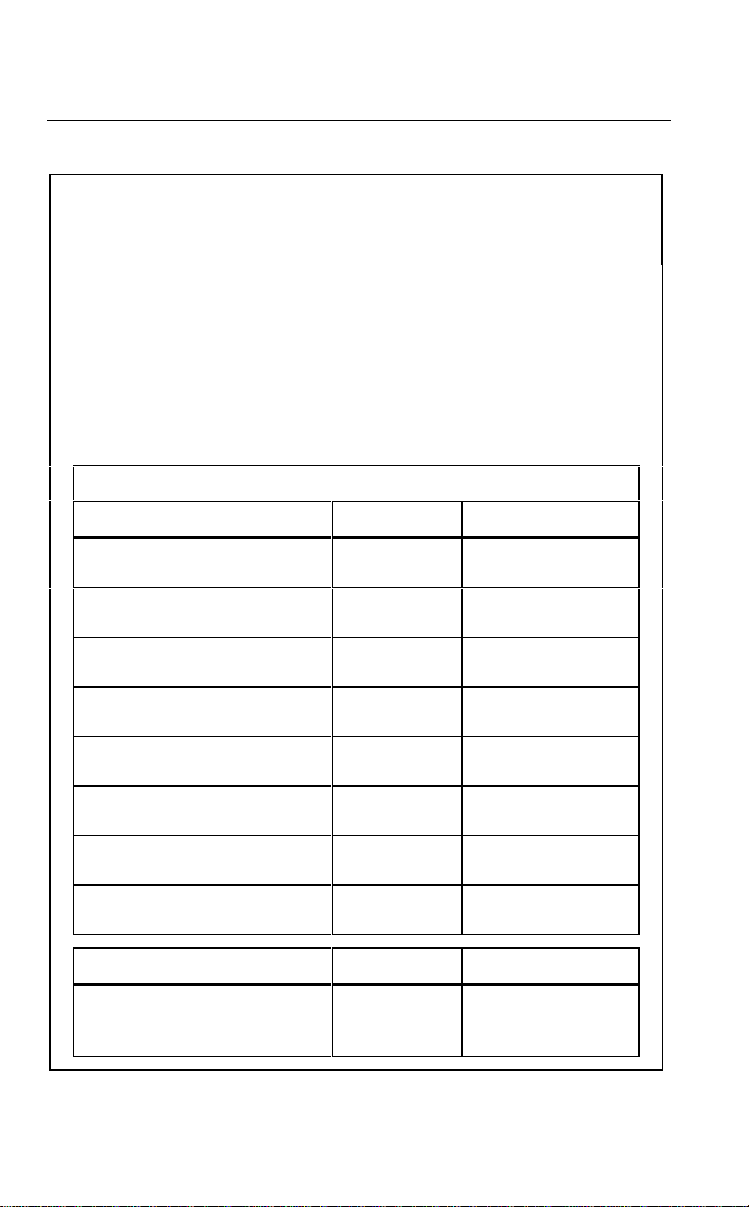
Table 1-1. 8060A Specifications
Electrical
The following specifications are based on a one-year calibration cycle, an
operating temperature of 18 to 28°C (64 to 82°F) and a relative humidity
not exceeding 80%.
DC Voltage
1
Range Resolution
200 mV
2V
20V
200V
1000V
Response Time............................. 1 second maximum, to rated
Input Impedance ........................... 10 MΩ nominal
Normal Mode Noise Rejection ...... >60 dB at 50 Hz or 60 Hz
Common Mode Noise Rejection ... >120 dB at dc, >90 dB at 50 Hz
Overload Protection ...................... 1000V dc or peak ac
DC Voltage, High Impedance Mode
All specifications are the same as for the dc voltage mode except
the following (only 200 mV and 2V ranges are available):
Range Resolutions
.01 mV
.1 mV
1 mV
10 mV
100 mV
±(% of reading + no. of digits)
accuracy within selected range.
and 60 Hz (1 kΩ imbalance)
continuous, except 20 seconds
maximum on 200 mV and 2V
ranges above 300V dc or rms.
±(% of reading + no. of digits)
Accuracy
0.04% + 2
0.05% + 2
Accuracy
200 mV
2V
Input Impedance ........................... >1,000 MΩ, typically 10,000 MΩ
Overload Protection ...................... 300V dc or rms continuous, 20
.01 mV
.1 mV
0.05% + 2
seconds maximum 300V to
1000V dc or peak ac.
1-5
Page 18
8060A
Instruction Manual
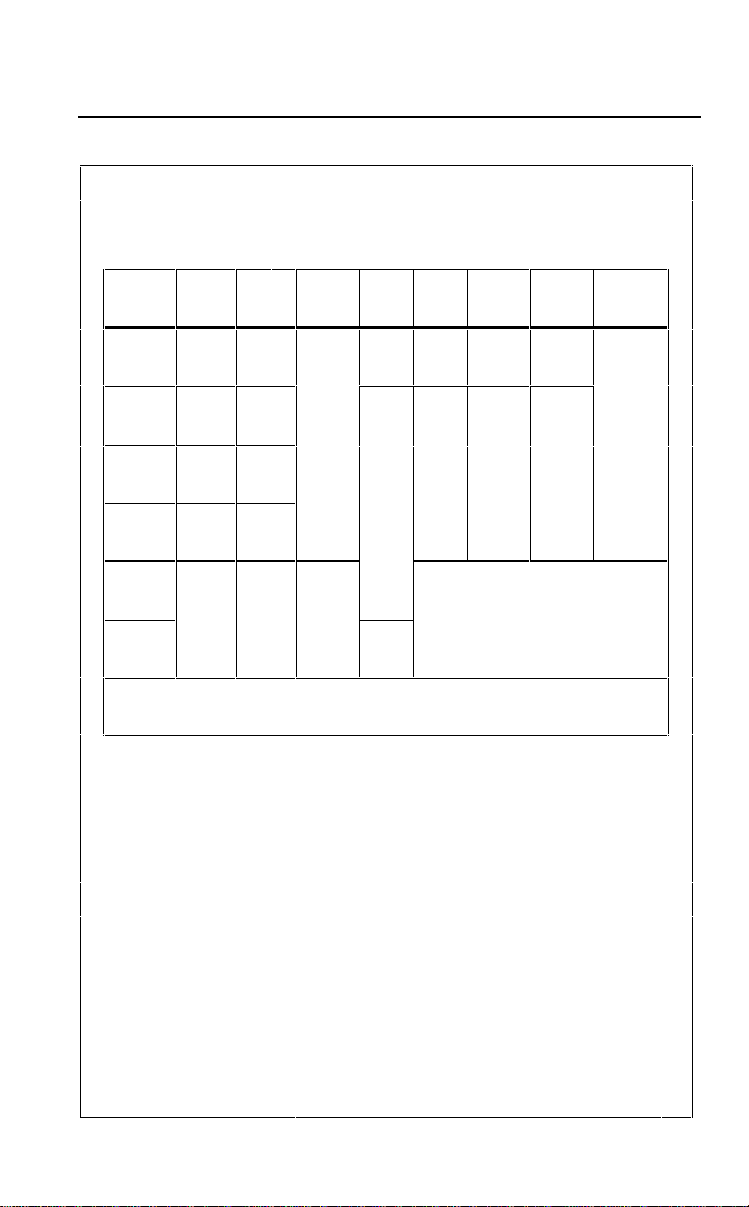
Table 1-1. 8060A Specifications (cont)
DC Voltage, dB Mode
Measurements are made in dBm referenced to 600Ω or relative dB. All
specifications are the same as for dc voltage except the following:
Dynamic Range............................. With full .01 dB resolution, 99.79
dB. Total specified dynamic
range is 136.22 dB (160 µV to
1000V).
Resolution and Accuracy .............. Depends on linear dc count
(count refers to the display in dc
volts independent of the decimal
points - see table below).
Accuracy
dBm Ref. 600
-74 to -56
(160 µV to 1.27 mV)
-55.6 to -37.6
(1.28 mV to 10.23 mV)
-37.58 to -31.77
(10.24 mV to 19.99 mV)
-31.76 to -11.76
(20 mV to 199.99 mV)
-11.76 to 8.24
(.2V to 1.9999V)
8.24 to 28.24
(2.000V to 19.999V)
28.24 to 48.24
(20.00V to 199.99V)
48.24 to 62.22
(200.0V to 1000V)
Linear Counts Resolution Accuracy
19.999 to 1024
1023 to 128
127 to 16
Ω
Range Tolerance
200 mV
200 mV
200 mV
200 mV
2V
20V
200V
1000V
.01 dB
.1 dB
1 dB
±1 dB
±.2 dB
±.04 dB
±.04 dB
±.04 dB
±.04 dB
±.04 dB
±.04 dB
±.04 dB
±.2 dB
±1 dB
1-6
Page 19
Introduction and Specifications
V
Specifications
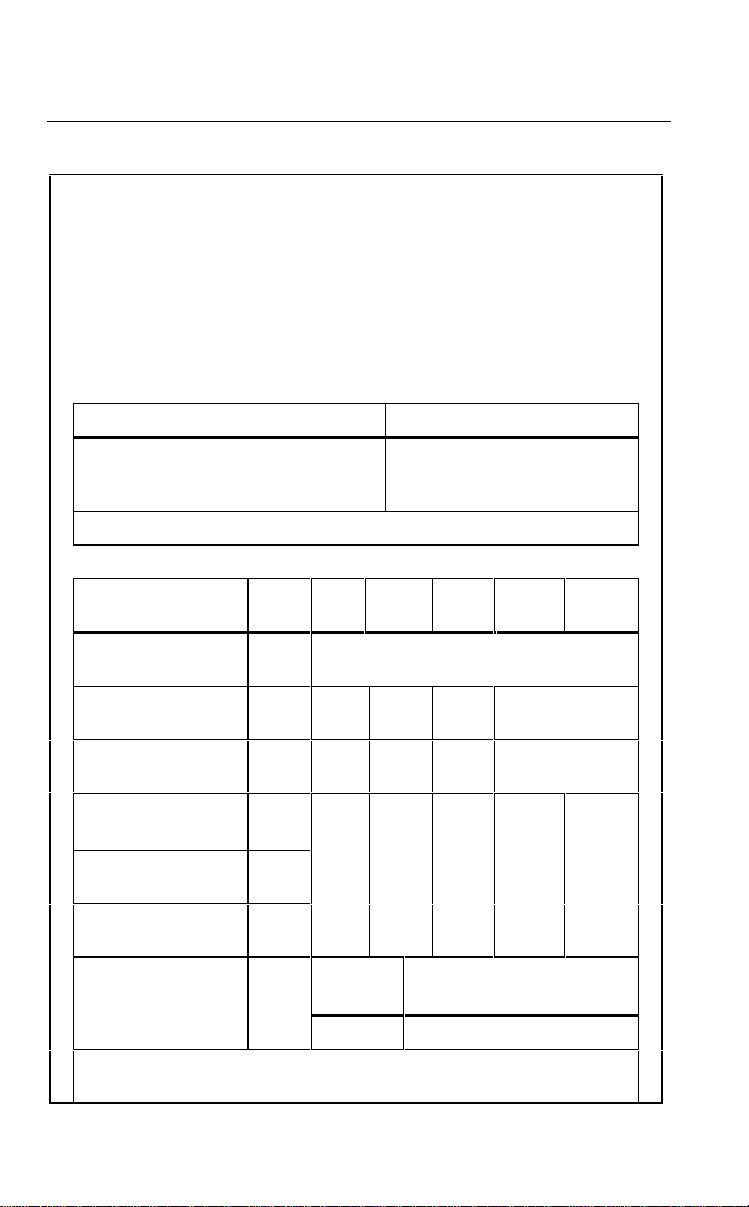
Table 1-1. 8060A Specifications (cont)
AC Voltage (True rms, AC-Coupled)
Ranges.................. 200 mV, 2V, 20V, 200V, 750V
Accuracy *............. ±(% of reading + no. of digits). See table below:
1
Input
Voltage
20.0 -
199.99 m
.2000 -
1.9999V
2.000 -
19.999V
20.00 -
199.99V
75.0 -
4.99.9V
500.0 -
750.0V
* Not specified for input signals <10% of range.
** For input voltage between 10% and 15% of range, add an additional 140 counts.
Reso-
Range
lution
.01 mV 200 mV
.1 mV 2V
1 mV 20V
10 mV 200V
100 mV 750V
20 Hz -
45 Hz -
1 kHz -
10 kHz -
45 Hz
1 kHz
10 kHz
30 kHz
0.2%
0.2%
0.5%
+ 12
+ 20
+ 401%+ 100
1% + 10
0.5%
0.5%
1% +40 2% +100
+12
+20
Not Not Specified
Specified
1%
+12
30 kHz -
50 kHz
50 kHz 100 kHz
3% +200**
Input Impedance......... 10 MΩ shunted by <100 pF
Common Mode Noise
Rejection..................... >60 dB at 50 Hz and 60 Hz (1 kΩ
imbalance)
Crest Factor Range .... 1:1 to 3:1
Response Time........... Five seconds maximum to rated accuracy
within selected range, 12 seconds to rated
accuracy from an overload.
Overload Protection.... 750V rms or 1000V peak continuous
except 20 seconds maximum on the 200
mV range above 300V rms or 300V dc.
Input not to exceed a volt-hertz product of
7
(for example, 200V at 50 kHz).
10
1-7
Page 20
8060A
0
Instruction Manual
Table 1-1. 8060A Specifications (cont)
AC Voltage, dB Mode (True rms, AC-Coupled)
Measurements are made in dBm referenced to 600Ω or relative dB. All
specifications are the same as for ac voltage except the following:
Dynamic Range... With full .01 dB resolution, 97.30 dBm. Total specified
Resolution ........... Depends on number of linear ac counts (count refers
dynamic range is 109.72 dBm (2.45 mV to 750.0V ac
rms).
to the actual number on the display independent of
the decimal point. See table below).
Linear Counts* Resolution
19.999 to 1024
1023 to 128
127 to 16
*Not specified below 245 counts.
Accuracy................. See table below:
dBm Ref. 600Ω Range 20 Hz -
-50.0 to -31.76
(2.45 mV to 20.00 mV)
-31.76 to -29.83
(20.00 mV to 25.00 mV)
-29.83 to -11.76
(25.00 mV to 199.99 mV)
-11.76 to 8.24
(.2000V to 1.9999V)
8.24 to 28.24
(2.000V to 19.999V)
28.24 to 48.24
(20.00V to 199.99V)
48.24 to 59.72 750V
(200.0V to 750.0V)
*Specification applies above 8000 linear counts.
**Not specified for input signals <10% of range.
45 Hz**
10 kHz**
200 mV Not Specified
200 mV 0.20 dB 0.50 dB 1.00 dB 2.70 dB
200 mV 0.10 dB 0.15 dB 0.30 dB 0.50 dB
2V
.10 dB*0.10 dB* 0.15 dB* 0.30 dB* 0.50 dB*
20V
200V 0.15 dB 0.30 dB 0.30 dB 0.65 dB 1.83 dB
20 Hz -
1 kHz**
0.5 dB Not Specified
45 Hz -
.01 dB
.1 dB
1 dB
10 kHz 30 kHz**
30 kHz 50 kHz**
1 kHz - 100 kHz**
50 kHz -
100 kHz**
1-8
Page 21
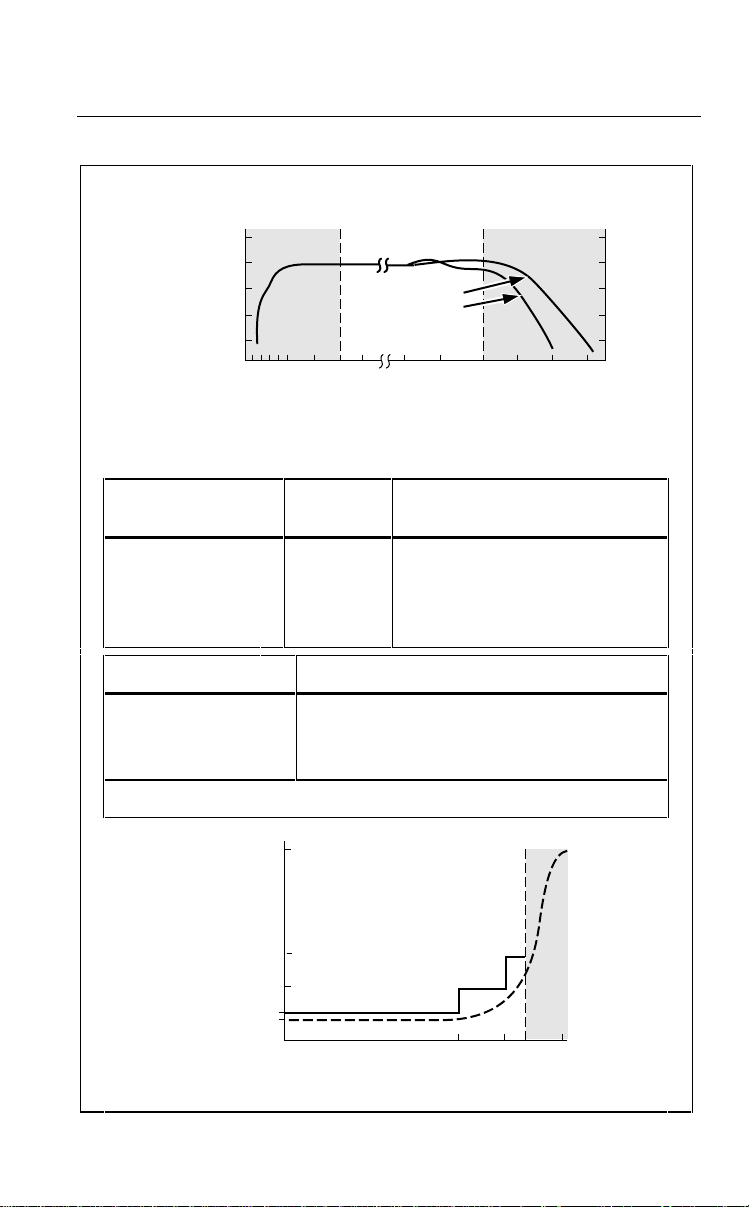
Table 1-1. 8060A Specifications (cont)
AC Voltage, dB Mode (cont.)
Introduction and Specifications
Specifications
1
+1
dB
(relative
to 200 Hz
reading)
0
-1
-2
-3
1Hz5Hz10Hz20Hz100Hz10
Not Specified
Typical Response in 200 mV Range
100 mV
kHz
25 mV
50
kHz
100
kHz
200
kHz
Frequency
Frequency Range
(Fully Autoranging)
200 Hz
2000 Hz
20 Hz
200 Hz
Resolution
.01 Hz
.1 Hz
1 Hz
10 Hz
(% of reading + no. of digits)
±
Accuracy
.05% + 1
Input Signal Sensitivity (based on sine wave V rms)
12 Hz to 20 kHz
20 kHz to 100 kHz
100 kHz to 200 kHz
20 mV or 10% of voltage range*
50 mV or 25% of voltage range*
150 mV or 75% of voltage range*
*Whichever value is greater.
300
400
kHz
kHz
Frequency
+1
0
-1
Not Specified
-2
-3
5V
150 mV
Voltage
50 mV
(sine wave rms)
20 mV
16 mV
Spec. Limit
Typical
Frequency (kHz)
Frequency Input Sensitivity (200 mV range)
Not Specified
70020010020
"
1-9
Page 22

8060A
Instruction Manual
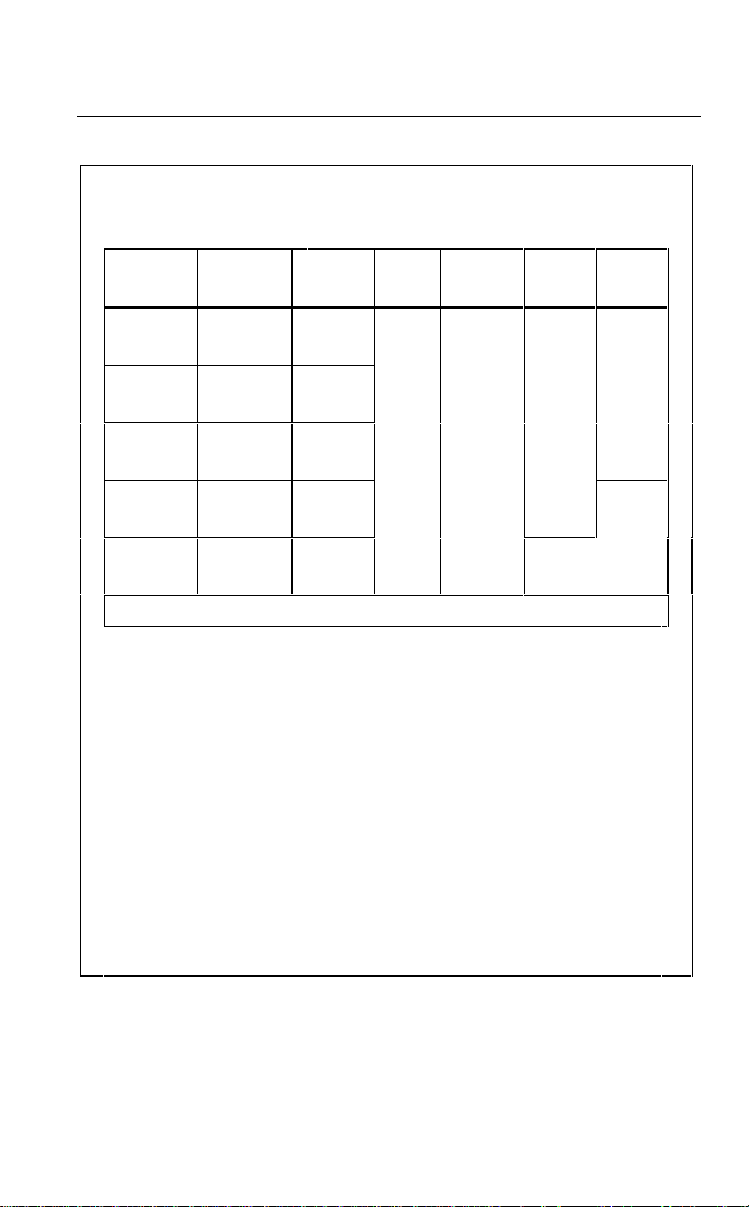
Frequency (cont.)
AC Voltage Range
Table 1-1. 8060A Specifications (cont)
Maximum Useable AC
Voltage*
200 MV
2V
20V
200V
750V
±5V peak
±50V peak
±500V peak
±1000V peak
±1000V peak
*Signal not to exceed a volt-hertz product of 1 x 10⁷.
Input Characteristics ..... Ac-coupled, 10 MΩ shunted by <100 pF
Overload Protection ...... 759V rms or 1000V peak continuous
except 20 seconds maximum on the 200
mV range above 300V rms or 300V dc.
Input not to exceed a volt-hertz product of
7
10
(for example, 200V at 50 kHz).
Extended Frequency
Selection................... Enabled by holding down Hz button at
power on.
Range....................... 12 Hz to 700 kHz, typically.
Resolution ................ 100 Hz above 200 kHz.
Accuracy................... ±(0.5% of reading + 2 digits)
Sensitivity
(sine wave V rms)..... Typically 100 mV at 200 kHz increasing to
4.5V at 700 kHz in the 200 mV range. Will
measure a TTL signal (50% duty cycle) to
420 kHz, typically.
Resistance
Ranges.......................... 200Ω, 2 kΩ, 20 kΩ, 200 kΩ, autoranging
MΩ. The MΩ range extends from .0001
mΩ to 300 MΩ in three autoranged
ranges. Upscale range changes are made
at 2 MΩ and 20 MΩ. Downscale range
changes are made at 19 MΩ and 1.9 MΩ.
Accuracy ....................... ±(% of reading + no. of digits). See table
below.
1-10
Page 23
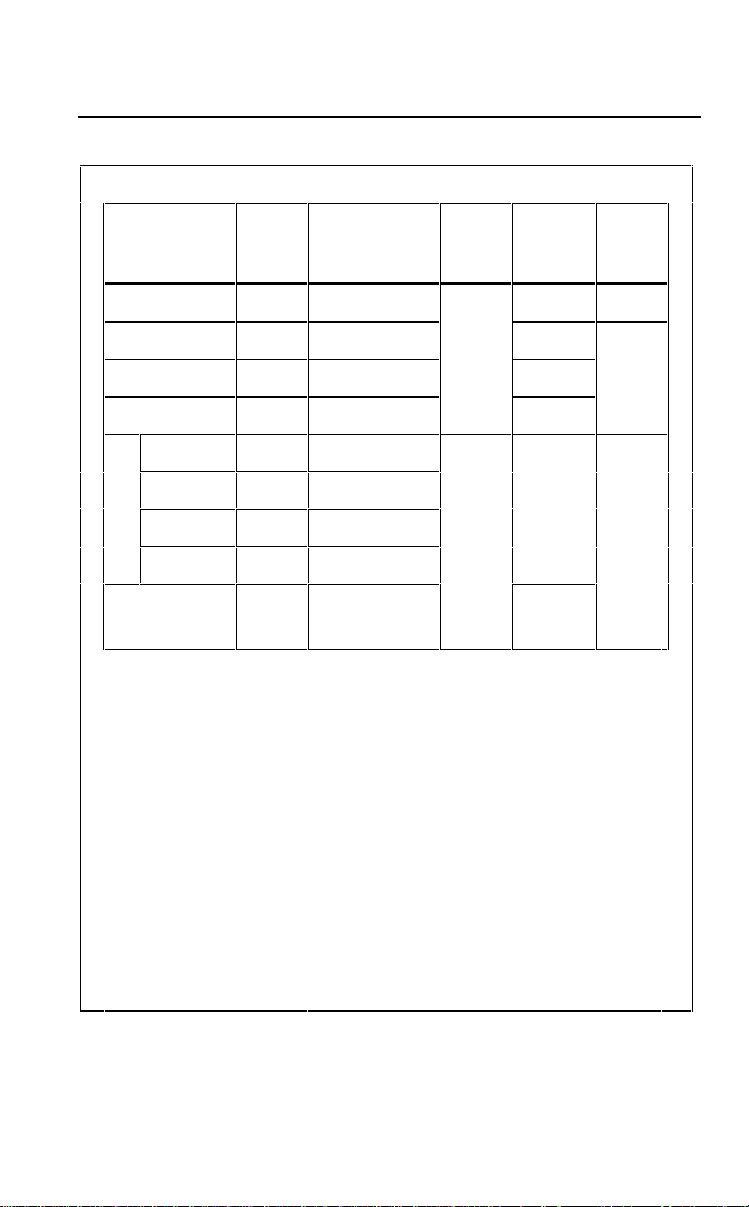
Table 1-1. 8060A Specifications (cont)
Resistance (cont.)
Introduction and Specifications
Specifications
1
Range
200Ω 0.01Ω (0.07%+2+.02Ω) <1.1 mA <4.8V
2 kΩ 0.1Ω (0.07%+2)
20 kΩ 1Ω (0.07%+2) <15 µA <1.5V
200 kΩ 10Ω (0.07%+2) <1.5 µA
0-1.9999 MΩ 100Ω (0.15%+2)
2-19.99 M
MΩ
20-99.9 MΩ 100 kΩ (1%+3) <2.5V <2.5V
100-300 MΩ 1 M Ω (2%+3)
Autoranging
k
Ω
Resolution
Ω 10 kΩ (0.2%+3) 2.5 µA
0.1Ω
to 1 kΩ
Accuracy
(0.2%+5) <1.0 mA
Full-
scale
Voltage
<250 mV
Max
Current
<150 µA
Response Time.............. Two seconds maximum to rated accuracy
for all ranges except MΩ. For MΩ, 8
seconds maximum.
Overload Protection....... 300V dc or rms ac for all ranges
Conductance
Open
Circuit
Voltage
Range............................ 2000 nS (equivalent to a resistance
range from 500 kΩ to 10,000 MΩ)
Resolution...................... 0.1 nS
Accuracy........................ ±(0.5% of reading + 20 digits)
Open Circuit Voltage...... <1.5V
Overload Protection....... 300V dc or rms ac
1-11
Page 24
8060A
Instruction Manual
Table 1-1. 8060A Specifications (cont)
Continuity
Ranges.......................... All resistance ranges
Threshold ...................... Nominally 10% of range (for example,
Display Indication.......... Horizontal bar across the top of the
Response Time............. 50 µs maximum (10 µs typical)
Overload Protection ...... 300V dc or rms ac
Diode Test
Range............................ 2V
Test Current.................. 1 mA (typical)
Accuracy ....................... ±(0.05% of reading + 2 digits)
Response Time............. 2 seconds maximum
Overload Protection ...... 300V dc or rms ac
DC Current
Range Resolution
20Ω in the 200Ω range) for 200Ω, 2 kΩ,
20 kΩ, 200 kΩ ranges. Nominally 20 kΩ
in MΩ range.
display and/or 2.667 kHz tone. Indication
is present for a minimum of 200 ms.
(Specification applies for voltage
measurement)
Accuracy
±(% of reading + no. of
digits)
Burden
Voltage
200 µA
2 mA
20 mA
200 mA
2000 mA
Overload Protection ......... 2A/250V fuse (operator replaceable) in
.01 µA
.1 µA
1 µA
10 µA
100 µA
0.2% + 2
0.3% + 2
series with 3A/600V fuse (service
personnel replaceable).
1-12
.3V typical
.3V typical
.3V typical
.3V typical
.9V typical
Page 25
Introduction and Specifications
Table 1-1. 8060A Specifications (cont)
AC Current (True rms Responding, AC-Coupled
Accuracy *.......................
Input
Current
Resolution Range
±(% of reading + no. of digits). See table
below:
20 Hz -
45 Hz
45 Hz -
3 kHz
Specifications
3 kHz 10 kHz
10 kHz -
30 kHz
1
20.00 to
199.99 µA
.2000 to
1.9999 mA
2.000 to
19.999 mA
20.00 to
199.99 mA
200 to
1999.9 mA
*Not specified for input < 10% of scale
0.01 µA 200 µA
0.1 µA 2 mA 2% + 40
1 µA 20 mA
10 µA 200 mA
100 µA 2000 mA
1% + 10 0.75% + 10 2% + 20
Not Specified
Burden Voltage ............. 0.3V rms typical except 2000 mA range,
0.9V rms typical
Overload Protection ...... 2A/250V fuse (operator replaceable) in
series with 3A/600V fuse (service
personnel replaceable).
Relative
Selection ....................... When the REL button is pushed, the
input applied at that time is stored as a
zero reference point. Subsequent
readings indicate deviations (±) from the
reference point.
Accuracy ....................... Error does not exceed the sum of the
errors of the reference reading and the
subsequent reading.
1-13
Page 26

8060A
Instruction Manual
Table 1-1. 8060A Specifications (cont)
General
Maximum Common
Mode Voltage............... 500V dc or ac rms
Display Update Rate ... 2.5 readings/second for all functions
except frequency and dB. For frequency,
1 reading/second. For dB, 1.4
readings/second.
Electromagnetic
Compatibility ..................
Display ............................ 4½ digit duplex LCD (19,999 counts),
Display Annunciators.... BT (low battery indicator), Hz or kHz
In an RF field of 1 V/m on all ranges
and functions: Total Accuracy =
Specified Accuracy + 2.3% of range.
Performance above 1 V/m is not
specified.
leading zero suppression, autopolarity.
(frequency unit), dB (dB function
enabled), REL (relative function
enabled).
function enabled), and — (bar indicates
continuity detected).
and (continuity
A/D Converter................. Dual-slope converter
Power .............................. Single standard 9V battery (NEDA
1604)
Battery Life ..................... Typically 170 hours with an alkaline
battery. BT appears on display when
approximately 20% of battery life
remains.
Size.................................. 180 mm L x 86 mm W x 45 mm H (7.1”
L x 3.4” W x 1.8” H)
Weight ............................. .41 kg (14.5 oz.)
Shock and Vibration ...... MIL-T-28800B
1-14
Page 27

Introduction and Specifications
Table 1-1. 8060A Specifications (cont)
General (cont)
Environmental
Operating Temperature ..... 0 to 50°C
Storage Temperature......... -35 to + 60°C
Specifications
1
Accuracy Temperature
Coefficient...........................
Relative Humidity............... 0 to 80% R.H. from 0 to + 35°C, 0 to
Safety
Safety Standards................ Designed to Protection Class II
Certifications
0.1 x the applicable accuracy
specification per °C (plus the initial
23°C specification) for 0 to 18°C and
28 to 50°C.
70% from + 35°C to + 50°C, except 0
to 70% R.H. for MΩ range above 20
MΩ.
requirements of IEC 348, UL1244
ANSI C39.5 andCSA Bulletin 556B.
1-15
Page 28

8060A
Instruction Manual
1-16
Page 29

Chapter 2
Operating Instructions
Contents Page
2-1. Introduction ..................................................................... 2-3
2-2. Unpacking Your Instrument............................................ 2-3
2-3. Battery Installation or Replacement................................ 2-3
2-4. Fuse Replacement............................................................ 2-5
2-5. Physical Features............................................................. 2-6
2-6. Front Panel................................................................... 2-6
2-7. Display......................................................................... 2-8
2-8. Signal Input Limits.......................................................... 2-9
2-9. Operation......................................................................... 2-10
2-10. Power-On Self-Test ..................................................... 2-10
2-11. AC/DC Voltage (V)..................................................... 2-11
2-12. True rms Measurement............................................. 2-12
2-13. AC-Coupled AC Measurements............................... 2-12
2-14. Waveform Comparison and Conversion.................. 2-13
2-15. High Impedance DC Voltage................................... 2-14
2-16. AC/DC Current (A) ..................................................... 2-16
2-17. Resistance (Ω).............................................................. 2-18
2-18. Autoranging Megohms............................................. 2-19
2-19. Autoranging Kilohms............................................... 2-20
2-20. Conductance (S)........................................................... 2-21
2-21. Diode Test (
2-22. Relative (REL)............................................................. 2-25
2-23. Frequency (Hz) ............................................................ 2-27
2-24. Decibel (dB)................................................................. 2-30
2-25. dBV.............................................................................. 2-31
2-26. Continuity (
2-27. Initial Check-Out Procedure............................................ 2-34
)........................................................... 2-23
) .................................................... 2-32
2-1
Page 30

8060A
Instruction Manual
2-2
Page 31

Operating Instructions
Introduction
2
2-1. Introduction
This chapter describes how to make measurements with your 8060A. Even
though you may have used a multimeter before, we suggest that you take the
time to read this material carefully so that you can take full advantage of the
wide variety of measurement functions offered by the 8060A.
2-2. Unpacking Your Instrument
Your instrument was shipped with two test leads (one red and one black), a
9V battery, and this manual. Check the shipment carefully and immediately
contact the place of purchase if anything is missing or damaged in shipment.
If reshipment is necessary, please use the original shipping container. If the
original container is not available, be sure that adequate protection is
provided to prevent damage during shipment. It is recommended that the
instrument be surrounded by at least three inches of shock-absorbing
material in the shipping container.
2-3. Battery Installation or Replacement
The 8060A is designed to operate on a single, common, inexpensive 9V
battery (NEDA 1604). When you receive the instrument, the battery will not
be installed. You can expect a typical operating life of up to 170 hours with
an alkaline batter, or 80 hours with a carbon-zinc battery. When the battery
has exhausted about 80% of its useful life the BT indicator will appear at the
far left of the display. Your instrument will continue to operate properly for
at least 24 hours with an alkaline battery after BT first appears on the
display. The 8060A also may be operated from a standard ac power line
outlet when used with the optional A81 Battery Eliminator (refer to Chapter
7 for a description). Use the following procedure to install or replace the
battery:
Warning
To avoid electrical shock, turn off the instrument and
remove the test leads and any input signals before
replacing the battery.
2-3
Page 32

8060A
Instruction Manual
1. Set the 8060A power switch to OFF.
2. Remove test leads from external connections and from the 8060A input
terminals.
3. Turn the instrument over and remove screw from battery cover as shown
in Figure 2-1.
4. Use your thumbs to push off the battery cover as shown in Figure 2-1.
5. Slide the battery out of the compartment as shown in Figure 2-2.
6. Carefully pull the battery clip free from the battery terminals (if
replacing the battery) and attach the new battery.
7. Slide the battery and its leads into the compartment and slide the cover
into place.
WARNING
TO AVOID SHOCK REMOVE
INPUTS BEFORE OPENING
CLOSE COVER BEFORE USE
WARNING
TO AVOID SHOCK REMOVE
INPUTS BEFORE OPENING
CLOSE COVER BEFORE USE
Use thumbs to push
battery cover down
and then out from
instrument case.
2-4
Backside of
8060A
dx03f.eps
Figure 2-1. Removal of Battery Compartment Cover
Fuse in Circuit
Spare Fuse
dx04f.eps
Figure 2-2. Battery Removal and Fuses
Page 33

Operating Instructions
Fuse Replacement
You can measure the voltage of your battery by using the following
procedure:
1. Select the dc voltage function and the 20V range (refer ahead to Figure
2-6 if necessary).
2. Locate the opening for the battery eliminator jack on the right side of the
instrument to the right of the display. Touch the red (VΩS) probe tip to
the side contact (not the center pin). Be sure you do not short the battery
by shorting the side contact to the center pin. Battery voltage should be
between 5.2V to 10V for proper operation. If the voltage is less, the
battery should be replaced.
2
2-4. Fuse Replacement
There are two fuses located at the right side of the battery compartment
(refer to Figure 2-2 or examine your instrument). The fuse at the far right is
F1. Fuse F1, 2A/250V, protects the current input from an input overload.
The other fuse is a spare fuse for F1. When you purchase your instrument,
F1 should be installed and the spare fuse should be in one of the two slots
next to it. The larger slot is for the American-style fuse, and the smaller slot
is for the European-style fuse (either style fuse fits in the installation
compartment).
If you need to replace F1, use the tip of a test lead to push the fuse forward
from the end and then up to release. Replace F1 with the appropriate
2A/250V fuse; American-style: fast-acting, type AGX2, 1/4 x 1”, Fluke PN
376582; European-style: 5 x 20 mm, Fluke PN 460972. Do not use makeshift
fuses or short-circuit the fuseholder.
There is another fuse, F2, 3A/600V, which also protects the current input.
The instrument cover must be removed to replace F2. This procedure is
described in Chapter 5 and should only be done by a person qualified to
service the instrument.
The following steps provide a quick and easy way to check the condition of
both fuses F1 and F2:
1. Select the resistance function and the 2 kΩ range.
2. Touch the red test lead tip to the A input jack so that the VΩS input and
the A input are shorted together.
3. If the display reads .1000 ± .0100 kΩ, both fuses are good.
4. If the display reads OL, one or both fuses need replacement.
2-5
Page 34

8060A
Instruction Manual
2-5. Physical Features
Before you begin using your 8060A, we suggest you take a few minutes to
familiarize yourself with the instrument. All of the externally accessible
features are shown in Figure 2-3 and described in Table 2-1. The front panel
and the display are also described in the following paragraphs.
12
11
10
9
8
7
Figure 2-3. Controls, Indicators and Connectors
2-6. Front Panel
Hz
2000mA
200mA
20mA
2mA
dB
1000 DC
200µA
750 AC
DC
1
REL
MΩ
2000nS
200k
200
20k
20
2k
2
200Ω
200mV
Hz
AC
A
A
V
2A MAX
COMMON
!
Ω
500V MAX
S
V Ω S
!
1000V DC
750V AC
MAX
2
3
4
5
6
dx05f.eps
The front panel of the 8060A is designed to make function and range
selection easy. The symbols and colors on the panel indicate which switches
to push or buttons to press to select the function you want. Details are
provided later with the description of each function.
2-6
Page 35

Operating Instructions
Physical Features
Table 2-1. Controls, Indicators and Connectors
2
Item
No.
1
*
2 Function Buttons:
3 Battery
4V Ω S Input
5 COMMON Input
6 A Input Connector Protected test lead connector used as the
7 Function
8 AC/DC Function
9 Range Switches Interlocked switches that are used to select
* For safe operation, fully insert the A81.
Name Function
Battery Eliminator
Connector
Hz, dB,
REL
Compartment and
Cover
Connector
Connector
Switches: A,V,
Ω,S
Switch
External input power connector for use with
the A81 Battery Eliminator accessory.
Push buttons that toggle on or toggle off the
‘secondary functions: frequency, dB, visible
,
or audible continuity, or relative. These
functions are selected in conjunction with the
primary measurement functions (see items 7
and 8).
Cover for the 9V battery and the current fuse
F1.
Protected test lead connector used as the
high input for all voltage, conductance,
resistance, continuity, frequency
measurements and diode test. All test lead
connectors accept standard or safetydesigned banana plugs.
Protected test lead connector used as the
low or commom input for all measurements.
high input for current measurements.
Interlocked switches that are used in
conduction with the input connectors to select
the measurement functions. Pushing one
switch releases the other, or both may be
pushed together.
Push-on/push-off switch is used to select ac
or dc for current or voltage measurements.
(Does not affect selection of diode test,
resistance, or conductance functions).
ranges. Pushing a switch selects the
corresponding range and released other
switch depressions. Also used to select
conductance and the diode test.
2-7
Page 36

8060A
Instruction Manual
Table 2-1. Controls, Indicators and Connectors (cont)
Item
No.
Name Function
10 Tilt Bail A fold-out stand. The bail may also be
removed (press on one of the legs at the
hinge of the bail) and reinserted from the top
as a hook for hanging the instrument.
11 Power Switch Slide switch for turning instrument on or off.
12 Display 4½ digit LCD display (19999 maximum) with
decimal point, minus sign, over-range, Hz,
dB, continuity and relative indicators.
2-7. Display
The 8060A provides measurement results on the 4½ digit LCD display (refer
to Figure 2-4 or your instrument). The decimal point is placed automatically.
Symbols in the upper portion of the display indicate when one of the
secondary functions is enabled. The unit for the autoranging frequency
measurement is displayed automatically as Hz or kHz. The units for all the
other measurements are indicated by the range switch that is pushed in.
Leading zeros are not displayed.
dB Function in Use
Frequency Unit
(Hz or kHz)
Continuity
Indicator
Visible Continuity
Enabled
Audible
Continuity
Enabled
2-8
Low Battery
Indicator
Relative
Function
in Use
dx06f.eps
Figure 2-4. 8060A Display
Page 37

Operating Instructions
Signal Input Limits
If you are taking a measurement and the OL symbol appears on the display
(Figure 2-5), an overrange condition is indicated, meaning that the input is
higher than the range selected. You should select a higher range for the
measurement. The OL symbol does not necessarily mean that the instrument
is being exposed to a damaging input condition. For example, when
measuring resistance, an open input will cause OL to appear.
2
Figure 2-5. Overrange Indicator
2-8. Signal Input Limits
Caution
Exceeding the maximum input overload limits can
damage your instrument.
Before you begin to use your 8060A, it is important to note the maximum
inputs that may be applied to the instrument. Table 2-2 presents the
maximum inputs that are allowed for each function, range, and input
terminal.
Warning
To avoid electrical shock and/or instrument damage, do
not connect the common input terminal to any source
more than 1000 volts dc or rms ac above earth ground.
dx07f.eps
2-9
Page 38

8060A
Instruction Manual
Function Input Terminals Maximum Input Limit
Table 2-2. Input Overload Limits
AC Voltage, AC dB,
Frequency
DC Voltage, DC dB VΩS and COMMON 1000V dc or peak ac
AC or DC Current A and COMMON 2A maximum, fuse
Resistance,
Conductance, Diode
Test, and Continuity
VΩS and COMMON 750V rms or 1000V peak
continuous except 20
seconds maximum on the
200 mV range above 300V
dc or ac rms.
continuous except 20
seconds maximum on the
200 mV and 2V ranges
above 300V dc or ac rms.
protected to 600V dc or ac
rms.
VΩS and COMMON 300V dc or ac rms
2-9. Operation
The following paragraphs describe the power-on self-test, and how to
operate your 8060A in each of the seven primary functions or the four
secondary functions.
2-10. Power-On Self-Test
To turn on your instrument, locate the green switch on the left side of the
instrument and slide it forward. Whenever you turn on the instrument, the
8060A automatically performs a self-test to make sure the display and the
microcomputer are functioning properly. If everything is functioning
properly, all the LCD segments in the display will turn on (Figure 2-4). After
about one or two seconds, the display will go blank briefly before responding
to switch selections.
2-10
Page 39

Operating Instructions
Operation
2
If the LCD segments do not all turn on during the self-test, or if the
instrument does not clear the display after the test and then respond to switch
selections, something is probably wrong with the instrument. Try the test
again, and if it fails, have a qualified person refer to Chapter 5. If there is no
display when you turn on the instrument, check the battery and battery
connections. You will find that if you turn off your instrument and then
immediately turn it back on, a random assortment of LCD segments may be
displayed. This is normal. After about a second the instrument should turn on
all the LCD segments as usual during the self-test.
2-11. AC/DC Voltage (V)
Selection of the ac or dc voltage (V) functions is described in Figure 2-6.
The 8060A offers five ac and five dc voltage ranges: 200 mV, 2V, 20V,
200V, and 750Vac/1000V dc. All ranges present a 10 MΩ input impedance,
which is shunted by <100 pF in ac voltage measurements.
Voltage (V)
REL
dB
1. Select a range.
2. Set AC/DC switch out
for DC, in for AC.
3. Press switch in to select
voltage function.
4. Ensure all other switches are out.
Hz
2000mA
200mA
MΩ
2000nS
1000 DC
750 AC
200k
200
20k
20
20mA
2k
2
2mA
200Ω
200mV
200µA
DC
Hz
AC
V
A
COMMON
A
!
2A MAX
Ω
500V MAX
S
V Ω S
1000V DC
750V AC
!
MAX
Low (-)
High (+)
5. Connect the test leads as shown above.
6. Heed the input overload limits (Table 2-2) and connect the leads
to the circuit being measured.
7. Read the measured value on the display.
Figure 2-6. Voltage Operation
dx08f.eps
2-11
Page 40

8060A
Instruction Manual
2-12. True rms Measurement
One of the most useful features of the 8060A is the direct measurement of
the True rms or effective ac voltages and ac currents. Mathematically, rms is
defined as the square root of the sum of the squares of the ac and dc
components. In physical terms, rms is equivalent to the dc value that
dissipates the same amount of heat in a resistor as the original waveform.
The reason that rms is so valuable is that it greatly simplifies the analysis of
complex ac signals. Since rms is the dc equivalent to the original waveform,
it can be used in the relationships derived from Ohm’s law (E = I x R), and it
provides a reliable basis for comparing dissimilar waveforms.
Most meters in use today have average-responding ac converters rather than
true rms ac converters like the 8060A. Usually the gain in averageresponding meters is adjusted so that the reading gives the rms value,
provided the input signal is a harmonic-free sinusoid. However, if the signal
is not sinusoidal, the average-responding meter does not give correct rms
readings.
The 8060A ac converter actually calculates the rms value through analog
computation. This means that 8060A readings are accurate rms values not
only for harmonic-free sinusoids, but also for mixed frequencies, modulated
signals, square waves, sawtooths, 10%-duty-cycle rectangular pulses, etc.
2-13. AC-Coupled AC Measurements
Input signals are ac-coupled in the ac functions. One of the major advantages
of ac-coupling is that ripple measurements can be made on power supplies,
phone lines, etc. Ripple measurements cannot be made with dc-coupling.
Remember, however, that when the 8060A measures signals with the ac
voltage function, the reading on the display does not include the dc
component (if it exists). For example, consider the waveform in Figure 2-7.
The ac voltage function will measure the ac rms component. The dc voltage
function will measure the dc component. To obtain the total rms value for
such a waveform, first measure the ac and dc values separately, then
calculate the total rms value using the formula given in Figure 2-7.
2-12
Page 41

0V
RMS Total =
(ac rms component)
Operating Instructions
Operation
AC Component
DC Component
2
+ (dc component)
2
2
Figure 2-7. AC and DC Waveform Components
dx09f.eps
2-14. Waveform Comparison and Conversion
Figure 2-8 shows the relationship between common waveforms and the
display readings for the 8060A and average-responding meters. Figure 2-8
also illustrates the relationship between ac and dc measurements for accoupled meters. For example, consider the first waveform, a 1.414V (0-pk)
sinewave. Both the 8060A and the rms-calibrated average-responding meter
display the correct rms reading of 1.000V (the dc component equals 0).
However, consider the 1.414V (0-pk) rectified square wave. Both types of
meters correctly measure the dc component (0.707V). But only the 8060A
correctly measures the ac component (0.707V). The average-responding
meter measures 0.785V, which amounts to a 5.6% error in the total rms
measurement calculated from the ac and dc components.
2-13
Page 42

8060A
Instruction Manual
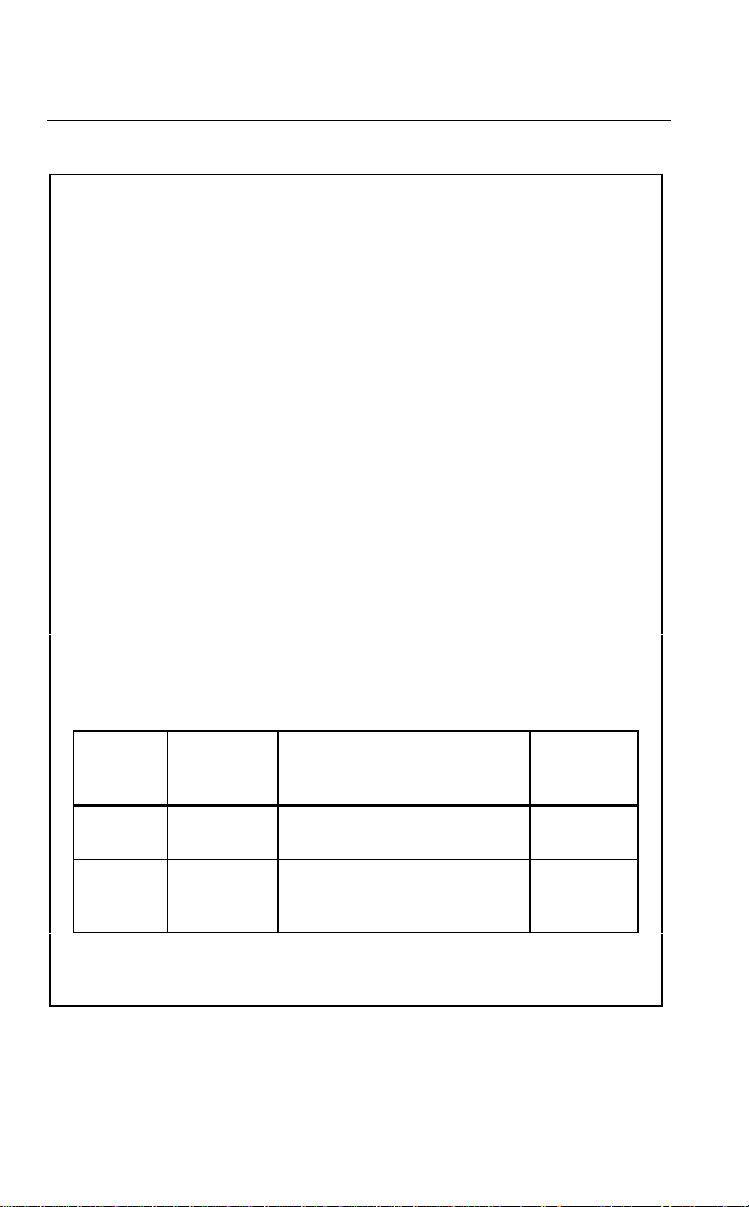
AC Coupled Peak Voltages Display Readings DC and AC
Input AC Component Only DC Total rms
Waveform PK - PK 0 - PK
Sine
PK
0
Rectified Sine
(Full Wave)
PK
0
Rectified Sine
(Half Wave)
PK
0
Square
PK
0
Rectified
Square
PK-PK
PK
0
Rectangular
Pulse
PK
X
0
Y
D = X/Y
K = D-D
Triangle
Sawtooth
PK
0
PK-PK
PK-PK
PK-PK
PK-PK
PK-PK
2
PK-PK
2.828 1.414 1.000 1.000 0.000 1.000
1.414 1.414 0.421 0.435 0.900 1.000
2.000 2.000 0.764 0.771 0.636 1.000
2.000 1.000 1.110 1.000 0.000 1.000
1.414 1.414 0.785 0.707 0.707 1.000
2.000 2.000 2.22K 2K 2D 2
3.464 1.732 0.960 1.000 0.000 1.000
rms CAL* 8062A
Component
only
TRUE RMS =
22
ac + dc
D
rms CAL is the displayed value for average responding meters that are calibrated to display rms for sine waves.
Figure 2-8. Multiplication Factors for Converting Waveforms
Since average-responding meters have been in use for so long, you may have
accumulated test or reference data based on them. The conversion factors in
Figure 2-8 should help you convert between the two measurement methods.
2-15. High Impedance DC Voltage
Occasionally you may want to make dc voltage measurements in high
impedance circuitry where even the 10 MΩ input impedance for the normal
dc voltage function could load the circuit and cause significant errors. For
example, a 10 MΩ input impedance causes a 0.1% error when measuring the
voltage across the 10 kΩ leg of a 90 kΩ over 10 kΩ voltage divider. The
8060A offers a >1,000 MΩ (typically >10,000 MΩ) input impedance dc
voltage function which greatly reduces this error.
2-14
Page 43

Operating Instructions
Operation
2
Figure 2-9 describes how to select the high input impedance dc voltage
function (the ac voltage function does not operate in this mode). Notice that
all of the function switches must be out to select this function. Either the 2V
or the 200 mV range may be selected. Refer to Chapter 3 for more
applications of this function, including a technique for using the 8060A as an
electrometer to measure extremely low currents.
Note
When taking measurements in the high impedance dc voltage
function, do not select any ranges except the 2V or 200 mV ranges.
Measurement in other ranges will result in erroneous readings.
Note
When the high impedance dc voltage function is selected and no
input is applied, noise from the environment (such as rf or power
line noise) may cause the 8060A to display OL (overrange).
High Impedance
DC Voltage (V)
Hz
1. Select the 2V or
2000mA
the 200 mV range.
2. Ensure all function
switches are out.
3. Connect the test leads as shown.
4. Heed the input overload limits
(Table 2-2) and connect the leads to
the circuit being measured.
5. Read the measured value on the display.
Figure 2-9. High Impedance DC Voltage
200mA
REL
dB
MΩ
2000nS
1000 DC
750 AC
200k
200
20k
20
20mA
2k
2
2mA
200Ω
200mV
200µA
DC
Hz
AC
V
A
COMMON
A
!
2A MAX
Ω
500V MAX
S
V Ω S
!
1000V DC
750V AC
Low (-)
High (+)
MAX
dx10f.eps
2-15
Page 44

8060A
Instruction Manual
2-16. AC/DC Current (A)
Selection of the ac or dc current (A) function is described is Figure 2-10. The
8060A offers five ac (true rms ac-coupled) and five dc current ranges: 200
µ
A, 2 mA, 20 mA, 200 mA, 2000 mA. Each range is protected by a
2A/250V fuse in series with a 3A/600V fuse.
When a meter is placed in series with a circuit to measure current, you may
have to consider an error caused by the voltage drop across the meter (in this
case, across the protective fuses and current shunts). This voltage drop is
called the burden voltage. The maximum full-scale burden voltages for the
8060A are 0.3V for the four lowest ranges and 0.9V for the highest range.
These voltage drops can affect the accuracy of a current measurement if the
current source is unregulated and the resistance of the shunt and fuses
represents a significant part (1/1000 or more) of the source resistance. If
burden voltage does present a problem, you can calculated the error by using
the formula in Figure 2-11. You can minimize this error by selecting the
highest current range that provides the necessary resolution.
Current (A)
1. Select a range.
2. Set AC/DC switch out
for DC, in for AC.
3. Push both switches at the same
time to select current function.
4. Ensure all other switches are out.
5. Connect the test leads as shown.
6. Heed the input overload limits (Table 2-2)
and connect the test leads to the circuit being
measured.
7. Read the measured value on the display.
Figure 2-10. Current Operation
2-16
Hz
2000mA
200mA
REL
dB
MΩ
1000 DC
750 AC
200k
200
20k
20
20mA
2k
2
2mA
200mV
200µA
DC
Hz
AC
V
A
A
2A MAX
2000nS
200Ω
COMMON
!
Ω
500V MAX
High (+)
S
V Ω S
!
1000V DC
750V AC
MAX
Low (-)
dx11f.eps
Page 45

Error:
Example:
Operating Instructions
Operation
IM
ES
EB
Ammeter Shunt
Es = Source Voltage
RI = Load resistance + Source resistance
Im = Measured current (display reading in amps)
Eb = Burden voltage (calculated)
Eb = meas. current [(200/current range in mA) + .35]
Error in % = 100 x Eb/(Es - Eb)
Error in A = (Eb x Im)/(Es - Eb)
RI
2
ES = 15V
RI = 100 kΩ
Im = 148.51 µA (.14851 mA)
Eb = 148.51 x 10 -6 x [(200/.2) + .35]
= 148.51 x 10-6 x 1000.35 = 148.56 mV
Max, error in % = 100 x [148.56 mV/(15V - .14856V)] = 1.0003%
Add this to the range spec. accuracy
Max. error in % = 1.0003% ±(.2% + 2 digits)
Max. error in A = (148.56 mV x 148.51 µA)/(15000 mV - 148.56 mV)
= 1.486 µA
Add 1.486 µA to the reading for correct current
Figure 2-11. Calculating Burden Voltage Error
2-17
Page 46

8060A
Instruction Manual
2-17. Resistance (Ω)
Selection of the resistance function is described in Figure 2-12. There are
four fixed ranges (200Ω, 2 kΩ, 20 kΩ, 200 kΩ) plus the autoranging M
range consisting of three ranges: 2 MΩ, 20 MΩ, and 300 MΩ.
In all fixed resistance ranges (200Ω to 200 kΩ), the test voltage is less than
that required to turn on most semiconductor junctions. This feature,
sometimes referred to as “low power” ohms, aids in troubleshooting by
allowing you to measure resistors independent of the effects of in-circuit
transistors and diodes. For the fixed ranges the maximum full scale voltage
across the circuit being measured is less than 250 mV. The autoranging M
ranges have enough voltage to turn on semiconductor junctions (maximum
2.5V full scale), but the current is very low (2.2 µA maximum).
Resistance ( )
REL
dB
1. Select a range
2. Push switch in for
resistance function.
3. Ensure all other switches
are out (except the AC/DC
switch which can be in or out).
4. Connect the test leads as shown.
5. Ensure that the device being measured
contains no electrical energy.
Hz
2000mA
200mA
MΩ
2000nS
1000 DC
750 AC
200k
200
20k
20
20mA
2k
2
2mA
200Ω
200mV
200µA
DC
Hz
AC
V
A
COMMON
A
!
2A MAX
Ω
500V MAX
S
V Ω S
1000V DC
750V AC
!
MAX
Low (-)
Ω
High (+)
Ω
6. Heed the input overload limits (Table 2-2) and
connect the test leads to the device being measured.
7. Read the measured value on the display.
Figure 2-12. Resistance Operation
2-18
dx13f.eps
Page 47

Operating Instructions
Operation
2
Resistance measurements for all ranges are made using a two-wire
ratiometric technique. This means that test lead resistance may affect the
accuracy in the 200Ω range. You can correct this error by shorting the test
leads together, reading the test lead resistance, and then subtracting it from
resistance readings. The most convenient way to do this is with the relative
function as described later in this chapter. This technique is also useful for
removing the 0.02Ω error factor in the 200Ω range (refer to resistance
specifications in Chapter 1).
2-18. Autoranging Megohms
When the autoranging MΩ range is selected, the 8060A automatically selects
the range appropriate for the measurement. The measurement resolution
decreases in the two higher MΩ ranges as shown in Table 2-3. Readings
made at the crossover points between ranges are microcomputer-stabilized
by an offset in the upscale and downscale directions. Range changes are
made at 2.00 MΩ and 20.00 MΩ as readings go upscale, or at 19.0 MΩ and
1.90 MΩ as readings go downscale.
Table 2-3. Resistance Function Autoranges and Resolution
MΩ
Autorange
kΩ
Autorange
Range Resolution
2 MΩ 100Ω 4½
20 MΩ 10 kΩ 3½
300 MΩ
2 kΩ
20 kΩ
300 kΩ
20 to 99.9 kΩ
100 to 300 MΩ
20 to 99.9 kΩ
100 to 299 kΩ
100 kΩ
1 MΩ
0.1Ω
10Ω
100Ω
1 kΩ
No. of Digits
Possible in
Reading
3
3
4½
3½
3
3
2-19
Page 48

8060A
Instruction Manual
2-19. Autoranging Kilohms
Although it is not indicated on the front panel, there is an additional
autoranging range available: the autoranging kΩ range, which consists of 2
kΩ, 20 kΩ, and 300 kΩ. To select this range, you must simultaneously press
the MΩ and the 200Ω switches as shown in Figure 2-13. Like the
autoranging MΩ ranges, the autoranging kΩ ranges have enough voltage to
turn on semiconductor junctions. Note that the use of the relative function
with the autoranging kΩ ranges is restricted to the autoranging kΩ ranges.
Refer to the description of the relative function for more information. The
autoranging kΩ has the same decrease in resolution (see Table 2-3) and the
same display hysteresis as the autoranging MΩ.
REL
dB
1. Push both the MΩ and
200Ω switches at the
same time to select the
KW autorange.
2. Press switch in to select
resistance function and
measure resistance as
described in Figure 2-12.
Hz
2000mA
200mA
MΩ
2000nS
1000 DC
750 AC
200k
200
20k
20
20mA
2k
2
2mA
200Ω
200mV
200µA
DC
Hz
AC
V
A
COMMON
A
!
2A MAX
Ω
500V MAX
S
V Ω S
1000V DC
750V AC
!
MAX
Low (-)
High (+)
2-20
Figure 2-13. Selection of Autoranging Kilohms
dx14f.eps
Page 49

2-20. Conductance (S)
Operating Instructions
Operation
2
Selection of the conductance function is described in Figure 2-14. The range
is 2000 nS (nS = nanosiemens or 10
-9
siemens, 1 siemen = 1/Ω) which
corresponds to a resistance range from 500 kΩ to 10,000 MΩ.
Conductance is a good way to measure high resistances, such as leakages in
diodes, capacitors, pcbs, or insulators. For example, you can measure the
conductance of a pcb and then covert the measurement to resistance by
referring to Figure 2-15. If you are measuring the leakage of a capacitor, be
sure to discharge it first by shorting its leads together. The positive (+) lead
of polarized capacitors should be connected to the VΩS input.
Conductance (S)
REL
dB
1. Push both switches
simultaneously to set range.
2. Press switch in for
conductance function.
3. Ensure all other switches are out
(except the AC/DC switch which can
be in or out).
Hz
2000mA
200mA
MΩ
2000nS
1000 DC
750 AC
200k
200
20k
20
20mA
2k
2
2mA
200Ω
200mV
200µA
DC
Hz
AC
V
A
COMMON
A
!
2A MAX
Ω
500V MAX
S
V Ω S
1000V DC
750V AC
!
MAX
Low (-)
High (+)
4. Connect the test leads as shown above.
5. Ensure that the device being measured
contains no electrical energy.
6. Heed the input overload limits (Table 2-2) and connect
the test leads to the device being measured (connect the
test lead from the V S input to the + lead of polarized
capacitors for leakage measurements).
7. Read the measured value on the display.
Figure 2-14. Conductance Operation
dx15f.eps
2-21
Page 50

8060A
Instruction Manual
nS
MΩ
*nS-to-MΩ
2000 nS Range
(1000/nS = MΩ)
nS
MΩ
2000 .5
1000 1
500 2
200 5
100 10
50 20
20 50
10 100
Conversion Scales
*S = Siemens = 1/Ω = International Unit
of conductance formerly known as the MHO.
Example: 250 nS = 4 MΩ
Figure 2-15. Conductance/Resistance Conversion
10
100
200
5
500
2
1000
1
.5
2000
5000
.2
.1
10,000
dx16f.eps
You may encounter situations where conductance is more convenient to
measure than resistance. For example, the resistance of a photodiode is
inversely proportional to the available light, i.e. as light increases, resistance
decreases. This might be confusing if you want to examine the response of
the component over a range of values. However, since conductance is the
reciprocal of resistance, photodiode conductance is directly proportional to
available light. As light increases, conductance increases. It might be easier
to examine the photodiode response in terms of conductance, and then covert
the measurements to resistance values if desired.
2-22
Page 51

Diode Test ( )
1. Press both switches
simultaneously
2. Set switch to select
diode test
3. Ensure all other switches
are out (except the AC/DC
switch which can be in or out).
4. Connect the test leads as shown.
5. Heed the input overload limits
(Table 2-2) and connect the test
leads to diode being measured.
6. Read the measured value on the display.
Forward Bias:
BlackRed
Reverse Bias:
Black Red
Operating Instructions
Operation
REL
dB
Hz
2000mA
200mA
MΩ
2000nS
1000 DC
750 AC
200k
200
20k
20
20mA
2k
2
2mA
200Ω
200mV
200µA
DC
Hz
AC
V
A
COMMON
A
!
2A MAX
Typical reading +
forward-biased
silicon diode.
Overrange display
if parallel resistance
is >2 KΩ.
Ω
500V MAX
S
V Ω S
1000V DC
750V AC
!
MAX
Low (-)
High (+)
2
Figure 2-16. Diode Test
dx17f.eps
2-21. Diode Test ( )
Selection of the diode test is described in Figure 2-16. Notice how the test
leads are placed to forward-bias or reverse-bias the diode in the figure.
The diode test measures the forward voltage of a semiconductor junction (or
junctions) at a 1 mA test current. Readings are displayed in the 2V range,
with OL displayed for voltages greater than 2V. For a silicon diode, the
typical forward voltage at 1 mA is about 0.6V. A reverse-biased
semiconductor junction should display the overrange (OL) indicator
provided that any resistance parallel to the junction is greater than 2 kΩ.
2-23
Page 52

8060A
Instruction Manual
A quick way to check for shorted or open junctions is to reverse the test
leads. If the junction indicates the same in-scale reading both directions, it is
probably shorted. If the junction indicates an overrange both directions, it is
open.
Relative (REL)
dB
Hz
1000 DC
750 AC
2000mA
200mA
20mA
2mA
200µA
DC
1.
Select range and function
(any measurement function:
V, A, Ω, S, Hz, dB or ).
Heed input overload limits (Table 2-2),
2.
connect test leads and take desired
measurement (example shows a 1.5000V
measurement has been taken and displayed):
3.
Press the REL button to store the next measured value
as relative reference (display becomes zero and the REL
indicator is displayed). The stored reference is subtracted
from subsequent measurements:
4. To cancel the relative reference, press REL.
indicator disappears and the original measurement
value is reestablished:
The REL
Relative (REL)
Button
REL
Ω
500V MAX
S
V Ω S
1000V DC
750V AC
!
MAX
Low (-)
High (+)
MΩ
2000nS
200k
200
20k
20
2k
2
200Ω
200mV
Hz
AC
V
A
COMMON
A
!
2A MAX
2-24
Figure 2-17. Relative (REL) Operation
dx18f.eps
Page 53

Operating Instructions
Operation
2
2-22. Relative (REL)
The relative function allows you to store any reading as an offset or relative
reference value. When you press the REL button, the REL indicator appears
in the upper right corner of the display, and the 8060A stores the next
measurement in a register along with the function and range. Subsequent
measurements are displayed as the difference between the measured value
and the stored relative reference (refer to Figure 2-17).
For example, if a reading of 1.0000V dc is displayed when the REL button is
pressed (the display will read 0.0000 after REL is pressed), subsequent
readings will have 1.0000 subtracted from them. If the next measurement is
1.2700V dc, the reading displayed will be .2700. If the next measurement is
0.8500V dc, the reading displayed will be -.1500. You may cancel the
relative reference by pressing the REL button (the REL indicator disappears
from the display), by turning the instrument off, or by storing a relative
reference with another function.
If you change ranges, the relative reference is automatically multiplied or
divided by the appropriate power of ten before being subtracted from the
measurement. If you change functions, the REL indicator disappears and the
relative reference is stored with the original function. When you reselect the
function, the relative reference is restored (the REL indicator reappears)
unless a new relative reference was established in another function.
The relative function may be used with all the measurement functions: ac or
dc voltage, ac or dc dB, ac or dc current, resistance, conductance, diode test,
and frequency. When used with continuity, the relative function stores the
accompanying resistance readings. Note that the input overload limits are not
changed by the use of the relative function.
Another thing to be aware of when using relative reference is that the range
of possible readings is still subject to the limits of the display and the 19999
counts of the analog-to-digital (a/d) converter, regardless of the relative
reference. For example, suppose the instrument is in the dc voltage function
with the 20V range selected, and you store a relative reference of 15V. The
maximum positive relative voltage reading that can be displayed without
overranging is 4.999V, which is actually a 19.999V input signal. Any input
signal greater than 19.999V exceeds the 19999 counts of the a/d converter.
The minimum (negative) voltage reading that may be displayed without
overranging is -19.999V, which is a -4.999V input signal. You can avoid this
situation by selecting a higher range.
2-25
Page 54

8060A
Instruction Manual
Remember that even though the REL indicator appears on the display almost
instantaneously after the REL button is pressed, the relative reference is not
stored until the next measurement takes place. For most functions, the time
between measurements is about 0.4 seconds (frequency measurements occur
every second, and dB measurements occur about every 1.4 seconds).
A typical way to use the relative reference is to correct for test lead
resistance. Although test lead resistance is usually very small (typically 0.5
to 5Ω), it can be significant when measuring low resistances. To correct for
it, select the desired resistance range, short the test leads together, and press
the REL button. The REL indicator will appear and the display will read
zero. The 8060A will automatically subtract the stored test lead resistance
from subsequent measurements. Other common applications for relative
reference include: offset nulling (dc and ac voltage or current), amplifier
matching (dB), power line frequency deviation (Hz), diode and transistor
matching (diode test), resistor matching (Ω), and voltage deviation (ac and
dc voltage).
Note
The use of the relative function with the autoranging k
restricted to the autoranging k
reading within the autoranging k
reference outside autoranging k
outside autoranging k
There is no restriction on the use of the relative function with the
fixed resistance ranges or with autoranging M
2-26
Ω
Ω
ranges. If you take a reference
Ω
range and then use it as a
Ω
, or use a reference reading taken
within autoranging kΩ, errors will result.
Ω
.
Ω
ranges is
Page 55

Frequency (Hz)
Frequency
Button
1.
Select the ac voltage
function by setting
two switches in.
2.
Connect the test leads
as shown.
3.
Heed the input overload limits for ac
voltage (Table 2-2) and connect the
test leads to he circuit being measured.
4.
Select a range so that there is adequate
input voltage for a stable reading (see Table 2-5).
5.
Press the frequency (Hz) button
to enable frequency:
Operating Instructions
Operation
REL
dB
Hz
2000mA
200mA
MΩ
2000nS
1000 DC
750 AC
200k
200
20k
20
20mA
2k
2
2mA
200Ω
200mV
200µA
DC
Hz
AC
V
A
COMMON
A
!
2A MAX
Ω
500V MAX
S
V Ω S
1000V DC
750V AC
!
MAX
Low (-)
High (+)
2
(Press again to disable):
Readings are updated every second
.
Figure 2-18. Frequency (Hz) Operation
dx19f.eps
2-23. Frequency (Hz)
The selection of the frequency function is described in Figure 2-18.
Frequency selection is canceled if you select a different function (resistance
or ac voltage dB, for example).
2-27
Page 56

8060A
Instruction Manual
The frequency function is fully autoranging over four ranges: 200 Hz, 2000
Hz, 20 kHz, and 200 kHz. Depending on the frequency of the ac input signal,
the 8060A automatically selects the proper range and displays the
appropriate measurement unit, either Hz or kHz. Frequencies less than 12.2
Hz are not measured reliably, and frequencies greater than 199.99 kHz cause
the OL overrange indicator to appear.
When you press the Hz button to select the frequency function, the Hz
indicator appears in the display almost immediately, and the first frequency
reading is displayed within one second. The 8060A has a one-second reading
rate for all ranges (except for frequencies between 12 and 16 Hz, which
respond in 1 to 1.3s), including the .01 Hz and .1 Hz resolution readings in
the 200 Hz and 2000 Hz range. The resolution for each range is listed in
Table 2-4.
Table 2-4. Frequency Function Autoranges and Resolution
Frequency Range Resolution
200 Hz
2000 Hz
20 Hz
200 Hz
>200 kHz Extended Range*
*Extended range enabled by holding down the Hz button at power-on.
.01 Hz
.1 Hz
1 Hz
10 Hz
100 Hz
The minimum input signal that is required to trigger the frequency counter
varies, depending on the ac voltage range selected and the frequency. The
input signal sensitivity is listed in Table 2-5. The values are based on rms
sine waves. You must increase the signal level for lower crest factor input
signals (the crest factor is the ratio of the peak voltage to the ac rms voltage
of a waveform) or non-50% duty-cycle signals. If the input signal is below
the required level, the 8060A will display 0.00 Hz, and will not take
readings. If you find that your readings are unstable, the input signal may be
near the threshold level for that range. You can correct this by selecting a
lower ac volts range.
2-28
Page 57

Operating Instructions
Operation
Table 2-5. Sensitivity for the Frequency Function
Input Signal Sensitivity (based on sine wave V rms)
2
12 Hz to 20 kHz
20 kHz to 100 kHz
100 kHz to 200 kHz
*Whichever value is greater.
20 mV or 10% of voltage range*
50 mV or 25% of voltage range*
150 mV or 75% of voltage range*
The maximum input voltage that may be applied depends on the ac voltage
range. The maximum inputs are listed in Table 2-6.
Caution
No voltage overrange indication is given when the 8060A
is measuring frequency. To prevent possible instrument
damage, do not exceed 750V ac rms or a volt-hertz
2V
20V
200V
750V
7
when measuring frequency.
±5V peak
±50V peak
±500V peak
±1000V peak
±1000V peak
product of 1 x10
Table 2-6. Maximum Input Voltages for the Frequency Function
AC Voltage Range Maximum Useable AC Voltage*
200 mV
*Signal not to exceed a volt-hertz product of 1 x 10⁷.
In addition to the four usual frequency ranges, there is an extended frequency
range that may be enabled. To enable the extended frequency range, hold
down the Hz button as you turn on the instrument. After the power-on selftest has been completed (the display is .8.8.8.8), release the Hz button. Now
when you select the frequency function, the autoranging can extend beyond
the 200 kHz range. The 200 mV ac voltage range is recommended for
frequencies above 200 kHz. Normally this frequency range is not enabled
because of loss of sensitivity above 200 kHz, but typically you can measure
420 kHz TTL level signals (50% duty cycle). When the instrument is turned
off, the extra range is disabled.
2-29
Page 58

8060A
Instruction Manual
2-24. Decibel (dB)
The selection of dB is described in Figure 2-19. Like frequency, dB is
automatically canceled if you select another function (resistance or
frequency, for example).
When dB is selected, the 8060A microcomputer converts ac or dc voltage
readings to the dBm equivalent (decibels above or below one milliwatt). The
standard reference impedance is 600Ω. You can make dB measurements
independent of the reference impedance by using the relative function in
conjunction with the dB function. You can also modify the reference
impedance by applying and storing a voltage equivalent to 0 dBm referenced
to the desired impedance. Refer to Chapter 3 for details.
Note that the 8060A performs a ‘bridging’ measurement when measuring
dBm, which assumes the reference load is part of the system. When making
‘terminating’ measurements (such as testing a phone line without a phone
connected) be sure to apply the proper load to the 8060A. For example, if
you are making a terminating dBm measurement in a 600Ω system with 50V
maximum signal levels, place a 600Ω 5 watt resistor across the 8060A input
terminals.
The ac dB dynamic range is from -50.0 to 59.72 dBm (109.72 dBm total).
The dc dB dynamic range is from -74 to 62.22 dBm (136.22 dBm total). For
readings greater than approximately 5% of full-scale for the voltage range
selected, the resolution is .01 dB. Below approximately 5% of scale,
resolution drops off to .1 dB, and below approximately 0.6% of scale,
resolution is 1 dB. Anytime blank digits appear to the right of the decimal
point, it is an indication that resolution has fallen off and you need to select a
lower range.
2-30
Page 59

Operating Instructions
Operation
2
Decibel (dB)
1. Select range.
2. Select AC or DC
voltage function.
3. Ensure all other
switches are out.
4. Press the decibel (dB)
button to enable the
decibel function:
(Press again to disable):
5. Connect the test leads as shown above.
6. Heed the input overload limits (Table 2-2) and
connect the test leads to he circuit being measured.
7. Read the measured value on the display.
Hz
2000mA
200mA
Decibel (dB)
Button
REL
dB
Ω
M
2000nS
1000 DC
750 AC
200k
200
20k
20
20mA
2k
2
2mA
200
Ω
200
200mV
A
µ
DC
Hz
AC
V
A
COMMON
A
!
2A MAX
Ω
500V MAX
S
V
1000V DC
Ω
!
750V AC
MAX
Low (-)
High (+)
S
Figure 2-19. Decibel (dB) Operation
dx20f.eps
2-25. dBV
dBV is defined as dB relative to 1 volt, independent of load impedance. This
measurement is commonly used in the audio industry as a convenient
reference for log weighted measurements such as noise, sensitivity, and
level. The 8060A uses the ratio self-test to “fool” the microcomputer into
thinking it has 1V present at the meter input, and then uses the pseudo 1V as
the 0 dB relative reference. Use the following procedure to make dBV
measurements:
2-31
Page 60

8060A
Instruction Manual
1. Turn the 8060A power switch off.
2. Select Volts, AC, 2V range.
3. Turn the power switch on while holding down the continuity button.
When the .8.8.8.8 display appears, the power-on self-test is complete.
4. Release the continuity button. The display should now read -.9990 to
-1.0010. The instrument is now in the ratio self-test mode.
5. Push the dB button. The display should read 2.21 dB to 2.22 dB.
6. Push the REL button. The display should read 0.00 dB REL.
7. Push the continuity button again to cancel the ratio self-test.
The meter will now make all subsequent dB measurements in dBV as long as
the power remains on and the REL button is not used again. All other meter
functions can be used without losing the dBV function.
2-26. Continuity (
To select the continuity function, first select the resistance function and then
press the
a three-position switch: the first button press enables visible continuity (the
indicator is displayed), the second button press enables audible
continuity (the
cancels continuity selection (the
continuity is summarized in Figure 2-20.
When continuity is detected, visible continuity is indicated by the long bar
across the top of the display. Audible continuity (if enabled) is indicated by
the tone emitted from the instrument.
Continuity is a quick check to verify whether circuit connections are intact.
The continuity detection threshold is typically <10% of the resistance range
selected for the fixed ranges (i.e. continuity is detected if resistance is less
than 20Ω in the 200Ω, less than 200Ω in the 2 kΩ range, etc.). The detection
threshold is <20Ω for the autoranging kΩ range, and 20 kΩ for the
autoranging MΩ range.
The 8060A can detect continuity for intervals as brief as 50 µs (typically as
brief as 10 µs). It extends the visible or audible indication to a minimum of
200 ms to make it easy for you to see or hear the results. Note that while
continuity is enabled, the 8060A still makes resistance measurements and
displays the readings.
button under the display. The button functions like
indicator is displayed), and the third button press
)
disappears). The selection of
2-32
Page 61

Continuity ( )
1. Select range.
2. Set switch in
for resistance function.
3. Ensure that other switches are out.
4. Press the button once to enable
visible continuity:
Press the button again to enable
audible continuity:
Operating Instructions
Initial Check-Out Procedure
Continuity
Button
REL
dB
Hz
2000mA
200mA
MΩ
2000nS
1000 DC
750 AC
200k
200
20k
20
20mA
2k
2
2mA
200Ω
200mV
200µA
DC
Hz
AC
V
A
COMMON
A
!
2A MAX
Ω
500V MAX
S
V Ω S
1000V DC
750V AC
!
MAX
Low (-)
High (+)
2
(Press again to disable both):
5. Connect the test leads as shown.
6. Ensure that the device being measured
contains no electrical energy. Heed the input
overload limits (Table 2-2), and connect the
test leads to the circuit.
7. Observe the display for visible continuity
indicated by the bar:
Or listen for tone indicating audible continuity:
Figure 2-20. Continuity ( ) Operation
BEEEEP
dx21f.eps
2-33
Page 62

8060A
Instruction Manual
2-27. Initial Check-Out Procedure
Here is an easy procedure you can use to verify that your 8060A is operating
properly for most functions. All you need to perform these tests are the test
leads and access to a standard wall socket. Remember that you are not trying
to verify the instrument accuracy, but are simply confirming that the
functions work. Performance tests and calibration adjustments are presented
in Chapter 5. If the instrument passes the self-test when the instrument is first
turned on, then the display and the microcomputer are working properly.
1. DC Voltage - Select the dc voltage function and the 20V range. Read the
battery voltage by touching the probe tip from the lead connected to the
VΩS jack to the side contact (not the center pin) in the opening for the
battery eliminator jack on the right side of the instrument. Be careful not
to short the battery by connecting the side contact to the center pin.
Battery voltage should read 5.2V to 10V. If the voltage is less than
5.2V, the battery should be replaced.
Warning
Be careful not to touch the probe tips with your fingers,
or to allow the probe tips to contact each other.
The local line voltage is measured in the following step.
2. AC Voltage, dB, Frequency - Select the ac voltage function and the
200V range. Take note of the preceding warning and insert the probe
tips into a standard wall socket. The display should read the local line
voltage.
Now push the dB button. The display should read the line voltage in dB.
Now push the Hz button. The display should read the frequency of the
line voltage. Carefully remove the probe tips from the wall socket.
3. Resistance, Continuity, Conductance, Diode Test - Select the resistance
function and the 2 kΩ range. Touch the red (VΩS) probe tip to the A
jack so the VΩS input is shorted to the A input (this is the fuse check
procedure from section 2-4). The display should read .1000 ± .0100 kΩ
(neglecting lead resistance).
2-34
Page 63

Operating Instructions
Initial Check-Out Procedure
2
Push the
continuity. You should see the bar in the display and hear the tone.
Select the diode test (with the VΩS and A inputs still shorted together).
The display should read .0102 ±.0015V.
Select the conductance function (with the VΩS and A inputs still
shorted together). The instrument should indicate overrange (OL).
Remove the connection between the inputs. The instrument should
indicate 0.0 ±1.0.
button twice to enable the visible and audible
2-35
Page 64

8060A
Instruction Manual
2-36
Page 65

Chapter 3
Applications
Contents Page
3-1. Introduction ...................................................................... 3-3
3-2. Determining Amplifier Bandwidth................................... 3-3
3-3. Using the 8060A as a Q-Meter......................................... 3-4
3-4. Measuring Amplifier Stage Gain with Relative dB.......... 3-5
3-5. General Audio Uses.......................................................... 3-6
3-6. Using the 8060A to Measure Extremely Low Currents... 3-7
3-7. Making dBm or dBW Measurements with Other
Reference Impedances...................................................... 3-7
3-8. Changing AC dB Reference Impedances with a DC
Source............................................................................... 3-9
3-1
Page 66

8060A
Instruction Manual
3-2
Page 67

Applications
Introduction
3
3-1. Introduction
With its unique combination of features such as true rms, frequency, dB,
relative reference and the 4½ digit display, the 8060A offers a wide variety
of measurement capabilities, including measurement of amplifier bandwidth,
the Q factor, amplifier stage gain in relative dB, and some other general
audio applications. You can also find out how to change the dB reference
impedance or how to use the 8060A to measure extremely low currents.
These applications may be of immediate use to you, or they may help you
discover other ways the 8060A can fill your measurement needs.
3-2. Determining Amplifier Bandwidth
The following procedure describes how to use the ac voltage dB, relative,
and frequency functions to determine the bandwidth of an amplifier (for
frequencies up to 100 kHz):
1. Connect the amplifier, signal generator, load, and 8060A as shown in
Figure 3-1.
2. On the 8060A, select the ac voltage function and a range appropriate for
the amplifier output.
3. Adjust the signal generator for a signal level that is within the input
operating range of the amplifier. Beginning at a low frequency (20 Hz),
steadily increase the frequency until the ac voltage reading on the
8060A begins to rise. Typically the ac voltage reading will rise to a
peak, level out, and then begin to fall, much like the response curve
shown in Figure 3-1. (High quality audio amplifiers will probably not
show a rise in readings since they are generally flat from 20 Hz to >20
kHz. In this case, use 1 kHz as a midband reference for 0 dB in Step 4.)
4. When the peak or the upper plateau of ac voltage readings has been
reached, press the dB button and then the REL (relative) button on the
8060A. This establishes the 0 dB relative reference.
3-3
Page 68

8060A
Instruction Manual
Signal
Generator
Amplifier Load
0 dBdB Rel. Ref. Level
-3 dB
f
1
Bandwidth (BW)
f
2
C
8060A
Ff
dx22f.eps
Figure 3-1. Measuring Amplifier Bandwidth
5. Increase the frequency input until the dB readings drop to -3.00 dB.
Press the Hz button on the 8060A to read the upper frequency limit of
the bandwidth. Press the dB button to restore the dB reading.
6. Decrease the frequency input so the dB readings rise to 0 dB and then
drop again to -3.00 dB. Press the Hz button to read the lower frequency
limit of the bandwidth.
You can use a similar technique to examine the performance characteristics
of frequency-sensitive filters, such as high or low-pass filters, notch filters,
etc. With the 4½ digit frequency resolution and the 0.01 dB resolution, you
can very accurately determine the rolloff, slope, and bandpass.
3-3. Using the 8060A as a Q-Meter
You can use the 8060A to determine the Q factor of a tuned circuit (refer to
Figure 3-2). First use the technique presented in section 3-2 to determine the
center frequency (fc) and bandwidth of the circuit (for tuned circuits, the
center frequency of the bandwidth is found at the peak or midway within the
high plateau of the dB readings). Then calculate the Q of the circuit by using
the following formula:
Q =fc/Bandwidth
3-4
Page 69

Measuring Amplifier Stage Gain with Relative dB
High Q
Medium Q
Low Q
fc = Center Frequency
Q =
fc
Bandwidth
Applications
3
Figure 3-2. Measuring Q with the 8060A
dx23f.eps
3-4. Measuring Amplifier Stage Gain with Relative dB
When testing multi-stage amplifiers, we are usually interested in the dB gain
or loss at each stage referenced to an initial dB level. Figure 3-3 shows an
example of this kind of application with the 8060A. A 20 mV signal is
applied to the first stage of a three-stage amplifier. This signal is measured
with the 8060A in the ac voltage function. Then the dB button is pressed
followed by the REL button which creates the relative reference 0 dB point.
Each stage is then measured, and the 8060A displays the dB level with
reference to the initial input.
3-5
Page 70

8060A
Instruction Manual
1. Apply 20 mV to the first-stage input and measure it with the
2. Press the dB button and then the REL button to create the
0 dB
20 mV
x50
8060A ac voltage function.
0 dB relative reference.
+34 dB
+28 dB
1V .5V
x3.16
+38 dB
1.58 V
x10
+58 dB
15.8V
R
L
Figure 3-3. Measuring Stage Gain with Relative dB
dx24f.eps
3-5. General Audio Uses
You can perform many audio equipment tests using the 8060A with a
minimum of other equipment. For example, connect the 8060A to the tape
recorder output sockets of a phono amplifier with a shielded lead. Select the
ac voltage dB function and the 200 mV range. Then play a frequency
response test record (they are available at some of the larger audio equipment
stores). You can establish a reference level by pressing the REL button while
a particular frequency is being played. The signal level of all the other
frequencies on the disc will be displayed in dB with reference to the original
reference level. If you connect the 8060A to the speaker sockets of an audio
amplifier and play the frequency response test record, you can adjust the
filters and tone controls and check their performance.
The 8060A is also useful for a variety of maintenance tasks when servicing
tape decks. Some of these tasks include setting up record and playback levels
during calibration, head alignment, checking attenuator pads, and testing
equalizers. Refer to manufacturer information for procedures.
3-6
Page 71

Applications
Using the 8060A to Measure Extremely Low Currents
3
3-6. Using the 8060A to Measure Extremely Low Currents
By using high impedance dc voltage function and high MΩ precision
resistors, you can use the 8060A to measure extremely low currents. For
example, if you place a 100 MΩ resistor across the 8060A and select the
high impedance dc voltage function and the 200 mV range, the 8060A will
measure a 2 nanoamp (10
The error sources with this method of measurement are the combined
accuracy specifications for the voltage range and the resistor, as well as the
8060A input bias current. The input bias current is typically 10 picoamps.
You can measure the input bias current error by removing the test leads and
selecting the normal dc voltage function and the 200 mV range. The number
of digits in the display reading indicates the input bias current in picoamps
(disregard the decimal point). You can correct for the input bias current by
using the relative reference to zero the offset.
The best measurement results will be obtained at ordinary room temperature
with low relative humidity. Be sure to use adequate shielding to prevent
power line or rf interference.
-9
A) current with 0.1 picoamp (10
-12
A) resolution.
3-7. Making dBm or dBW Measurements with Other Reference Impedances
The standard power-on reference impedance for 8060A dBm (decibels above
or below one milliwatt) measurements is 600Ω, which is the most common
reference impedance used in the data communications and audio fields.
However, occasionally you might want to make measurements with a
different reference impedance. For instance, the standard rf dBm reference
impedance is 50Ω. Audio power amplifiers use dBW (decibels above or
below one watt) referenced to 2, 4, 8, or 16Ω. The standard method for
making these dBm or dBW measurements is to add or subtract a correction
factor. With the 8060A, however, you can set up any of these reference
impedances with the relative (REL) function.
To change the reference impedance, select the desired dB function and
appropriate range, apply the equivalent voltage level obtained from Table 31 (or from the formulas at the bottom of Table 3-1), and press the REL
button. The 8060A will store the equivalent voltage level, and subsequent dB
measurements will be referenced to the new impedance.
3-7
Page 72

8060A
Instruction Manual
For an example of how to use this feature, let’s assume that you want to
make ac voltage dBm measurements referenced to 50Ω. First select the
8060A ac voltage dB function and the 2V range. Referring to Table 3-1, we
find that the equivalent voltage level for 0 dBm for 50Ω is 0.2236V and the
equivalent dB level for 0 dBm referenced to 600Ω is -10.79 dBm. Apply an
ac voltage to the 8060A input (VΩS and COMMON) and adjust the applied
voltage level until the 8060A displays -10.79. Now press the REL button.
The display should read 0.00 (with the dB and REL indicators at the top of
the display). Measurements taken with the ac voltage dB function will now
read dBm referenced to 50Ω.
Table 3-1. Equivalent Voltage Levels for Modifying the Reference
Impedance
Reference
Impedance Z (Ω)
50
75
90
125
150
300
600 (power-on value)
900
1000 (dBV)
2
4
8
16
Use the following formulas to calculate equivalent voltage levels for
reference impedances not listed.
For dBm: 0 dBm level (V) =
600Ω Ref. Equiv. (dBm) = 20 log [0 dBm level (V)/.7746]
For dBw: 0 dBw level (V) = desired ref.impedance( )Ω
Equiv. Voltage
Level
For
0 dBm (V)
For
0 dBm (V)
.001xdesiredref.impedance( )Ω
0.2236
0.2739
0.3000
0.3536
0.3873
0.5477
0.7746
0.9487
1.0000
1.4142
2.000
2.828
4.000
Equiv. dB Level for 0
dBm REF. to 600
as Shown on the
8060A Display (dBm)
-10.79
-9.03
-8.23
-6.81
-6.02
-3.01
0.00
1.76
2.22
5.23
8.24
11.26
14.26
Ω
3-8
600Ω Ref. Equiv. (dBm) = 20 log [0 dBm level (V)/.7746]
Page 73

Applications
Changing AC dB Reference Impedances with a DC Source
Whenever you use Table 3-1, be sure you start with the 600Ω reference
impedance selected on the 8060A. Otherwise the values and formulas listed
in Table 3-1 will be incorrect because they use the 600Ω reference
impedance as a starting point.
After a reference impedance is stored with the REL button, the reference
impedance will remain stored until the instrument is turned off or until
another relative value is stored. You can cancel the stored reference by
pressing the REL button, in which case the REL indicator will disappear and
the reference impedance will revert to the power-on value, 600Ω. You can
use other functions without losing a stored reference impedance as long as
you do not store some other relative value.
3
3-8. Changing AC dB Reference Impedances with a DC Source
The most straightforward method of changing the reference impedance is to
select the desired voltage dB function, apply the equivalent voltage, and
press the REL button. However, a precision ac voltage source is not always
as readily available as a dc voltage source. There is a method for using a
variable 0 to 200 mV dc voltage source to set up virtually any reference
impedance for ac voltage dB.
To use this method, place the AC/DC switch in the AC position and place
the other two function switches in the out position. Find the equivalent dB
level in Table 3-1 and select the appropriate range. Press the dB button.
Beginning with a 200 mV input signal, slowly decrease the input signal until
the proper dB level is displayed on the 8060A. Then press the REL button.
Now you can select the ac voltage dB function and subsequent
measurements will be referenced to the modified reference impedance.
Note that in this mode the input signal does not go through the voltage
divider or the ac rms converter, but is applied directly to the a/d converter.
Since the a/d converter inputs are between 0 and 200 mV for all ac ranges,
the voltage you apply will always be between 0 and 200 mV, regardless of
the range. For example, let’s assume you want to use this method to establish
a reference impedance of 90Ω. From Table 3-1 you can see this requires an
input of 0.3000V. So you select the 2V range, but you only apply 30 mV dc
of signal in the 2V range to make the reading appear to be 300 mV ac.
Similarly, 30 mV dc of signal in the 20 V range will appear to be 3V ac, and
in the 200V range will appear to be 30V ac.
3-9
Page 74

8060A
Instruction Manual
3-10
Page 75

Chapter 4
Theory of Operation
Contents Page
4-1. Introduction ...................................................................... 4-3
4-2. Functional Description ..................................................... 4-3
4-3. Microcomputer.............................................................. 4-4
4-4. Measurement Acquisition Chip (MAC)........................ 4-5
4-5. A/D Conversion Cycle.................................................. 4-6
4-6. Voltage Measurement................................................... 4-8
4-7. Current Measurement.................................................... 4-10
4-8. Resistance Measurement............................................... 4-10
4-9. Conductance Measurement........................................... 4-11
4-10. Continuity Measurement............................................... 4-12
4-11. Frequency Measurement............................................... 4-13
4-1
Page 76

8060A
Instruction Manual
4-2
Page 77

Theory of Operation
Introduction
4
4-1. Introduction
This chapter describes how the 8060A works. An overview of the operation
is provided first, followed by descriptions of the two major components and
the measurement functions. A detailed schematic of the instrument appears
in Chapter 8.
4-2. Functional Description
The major circuits and components of the 8060A are arranged in a block
diagram in Figure 4-1. Two major components make up the measurement
system: a four-bit CMOS microcomputer, and a CMOS integrated circuit
known as the Measurement Acquisition Chip (MAC). The microcomputer
selects the appropriate measurement function in the MAC according to the
switches or buttons pushed by the operator. The microcomputer also controls
the measurement cycles, performs calculations on measured data, and drives
the display. The MAC measures the conditioned input signals with the a/d
converter or the frequency counter. The MAC also controls the power supply
and the continuity tone generator. The microcomputer and the MAC
communicate through a four-bit bidirectional bus and four control lines. Both
components are described in more detail later in this chapter.
As shown in Figure 4-1, the input signals are routed by the range and
function switches through the appropriate signal conditioners for input
filtering and scale changes. Input signals for all measurement functions
except frequency are converted to a proportional dc analog voltage that is
applied to the a/d converter. The dual-slope a/d converter converts the dc
analog voltage to a digital number that is sent to the microcomputer. Input
signals for frequency measurement are ac voltages that are buffered by the ac
converter and applied to the frequency counter in the MAC. The frequency
counter supplies the digital number to the microcomputer. Each of the major
measurement functions are described later in this chapter.
4-3
Page 78

8060A
Instruction Manual
Source
+1.0000V
A/D Ref
Ω/S
True RMS
Frequency (V AC)
Ohms
MAC
Digital
Control
Logic
A/D
Converter
Frequency
Counter
Power Supply
Ctl.
Cont.
Logic
BUS
CTL
Hz, dB,
and
REL Push
Buttons
Micro-
computer
Power
Supply
Tone
dx25f.eps
V/Ω/S
Common
A
Range
and
Function
Switches
Ω/S
V
V
A
Voltage
Divider
and
Ohms Ref
Resistors
DC
AC
A
Switch Sense
AC Converter
Current
Shunts
Figure 4-1. 8060A Block Diagram
4-3. Microcomputer
The four-bit CMOS microcomputer senses switch positions by reading status
registers in the MAC, and senses button pushes through input lines
connected directly to the microcomputer. The microcomputer processes the
information and then selects the appropriate digital and analog configuration
in the MAC by writing to an array of MAC control registers.
The operation of the instrument is controlled by software routines that are
stored in the microcomputer memory. These routines include the normal
operating routine, the power-on self-test, or special self-test routines that
may be selected by the operator. When the instrument is first turned on, the
microcomputer performs the self-test routine which checks the LCD
segments and the interface to the MAC (refer to Chapter 2 for operating
instructions). While the LCD segments are on (a minimum of 1.6 seconds),
the microcomputer exercises the bus and checks the internal registers in the
MAC to make sure it has control over them. If the microcomputer detects a
problem with the MAC interface, it stays in the self-test routine with the
LCD segments on until the problem is resolved or the instrument is turned
off.
4-4
Page 79

Theory of Operation
Functional Description
After the power-on self-test routine is successfully completed, the
microcomputer checks to see if the operator has selected the ratio self-test or
the switch decoding self-test (refer to Chapter 5 for operating instructions). If
neither of the self-tests has been selected, the microcomputer begins the
normal operating routine. The operating routine consists of four steps:
1. The microcomputer reads the function and range selections and checks
the four push buttons to determine the mode the operator has selected.
The microcomputer then selects either the a/d converter (for
measurement of voltage, current, resistance, conductance, continuity, or
the diode test) or the frequency counter.
2. The microcomputer initiates either the a/d measurement cycle
(approximately 400 ms) or the frequency measurement cycle
(approximately 1.0s). The measurement cycles are described later in this
chapter.
3. The microcomputer processes the data obtained in the measurement
cycle. This includes calculations for the dB, relative (REL) offset, and
MΩ or frequency autoranging.
4. The microcomputer displays the results. The results remain on the
display until it is updated.
4
After the results are displayed, the routine begins again at the first step.
4-4. Measurement Acquisition Chip (MAC)
A block diagram of the MAC is shown in Figure 4-1. The digital control
logic includes a buffer and decoder, read and write logic, status and control
registers, and logic control for the continuity function. The power supply
control uses the calibrated 1V a/d reference voltage obtained from a bandgap
reference diode to regulate the 5.2V main power supply for the instrument.
When the continuity function is selected and continuity is detected, the MAC
generates the tone by supplying a square wave to the external piezoelectic
transducer.
4-5
Page 80

8060A
Instruction Manual
4-5. A/D Conversion Cycle
The heart of the MAC is the dual-slope a/d converter. A block diagram of the
analog portion of the a/d converter is shown in Figure 4-2. The internal
buffer, integrator, and comparators work in conjunction with external
resistors and capacitors to convert the dc analog voltage to a digital number.
The internal switches are FET switches that are controlled by the
microcomputer and the MAC digital control logic. The switchable integrator
gain depends on the function and range selected.
The complete a/d measurement cycle is shown in Figure 4-3. It consists of
three consecutive time periods: autozero (AZ), integrate (INTEG) and read.
A fourth time period, overload (OL) is also used if an overrange reading is
taken. The total length of the measurement cycle is 400 ms. The length of the
integrate period is fixed at 100 ms. One hundred ms is a multiple of the
period of 50 Hz or 60 Hz power, which helps to reduce possible power line
noise that might interfere with the measurement. The waveform at the
INTEG capacitor is shown for three sample measurement readings: halfscale, full-scale, and overrange.
The measurement cycle begins with the autozero period. The AZ switches
close, applying a ground reference as the input to the converter. Under ideal
conditions the output of the comparator would also go to zero. However,
input-offset voltage errors accumulate in the buffer amplifier loop, and
appear at the comparator output as an error voltage. To compensate for this
error, the error is impressed across the AZ capacitor where it is stored for the
remainder of the measurement cycle. The stored level is used to provide
offset voltage correction during the integrate and read periods.
4-6
Page 81

9R R
Theory of Operation
Functional Description
4
C
AZ
Integ or Read
AZ
+
+
Integrator Comparators
Internal to the MAC
+
Buffer Amp
Reference
Voltage
± Unkown
Input Voltage
C
200 mV
dc
2V dc
Integrator Gain
Read
Integ
AZ
Integ
Figure 4-2. Analog Portion of the A/D Converter
A/D Measurement Cycle
OL
+
To Digital
Control Logic
dx26f.eps
Waveform at
the Integ
Capacitor
AZ AZ
Accumulated Counts
Integ
400 ms
100 ms
Read
Overrange (“OL” on display)
Fullscale reading
OL
19999
10000
0
1
/
2
Figure 4-3. A/D Measurement Cycle
scale reading
dx27f.eps
4-7
Page 82

8060A
Instruction Manual
The integrate period begins at the end of the autozero period. As the period
begins, the AZ switches open and the INTEG switches close. This applies
the unknown input voltage to the input of the converter. The voltage is
buffered and then begins charging the INTEG capacitor. The waveform at
the INTEG capacitor is a ramp from near zero to some maximum value
determined by the amplitude and polarity of the unknown input voltage.
As the read period begins, the INTEG switches opens and the READ
switches close. This applies the known reference voltage from a “flying”
capacitor whose polarity is chosen by the a/d converter to be the opposite of
the polarity of the unknown input voltage. The INTEG capacitor begins
discharging at a fixed rate while a counter begins counting. The counter
stops counting when the INTEG capacitor voltage equals the initial autozero
voltage. The count is proportional to the unknown input voltage, and is
placed on the display by the microcomputer.
If during the read period the counter counts up to the maximum number of
counts for a full-scale reading (19999 counts) and the INTEG capacitor
charge has not yet reached the initial autozero voltage, the microcomputer
knows an overrange reading has been taken. The microcomputer places
“OL” on the display and commands the a/d converter to go into the overload
(OL) period which rapidly slews the integrator voltage back to the initial
autozero voltage.
The measurement cycle ends at the end of the read period for an on-scale
reading, or at the end of the overload period for an overrange reading. A new
measurement cycle then begins with the autozero period. The display update
rate for measurement functions that use the a/d converter is approximately
0.4s, or about 2-1/2 readings per second.
4-6. Voltage Measurement
Both the ac and dc voltage ranges use an over-voltage protected 10 MΩ
input divider as shown in Figure 4-4. The over-voltage protection includes
two 2-watt fusible resistors and four metal-oxide varistors for high voltage
clamping. Depending on the range selected, lower leg resistors of the divider
are connected to ground to perform the input signal division.
4-8
Page 83

Theory of Operation
Functional Description
4
The dc input voltages for all ranges are divided by the appropriate factor of
10 to produce a proportional dc signal which is then filtered and applied to
the input to the a/d converter. The dc and ac voltage ranges and division
factors are listed in Table 4-1 along with the corresponding range of inputs to
the a/d converter. Notice in Table 4-1 that the 2V dc voltage range is divided
by 1 (not 10). The microcomputer compensates by decreasing the integrator
gain in the a/d converter by a factor of 10 (refer to Figure 4-2). The
integrator gain is also reduced by a factor of 10 in the 1000V dc voltage
range, which uses the same divider arrangement as the 200V dc voltage
range.
The ac input voltages are divided with the same divider arrangement as the
dc input voltages, with the exception that the 2V ac voltage range is divided
by 10. The divider output signals for ac voltages are ac-coupled to the input
of a true rms ac converter which produces a current output. This negative dc
representation is applied through a calibrated scaling resistor. The resultant
negative voltage is filtered and applied to the input of the a/d converter.
V/Ω/S
Common
Voltage
÷
Divider
1000
÷
1DC
÷
10
÷
100
÷
1000
÷
100
÷
10
AC
Figure 4-4. Voltage Measurement
True RMS
AC
Converter
Inputs
to A/D
Converter
HI
LO
dx28f.eps
4-9
Page 84

8060A
Instruction Manual
Table 4-1. Voltage Input Divider
Function Range
200 mV
DC Voltage
AC Voltage
*Integrator gain in a/d converter reduced by factor of 10.
2V*
20V
200V
1000V*
200 mV
2V
20V
200V
1000V*
Input
Divider
1/1
1/1
1/100
1/1000
1/1000
1/1
1/10
1/100
1/1000
1/1000
Range of A/D Converter Input
-200 mV to +200 mV
-2V to + 2V
-200 mV to + 200 mV
-200 mV to + 200 mV
-2V to + 2V (1V max. input)
0 to -200 mV
0 to -200 mV
0 to -200 mV
0 to -200 mV
0 to -2V (-0.75V max. input)
4-7. Current Measurement
Current measurements are made using a double-fuse-protected, switchable,
five-terminal current shunt (0.1 ohm, 1 ohm, 10 ohm, 100 ohm, or 1 kilohm)
to perform the current-to-voltage conversion required by the a/d converter. A
block diagram of current measurements is shown in Figure 4-5. When the dc
current function is selected, the dc voltage drop across the shunt is filtered
and applied to the input of the a/d converter. When the ac current function is
selected the ac voltage drop across the shunt is ac-coupled to the input of the
true rms ac converter. The dc representation of the ac voltage is filtered and
applied to the input of the a/d converter. All current ranges use the ±200 mV
a/d converter input range.
4-8. Resistance Measurement
Resistance measurements are made using a ratio technique as shown in
Figure 4-6. When the resistance function is selected, a series circuit is
formed by the ohms source, a reference resistor for the voltage divider
(selected by the range switches), and the external unknown resistor. The ratio
of the two resistors is equal to the ratio of the voltage drop across each of
them. Since the voltage drop across the reference resistor and the value of
the reference resistor are known, the value of the second resistor can be
determined. Input protection during resistance measurements consists of a
thermistor and a double-transistor clamp.
4-10
Page 85

Current
Shunt
Theory of Operation
Functional Description
4
A
Common
AC
DC
True RMS
AC
Converter
HI
Inputs
to A/D
Converter
LO
dx29f.eps
Figure 4-5. Current Measurement
The operation of the a/d converter during a resistance measurement is
basically as described earlier in this chapter, with a few exceptions. During
the integrate period the voltage drop across the unknown resistor charges the
INTEG capacitor. During the read period, the voltage across the known
resistor (stored on the flying capacitor) discharges the INTEG capacitor. The
length of the read period is a direct indication of the value of the unknown
resistor.
4-9. Conductance Measurement
Conductance measurements are made using a ratio technique similar to that
used in making resistance measurements as shown in Figure 4-6. The main
difference is that the function of the range and unknown resistors in the a/d
measurement cycle is reversed so that the smaller voltage is applied during
the integrate period, which minimizes error due to noise. During the integrate
period the voltage drop across the known resistor charges the INTEG
capacitor. During the read period the voltage drop across the unknown
resistor discharges the capacitor. Consequently the display presents a reading
that is the reciprocal of resistance, which is conductance.
4-11
Page 86

8060A
Instruction Manual
V/Ω/S
Common
Unknown
Resistor
Continuity
Ref V
Ohms
Source
Known
Ref
Resistor
Internal to the MAC
CM+
Comp.
CM-
+
ORef -
Known
V Ref
to A/D
Converter
ORef +
To
Continuity
Logic
Figure 4-6. Resistance/Conductance/Continuity Measurement
4-10. Continuity Measurement
HI
Unknown
V to A/D
Converter
LO
dx30f.eps
Continuity measurement is a voltage comparison made in the resistance
mode as illustrated in Figure 4-6. The 8060A determines whether continuity
exists in the circuit under test by comparing the voltage drop across the
external circuit with a continuity reference voltage. If the voltage drop across
the external circuit is less than the reference voltage, the comparator sends
the appropriate signal to the continuity logic. The continuity logic notifies
the microcomputer which turns on the visible indicator (the full-length bar
across the top of the display). If the audible indicator is enabled, the
continuity logic enables the tone generator.
The detection threshold is typically 10% of the full scale resistance range
selected. When the 8060A detects continuity for brief intervals (50 µs or
greater), the microcomputer extends the visible and audible indication to a
minimum of 200 ms to allow easy perception by the operator.
4-12
Page 87

Theory of Operation
Functional Description
4
4-11. Frequency Measurement
Frequency measurement is illustrated in Figure 4-7. The ac input signal is
divided by the voltage divider (Figure 4-4) and buffered by the ac rms
converter. The signal is then applied to a comparator in the MAC for
counting. The counter gate is controlled by the microcomputer, and the range
is automatically selected by the software in the microcomputer. For very low
frequency input signals, the counter actually measures the period of the input
signal which the microcomputer then inverts to derive the corresponding
frequency. The display update rate for all ranges is approximately one
second (except for frequencies between 12.2 and 16 Hz, which are updated
every 1 to 1.3s).
From
Voltage
Divider
Hysteresis
True RMS
AC
Converter
Figure 4-7. Frequency Measurement
Internal to the MAC
CM+
Comp.
CM-
To
Counter
dx31f.eps
4-13
Page 88

8060A
Instruction Manual
4-14
Page 89

Chapter 5
Maintenance
Contents Page
5-1. Introduction ..................................................................... 5-3
5-2. Service Information......................................................... 5-3
5-3. General Information ........................................................ 5-4
5-4. Handling Precautions for Using Static Sensitive
Devices......................................................................... 5-5
5-5. Disassembly and Reassembly...................................... 5-5
5-6. Calibration and Backup Fuse Access....................... 5-6
5-7. Main PCB Access..................................................... 5-8
5-8. LCD and Microcomputer PCB Disassembly
and Assembly........................................................... 5-9
5-9. Backup Fuse Replacement........................................... 5-12
5-10. Cleaning....................................................................... 5-12
5-11. Performance Tests........................................................... 5-13
5-12. Initial Procedure........................................................... 5-13
5-13. Microcomputer and Display Test................................. 5-13
5-14. Voltage Test................................................................. 5-13
5-15. Resistance Test............................................................. 5-15
5-16. Continuity Test ............................................................ 5-16
5-17. Conductance Test......................................................... 5-16
5-18. Current Test ................................................................. 5-17
5-19. Diode Test.................................................................... 5-18
5-20. Frequency Test............................................................. 5-18
5-21. Calibration Adjustment ................................................... 5-19
5-22. Troubleshooting............................................................... 5-21
5-23. Self-Tests ..................................................................... 5-21
5-24. Ratio Self-Test.......................................................... 5-21
5-25. Switch Decoding Self-Test....................................... 5-22
5-26. Troubleshooting Guide................................................ 5-23
5-1
Page 90

8060A
Instruction Manual
5-2
Page 91

Maintenance
Introduction
5-1. Introduction
Warning
These servicing instructions are for use by qualified
personnel only. To avoid electric shock, do not perform
any servicing other than that contained in the operating
instructions unless you are qualified to do so.
This chapter of the manual contains information regarding the maintenance
of your instrument. It includes information about disassembly, performance
tests, calibration adjustments, and troubleshooting. The combined
performance tests are recommended as an acceptance test when the
instrument is first received, and can be used later as preventive maintenance
tool.
A one-year calibration cycle is recommended to maintain the specifications
given in Chapter 1 of this manual. The test equipment required for the
performance tests or calibration adjustments is listed in Table 5-1. Test
equipment with equivalent specifications may also be used.
5-2. Service Information
5
The 8060A is warranted for a period of one year upon shipment of the
instrument to the original purchaser. Conditions of the warranty are given at
the front of this manual. Malfunctions that occur within the limits of the
warranty will be corrected at no cost to the purchaser. For in-warranty repair,
call (toll-free) 800 426-0361 for the address of the nearest Fluke Technical
Service Center designated to service your instrument. (In Alaska, Hawaii,
Washington or Canada call 206 356-5400.) Ship the instrument postpaid in
the original shipping container (if available). Dated proof-of-purchase may
be required for in-warranty repairs.
Fluke Technical Service Centers are also available for calibration and/or
repair of instruments that are beyond the warranty period. Call the number
listed above for shipping information. Ship the instrument and remittance in
accordance with instructions received.
5-3
Page 92

8060A
Instruction Manual
Table 5-1. Required Test Equipment
Equipment Required specifications
DC Voltage: 0 to 1000V, ±(0.0075%)
AC Voltage:
200 Hz to 1 kHz, 0 to 750V, ±(0.06%)
DMM
Calibrator
Reference
Resistors
Signal
Source
DMM
1 kHz to 10 kHz, 0 to 200 V, ±(0.06%)
10 kHz to 30 kHz, 0 to 200V, ±(0.1%)
30 kHz to 50 kHz, 0 to 200V, ±(0.25%)
50 kHz to 100 kHz, 0 to 2.0V, ±(0.75%)
Resistance: 100Ω to 10.0 MΩ, ±(0.1%)
DC Current: 0 to 2000 mA, ±(0.05%)
AC Current:
20 Hz to 3 kHz, 0 to 2000 mA, ±(0.25%)
40 MΩ and 290 MΩ, ±(0.1%)
Frequency: 25 mV to 200 mV, 100 Hz to
200 kHz, ±(0.1%)
DC Voltage: 200 mV to 20V, ±(0.25%)
DC Current: 2 mA to 200 mA, ±(0.1%)
Recommended
Type
Fluke 5100B
with Options
Y5000, 5100A03, and Fluke
5205A Amplifier
Fluke 5100B
with Option
Y5000 and
Fluke 5220A
Amplifier
Caddock
MG750*
Fluke 5700A
Fluke 87
*Precision high MΩ resistors may be ordered from Caddock Electronics,
3127 Chicago Ave., Riverside, CA, 92507. Be sure to specify 0.1%
tolerance.
5-3. General Information
It is recommended that you periodically check the battery and perform the
performance tests (paragraphs 5-11 through 5-20).
5-4
Page 93

Maintenance
Service Information
5-4. Handling Precautions for Using Static Sensitive Devices
Caution
This instrument contains CMOS components which can
be damaged by static discharge. Static sensitive
components on the main pcb include U3 and U4. The
microcomputer pcb includes one static sensitive
component, U5, the microcomputer. To prevent damage,
take the following precautions when troubleshooting
and/or repairing the instrument:
•
Perform all work at a static-free work station.
•
Do not handle components or pcb assemblies by their connectors.
• Wear static ground straps.
• Use conductive foam to store components.
• Remove all plastic, vinyl and styrofoam from the work area.
• Use a grounded, temperature-regulated soldering iron.
5
5-5. Disassembly and Reassembly
The instrument has two pcbs: the main pcb and the microcomputer pcb. To
gain access to the calibration adjustments, the backup fuse, or the LCD, you
have to remove only the top cover. You can also do some troubleshooting
with only the top cover and the top ac shield off. For other troubleshooting
or to gain access to the microcomputer pcb, you have to remove the main
pcb from the case. If you remove the main pcb from the case, you will need
to perform the calibration adjustments. Be sure to heed the notes and
cautions about special handling requirements.
Note
It is not necessary to remove the main pcb from the bottom case in
order to disassemble or reassemble the LCD. However, because the
LCD and the microcomputer require similar special handling, the
disassembly and reassembly procedures are described together.
5-5
Page 94

8060A
Instruction Manual
Caution
To avoid contaminating the pcbs with oil from the
fingers, handle the pcbs by the edges or wear gloves.
5-6. Calibration and Backup Fuse Access
Use the following procedure to gain access to the calibration adjustments or
the backup fuse (F2):
1. Disconnect the test leads and battery eliminator, if attached. Turn the
power switch off.
2. Remove the three phillips screws from the bottom of the case.
3. Turn the instrument face-up and grasp the top cover at both sides of the
input connectors. Then pull the top cover from the unit. The backup fuse
and the calibration adjustments are now accessible (Figure 5-1).
Caution
The function buttons below the display are part of a
single elastomeric strip (Figure 5-1) that is held in place
by the top cover. When the top cover is removed, the
elastomeric strip will be loose and may be removed. Do
not touch or contaminate the carbon-impregnated switch
contacts on the bottom of the strip or the switch
contacts on the display pcb. If the contacts do become
contaminated, clean them with isopropyl alcohol.
4. To reassemble, position the elastomeric strip on the microcomputer pcb
so that the small rubber posts on the bottom of the strip are properly
seated. Install the top cover and fasten the three screws on the bottom
case.
5-6
Page 95

Maintenance
Service Information
5
Green Power
Switch Cap
Pry fuse out from the side.
Figure 5-1. Calibration and Backup Fuse (F2) Access)
Elastomeric Strip
AC Shield
Remove before removing
Main PCB. When reassembling,
install shield after installing
Main PCB.
Backup Fuse F2
dx32c.eps
5-7
Page 96

8060A
Instruction Manual
5-7. Main PCB Access
Use the following procedure to gain access to the main pcb:
1. Remove the screw in the center of the ac shield and remove the shield.
2. Using your index finger, lift up the lower right corner of the main pcb
until it is free. Then pull the pcb to the right until it clears the shelf
under the buttons.
Caution
Do not touch or contaminate the plastic insulator that is
attached to the inside of the case bottom. When the
instrument is assembled the insulator makes contact
with the leads on the bottom of the main pcb.
Contaminants could cause undesirable conduction
paths. If the insulator becomes contaminated, clean with
isopropyl alcohol.
3. Reassemble in the logical reverse order and heed the following notes:
a. When reassembling, be sure to put on the ac shield after the main
pcb has been placed in the case bottom. The reason for this is that
the screw which holds down the ac shield has a spring attached. The
spring provides the electrical connection between the top of the ac
shield and the bottom of the shield (under the insulator). If the ac
shield is attached to the main pcb before the main pcb is in the case,
the spring may fold across the insulator and not be in proper
position to make the electrical connection.
b. Be sure to place the green power switch cap over the small black
power switch before sliding the main pcb into the case.
c. Be sure to route the battery-clip wires to the left side of the post
under the backup fuse case.
5-8
Page 97

Maintenance
Service Information
5-8. LCD and Microcomputer PCB Disassembly and Assembly
Note
This procedure applies to serial number 3995000 and higher.
The procedure for disassembling or assembling the LCD and the
microcomputer pcb is not difficult, but the steps must be followed in
sequence. Before you try the procedure, examine the components in Figure
5-2 and familiarize yourself with the following handling precautions:
•
The microcomputer, U5 (item 4 in Figure 5-2), is a static sensitive
CMOS device. Follow the standard procedures for handling static
sensitive devices.
•
The LCD interconnect (item 7) and the microcomputer interconnect
(item 5) should not be touched with fingers or contaminated. Handle
these items with tweezers and keep them clean.
• The microcomputer interconnect (item 5) is susceptible to corrosion
caused by the reaction between the metal in the connector and possible
contaminates in the air such as smoke or sulfur. Store the connector in
an air-tight container if the LCD is disassembled for a long period of
time.
5
• Do not get fingerprints or dirt on the LCD display, the display lens, or
the gasket.
• While the LCD and microcomputer pcb are assembled, take care not to
press down on the display lens because pressure could damage the LCD.
5-9
Page 98

8060A
Instruction Manual
LCD Display
LCD Bracket
LCD Plate
(Do not remove)
Microcomputer
Interconnect
CAUTION:
Use tweezers to insert.
Do not handle with fingers.
Shock Absorber
LCD Interconnect
CAUTION:
Use tweezers to insert.
Do not handle with fingers.
Microcomputer PCB
CAUTION:
Static Sensitive.
LCD Support
Display Lens
Gasket
Align, then push down
Insert edge
under retainer
Serial # effectivity. 3995000
and snap into place.
Figure 5-2. Assembling/Disassembling the Microcomputer PCB and
LCD
5-10
dx33c.eps
Page 99

Maintenance
Service Information
To disassemble the LCD, use your thumbnails and push on the corners of the
LCD display, gasket and display lens so that all three components slide out
together as shown in Figure 5-3.
Note
It is not necessary to remove the main pcb from the button case to
disassemble or reassemble the LCD.
To assemble the LCD, use the following procedure:
1. Align the LCD display (item 8) as indicated in Figure 5-2 and slide it
into place. The bottom edge of the LCD display should compress the
LCD interconnect (item 7) and slide underneath the two plastic notches
on the LCD bracket (item 1).
2. Refer to Figure 5-2 and follow steps 9 and 10 to complete assembly.
Slide Out
5
Push corners with thumbnails.
Figure 5-3. Disassembling the LCD
To disassemble the microcomputer pcb, use the following procedure:
1. Turn the main pcb face down and remove the two small screws at the
top of the pcb to free the microcomputer pcb.
2. Refer to Figure 5-2. Beginning with item 7, remove items 7 through 3
(leave item 2 attached to item 1). Be sure to observe the handling
precautions for items 7, 5, and 4.
To assemble the microcomputer LCD, refer to Figure 5-2. Beginning with
item 3, assemble items 3 through 7 (in ascending numerical order). Be sure
to follow the handling precautions for items 4, 5, and 7.
sx34c.eps
5-11
Page 100

8060A
Instruction Manual
5-9. Backup Fuse Replacement
Use the following procedure to replace the backup fuse (F2):
1. Remove the top cover by following the precautions given previously for
the calibration and backup fuse access.
2. Use a flat-tipped screwdriver to pry the fuse out of its fuse holder. Pry
the fuse from the side as indicated in Figure 5-1.
3. Replace the defective backup fuse with a 3A/600V type BBS-3 (Fluke
PN 475004). Refer to section 2-4 for information about replacing fuse
F1 (2A/250V; American style: fast acting type AGX2, 1/4 x 1”, Fluke
PN 376582.; European style: 5 x 20 mm, Fluke PN 460972).
5-10. Cleaning
Clean the front panel and case with a damp cloth and mild detergent. Do not
use abrasives, solvents, or alcohol.
Warning
To avoid electrical shock, remove test leads and any
input signals before cleaning operation.
5-12
 Loading...