

Page 1
TECHNICAL DATA
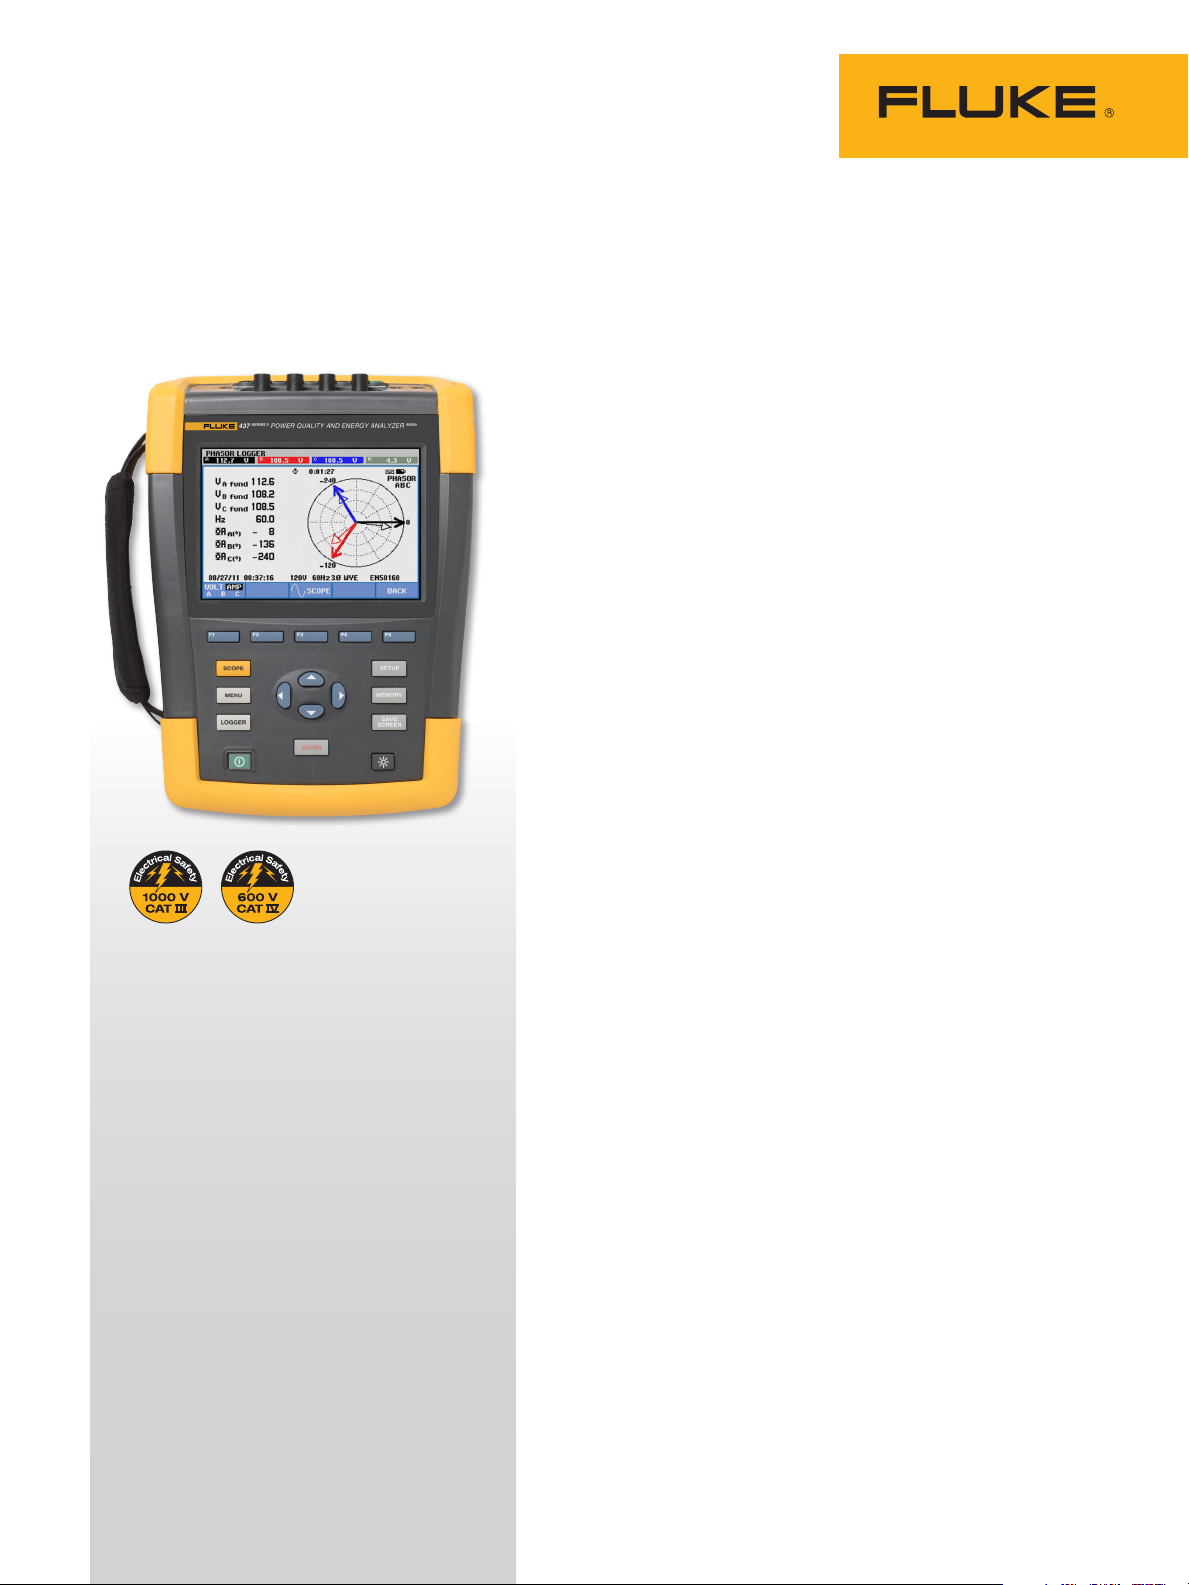
Fluke 430 Series II Three-Phase
Power Quality and Energy Analyzers
More detailed power quality analysis capability, and a
new Fluke-patented energy monetization function
The new 430 Series II Power Quality and Energy Analyzers offer
the best in power quality analysis and introduce, for the first time
ever, the ability to monetarily quantify energy losses.
The new Fluke 434, 435 and 437 Series II models help locate,
predict, prevent, and troubleshoot power quality problems in threephase and single-phase power distribution systems. Additionally,
the Fluke-patented energy loss algorithm, Unified Measurement, measures and quantifies energy losses due to harmonics
and unbalance issues, allowing the user to pinpoint the origin of
energy waste within a system.
• Energy loss calculator: Classic active and reactive power
measurements, unbalance and harmonic power, are quantified
to pinpoint true system energy losses in dollars (other local
currencies available).
• Power inverter efficiency: Simultaneously measure AC output
power and DC input power for power electronics systems using
optional DC clamp.
• PowerWave data capture: 435 and 437 Series II analyzers capture fast RMS data, show half-cycle and waveforms to
characterize electrical system dynamics (generator start-ups, UPS
switching etc.).
• Waveform capture: 435 and 437 Series II models capture
50/60 cycles (50/60Hz) of each event that is detected in all
modes, without set-up.
KEY MEASUREMENTS
Power Quality Measurements, Power
Waveform Details, Event Capture and
Recording, Energy Loss and Efficiency
calculations
FLUKE CONNECT® CO M PATIB L E*
View data locally on the instrument,
via Fluke Connect mobile app and
PowerLog 430-II desktop software
SAFETY RATED FOR INDUSTRIAL
APPLICATIONS
600 V CAT IV/1000 V CAT III rated
for use at the service entrance and
downstream
• Automatic Transient Mode: 435 and 437 Series II analyzers
capture 200 kHz waveform data on all phases simultaneously up
to 6 kV.
• Fully Class-A compliant: 435 and 437 Series II analyzers
conduct tests according to the stringent international IEC
61000-4-30 Class-A standard.
• Mains signaling: 435 and 437 Series II analyzers measure
interference from ripple control signals at specific frequencies.
• 400 Hz measurement: 437 Series II analyzer captures power
quality measurements for avionic and military power systems.
• Troubleshoot: Analyze the trends using the cursors and zoom
tools.
* Not all models are available i n all count ries. Check wit h
your local Fluke representative.
Page 2
• Highest safety rating in the industry: 600 V
CAT IV/1000 V CAT III rated for use at the service
entrance.
• Measure all three phases and neutral: With
included four flexible current probes with
enhanced thin flex designed to fit into
the tightest places.
• Automatic Trending: Every measurement is
always automatically recorded, without any
set-up.
• System-Monitor: Ten power quality parameters
on one screen according to EN50160 power
quality standard.
• Logger function: Configure for any test condi-
tion with memory for up to 600 parameters at
user defined intervals.
• View graphs and generate reports: With
included analysis software.
• Battery life: Up to 8 hours operating time per
charge on Li-ion battery pack.
• Wireless data download: Download data to
PC wirelessly and capture screens using
Fluke Connect App.
Unified power measurement
Fluke’s patented Unified Power Measurement
system (UPM) provides the most comprehensive
view of power available, measuring:
• Parameters of Classical Power (Steinmetz 1897)
and IEEE 1459-2000 Power
• Detailed Loss Analysis
• Unbalance Analysis
These UPM calculations are used to quantify the
fiscal cost of energy loss caused by power quality
issues. The calculations are computed, along with
other facility-specific information, by an Energy
Loss Calculator that ultimately determines how
much money a facility loses due to wasted energy.
Energy savings
Traditionally energy savings are achieved by monitoring and targeting, or in other words, by finding
the major loads in a facility and optimizing their
operation. The cost of power quality could only be
quantified in terms of downtime caused by lost
production and damage to electrical equipment.
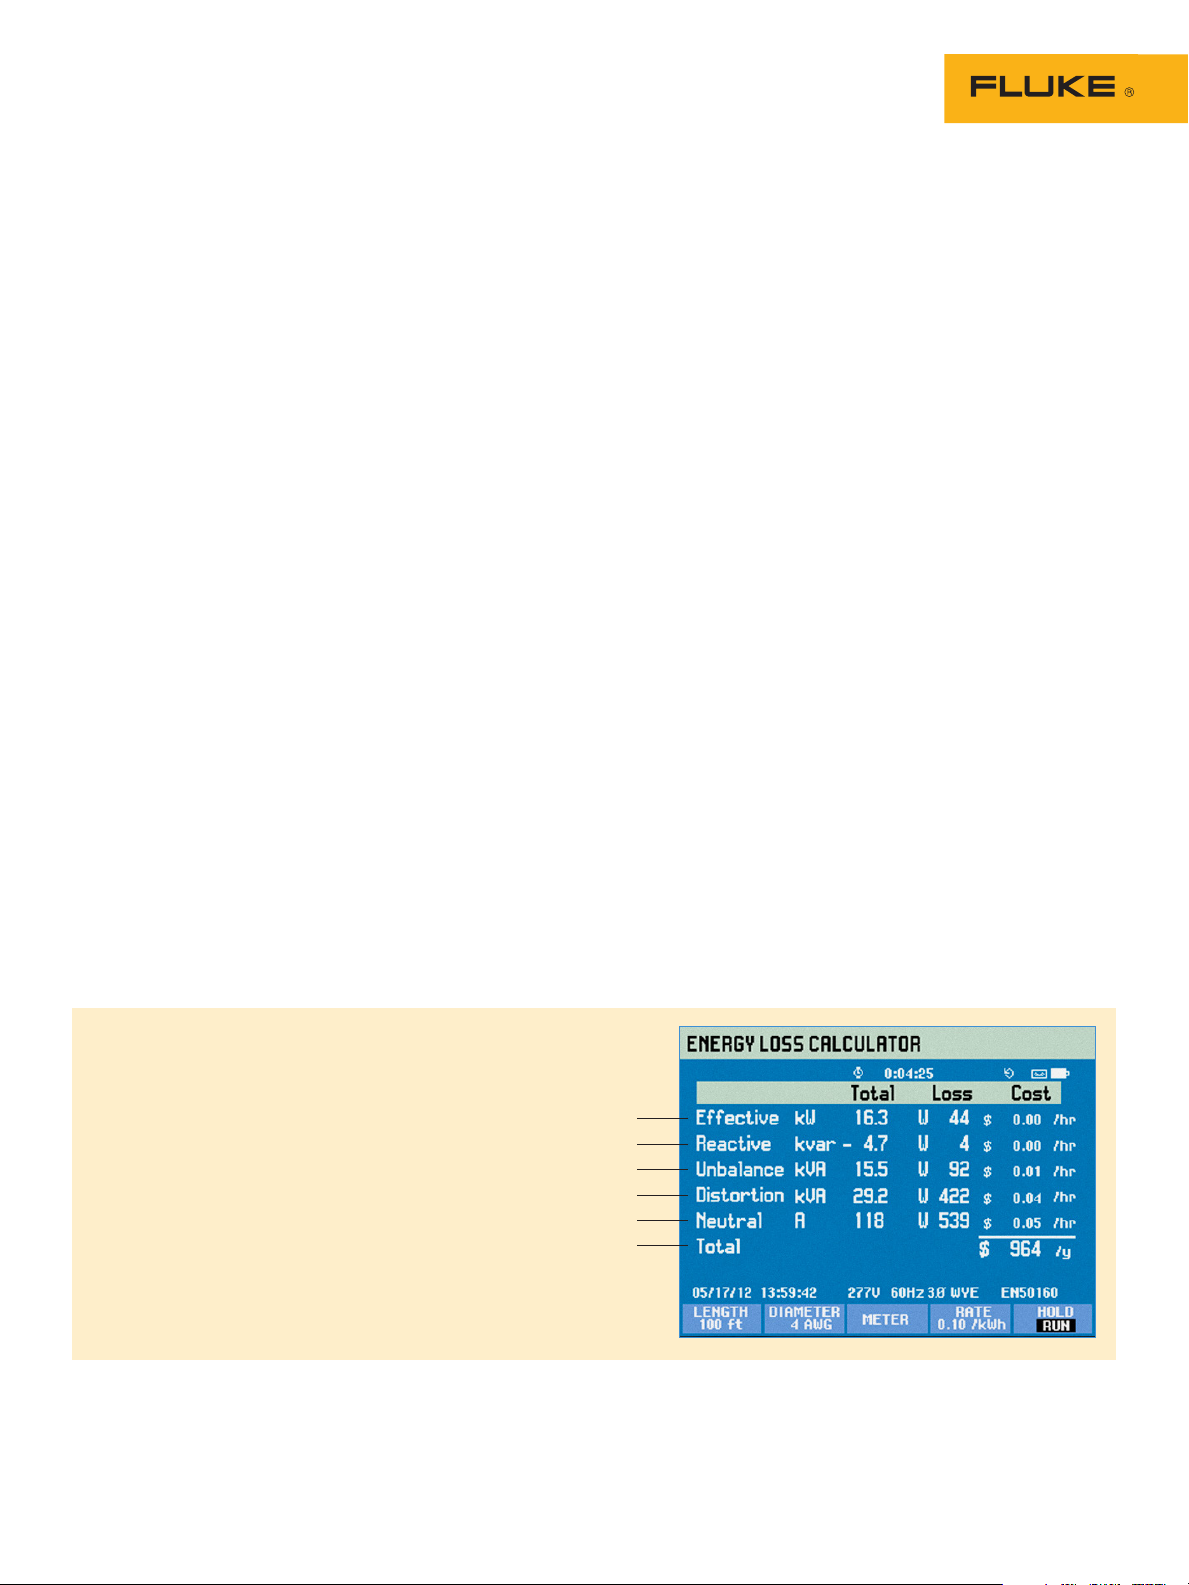
The Unified Power Measurement (UPM) method
now goes beyond this to achieve energy savings
by discovering the energy waste caused by power
quality issues. Using the Unified Power Measurement, Fluke’s Energy Loss Calculator (see screen
shot below) will determine how much money a
facility is losing due to waste energy.
Energy loss calculator
Useful kilowatts (power) available
Reactive (unusable) power
Kilowatts made unusable by unbalance issues
Kilowatts made unusable by harmonics
Neutral current
Total cost of wasted kilowatt hours
2 Fluke Corporation Fluke 430 Series II Three-Phase Power Quality and Energy Analyzers
Page 3
Unbalance
UPM gives a more comprehensive breakdown of
the energy consumed in the plant. In addition to
measuring reactive power (caused by poor power
factor), UPM also measures the energy waste
caused by unbalance; the effect of unevenly loading each phase in three-phase systems. Unbalance
can often be corrected by reconnecting loads on
different phases to ensure the current drawn on
each phase is as equal as possible. Unbalance
can also be corrected by installing an unbalance
reactance device (or filter), that will minimize the
effects. Correcting unbalance should be basic good
housekeeping in the facility as unbalance problems
can cause motor failure or shorten equipment life
expectancy. Unbalance also wastes energy. Using
UPM can minimize or eliminate that energy waste,
thus saving money.
Harmonics
UPM also provides details of the energy wasted
in your facility due to the presence of harmonics.
Harmonics may be present in your facility due to
the loads you operate or may be caused by loads
in adjacent facilities. The presence of harmonics in
your facility can lead to:
• overheating transformers and conductors
• nuisance tripping of circuit breakers
• early failures of electrical equipment
Quantifying the cost of wasted energy due to the
presence of harmonics simplifies the return-oninvestment calculation needed to justify purchasing
harmonic filters. By installing a harmonic filter the
ill effects of harmonics can be reduced and energy
waste eliminated, resulting in lower operational
costs and more reliable operation.
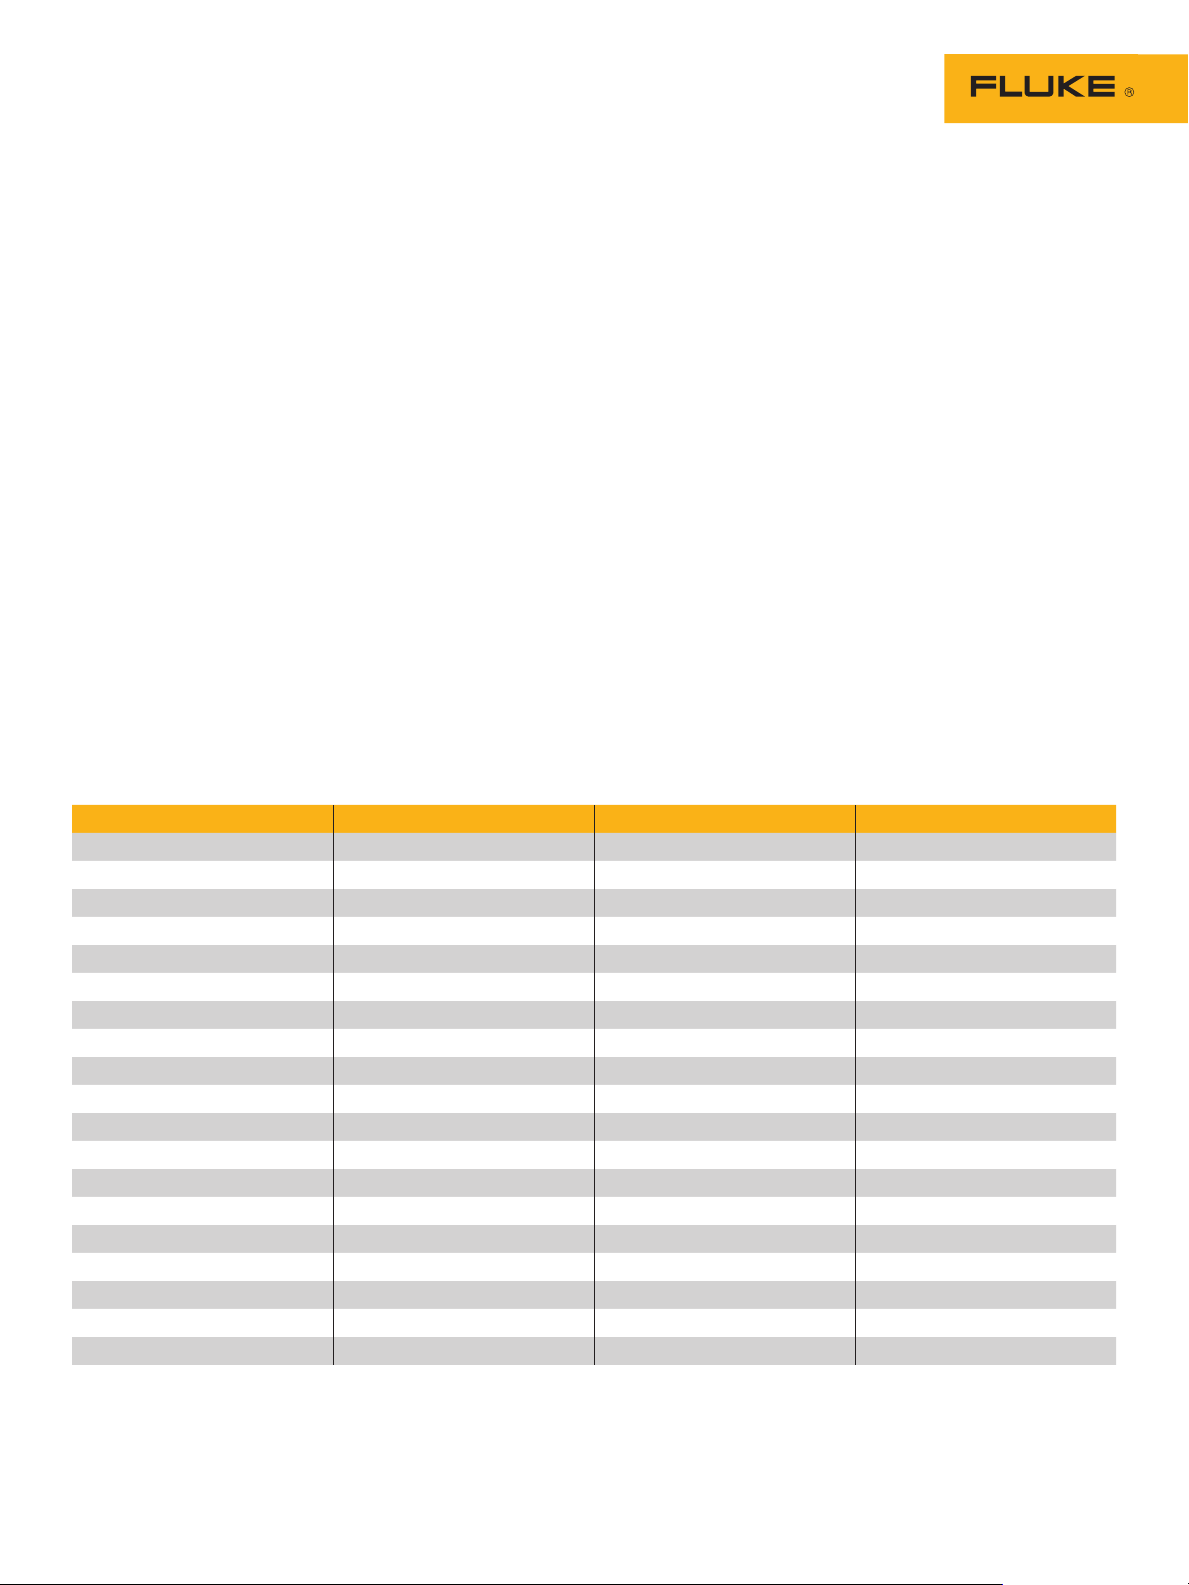
430 Series II Power Quality and Energy Analyzer selection table
Model Fluke 434-II Fluke 435-II Fluke 437-II
Standard compliance IEC 61000-4-30 Class S IEC 61000-4-30 Class A IEC 61000-4-30 Class A
Volt Amp Hz
Dips and swells
Harmonics
Power and energy
Energy loss calculator
Unbalance
Monitor
Inrush
Event waveform capture
Flicker
Transients
Mains signaling
Power wave
Power inverter efficiency
400Hz
C1740 Soft Case
C437-II Hard Case with rollers
FC WiFi SD card (Max 32 GB)* 8 GB 8 GB 8 GB
All models include the following accessories TL430 test lead set, 4 x i430 thin flexi current probes, BP290 battery, BC430 power adapter with international power adapter set, USB cable A-B mini and
PowerLog CD.
* Standard 8GB SD card included with /INTL instrument versions.
• • •
• • •
• • •
• • •
• • •
• • •
• • •
• • •
• •
• •
• •
• •
• •
• • •
•
• •
•
3 Fluke Corporation Fluke 430 Series II Three-Phase Power Quality and Energy Analyzers
Page 4
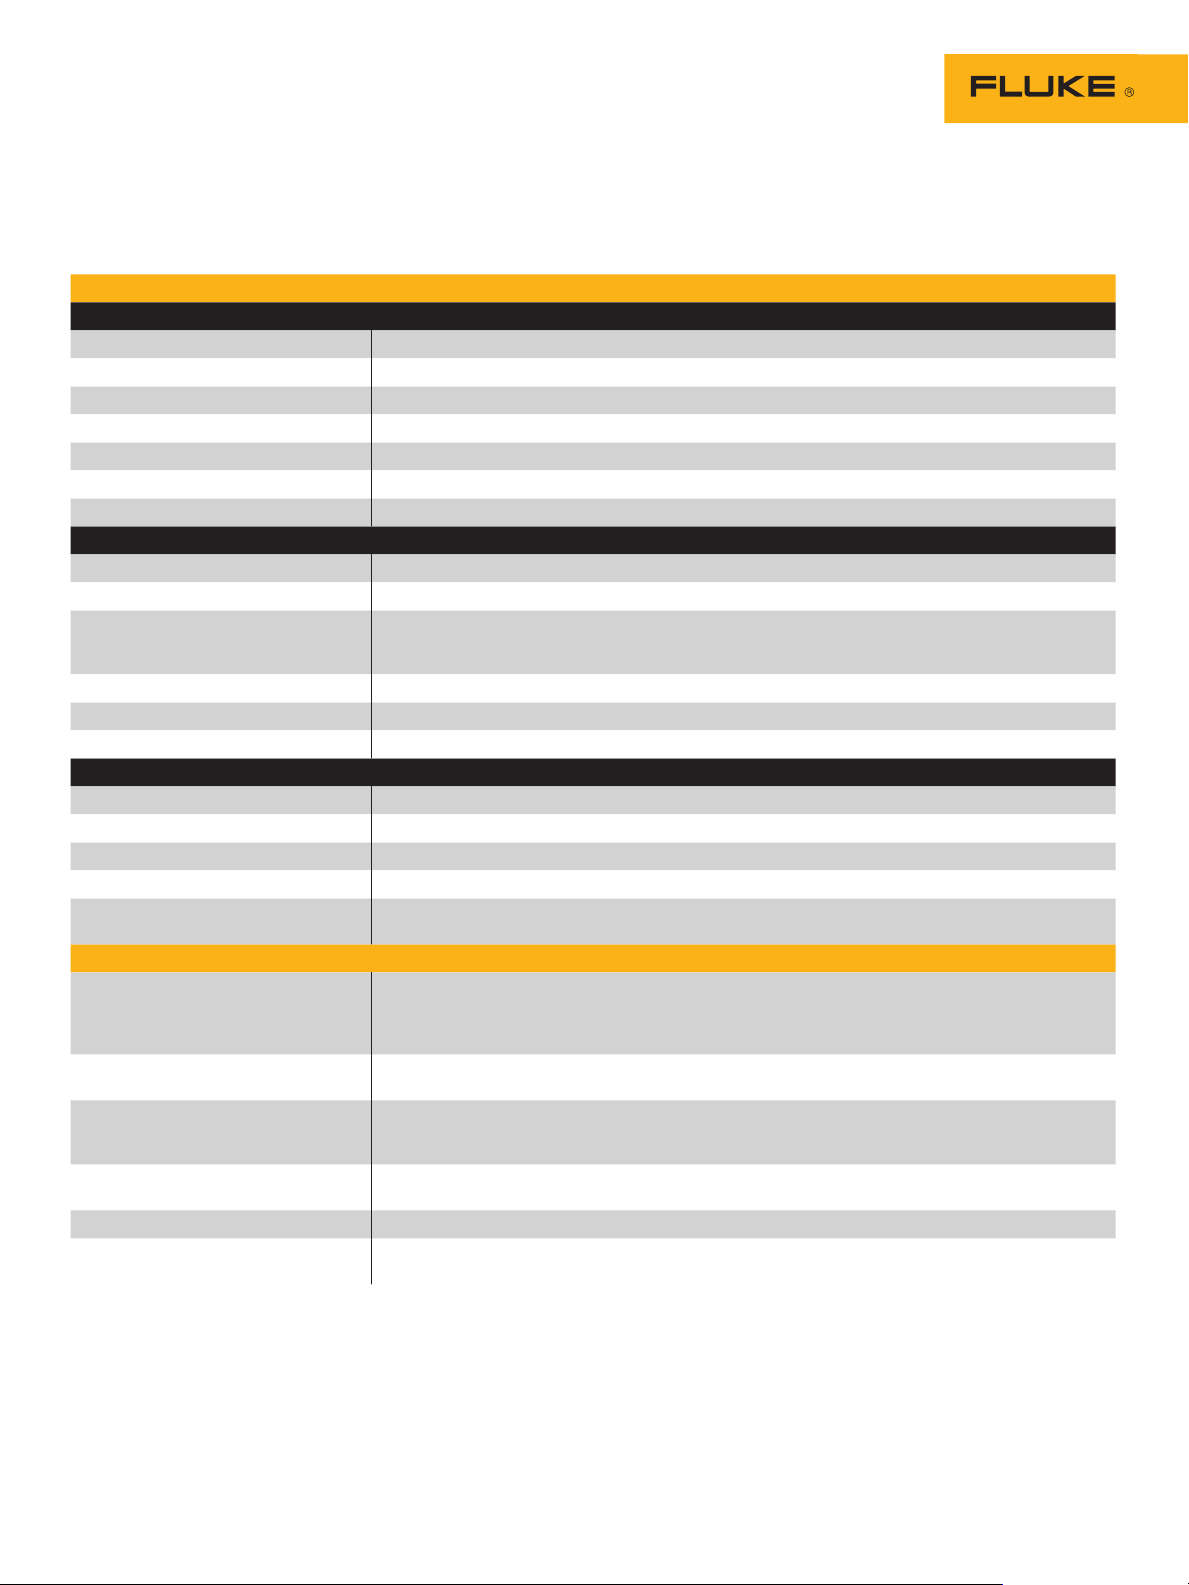
Technical specifications
Specifications are valid for models Fluke 434-II, Fluke 435-II, Fluke 437-II unless otherwise specified.
Specificatons for Amp and Watt readings are based upon i430-Flexi-TF unless otherwise specified.
Input characteristics
Voltage inputs
Number of inputs 4 (3 phase + neutral) dc-coupled
Maximum input voltage 1000 Vrms
Nominal voltage range Selectable 1 V to 1000 V
Max. peak measurement voltage 6 kV (transient mode only)
Input impedance 4 MΩ//5 pF
Bandwidth > 10 kHz, up to 100 kHz for transient mode
Scaling 1:1, 10:1, 100:1, 1,000:1 10,000:1 and variable
Current inputs
Number of inputs 4 (3 phase + neutral) dc- or ac-coupled
Type Clamp or current transformer with mV output or i430flex-TF
Range
Input impedance 1 MΩ
Bandwidth > 10 kHz
Scaling 1:1, 10:1, 100:1, 1,000:1 10,000:1 and variable
Sampling system
Resolution 16 bit analog to digital converter on 8 channels
Maximum sampling speed 200 kS/s on each channel simultaneously
RMS sampling 5000 samples on 10/12 cycles according to IEC61000-4-30
PLL synchronization 4096 samples on 10/12 cycles according to IEC61000-4-7
Nominal frequency
Display modes
Waveform display
Phasor diagram
Meter readings
Trend graph
Bar graph Available in Monitor and Harmonics mode
Event list
0.5 Arms to 600 Arms with included i430flex-TF (with sensitivity 10x)
5 Arms to 6000 Arms with included i430flex-TF (with sensitivity 1x)
0.1 mV/A to 1 V/A and custom for use with optional ac or dc clamps
434-II and 435-II: 50 Hz and 60 Hz
437-II: 50 Hz, 60 Hz and 400 Hz
Available in all modes via SCOPE key
435-II and 437-II: Default display mode for Transients function
Update rate 5x per second
Displays 4 cycles of waveform data on screen, up to 4 waveforms simultaneously
Available in all modes via Scope waveform display
Default view for Unbalance mode
Available in all modes except Monitor and Transients, provides tabulated view of all available
readings
Fully customizable up to 150 readings for Logger mode
Available in all modes except Transients
Single vertical cursor with min max and avg reading at cursor position
Available in all modes
Provides waveforms on 435II and 437II only
4 Fluke Corporation Fluke 430 Series II Three-Phase Power Quality and Energy Analyzers
Page 5

Measurement modes
Scope
Volts/amps/hertz Vrms phase to phase, Vrms phase to neutral, Vpeak, V Crest Factor, Arms Apeak, A Crest Factor, Hz
Dips and swells Vrms½, Arms½, Pinst with programmable threshold levels for event detection
Harmonics dc, 1 to 50, up to 9th harmonic for 400 Hz
Power and energy
Energy loss calculator
Inverter efficiency
(requires optional dc current clamp)
Unbalance Vneg%, Vzero%, Aneg%, Azero%, Vfund, Afund, V phase angles, A phase angles
Inrush Inrush current, Inrush duration, Arms½, Vrms½
Monitor
Flicker (435-II and 437-II only) Pst(1min), Pst, Plt, Pinst, Vrms ½, Arms ½, Hz
Transients (435-II and 437-II only) Transient waveforms 4x Voltage 4x Amps, triggers: Vrms ½, Arms ½, Pinst
Mains Signaling (435-II and 437-II
only)
Power Wave (435-II and 437-II only) Vrms½, Arms½ W, Hz and scope waveforms for voltage amps and watts
Logger Custom selection of up to 150 PQ parameters measured simultaneously on 4 phases
4 voltage waveforms, 4 current waveforms, Vrms, Vfund. Arms, A fund, V @ cursor, A @ cursor,
phase angles
Harmonics Volts, THD, Harmonic Amps, K factor Amps, Harmonic Watts, THd Watts, K factor Watts,
Interharmonic Volts, Interharmonic Amps, Vrms, Arms (relative to fundamental or to total rms)
Vrms, Arms, Wfull, Wfund., VAfull, VAfund., VAharmonics, VAunbalance, var, PF, DPF, CosQ, Efficiency factor, Wforward, Wreverse
Wfund, VAharmonics, VAunbalance, var, A, Loss Active, Loss Reactive, Loss Harmonics, Loss Unbalance, Loss Neutral, Loss Cost (based upon user defined cost / kWh)
Wfull, Wfund, Wdc, Efficiency, Vdc, Adc, Vrms, Arms, Hz
Vrms, Arms, harmonic Volts, THD Volts, PLT, Vrms½, Arms½, Hz, dips, swells, interruptions, rapid
voltage changes, unbalance and mains signalling.
All parameters are measured simultaneously in accordance with EN50160
Flagging is applied according to IEC61000-4-30 to indicate unreliable readings due to dips or swells
Relative signaling voltage and absolute signaling voltage averaged over three seconds for up to two
selectable signaling frequencies
Product specifications
Model Measurement range Resolution Accuracy
Volt
Vrms (ac+dc)
Vpk 1 Vpk to 1400 Vpk 1 V 5 % of nominal voltage
Voltage Crest Factor (CF) 1.0 > 2.8 0.01 ± 5 %
Vrms½
Vfund
434-II 1 V to 1000 V phase to neutral 0.1 V ± 0.5 % of nominal voltage****
435-II and 437-II 1 V to 1000 V phase to neutral 0.01 V ± 0.1 % of nominal voltage****
434-II 1 V to 1000 V phase to neutral 0.1 V ± 1 % of nominal voltage
434-II and 435-II 0.1 V ± 0.2 % of nominal voltage
434-II 1 V to 1000 V phase to neutral 0.1 V ± 0.5 % of nominal voltage
435-II and 437-II 0.1 V ± 0.1 % of nominal voltage
5 Fluke Corporation Fluke 430 Series II Three-Phase Power Quality and Energy Analyzers
Page 6

Amps (accuracy excluding clamp accuracy)
i430-Flex 1x 5 A to 6000 A 1 A ± 0.5 % ± 5 counts
Amps (ac +dc)
i430-Fle x 10x 0.5 A to 600 A 0.1 A ± 0.5 % ± 5 counts
1mV/A 1x 5 A to 2000 A 1A ± 0.5 % ± 5 counts
1mV/A 10x 0.5 A A to 200 A (ac only) 0.1 A ± 0.5 % ± 5 counts
Apk
i430-Flex 8400 Apk 1 Arms ± 5 %
1mV/A 5500 Apk 1 Arms ± 5 %
A Crest Factor (CF) 1 to 10 0.01 ± 5 %
i430-Flex 1x 5 A to 6000 A 1 A ± 1 % ± 10 counts
Amps½
i430-Fle x 10x 0.5 A to 600 A 0.1 A ± 1 % ± 10 counts
1mV/A 1x 5 A to 2000 A 1A ± 1 % ± 10 counts
1mV/A 10x 0.5 A A to 200 A (ac only) 0.1 A ± 1 % ± 10 counts
i430-Flex 1x 5 A to 6000 A 1 A ± 0.5 % ± 5 counts
Afund
i430-Fle x 10x 0.5 A to 600 A 0.1 A ± 0.5 % ± 5 counts
1mV/A 1x 5 A to 2000 A 1A ± 0.5 % ± 5 counts
1mV/A 10x 0.5 A A to 200 A (ac only) 0.1 A ± 0.5 % ± 5 counts
Hz
Hz
Fluke 434 @ 50 Hz
nominal
Fluke 434 @ 60 Hz
nominal
Fluke 435/7 @ 50 Hz
nominal
Fluke 435/7 @ 60 Hz
nominal
Fluke 437 @ 400 Hz
nominal
42.50 Hz to 57.50 Hz 0.01 H z ± 0.01 Hz
51.00 Hz to 69.00 Hz 0.01 H z ± 0.01 Hz
42.500 Hz to 57.500 Hz 0.0 01 H z ± 0.01 Hz
51.000 Hz to 69.000 Hz 0.0 01 Hz ± 0.01 Hz
340.0 Hz to 460.0 Hz 0.1 Hz ± 0.1 Hz
Power
i430-Flex max 6000 MW
Watts (VA, var)
1 mV/A max 2000 MW
Power factor (Cos j/DPF) 0 to 1 0.001
0.1 W to 1
MW
0.1 W to 1
MW
± 1 % ± 10 counts
± 1 % ± 10 counts
± 0.1 % @ nominal load
conditions
Energy
kWh (kVAh, kvarh) i430 -Flex 10x Depends on clamp scaling and V nominal ± 1 % ± 10 counts
± 1 % ± 10 counts
Energy loss i4 30 -Flex 10x Depends on clamp scaling and V nominal
Excluding line resistance
accuracy
6 Fluke Corporation Fluke 430 Series II Three-Phase Power Quality and Energy Analyzers
Page 7

Harmonics
Harmonic order (n) DC, 1 to 50 Grouping: Harmonic groups according to IEC 61000-4-7
Inter-harmonic order (n)
OFF, 1 to 50 Grouping: Harmonic and Interharmonic subgroups according to IEC
61000-4-7
%f 0.0 % to 100 % 0.1 % ± 0.1 % ± n x 0.1 %
Volts
%r 0.0 % to 100 % 0.1 % ± 0.1 % ± n x 0.4 %
Absolute 0.0 to 1000 V 0.1 V ± 5 % *
THD 0.0 % to 100 % 0.1 % ± 2.5 %
%f 0.0 % to 100 % 0.1 % ± 0.1 % ± n x 0.1 %
Amps
%r 0.0 % to 100 % 0.1 % ± 0.1 % ± n x 0.4 %
Absolute 0.0 to 600 A 0.1 A ± 5 % ± 5 counts
THD 0.0 % to 100 % 0.1 % ± 2.5 %
%f or %r 0.0 % t o 100 % 0 .1 % ± n x 2 %
Watts
Absolute
Depends on clamp scaling and V
nominal
— ± 5 % ± n x 2 % ± 10 counts
THD 0.0 % to 100 % 0.1 % ± 5 %
Phase Angle -360° to +0° 1° ± n x 1°
Flicker
Plt, Pst, Pst(1min) Pinst 0.00 to 20.00 0.01 ± 5 %
Unbalance
Volts % 0.0 % to 20.0 % 0.1 % ± 0.1 %
Amps % 0.0 % to 20.0 % 0.1 % ± 1 %
Mains signaling
Threshold, limits and signaling
Threshold levels
duration is programable for two
— —
signaling frequencies
Signaling frequency 60 Hz to 3000 Hz 0.1 H z
Relative V% 0 % to 100 % 0 .10 % ± 0.4 %
Absolute V3s
(3 second avg.)
0.0 V to 1000 V 0.1 V ± 5 % of nominal voltage
7 Fluke Corporation Fluke 430 Series II Three-Phase Power Quality and Energy Analyzers
Page 8

Trend recording
Method
Sampling 5 readings/s continuous sampling per channel, 100/120** reading/s for 1/2 cycle values and Pinst
Recording time 1 hr up to 1 year, user selectable (default setting 7 days)
Averaging time Minimum of 1 second
Memory Data is stored on SDcard (8GB included 32GB max)
Events
Automatically records min, max and average values over time for all readings being displayed for the three phases and neutral
simultaneously
434-II: Tabulated in event list
435-II and 437-II: Tabulated in event list, including 50/60** waveform cycles and 7.5s 1/2 cycle rms Voltage and Amps trend
Measurement method
Vrms, Arms 10/12 cycle contiguous non-overlapping intervals using 500/4162 samples per cycle in accordance with IEC 61000-4-30
Vpeak, Apeak Absolute highest sample value within 10/12 cycle interval with 40 μs sample resolution
V Crest Factor Measures ratio between the Vpeak and Vrms
A Crest Factor Measures ratio between the Apeak and Arms
Hz
Harmonics Calculated from 10/12-cycle gapless harmonic group measurements on Voltage and Amps according to IEC 61000-4-7
Watt
VA Full and fundamental apparent power display. Calculates apparent power using Vrms x Arms value over 10/12 cycle period.
var
VA Harmonics
VA Unbalance
Power factor Calculated total watt/VA
Cos j Cosine of angle between fundamental voltage and current
DPF Calculated fundamental Watt/VA
Energy/energy cost Power values are accumulated over time for kWh values. Energy cost is calculated from user defined /kWh cost variable
Unbalance The supply voltage unbalance is evaluated using the method of symmetrical components according to IEC61000-4-30
Flicker
Transient capture Captures waveform triggered on signal envelope. Additionally triggers on dips, swells, interruptions and Amps level
Inrush current
Mains signaling
Time synchronization
Measured every 10 sec in accordance with IEC61000-4-30. Vrms½, Arms½ Value is measured over 1 cycle, commencing at
a fundamental zero crossing, and refreshed each half-cycle.
This technique is independent for each channel in accordance with IEC 61000-4-30.
Full and fundamental real power display. Calculates average value of instantaneous power over 10/12 cycle period for each phase.
Total Active Power PT = P1 + P2 + P3.
Fundamental reactive power display. Calculates reactive power on fundamental positive sequence components. Capacitive and
inductive load is indicated with capacitor and inductor icons.
Total disturbance power due to harmonics. Calculated for each phase and for total system based upon total apparent power and
fundamental real power.
Unbalance power for total sytem. Calculated using symmetrical components method for fundamental apparent power and total
apparent power.
According to IEC 61000-4-15 flickermeter—functional and design specification.
Includes 230 V 50 Hz lamp and 120 V 60 Hz lamp models.
The inrush current begins when the Arms half cycle rises above the inrush threshold, and ends when the Arms half cycle
rms is equal to or below the inrush threshold minus a user-selected hysteresis value. The measurement is the square root of
the mean of the squared Arms half cycle values measured during the inrush duration. Each half-cycle interval is contiguous
and non-overlapping as recommended by IEC 61000-4-30. Markers indicate inrush duration. Cursors allow measurement of
peak Arms half cycle.
Measurements are based on: either the corresponding 10/12-cycle rms value interharmonic bin or the rms of the four nearest
10/12-cycle rms value interharmonic bins per IEC 61000-4-30. Limit setup for Monitor mode follows EN50160 standard limits.
Optional GPS430-II timesync module provides time uncertainty ≤ 20 ms or ≤ 16.7 ms for time tagging of events and time
aggregated measurements. When synchronization is not available, time tolerance is ≤ 1-s/24h
8 Fluke Corporation Fluke 430 Series II Three-Phase Power Quality and Energy Analyzers
Page 9

Wiring configurations
1Ø + NEUTRAL Single phase with neutral
1Ø SPLIT PHASE Split phase
1Ø IT NO NEUTRAL Single phase system with two phase voltages without neutral
3Ø WYE Three phase four wire system WYE
3Ø DELTA Three phase three wire system Delta
3Ø IT Three phase system without neutral WYE
3Ø HIGH LEG Four wire three phase Delta system with center tapped high leg
3Ø OPEN LEG Open delta three wire system with 2 transformer windings
2-ELEMENT Three phase three wire system without current sensor on phase L2/B (2 watt meter method)
2½-ELEMENT Three phase four wire system without voltage sensor on phase L2/B
INVERTER EFFICIENCY dc voltage and current input with ac output power (automatically displayed and selected in Inverter Efficiency mode)
General specifications
Case
Display
Memory
Real-time clock Time and date stamp for Trend mode, Transient display, System Monitor and event capture
Design Rugged, shock proof with integrated protective holster
Drip and dust proof IP51 according to IEC60529 when used in tilt stand position
Shock and vibration Shock 30 g, vibration: 3 g sinusoid, random 0.03 g2/Hz according to MIL-PRF-28800F Class 2
Brightness: 200 cd/m2 typ. using power adapter, 90 cd/m2 typical using battery power
Size: 127 mm x 88 mm (153 mm/6.0 in diagonal) LCD
Resolution: 320 x 240 pixels
Contrast and brightness: user-adjustable, temperature compensated
8GB SD card (SDHC compliant, FAT32 formatted) standard, upto 32GB optionally
Screen save and multiple data memories for storing data including recordings (dependent on memory size)
Environmental
Operating temperature 0 °C ~ +40 °C; +40 °C ~ +50 °C excl. battery
Storage temperature -20 °C ~ +60 °C
+10 °C ~ +30 °C: 95 % RH non-condensing
Humidity
+30 °C ~ +40 °C: 75 % RH non-condensing
+40 °C ~ +50 °C: 45 % RH non-condensing
Up to 2,000 m (6666 ft) for CAT IV 600 V, CAT III 1000 V
Maximum operating altitude
Up to 3,000 m (10,000 ft) for CAT III 600 V, CAT II 1000 V
Maximum storage altitude 12 km (40,000 ft)
Electro-Magnetic-Compatibility
(EMC)
Interfaces
EN 61326 (2005-12) for emission and immunity
mini-USB-B, Isolated USB port for PC connectivity
SD card slot accessible behind instrument battery
Warranty Three years (parts and labor) on main instrument, one year on accessories
Included accessories
Power options
Leads TL430 Test lead and Alligator clip set
Color coding WC100 color coding clips and regional decals
Flexible current probes i430flex-TF, 24 inch (61cm) length, 4 clamps
Memory, Software and
PC connection
Carrying case
* ± 5 % if ≥ 1% of nominal voltage ± 0.05 % of nominal voltage if < 1 % of nominal voltage
** 50 Hz/60 Hz nominal frequency according to IEC 61000-4-30
*** 400 Hz measurements are not supported for Flicker, Mains Signaling and Monitor Mode.
**** for nominal voltage 50 V to 500 V
***** Standard 8GB SD card included with /INTL instrument versions.
BC430 Power Adapter
International plug adapter set
BP290 (Single capacity Li-ion battery) 28Wh (Up to 8 hours)
8GB WiFi SD card*****
PowerLog on CD (includes operator manuals in PDF format)
USB cable A-Bmini
C1740 Soft Case for 434-II and 435-II
C437 Hard Case with rollers for 437-II
9 Fluke Corporation Fluke 430 Series II Three-Phase Power Quality and Energy Analyzers
Page 10

Flexible Current Probe i430 Flexi-TF specification
General specifications
Probe and cable material Alcryn 2070NC, reinforced insulation, UL94 V0, Color: Red
Couplings material Lati Latamid 6H-V0 Nylon
Probe cable length 610 mm (24 in)
Probe cable diameter 12.4 mm (0.49 in)
Probe cable bend radius 38.1 mm (1.5 in)
Output cable length 2.5 meters RG58
Output connector Safety BNC connector
Operating range -20 °C to +90 °C
Storage temperature -40 °C to +105°C
Operating humidity 15 % to 85 % (non condensing)
Degree of protection (Probe) IP41
Specifications
Current range 6000 A AC RMS
Voltage output (@1000 ARMS,
50 Hz)
Accuracy ± 1 % of reading(@ 25 °C, 50 Hz)
Linearity (10 % to 100 % of
range)
Noise (10 Hz – 7 kHz) 1.0 mV ACRMS
Output impedance 82 Ω min
Load impedance 50 MΩ
Internal Resistance per 100
mm probe length
Bandwidth (-3dB) 10 Hz to 7 kHz
Phase error (45 Hz – 65 Hz) ± 1°
Position sensitivity ± 2 % of reading max.
Temperature coefficient ± 0.08 % max of reading per °C
Working voltage
(see safety standards section)
86.6 mV
± 0.2 % of reading
10.5 Ω ± 5 %
1000 V AC RMS or DC (head)
30 V max. (output)
Now available: Fluke 438-II Power Quality and Motor Analyzer
Quickly and easily discover electrical and mechanical
performance of electric motors, and evaluate power quality
with a single test tool
The new Fluke 438-II Power Quality and Motor Analyzer adds key
mechanical measurement capabilities for electric motors to the advanced
power quality analysis functions of the Fluke 430 series II Power
Quality Analyzers. Quickly and easily measure and analyze key
electrical and mechanical performance parameters such as power,
harmonics, unbalance, motor speed, torque and mechanical power
without the need of mechanical sensors.
Contact your local Fluke representative, or visit our website for
more details.
10 Fluke Corporation Fluke 430 Series II Three-Phase Power Quality and Energy Analyzers
Page 11

Ordering information
Fluke-434-II Three-Phase Energy Analyzer
Fluke-435-II Three-Phase Power Quality and
Energy Analyzer
Fluke-437-II 400 Hz Three-Phase Power
Quality and Energy Analyzer
FLUKE-434-II/INTL Power Quality and Energy
Analyzer international*
FLUKE-435-II/INTL Power Quality and Energy
Analyzer international*
FLUKE-437-II/INTL 400 Hz Power Quality
andEnergy Analyzer international*
FLUKE-438-II Power Quality and Motor
Analyzer
* /INTL include standard 8GB SD card, other versions include Fluke FC-SD,
wireless SD card.
Optional/replacement accessories
Fluke-430-II/M Motor Analyzer Upgrade Kit
Fluke FC-SD Fluke Connect Wireless SD Card
I430-FLEXI-TF-II-4PK 6000 A Fluke 430 Thin
Flexi 61 cm (24 in) 4 pack
C437-II Hard Case 430 Series II with roller
C174 0 Softcase for 174X and 43X-II PQ
Analyzer
i5sPQ3 i5sPQ3, 5 A ac Current Clamps, 3-pack
i400s i400s AC Current Clamp
WC10 0 WC100 Color Localization Set
GPS430-II GPS430 Time Synchronization
Module
BP291 Double capacity Li-ion battery
(up to 16 hr)
HH290 Hanging hook for use on cabinet doors
Preventive maintenance simplified. Rework eliminated.
Save time and improve the reliability of your maintenance data by
wirelessly syncing measurements using the Fluke Connect® system.
• Eliminate data-entry errors by saving measurements directly from the
tool and associating them with the work order, report or asset record.
• Maximize uptime and make confident maintenance decisions with data
you can trust and trace.
• Access baseline, historical and current measurements by asset.
• Move away from clipboards, notebooks and multiple spreadsheets with
a wireless one-step measurement transfer.
• Share your measurement data using ShareLiveTM video calls and emails.
• 430 Series-ll is part of a growing system of connected test tools and
equipment maintenance software. Visit the website to learn more
about the Fluke Connect® system.
Find out more at flukeconnect.com
All t rademarks a re the proper ty of t heir r espe ctive owners. WiFi or c ellu lar s erv ice re quired to share
data. Smar tphone, wireless service a nd data plan not included with purchase. Fi rst 5 GB of storage is
free. P hone support detai ls ca n be viewed at fluke.com/phones.
Smart phone wireless service and data plan not included with purchase. Fluke Connect
is not available in all countries.
11 Fluke Corporation Fluke 430 Series II Three-Phase Power Quality and Energy Analyzers
Fluke. Keeping your world
up and running.
Fluke Corporation
PO Box 9090, Everett, WA 98206 U.S.A.
Fluke Europe B.V.
PO Box 1186, 5602 BD
Eindhoven, The Netherlands
For more information call:
In the U.S.A. (800) 443-5853 or
Fax (425) 446-5116
In Europe/M-East/Africa +31 (0) 40 2675 200 or
Fax +31 (0) 40 2675 222
In Canada (800)-36-FLUKE or
Fax (905) 890-6866
From other countries +1 (425) 446-5500 or
Fax +1 (425) 446-5116
Web access: http://www.fluke.com
©2016 Fluke Corporation.
Specifications subject to change without notice.
Printed in U.S.A. 3/2016 2643006f-en
Modification of this document is not permitted
without written permission from Fluke Corporation.
®
 Loading...