

Page 1
Power quality recording
and analysis: Techniques
and applications
Application Note
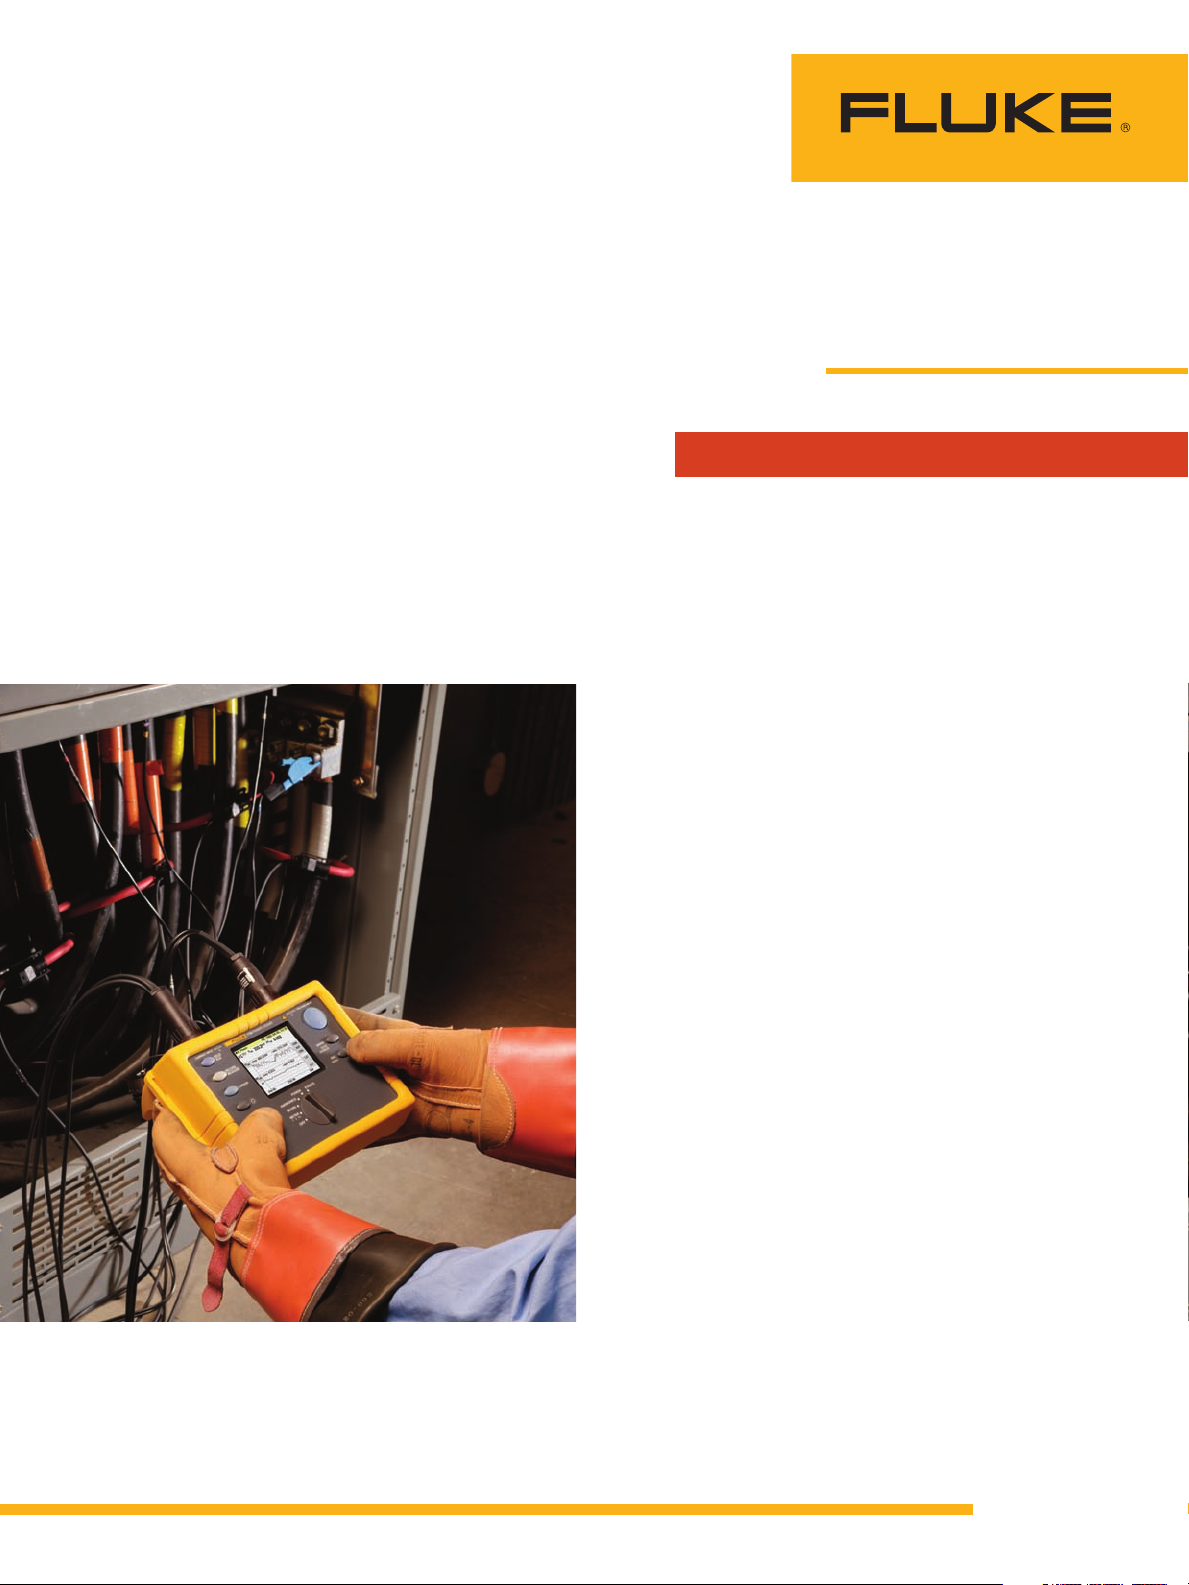
Hooking up a power quality recorder and taking
days’ worth of data can give you a rich picture
of your power. In this article we’ll talk about the
various recording techniques available in power
loggers and recorders—understanding the tools
and techniques you have available will be key to
your strategy. What should you be looking for?
And when does recording make sense?
Recording techniques
To really know your power, ideally,
you’d want to look at every line
cycle to see even the smallest
changes. However, since our power
swings through more than four
million cycles per day, it’s impractical to look at tiny changes—and
often unnecessary. Few loads even
notice occasional voltage dips of
one or two cycles.
How long you record depends
somewhat on the rhythm of your
building. If you are working on a
typical commercial or light industrial building, then a week is long
enough for a building to go through
its normal cycle. If you are working in a plant that runs special
equipment only periodically (say
a furnace that runs only monthly),
you’ll need to be sensitive to the
timing of these loads.
Different recording techniques
have been developed to look at
small changes over relatively long
time periods. Many instruments
combine several techniques to
improve their coverage. We’ll
describe the common techniques
and some of their pros and cons.
By understanding the different
techniques. you’ll be better able to
choose an appropriate tool for the
job at hand.
Setting up a Fluke 1735 Power Logger at the service entrance for a
30-day load study.
F r o m t h e F l u k e D i g i t a l L i b r a r y @ w w w . f l u k e . c o m / l i b r a r y
Page 2
Techniques for tracking
3
2
4
10 min.
10 min.
20 min.
20 min.
30 min.
30 min.
40 min.
40 min.
3
2
4
X
X
X
X
Actual variation over time
Plot using fixed 10 minute interval, extremes are lost
trends
Trending tracks power quality
parameters over hours or days.
Power loggers measure parameters like voltage, current, or
power and log them over time.
Trend recording is good for
tracking normal power, subtle
changes, and exceptional conditions but may have a limited
ability to catch fast events.
However, instrument makers
have come up with some creative
ways of showing faster events
while allowing recording lengths
of weeks or even months.
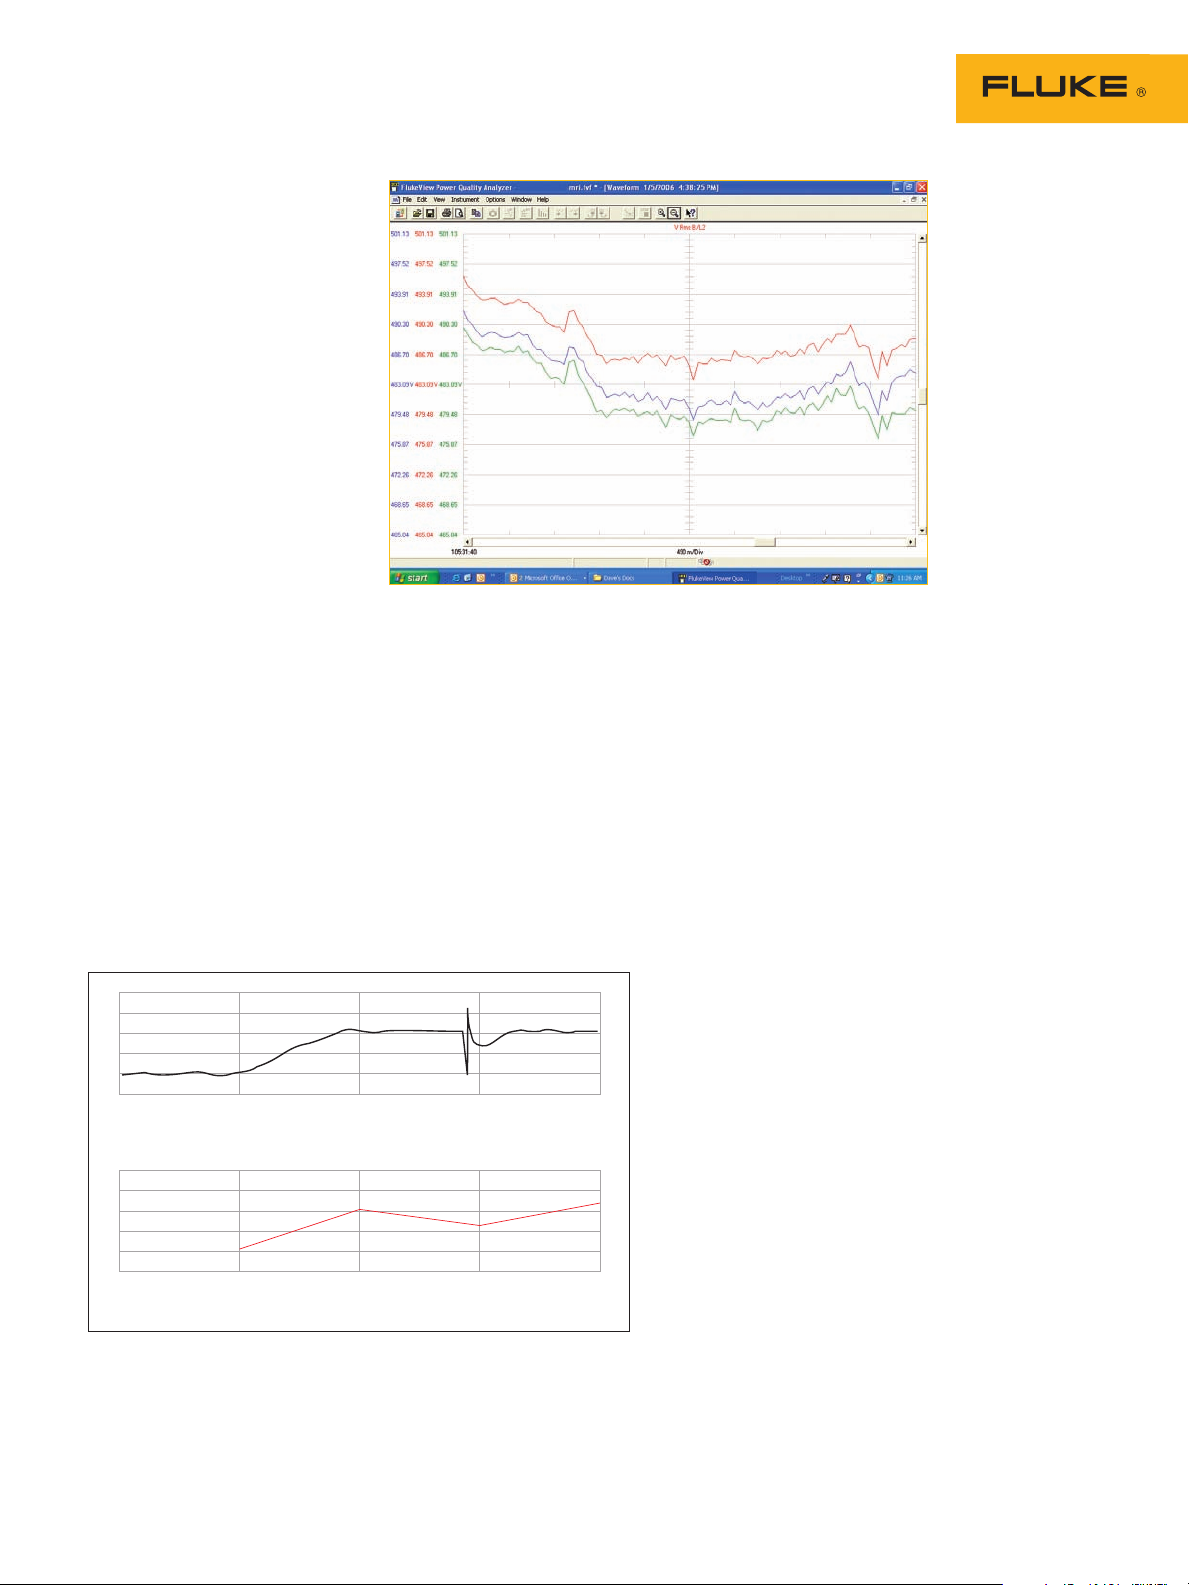
Fixed interval logging
This is the simplest form of
digital recording. To set it up, you
choose a time period, or interval,
between readings—usually in
seconds or minutes. The instrument calculates an average of the
rms values during each interval
and stores it in memory. This
technique is useful for tracking
changes longer than the logging
interval. Unfortunately, a very
short measurement interval will
catch fast events, but will also
use memory quickly. So even
though fixed interval logging is
easy to set up, it can’t capture
fast events over hours or days.
Figure 2. Min/Max/Avg trendplot.
Min/Max/Avg logging
This technique is similar to fixed
interval logging since it uses
a preset interval. But instead
of taking just one reading per
interval, the instrument takes
many high-speed measurements
over each interval. Processors
within the instrument crunch
through the measurements and
log three numbers for each
interval: a minimum, a maximum
and an average. The min and
max indicate the worst-case,
short-duration events, in some
instruments as short as a single
power cycle. The average tracks
the overall trend. Graphs from
these instruments will often plot
min, average and max on the
same graph.
Automatic time compression,
TrendPlot
TrendPlot is a logging technique
in some Fluke instruments. It is
a form of min/max/avg recording
in which the timescale automatically compresses whenever
the trend approaches the end
of memory. When the recorder
starts to run out of memory,
signal processors quickly go to
work. They combine adjacent
intervals into a new min, max,
and average. You still get to
see the worst-case measurements and the overall trend. And
because you choose when to stop
the measurement, you automatically get the best time resolution
with the available memory.
Figure 1. Fixed interval voltage trend.
2 Fluke Corporation Power quality recording and analysis: techniques and applications
Page 3

Event recording
#APTURED
7AVEFORM
4OLERANCE
%NVELOPE
6OLTAGE
7AVEFORM
Dips, swells, interruptions, and
transients are all voltage events.
Power quality events are characterized by the time and date
they occur, severity, and duration. User-defined thresholds or
triggers determine what qualifies
as an event. Event recording is
great for ensuring your voltage
stays within tolerances, say ± 10
%. Data is usually presented as
a list, making it easy to see all
of the extraordinary conditions
on the power system. Whether
or not an event causes problems
depends on both severity and
duration. For example, a 20 % dip
that lasts for 5 seconds is more
likely to cause problems than
a 20 % dip that lasts for 1 line
cycle. So event data is sometimes
compared to standard tolerance
curves, like the CBEMA curve,
that give limits for severity and
duration. The need to specify
multiple limits can make event
recording tricky to set up. If you
set the tolerances too tightly,
you’ll capture lots of events and if
you set the tolerance too loosely,
you may not see anything at all.
Transient waveform
capture
This technique records the
actual sine wave of the voltage
or current, allowing you to see
any event shorter than one line
cycle. The capture is initiated by
a trigger and uses a high speed
digitizer. Various triggers can
start the capture but most instruments use an “envelope trigger”.
Figure 3. This event table lists multiple small dips captured within seconds of each other.
An envelope trigger finds
deviations from a clean sine
wave. It builds an envelope
around the sinusoidal voltage
waveform, based on a userspecified tolerance. If the waveform goes outside the envelope
then the instrument captures and
These instruments can determine
event thresholds automatically and
adjust the threshold on the fly. This
eliminates the difficulty in setting
event thresholds. Full disclosure
recording is very useful for performing comprehensive studies over days,
weeks or even months.
stores. Some instruments, like the
Fluke 430 Series, can also take a
snapshot of the waveform based
on other criteria like rms events
or current increases.
Full disclosure recording
This technique combines min/
max/avg recording, transient,
and event capture all at the
same time. So you don’t have to
decide whether to look for dips or
transients—you can capture both.
Figure 4. Envelope trigger example.
3 Fluke Corporation Power quality recording and analysis: techniques and applications
Page 4

Recording applications
Power quality is recorded in
several general situations. This
section describes the most
common applications.
Troubleshooting with
long-term analysis
Troubleshooting intermittent
failures is challenging. When a
piece of equipment fails or resets
itself mysteriously, it’s tempting
to just swap gear out or reset a
circuit breaker and hope for the
best. For equipment with a high
cost of downtime, the risk of a
repeat failure is too great to rely
on a quick fix. Monitoring the
power after getting your equipment running again will reduce
the number of repeat failures
and rule out power problems if a
failure does recur.
The first decision you’ll have
to make is where to connect
the monitor or analyzer. In
general you should start with the
recorder close to the “victim load”
(the equipment that’s having
problems). This way the monitor
will “see” what the load “sees”. If
you have multiple tools available
it can help to record at different
points in the power system.
Before recording, start by
taking some spot measurements
to answer some basic questions.
Is the voltage level right? Is the
voltage waveform a clean sine
wave or is it noisy or distorted?
If the victim is a 3-phase load,
are the phases balanced? Is the
current being drawn by the load
too high?
The next question is: what
should I record? Unless you are
lucky enough to have a sophisticated power analyzer, you’re
probably going to have to decide
whether to start by tracking
trends or hunting for transients.
Trends will uncover more problems so try trend recording first
(use fixed interval logging or min/
max/avg). Recording rms voltage
trends on all relevant phases is
the most basic approach. This
will determine if the supply is
subject to voltage dips or outages
which can cause load dropouts
or resets. Recording voltage will
also uncover swells or unbalance
which can cause overheating.
Current trends can also help
in troubleshooting. Excessive
current draw will cause overheating. If the voltage is stable,
clean and balanced, high current
indicates a problem with the load
itself. By comparing the voltage
and current recordings you can
tell whether the voltage drop is
being caused by high current
being drawn by the victim load
or is being caused by some other
load upstream.
Voltage distortion can also
cause overheating and should
be recorded if possible. The
most basic way to track voltage
distortion is by recording total
harmonic distortion (THD). Some
analyzers can also track individual harmonics which can help
point to the source of high THD.
If the victim load shows
evidence of arcing or blown
input circuitry transients may
be to blame, but don’t jump to
this conclusion too quickly. After
you’ve performed some trending, or if the evidence strongly
suggests transient damage, then
it’s time to try transient capture
and look at waveforms.
Checking data during recording with the wireless PDA feature of the
FLuke 1750 Power Recorder.
4 Fluke Corporation Power quality recording and analysis: techniques and applications
Page 5

Tools from Fluke
Fluke offers a number of power
recording tools for almost any
application. In some cases a
combination of tools is best. For
example, you could use the Fluke
434 for quick troubleshooting
and short term monitoring or for
longer term monitoring you might
select a Power Recorder.
Loggers Recorders
Fluke 434
Power
Quality
Analyzer
Applications
1-Phase / 3-Phase 3-Phase 3-Phase 1-Phase 3-Phase 3-Phase 3-Phase 3-Phase 3-Phase 3-Phase
Frontline troubleshooting
Predictive maintenance
Load study/PQ survey
Quality of service
compliance (EN50160)
Long-term analysis —
Recording capability
Typical recording period 1 week 1 month 1 month 1 month 3 months 3 months 3 months 1 month 3 months
Memory 8 Mb 16 Mb 32 kB 4 MB 4 MB 4 MB 8 MB 2 GB 1 GB
Min/Max/Avg logging
Event capture
Waveform capture
User defined logging —
Full-disclosure — — — — — — —
Powered off of measured
signals
Sample rate
High-speed capture rate 200 kHz 200 kHz
Peak voltage 6 kV 6 kV 2.5 kV
Features
Display Color
Voltage channels
Current channels 4 4 — 4 4 4 4 5 4 (0)
Included current probes 40 A/400 A
Dust/water resistance IP51 IP51 — IP 65 (not
Safety rating 600 V CAT IV 600 V CAT IV 300 V CAT III 600 V CAT III 600 V CAT III 600 V CAT III 600 V CAT III 600 V CAT IV 600 V CAT III
Software Fluke View Fluke Power
Battery Operation /UPS 7 hours 7 hours — 24 hours — — 5 hours 5 min UPS 40 min
Analysis capability
Statistical analysis
(including EN50160)
Report generator —
Root causeanalysis — — — —
Accuracy
IEC 61000-4-30 Class A
compliant
Volts rms 0.5 % Vnom 0.1 % Vnom ± 2 V
Amps rms 1 % +-5
• •
• •
• •
• •
• • • • • • • • •
• • • • • • • • •
• •
— — — —
10 kHz 10 kHz
Graphical
4 4 1 4 4 4 4 4
Clamps
• •
—
counts
Fluke 435
Logging
Power
Quality
Analyzer
Fluke VR101
Voltage
Event
Recorder
— — — — — — —
— — — — — — —
—
— —
Fluke 1735
Power
Logger
Fluke 1743
Power
Quality
Logger
Fluke 1744
Power
Quality
Logger
Fluke 1745
Power
Quality
Logger
Fluke 1750
Power
Recorder
• • • • • •
• • • • •
• • • • • • • •
— — — — —
•
— —
• • •
• •
—
•
— —
12.8 kHz and
15.36 kHz
5 MHz 0.5 or 10 MHz
6 kV 6 kV
PDA and
LEDs
400 A
Clamps
Analyze
—
• •
0.1 % Vnom 0.1 % Vnom
1 % with
flex CT
Color
Graphical
3000 A
Flexis
Log
•
•
0.5 % +-5
counts
• • •
1/2 cycle
integrated
10.24 kHz 10.24 kHz 10.24 kHz 10.24 kHz
• • • • •
• • • •
LED
— 15 A /150 A/
Fluke Event
View
—
—
Color
Graphical
3000 A Flexis
including
battery
housing)
Fluke Power
Log
LEDs LEDs
15 A/150 A
/1500 A/
3000 A Flexis
IP65 IP65 IP50 IP50 IP50
Fluke PQ Log Fluke PQ Log Fluke PQ Log Fluke Power
15 A/150 A
/1500 A/
3000A Flexis
• • • • • •
• • • • • •
• • •
— — — — —
0 to 200 V
± 4 V
0 to 270 V
—
± (0.5 % +
10 counts)
± (1 % + 10
counts)
0.1 % of
range
2 % of range
with flex CT
0.1 % of
range
2 % of range
with flex CT
LCD and
LEDs
15 A/150 A
/1500A/
3000A Flexis
0.1 % of
range
2 % of range
with flex CT
Fluke 1760
Power
Quality
Recorder
•
—
10.24 kHz
LEDs
4 (8 without
current)
200 A/
1000 A
Flexis
Fluke PQ
Analyze
•
1 % with
flex CT
5 Fluke Corporation Power quality recording and analysis: techniques and applications
Page 6

Quality of service
In some cases, utilities agree to
provide power that complies with
predetermined specifications. The
specifications may be laid out in
contracts or may take the form
of regulations, like EN50160. In
these agreements, details of the
recording techniques, tolerances
and recording duration may be
spelled out. Standard EN50160,
for example, specifies tolerances
for a 1-week recording and references standard IEC 61000-4-30
for measurement and recording
Load studies, power
quality studies, and
commissioning
These types of recordings are
generally done to assess the
power prior to installation or
operation of equipment.
A load study is performed to
determine the existing loads on
a system, prior to adding more
loads. This may be required by
local authorities and local norms
or standards dictate the required
measurements, intervals and
durations. For example, the US
techniques. If you believe that
the power your utility is providing does not meet the agreed
upon specifications, test it.
Before you push the RECORD button
National Electrical Code specifies
current or power measurements
average over 15 minute intervals,
taken over 30 days. In addition to
satisfying the authorities, taking
recordings prior to significant
system modifications can help in
debugging the system later.
Power quality studies and
commissioning studies try to
answer the questions: “Is this
system healthy?” The strategy
in these applications is to cast a
wide net and record as much as
possible. Ideally we would record
voltage, current and power
trends, transients, and event logs.
Don’t jump right into record-
•
ing. Gather as much information as you can with spot
measurements of voltage level,
voltage waveform/distortion,
current, unbalance. These may
point you to the problem or
give you some insight as to
where to go next.
Check your connections. If
•
the instrument has a phasor
or scope display, use it to
verify that the connections are
correct.
To twist the old saying: set
•
twice, measure once. If you
are trending, double check
your recording interval. If you
are using event or transient
capture, recheck your limits.
6 Fluke Corporation Power quality recording and analysis: techniques and applications
Consider doing a short run of
•
an hour or so, before leaving
a monitor for a longer period.
This will help you work any
bugs out of your setup, and
you may get lucky and find
what you’re looking for!
Fluke. Keeping your world
up and running.
Fluke Corporation
PO Box 9090, Everett, WA USA 98206
Fluke Europe B.V.
PO Box 1186, 5602 BD
Eindhoven, The Netherlands
For more information call:
In the U.S.A. (800) 443-5853 or
Fax (425) 446-5116
In Europe/M-East/Africa +31 (0) 40 2675 200 or
Fax +31 (0) 40 2675 222
In Canada (800) 36-FLUKE or
Fax (905) 890-6866
From other countries +1 (425) 446-5500 or
Fax +1 (425) 446-5116
Web access: http://www.fluke.com
©2006 Fluke Corporation. All rights reserved.
Printed in U.S.A. 4/2006 2646555 A-EN-N Rev A
 Loading...