

Page 1

99 Washington Street
Melrose, MA 02176
Fax 781-665-0780
TestEquipmentDepot.com
®
1744/1743
Power Quality Logger
PN 2560353
April 2006 Rev.1, 6/06
© 2006 Fluke Corporation, All rights reserved. Printed in USA
All product names are trademarks of their respective companies.
Users Manual
Page 2

Table of Contents
Title Page
Introduction .......................................................................................... 1
Information and PC Software CD..................................................... 1
Logger Power Supply ....................................................................... 2
Power Interruptions........................................................................... 2
Introduction to the Logging Functions.................................................. 2
Symbols ............................................................................................ 4
Safety Instructions ................................................................................ 4
Qualified Personnel........................................................................... 6
Standard Equipment and Optional Accessories ................................ 6
Features............................................................................................. 8
Power Network Configurations ........................................................ 10
Working with Logged Data............................................................... 10
Using the Logger .................................................................................. 11
Logging Jobs..................................................................................... 11
Preparing the Logger for Use............................................................ 12
Test Leads – Markings.................................................................. 14
Connecting Current Probes ........................................................... 14
Logging with Voltage Converters................................................. 15
Connecting the Logger...................................................................... 15
Connections in 3-Phase 4-Wire (Wye) Systems ........................... 18
Connections in 3-Phase 3-Wire (Delta) Systems .......................... 19
Connections for Single-Phase Logging......................................... 20
Connections for Medium-Voltage Networks ................................ 21
Phase-Phase Delta Logging .......................................................... 22
Phase-Ground, Wye-Logging ....................................................... 23
Logging with Two Voltage Converters and
Two Current Transformers............................................................ 24
Logging............................................................................................. 25
Completing the Logging Job......................................................... 26
Evaluating the Logged Data.............................................................. 27
Methods of Logging.............................................................................. 27
Measuring Ranges............................................................................. 27
Signal Sampling............................................................................ 28
Resolution Accuracy......................................................................... 28
Voltage Variations ............................................................................ 29
i
Page 3

1744/1743
Users Manual
Voltage Harmonics........................................................................... 32
Current Harmonics ........................................................................... 33
Power ............................................................................................... 37
Logger Parameters with Function P ..................................................... 38
Logger Parameters with Function A..................................................... 41
Maintenance ......................................................................................... 45
Lithium Battery ................................................................................ 45
Disposal............................................................................................ 45
Technical Specifications....................................................................... 46
Logging Parameters – Overview ...................................................... 46
General Specifications...................................................................... 52
Logging Function P.......................................................................... 54
Logging Function A – “All” parameters........................................... 55
PQ Log PC Application Software ........................................................ 57
Min/Max Values........................................................................... 30
Voltage Interruptions.................................................................... 31
Voltage Dips and Swells .............................................................. 32
Mains Signaling............................................................................ 33
THDV – In Function A................................................................. 34
Calculation of THD in Measuring Function P.............................. 35
Flicker .......................................................................................... 35
Unbalance..................................................................................... 36
Frequency..................................................................................... 36
Current Logging ........................................................................... 37
Logging Function A ..................................................................... 37
Crest Factor (CF).......................................................................... 37
Maximum Number of Intervals for Logging Function P.............. 47
General Information ..................................................................... 47
Environmental Specifications....................................................... 48
EMC ............................................................................................. 48
Power Supply ............................................................................... 49
Measurement ................................................................................ 49
Input Voltage................................................................................ 50
Current Input with Flexi Set......................................................... 50
Current Input for Clamp ............................................................... 51
RMS Logging Slow Voltage Variations....................................... 52
Current Logging Values ............................................................... 52
Events Dips, Swells, Interruptions................................................ 52
Flicker .......................................................................................... 52
Power (Logging Functions A, P only) P, S, |P|............................. 53
Harmonics .................................................................................... 53
Statistics ....................................................................................... 53
Logging Values ............................................................................ 54
Application................................................................................... 54
Logging Values ............................................................................ 55
Applications ................................................................................. 56
Online Test ................................................................................... 58
ASCII Export................................................................................ 59
ii
Test Equipment Depot - 800.517.8431 - 99 Washington Street Melrose, MA 02176
FAX 781.665.0780 - TestEquipmentDepot.com
Page 4

Contents
Timeplot diagram.......................................................................... 60
UNIPEDE DISDIP Table.............................................................. 61
Cumulative Frequency – Harmonics............................................. 62
Index
(continued)
iii
Page 5

1744/1743
Users Manual
iv
Page 6

List of Tables
Table Title Page
1. Symbols.............................................................................................. 4
2. Standard Equipment........................................................................... 7
3. Optional Accessories.......................................................................... 7
4. 1744/1743 Power Quality Logger -
Controls and Indicators ...................................................................... 9
5 Test Lead Markings............................................................................ 14
6. Measuring Ranges.............................................................................. 27
7. Logging Parameters - Overview......................................................... 46
v
Page 7

1744/1743
Users Manual
vi
Page 8

List of Figures
Figure Title Page
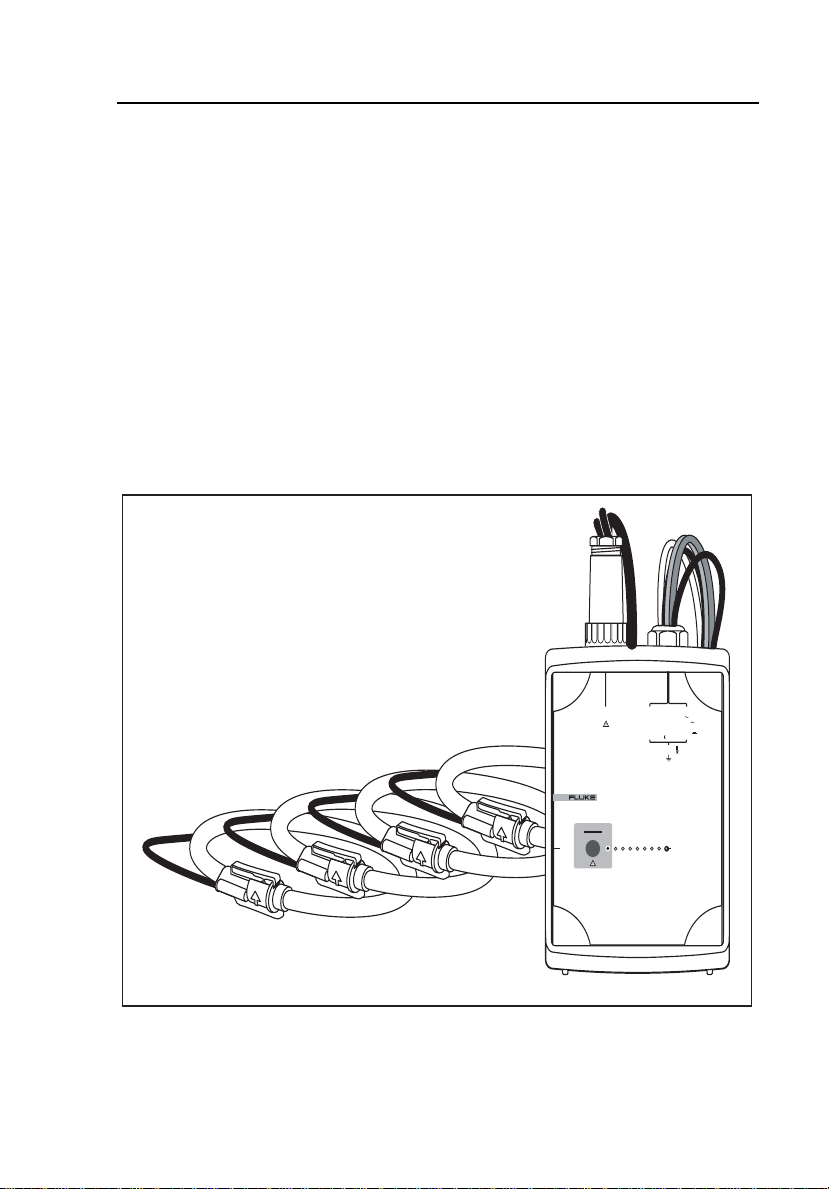
1. 1743 and 1744 Power Quality Loggers.............................................. 3
2. 1744/1743 Power Quality Logger - Front View................................. 8
3. Supplying Operating Power to the Logger......................................... 13
4. Logging in a 3-Phase 4-Wire (Wye) System...................................... 18
5. Logging in a 3-Phase 3-Wire (Delta) System..................................... 19
6. Single Phase Logging......................................................................... 20
7. Measuring 3-Phase Voltages in a 3-Wire (Delta)
System with Three Voltage Converters.............................................. 21
8. PQ Log Settings for a 16 kV Network ............................................... 22
9. PQ Log Settings for a 16 kV Network ............................................... 23
10. Measuring 3-Phase Voltages in a 3-Wire System
with Potential Transformers (Aron Measuring Circuit)...................... 24
11. PQ Log Settings for a 16 kV Network ............................................... 25
12. Selecting Voltage Input Ranges During Job Processing..................... 28
13. Measuring Voltage Variations............................................................ 29
14. Logging Min and Max Values............................................................ 30
15. Voltage Interruption........................................................................... 31
16. Voltage Dips and Swells .................................................................... 32
17. Measuring Flicker Values .................................................................. 36
18. Online Test ......................................................................................... 58
19. ASCII Export ..................................................................................... 59
20. Timeplot Diagram .............................................................................. 60
21. UNIPEDE DISDIP Table................................................................... 61
22. Cumulative Frequency – For Voltage and
Current Harmonics............................................................................. 62
vii
Page 9

1744/1743
Users Manual
viii
Page 10

1744/1743
Power Quality Logger
Introduction
The Fluke 1744 and 1743 Power Quality Loggers are sophisticated, robust,
easy-to-use electrical power-recording devices for the electrician or powerquality specialist.
Note
This manual also refers to the 1744 or 1743 Power Quality Logger
simply as “the Logger.”
You’ll prepare the Logger for use with the included PQ Log software CD. You
can then connect the Logger to an electrical power-distribution network to log
a variety of power parameters, recorded as sequential averaged values over an
averaging period you can define. The Logger can measure up to three voltages
and four currents simultaneously.
The Logger enables you to conduct a load study over a specified period, or
monitor power quality to discover and report disturbances in low- and
medium-voltage networks.
The Logger has a light, compact design. Its case is sealed to IP 65
specifications, so it can be used outdoors in any weather.
Information and PC Software CD
The CD included with the Logger contains the PQ Log application software for
Windows
Upgrade Utility for installing firmware upgrades.
The PQ Log software prepares the Logger for use, and downloads data from
the Logger to a connected PC. You can then view the logged data in graphical
and tabular form, export it to a spreadsheet, or create reports for printing. For
details and instructions, see the PQ Log Users Manual on the CD.
®
, along with users manuals in multiple languages, and the 1735
1
Page 11

1744/1743
Users Manual
Logger Power Supply
The Logger does not include a power switch, but turns on automatically
whenever its power supply leads are connected to a voltage in its allowed
range. You can plug the Logger’s power supply leads into a standard wall
outlet (using the included adapter cord), or you can connect them directly to
the power network under test (in parallel with the test leads) if there is no
convenient wall outlet.
Power Interruptions
The Logger can sustain operation through power interruptions of up to
three seconds, long enough for most common interruptions. In longer
interruptions, the Logger shuts down, then resumes logging when power
returns.
Introduction to the Logging Functions
The Logger monitors power quality and locates disturbances in low and
medium voltage distribution networks. It measures up to three voltages and
four currents. Logged values are saved in your choice of sequential averaging
periods. You graphically or numerically evaluated measured values with PQ
Log.
The Model 1744 has two types of logging functions: logging function A
(Advanced) and logging function P (Power). Function A is the full set of
parameters, and function P provides logging capability optimized for load
studies and basic power logging. Function P contains every parameter in
Function A except voltage and current harmonics and interharmonics. Model
1743 provides only logging function P.
Measured values are saved as averaged values over user-selected averaging
periods. You can evaluate measured values graphically or in tabular form with
PQ Log software.
Logging function parameters:
• RMS Voltage of each phase (average, min, max)
• RMS Current of each phase and neutral (average, min, max)
• Voltage events (dips, swells, interruptions)
• Power (kW, kVA, kVAR, Power PF, Power tangent)
2
Page 12
Power Quality Logger
Introduction to the Logging Functions
• Energy, total energy
• Flicker (Pst, Plt)
• Voltage THD
• Current THD
• Current CF
• Voltage harmonics to the 50
th
(not in P function)
• Voltage interharmonics (not in P function)
• Mains signaling voltage
• Unbalance
• Frequency
CURRENT INPUT
MEASUREMENT INPUT
I
I3I2I1V3V2V
N
SUPPLY INPUT
660V MAX
L1/A
L2/B
88-660V
45-65 Hz
L3/C
N
100-350V
830V
RMS
MAX CAT
5VA
600VCAT
300V CAT
1
POWER
egb002.eps
10V
RMS
MAX
POWER LOGGER
1743
START
STOP
232SR
Figure 1. Model 1744/1743 Power Quality Loggers
3
Page 13
1744/1743
Users Manual
Symbols
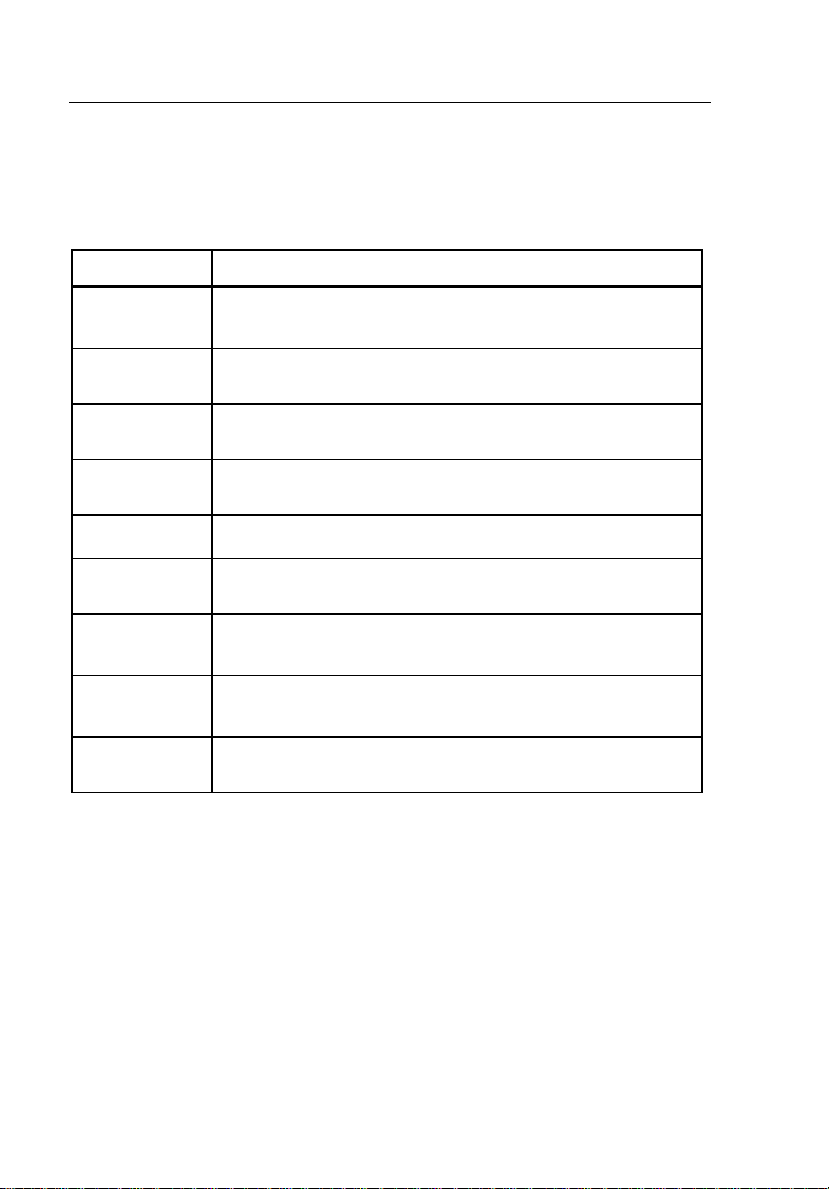
Table 1 lists the symbols used on the instrument and in this manual.
Table 1. Symbols
Symbol Description
W
X
J
T
F
P
)
~
;
Important information. See the manual.
Hazardous voltage.
Earth ground.
Double insulation.
Direct current (DC).
Conforms to European Union requirements.
Canadian Standards Association is the certified body used
for testing compliance to safety standards.
Do not dispose of this product as unsorted municipal waste.
Contact Fluke or a qualified recycler for disposal.
Conforms to relevant Australian Standards.
Safety Instructions
Please read this section carefully. It will make you familiar with the most
important safety instructions for using the Logger.
Warnings identify conditions and actions that pose safety hazards to the
user, and Cautions identify conditions and actions that can damage the
Logger.
4
Test Equipment Depot - 800.517.8431 - 99 Washington Street Melrose, MA 02176
FAX 781.665.0780 - TestEquipmentDepot.com
Page 14

Power Quality Logger
Safety Instructions
W X Warnings
• To avoid electrical shock, do not connect any part of
the Logger to systems that have higher voltages to
ground (earth) than are marked on the Logger.
• Areas between the power company meter and the
source of the distribution system are characterized as
CAT IV areas. To avoid electrical shock or equipment
damage, never connect the Logger to power in CAT IV
areas if the voltage-to-earth ground is greater than
300 V.
• To avoid damaging the Logger, never connect its
voltage measuring inputs to phase-to-phase voltages
higher than 830 V.
• To avoid damaging the Logger, never connect the
power supply leads to voltages higher than 660 V RMS
ac.
• The Logger is to be used and handled only by qualified
personnel (see page 6).
• Maintenance work on the Logger must be done only by
qualified service personnel.
• Use only the current probes specified in this manual. If
you use flexible current probes, wear suitable
protective gloves or work on de-energized conductors.
• Do not expose the Logger to moisture or humidity.
• To prevent electrical shock, always connect power
supply and voltage test leads to the Logger before
connecting to the load.
• All accessories must be approved for 600 V CAT III or
higher.
• Use the Logger only with its original standard
equipment or with approved optional accessories, as
listed in Table 2 and Table 3 in this manual.
5
Page 15

1744/1743
Users Manual
• Connect clip-on current transformers and/or Flexi Set
to insulated live conductors only.
• If measuring sensors are to be connected to non-
insulated live conductors, additional personal
protective measures must be taken as required by local
government agencies.
W Caution
To avoid damage, use the 1744/1743 Power Quality Logger,
only with the following nominal voltages:
• Single-/3-phase, 4-wire (Wye) systems (P-N): 69 V
to 480 V
• 3-phase 3-wire(Delta) systems (P-P): 120 V to 830 V
WX Warning
To avoid electrical shock, or damaging the Logger’s
internal protective circuitry or weatherproof seal, do not
open the Logger.
Qualified Personnel
The following qualifications are required for using the Logger safely:
• Trained and authorized to switch on/off, ground (earth), and mark
power distribution circuits and devices in accordance with electrical
engineering safety standards.
• Trained or instructed in safety engineering standards for maintaining
and using appropriate safety equipment.
• Trained in first aid.
Standard Equipment and Optional Accessories
Table 2 lists the standard equipment for the 1744/1743 Power Quality Logger,
and Table 3 lists optional accessories.
6
Page 16
Power Quality Logger
Safety Instructions
Table 2. Standard Equipment
Equipment Model/Part
Number
Power Quality Logger 1744/1743
International IEC Power Plug Adapter Set 2441372
RS232 Cable, Red, Null-Modem 2625531
Shielded 4-Phase Flexi Set (15 A/150 A/1500 A/3000 A) FS17XX
Dolphin Clip, Black (4x) 2540726
Color Coding Wire Clips WC17XX
Soft Case 1642656
English Users Manual 2560353
CD with Users Manual (English, German, French, Spanish,
Portuguese, Simplified Chinese, Italian), and PQ Log
software (same languages as the manual)
Power Cord 2561702
USB Adapter
2583487
Note
Power supply and voltage measuring leads are built into the
1744/1743 Power Quality Logger.
Table 3. Optional Accessories
Description Accessory
3-Phase Flexi Set MBX 3FLEX
3-Phase 1 A/10 A micro CT EPO405A
Pole Mounting Kit 1743/4 Pole Kit
Permlink Software for Modem Permlink
Magnetic Hanging Kit 1281997
7
Page 17
1744/1743
Users Manual
Inspect the contents of the shipping box for completeness and damage. Report
any damage to the shipper.
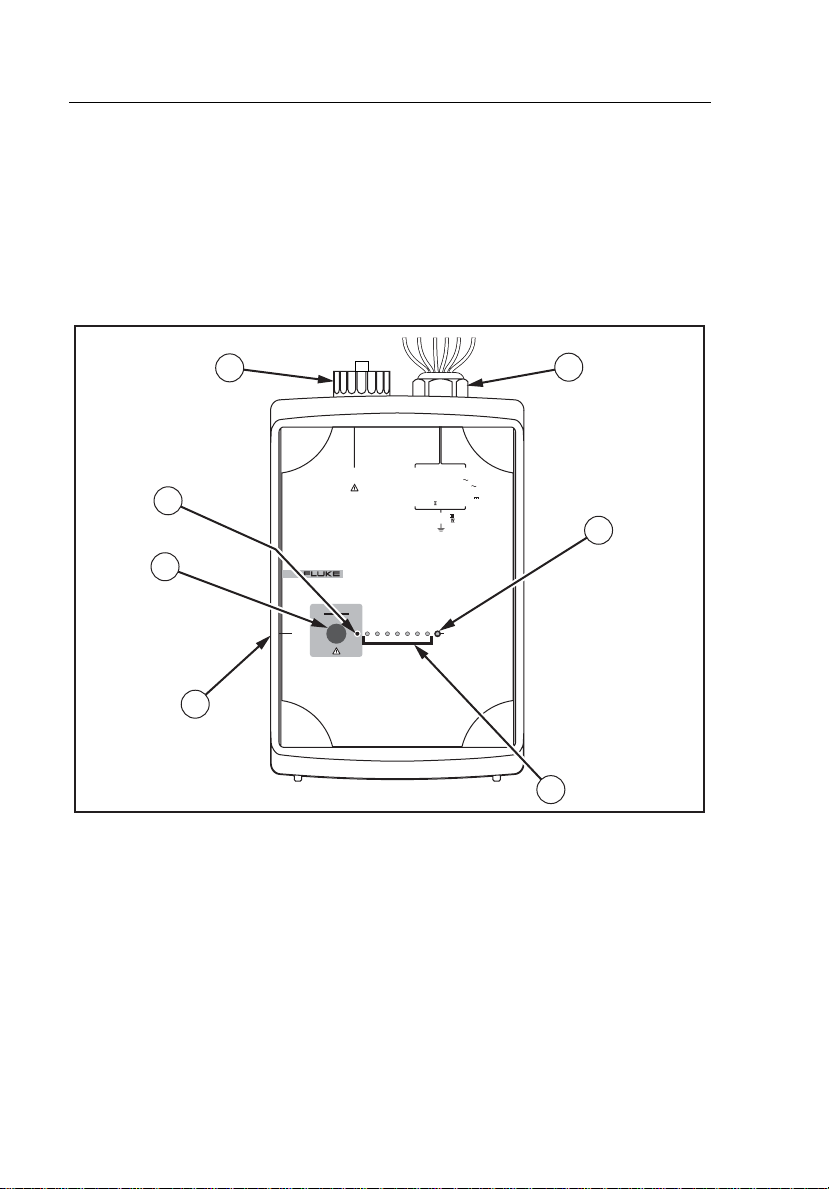
Features
This section introduces the Logger’s controls, indicators, and other features.
Refer to Figure 2 and Table 4.
6
CURRENT INPUT
MEASUREMENT INPUT
10V
RMS
MAX
7
3
232SR
START
STOP
POWER LOGGER
1743
I
N
I3I2I1V3V2V
SUPPLY INPUT
660V MAX
L1/A
L2/B
88-660 V
45-65 Hz
L3/C
N
100-350 V
RMS
MAX CAT
830V
600V CAT
300V CAT
1
5VA
POWER
1
5
2
4
Figure 2. 1744/1743 Power Quality Logger - Front View
egb021.eps
8
Page 18

Power Quality Logger
Safety Instructions
Table 4. 1744/1743 Power Quality Logger - Controls and Indicators
Item Name Description
A
B
C
D
E
F
G
Power supply
leads and
3-phase plus
neutral voltage
test leads
RS232
interface port
START/STOP
Channel LEDs
Power status
LED
Connector for
Flexi Set or
current clamps
Logging status
LED
Power supply voltage range: 88-660 V ac or
100-350 VDC, 50 Hz / 60 Hz, 600 V CAT III.
Fixed installed voltage input cables for L1 or A,
L2 or B, L3 or C, N.
The highest permissible nominal voltage for power
supply input is 660 V.
The highest permissible nominal voltage for signal
input is 830 V in a 3-wire network with Delta
connection.
In a 4-wire network with Wye connection, the
highest permissible nominal voltage is 480 V.
When using PTs and CTs for measuring voltage
and current in a medium-voltage network, refer to
the IEC 60044 international standard for
guidelines.
The serial RS232 interface is used to communicate
with a PC. The Logger is connected to the PC’s
serial port (or a modem for remote communication)
using the interface cable. Use a USB adapter if
necessary.
The START/STOP button is used to start or end
switch-operated logging sessions.
The logging channel LEDs indicate whether the
applied voltages and currents are within the
nominal range set using the PQ Log software.
Continuously on = Logging signal in nominal range
Short blinks = No or low-level signal
Long blinks = Overload
Continuously on = Power supply voltage in
permissible range
Off = No power
Flexi sets or current clamps are detected
automatically at power-up. If you change the current
probe type, be sure to remove and restore power so
the Logger will detect the new current probe.
Nominal ranges for the Flexi Set are 15 A, 150 A,
1500 A, and 3000 A ac. Nominal input for current
clamps is 0.5 V.
Continuously on = Logging in progress
Blinking = Logging stopped or not started
9
Page 19

1744/1743
Users Manual
Power Network Configurations
You can set up the Logger to work with several power network configurations:
• Single-phase voltage
• Single-phase voltage, current, power
• 3-phase voltage
• 3-phase voltage, 3-phase current, power
• 3-phase voltage, 3-phase current, neutral current, power
Note
3-phase logging with no neutral current can be done with appropriate
optional accessories (available separately).
Working with Logged Data
Logged data can be evaluated using the PQ Log software to provide the
following:
• Amount, date/time, and duration of quick and slow voltage variations
• Half-cycle 10 ms-extreme values for 50 Hz (8.3 ms at 60 Hz) MIN
and MAX for each measuring interval
• Depth and duration of voltage dips
• Correlation between peak current and voltage dips
• 95%-flicker values according to EN 50160
• Number and duration of interruptions
• Compliance of harmonic levels with defined limits
• Mean and peak values of phase currents
• Value of neutral conductor current
• Current total harmonic distortion (THD) of phase and neutral
conductor currents
• Profile of active, reactive, and apparent power versus time
• Monitoring of power factor (PF), and information about effectiveness
of compensation systems
• Graphical representations of logging data and statistics
10
Page 20

Power Quality Logger
Using the Logger
Using the Logger
This section explains how to operate the 1744/1743 Power Quality Logger.
A typical logging session includes four steps:
1. Preparing the Logger for use with the PQ Log software.
2. Installing the Logger at the logging site.
3. Leaving the Logger to collect data for a period.
4. Downloading and evaluating the logged data.
These steps are described in the following pages.
Logging Jobs
Logging jobs are defined using the PQ Log software, and transferred to the
Logger over the RS232 cable. Each job contains the following information:
• Logging function (P for Model 1743, and P or A for Model 1744)
• Measuring period, defined by start and end times
• Time activated, switch or immediate job
• Input range
• Nominal voltage, primary and secondary voltage for logging with
voltage converters
• Logging of phase-neutral wire or phase-phase
• Memory model
• Averaging period length
• Logging time periods
• Interharmonics and signaling voltages
• Limit values for events
• Memory model for events: circular (first-in/first-out, continuous), or
linear (quit logging when logging period is finished)
• Logging of current-neutral wire
• Converter ratios for current and voltage if using potential transformers
(PTs) and current transformers (CTs) at a medium-voltage network
site
11
Page 21

1744/1743
Users Manual
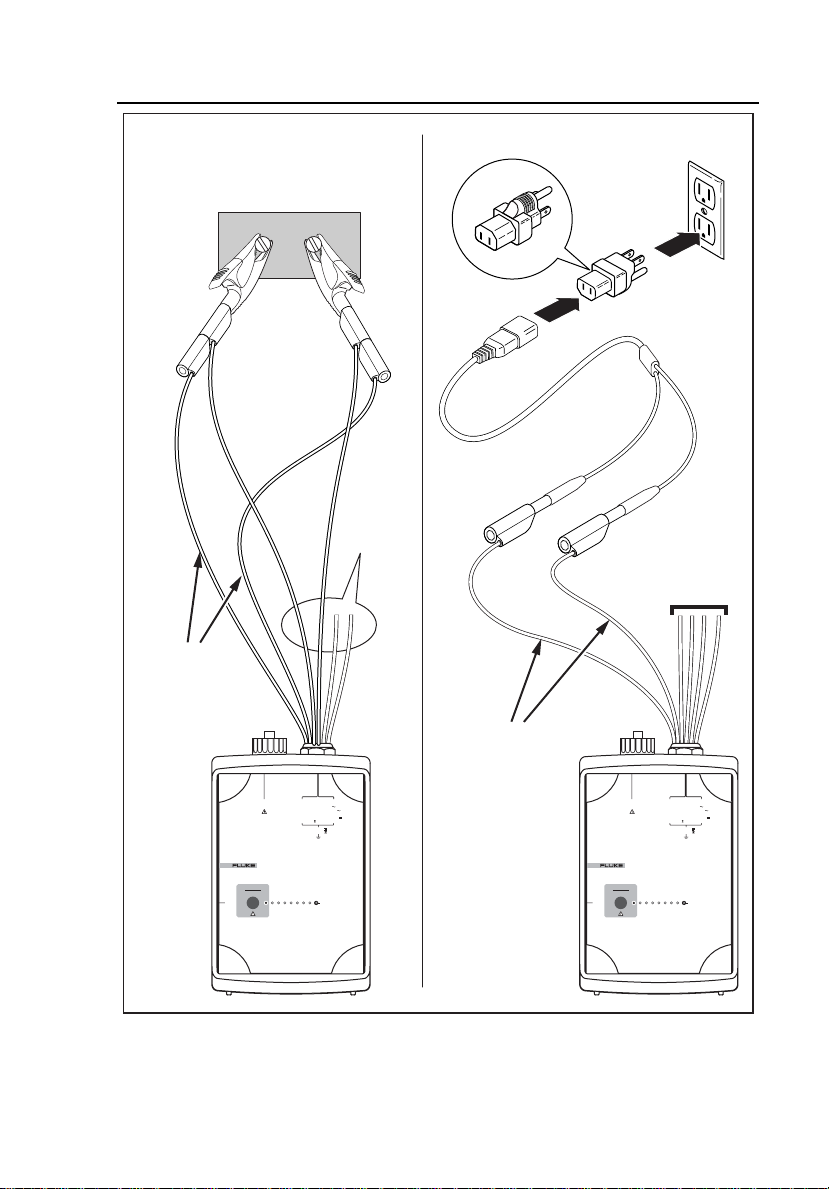
Preparing the Logger for Use
Prepare the 1744/1743 Logger for use with the PQ Log software as follows
(see Figure 3):
1. Connect the Logger to line power. Use the power supply cables to
connect to an outlet, or to the test leads phase and neutral for Wye
configurations, or any two-phase leads for delta.
W Caution
If you are powering the Logger in parallel with the test
leads, and the voltage under test at the Logger power
supply connections could be greater than 660 V RMS ac,
plug the power supply leads into an outlet instead.
Otherwise, you could damage the Logger.
12
Page 22
Power Quality Logger
Using the Logger
Power from Wall OutletPower in Parallel
with
Test Leads
Max 660 V
Voltage
Test Leads
Voltage
Test Leads
Power Supply
Leads
Power Supply
Leads
CURRENT INPUT
MEASUREMENT INPUT
MAX
POWER LOGGER
I
I3I2I1V3V2V
N
SUPPLY INPUT
660V MAX
L1/A
L2/B
88-660V
45-65Hz
L3/C
N
100-350V
830V
RMS
MAX CAT
5VA
600VCAT
300VCAT
1
POWER
10V
RMS
1743
START
STOP
232SR
CURRENT INPUT
MEASUREMENT INPUT
MAX
POWER LOGGER
I
I3I2I1V3V2V
N
SUPPLY INPUT
660V MAX
L1/A
L2/B
88-660V
45-65Hz
L3/C
N
100-350V
830V
RMS
MAX CAT
5VA
600VCAT
300VCAT
1
POWER
egb031.eps
10V
RMS
1743
START
STOP
232SR
Figure 3. Supplying Operating Power to the Logger
2. Connect the RS232 interface cable to the serial port of your PC.
13
Page 23

1744/1743
Users Manual
3. Run the PQ Log software as described in the PQ Log Users Manual.
4. Set up the Logging job and transfer the settings to the Logger.
Test Leads – Markings
The 1744/1743 Logger includes built-in, labeled test leads for voltage
terminals L1 or A, L2 or B, L3 or C, and N, as well as two for the internal
power supply. The Flexi Set or current clamp sets are connected by a seven-pin
plug to the Logger. Color coding clips are provided for your convenience.
Table 5. Test Lead Markings
Test Leads Markings
Phase L1 or A L1 / A
Phase L2 or B L2 / B
Phase L3 or C L3 / C
Neutral wire N N
Supply “Supply”
Supply “Supply”
Connecting Current Probes
Connect current clamps and Flexi Set probes so that current will flow in the
direction marked by arrows on the probes. Current must flow from the energy
generator to the energy consumer (the load) in order to maintain a positive
active power. (The polarization of the test lead for neutral conductor current is
not significant, because the phase angle of the neutral conductor current is not
evaluated.)
Note
Make sure the clip-on probes are connected to the appropriate phase:
with IL1 for a P-N measurement or V
V
L1
measurement.
14
Test Equipment Depot - 800.517.8431 - 99 Washington Street Melrose, MA 02176
FAX 781.665.0780 - TestEquipmentDepot.com
with IL1 for a P-P
L12
Page 24

Power Quality Logger
Using the Logger
Logging with Voltage Converters
The 1744/1743 Logger includes an adjustable converter ratio that enables it to
be used with voltage converters (potential transformers, or PTs).
Note
When logging with voltage converters, make sure the power supply
cables are not connected in parallel to the voltage test leads, or the
Logger’s power consumption can reduce accuracy.
The converter ratio is defined using the PQ Log software.
Connecting the Logger
W X Warnings
• To avoid electrical shock, do not connect any part of
the Logger to systems that have higher voltages to
ground (earth) than are marked on the Logger.
• Areas between the power company meter and the
source of the distribution system are characterized as
CAT IV areas. To avoid electrical shock or equipment
damage, never connect the Logger to power in CAT IV
areas if the voltage-to-earth ground is greater than
300 V.
• To avoid damaging the Logger, never connect its
voltage measuring inputs to phase-to-phase voltages
higher than 830 V.
• To avoid damaging the Logger, never connect the
power supply leads to voltages higher than 660 V RMS
ac.
• The Logger is to be used and handled only by qualified
personnel (see page 6).
• Maintenance work on the Logger must be done only by
qualified service personnel.
15
Page 25

1744/1743
Users Manual
• Use only the current probes specified in this manual. If
you use flexible current probes, wear suitable
protective gloves or work on de-energized conductors.
• Do not expose the Logger to moisture or humidity.
• To prevent electrical shock, always connect power
supply and voltage test leads to the Logger before
connecting to the load.
• All accessories must be approved for 600 V CAT III or
higher.
• Use the Logger only with its original standard
equipment or with approved optional accessories, as
listed in Table 2 and Table 3 in this manual.
• Connect clip-on current transformers and/or Flexi Set
to insulated live conductors only.
• If measuring sensors are to be connected to noninsulated live conductors, additional personal
protective measures must be taken as required by local
government agencies.
W Caution
To avoid damage, use the 1744/1743 Power Quality Logger,
only with the following nominal voltages:
• Single-/3-phase, 4-wire (Wye) systems (P-N): 69 V
to 480 V
• 3-phase 3-wire (Delta) systems (P-P): 120 V to 830 V
WX Warning
To avoid electrical shock, or damaging the Logger’s
internal protective circuitry or weatherproof seal, do not
open the Logger.
16
Page 26

Power Quality Logger
Using the Logger
Connect the Logger as follows:
Note
∆ (Delta) or Υ (Wye) measurements
The 1744/1743 Logger is prepared for logging in 3-phase 4-wire
(Wye) systems (P-N), or 3-phase 3-wire (Delta) systems (P-P). Please
note the different types of connection and configuration in the PQ Log
software.
1. Connect all required measuring leads.
2. If you want to supply the Logger from an extra outlet, use the
supplied line power adapter. The power supply leads can also be
connected in parallel to the voltage test leads, but the voltage is
limited to 660 V RMS ac.
3. Connect the current clamp set or Flexi Set to the Logger.
4. Connect the current sensor to the conductor under test.
5. Connect the dolphin clips to the test leads. For 3-phase, 4-wire
systems, connect the N-test lead first, and then the other phases.
17
Page 27

1744/1743
Users Manual
Connections in 3-Phase 4-Wire (Wye) Systems
The following figure shows the connections for logging 3-phase 4-wire (Wye)
systems:
L1
L2
L3
N
CURRENT INPUT
MEASUREMENT INPUT
MAX
POWER LOGGER
I
I3I2I1V3V2V
N
SUPPLY INPUT
660V MAX
L1/A
88-660V
L2/B
45-65Hz
L3/C
100-350V
N
RMS
MAX CAT
830V
5VA
600VCAT
300VCAT
1
POWER
10V
RMS
1743
START
STOP
232SR
18
Figure 4. Logging in a 3-Phase 4-Wire (Wye) System
egb003.eps
Page 28

Power Quality Logger
Using the Logger
Connections in 3-Phase 3-Wire (Delta) Systems
Figure 5 shows the connections for logging 3-phase 3-wire (Delta) systems.
L1
L2
L3
L4
CURRENT INPUT
MEASUREMENT INPUT
MAX
POWER LOGGER
I
I3I2I1V3V2V
N
SUPPLY INPUT
660V MAX
L1/A
88-660V
L2/B
45-65Hz
L3/C
100-350V
N
RMS
MAX CAT
830V
5VA
600VCAT
300VCAT
1
POWER
10V
RMS
1743
START
STOP
232SR
IP65
egb004.eps
Figure 5. Logging in a 3-Phase 3-Wire (Delta) System
The test lead N can be left open, or connected to ground potential.
19
Page 29

1744/1743
Users Manual
Connections for Single-Phase Logging
Figure 6 shows the connections for logging single-phase systems.
L1 N
L3
L2
20
Figure 6. Single-Phase Logging
CURRENT INPUT
MEASUREMENT INPUT
MAX
POWER LOGGER
I
I3I2I1V3V2V
N
SUPPLY INPUT
660V MAX
L1/A
L2/B
88-660V
45-65Hz
L3/C
N
100-350V
RMS
MAX CAT
830V
5VA
600VCAT
300VCAT
1
POWER
egb005.eps
10V
RMS
1743
START
STOP
232SR
Page 30

Power Quality Logger
Using the Logger
Connections for Medium-Voltage Networks
In a 3-phase 3-wire (Delta) system with three separate voltage converters and
three current transformers, the Logger can measure phase-phase (P-P, Delta) or
phase-N (P-N, Wye). See Figure 7.
L1
L1
L2
L2
L3
L1
L3
Supply
L2
L3
CURRENT INPUT
MEASUREMENT INPUT
SUPPLY INPUT
10V
RMS
MAX
L1/A
660V MAX
L2/B
88-660V
45-65Hz
L3/C
N
N
232SR
100-350V
830V
RMS
MAX CAT
5VA
600VCAT
300VCAT
POWER LOGGER
1743
START
STOP
I
I3I2I1V3V2V
N
1
POWER
egb006.eps
Figure 7. Measuring 3-Phase Voltages in a 3-Wire (Delta) System with
Three Voltage Converters
21
Page 31

1744/1743
Users Manual
Phase-Phase Delta Logging
Figure 7 shows the connections for phase-phase Delta logging.
1. Connect the voltage test leads to the outputs of the voltage
transformers (VTs).
2. In PQ Log, select the measuring range with the matching nominal
voltage and P-P logging.
3. Enter the correct converter/transformer ratio for current and voltage.
22
Figure 8. PQ Log Settings for a 16 kV Network
egb007.bmp
Page 32

Power Quality Logger
Using the Logger
Phase-Ground, Wye-Logging
Figure 7 shows the Phase-Ground, Wye-Logging. Figure 9 shows typical PQ
Log settings for using potential transformers (PTs) and current transformers
(CTs) with a 16 kV network.
Figure 9. PQ Log Settings for a 16 kV Network
egb010.bmp
23
Page 33

1744/1743
Users Manual
1. Connect the voltage test leads to the outputs of the voltage
transformers (VTs).
2. In PQ Log, select the measuring range with P-N logging and
matching nominal voltage.
3. Enter the correct converter/transformer ratio for current and voltage.
Note
Current clamp sets are available for 1 A current transformers.
Logging with Two Voltage Converters and Two Current Transformers
In 3-phase 3-wire systems with two voltage converters (VTs) and two current
transformers (CTs) in an Aron or Blondel measuring circuit, the Logger can
measure only phase-phase (P-P, Delta).
L1
L2
L3
L3
L2, N
CURRENT INPUT
MEASUREMENT INPUT
SUPPLY INPUT
10V
RMS
MAX
L1/A
660V MAX
L2/B
88-660V
45-65Hz
L3/C
N
100-350V
RMS
MAX CAT
830V
5VA
600VCAT
300VCAT
POWER LOGGER
L1
1743
START
STOP
I
I3I2I1V3V2V
N
1
POWER
232SR
egb009.eps
Figure 10. Measuring 3-Phase Voltages in a 3-Wire System with Potential
Transformers (Aron Measuring Circuit)
24
Test Equipment Depot - 800.517.8431 - 99 Washington Street Melrose, MA 02176
FAX 781.665.0780 - TestEquipmentDepot.com
Page 34

Power Quality Logger
Using the Logger
1. Connect the voltage test leads L2 or B and N to the common ground
point.
2. In PQ Log, select the measuring range with P-P logging and matching
nominal voltage.
3. Enter the correct converter/transformer ratio for current and voltage.
Figure 11. PQ Log Settings for a 16 kV Network
egb007.bmp
Note
Current clamp sets are available for 1 A current transformer.
Logging
When the Logger is connected and ready, you can perform three types of
logging:
• Switch-activated job: The status LED is blinking. Press the
START/STOP button once. As soon as the job is active, the LED is
on continuously. If needed, the job can be cancelled after running for
at least one minute, and restarted later.
25
Page 35

1744/1743
Users Manual
• Time-activated job: The Logger starts logging as soon as the
preprogrammed start time is reached, and stops at the defined end
time.
• Immediate job: The Logger starts logging as soon as power is on.
Note the following about logging jobs:
• The connection can be verified using the logging channel LEDs. If all
three LEDs are lit continuously, the connection and the signal levels
are within nominal range. For details, see Table 4 in the Features
section.
• The unit/job status is indicated by the status LED. For details, see
Table 4 in the Features section.
Completing the Logging Job
1. Terminate the job as follows:
• For switch-activated jobs: At the end of the logging period, stop
the logging job by pressing the START/STOP button.
• For time-activated and immediate jobs: Stop the job in PQ Log
with the icon, or with menu Logger/Stop logging.
Note
Make sure the logging job is stopped with the START/STOP button
(switch-activated jobs) or PQ Log (time-activated jobs) before the test
leads or power supply leads are removed. Otherwise, the Logger will
record a voltage interruption.
Only switch-activated jobs can be aborted. Time-activated jobs are
terminated only when the programmed measuring time has elapsed.
2. Remove the test leads of the three phases. Be sure to remove the
measuring cable of the neutral wire last.
3. Remove the current probes.
26
Page 36

Power Quality Logger
Methods of Logging
Evaluating the Logged Data
You’ll use PQ Log to evaluate the logged data. Data can be read out during
logging as well as at the end.
1. Connect the Logger to line power.
2. Connect the RS232 interface cable to your PC’s serial port, then to the
Logger.
3. Start the PQ Log software.
4. Use PQ Log to transfer the data from the Logger to the PC.
5. Once the data is transferred, remove the RS232 interface cable and
operating power from the Logger.
6. Evaluate the data using PQ Log.
For details, refer to the PQ Log manual.
Methods of Logging
The following section describes methods of logging using the 1744/1743
Logger.
Measuring Ranges
The Logger has three input ranges for each of its two connection systems: Wye
connection (3-phase, 4-wire) and Delta connection (3-phase, 3-wire).
Table 6. Measuring Ranges
Connection Nominal Voltages (Wye/Delta) Max. Input Voltage
Wye/Delta 69 V / 120 V 115 V / 200 V 230 V / 400 V 480 V / 830 V
Phase/Neutral
3-phase 4 wire
Phase/Phase
3-phase 3 wire
27
69 V ~, +20% 115 V ~, +20% 230 V ~, +20% 480 V ~, +20%
120 V ~, +20% 200 V ~, +20% 400 V ~, +20% 830 V ~, +20%
Page 37

1744/1743
Users Manual
Figure 12. Selecting Voltage Input Ranges During Job Processing
Note
For P-P logging, the P-P voltage must be entered as the nominal
voltage (e.g. 400 V for 230 V systems).
Signal Sampling
egb015.bmp
Input signals (up to three voltages and four currents) are filtered with an antialiasing filter, and digitized with a 16-bit A/D converter. The sampling rate is
10.24 kHz. All parameters are calculated from this data.
Resolution Accuracy
Resolution and accuracy depend on the logging parameter. For details, see
28
Page 38

Power Quality Logger
Methods of Logging
Technical Specifications” on page 46.
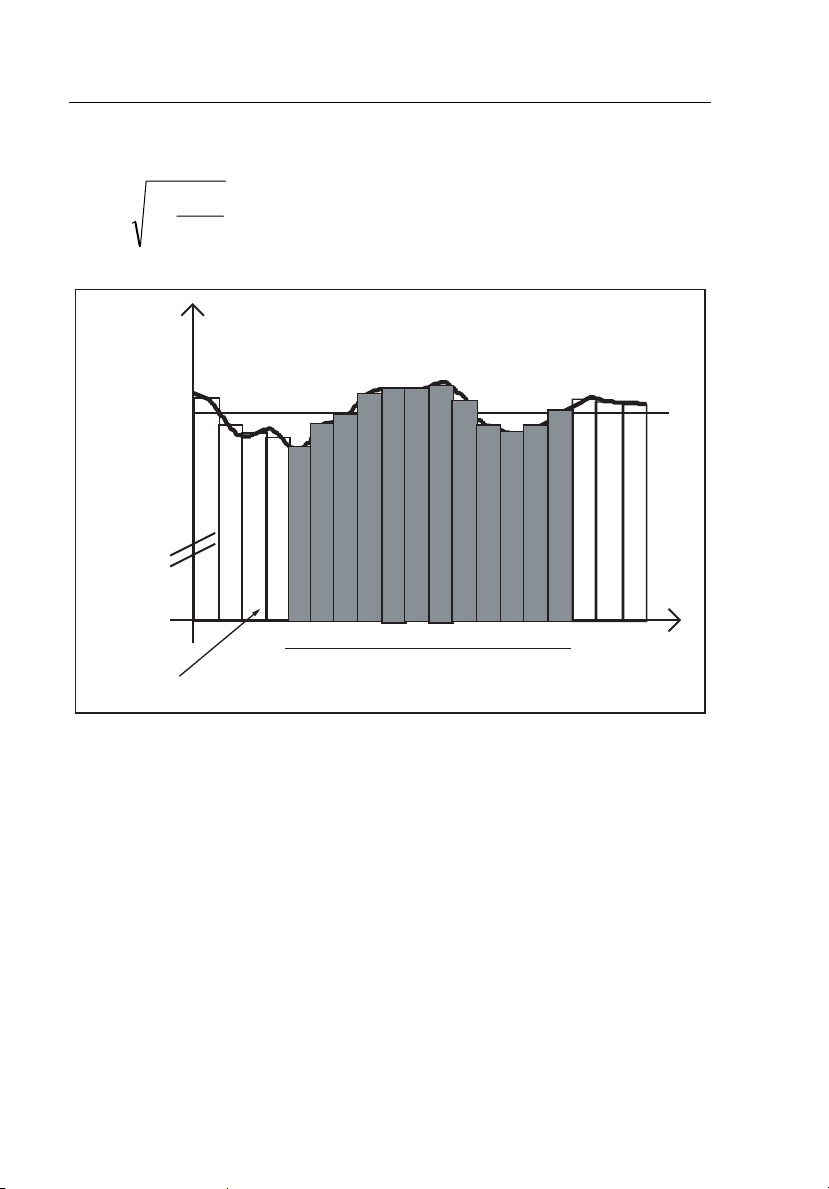
Voltage Variations
The interval value of the voltage is defined as the mean value of the RMS
values over the interval length defined in PQ Log.
Averaging intervals can be set in PQ Log to the following:
• 1, 3, 5, 10, or 30 seconds
• 1, 5, 10, 15, or 60 minutes
1 Interval
V
N
Time
Measuring period
Figure 13. Measuring Voltage Variations
egb016.eps
Note
For logging in Wye configuration using logging function A, the
phase-phase voltages are measured and displayed separately from the
logging of the phase-neutral voltages.
29
Page 39

1744/1743
Users Manual
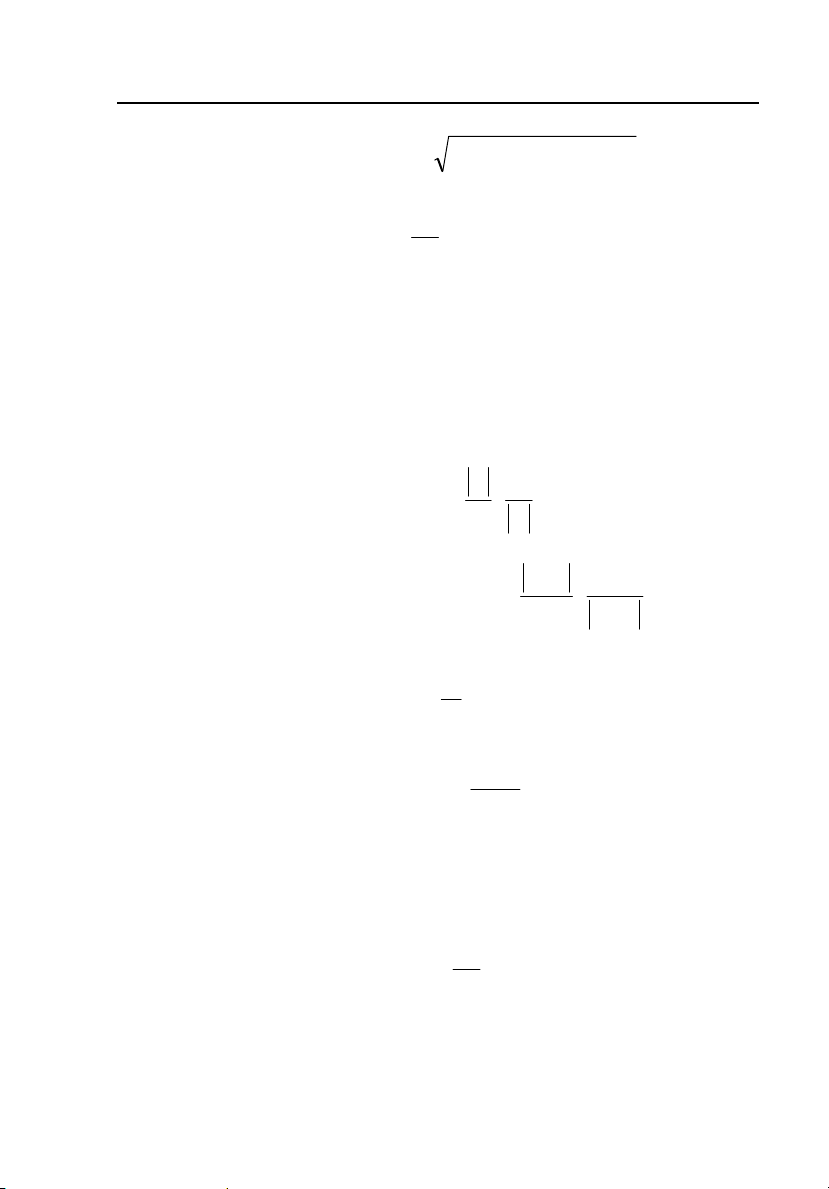
Min/Max Values
Logging detects the highest and lowest voltage RMS values and the highest
current RMS value during the test interval, using a minimum resolution of
10 ms.
The response time can be set in PQ Log to the following:
• 0.5 or 1 line power period
• 200 ms
• 1, 3, or 5 seconds.
U
Max. Value
Min. Value
30
Measuring Interval
Figure 14. Logging Min and Max Values
t
egb017.jpg
Page 40

Power Quality Logger
Methods of Logging
Voltage Interruptions
The Logger records two types of interruptions:
• All measured RMS values of input voltages that are < 1% of the
nominal voltage. (This threshold can be adjusted in PQ Log.)
• Interruptions > 10 ms (0.5 line power periods).
The start time and duration of each interruption are registered.
110% Un
100% Un
90% Un
1%
Duration
Figure 15. Voltage Interruption
Time
egb018.eps
31
Page 41

1744/1743
Users Manual
Voltage Dips and Swells
If the voltage passes the upper limit (VN + 10%) or lower limit (VN – 10%), the
event is registered as a voltage swell or dip, respectively (thresholds are
adjustable in PQ Log).
The duration, time, and extreme value of the dip or swell is also recorded.
Heigth
110% Un
100% Un
90% Un
Depth
Duration
Figure 16. Voltage Dips and Swells
Duration
Time
Zeit
egb019.eps
Voltage Harmonics
Voltage harmonics are defined as voltage components that have a frequency
that is an integer multiple of the fundamental frequency of the line power
voltage. Logging function A records each individual voltage harmonic, up to
th
the 50
order. These values are averaged over the interval length defined in
PQ Log.
32
Page 42

Power Quality Logger
Methods of Logging
Current Harmonics
Current harmonics are defined as current components that have a frequency
that is an integer multiple of the fundamental frequency of the line power
current. Logging function A records each individual harmonic of the phase
currents and the neutral current, up to the 50
harmonics as absolute values. The values are averaged over the interval length
defined in PQ Log.
th
order, and presents the
Mains Signaling
Voltage components that have frequencies that are not integer multiples of the
fundamental frequency of the line power voltage are called Mains Signaling
voltages or ripple-control voltages (“interharmonics”).
The Logger can be programmed to record up to five interharmonics, with a
resolution of 5 Hz. This function can also be used to monitor ripple-control
signals, by entering the signal frequency of the local utility.
The Logger measures the three-second RMS value of each interharmonic, and
establishes statistics for EN 50160 evaluation. These statistics are available
after a minimum recording time of 24 hours, or after regular termination of the
measuring job, and can be exported from PQ Log and evaluated later.
Additionally, the Logger provides a long-term recording of the interharmonics.
You can select from the following special measurement methods in the PQ
Log software:
• 200 ms maximum value (recommended for estimating ripple-control
signal levels)
• 200 ms minimum value
• 3 seconds maximum value
• Average value over interval
In PQ Log, the frequency can be entered with a resolution of 0.5 Hz, but for
evaluation the values are corrected to a bandwidth of 5 Hz. One frequency can
be defined for each band: for example, for a ripple-control signal of 183 Hz,
the values will be corrected to 185 Hz. Interharmonics of voltages and currents
with these frequencies are recorded.
See the PQ Log manual for details.
33
Page 43

1744/1743
Users Manual
THDV – In Function A
50
2
V
∑
n
2
n
Function A:
V
: RMS value of harmonic frequency #n.
n
V
: RMS value of the fundamental frequency.
1
VTHD
THDV: total contents of harmonics of the line power voltage as a percentage
of the fundamental.
This algorithm is according to EN 61000-4-7.
THD of currents:
THDI
=
Function A:
I
: RMS value of harmonic frequency #n.
n
I
: RMS value of the fundamental frequency.
1
THDI: total contents of harmonics of the current as a percentage of the
fundamental.
=
=
V
1
50
2
I
∑
n
2
n
=
I
1
and
()
=
50
∑
=
IATHDI
22n
n
34
Test Equipment Depot - 800.517.8431 - 99 Washington Street Melrose, MA 02176
FAX 781.665.0780 - TestEquipmentDepot.com
Page 44

Power Quality Logger
Methods of Logging
Calculation of THD in Measuring Function P
THD – Measuring Function P
Function P does not measure harmonic values.
2
2
−
Voltages:
V
RMS
V
1
Currents:
I
RMS
I
: RMS value of the fundamental.
1
THDV
: RMS value of total signal
: RMS value of the fundamental
THDI
: RMS value of the total signal.
RMS
=
RMS
=
VV
1
V
1
2
−
I
1
2
II
1
Note
THDI for currents < 5% of IE (measuring range) can have additional
uncertainties, or can be suppressed.
Harmonics up to 50th order are taken into account.
Flicker
Flicker is the visual impression of unsteadiness in a light source whose
luminance or spectral distribution changes over time. Flicker is logged in
accordance with the IEC 61000-4-15 standard. The short-term (st) flicker Pst
is logged over a default standard interval of 10 minutes, and is used to
calculate the long-term (lt) flicker Plt (by taking the sliding average of 12
short-term values). The interval value can be changed as needed in PQ Log.
35
t
Page 45
1744/1743
Users Manual
Formula for Plt Function
12
Pst
3
Plt
=
∑
12
=
i
1
Flicker [%]
Interval le ngth => 1 Pst
3
12 x interval length => 1 flicker value Plt
Figure 17. Measuring Flicker Values
Time
egb020.eps
Unbalance
The ratio of negative-to-positive sequence harmonics is calculated, with the
angles and magnitudes of the phase voltages taken into account. These values
are averaged over the interval length defined in PQ Log.
Frequency
The line power frequency is measured and averaged over 10 seconds, and the
resulting values are divided into 42 classes for establishing statistics. Values
are also averaged over the interval length defined in PQ Log.
36
Page 46

Power Quality Logger
Methods of Logging
Current Logging
The maximum values of the currents (L1 or A, L2 or B, L3 or C, and N) are
measured, and the interval value of the current is calculated using the mean
value over the RMS values of the interval defined in PQ Log.
Logging Function A
If a 3-phase current sensor is connected, the neutral current is calculated on a
sample basis from the phase currents. If a 3-phase+N sensor is detected, you
can select between logging and calculating the neutral current in PQ Log.
I
peak
The peak values of the current (samples, not RMS values) are averaged in the
PQ Log software over the predefined measuring interval.
Note
Short peak values do not contribute much to the average value, and so
I
can be higher than I
max
peak
.
Crest Factor (CF)
The crest factor (CF) of the currents (L1 or A, L2 or B, L3 or C, and N) is the
ratio of current peak value divided by current RMS value, and is averaged over
the interval length defined in PQ Log. For sinusoidal signals: CF = 1.41, and
for square waves: CF = 1.00
Power
The power values (L1 or A, L2 or B, L3 or C and N) are averaged over the
interval length, and the maximum value of each is recorded.
The response time can be set to 1 second or 1 minute, and is independent of the
response time for voltage and current.
In logging function P, the active power, apparent power, and reactive power of
the phases and total power of all three phases is calculated.
Logging function A also calculates the distorting power D of the phases, and
D
.
total
37
Page 47

1744/1743
Users Manual
Logger Parameters with Function P
The following are the parameters of the 1744/1743 Logger with function P.
N
RMS value of voltage and current.
Basic values on 200 ms per phase.
RMS value of voltage and current
per logging interval per phase
V
1
N
I
1
N
N: Number of samples in 200 ms intervals
(2048)
V
1
M
I
1
M
⋅=
⋅=
⋅=
⋅=
∑
i
∑
i
M
∑
j
M
∑
j
2
V
ibas
=
1
N
2
I
ibas
=
1
V
basRMS
j
=
1
I
basRMS
j
=
1
Active power based on samples.
Basic value on 200 ms per phase.
Active power per logging interval
per phase
Total active power on all three
phases
38
M: Number of 200 ms intervals per
logging interval
N
M
=
1
∑
N
M
1
⋅=
∑
j
3
∑
=
1k
P ⋅=
P
P
: 200 ms value
bas
M: Number of 200 ms intervals per
logging interval
=1
i
=
PP
IV
i
ibas
P
bas
j
1
ktotal
Page 48

Power Quality Logger
Logger Parameters with Function P
Pk: Active power of the phase
k: Phase (k = 1, 2, 3)
M
M
1
⋅=
P
∑
j
=
1
basbetr
j
Absolute value of the active power
per interval per phase. Parameter in
PQ Log: |P|.
P
M: Number of 200 ms intervals per
logging interval
Sum of the absolute value of the total
active power on all three phases. PQ
Log parameter: |P|
Apparent power per phase
Apparent power per logging interval
per phase
Total apparent power on all three
phases
Power factor per phase
Total power factor on all three
phases
total
.
3
=
∑
k
=
1
K: Phase (k = 1, 2, 3)
M
1
⋅=
S
M
=
PF ⋅==
S
∑
j
=
1
3
SS
∑
1k
=
Q
λ
Q
PF ⋅==
λ
totaltotal
PP
bas
betrbetrtotal
k
22
QPS +=
basbasbas
j
()
ktotal
P
S
P
total
S
total
Q
Q
total
total
Tangent φ per phase
Q
=
ϕ
tan
P
39
Page 49

1744/1743
Users Manual
Tangent φ total on all three phases
Q
total
ϕ
tan
Active energy per phase and total Active power accumulated on each
logging interval
total
=
P
total
Note
The sign of the active power P gives the direction of the power flow
(positive: from generator to load), and the sign of the power factor
distinguishes between inductive load (positive) and capacitive load
(negative).
Sign of PF, tan φ, cos φ:
• Sign “+” : Q positive (“inductive”)
• Sign “–” : Q negative (“capacitive”) independent of the sign of active
power P
40
Page 50

Power Quality Logger
ϕ
Logger Parameters with Function A
Logger Parameters with Function A
The following are the parameters of the 1744/1743 Logger with function A.
TRMS value of voltage
and current. Basic values
on 200 ms per phase.
RMS value of voltage and
current per logging
interval per phase
Active power calculated
from FFT from samples
of voltage and current.
Basic value on 200 ms per
phase.
N
1
=
V
N
I
1
N
N: Number of samples in 200 ms intervals (2048)
1
=
V
M
I
RMS
M: Number of 200 ms intervals per logging interval
1
M
IVP
Vn: RMS value of voltage harmonics of order n
In: RMS value of current harmonics of order n
V
.
∑
i
=
1
N
⋅=
I
∑
i
=
1
M
V
.
∑
j
=
1
M
⋅=
∑
j
=
1
cos..=
2
ibas
2
ibas
2
basjRMS
2
I
bas
j
nnnn
n: Order of the harmonics
: Phase angle between current and voltage
φ
n
harmonics of order n
P
: Harmonics of the active power of order n
n
Fundamental
50
=
PP
∑
nbas
1
=
n
1 PPh
=
bas
1
41
Page 51

1744/1743
Users Manual
Active power of logging
interval per phase
Total active power on all
three phases
Absolute value of the
active power per interval
per phase
Sum of the absolute
values of the active power
on all three phases
Apparent power based on
RMS values of voltage
and current. Basic values
on 200 ms per phase
M
1
⋅=
3
∑
1
M
=
∑
j
1k
=
1
PP
⋅=
∑
1
M
IVS .=
P
bas
j
ktotal
M
P
basbetr
=
1
M
∑
j
j
++=
PPP
basbasbas
=
1
321
j
basbasbas
P
M
P
to 200 ms value
bas j
M: Number of 200 ms intervals per logging interval
=
Pk: Active power of the phase
k: Phase (k = 1, 2, 3)
P
P
betr
total
Apparent power per
logging interval per phase
Total apparent power on
three phases
42
M
1
⋅=
∑
∑
3
=
S
bas
j
1K
j
=
1
SS
ktotal
S
M
S
: 200 ms value
bas j
M: Number of 200 ms intervals per logging interval
=
k: Phase (k = 1, 2, 3)
Page 52
Power Quality Logger
Logger Parameters with Function A
Distortion power. Basic
value on 200 ms per
phase
222
QPSD −−=
basbasbasbas
Distortion power per
interval per phase
Total distortion power on
three phases
Distortion power per
phase
Total distortion power on
three phases
Tangent φ per phase
Total tangent φ on three
phases
M
1
⋅=
D
M
D
: 200 ms value
bas j
M: Number of 200 ms intervals per logging interval
=
PF ⋅==
PF ⋅==
=
ϕ
tan
ϕ
tan
total
D
∑
bas
j
3
∑
=
1k
λ
λ
j
=
1
DD
P
S
totaltotal
ktotal
Q
Q
P
S
total
total
Q
Q
total
total
Q
P
Q
total
=
P
total
Active power of the
fundamental per phase
Basic value for 200 ms.
Active power of the
fundamental per phase per
interval
Ph
1 PPh
=
1
bas
1
M
M
1
⋅=
Ph
1
∑
j
basbas
=
1
j
43
Page 53

1744/1743
Users Manual
Total active power of the
fundamental for three
phases
Apparent power of the
fundamental per phase.
Basic value for 200 ms.
Apparent power of the
fundamental per phase per
interval
Power factor of the
fundamental per phase
Total power factor on all
three phases
Active energy per phase
and total
Sign of PF, tan φ, cos φ:
3
⋅=
11
PhPh
∑
k
.1 IVSh
=
bas
1
Sh
1
cos
cos
Active power accumulated on each logging interval
⋅=
∑
M
Ph
ϕ
1
=
ϕ
total
1
=
M
=
j
Sh
1
1
11
1
Sh
total
1
ktotal
1
bas
j
1
Qh
⋅=
1
Qh
Ph
1
total
ShShSh
++
Qh
1
⋅
Qh
111
1
321
total
total
• Sign “+” : Q positive (“inductive”)
• Sign “–” : Q negative (“capacitive”) independent of the sign of active
power P
44
Test Equipment Depot - 800.517.8431 - 99 Washington Street Melrose, MA 02176
FAX 781.665.0780 - TestEquipmentDepot.com
Page 54

Power Quality Logger
Maintenance
Maintenance
W Caution
Maintenance work on the Logger can be done only by
trained and qualified personnel at a company-approved
service center within the warranty period. For locations of
Fluke Service Centers worldwide and contact information,
see the Fluke website: www.fluke.com.
With proper use, the Logger does not require special maintenance other than
periodic calibration at a Fluke calibration center.
If the Logger gets dirty, wipe it off carefully with a damp cloth without
cleaning agents.
Lithium Battery
The 1744/1743 Logger contains a vanadium pentoxide lithium rechargeable
battery. This battery is automatically recharged during normal operation.
Disposal
If you discard the Logger, you must recycle it at an appropriate recycling
center as required by local regulations.
45
Page 55

1744/1743
Users Manual
Technical Specifications
Logging Parameters – Overview
The following table gives an overview of the logging parameters.
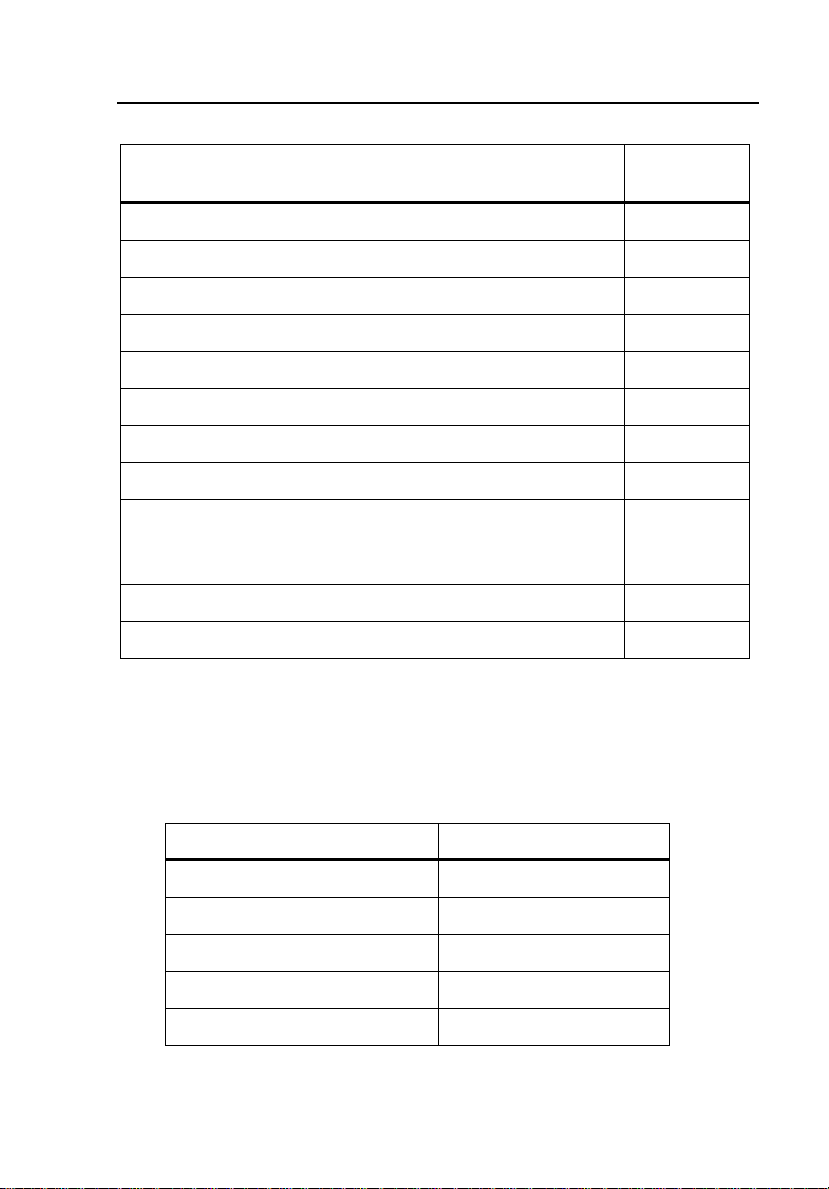
Table 7. Logging Parameters – Overview
Measuring Function P A
Voltage: mean, min, max
values
Current: mean, max values z z
Neutral current N z z
Voltage events z z
Power: P, |P|, S, D, PF,
tangent
Power total P, |P|, S, D, PF,
tangent
Energy z z
Flicker: Pst, Plt z z
Voltage harmonics z
Current harmonics (L1 or A,
L2 or B, L3 or C, N,
up to 50
Interharmonics, ripple-control
signals
THDV (voltage) z z
th
order)
z z
z z
z z
z
z
46
THDI (current) z z
CF (crest factor current) z
Unbalance z
Frequency z
Page 56

Power Quality Logger
Technical Specifications
Maximum Number of Intervals for Logging Function P
The maximum recording period can be calculated by multiplying the interval
time defined in PQ Log with the maximum number of intervals in the
following table.
Version P, V+I A, V+I
Averaged
periods
> 24,000 > 10,000
General Information
Intrinsic uncertainty Valid for reference conditions, and guaranteed for
two years.
Quality system Developed, designed, and manufactured according to
DIN ISO 9001.
Recalibration interval Fluke recommends a recalibration interval of no
more than two years, depending on use.
Reference conditions 23 C ± 2 K, 230 V ± 10%
50 Hz ± 0.1 Hz / 60 Hz ± 0.1 Hz
Phase sequence: L1 or A, L2 or B, L3 or C
Interval length: 10 minutes, 3-phase Wye
configuration.
Power supply: 88 to 265 V ac
47
Page 57

1744/1743
Users Manual
Environmental Specifications
Working temperature
range
Operating temperature
range
Storage temperature range –20 °C to +60 °C
Reference temperature
range
Relative humidity 10 to 90%, no condensation
Housing Robust, compact housing of CYCOLOY
Protection IP65 per EN 60529
Safety EN 61010-1 600 V CAT III, 300 V CAT IV
Type test voltage 5.2 kV ac, 50 Hz / 60 Hz, 5 s
–10 °C to +55 °C
0 °C to +35 °C
23 °C ± 2 K
pollution degree 2, double insulation
EMC
Emission IEC/EN 61326-1, EN 55022
Immunity IEC/EN 61326-1
48
Page 58

Power Quality Logger
Technical Specifications
Power Supply
Functional range 88 to 660 V RMS ac absolute, 50 Hz / 60 Hz
Safety EN 61010-1 600 V CAT III, 300 V CAT IV,
pollution degree 2, double insulation
Fuse Power supply fuse can be replaced only in service
facility. Supply can be connected in parallel to
measuring inputs (up to 660 V RMS ac).
Power consumption 5 W
Memory capacity 8 MB Flash-EPROM
Intervals > 5.600 intervals, > 39 days with 10-min intervals
Events > 13.000
Memory model Linear, circular
Interface RS232, 9600 to 115000 Baud, automatic selection,
3-wire communication.
Dimensions 170 mm x 125 mm x 55 mm
Weight Approx. 0.9 kg
Measurement
A/D converter 16 bit
Sampling frequency 10.24 kHz
Anti-aliasing filter FIR-Filter, fC = 4.9 kHz
Frequency response Uncertainty < 1% of Vm for 40 to 2500 Hz
Interval length 1, 3, 5, 10, or 30 seconds,
1, 5, 10, 15, or 60 minutes
Averaging time for
min/max values
Time base Resolution: 10 ms (at 50 Hz) deviation: 2 s/day
49
½ , 1 line power period
200 ms
1, 3, 5 s
at 23 °C.
Page 59

1744/1743
Users Manual
Input Voltage
Input range VI P-N: 69, 115, 230, or 480 V ac
Input range VI P-P 120, 200, 400, or 830 V ac
Max overload voltage 1.2 VI
Input range selection By job programming
Connections P-P or P-N, 1- or 3-phase
Nominal voltage VN ≤ 999 kV (using PTs and ratios)
Input resistance Approx. 820 ke per channel. Lx-N
Single phase (L1 or A, L2 or B, L3 or C connected):
app. 300 ke
Intrinsic uncertainty 0.1% of V
I
Voltage transformer Ratio : < 999 kV / VI
Ratio selection By job programming
Current Input with Flexi Set
Input ranges II L1 or A, L2
or B, L3 or C, N:
Measuring range 0.75 A to 3000 A ac
Intrinsic uncertainty < 2% of I
Position influence Max. ±2% of m.v. for distance conductor to
Stray field influence <± 2 A for Iext= 500 A ac and distance to measuring
Temperature coeff. 0.005% / K
Current transformer Ratio : ≤ 999 kA / I
Ratio selection By job programming
Connection 3-phase, 3-phase + N 2-phase L1 or A and L3 or C
15, 150, 1500, or 3000 A ac
I
measuring head >30 mm
head >200 mm
I
(2 W-meter-method) 7-pole connector
50
Page 60

Power Quality Logger
Technical Specifications
Current Input for Clamp
Input signal: 0.5 V ac nominal (for II) 1.4 V peak
Intrinsic uncertainty < 0.3% of II
Max. overload 10 V ac
Input resistance App. 8.2 ke
Current transformer Ratio : ≤ 999 kA / ≤ II
Ratio selection By job programming
51
Page 61

1744/1743
Users Manual
General Specifications
RMS Logging Slow Voltage Variations
Logging values: Mean value RMS values averaged over interval length
Min, Max values Averaging with selectable averaging time from
0.5 periods to 5 s
Max value Max 10 ms RMS value per interval
Min value: Min 10 ms RMS value per interval
Current Logging Values
Mean value RMS values averaged over interval length
Max value Highest RMS value per interval
Events Dips, Swells, Interruptions
Limit value Variable
Lower limit: 0 to 95% V
Upper limit: 105 to 120% VN
Set in PQ Log
Range 0 to VI + 20%
Logging value ½ period RMS value
Operating uncertainty < 2% of V
Response time ½ line power period
I
N
Flicker
Logging value Flicker severity (Pst / Plt) according to
IEC 61000-4-15
Intrinsic uncertainty Pst < 5% of m. v
Measuring range Pst 0.4 to 4
52
Page 62

Power Quality Logger
Technical Specifications
Power (Logging Functions A, P only) P, S, |P|
Active power P As per EN 61036, class 2
Distorting power D As per EN 61268, class 2 (A-version only)
Max value Highest value per interval
Min value Smallest value per interval
Phase uncertainty < 0.3 degrees
Conditions Conductor centered within clamp jaws or
Flexi Set
Harmonics
Vm, Im, THDV, THDI per IEC/EN 61000-4-7, class B
Voltage harmonics (function A)
intrinsic uncertainty:
Current harmonics (function A)
intrinsic uncertainty
THDV (function A) intrinsic
uncertainty at V
THDV (function P) intrinsic uncertainty
at VN
THDI (functions A, P) intrinsic
uncertainty at II
N
For Vm < 3% VN: < 0.15% VN
For Vm ≥ 3% VN: < 5% Vm
For Im < 10% IN: < 0.5% IN
For Im ≥ 10% IN: < 5% Im
For THDV < 3%: < 0.15%
For THDV ≥ 3%: < 5%
For THDV < 3%: < 1%
For THDV ≥3%: < 5%
For THDI < 3%: < 2%
For THDI ≥ 3%: < 5%
Statistics
Frequency 42 classes for 10 s mean values
Ripple-control signals
Interharmonics 21 classes for 3 s mean values
Analysis of logging data
Programming and analysis is done by PQ Log software on PC.
53
Page 63

1744/1743
Users Manual
Logging Function P
Logging Values
Voltage L1 or A, L2 or B, L3 or C: phase-phase or phase-neutral:
• Voltage (mean, min, and max values)
• THDV (mean, and max values)
• Flicker Pst, Plt
• Voltage events (dips, swells, interruptions)
Current L1 or A, L2 or B, L3 or C, and N:
• Current (mean, max values), THDI
Power:
• Active power P (mean, min, and max values)
• Absolute values active power |P| (mean, min, and max values)
• Apparent power S (mean, min, and max values)
• Power Factor PF, tangent
• Energy per averaging interval
Total Power:
• Total power P, |P|, S
• 3-wattmeter and 2-wattmeter method (Aron circuitry)
Application
Power logging:
• Long-term analysis of active, reactive, apparent power
• Long-term analysis of power factor, symmetry
Disturbance analysis:
• Examination of voltage dips and swells, flicker measurement
Network optimization:
• Load measurements, acceptance of new loads
• Efficiency of compensation systems
54
Test Equipment Depot - 800.517.8431 - 99 Washington Street Melrose, MA 02176
FAX 781.665.0780 - TestEquipmentDepot.com
Page 64

Power Quality Logger
Technical Specifications
Logging Function A – “All” parameters
Logging Values
All parameters for voltage quality per EN 50160:
Voltage L1 or A, L2 or B, L3 or C: phase-phase or phase-neutral:
• Voltage (mean, max, min values)
• Voltage harmonics 1
• THDV (harmonic contents of voltage)
• Interharmonics 5 to 2500 Hz (in steps of 0.5 Hz)
• Flicker Pst,Plt
• Unbalance
• Signaling voltages
• Frequency
• Voltage events (dips, swells, interruptions)
Current L1 or A, L2 or B, L3 or C, and N:
st
to 50th order
• Current (mean, max values)
• Harmonics of phase and neutral currents up to 50
th
order
• Crest factor and peak values of the currents
Power:
• Active power P (mean, min, and max values)
• Absolute values active power |P| (mean, min, and max values)
• Distorting power D (mean, min, and max values)
• Apparent power S (mean, min, and max values)
• Power Factor PF, tangent
• Energy per averaging interval
55
Page 65

1744/1743
Users Manual
Total power:
• Total power P, |P|, D, S
• 3-wattmeter method
• 2-wattmeter method (Aron circuitry)
• 2 ½ wattmeter method
Applications
Power quality:
• Voltage quality analysis according to EN 50160 over a 1-week period
(time-activated job)
• Examination of measurement quantities per standards
Disturbance analysis:
• Long-term analysis of line power voltage
• Examination of voltage dips, swells, and harmonic problems
• Flicker measurement
• Examination of ripple control signals (level)
• Specific search for disturbances through correlation of relevant
logging quantities (e.g. current, voltage, and flicker), time of
occurrence, periodicity
Network Optimization:
• Load logging
• Current logging (with Flexi Set 5 to 3000 A or clamps 1 to 1000 A)
• Capture of current peaks
56
Page 66

Power Quality Logger
PQ Log PC Application Software
PQ Log PC Application Software
PQ Log software for Windows® PCs is the application for use with the
1744/1743 Power Quality Logger. The data are also available in ASCII format.
Programs available for setting up the Logger:
• Interval length
• Memory model
• Voltage input range, nominal voltage, nominal current
• Response time for min, max values
• Connection type (P-N, P-P)
• Thresholds for event detection, interruptions
Setup:
• Internal clock (date/time)
• Define 1744/1743 Power Quality Logger designation
• Parameters for data export
• Software updates
Analysis:
• ASCII data export
• Graphical summary of all EN 50160 parameters
• Online test function
57
Page 67

1744/1743
Users Manual
Online Test
The following figure shows the online test display.
Figure 18. Online Test
egb024.bmp
58
Page 68

Power Quality Logger
PQ Log PC Application Software
ASCII Export
The following figure illustrates the ASCII export display:
Figure 19. ASCII Export
egb025.bmp
For special cases, additional evaluations are available:
• Graphic representation of measured data
• Timeplot diagrams
• Application oriented analysis
• Logging value list
• Table of events (UNIPEDE DISDIP)
• Table summary
• Cumulative frequency, harmonics (logging function A only)
• Statistical values (logging function A only)
• All exceeding table (logging function A only)
• Most critical values (logging function A only)
59
Page 69

1744/1743
Users Manual
Timeplot diagram
The following figure shows a typical Timeplot diagram:
Figure 20. Timeplot Diagram
egb026.bmp
60
Page 70

Power Quality Logger
PQ Log PC Application Software
UNIPEDE DISDIP Table
The following figure shows a typical UNIPEDE DISDIP table:
Figure 21. UNIPEDE DISDIP Table
egb027.bmp
61
Page 71

1744/1743
Users Manual
Cumulative Frequency – Harmonics
The following figure shows a typical display of cumulative frequencies for
current and voltage harmonics:
egb028.bmp
Figure 22. Cumulative Frequency – For Voltage and Current Harmonics
62
Page 72

Index
—A—
Anti aliasing filter, 28
Apparent Power, 37
—C—
Completing the Logging, 26
Connecting the clip on probes, 14
Connection modes, 27
Connections for Medium Voltage
Networks, 21
Crest Factor, 37
Current, 37
Current Harmonics, 33
—D—
Disposal, 45
—E—
Energy, 40
Evaluation, 27
Extreme values, 29
—F—
Flicker, 35
Frequency, 36
—I—
Logging Configurations, 10
Logging input for voltages, 9
Logging segments, 11
Logging with two voltage converters and
two current transformers, 24
—M—
Maximum nominal voltages, 6, 16
Memory model, 11
Methods of Logging, 27
—N—
Nominal Voltages, 27
—P—
Phase-N, 11
Phase-Phase, 11
Power factor, 37, 39
—R—
Reactive Power, 37
—S—
Sampling rate, 28
signaling voltages, 11
Signaling voltages, interharmonics, 33
—T—
Installation at the measuring site, 17
Interharmonics, 11
Interval length, 11
I
, 37
peak
—L—
Limit values for events, 11
Lithium Battery, 45
THD I, 35
THD V, 34
—U—
Unbalance, 36
User Interface, 1
—V—
Voltage dips/swells, 32
63
Page 73

1744/1743
Users Manual
Voltage Harmonics, 32
Voltage interruptions, 31
Voltage variations, 28
Test Equipment Depot - 800.517.8431 - 99 Washington Street Melrose, MA 02176
64
FAX 781.665.0780 - TestEquipmentDepot.com
 Loading...