

Page 1

1735
Power Logger
®
Users Manual
March 2006 Rev. 2, 3/10
© 2006-2010 Fluke Corporation, All rights reserved. Specifications are subject to change without notice. All product
names are trademarks of their respective companies.
Page 2

LIMITED WARRANTY AND LIMITATION OF LIABILITY
Each Fluke product is warranted to be free from defects in material and workmanship
under normal use and service. The warranty period is two years and begins on the date of
shipment. Parts, product repairs, and services are warranted for 90 days. This warranty
extends only to the original buyer or end-user customer of a Fluke authorized reseller,
and does not apply to fuses, disposable batteries, or to any product which, in Fluke's
opinion, has been misused, altered, neglected, contaminated, or damaged by accident or
abnormal conditions of operation or handling. Fluke warrants that software will operate
substantially in accordance with its functional specifications for 90 days and that it has
been properly recorded on non-defective media. Fluke does not warrant that software will
be error free or operate without interruption.
Fluke authorized resellers shall extend this warranty on new and unused products to enduser customers only but have no authority to extend a greater or different warranty on
behalf of Fluke. Warranty support is available only if product is purchased through a Fluke
authorized sales outlet or Buyer has paid the applicable international price. Fluke reserves the right to invoice Buyer for importation costs of repair/replacement parts when
product purchased in one country is submitted for repair in another country.
Fluke's warranty obligation is limited, at Fluke's option, to refund of the purchase price,
free of charge repair, or replacement of a defective product which is returned to a Fluke
authorized service center within the warranty period.
To obtain warranty service, contact your nearest Fluke authorized service center to obtain
return authorization information, then send the product to that service center, with a description of the difficulty, postage and insurance prepaid (FOB Destination). Fluke assumes no risk for damage in transit. Following warranty repair, the product will be returned to Buyer, transportation prepaid (FOB Destination). If Fluke determines that failure
was caused by neglect, misuse, contamination, alteration, accident, or abnormal condition
of operation or handling, including overvoltage failures caused by use outside the product’s specified rating, or normal wear and tear of mechanical components, Fluke will provide an estimate of repair costs and obtain authorization before commencing the work.
Following repair, the product will be returned to the Buyer transportation prepaid and the
Buyer will be billed for the repair and return transportation charges (FOB Shipping Point).
THIS WARRANTY IS BUYER'S SOLE AND EXCLUSIVE REMEDY AND IS IN LIEU OF
ALL OTHER WARRANTIES, EXPRESS OR IMPLIED, INCLUDING BUT NOT LIMITED
TO ANY IMPLIED WARRANTY OF MERCHANTABILITY OR FITNESS FOR A PARTICULAR PURPOSE. FLUKE SHALL NOT BE LIABLE FOR ANY SPECIAL, INDIRECT,
INCIDENTAL OR CONSEQUENTIAL DAMAGES OR LOSSES, INCLUDING LOSS OF
DATA, ARISING FROM ANY CAUSE OR THEORY.
Since some countries or states do not allow limitation of the term of an implied warranty,
or exclusion or limitation of incidental or consequential damages, the limitations and exclusions of this warranty may not apply to every buyer. If any provision of this Warranty is
held invalid or unenforceable by a court or other decision-maker of competent jurisdiction,
such holding will not affect the validity or enforceability of any other provision.
Fluke Corporation
P.O. Box 9090
Everett, WA 98206-9090
U.S.A.
Fluke Europe B.V.
P.O. Box 1186
5602 BD Eindhoven
The Netherlands
11/99
Page 3

Table of Contents
Title Page
Introduction .......................................................................................... 1
Contacting Fluke................................................................................... 1
Symbols ................................................................................................ 2
Safety Instructions ................................................................................ 3
Standard and Optional Accessories....................................................... 5
Software and Information CD-ROM .................................................... 7
Instrument Familiarity .......................................................................... 7
Current Probes .................................................................................. 7
Control Elements, Display................................................................ 7
Display Symbols........................................................................... 8
Description of the Control Elements............................................. 9
Using the SAVE and CURSOR Keys........................................... 10
Connectors .................................................................................... 11
USB Interface ............................................................................... 11
Installing the USB Driver ............................................................. 11
Basic Adjustments (Menu)................................................................ 12
Menu Structuring .......................................................................... 12
Short Overview of the Menu......................................................... 13
Charging the Internal Battery................................................................ 14
Basic Operation .................................................................................... 14
Parameter Configuration................................................................... 15
Logging Menu............................................................................... 15
View/Delete Screenshots .............................................................. 17
View Auto Screenshots................................................................. 18
Instrument Setup............................................................................... 19
Current Probes .............................................................................. 19
Voltage Transformers ................................................................... 21
Phase Identification....................................................................... 21
Backlight....................................................................................... 21
Display Contrast ........................................................................... 21
Version & Calibration................................................................... 21
Power Network ................................................................................. 22
Date & Time ..................................................................................... 22
Language .......................................................................................... 22
Measuring Functions............................................................................. 23
i
Page 4

1735
Users Manual
Overview.......................................................................................... 23
Connecting the Power Logger to the Network ................................. 24
Volts / Amps / Hertz......................................................................... 32
Power ............................................................................................... 35
Events............................................................................................... 40
Harmonics ........................................................................................ 42
Scope................................................................................................ 45
Power Log PC Software....................................................................... 46
Installing Power Log Software......................................................... 46
Starting Power Log........................................................................... 46
Using Power Log.............................................................................. 47
Energy Recording with Fluke Power Log ........................................ 49
Recording Power (Demand) with 1735 Power Logger..................... 51
Inside the Logger.................................................................................. 52
Line Power or Battery Mode ............................................................ 52
Replacing the Battery Pack .............................................................. 52
Maintenance ......................................................................................... 54
Cleaning ........................................................................................... 54
Calibration........................................................................................ 54
Storage.............................................................................................. 54
Measurement Theory............................................................................ 55
Waveform......................................................................................... 55
Meter Volts / Amps / Hz .............................................................. 23
Scope............................................................................................ 23
Harmonics .................................................................................... 23
Power............................................................................................ 23
Events........................................................................................... 24
Color Coding Wire Clips.............................................................. 25
Single and Split Phase Connections ............................................. 26
Split Phase.................................................................................... 28
Measurement in a Three-Phase Power Network........................... 29
Logging ........................................................................................ 33
Measurement ................................................................................ 33
Save.............................................................................................. 34
Logging Function ......................................................................... 34
Measurement ................................................................................ 36
Three-Phase Power Theory .......................................................... 37
Save.............................................................................................. 38
Logging Function ......................................................................... 39
Logging ........................................................................................ 40
Save.............................................................................................. 41
Logged Events.............................................................................. 41
Measurement ................................................................................ 42
Logger Function ........................................................................... 43
Logging ........................................................................................ 44
Save.............................................................................................. 44
Measurement ................................................................................ 45
Save.............................................................................................. 46
ii
Page 5

Contents (continued)
Power Measurements........................................................................ 55
Total Harmonic Distortion................................................................ 57
Specifications........................................................................................ 57
General.............................................................................................. 57
Temperature Ranges ......................................................................... 57
EMC ................................................................................................. 58
Safety................................................................................................ 58
V-RMS Wye Measurement............................................................... 58
V-RMS Delta Measurement.............................................................. 59
A-RMS Measurement....................................................................... 59
Power Measurement (P, S, D)........................................................... 60
PF (Power Factor)............................................................................. 60
Frequency Measurement................................................................... 60
Harmonics......................................................................................... 61
Events ............................................................................................... 61
Unbalance ......................................................................................... 62
Recorded Values................................................................................... 63
iii
Page 6

1735
Users Manual
iv v
Page 7

List of Tables
Table Title Page
1. Symbols ................................................................................................ 2
2. Standard Equipment.............................................................................. 5
3. Optional Accessories ............................................................................ 6
4. Maximum Possible Measuring Periods................................................. 51
Page 8

1735
Users Manual
vi
Page 9

List of Figures
Figure Title Page
1. Display Symbols................................................................................... 8
2. Control Elements .................................................................................. 9
3. Power Logger Connectors..................................................................... 11
4. Menu Overview .................................................................................... 13
5. Using the Optional Mini Clamps .......................................................... 25
6. Single Phase Connections..................................................................... 27
7. Split Phase Connections........................................................................ 29
8. Three-Phase Wye Connections ............................................................. 30
9. Three-Phase Delta Δ Connections-Blondel (Aron, Two-Element
Delta) .................................................................................................... 31
10. Three-Phase Delta Δ Connections-Blondel (Aron, Three-Element
Delta) .................................................................................................... 32
11. Fluke Power Log Screen....................................................................... 47
12. Fluke Power Log Displaying Three Phases of Voltage
and Current ........................................................................................... 48
13. Replacing the Battery Pack................................................................... 53
vii
Page 10

1735
Users Manual
viii
Page 11

1735 Power Logger
Introduction
With this 1735 Power Logger (referred to throughout this manual as “Logger”)
you can conduct voltage, current and power studies for determining existing
loads. The Logger is also a general-purpose power quality investigative tool
that reveals the quality of voltage supply at any point in a distribution network.
The Logger was developed in particular for plant electricians and electrical
installers, who have an important role in investigating and solving disturbances
of the power distribution system.
Your 1735 Power Logger is equipped with Flash Technology. This enables
you to perform firmware updates. Please use the Windows Flash Update utility
to do this. You will find it on the supplied 1735 CD-ROM. If there is a
firmware update, it can be found on the Fluke website: www.fluke.com
Contacting Fluke
.
To contact Fluke, call one of the following telephone numbers:
• Technical Support USA: 1-800-44-FLUKE (1-800-443-5853)
• Calibration/Repair USA: 1-888-99-FLUKE (1-888-993-5853)
• Canada: 1-800-36-FLUKE (1-800-363-5853)
• Europe: +31 402-675-200
• Japan: +81-3-3434-0181
• Singapore: +65-738-5655
• Anywhere in the world: +1-425-446-5500
Or, visit Fluke's website at www.fluke.com
To register your product, visit http://register.fluke.com
To view, print, or download the latest manual supplement, visit
http://us.fluke.com/usen/support/manuals
1
.
.
.
Page 12

1735
Users Manual
Address correspondence to:
Fluke Corporation Fluke Europe B.V.
P.O. Box 9090, P.O. Box 1186,
Everett, WA 98206-9090 5602 BD Eindhoven
U.S.A. The Netherlands
Symbols
Table 1 lists the symbols used on the instrument and/or in this manual.
Table 1. Symbols
Symbol Description
W Important information. See manual.
X Hazardous voltage.
J Earth ground.
T
Double insulation.
F DC (Direct Current).
P Conforms to requirements of European Union.
)
~
Canadian Standards Association is the certified body used
for testing compliance to safety standards.
Do not dispose of this product as unsorted municipal waste.
Go to Fluke’s website for recycling information.
; Conforms to relevant Australian Standards.
-
CAT III
2
Do not apply around or remove from HAZARDOUS LIVE
conductors.
IEC Overvoltage Category III
CAT III equipment is designed to protect against transients
in installations, such as distribution panels, feeders and
short branch circuits, and lighting systems in large buildings.
Page 13

Power Logger
Safety Instructions
Safety Instructions
Please read this section carefully. It will make you familiar with the most
important safety instructions for handling your Logger. In this manual, a
Warning identifies conditions and actions that pose hazard(s) to the user. A
Caution identifies conditions and actions that may damage the Calibrator or
the test instruments.
XW Warnings
To prevent possible electrical shock or personal injury,
follow these guidelines:
• The Logger must only be used and handled by
qualified personnel.
• Adhere to local and national safety codes.
Individual protective equipment must be used to
prevent shock injury where hazardous live
conductors are exposed.
• To avoid electrical shock, remove all test leads
from the Logger before you open the battery door.
Open the Logger only to replace the rechargeable
battery.
• Maintenance work must be done only by qualified
service personnel.
• Use only specified current probes. If you use
flexible current probes, wear suitable protective
gloves or work on de-energized conductors.
• Protect the Logger against dampness, wetness and
humidity.
• To prevent electrical shock, always connect
voltage and current test leads to the Logger before
connecting to the load.
3
Page 14

1735
Users Manual
• The plug and socket connection for the voltage
lead set is designed for 600 V CAT III. The
maximum voltage between outer conductor and
earth potential must not exceed 600 V. With multiphase connections, phase-phase voltage may not
exceed 800 V.
• Use only the provided original or specified
accessories. This includes the ac power adapter.
Adequate qualifications are the following:
• Trained and authorized to switch on/off, ground (earth) and mark
power distribution circuits and devices in accordance with the safety
standards of electrical engineering.
• Training or instruction in accordance with the standards of the safety
engineering in maintenance and use of appropriate safety equipment.
• Training in first aid.
4
Page 15

Power Logger
Standard and Optional Accessories
Standard and Optional Accessories
The standard equipment for the Power Logger is listed in Table 2. Optional
accessories are listed in Table 3.
Table 2. Standard Equipment
Equipment Model or Part
Number
Power Logger Fluke-1735
Battery Charger, BC1735, 115V/230V 50/60 Hz 2584895
International AC Power Plug Set For Battery Charger 2441372
FS17XX, Shielded 4-Phase Flexi Set for Models 1735,
1743, 1744, 1745 (15A/150A/1500A)
VL1735/45,BANANA 4-PHASE VOLTAGE LEAD SET
FOR FLUKE-1735/45 3276205
Dolphin Clip, Black 2540726
WC17XX, COLOR CODE WIRE CLIPS 2637481
Rechargeable Battery,NiMH 7.2V 2625171
Soft Case 1642656
CD-ROM,FLUKE-1735 MANUAL AND SOFTWARE
Includes: manuals, PC application software, firmware
upgrade utility (English, French, German, Italian,
Spanish, Portuguese, Simplified Chinese, Czech,
Polish, Russian, Turkish, Swedish)
1735 Getting Started Manual 3611908
USB 2.0 Connection Cable, Mini USB B5 Male – USB
A Male 3671726
2637462
2583487
5
Page 16

1735
Users Manual
Table 3. Optional Accessories
Description
I1A/10A CLAMP PQ4, 4-PHASE 1A/10A MINI
CURRENT CLAMP SET FOR PQ
I5A/50A CLAMP PQ3, 3-PHASE 5A/50A MINI
CURRENT CLAMP SET FOR PQ
I5A/50A CLAMP PQ4, 4-PHASE 5A/50A MINI
CURRENT CLAMP SET FOR PQ
I20/200A CLAMP PQ3, 3-PHASE 20A/200A MINI
CURRENT CLAMP SET FOR PQ
I20/200A CLAMP PQ4, 4-PHASE 20A/200A MINI
CURRENT CLAMP SET FOR PQ
3000/6000A FLEX 4,3000A/6000A 36-INCH FLEXI
PROBE 4 PHASE
I1A/10A CLAMP PQ3, 3-PHASE 1A/10A MINI
CURRENT CLAMP SET FOR PQ
1-PHASE 1A/10A MINI CURRENT CLAMP SET FOR
PQ
1-PHASE 5A/50A MINI CURRENT CLAMP SET FOR
PQ
Model or Part
Number
3024424
3024436
3024449
3024451
3024460
3024472
3024413
3345753
3345766
SHIELDED 1-PHASE FLEXI SET FOR MODELS 1735,
1743, 1744, 1745
FS17XX IP65, IP65 RATED 4-PHASE FLEXI SET FOR
MODELS 1735, 1743, 1744, 1745
3000/6000A FLEX 4,3000A/6000A 36-INCH FLEXI
PROBE 4 PHASE
3345748
3474696
3024472
Inspect the contents of the shipping box for completeness and damage. If there
is any damage, report the damage to your shipper.
6
Page 17

Power Logger
Software and Information CD-ROM
Software and Information CD-ROM
The CD-ROM delivered with the Logger contains additional, important
information. This includes:
• International manuals
• Power Log PC application software
• 1735 Upgrade Utility for future Logger upgrades
• USB Drivers
Instrument Familiarity
Note
Please charge the battery before the first operation or use the
provided charging adapter at the beginning.
Current Probes
Fluke flexi-sets or current clamps are automatically detected by the Logger
when the Logger is turned on. If you change current probes, turn the Logger
off and on again so the Logger can recognize the new probe.
Control Elements, Display
This section familiarizes you with the display and the controls.
Turn the Logger on by turning the rotary switch in clockwise direction. The
display shows the selected measuring function.
7
Page 18
1735
Users Manual
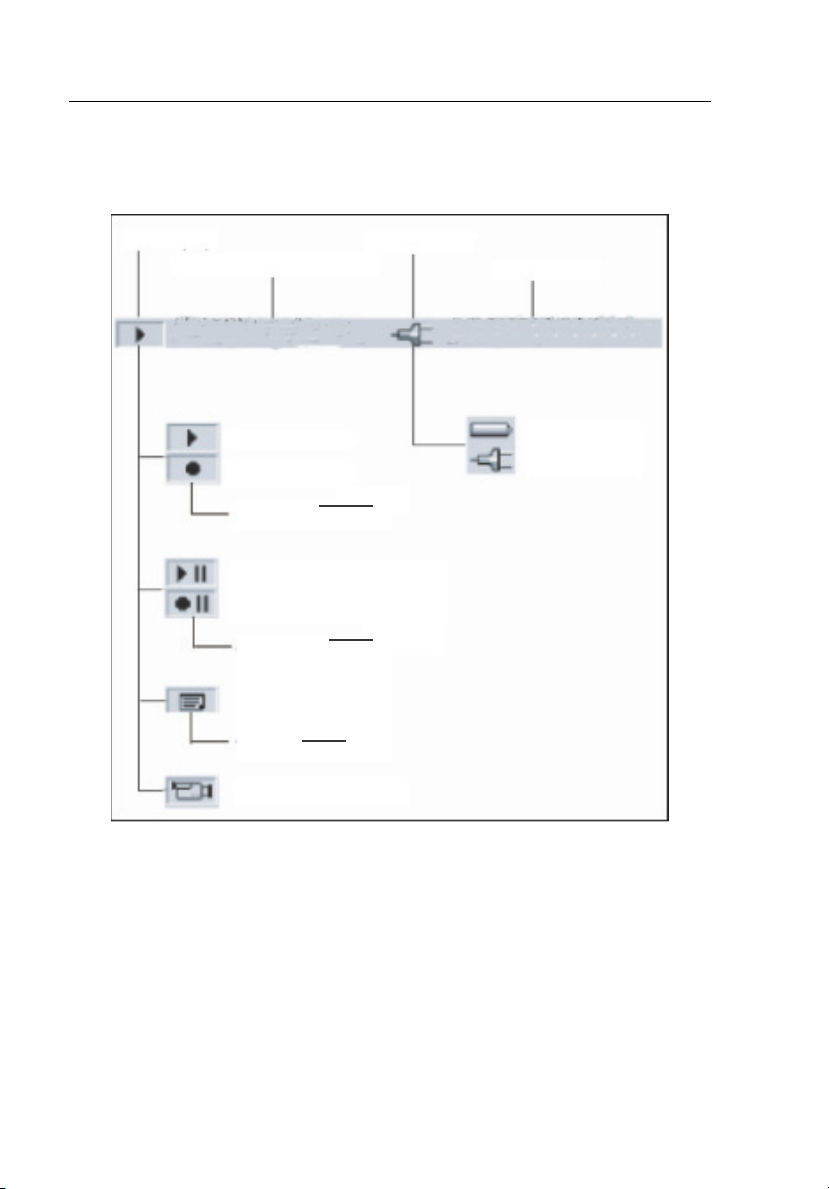
Display Symbols
Figure 1 shows the display symbols the Power Logger uses.
Status Display
Current Measuring
Function
Volts/Amps/Hertz
Measuring Mode
Memory Mode
Switch with:
Pause in Measuring Mode
Pause in Memory Mode
Activate with:
Menu
ON?OFF
Display Shared data
Record
Measure
Hold
Run
Menu
Esc
Figure 1. Display Symbols
Power Supply
Date/Time
2001-03-21, 20:50
Battery
Mains operation
edx004.eps
8
Page 19
Power Logger
Instrument Familiarity
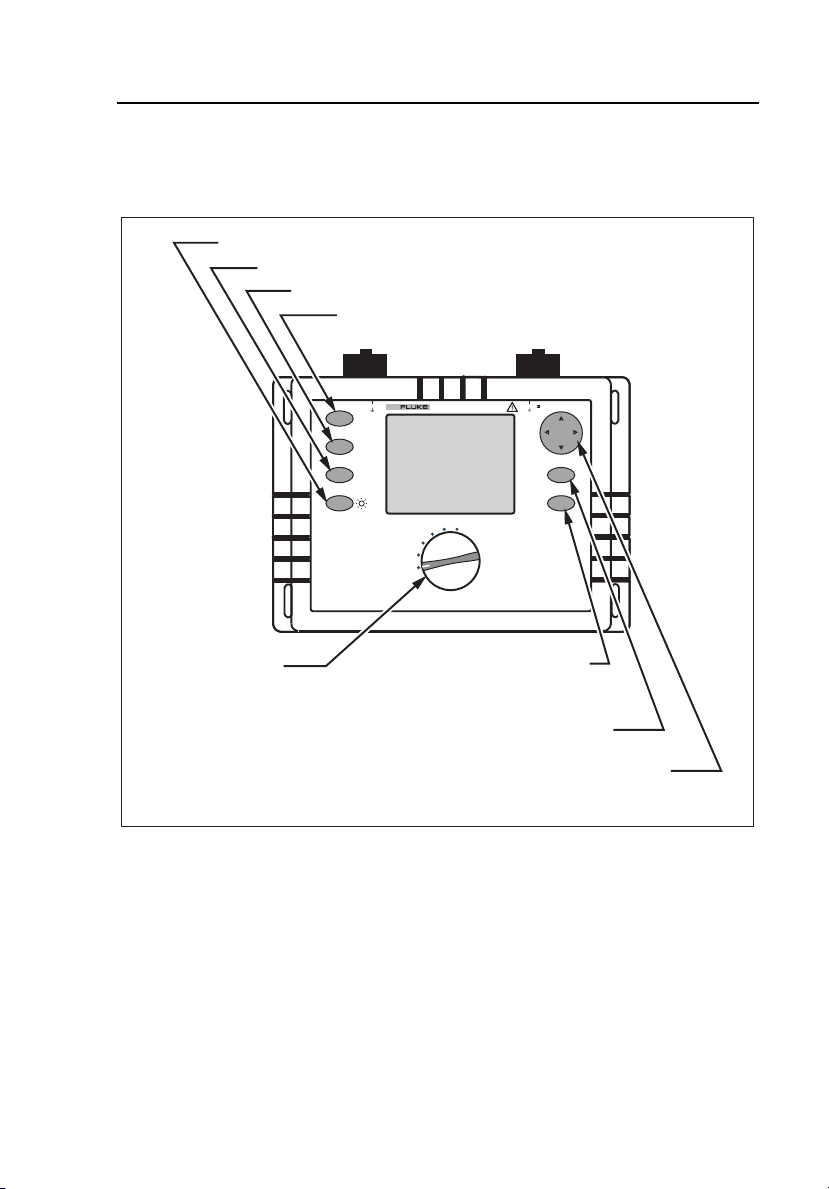
Description of the Control Elements
Figure 2 indicates the control elements of the Power Logger.
Activation - Adjustment of the background lighting
Activating the appropriate cursor function
Switching between measuring and recording function
Stopping and continuing the measurement
Rotary switch for
switching On and for
selecting different
MAX 30V
CURRENT INPUT
HOLD
RUN
RECORD
MEASURE
CURSOR
HARMONICS
SCOPE
METER
V A Hz
OFF
1735
POWER
POWER LOGGER
EVENTS
Call up the menu (at anytime)
or go back to a higher menu level
without saving changes
600V CAT
ENTER
SCREEN
SAVE
ESC
MENU
VOLTAGE INPUT
measuring functions
Save a screen shot or to acknowledge
changes of the menu
Cursor Control Key, Principal function and operation are
described below. For details see its functional description
Figure 2. Control Elements
Note
The symbols occurring in this operating instruction 21 and 4 5
correspond to the respective directions of the cursor control keys.
edx005.eps
9
Page 20

1735
Users Manual
Using the SAVE and CURSOR Keys
Pressing the ENTER/SAVE SCREEN key saves the current picture as a
screenshot.
Since it is a screenshot, a saved picture cannot be modified or edited with the
cursor.
The cursor control keys (4 5 2 1) are activated once you are in HOLD
mode. The CURSOR key activates HOLD mode and displays a cursor (vertical
line) for detailed analysis of measurement results.
Pressing the CURSOR key starts cursor mode. Press 4 and 5 to move the
cursor and read the current values on the display.
Pressing the CURSOR key in the view logged data mode sets a reference
cursor.
Screenshots can also be taken in cursor mode.
Pressing ESC exits cursor mode and returns to the hold mode. From HOLD
mode, different parameters may be selected and Cursor mode may be reentered by pressing CURSOR.
10
Page 21
Power Logger
Instrument Familiarity
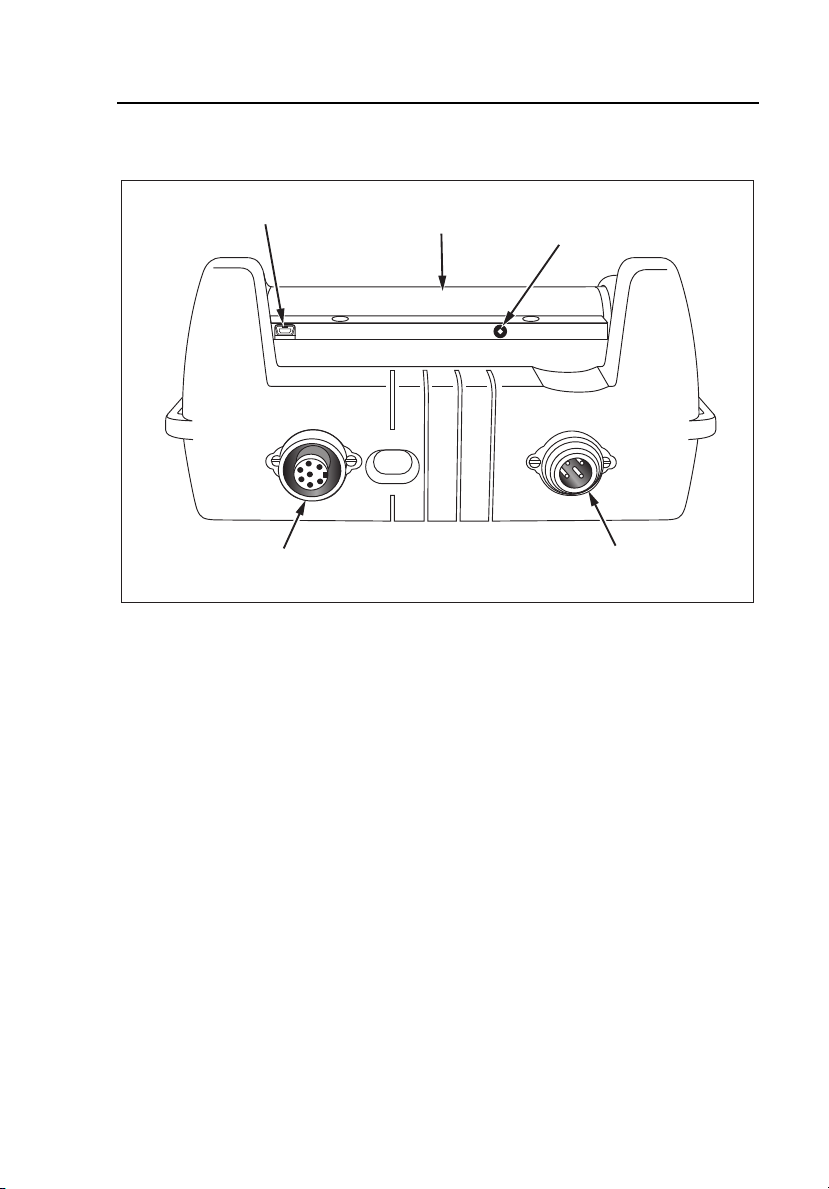
Connectors
USB Interface
Fluke flex inputs
Figure 3. Power Logger Connectors
Battery
compartment
AC - adapter
Voltage inputs for
L1, L2, L3, N
edx006.eps
USB Interface
The USB interface is used for communication with an external PC. Use Power
Log software (included) to download and analyze logged data. This interface is
also used for updating firmware using the 1735 Upgrade Utility. Refer to
“Installing the USB Driver”.
Installing the USB Driver
USB drivers are located on the CD-ROM that came with the instrument. Note
that some drivers will automatically load twice. See instrument manuals for
more details.
To load the USB driver:
1. Run the 1735 Product CD-ROM on a PC.
2. Click on USB Driver Installation.
11
Page 22

1735
Users Manual
3. Either select the default directory by clicking on Install, or click Change
Install Location… and change the file path to a different location.
4. Follow the on screen instructions.
5. The necessary files are copied to the PC.
6. Restart the PC to conclude driver installation.
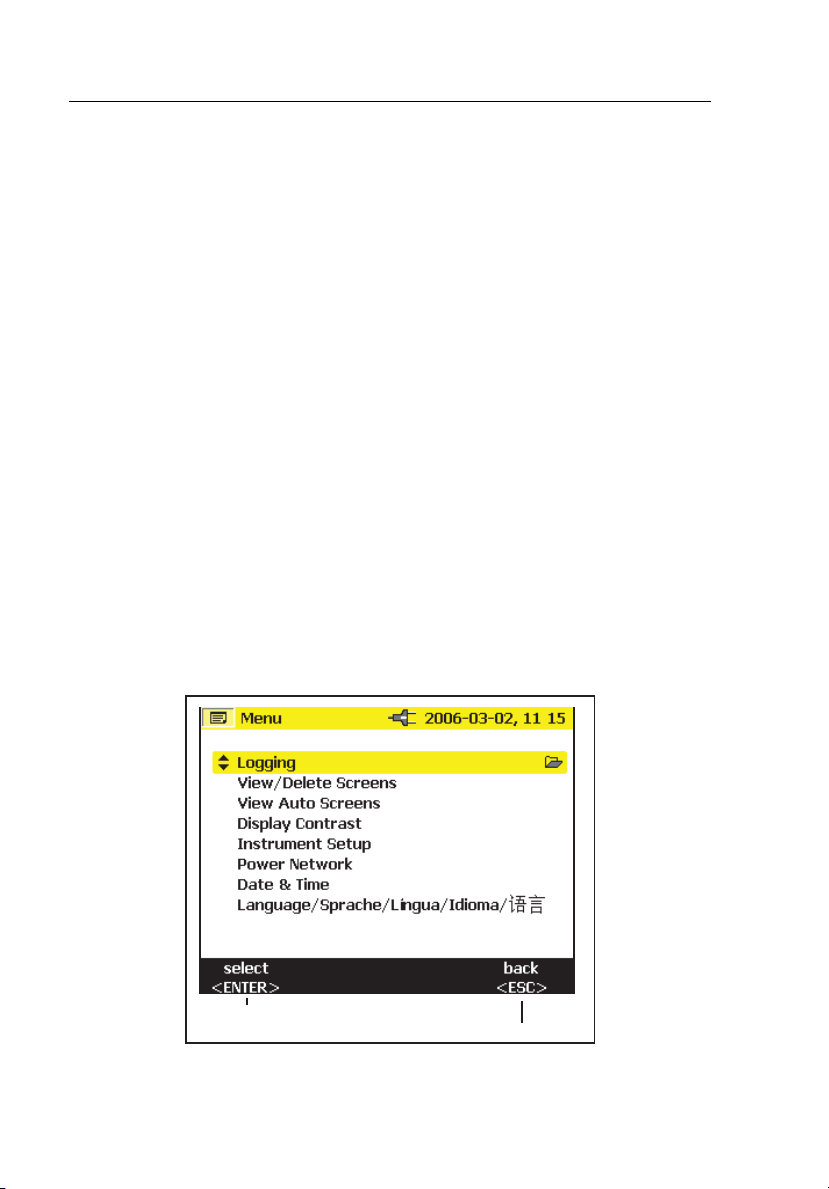
Basic Adjustments (Menu)
Menu Structuring
You make all basic adjustments of the Logger in the main menu. You can call
this at any time with the key M. If you push it again you return to the
previous display.
12
Page 23
Power Logger
Instrument Familiarity
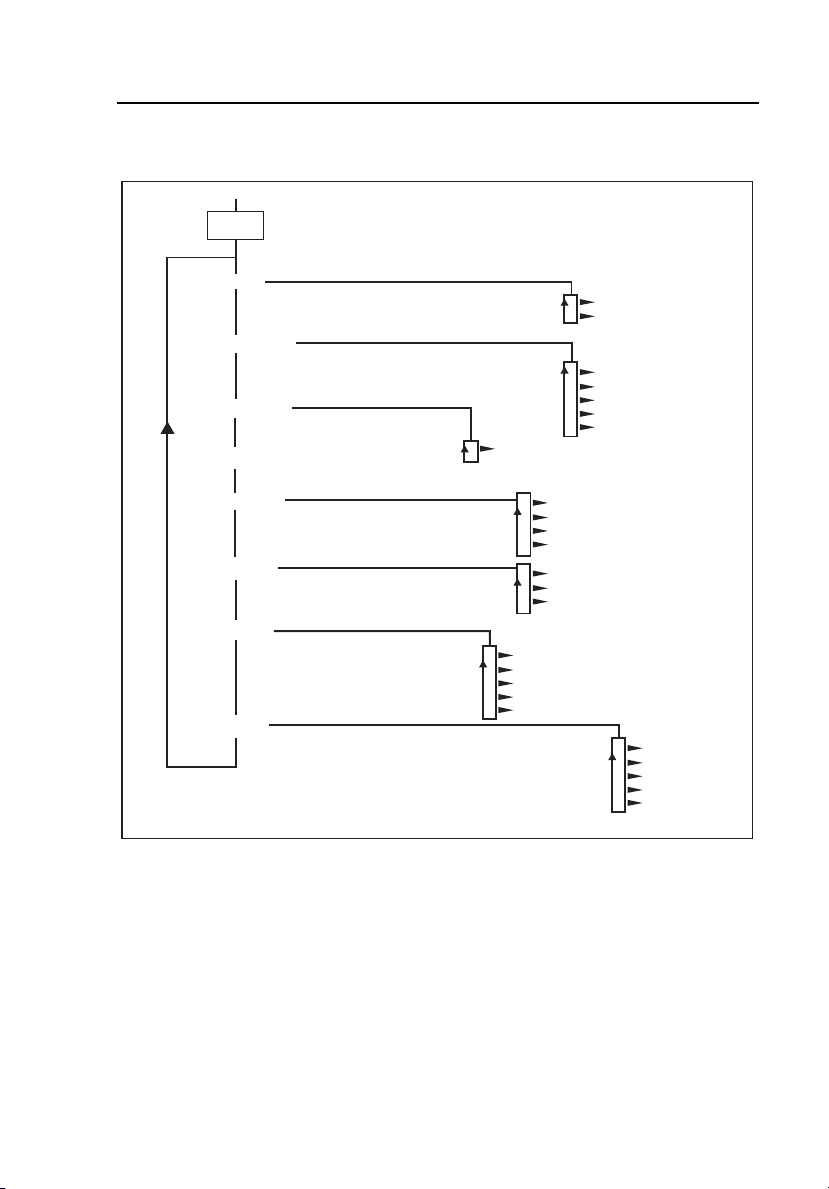
Short Overview of the Menu
MENU
Logging
Averaging Time
Event Thresholds
View/Delete Screens
Memory loc. 10.10
Memory loc. 11.20
View Auto Screens
Display Contrast
Memory loc. 01..06
Memory loc. 21.30
Memory loc. 31.40
Memory loc. 41.50
Instrument Setup
Power Network
Date / Time
Language
Ye a r
Month
Day
Hour
Minute
Figure 4. Menu Overview
Current Probes
Voltage Transformers
Backlight
Version & Calibration
Power Type
Nominal Voltage
Frequency
English
Deutsch
Français
Portuguese
Chinese
edx007.eps
13
Page 24
1735
Users Manual
Charging the Internal Battery
Before you use the Logger, charge the internal battery as follows:
1. Switch the 1735 Battery Charger to either 115V or 230V as
appropriate.
2. With the Logger power off, attach the BC1735 Battery Charger to a
power outlet and then to the Logger.
3. Charge the Logger for 5 hours before using it for the first time.
4. On subsequent use, turn the Logger power on before you connect the
BC1735 Battery Charger.
This helps ensure that the fast charge mode is activated. If the Logger
does not turn on due to a discharged battery, recharge the battery for 5
hours with the Logger power off as described in steps 2 and 3 above.
Basic Operation
The following examples show how to select parameters in the menu.
• Entering the main menu: M
• Selecting menu options with the cursor control keys: 2 1
<Enter>go to marked submenu
<ESC> back to the previous menu level
14
edx008.eps
Page 25
Power Logger
Basic Operation
Changing parameters:
• The displayed parameters can be modified with the cursor control
keys (in the available preset values).
• If values are not preset you can modify them by using the cursor
control keys. With 4 5 you can select the decimal place and with
2 1 you can modify the number.
Note
Selected parameters are stored in the memory with Enter. With ESC
the adjusted value can be rejected at any time.
Parameter Configuration
Logging Menu
If you call the logging menu, then you can select between two further
submenus: Menu for adjusting the averaging time and for adjusting the event
threshold in recording adjustments.
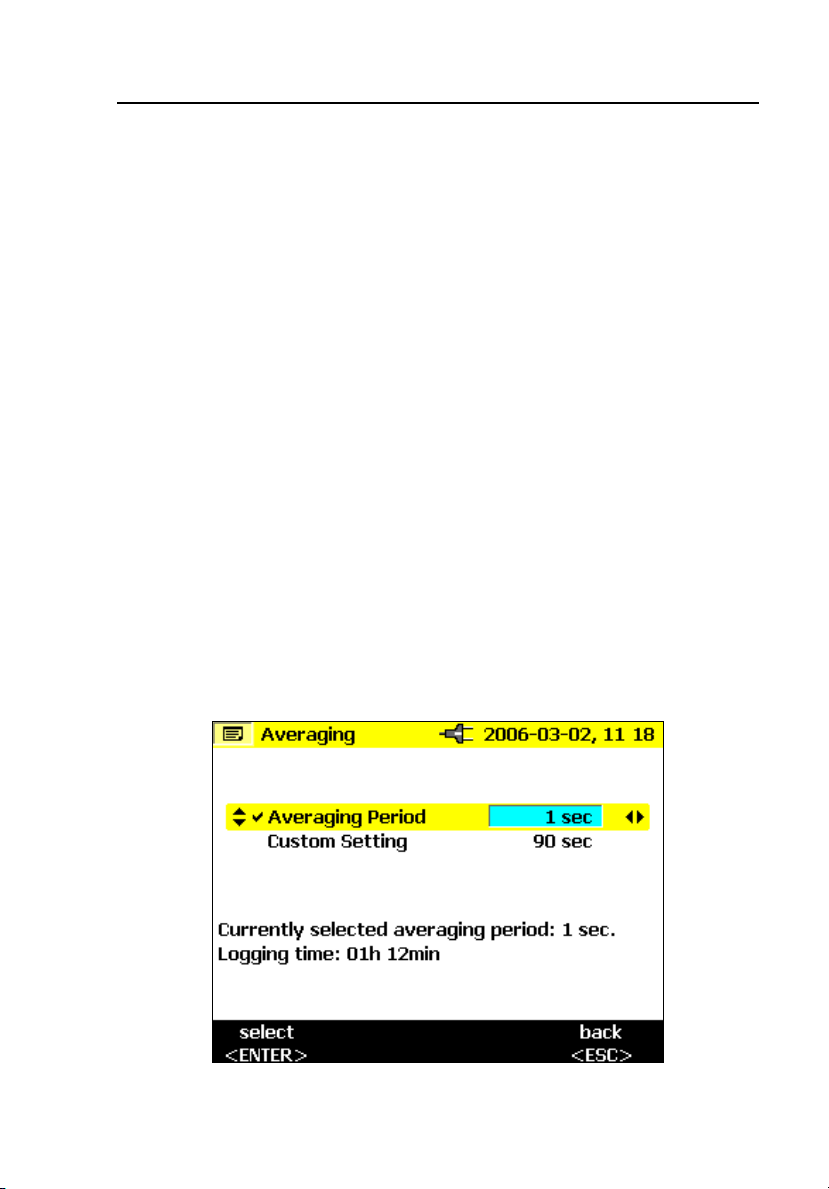
In the menu Averaging you select the time over which the data are to be
averaged. You can also select these values from the predefined values for
averaging time. As you change the averaging time, you will see on the display
the resulting logging time available for each averaging interval.
edx009.bmp
15
Page 26

1735
Users Manual
With Custom Setting you can choose any averaging time value. Depending on
the selected averaging time, maximum available recording time is indicated in
the display at the same time. Up to 4,320 averaging intervals can be recorded
with the record function.
By selecting the menu Event Thresholds you can select the threshold voltage at
which the recording is to be started (see also “Harmonics”).
16
edx010.bmp
Page 27

Power Logger
Basic Operation
View/Delete Screenshots
Select one of the saved screenshots. Press ENTER to view it. All screenshots
include the date and time and the measuring mode, in which they were saved.
Each page lists 10 screens.
Use the 4 5 to change the page.
edx011.bmp
17
Page 28
1735
Users Manual
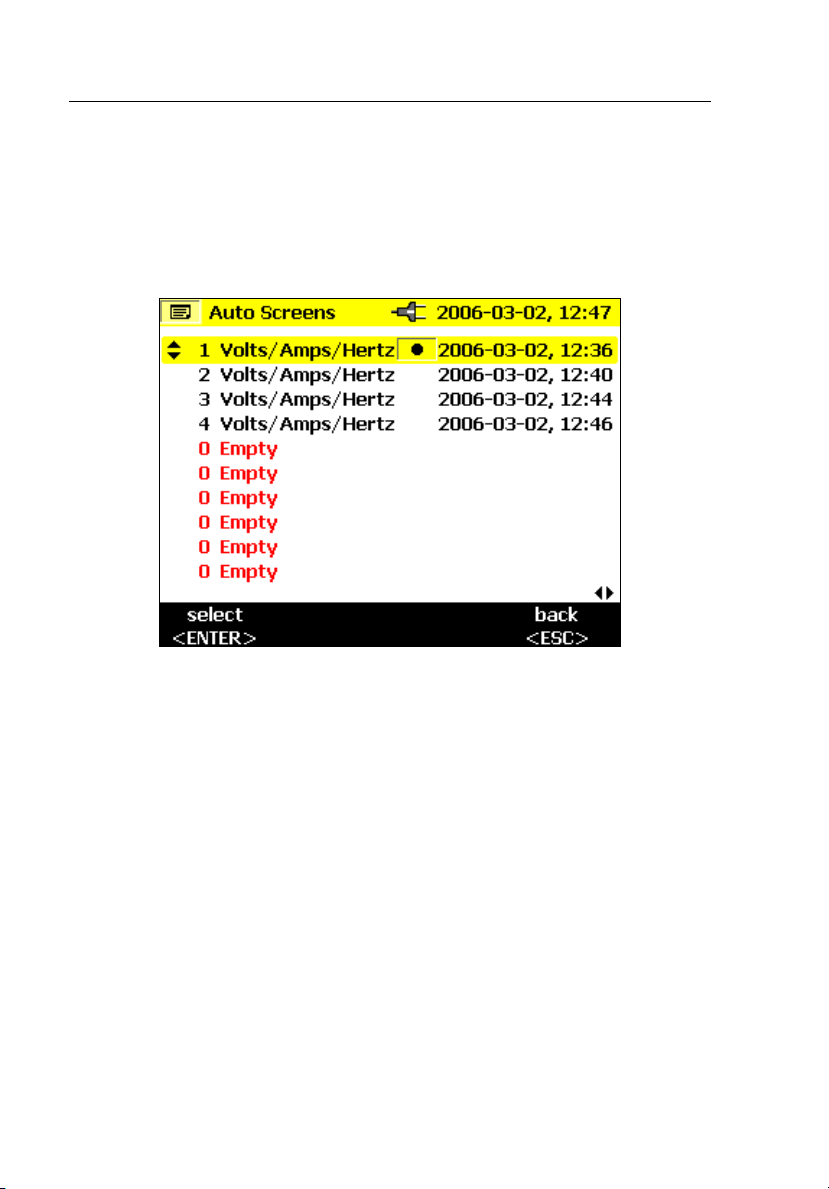
View Auto Screenshots
With this menu item, you can view the screenshots of a recording session,
which have been automatically saved in the Save mode. 6 screenshots are
available (01 to 06).
Select one of the pictures with the CURSOR key and press ENTER to view it.
edx012.bmp
Note
Saved Auto Screenshots always show the currently displayed
parameters.
Example: If you selected phase L2 in the Volt/Ampere/Hertz function and the
recording reaches the margin of the picture, a screenshot of the current picture,
i.e., phase L2, is saved.
18
Page 29

Power Logger
Basic Operation
Instrument Setup
In this menu option you can make adjustments in the submenu for:
• Current Probes
• Voltage Transformers
• Phase Identification
• Backlight
• Version and Calibration
These are described individually in the following:
Current Probes
When a Flexi set or Current Probe is connected to the instrument it is
automatically recognized, but only at power-up. Select the current measuring
range by pressing B. If the secondary of a current transformer is being
measured, it is possible to display the current in terms of the primary by
entering a CT ratio into the current probe setting. The Transformer ratio setting
is only available if one of the MINI clamps is attached. It is not available with
Flexi sets.
edx013.bmp
19
Page 30

1735
Users Manual
Use 21 to select transformer ratio
Use 4 5 to enter the ratio
Use 4 5 to select digit and 21 to adjust the value
edx014.bmp
edx015.bmp
The effect of the ratio is shown at the foot of the display with the primary of
the interposing transformer displayed above the secondary current (input to
probe).
Press ENTER to confirm changes.
20
Page 31

Power Logger
Basic Operation
Voltage Transformers
If you use voltage transformers, select transformation ratio with ENTER. Press
the 4 5 key and enter any transformation ratio with 21.
For transformation ratio details see information on the voltage transformer.
Phase Identification
Here you can choose whether the display shows “A, B, C” for phase
identification or “L1, L2, and L3.” In this manual, phases are called A, B, and
C, but this is equivalent to L1, L2, and L3.
Backlight
This selects whether the backlight deactivates automatically after 30 seconds
or whether you want to always deactivate it manually after you turn it on with
the C key.
Note
If the battery is in use, use the backlight only if necessary in order to
conserve battery life.
Display Contrast
Select the display contrast optimal for you with 21.
Version & Calibration
This menu serves for your information. No adjustments can be made. The
displayed data give information of type and version of the logger firmware.
21
Page 32

1735
Users Manual
Power Network
Select the Power Type (Single phase, split phase, wye, 2-element delta, 3element delta), here. This is also where you select the nominal phase voltage
and frequency.
edx016.bmp
Date & Time
Here you can enter the current date and the current time.
Language
Presents a menu of the provided languages for the Logger displays.
22
Page 33

Power Logger
Measuring Functions
Measuring Functions
Overview
The following information provides an overview of each rotary switch position.
Meter Volts / Amps / Hz
This function displays the voltage and current values at the same time, plus the
frequency and the neutral-conductor current. You can also use this measuring
function to get an overview of these values before you analyze the signal in
detail in the other functions.
Scope
Scope shows the voltages, currents and the ϕ (phase) angle in oscilloscope
representation as well as their instantaneous values at the cursor position. With
this function you get a clear picture of current and voltage waveforms and their
distortions.
Harmonics
Harmonics are sinusoidal voltages with a frequency that corresponds to an
integer multiple of the fundamental (line) frequency.
Every repetitive signal can be split into an infinite number of sine waves of
different frequency and amplitude. The contribution of each of these individual
sine waves is represented in a bar chart up to the 40
the harmonics are (starting from the 2
the better is the power network quality.
nd
harmonic, the 1st is the fundamental)
th
harmonic. The smaller
Power
This function indicates the values of the transferred power. At the same time
you can measure active power, reactive power, apparent power, distortion
power and the appropriate power factor. You can also view the active and
reactive power energy.
23
Page 34

1735
Users Manual
Note
Demand can be logged by setting the averaging period in the Setup
menu to either 10 or 15 minutes, which produces a record of
consecutive averages. This is called block demand.
Events
Events are voltage dips, swells and interruptions. This measuring mode
automatically records all events for later evaluation. The threshold values for
starting the recording are freely configurable in the menu.
Connecting the Power Logger to the Network
XWWarning
• To prevent the risk of electric shock, when
connecting current circuits, the corresponding test
leads must first be connected to the Logger and
then to the load.
• Adhere to local and national safety codes.
Individual protective equipment must be used to
prevent shock injury where hazardous live
conductors are exposed.
• Use only specified current probes. If flexible
current probes are used, wear suitable protective
gloves or work on de-energized conductors.
• To avoid shock or personal injury, keep fingers
behind the tactile barrier, see Figure 5.
Note
When using either flexi-probes or current clamp sets, make sure the
arrow on the current probe points towards the load.
Use the original cables only for connecting the current probes and the voltages
to the Logger. If these are damaged do not use them. Before connecting to the
load, make sure that all plugs are connected correctly to the Logger and locked,
in order to prevent contact with live conductors.
24
Page 35

Power Logger
Single Insulated
Current Carrying
Conductor
Measuring Functions
AC CURRENT CLAMP
600V CAT III
SERIAL NUMBER
i5s
Release
Button
Load Direction
Arrow
Tactile Barrier
Figure 5. Using the Optional Mini Clamps
edx045f.eps
Color Coding Wire Clips
Your Logger includes a set of color clips that you can attach to the test leads.
These help you keep track of which current probe lead and voltage lead
belongs to which phase. The large clips are for the current probe leads and the
small clips are for the voltage leads. Use the plastic rod tool to help you attach
the clips.
25
Page 36

1735
Users Manual
Single and Split Phase Connections
For Single Phase + Neutral, refer to Figure 6 and connect the leads as follows:
Voltage:
Network Test Leads
Line A (L1)
Line (same) B (L2)
Line (same) C (L3)
N N
Current:
Network Test Leads
L1 A (L1)
Not connected B (L2)
Not connected C (L3)
N N
26
Page 37

Power Logger
L1
L1
L2 L3 N
L
N
N
L2
L3
Figure 6. Single Phase Connections
Measuring Functions
T
U
P
N
I
E
G
A
T
L
O
V
T
A
C
V
0
0
6
R
E
G
G
O
L
R
E
OW
P
5
3
7
1
R
E
T
N
E
E
AV
N
S
E
E
R
C
V
30
X
A
M
T
U
P
N
I
D
L
T
N
O
E
H
R
N
R
U
U
R
C
D
R
O
R
C
U
E
S
R
A
E
M
S
C
S
E
U
N
E
E
R
O
S
R
U
C
M
S
T
N
E
V
E
R
E
W
O
P
S
IC
N
O
M
R
A
E
H
P
O
C
S
R
E
T
z
H
E
M
A
V
F
F
O
edx040.eps
27
Page 38

1735
Users Manual
Split Phase
For Split Phase, the Neutral is center-tapped and there are two hot legs which
correspond to A and B test Leads. AB is the voltage from phase to phase,
which is twice that of each individual hot leg. Refer to Figure 7 and connect
the leads as follows:
Voltage:
Network Test Leads
Line 1 A (L1)
Line 2 B (L2)
Line 1 C (L3)
N N
Current:
Network Test Leads
A (L1) A (L1)
B (L2) Line 1 B (L2)
Not connected Neutral C(L3)
N N
28
Page 39

Power Logger
L1
L1
L2 L3 N
L1
L2
N
L2
N
L3
Figure 7. Split Phase Connections
Measuring Functions
T
U
P
N
I
E
G
A
T
L
O
V
T
A
C
0V
0
6
R
E
G
G
O
L
R
E
OW
P
5
3
7
1
R
E
T
N
E
E
V
N
SA
E
E
R
C
V
30
X
A
M
T
U
P
N
I
D
L
T
N
O
E
H
R
N
R
U
RU
C
D
R
O
R
C
U
E
S
R
A
E
M
S
C
S
E
U
N
E
E
R
O
S
R
U
C
M
S
T
N
E
V
E
R
E
W
O
P
S
C
I
N
O
M
R
A
E
H
P
O
C
S
R
E
T
z
H
E
M
A
V
F
F
O
edx041.eps
Measurement in a Three-Phase Power Network
In order to measure all phases in the three-phase power network with the
Logger you attach your Logger to the measuring power network according to
the following figures.
See ‘Power’ for further details.
29
Page 40

1735
Users Manual
Voltage:
Mains Line Test Leads
A (L1) A (L1)
B (L2) B (L2)
C (L3) C (L3)
N N
Current:
Mains Line Test Leads
A (L1) A (L1)
B (L2) B (L2)
C (L3) C (L3)
N N
30
L1
L2
L3
L1
L1
L2 L3 N
L2
L3
N
N
T
U
P
N
I
E
G
A
T
L
O
V
T
A
C
0V
0
6
R
E
G
G
O
L
R
E
OW
P
5
3
7
1
R
E
T
N
E
E
V
N
SA
E
E
R
C
V
30
X
A
M
T
U
P
N
I
D
L
T
N
O
E
H
R
N
R
U
U
R
C
D
R
O
C
U
E
S
R
A
E
M
S
C
S
E
U
N
E
E
R
R
O
S
R
U
C
M
S
T
N
E
V
E
R
E
W
O
P
S
C
I
N
O
M
R
A
E
H
P
O
C
S
R
E
T
z
H
E
M
A
V
F
F
O
edx042.eps
Figure 8. Three-Phase Wye Connections
Page 41

Power Logger
L1
L1
L2 L3 N
L1
Measuring Functions
L2
L3
L3
L2
T
U
P
N
I
E
G
A
T
L
O
V
T
A
C
0V
0
6
R
E
G
G
O
L
R
E
OW
P
5
3
7
1
R
E
T
N
E
E
V
N
SA
E
E
R
C
V
30
X
A
M
T
U
P
N
I
D
L
T
N
O
E
H
R
N
R
U
RU
C
D
R
O
R
C
U
E
S
R
A
E
N
M
S
C
S
E
U
N
E
E
R
O
S
R
U
C
M
S
T
N
E
V
E
R
E
W
O
P
S
C
I
N
O
M
R
A
E
H
P
O
C
S
R
E
T
z
H
E
M
A
V
F
F
O
edx043.eps
Figure 9. Three-Phase Delta Δ Connections-Blondel (Aron, Two-Element
Delta)
31
Page 42

1735
Users Manual
L1
L1
L2
L1
L2 L3 N
L2
L3
L3
WER LOGGER
O
P
1735
V
0
3
MAX
HOLD
UN
R
CURRENT INPUT
RECORD
N
MEASURE
CURSOR
Figure 10. Three-Phase Delta Δ Connections-Blondel (Aron, Three-
Element Delta)
Volts / Amps / Hertz
Select Meter with the rotary switch.
In this mode you can measure values for each phase (A, B, C) of
• Voltage (V)
GE INPUT
LTA
O
V
T
A
C
V
0
60
ENTER
VE
A
S
SCREEN
ESC
MENU
EVENTS
OWER
P
HARMONICS
SCOPE
Hz
METER
A
V
OFF
edx046f.eps
• Current (I)
• Frequency (F)
• Neutral-conductor current (In)
You can determine and store the values. It is also possible to log the values
with the logging function.
Measurement or calculation of the neutral-conductor current is optional.
32
Page 43

Power Logger
Measuring Functions
Logging
In Logging mode, the following values are recorded for every phase (A, B, C)
• Voltage (V) and
• Current (I) and the value of the
• Frequency (F)
These values can be recorded in the instrument, downloaded and evaluated
with the Fluke Power Log software package
Measurement
If you select this measuring mode you will see the following display:
edx024.bmp
21 Use this switch to get the following values:
- minimum of values
- maximum of values and
4 5 - frequency or neutral-conductor current
With Hold/Run the actual values “freeze” and the measurement is stopped or
started again.
33
Page 44

1735
Users Manual
Save
With Save/Enter you will get a screenshot and thus store the actual picture of
the display in the memory location subsequently shown.
Logging Function
With Record/Measure you can start the logging function or you can get back
into the measuring mode. Before the start, the maximum logging time is
indicated and you can change this value with Esc followed by entering using
the Cursor key.
Changes in the averaging time, cause corresponding changes in the logging
time of the measurement (double averaging time = double logging time).
When the logger graphics reach the screen margin during recording, a picture
of this screen is saved.
The display is then deleted and the recording is continued. Up to 6 auto screens
are saved in the course of a recording. The saved screenshots can be retrieved
via the View Auto Screenshots menu.
Note
Do not forget to operate the Logger with the AC adapter during
logging in order to prevent shutdown caused by low battery.
34
Page 45

Power Logger
Measuring Functions
edx025.bmp
21 Select between the individual phases
4 5
Select between the two representation modes:
- V and I (see fig.)
- V and F
- V and In
Analyzing the measured values of the recorder function:
These values can be recorded in the instrument, downloaded and evaluated
with Fluke Power Log software package.
Power
Select Power with the rotary switch.
In this measuring mode you can get the following values for each phase (A,
B, C):
• Power (P) in W (for each phase and its sum P
• Reactive power (Q) in var (for each phase and its sum Q
• Apparent power (S) in VA (for each phase and its sum S
• Distortion power (D) in VA (for each phase and its sum D
• Power factor (PF) and the average PF for the three phases.
• Cos ϕ and the average cosϕ for each of the three phases.
35
).
tot
).
tot
).
tot
).
tot
Page 46

1735
Users Manual
• Active energy (EP) in kWh.
• Reactive energy (EQ) in kVAR.
Note
When operating in DELTA connected modes, the Logger will only
display the Ptotal, Qtotal, and the related Power Factor.
Measurement
You can determine the instantaneous values and store them. You can also
record the values with the recorder function.
If you select this measurement mode you will get the following display:
edx026.bmp
21 Switch between the individual phases (detailed view: min- max- values
and distorted power and Energy values.
4 5 Switch between the representation modes:
- kW, kVA and PF
- kW, kVA and DPF
- kW, kVA and kVAR
36
Page 47

Power Logger
Measuring Functions
- kW, kVA and kWh
- kW, kVA and kVARh
On pressing 21 the accumulated energy function becomes active, this must
be acknowledged by pressing RUN to activate the accumulation timer.
edx027.bmp
The accumulation time is indicated at the top of the measurement display.
A further press of 21 gives a detail view of the individual phase values.
Capacitor or inductance symbols issue information about capacitive or
inductive reactive power.
With Hold/Run the values displayed at the moment “freeze” and the
measurement is stopped or started again.
Note
In the individual representation of A or B or C, the active and
reactive energy cannot be selected.
Three-Phase Power Theory
By switching the Power Network setting from wye to delta, the voltages and
currents I
When calculating the power, selecting the delta connection will use the twowattmeter method (Blondel or Aron) measuring circuit for the calculation.
, I L3, I
L1
are calculated, measured and displayed.
L2
37
Page 48

1735
Users Manual
The neutral conductor may be connected, however, it does not influence the
measurement even in open state. If no neutral conductor is connected, a
virtual ”metering neutral” is established in the Logger via symmetrization
resistors.
In the Blondel (or Aron) circuit, phase L2 becomes the return line for L1 and
L3 causing the current I
currents I
L1
I L3.
to be obtained as the sum of the two negative
L2
i2 (t) =-[i1(t)+ i3(t)]
In general, the instantaneous total power is:
• Ptot(t)=v1(t) i1(t)+ v2(t) i2(t)+ v3(t) i3(t)
• Ptot(t)= v1(t) i1(t)- v2 [i1(t)+ i3(t)]+ v3(t)i3(t)=
=[v1(t)- v2(t)] i1(t)+[ v3(t)-v2(t)]i3(t)
However, since the voltages between the lines of a poly-phase are measured in
the delta connection, the following formula results for the total power:
Ptot(t)= v12(t) i1(t)+v32 i3(t)
Integration via a period results in:
Ptot= V12 I1 cos (V12, I1) +V32 I3 cos (V32, I3)
Therefore, the total power corresponds to the total power of the Wye
connection. For control purposes, it can be derived from the sum of the powers
P
and P31.
12
Since I
is only calculated as an auxiliary value and is not measured, P23 must
L2
be set to zero (as per definition), because it does not exist in the Aron circuit.
The power factor PF has no physical meaning in the Aron circuit, because one
would compare the current to the voltage between the lines of a poly-phase
system. Reactive and apparent power should be understood as pure computing
values and have no physical meaning.
Invalid measurements are suppressed from the display by the symbol ‘----‘.
The exact formulae for calculating the active power are given in the section
Measurement Theory.
Save
With Save/Enter you will get a screenshot and thus store the actual display in
the memory location shown subsequently.
38
Page 49

Power Logger
Measuring Functions
Logging Function
With Record/Measure you can start the logging (recorder) function or you can
get back into the measuring mode. Before the start, maximum recording time is
indicated and you can change this value with cursor.
Changes in the averaging time, cause corresponding changes in the recording
time of the measurement (double averaging time = double recording time).
When the recorder graphics reach the screen margin during recording, a picture
of this screen is saved.
The display is then deleted and the recording is continued. Up to 6 auto screens
are saved in the course of a recording. The saved screenshots can be retrieved
via the View Auto Screenshots menu.
Note
Do not forget to operate the Logger with the BC 1735 AC Power
Adapter during recording in order to prevent shutdown caused by low
battery.
Active and reactive energy are not shown in the recorder function.
edx028.bmp
21 Switch between the individual phases and
phase totals
4 5 Switch between the representation modes:
39
Page 50

1735
Users Manual
- kW and PF
- W and D (kVA)
- W and S (kVA)
- W and Q (kVAR)
- W and D
Logging
In the Logging (Record) mode, the following values are recorded for every
phase (L1, L2, L3)
• Active power (P)
• Apparent power (S)
• Reactive power (Q)
• Power factor (PF)
• Cos phi (cosϕ)
• Distortion power (D)
• Accumulated values (kWh, kVAh, kVARh)
These values can be recorded in the instrument, downloaded and evaluated
with Fluke Power Log software package.
Events
Select Events with the rotary switch.
This measuring mode records the voltage of every phase (L
of voltage dips, swells or interruptions (recorder function).
This function exclusively works with the recorder function.
Before you start the measurement, select the desired threshold value with
Menu/Esc (under recording adjustments). After the measurement has started
the following message appears on the display.
. . . waiting for events
The Logger is now in the trigger mode. If an event on one of the phases occurs,
the recording is started automatically and lasts for 4 minutes. The MIN and
40
, L2, L3) in cases
1
Page 51

Power Logger
Measuring Functions
MAX values of the half-cycle RMS values are shown as graphs. The
screenshots recorded by this method are saved as individual pictures and can
be viewed later, or the data can be displayed with the Power Log software. A
total of 999 events can be recorded. In the LC display the phase and the
number of recordings are displayed.
edx029.bmp
21 Switch between the individual events (if there is more than one).
This is also possible if the recording has been stopped and you want to
evaluate the stored events.
With Hold/Run you can stop/start the measurement or you can also start a new
measurement.
Save
With Save/Enter you will get a screenshot and thus store the actual display in
the memory location shown.
Logged Events
You can download logged events using Fluke Power Log software package.
The Fluke Power Log software presents the event data in a variety of formats:
• graphs similar to those displayed on the instrument
41
Page 52

1735
Users Manual
• statistical format with number of events, range of duration and range
of voltage
• spreadsheet format with date/time stamp, event type and duration
Harmonics
Select Harmonics with the rotary switch.
In this measuring mode you can determine the Harmonics H1 (fundamental
frequency) to H50 for all phases (L1, L2, L3) of:
• Voltage (V)
• Current (I)
Measurement
When selecting this measuring mode with the rotary switch the harmonics are
immediately and clearly represented on the LC display as follows:
edx030.bmp
21 Switch between the individual phases.
4 5 Switch between V and I.
With Hold/Run the values displayed at the moment “freeze” and the
measurement is stopped or started again. By pressing the CURSOR key, you
will go into Cursor mode, where you can read additional values of the
42
Page 53

Power Logger
Measuring Functions
individual harmonics. With 21 you can change the scale; use 4 5 to select
the individual harmonic from 100 %-50 % to 50 %-25 % or 10 %-5 %.
edx031.bmp
Logger Function
Record/Measure starts the logging function or toggles from logging to
measurement mode, respectively.
edx032.bmp
21 Switching between individual phases
43
Page 54

1735
Users Manual
4 5 Switching between V and I
When the recorder graphics reach the screen margin during recording, a picture
of this screen is saved.
The display is then deleted and the recording is continued. Up to 6 auto screens
are saved in the course of a recording. The saved screenshots can be retrieved
via the View Auto Screenshots menu.
You can exit a measurement with HOLD, however, the measurement cannot be
continued afterwards. In order to evaluate the measurement values of the
recorder function:
Use the Cursor key. Using the cursor control keys, select the respective time
and read the corresponding measurement value.
Logging
In Logging mode, the following values are recorded for every phase (L1, L2,
L3)
• Voltages (V) and
• Currents (I)
• THD V
• THD I
• Values of uneven harmonics from 1-25 for V and I shown as 25 bars,
for example fundamental + 24 harmonics, including even harmonics.
• Frequency
These values can be recorded in the instrument, downloaded and evaluated
with Power Log software package
Save
With Save/Enter you will get a screenshot and thus store the actual display in
the memory location shown subsequently.
44
Page 55

Power Logger
Measuring Functions
Scope
Select Scope with the rotary switch.
In this measuring mode you get a live picture of the waveforms of
• Voltage (V)
• Current (I)
• Angle (ϕ)
for all three phases (L1, L2, L3).
Measurement
If you select the measuring mode with the rotary switch the following figure
appears on the display. The three phase voltages and current values are plotted
for the time of one period.
edx033.bmp
21 Switch between the individual phases or total view of all phases.
4 5 While viewing the individual phases, the cursor can be shifted and the
value at this location is displayed.
In the individual view, the ϕ angle is also shown.
With Hold/Run the momentary values “freeze” and the measurement is
stopped or started again.
45
Page 56

1735
Users Manual
Save
With Save/Enter you will get a screenshot and thus store the actual display in
the memory location shown subsequently.
Note
In this mode the recorder function is not available. The angle (
describes the phase shift between first harmonic active power and
first harmonic reactive power. See formula in the Measurement
Theory section for more details.
ϕ
)
Power Log PC Software
Power Log provides data download, analysis and reporting in one simple to
use package.
Installing Power Log Software
Insert the supplied CD-ROM, the main menu starts automatically (if it doesn’t
double-click on “launch.exe” and execute the program). Please follow the
instructions appearing on the screen (menu):
Power Log is a simple but complete application designed to help the user get
the most from the 1735 Power Logger.
Check www.Fluke.com
for any available new releases.
Starting Power Log
1. Click the Start button.
2. From the start menu, point to programs, point to Fluke Power Log then
click Fluke Power Log.
For 3 seconds there is a screen that identifies the program:
Then your screen will look similar to this:
46
Page 57

Power Logger
Figure 11. Fluke Power Log Screen
Power Log PC Software
edx034.bmp
Fluke Power Log incorporates several toolbars which provide quick access to
commonly used functions. These functions are also accessible from the Menu
Bar. All toolbars can be re-arranged by dragging them, or make them ‘float’
over the application. It is also possible to hide them by clicking the ‘x’ button
when ‘floating’.
Using Power Log
Primary functions:
• The Download data button. A connection will be established with the
1735 Power Logger, and all Logger recordings will be downloaded.
• The Main Toolbar also comprises of 4 items, but only 1 is active at
start-up:
Open data from File: To retrieve previously saved data files from the
PC hard drive.
47
Page 58

1735
Users Manual
• The other 3 buttons are active when the Fluke Power Log has data
stored in memory:
o Save data to File.
o Print Current Screen.
o Print report. This produces a printed report of the information on
screen. It is possible to adjust the report parameters to avoid the
printing of data not required and the generation of large reports.
Figure 12. Fluke Power Log Displaying Three Phases of Voltage and
edx035.bmp
Current
In the Power Log, every file has its own window within the main one. This
allows files to be open simultaneously for comparison. Each of these windows
has tab markers, which are used to select different viewing modes of the
recorded data.
48
Page 59

Power Logger
Power Log PC Software
Energy Recording with Fluke Power Log
The supplied software Fluke Power Log enables analysis of energy data in two
modes.
The first mode shows the energy as an incremental graph:
edx036.bmp
49
Page 60

1735
Users Manual
The second mode allows a time aggregation period to be set. The minimum
aggregation time is the same as the recorded average period. Values greater
than the recorded period may also be set.
50
edx037.bmp
Page 61

Power Logger
Power Log PC Software
Recording Power (Demand) with 1735 Power Logger
This section provides an example of using the logging function to record 15minute demand averages over 30 days. However, this is only one example of
the types of recordings that you can make.
The export of events is an exception, which is described separately in “Using
Power Log.”
• Connect Logger to the power network at switchgear, a junction box,
or breaker panel, or other convenient access point; set up for POWER.
• Start the measurement by pressing Record.
• In the POWER switch position,, Logger can record up to 4,320
intervals based on the preset interval time. The process can be
cancelled by pressing RECORD/MEASURE at any time.
Table 4. Maximum Possible Measuring Periods
Measurement
Function
V/A/Hz,
Harmonics,
Power
Average Interval Recording Time
½ sec
1 sec
2 sec
5 sec
10 sec
30 sec
1 min
5 min
10 min
15 min
20 min
36 minutes
1 hour, 12 minutes
2 hours, 24 minutes
6 hours
12 hours
1 day, 12 hours
3 days
15 days
30 days
45 days
60 days
51
Page 62

1735
Users Manual
Inside the Logger
Line Power or Battery Mode
You can operate the Logger continuously with the provided charging adapter
or for a few hours with the built-in battery. The battery is to ride through
power interruptions during logging sessions, and to provide operating power
during handheld troubleshooting and analysis of signals.
If you operate your Logger with the ac adapter, the battery is charged
automatically. On the display the symbol for “plugged-in” or battery is
displayed accordingly.
If the battery is completely discharged, it takes about 4 hours to charge it
completely. It is impossible to overcharge the battery as the Logger has an
automatic charging circuit.
When LO-BAT is indicated, attach the ac adapter to recharge the battery.
Replacing the Battery Pack
If the battery life is noticeably low (see technical specification), then it has to
be replaced. Replace the battery as follows, refer to Figure 13:
1. Turn off the Logger
2. Disconnect all measuring leads
3. Open the battery compartment (two cross-notched screws)
4. Unplug and replace the battery pack. Close the battery compartment
again.
52
Page 63

Power Logger
Inside the Logger
1
2 3
4
Battery Pack
Figure 13. Replacing the Battery Pack
Note
If you replace the battery please use original spare parts only – see
section “Standard and Optional Accessories”.
53
edx038.eps
Page 64

1735
Users Manual
Maintenance
If the Logger is used appropriately it does not require special maintenance or
repair. Maintenance work may be executed only by trained and qualified
personnel. This work may only be done at a company related service center
within the guarantee period. See www.fluke.com
information of Fluke Service Centers worldwide.
Cleaning
WCaution
To avoid damaging the Logger, do not use abrasives or
solvents on this instrument.
If the Logger gets dirty, wipe it off carefully with a damp cloth (without
cleaning agents). Mild soap may be used.
Calibration
As an additional service we offer the regular examination and calibration of
your Logger.
for locations and contact
Storage
If the Logger is stored for longer time or is not in use for longer time, you
should charge the battery at least once every six months.
54
Page 65

Power Logger
Measurement Theory
Measurement Theory
The following formulas are the basics of the measuring values:
Voltage and current measurement
1
= dtv
V
RMS
I
= RMS value of currents
RMS
N
Neutral is calculated when not measured, i.e., no 4-
Waveform
The angle given in the waveform function is based on the following formula.
2
RMS value of voltages
∫
T
2
1
dti
∫
T
IIII
++= RMS value of neutral-conductor current
321
phase Flexi set is connected.
⎤
1
⎥
Angle between
2
⎥
+
QP
1
⎦
reactive power of first harmonic
Q
1
P
active power of first harmonic
1
ϕ
=
arctan
⎡
P
⎢
2
⎢
1
⎣
Power Measurements
50
IVP
∑
=
1kk
1
=
P
M
55
××=
kk
M
→
P
active power over average interval
∑
iM
=
1
i
)cos(
ϕ
active power (200 ms average values)
V
, I
, ϕ
values of harmonics
k
k
k
Page 66

1735
Users Manual
tot
PPP
+= Total Active Power-Blondel (Aron)
2
12
=
50
∑
k
=
1kkk
M
1
=
∑
M
=
1
i
S
Q
tot
tot
Pi to single 200 ms values
M to number of values
PPPP
++= total active power
321
31
22
PSQ −= Total Reactive Power-Blondel (Aron)
tottottot
2
2
2
2
2
23
)(
III +−= Blondel (Aron) circuit
312
IVQ
1
31
3
ϕ
××=
IIIVVV
++⋅++
Total Apparent Power
3
2
)sin(
reactive power (200 ms average values)
Vk, Ik, ϕk values of harmonics
Q
reactive power over average time
i
IVS ×= apparent power
PF ==
P
λ
power factor
S
222
QPSD −−= distortion power
P
cos
ϕ
=
The distortion power is > zero if the waveform of current is different
from the voltage waveform.
56
1
cosine cosϕ
2
2
QP
+
1
1
Note
Page 67

Power Logger
Specifications
Total Harmonic Distortion
THD
50
∑
h
2
)(
V
h
2
=
1
V
%100
×=
Total Harmonic Distortion
V1 to RMS of the fundamental
Vh to RMS of the h-th harmonic
50
⎛
⎜
factork k-factor
=−
∑
⎜
1
h
=
⎝
I
I
2
⎞
I
h
I
RMS
2
⎟
⋅
h
⎟
⎠
… h-th harmonic (amps)
h
… RMS amps
RMS
h … harmonic order
Specifications
General
Display:
Quality:
Memory: 4 MB Flash memory, from this 3.5 MB for measuring data;
Interface: USB/RS232 USB with Mini USB B socket
Sample rate: 10.24 kHz
Line frequency:
¼ VGA Graphic Color transmissive displays 320 x 240 Pixel
with additional background lighting and adjustable contrast,
text and graphics in color.
Developed, designed and manufactured according to DIN ISO
9001
50 Hz or 60 Hz, user-selectable, with automatic
synchronization
Temperature Ranges
Working temperature
range:
Storage temperature
range:
Operating temperature
range:
57
-10 °C to +50 °C
-20 °C to +60 °C
0 °C to +40 °C
Page 68

1735
Users Manual
Note
The above terms are defined in European Standards.
To calculate the specification at any point in the
working temperature range, use the temperature
coefficient below.
Temperature coefficient:
Intrinsic error:
Operating error:
Climatic class:
Housing:
±0.1 % of the measured value per K.
Refers to reference temperature, max. deviation is
guaranteed for 2 years.
Refers to operating temperature range, max. deviation is
guaranteed for 2 years.
C1 (IEC 654-1) -5 °C to +45 °C, 5 % to 95 % RH, no dew
Cycoloy shock and scratch proof thermoplast V0-type (nonflammable) with rubber protection holster
EMC
Emission: IEC 61326-1:2006 class B
Immunity: IEC 61326-1:2006
Power supply: NiMH battery-pack, with ac adapter (15 V to 20 V/0.8 A)
Operation time with
battery:
Dimensions: 240 x 180 x 110 mm (6.1 x 4.6 x 2.8 in)
Weight: 1.7 kg (3.75 lb), including battery
Typical >8 h with bright backlight, >10 h with low backlight,
and 24 h without backlight
Safety
Safety:
Pollution Degree: 2
Protection:
RMS values are measured with a 20 ms resolution.
EN/IEC 61010-1:2001 (2
enforced insulation
IP65; EN60529 (refers only to the main housing without the
battery compartment)
V-RMS Wye Measurement
Measuring range:
Intrinsic error:
Operating error:
Resolution: 0.1 V
58
57 / 66 / 110 / 120 / 127 / 220 / 230/ 240 / 260 / 277 / 347 /
380 / 400 / 417 / 480 V AC
±(0.2 % of measured value. + 5 digits)
±(0.5 % of m. v. + 10 digit)
nd
ed.) 600 V CAT III, double or
Page 69

Power Logger
Specifications
V-RMS Delta Measurement
Measuring range:
Intrinsic error:
Operating error:
Resolution: 0.1 V
100 / 115 / 190 /208 / 220 / 380 / 400 / 415 / 450 / 480 / 600 /
660 / 690 / 720 / 830 V AC
±(0.2 % of m. v. + 5 digit)
±(0.5 % of m. v. + 10 digit)
A-RMS Measurement
Flexi Sets and current probes with voltage output are supported. All current probes must
correspond to 600 V / CAT III
Flexi set I ranges: 15 A / 150 A / 3000 A RMS (non-distorted sine wave)
Resolution: 0.01 A
For ranges 150 A/3000 A
Intrinsic error:
Operating error:
For range 15 A
Intrinsic error:
Operating error:
The errors of the current probes are not considered.
By using Flexi-Set:
Flexi Set measuring
error:
Position influence:
CF (typical): 2.83
±(0.5 % of m. v. + 10 digit)
±(1 % of m. v. + 10 digit)
±(0.5 % of m. v. + 20 digit)
±(1 % of m. v. + 20 digit)
±(2 % of m. v. + 10 digit)
±(3 % of m. v. + 10 digit)
Note
Error for current clamps is specified separately.
59
Page 70

1735
Users Manual
Power Measurement (P, S, D)
• Measuring range: see V RMS and A RMS measurement
• Power errors are calculated by adding the errors of voltage and current
• Additional error due to power factor PF
• Specified error x (1-IPFI)
• Maximum Range with Voltage range 830 V delta-connection and 3000 A
current range is 2.490 MW
Intrinsic error:
Resolution: 1 kW
Operating error:
Typical range with Voltage range 230 V Wye connection and 150 A Current range is
34.50 KW
Intrinsic error:
Resolution: 1 W to 10 W
Operating error:
The errors of the current sensors themselves have not been considered.
Energy Measurement (kWh, KVAh, kVARh)
Intrinsic error:
Resolution: 1 W to 10 W
Operating error:
* Frequency variation
error
±(0.7 % of m.v. +15 digit)
±(1.5 % of m.v. + 20 digit)
±(0.7 % of m.v. +15 digit)
±(1.5 % of m.v. + 20 digit)
±(0.7 % of m.v.+ F variation error* +15 digit)
±(1.5 % of m.v. + F variation error* + 20 digit)
±2 % m.v. + 2* (% maximum frequency deviation)
PF (Power Factor)
Range: 0.000 to 1.000
Resolution: 0.001
Accuracy:
±1 % of full scale
Frequency Measurement
Measuring range: 46 Hz – 54 Hz and 56 Hz – 64 Hz
Intrinsic error:
Operating error:
Resolution: 0.01 Hz
±(0.2 % of m. v. + 5 digit)
±(0.5 % of m. v.+ 10 digit)
60
Page 71

Power Logger
Specifications
Harmonics
Measuring range: 1 to 50th harmonic (<50 % von Vm)
Accuracy:
Vm, Im, THDV, THDI: According IEC 1000-4-7, class B
Vm, Im, THDV, THDI: According IEC 1000-4-7, class B
Vm ≥3 % Vn: 5 % V
Vm < 3 % Vn: 0.15 % Vn
Im ≥10 % In: 5 % Im
Im < 10 % In: 0.5 % In
THDV: for THD <3 % - <0.15 % at Vn
for THD ≥3 % - <5 % at Vn
THDI: for THD <10 % - <0.5 % at In
for THD ≥10 % - <5 % at In
Events
Detection of voltage dips, voltage swells and voltage interruptions with a 10 ms resolution
and measuring error of the half period sine wave of RMS.
Intrinsic error:
Operating error:
Resolution: 0.1 V
±(1 % of m. v. + 10 digit)
±(2 % of m. v. + 10 digit)
61
Page 72

1735
Users Manual
Unbalance
RMS errors see V-RMS specification.
Phase angle error.
Intrinsic error:
Operating error:
Resolution:
When using Flexi Set please make sure to position the
conductor opposite to the Flexi Set-lock (refer following
figure).
±(0.5 % of m. v. + 5 digit)
±(1 % of m. v. + 10 digit)
0.1°
Note
conductor
lock
62
Flexi Set-Lock
edx039.eps]
Page 73

Values Recorded by the Power
Recorded Values
Appendix A
Logger
Measurement
function
Volts/Amps/Hertz
Saved
parameters
Voltages
VL1, VL2,
VL3,
AVG, MIN,
MAX RMS
values
Description
VoltageV1 AN Volts&Amps
VOLTAGE (AVG)
VoltageV1 AN Volts&Amps
VOLTAGE (MAX)
VoltageV1 AN Volts&Amps
VOLTAGE (MIN)
VoltageV2 BN Volts&Amps
VOLTAGE (AVG)
VoltageV2 BN Volts&Amps
VOLTAGE (MAX)
VoltageV2 BN Volts&Amps
VOLTAGE (MIN)
VoltageV3 CN Volts&Amps
VOLTAGE (AVG)
VoltageV3 CN Volts&Amps
VOLTAGE (MAX)
VoltageV3 CN Volts&Amps
VOLTAGE (MIN)
63
Page 74

1735
Users Manual
Currents I1,
I2, I3, AVG,
MIN, MAX
RMS values
Current I1 AN Volts & Amps
CURRENT (AVG)
Current I1 AN Volts & Amps
CURRENT MAX)
Current I1 AN Volts & Amps
CURRENT (MIN)
Current I2 BN Volts & Amps
CURRENT (AVG)
Current I2 BN Volts & Amps
CURRENT (MAX)
Current I2 BN Volts & Amps
CURRENT (MIN)
Current I3 CN Volts & Amps
CURRENT (AVG)
Current I3 CN Volts & Amps
CURRENT (MAX)
Current I3 CN Volts & Amps
CURRENT (MIN)
Frequency,
AVG, MIN,
MAX values
64
Frequency F TOTAL Volts & Amps
VOLTAGE (AVG)
Frequency F TOTAL Volts & Amps
VOLTAGE (MAX)
Frequency F TOTAL Volts & Amps
VOLTAGE (MIN)
Page 75

Power Logger
Recorded Values
Harmonics
Voltages
VL1,VL2,
VL3, AVG,
MIN, MAX
RMS values
Currents I1,
I2, I3, In
AVG, MIN,
MAX RMS
values
VoltageV1 AN Harmonic
VOLTAGE (AVG)
VoltageV1 AN Harmonic
VOLTAGE (MAX)
VoltageV1 AN Harmonic VOLTAGE
(MIN)
VoltageV2 BN Harmonic VOLTAGE
(AVG)
VoltageV2 BN Harmonic VOLTAGE
(MAX)
VoltageV2 BN Harmonic
VOLTAGE (MIN)
VoltageV3 CN Harmonic VOLTAGE
(AVG)
VoltageV3 CN Harmonic VOLTAGE
(MAX)
VoltageV3 CN Harmonic
VOLTAGE (MIN)
Current I1 AN Harmonic CURRENT
(AVG)
Current I1 AN Harmonic
CURRENT (MAX)
Current I1 AN Harmonic CURRENT
(MIN)
Current I2 BN Harmonic
CURRENT (AVG)
Current I2 BN Harmonic
CURRENT (MAX)
Current I2 BN Harmonic
CURRENT (MIN)
Current I3 CN Harmonic CURRENT
(AVG)
65
Page 76

1735
Users Manual
Current I3 CN Harmonic
CURRENT (MAX)
Current I3 CN Harmonic
CURRENT (MIN)
Current IN NG Harmonic
CURRENT (AVG)
Current IN NG Harmonic
CURRENT (MAX)
Current IN NG Harmonic CURRENT
(MIN)
THD I L1, L2,
L3, In, AVG,
MIN, MAX
RMS values
THD V L1,
L2, L3, AVG,
MIN, MAX
RMS values
THD I1 AN Harmonic CURRENT (AVG)
THD I1 AN Harmonic CURRENT (MAX)
THD I1 AN Harmonic CURRENT (MIN)
THD I2 BN Harmonic CURRENT (AVG)
THD I2 BN Harmonic CURRENT (MAX)
THD I2 BN Harmonic CURRENT (MIN)
THD I3 CN Harmonic CURRENT (AVG)
THD I3 CN Harmonic CURRENT (MAX)
THD I3 CN Harmonic CURRENT (MIN)
THD I
NG Harmonic CURRENT (AVG)
n
NG Harmonic CURRENT (MAX)
THD I
n
THD In NG Harmonic CURRENT (MIN)
THD V1 AN Harmonic VOLTAGE (AVG)
THD V1 AN Harmonic VOLTAGE (MAX)
THD V1 AN Harmonic VOLTAGE (MIN)
THD V2 BN Harmonic VOLTAGE (AVG)
THD V2 BN Harmonic VOLTAGE (MAX)
66
THD V2 BN Harmonic VOLTAGE (MIN)
THD V3 CN Harmonic VOLTAGE (AVG)
Page 77

Power Logger
THD V3 CN Harmonic VOLTAGE (MAX)
THD V3 CN Harmonic VOLTAGE (MIN)
Recorded Values
Values of
odd and
uneven
harmonics
from the 1
th
25
st
-
order for
V1, V2, V3,
I1, I2, I3 ,In,
AVG, MIN,
MAX RMS
values
Frequency,
AVG, MIN,
MAX values
Frequency F TOTAL Harmonic
VOLTAGE (AVG)
Frequency F TOTAL Harmonic
VOLTAGE (MAX)
Frequency F TOTAL Harmonic
VOLTAGE (MIN)
W Power
Current I1 AN Power CURRENT (AVG)
Current I1 AN Power CURRENT (MAX)
Current I1 AN Power CURRENT (MIN)
Current I2 BN Power CURRENT (AVG)
Current I2 BN Power CURRENT (MAX)
Current I2 BN Power CURRENT (MIN)
Current I3 CN Power CURRENT (AVG)
Current I3 CN Power CURRENT (MAX)
Current I3 CN Power CURRENT (MIN)
Current In NG Power CURRENT (AVG)
Current In NG Power CURRENT (MAX)
67
Page 78

1735
Users Manual
Current In NG Power CURRENT (MIN)
Real powers
P1, P2, P3,
AVG, MIN,
MAX values
Voltages
VL1, VL2,
VL3,
AVG, MIN,
MAX RMS
values
Real Power P1 AN Power
POWER (AVG)
Real Power P1 AN Power
POWER (MAX)
Real Power P1 AN Power
POWER (MIN)
Real Power P2 BN Power
POWER (AVG)
Real Power P2 BN Power
POWER (MAX)
Real Power P2 BN Power
POWER (MIN)
Real Power P3 CN Power
POWER (AVG)
Real Power P3 CN Power
POWER (MAX)
Real Power P3 CN Power
POWER (MIN)
VoltageVU1 AN Power VOLTAGE (AVG)
VoltageV1 AN Power VOLTAGE (MAX)
VoltageV1 AN Power VOLTAGE (MIN)
VoltageV2 BN Power VOLTAGE (AVG)
VoltageV2 BN Power VOLTAGE (MAX)
68
VoltageV2 BN Power VOLTAGE (MIN)
VoltageV3 CN Power VOLTAGE (AVG)
VoltageV3 CN Power VOLTAGE (MAX)
VoltageV3 CN Power VOLTAGE (MIN)
Page 79

Power Logger
Recorded Values
Apparent
powers S1,
S2, S3,
AVG, MIN,
MAX values
Apparent Power S1 AN Power
POWER (AVG)
Apparent Power S1 AN Power
POWER (MAX)
Apparent Power S1 AN Power
POWER (MIN)
Apparent Power S2 BN Power
POWER (AVG)
Apparent Power S2 BN Power
POWER (MAX)
Apparent Power S2 BN Power
POWER (MIN)
Apparent Power S3 CN Power
POWER (AVG)
Apparent Power S3 CN Power
POWER (MAX)
Apparent Power S3 CN Power
POWER (MIN)
Reactive
powers Q1,
Q2, Q3,
AVG, MIN,
MAX values
Reactive Power Q1 AN Power
POWER (AVG)
Reactive Power Q1 AN Power
POWER (MAX)
Reactive Power Q1 AN Power
POWER (MIN)
Reactive Power Q2 BN Power
POWER (AVG)
Reactive Power Q2 BN Power
POWER (MAX)
Reactive Power Q2 BN Power
POWER (MIN)
Reactive Power Q3 CN Power
POWER (AVG)
Reactive Power Q3 CN Power
POWER (MAX)
69
Page 80

1735
Users Manual
Reactive Power Q3 CN Power
POWER (MIN)
Distortion
powers D1,
D2, D3,
AVG, MIN,
MAX values
Frequency,
AVG, MIN,
MAX values
Distortion Power D1 AN Power
POWER (AVG)
Distortion Power D1 AN Power
POWER (MAX)
Distortion Power D1 AN Power
POWER (MIN)
Distortion Power D2 BN Power
POWER (AVG)
Distortion Power D2 BN Power
POWER (MAX)
Distortion Power D2 BN Power
POWER (MIN)
Distortion Power D3 CN Power
POWER (AVG)
Distortion Power D3 CN Power
POWER (MAX)
Distortion Power D3 CN Power
POWER (MIN)
Frequency F TOTAL Power
VOLTAGE (AVG)
Frequency F TOTAL Power
VOLTAGE (MAX)
Cosϕ L1,L2,
L3
70
Frequency F TOTAL Power
VOLTAGE (MIN)
Cos PHI 1 AN Power POWER (AVG)
Cos PHI 1 AN Power POWER (MAX)
Cos PHI 1 AN Power POWER (MIN)
Cos PHI 2 BN Power POWER (AVG)
Cos PHI 2 BN Power POWER (MAX)
Page 81

Power Logger
Cos PHI 2 BN Power POWER (MIN)
Cos PHI 3 CN Power POWER (AVG)
Cos PHI 3 CN Power POWER (MAX)
Cos PHI 3 CN Power POWER (MIN)
Recorded Values
Power
factors PF1,
PF2, PF3,
AVG, MIN,
MAX values
Reactive
energy EQ1,
EQ2, EQ3
Averages
only
Power Factor PF1 AN Power
POWER (AVG)
Power Factor PF1 AN Power POWER
(MAX)
Power Factor PF1 AN Power
POWER (MIN)
Power Factor PF2 BN Power
POWER (AVG)
Power Factor PF2 BN Power
POWER (MAX)
Power Factor PF2 BN Power
POWER (MIN)
Power Factor PF3 CN Power
POWER (AVG)
Power Factor PF3 CN Power
POWER (MAX)
Power Factor PF3 CN Power
POWER (MIN)
Reactive Energy EQ1 AN Power
ENERGY (AVG)
Reactive Energy EQ2 BN Power
ENERGY (AVG)
Reactive Energy EQ3 CN Power
ENERGY (AVG)
71
Page 82

1735
Users Manual
Real energy
EP1, EP2,
EP3
Averages
only
Events
Real Energy EP1 AN Power
ENERGY (AVG)
Real Energy EP2 BN Power
ENERGY (AVG)
Real Energy EP3 CN Power
ENERGY (AVG)
Voltages
VL1, VL2,
VL3, MIN,
MAX of 10ms RMS
values
Number of
events per
phase
This table is valid for WYE mode only. In 2/3 elements delta modes, the data
set is reduced.
DIP-Phase CN VALUELOG VOLTAGE
MIN VOLTS RMS
DIP-Phase CN VALUELOG VOLTAGE
MAX VOLTS RMS
BAND-Phase CN VALUELOG VOLTAGE
MIN VOLTS RMS
BAND-Phase CN VALUELOG VOLTAGE
MAX VOLTS RMS
INTER-Phase AN VALUELOG VOLTAGE
MIN VOLTS RMS
INTER-Phase AN VALUELOG VOLTAGE
MAX VOLTS RMS
SWELL-Phase BN VALUELOG VOLTAGE
MIN VOLTS RMS
SWELL-Phase BN VALUELOG VOLTAGE
MAX VOLTS RMS
72
 Loading...