

Flo-tech USB Specifications
Flo-Check® USB Hydraulic System Analyzer
Simultaneously Measures Flow, Pressure and Temperature
SPECIFICATIONS
Performance
Flow:
Accuracy ±1% of reading @ 32 cSt
Repeatability ±0.2%
Pressure:
Accuracy <±0.5% BFSL
Stability <±0.25% of full scale
Zero Offset <±2% of full scale
TC Zero and TC Span <±1.5% of full scale
Response Time 0.2 milliseconds
Temperature:
Calibration Error (25 °C) ±1 °C
Absolute Error (over full range of sensor, 0 to 150 °C)
• Flow accuracy ±1% of reading @ 32 cSt
• Field selectable US or metric readings
• High and low set point alarms for ow, pressure and
temperature
• Captures pressure spikes up to 10,000 PSI
(0.2 milliseconds duration)
• Exports saved data to Microsoft Excel
spreadsheet programs
• USB powered
• Easy to use, plug and play
• Calculates hydraulic power
• Select continuous monitoring or capture data manually
• Logs up to 12 hours
• Records alarm history
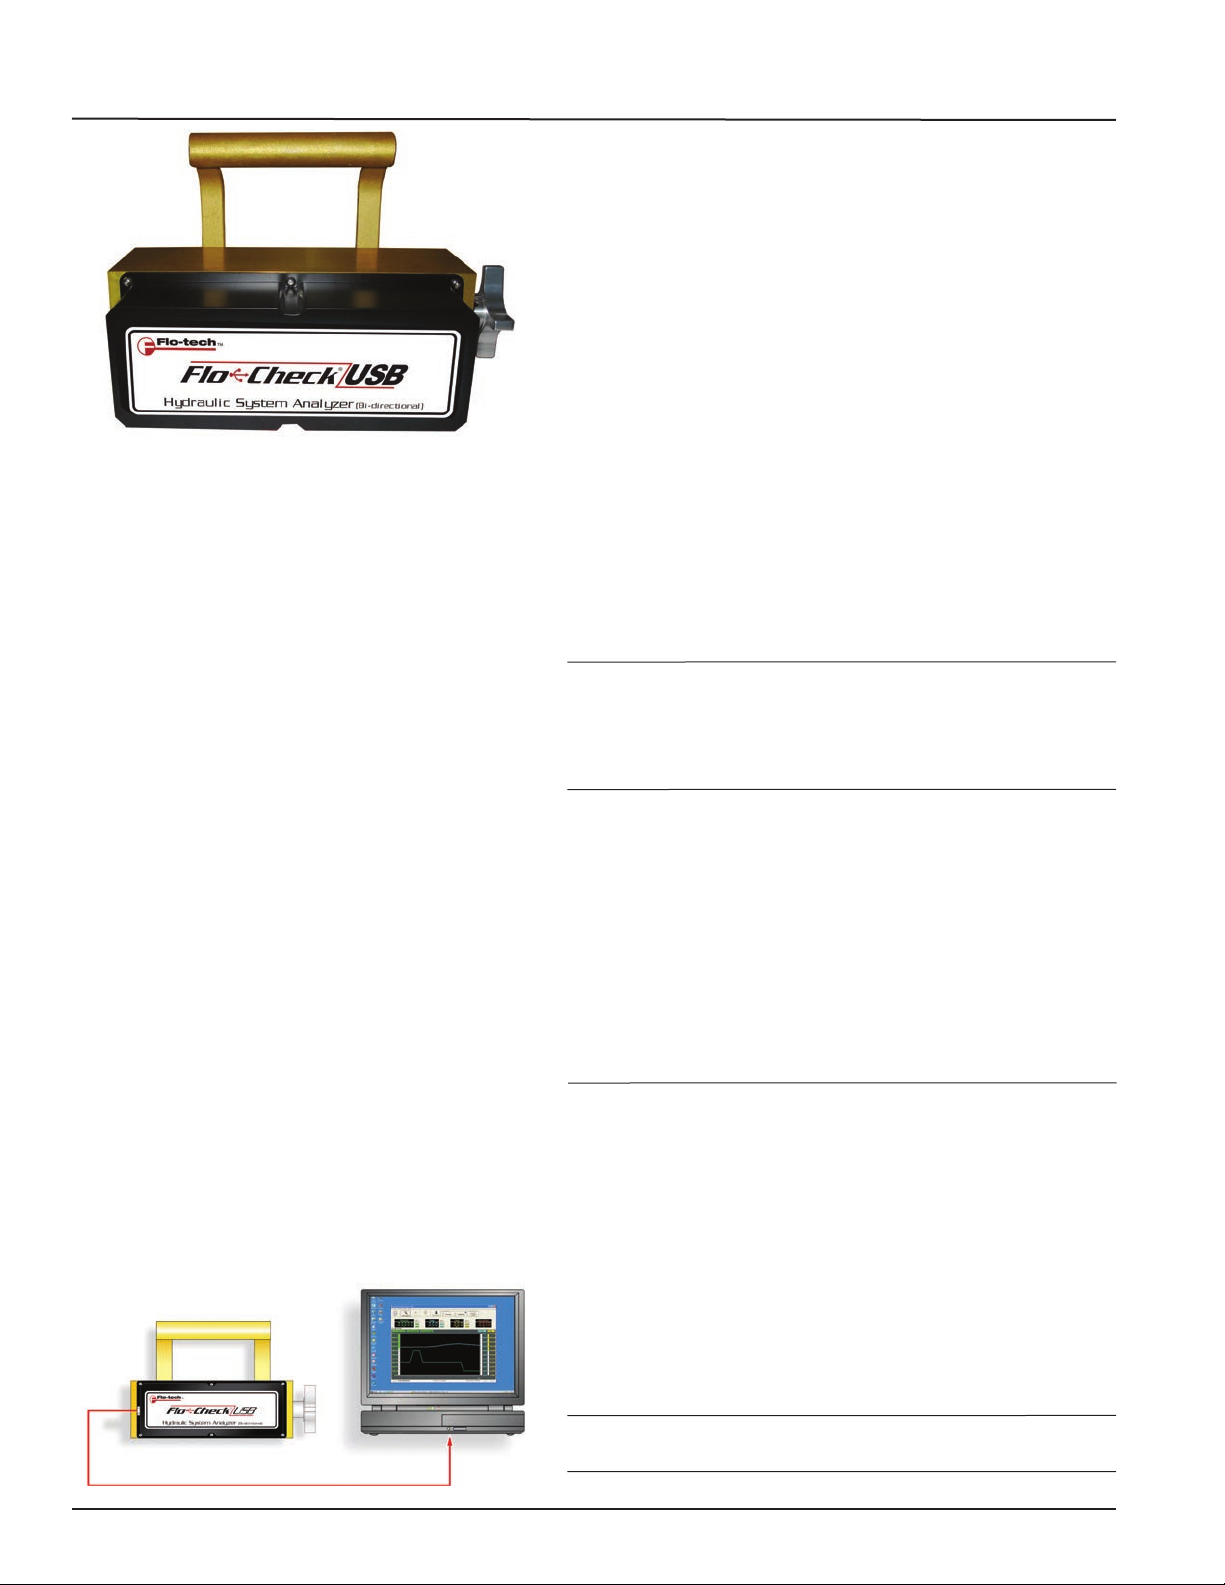
The Flo-Check Hydraulic System Analyzer can be used
as a stationary or portable tester for both industrial and
mobile hydraulic system diagnostics, and analysis of the
prognostic health of a hydraulic system. It features ow,
pressure and temperature sensors that are monitored by a
data acquisition module. This module records the operating
parameters of the system and transfers them to the user’s
laptop via the USB port.
The custom software utility is a Windows
which is compatible with Windows Vista
Windows 2000, and Windows 7. This intuitive software
congures the displayed information into user-selected
engineering units and provides real-time graphics with
instantaneous readings and trends for all three measurement
parameters. The software also permits the data to be saved
for export into a spreadsheet program.
The Hydraulic System Analyzer is powered through the USB
port of a PC, making it easy to set up and ideal for portable
applications. Interfaced to the PC application, the Hydraulic
Analyzer offers a straightforward method of monitoring
system parameters complete with data acquisition.
®
and other
®
-based application
®
, Windows XP,
Without Calibration ±3 °C
With Calibration ±1.6 °C
Nonlinearity ±0.4 °C
Repeatability ±0.1 °C
Data Acquisition:
Sample Rate 10 kHz
PC Screen Update/Record Rate
Flow 1 second (average 10K samples)
Temperature 1 second (average 10K samples)
Pressure 1 second (min, max, average 10K samples)
Power
USB Power: +5 VDC (supplied through USB port
USB Voltage Tolerance: +4.6 VDC min, +5.25 VDC max
Current: 100 mA, typ
of a PC)
Environmental
Pressure Rating: 6000 PSI (414 Bar) maximum with a 3:1
safety factor; capable of 10,000 PSI
transients
Operating Pressure: <6000 PSI (414 Bar, 41.4 MPa,
420 kg/cm²); capable of 10,000 PSI
transients
Internal Valve By-pass: 7500 PSI ∆P
Pressure Drop: See ∆P charts on page 14
Fluid Temperature: -40 to +300 °F (-40 to +150 °C)
Ambient Temperature: +32 to +185 °F (0 to +85 °C)
Storage Temperature: -40 to +185 °F (-40 to +85 °C)
Humidity: 0-90%, non-condensing
Material
Housing: 6013-T351 Aluminum; anodized
Turbine Rotor: T416 Stainless steel
Rotor Supports: 6061-T6 Aluminum alloy
Seals: Viton® standard; EPR optional
Ball Bearings: 440C Stainless steel
Hub Cones: 6061-T6 Aluminum alloy
Temperature Probe: T303 Stainless steel
Valve: 12L14 Steel body with 303 SS seat
Spool/Sleeve: 12L14 Steel
Magnetic Pick-up:
Body T303 Stainless Steel
Nut T303 Stainless Steel
Electronic Case: Cold rolled steel; black zinc plate
with clear seal
Ports: SAE Straight thread O-ring boss, female,
J1926/1; ISO1179 (BSPP)
Page 4 January 2014
Flo-Check® USB Hydraulic System Analyzer
Simultaneously Measures Flow, Pressure and Temperature
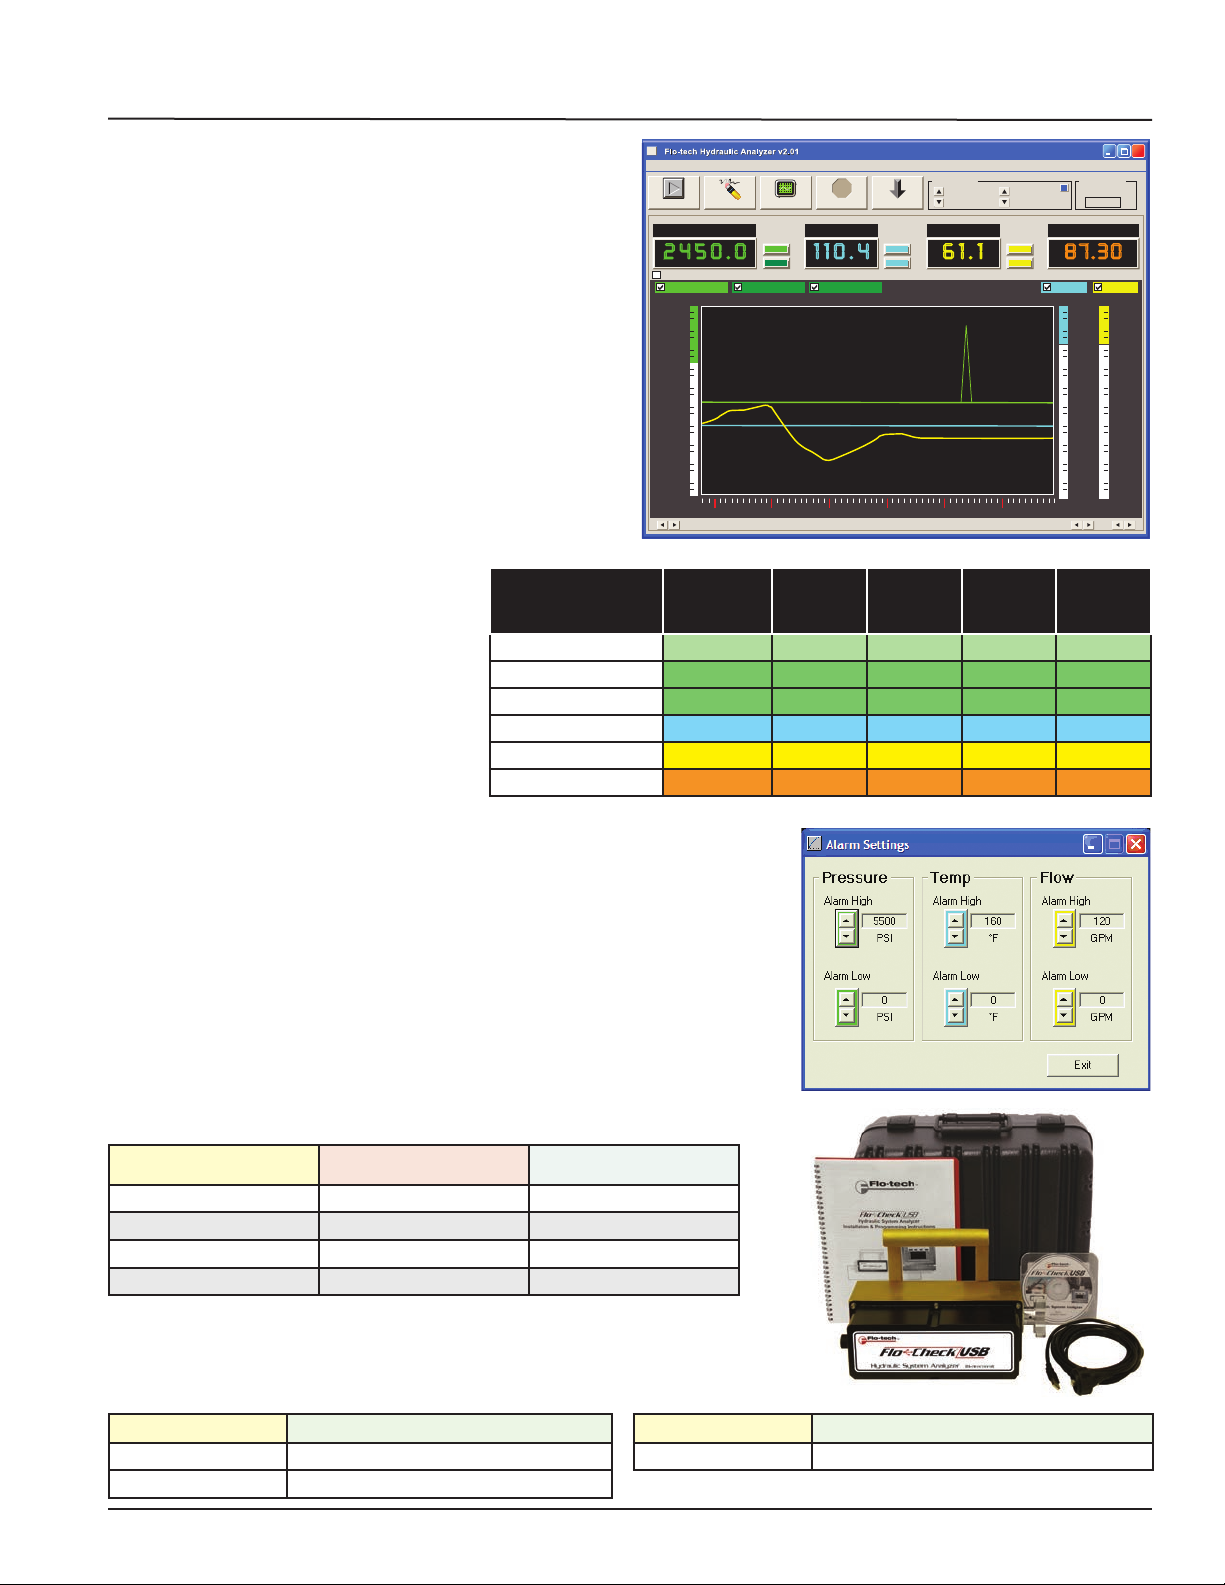
SOFTWARE
The Flo-tech Analyzer software provides a real-time graphical
and digital interface for monitoring and/or recording pressure,
temperature and ow rate parameters from the Hydraulic
Analyzer. In addition to the graphical and digital displays, the
main screen also consists of a menu bar, buttons with common
functions and alarm indicators.
The software offers the following options:
• View real time pressure, temperature, ow rate and power
measurements
• Record all measurements to a le
• Choice of recording all measurement points or capturing
points manually
• Selection of all measurement units, US or metric
• Ability to adjust display of graph data
• High/Low alarm indicators set by the operator
All measurements taken can be saved once
per second to a comma separated value (.csv)
le for export into a spreadsheet program. For
example, recording for 2 minutes would yield
120 points of data. Even though data points
are only recorded once per second, pressure
spikes and dips are captured by recording the
maximum or minimum pressure during each
measurement period. Therefore, the precise
shape of the pressure spike is not recorded
but its amplitude and the time it occurred are
both recorded.
Measurement
(over a 1 second
time period)
Average Pressure Green
Minimum Pressure Dark Green
Maximum Pressure Dark Green
Average Temperature Blue
Average Flow Rate Yellow
Average Power Orange
File View Options Tools About
Run Clear Graph
Pressure Temp Flow Horse Power
2450.0 87.30110.4 61.1
PSI
View History
Pressure Avg PressureMin PressureMax
5000.0 PSI
—
4500.0 PSI
—
4000.0 PSI
—
3500.0 PSI
—
3000.0 PSI
—
2500.0 PSI
—
2000.0 PSI
—
1500.0 PSI
—
1000.0 PSI
—
500.0 PSI
—
0 PSI
—
990.0s 1000.0s 1010.0s 1020.0s 1030.0s 1040.0s
Record Stop Reset Alarms
Alarms
High/Low
Color
Indication
STOP
°F GPM HP
Alarm
Indication
Log Interval
Alarms
High/Low
Digital
Indication
4 Hours 0 Minutes
Alarms
High/Low
Elapsed Time=00:17:28
Graphical
Display
• • • •
• •
• •
• • • •
• • • •
• •
Test Period
Seconds
14400
Temp Flow
300.0 °F
—
270.0 °F
—
240.0 °F
—
210.0 °F
—
180.0 °F
—
150.0 °F
—
120.0 °F
—
90.0 °F
—
60.0 °F
—
30.0 °F
—
0.0 °F
—
Record to
File
200.0 GPM
—
180.0 GPM
—
160.0 GPM
—
140.0 GPM
—
120.0 GPM
—
100.0 GPM
—
80.0 GPM
—
60.0 GPM
—
40.0 GPM
—
20.0 GPM
—
0.0 GPM
—
×
Graphs
The graph on the main screen contains more than 60 points of data. Previous data
points are saved in memory and can be viewed at any time. Adjustments can be
made to optimize data that is displayed by hiding individual graph plots, adjusting the
scale of each plot or adding horizontal gridlines to the graph.
Alarms
There are three sets of High/Low alarm indicators on the main screen which monitor
pressure, temperature and ow rate. Alarm indicators ash if the current system
measurements exceed the alarm limits set by the operator and continue to ash
when the current system measurements return to normal to alert the operator that an
alarm condition occurred. Alarms must be reset manually to acknowledge the alarm
condition.
ORDERING INFORMATION
MODEL NUMBER ¹ NOMINAL PORT SIZE FLOW RANGE
F7160 SAE 16 3 - 85 GPM
F7161 SAE 24 7 - 199.9 GPM
F7162 G 1 15 - 321 LPM
F7163 G 1-1/2 26 - 757 LPM
¹ Each Flo-Check Hydraulic System Analyzer includes a 16.4 ft. (5 M) USB,
A male to B male (IP 68) connection cable, CD-Rom of the software utility, and
complete operating instructions packaged in a protective carrying case.
ACCESSORIES
MODEL NUMBER DESCRIPTION
F001109 5-Point Calibration Certicate ²
F001110 10-Point Calibration Certicate ²
MODEL NUMBER DESCRIPTION
F1614-7500 Pressure Relief Disc, 7500 PSI (1 per Tester)
² Certicates are traceable to NIST, ISO 9001.
Page 5 January 2014
 Loading...