

Page 1
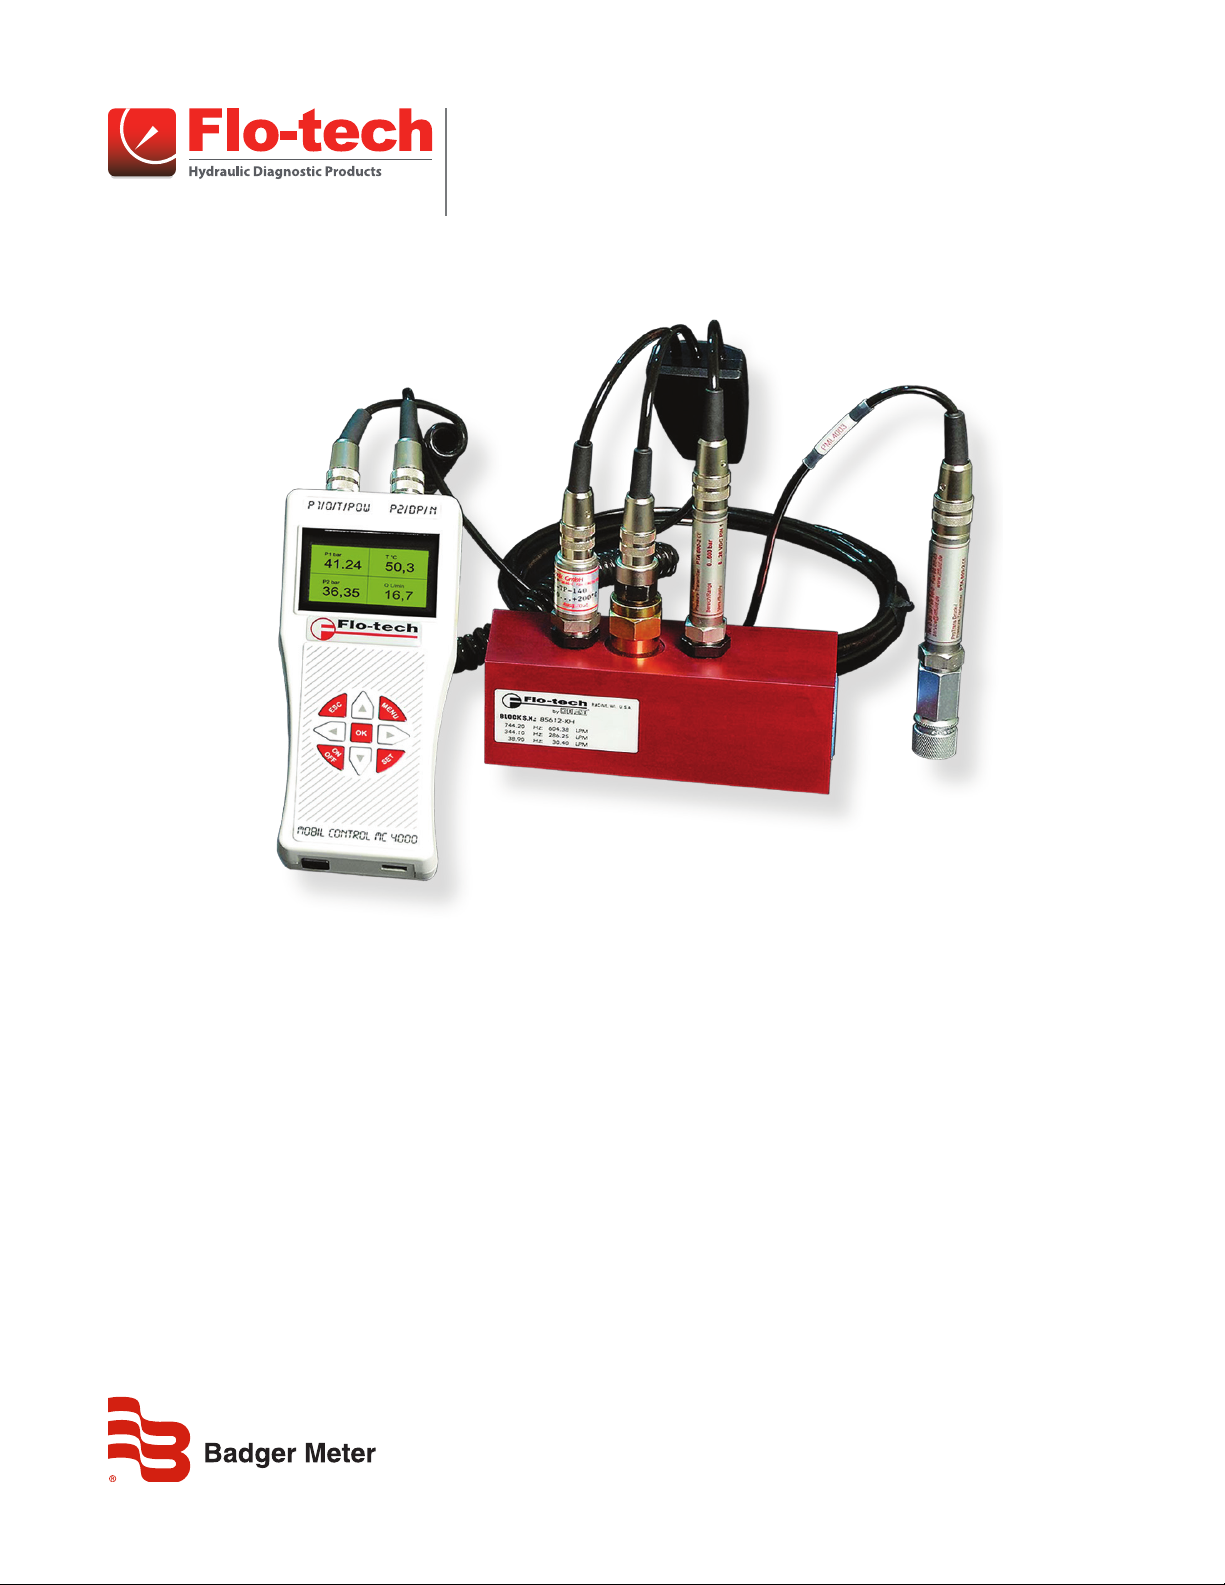
Turbine Flow Meter
MC4000 Handheld Hydraulic System Analyzer
TST-UM-00017-EN-03 (February 2015)
User Manual
Page 2

Turbine Flow Meter, MC4000 Handheld Hydraulic System Analyzer
Page ii February 2015
Page 3

User Manual
CONTENTS
Product Unpacking And Inspection . . . . . . . . . . . . . . . . . . . . . . . . . . . . . . . . . . . . . . . . . . . . . . . . . . . . . . . . . . 4
Introduction. . . . . . . . . . . . . . . . . . . . . . . . . . . . . . . . . . . . . . . . . . . . . . . . . . . . . . . . . . . . . . . . . . . . . . . . . 4
Operating Principle . . . . . . . . . . . . . . . . . . . . . . . . . . . . . . . . . . . . . . . . . . . . . . . . . . . . . . . . . . . . . . . . . 5
Connections. . . . . . . . . . . . . . . . . . . . . . . . . . . . . . . . . . . . . . . . . . . . . . . . . . . . . . . . . . . . . . . . . . . . . . . . . 6
Installation. . . . . . . . . . . . . . . . . . . . . . . . . . . . . . . . . . . . . . . . . . . . . . . . . . . . . . . . . . . . . . . . . . . . . . . . . . 6
Operation . . . . . . . . . . . . . . . . . . . . . . . . . . . . . . . . . . . . . . . . . . . . . . . . . . . . . . . . . . . . . . . . . . . . . . . . . . 7
Measuring Mode . . . . . . . . . . . . . . . . . . . . . . . . . . . . . . . . . . . . . . . . . . . . . . . . . . . . . . . . . . . . . . . . . . . 7
Programming Menu. . . . . . . . . . . . . . . . . . . . . . . . . . . . . . . . . . . . . . . . . . . . . . . . . . . . . . . . . . . . . . . . . 9
Supplementary Measurements. . . . . . . . . . . . . . . . . . . . . . . . . . . . . . . . . . . . . . . . . . . . . . . . . . . . . . . . . . . . 13
Peak and Valley . . . . . . . . . . . . . . . . . . . . . . . . . . . . . . . . . . . . . . . . . . . . . . . . . . . . . . . . . . . . . . . . . . . 13
Pressure Dierence . . . . . . . . . . . . . . . . . . . . . . . . . . . . . . . . . . . . . . . . . . . . . . . . . . . . . . . . . . . . . . . . 13
Power . . . . . . . . . . . . . . . . . . . . . . . . . . . . . . . . . . . . . . . . . . . . . . . . . . . . . . . . . . . . . . . . . . . . . . . . . 13
Two Point Flow Sensor Calibration Using the New Lin Function . . . . . . . . . . . . . . . . . . . . . . . . . . . . . . . . . . . . 14
Three Point Flow Sensors Linearizing Using the New Tab Function . . . . . . . . . . . . . . . . . . . . . . . . . . . . . . . . . . 15
MC4CON Software. . . . . . . . . . . . . . . . . . . . . . . . . . . . . . . . . . . . . . . . . . . . . . . . . . . . . . . . . . . . . . . . . . . . 16
Installation. . . . . . . . . . . . . . . . . . . . . . . . . . . . . . . . . . . . . . . . . . . . . . . . . . . . . . . . . . . . . . . . . . . . . . 16
Communication . . . . . . . . . . . . . . . . . . . . . . . . . . . . . . . . . . . . . . . . . . . . . . . . . . . . . . . . . . . . . . . . . . 16
Menu Structure . . . . . . . . . . . . . . . . . . . . . . . . . . . . . . . . . . . . . . . . . . . . . . . . . . . . . . . . . . . . . . . . . . . 17
Menu Tabs . . . . . . . . . . . . . . . . . . . . . . . . . . . . . . . . . . . . . . . . . . . . . . . . . . . . . . . . . . . . . . . . . . . . . . 17
Datalogger Tab . . . . . . . . . . . . . . . . . . . . . . . . . . . . . . . . . . . . . . . . . . . . . . . . . . . . . . . . . . . . . . . . . . . 21
Troubleshooting Guide. . . . . . . . . . . . . . . . . . . . . . . . . . . . . . . . . . . . . . . . . . . . . . . . . . . . . . . . . . . . . . . . . 24
Specications . . . . . . . . . . . . . . . . . . . . . . . . . . . . . . . . . . . . . . . . . . . . . . . . . . . . . . . . . . . . . . . . . . . . . . . 25
Dimensions . . . . . . . . . . . . . . . . . . . . . . . . . . . . . . . . . . . . . . . . . . . . . . . . . . . . . . . . . . . . . . . . . . . . . . . . 26
Model Numbers . . . . . . . . . . . . . . . . . . . . . . . . . . . . . . . . . . . . . . . . . . . . . . . . . . . . . . . . . . . . . . . . . . . . . 27
Page iii February 2015
Page 4

Product Unpacking And Inspection
PRODUCT UNPACKING AND INSPECTION
Upon receipt of the product, perform the following unpacking and inspection procedures.
OTE:N If damage to the shipping container is evident upon receipt, request the carrier to be present when the product
is unpacked.
1. Carefully open the shipping package, follow any instructions that may be marked on the exterior. Remove all cushioning
material surrounding the product and carefully lift the product from the package.
2. Save the package and all packing material for possible use in reshipment or storage.
3. Visually inspect the product and applicable accessories for any physical damage such as scratches, loose or broken parts or
any other sign of damage that may have occurred during shipment.
OTE:N If damage is found, request an inspection by the carrier’s agent within 48 hours of delivery and file a claim with the
carrier. A claim for equipment damage in transit is the sole responsibility of the purchaser.
INTRODUCTION
The MC4000 has inputs for two pressure sensors, one temperature sensor, one flow sensor, and one active pickup for RPM
measurements. The MC4000 allows simultaneous connection of four sensors with the measurements displayed in four
individual LCD windows using preselected process units according to US or DIN norms. The display supports English and one
of the following languages selected at the time of order: Spanish, German, Italian, or French.
An internal rechargeable battery powers the MC4000. A green LED indicates a completely charged battery. A fully charged
battery permits four hours of operation with two pressure sensors connected. With the charger connected, the battery
charges while also allowing use of the instrument. An optional automobile style power cable is available for operation from a
car battery.
When in Datalogger mode, the MC4000 stores data in an internal 2.5 MB memory space. Each stored measurement contains
the day and date from the instruments real time clock.
The MC4CON software utility transfers stored measurements via a USB data port to a Windows PC. The MC4CON program
permits bi-directional communication not only for uploading recorded data to a PC, but also for downloading commands
from the PC to the MC4000.
All parameters can also be set using the buttons on the instrument’s front panel. Pressure units are programmed in psi or bar.
The flow and rpm measurements are scaled using programmable constants. Additionally, three point flow calibration for the
turbine sensors is available. When activated, the pressure tare function allows offset adjustments and the sets the display to
zero at non-zero pressure inputs.
Hydraulic horsepower is automatically calculated from the measured pressure and flow. Horsepower displays as either HP or
kW depending on the selected units.
Page 4 February 2015TST-UM-00017-EN-03
Page 5
Introduction
Operating Principle
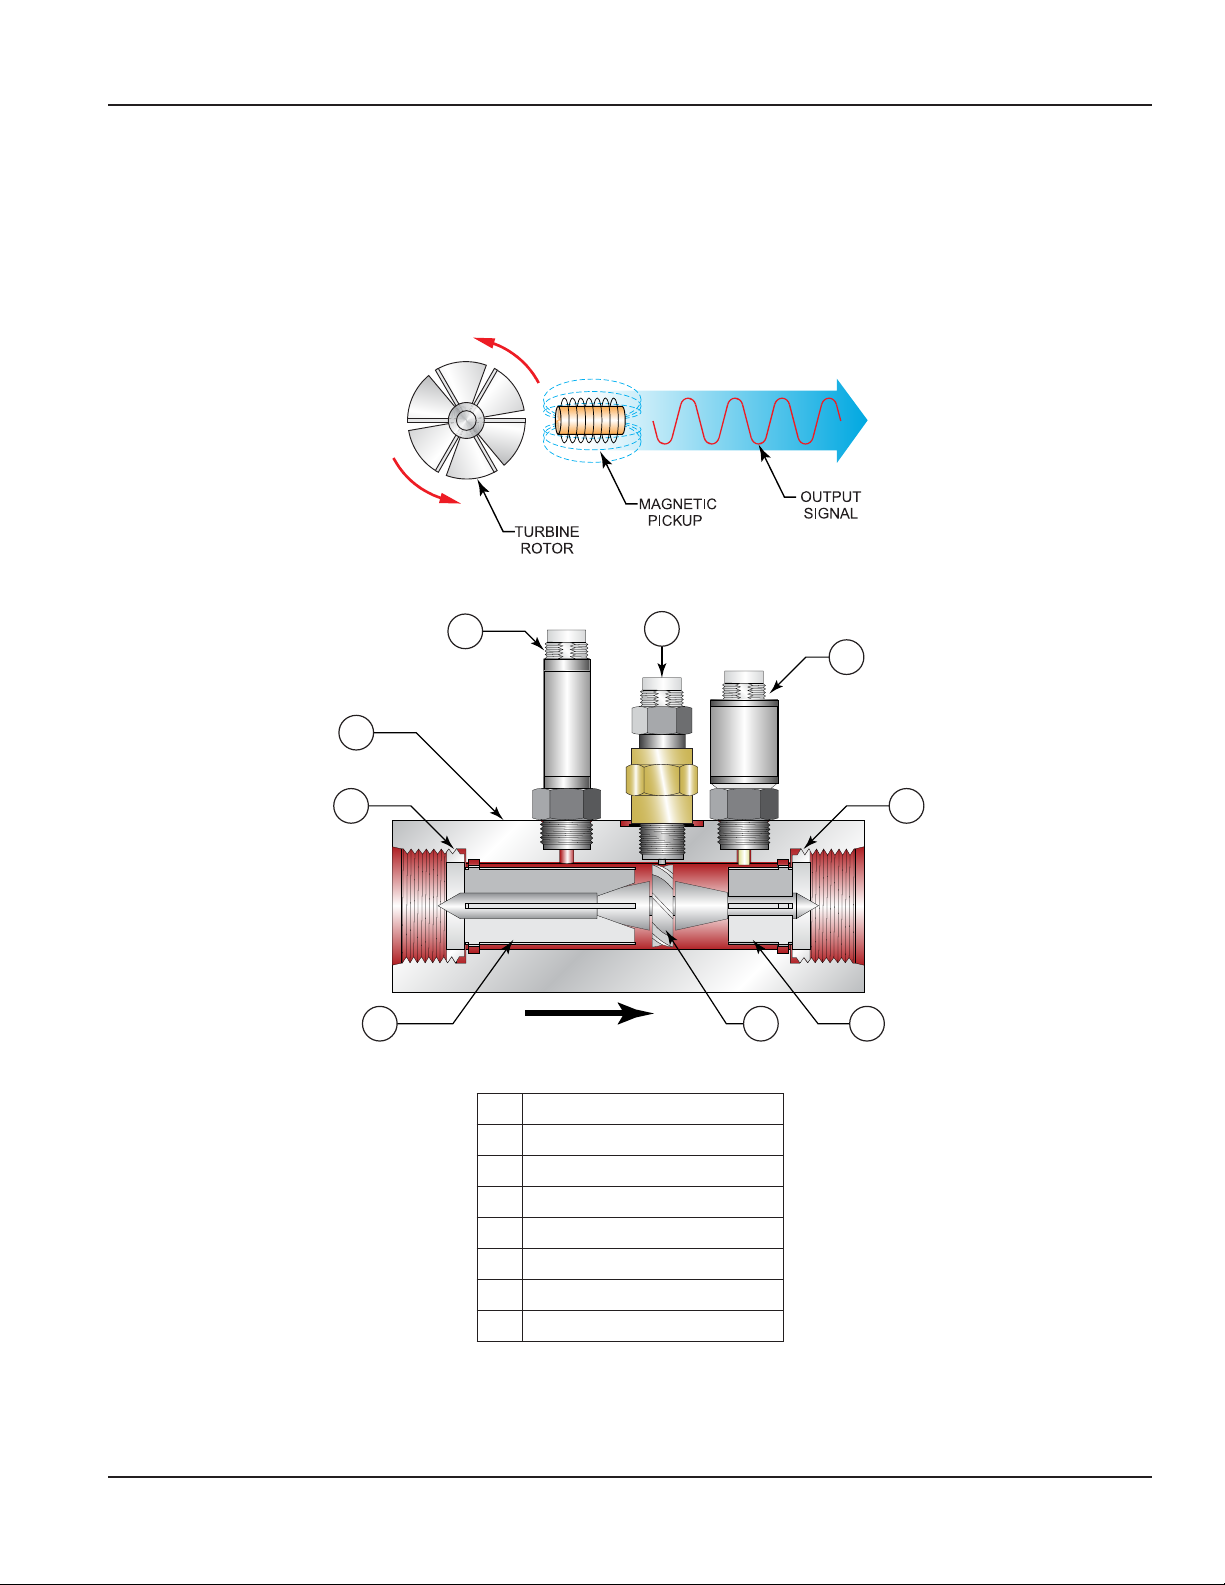
Fluid entering the meter passes through the inlet flow straightener, which reduces its turbulent flow pattern and improves the
fluid’s velocity profile. Fluid then passes through the turbine, causing it to rotate at a speed proportional to the fluid velocity.
As each turbine blade passes through the magnetic field, the blade generates an AC voltage pulse in the pickup coil at the
base of the magnetic pickup (see Figure 1). These pulses produce an output frequency proportional to the volumetric flow
through the meter. The output frequency represents flow rate and/or totalization of fluid passing through the turbine flow
meter. For a complete component orientation, see Figure 2.
Figure 1: Schematic illustration of electric signal generated by rotor movement
8
1
2
7
33
Flow Direction
Figure 2: Typical cross section of sensor array
1 Magnetic pickup
2 Temperature sensor
3 Retaining ring
4 Downstream rotor
5 Turbine rotor
6 Upstream rotor
7 Meter body
8 Pressure sensor
456
Page 5 February 2015 TST-UM-00017-EN-03
Page 6
Connections
CONNECTIONS
1
11 V
to GND
Flow
Sensor
Excitation
2
S-
Pt-100
E+
S+
E-
10 mV
7
3
5
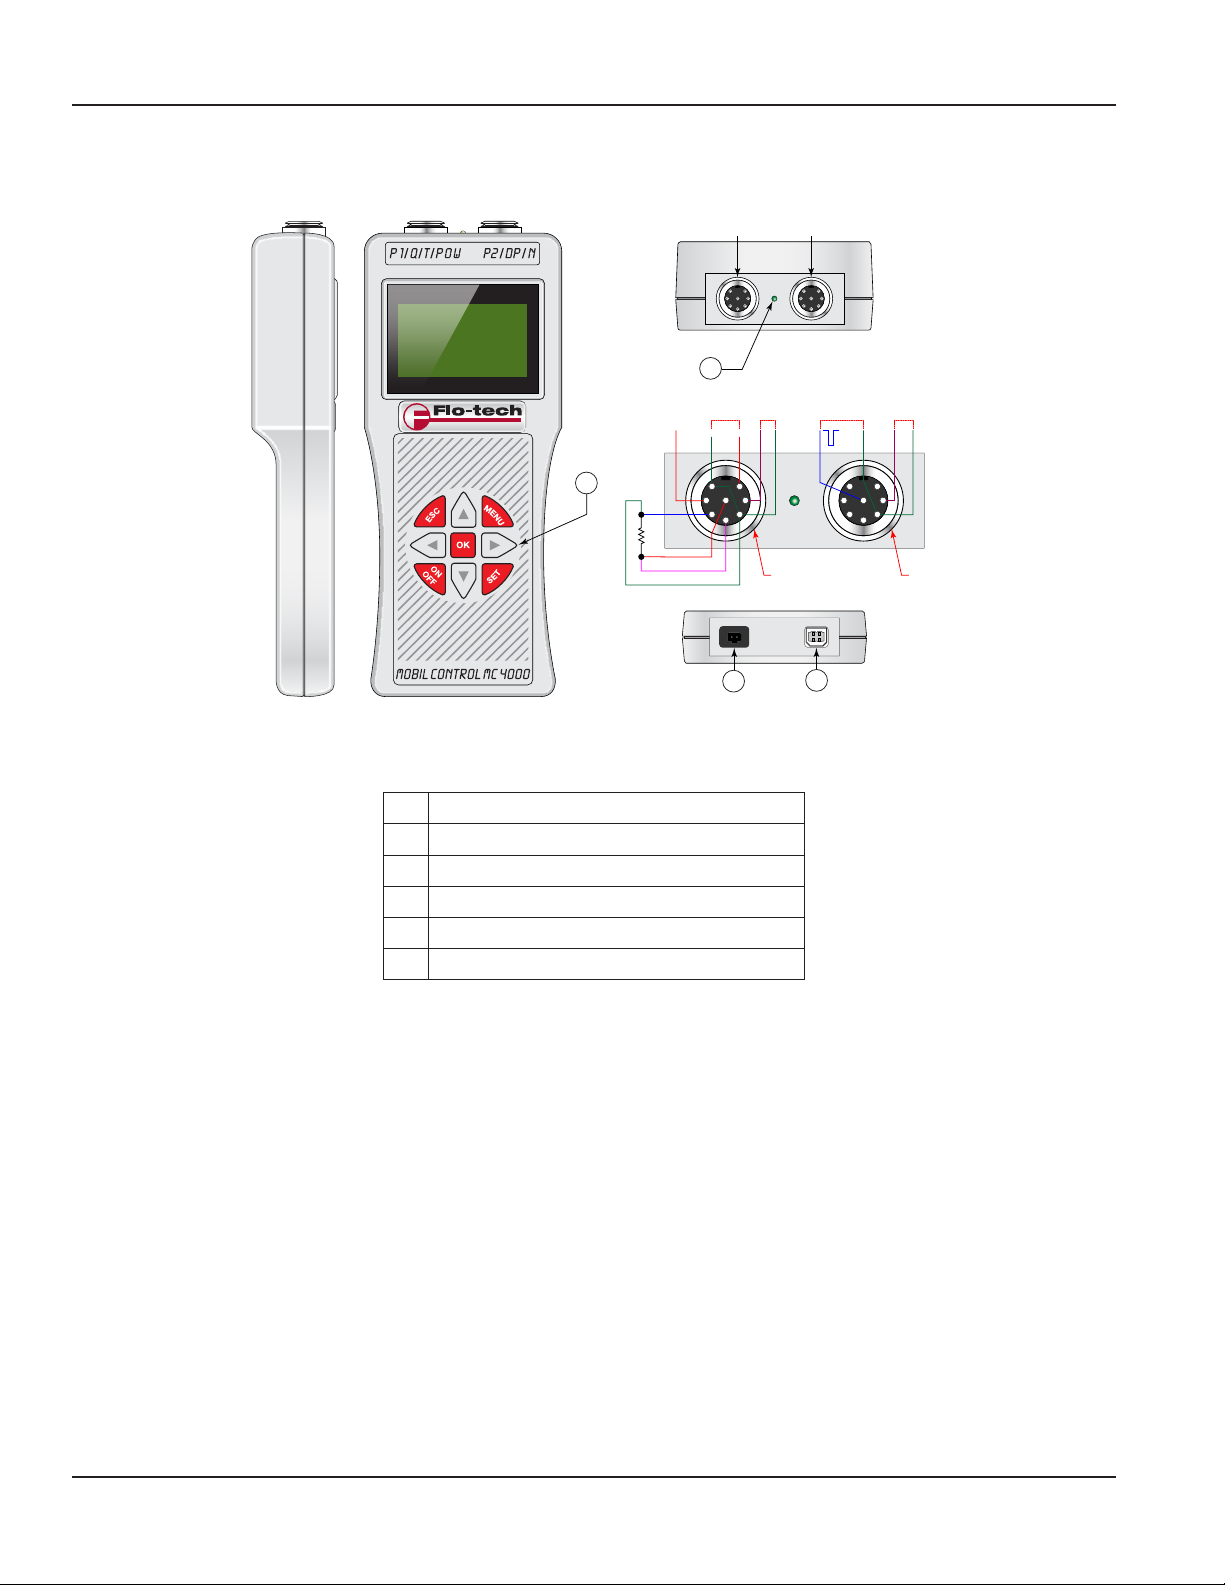
Figure 3: MC4000 controls and connections
P1
4-20 mA
T2
P2RPM Pulses
GND
T1
4-20 mA
GND
GND
6
7
1
8
3
4
5
2
T2
4
T1
(+) (-)
6
1
8
4
2
3
1 Battery charging indicator
T1 Flow, pressure and temperature sensors
T2 Auxiliary pressure sensor
2 Keypad
3 Battery charging
4 USB–B port
Table 1: Controls and connections locations
INSTALLATION
Check the interior of the meter for foreign material. Make sure the turbine rotor spins freely prior to installation. Additionally,
check and clear fluid lines of all debris.
Page 6 February 2015TST-UM-00017-EN-03
Page 7
Operation
OPERATION
Measuring Mode
OTE:N Any reference to the P2 pressure sensor assumes installation of the optional pressure sensor in the system.
Start the MC4000 by pressing ON OFF. The MC4000 performs a self-test and displays the version number of the firmware
and the unit's serial number. Additionally the setup parameters, the battery capacity, date, time ,and free memory are also
available. After the startup routine, the instrument automatically goes into measuring mode.
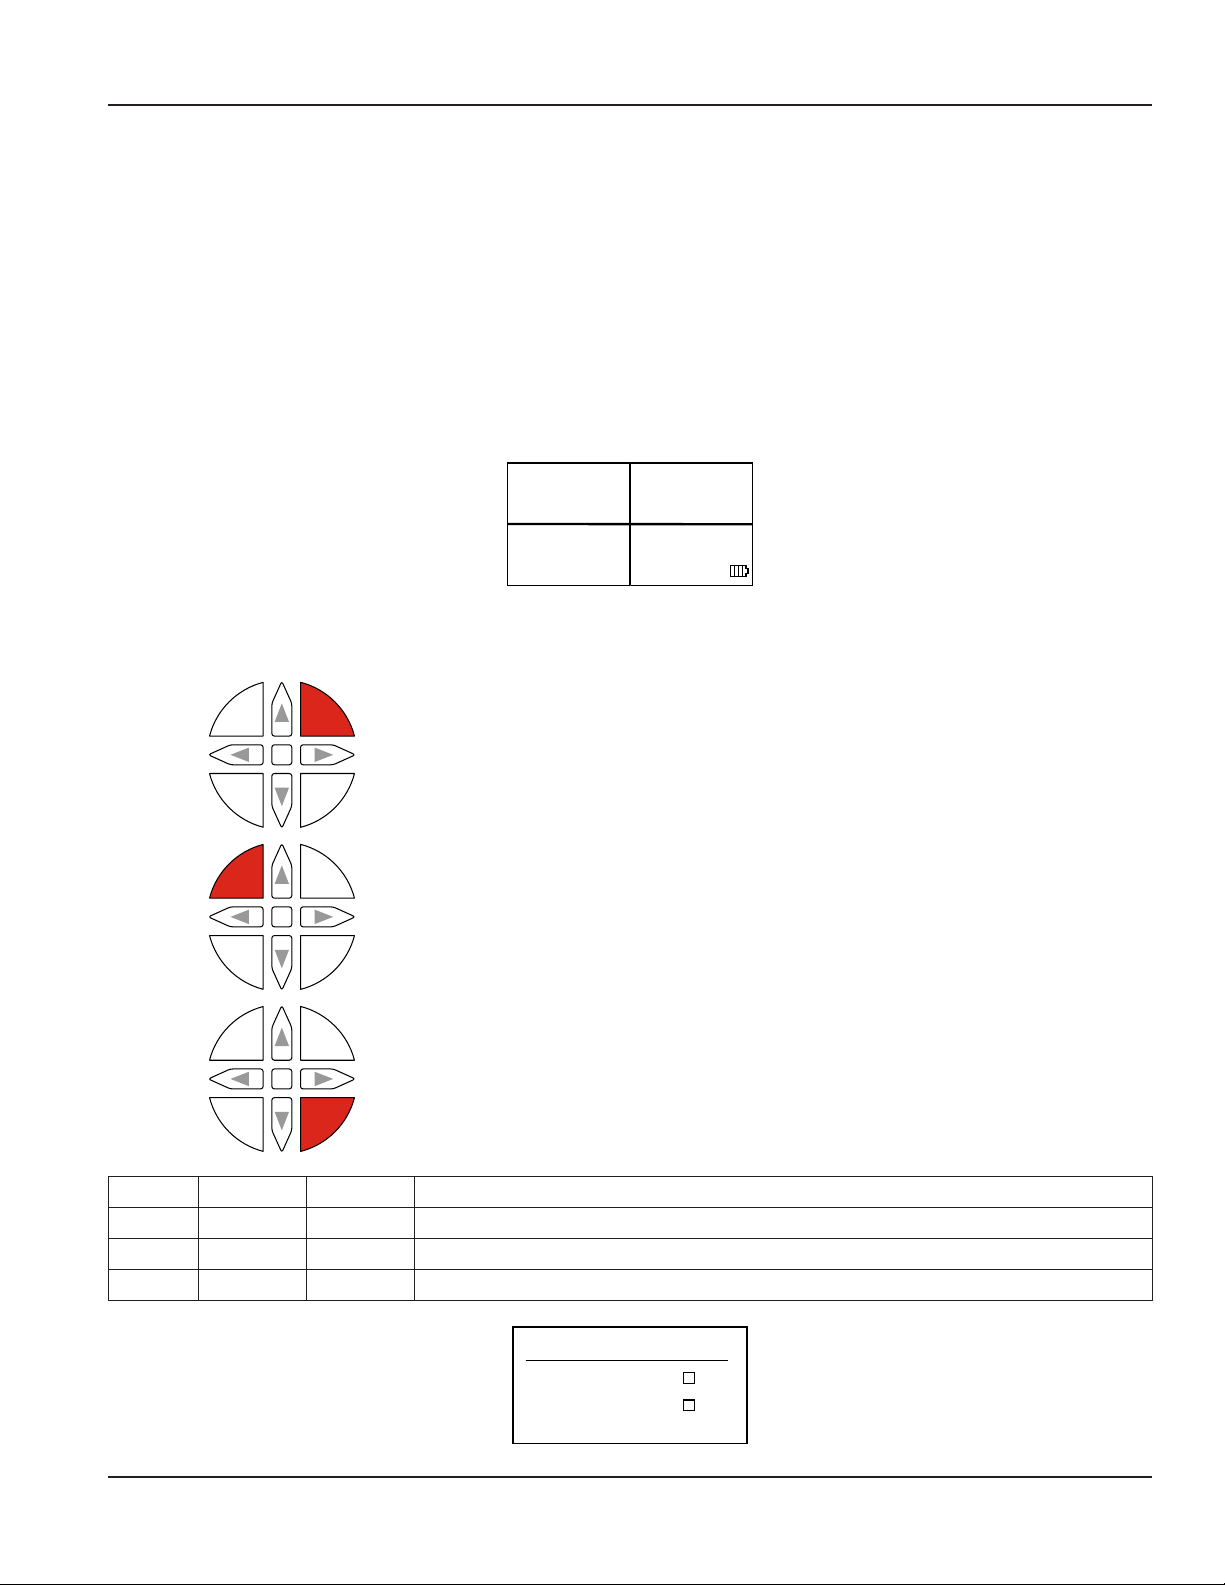
Four windows divide the screen. The two left windows show pressure measurements. The right upper window measures
the temperature and the right lower window shows flow or the rpm. Menu commands select the flow (Q) or the rpm (N).
Three dashes in a window indicates the absence of a sensor. A battery symbol in the lower right display corner indicates the
battery capacity.
Function buttons MENU, ESC and SET
MENU
OK
SET
MENU
OK
SET
MENU
OK
SET
OFF
OFF
OFF
ESC
ON
ESC
ON
ESC
ON
P1 bar
74.32
P2 bar
76.12
Figure 4: Display in measuring mode
T °C
86.5
Q l/min
38.4
• Access menu commands.
• Scroll through menu options, press and hold to automatically scroll through
menu options at one second intervals.
• Backwards menu steps.
• Press three times to switch to measuring mode.
• Activate tare in both P1 and P2 pressure channels
OFFSET P1 SET Set pressure P1 to zero – Tare P1
OFFSET P1 RES Cancel the tare function – No Tare P1
OFFSET P2 SET Set pressure P2 to zero – Tare P2
OFFSET P2 RES Cancel the tare function – No Tare P2
OFFSET
OFFSET P1 SET
OFFSET P1 RES
OFFSET P2 SET
OFFSET P2 RES
Page 7 February 2015 TST-UM-00017-EN-03
Page 8
Operation
P1 bar
124.3
P1-P2 bar
13.5
PW kW
38.4
P2 bar
24.1
P1 bar
82.2
Q l/min
13.4
T °C
83.3
P2 bar
108.7
P2 bar
64.6
P1 bar
124.3
P1 bar
82.2
T °C
83.3
Q l/min
13.4
P2 bar
4.1
P2 bar
64.6
P1 bar
12.3
P1 bar
12.3
P1-P2 bar
13.55
PW kW
38.4
P2 bar
4.1
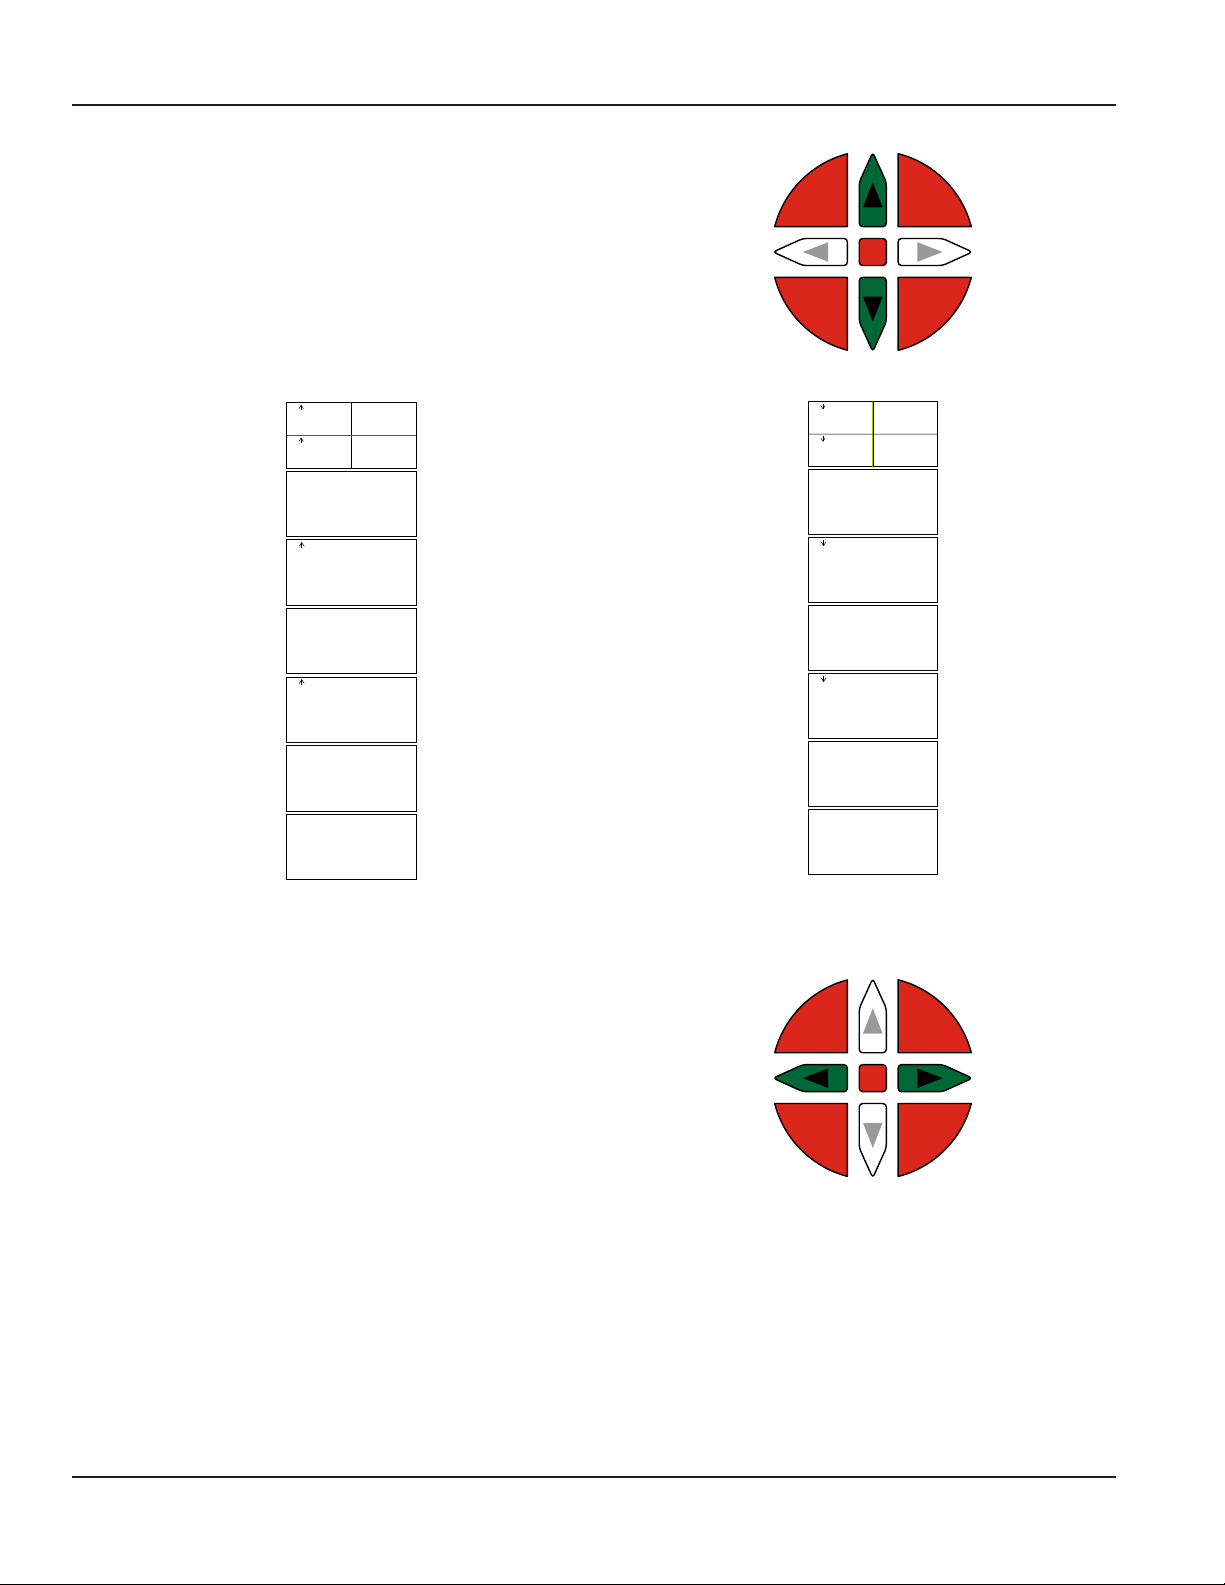
Up and Down Arrow Buttons
Press UP or DOWN to view any of following display modes:
• Peak & valley, pressure difference, power
• Large display mode for pressure P1 or P2
• Large display mode for temperature
• Large display mode for flow and rpm
ESC
OFF
MENU
OK
ON
SET
Large display modes display in this sequence by pressing UP.
Large display modes display in this sequence by
Left and Right Arrow Buttons
• Pressing LEFT resets the peak & valley memory.
• Pressing RIGHT returns to measuring mode.
Page 8 February 2015TST-UM-00017-EN-03
pressing DOWN.
MENU
ESC
OK
ON
OFF
SET
Page 9
Operation
Programming Menu
Press MENU to open the programming menu. Continue to press MENU to scroll through the user settings and measurement
parameters on the display. Press UP or DOWN to scroll through the options available for each parameter. Press OK to store
any new settings, the display will read DATA STORED. Press ESC to scroll backwards through the menu choices. Press ESC three
times to return to measuring mode.
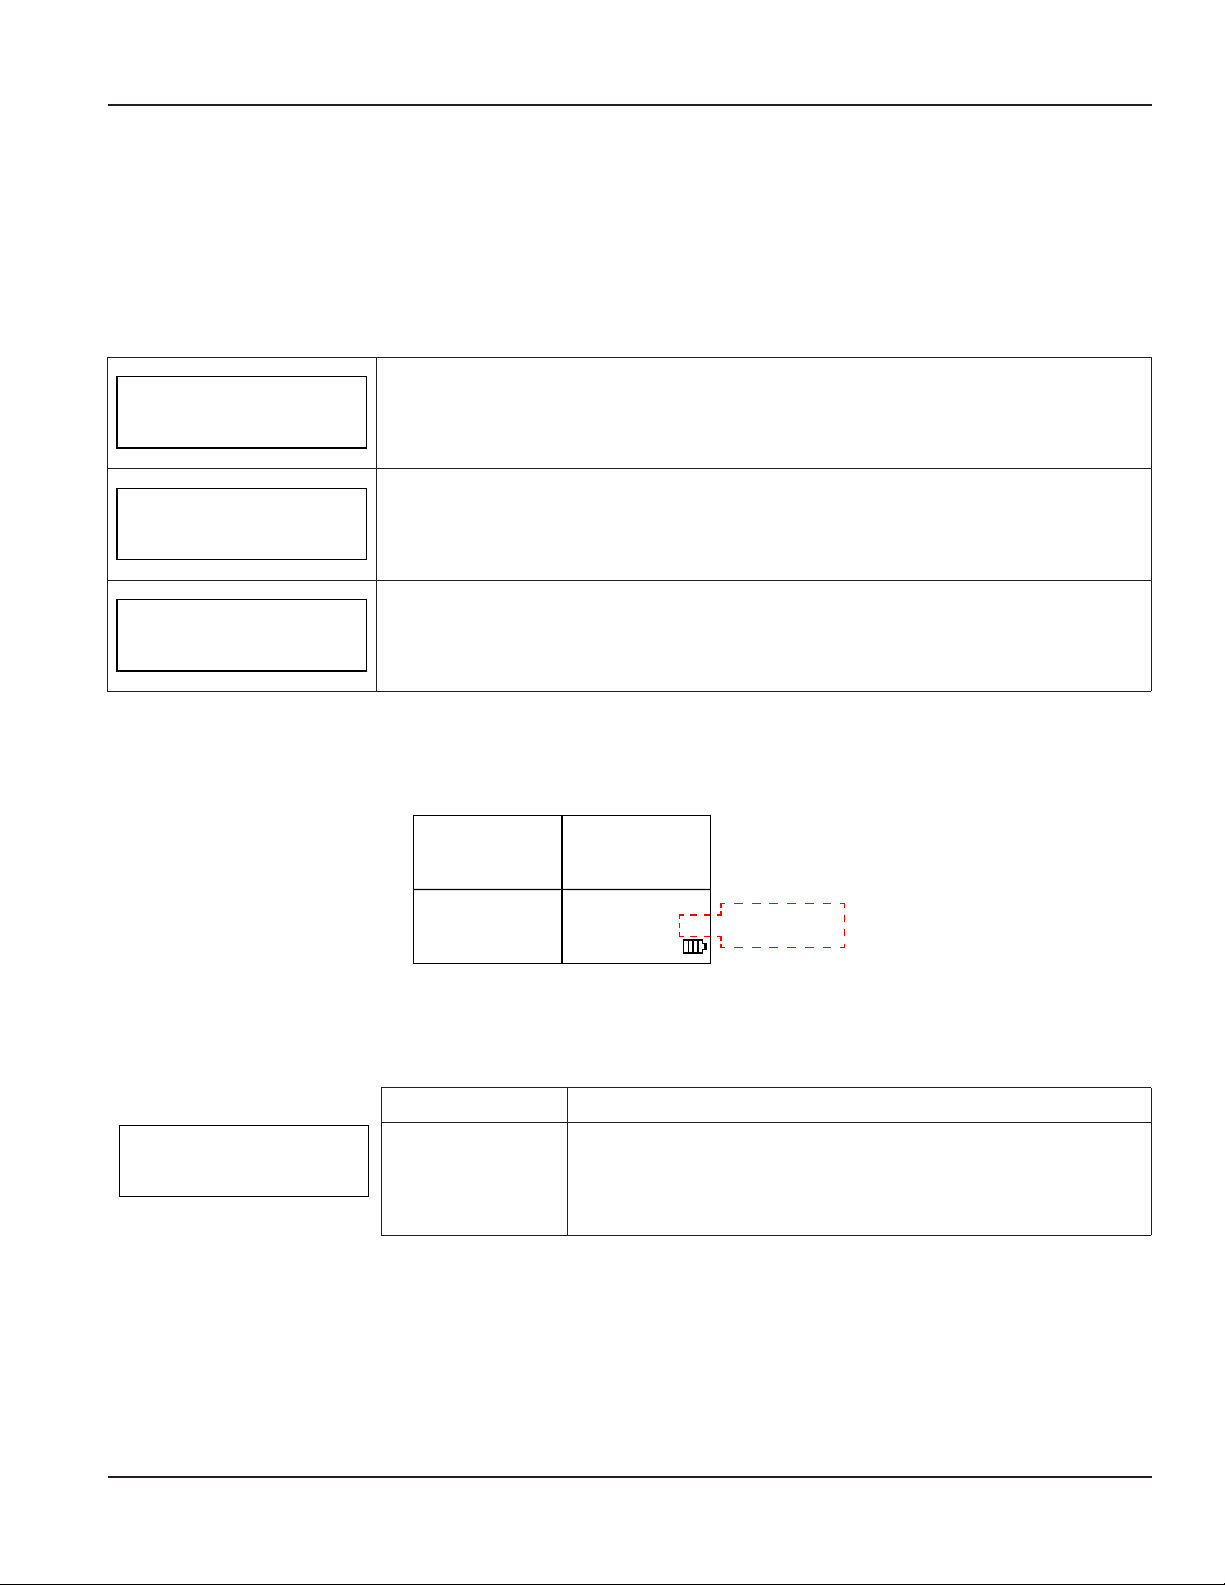
Datalogger
The datalogger parameter allows you to start, stop or delete recorded measurement sessions.
DATALOGGER
STORE OFF
DATALOGGER
STORE ON
DATALOGGER
STORE DELETE
The internal memory can save all displayed measurements and permits 224 individual records at a total capacity of 2.5 MB.
To start a new datalogging session, press OK at the STORE ON prompt. After starting a new datalogging session, press ESC to
switch the display to measuring mode. In measuring mode, an M icon indicates an active datalogging session, see Figure 5.
Stored datalogging sessions can be uploaded to a computer, using the USB data port, for further processing.
This command stops recording the datalogging information to memory. Press OK to stop
an active datalogging session. The screen will display DATA STORED.
This command starts recording data at a selected interval rate, see "Save Interval" below.
Each record automatically adds the date and time from an internal real time clock. To start a
new datalogging session press OK. The screen will display DATA STORED.
This command deletes all stored data. To delete data press OK, the unit will display ERASE
DATA ? Press OK again to confirm the request. The screen will display DATA ERASED.
P1 bar
74.32
P2 bar
76.12
T °C
86.5
Q l/min
M
38.4
Logging Active
Indication
Figure 5: Active datalogging session display
Save Interval
The save interval is the time between two consecutive recording cycles set in fixed increments as shown below.
Selection Function
SAVE INTERVAL
1 s
1s, 2s, 5s, 15s, 30s,
60s, 120s, 300s, 600s,
1200s, 1800s, 2700s,
3600s, 7200s
This command sets the time, in seconds, between two recording
cycles. Press UP or DOWN to scroll through each interval, when
the correct interval is displayed, press OK to select the interval. The
screen will display DATA STORED.
Page 9 February 2015 TST-UM-00017-EN-03
Page 10
Operation
Int = 1ms L = 10% T = 240 s
Int = 1ms L = 10% T = 138 s
Fast Transients
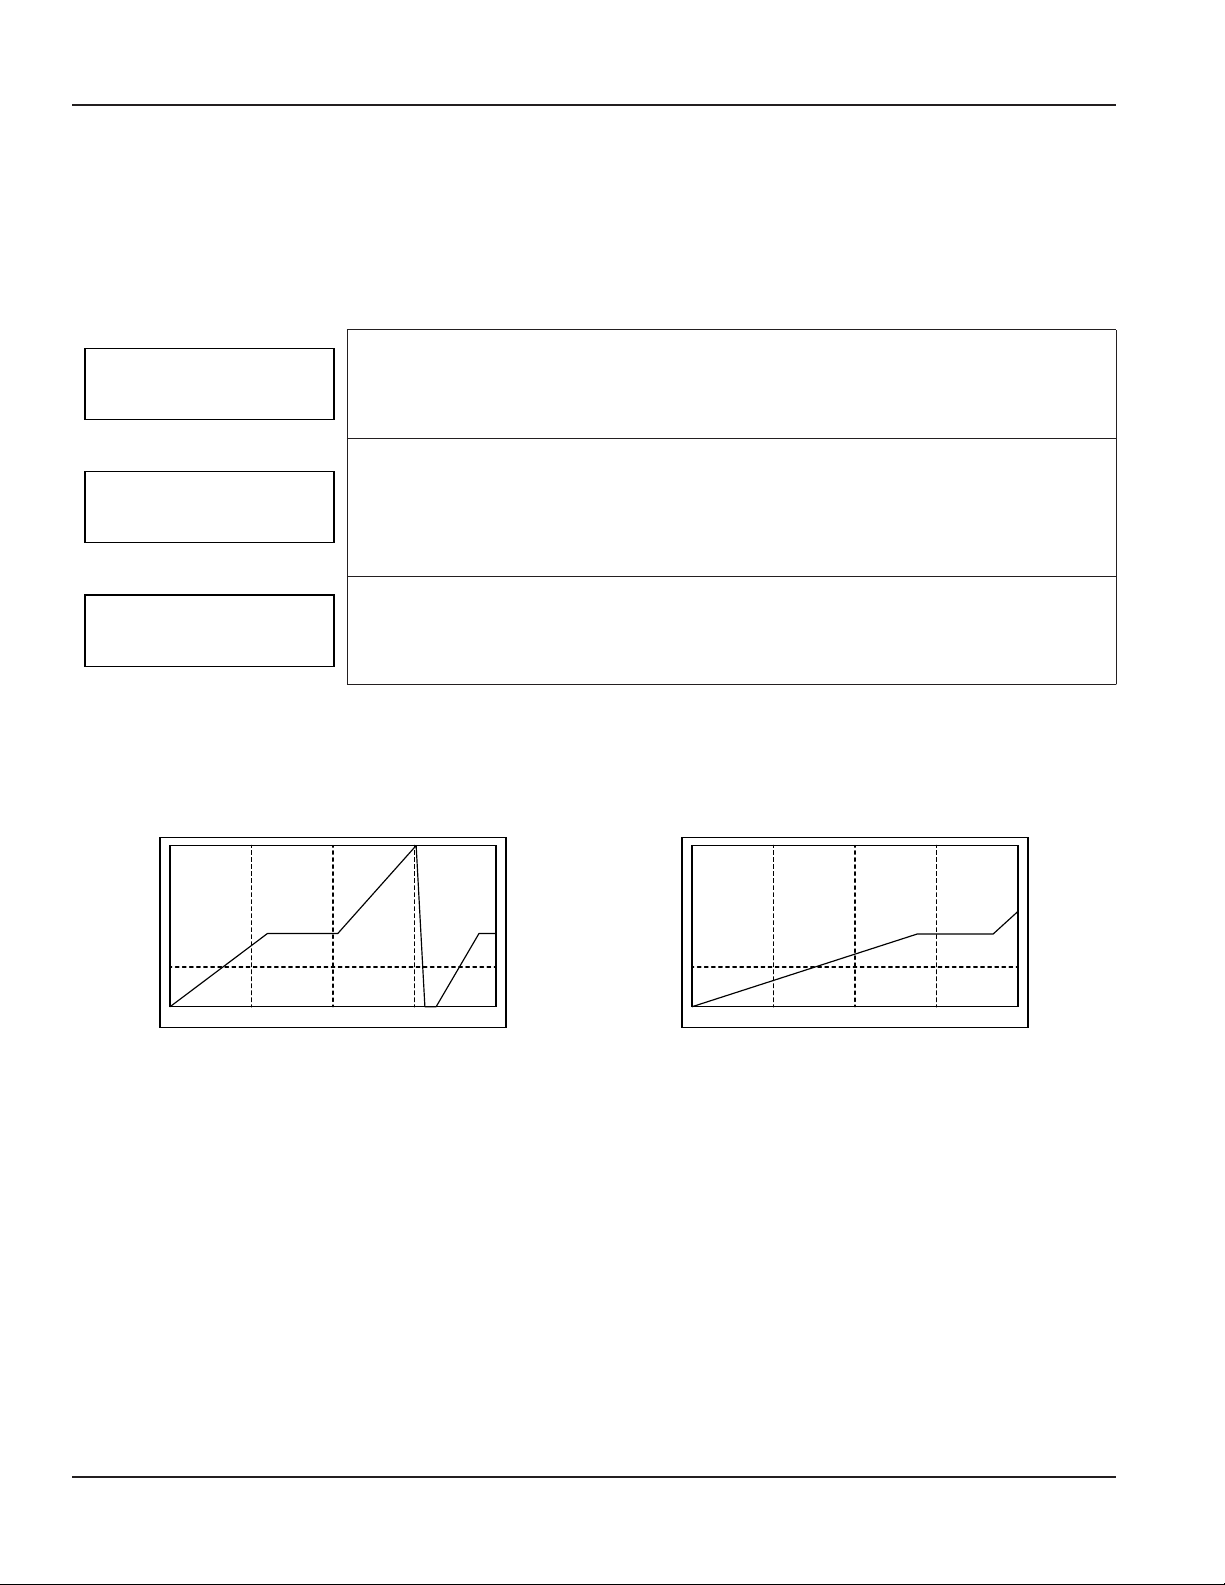
In the transient menu, you have the option to delete, start, or show a transient. There are two memory locations available
to record transients, TRANSIENT NO.1 and TRANSIENT NO.2. Before a new transient can be started, one must be deleted from
the memory by pressing OK at the TRANSIENT DELETE prompt. Each transient contains a maximum 240,000 samples. For
example, with a sampling rate of 1 ms the memory capacity is 240 seconds in each memory location. Press OK to begin
recording, the minimum recording time is 30 s. To stop recording, press and hold OK for at least ve seconds, DATA STORED is
automatically displayed.
TRANSIENTS
NO. 1 DELETE
TRANSIENTS
NO. 1 START
TRANSIENTS
NO. 1 SHOW
OTE:N The controls for transient 2 work the same way as the controls for transient 1.
The SHOW selection displays the stored measurements as graphs. The X-axis shows the elapsed recorded
time, the Y-axis shows 0…100% of the full scale pressure set in the pressure channel P1 parameter setup. See
"Scaling for Pressure Sensors" on page 11. Any recording may be stopped by pressing OK before reaching the end of the 240
second maximum record length.
Recorded data, in the transient 1 memory location, is deleted by pressing OK at the
TRANSIENT NO. 1 DELETE prompt. The unit will display ERASE DATA? Press OK again to
confirm the request. The screen will display DATA ERASED.
Data recording, in the Transient 1 memory location, is started by pressing OK at the
TRANSIENT NO. 1 START prompt. The screen will display TRANSIENT STORED until the storage
session is stopped. To stop the transient, press and hold OK after the minimum recording
time of 30 seconds. The display will show a graph of the data.
This prompt will not display if a transient is currently stored on the device at that location.
A graph of the transient 1 data is displayed by pressing OK at the TRANSIENT NO. 1 SHOW
prompt, see Figure 6.
This prompt will not display if there is not a transient stored on the device at that location.
Record using the full memory capacity. Record terminated after 138 seconds.
Figure 6: Graphical pressure representations
Press ESC to return the display to the transients menu.
Page 10 February 2015TST-UM-00017-EN-03
Page 11
Operation
Threshold
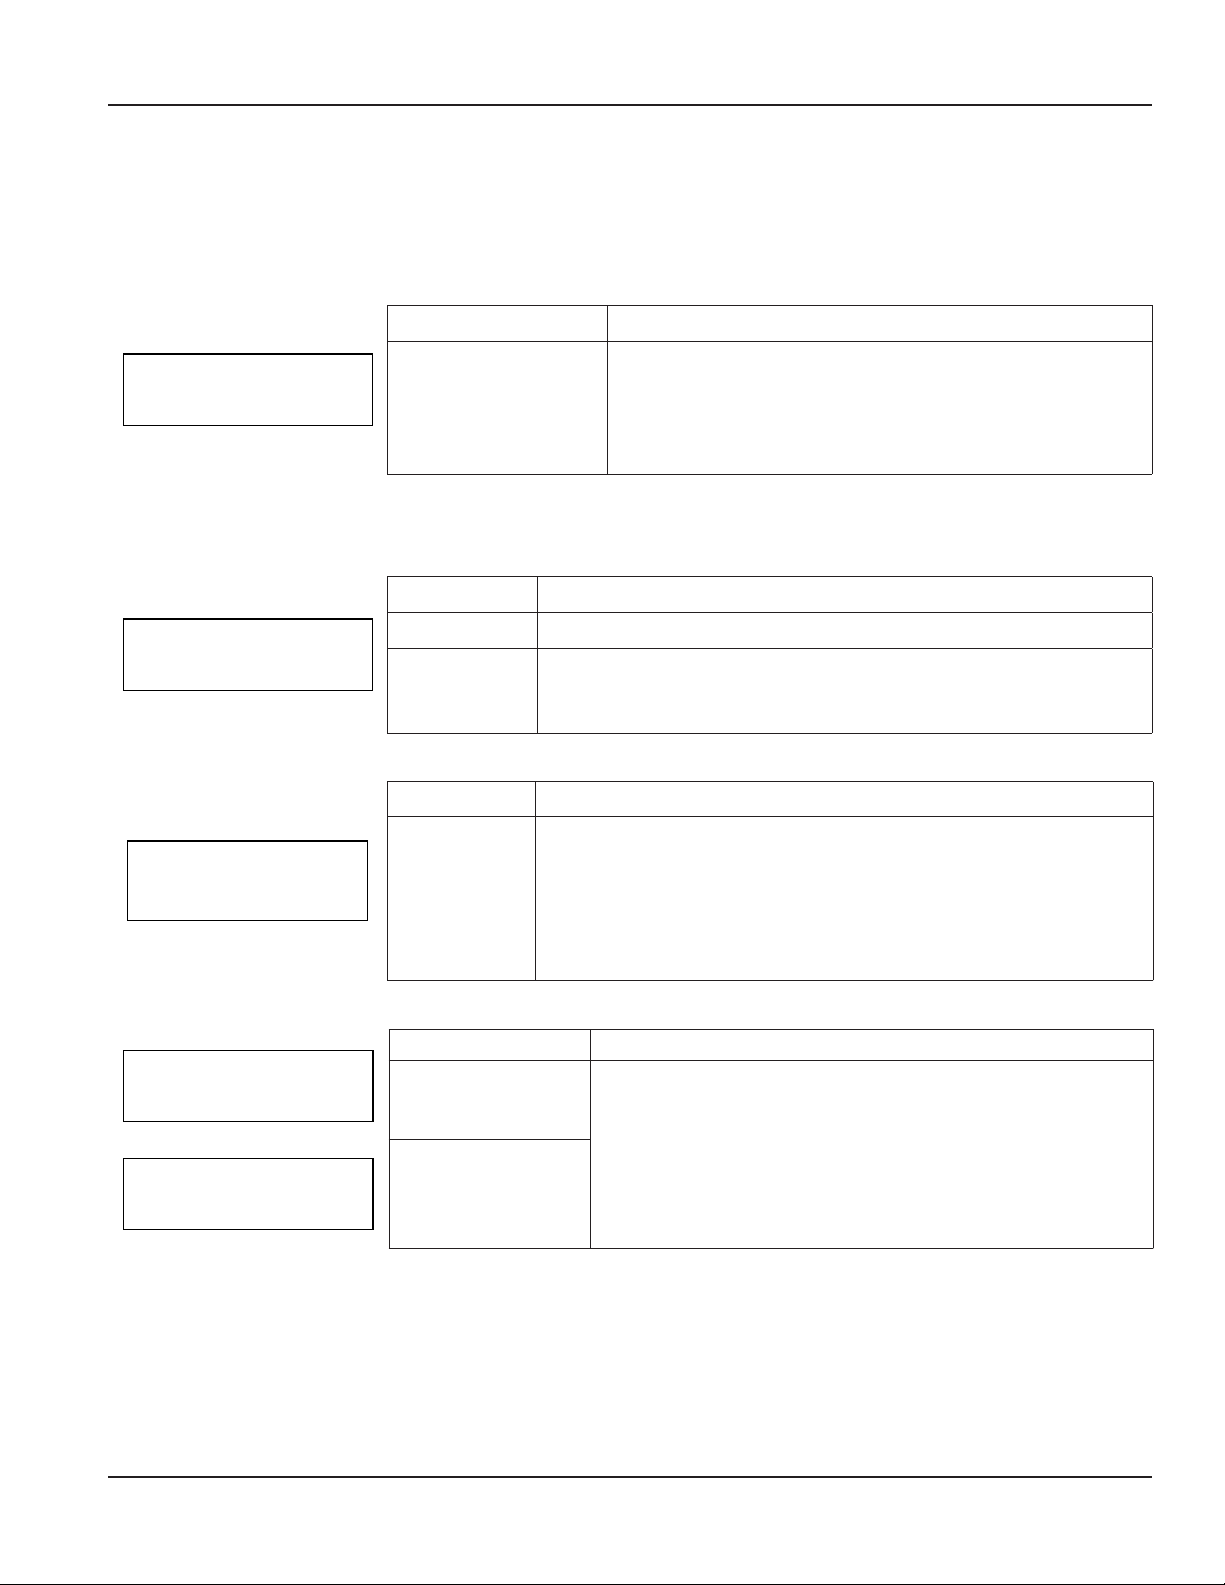
The threshold function defines the level at which pressure recordings begin. For example, if the THRESHOLD SIGNAL is set to
>20%, the pressure recording will not begin until the pressure exceeds 20% of the maximum pressure set for that sensor. The
threshold is set using a percentage of the maximum value used to scale 20 mA input in the SCALE P1 or SCALE P2 menu item.
With threshold set for example at >10% the recording starts when the pressure transducer is sending 5.6 mA of current to the
MC4000 display. If scaled for 200 psi, pressure sensor P1 begins recording as soon as the pressure reaches 20 psi.
Selection Function
THRESHOLD
SIGNAL <10 %
At the end of a recording cycle, the display automatically shows the graphs corresponding to the stored data from the P1
pressure transducer.
Backlight
BACKLIGHT
LIGHT OFF
Date and Time
DATE AND TIME
21:32:45 AM
29/03/13
>10%, <10%…>90%,
<90% in steps of 10%
Selection Function
BACKLIGHT OFF The backlight is off.
The display illuminates for 30 seconds each time any of the buttons are
BACKLIGHT ON
Selection Function
HH : MM : SS
DD : MM : YY
pressed. Press OK at this prompt to turn the backlight on. The backlight
set to on reduces battery life.
This command sets the internal clock with the time and date. In this
prompt, the number that is selected for change will blink. To increase
the number press UP, to decrease the number press DOWN. Once you
have reached the appropriate number, press RIGHT to move to the next
number that needs to be changed. When you are finished press OK. The
screen will display DATA STORED.
The recording starts as soon as the input signal exceeds the
selected level. Scroll through the options using UP and DOWN,
when the needed threshold is reached, press OK. The screen
will display DATA STORED. For records that have to begin at zero
signal level, use <10%.
Scaling for Pressure Sensors
SCALE P1
+ 100.000
SCALE P2
+ 2.00000
Selection Function
+000.000…+999.999
+0.00000…+9.99999
This parameter sets the full-scale reading at the point the
pressure sensor P1 and P2 has an output of 20 mA. In this prompt,
the number that is selected for change will blink. To increase the
number press UP, to decrease the number press DOWN. Once
you have reached the appropriate number, press RIGHT to move
to the next number that needs to be changed. When you are
finished press OK. The screen will display DATA STORED.
Page 11 February 2015 TST-UM-00017-EN-03
Page 12
Operation
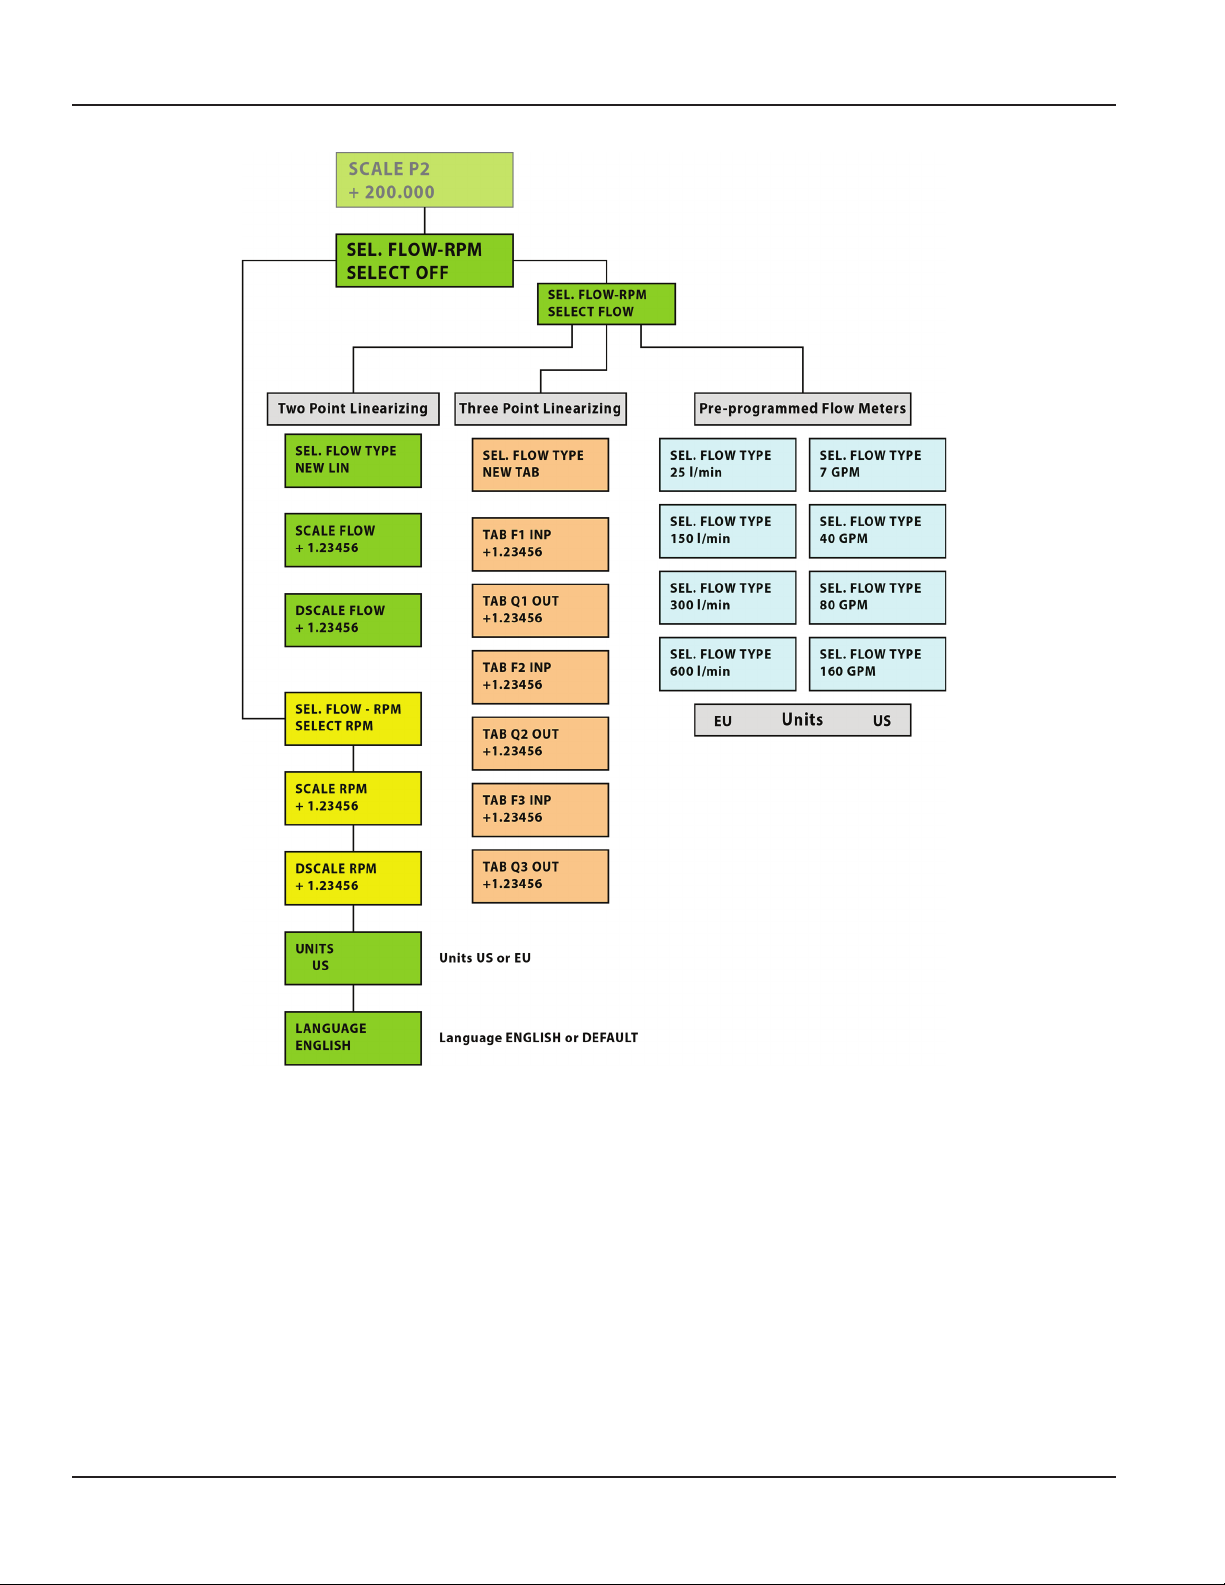
Figure 7: Programming menu map
To exit the programming menu and return to measuring mode, press ESC three times.
Page 12 February 2015TST-UM-00017-EN-03
Page 13

Supplementary Measurements
Power (HP) =
1720
Pressure (psi) x Flow (gpm)
Power (kW) =
600
Pressure (bar) x Flow (lpm)
1720
1450.4 (psi) x 52.84 (gpm)
= 44.56 HP
Power (kW) =
600
100 (bar) x 200 (lpm)
= 33.33 kW
SUPPLEMENTARY MEASUREMENTS
Peak and Valley
While the MC4000 is in operation, the maximum and minimum pressure measurements from both pressure transducers, P1
and P2, record automatically. Pressing UP or DOWN displays the measurements.
In measuring mode press UP to display the maximum values recorded by pressure sensors P1 and P2. The small arrows on the
display points up, indicating displayed readings are the maximums (see Figure 8). Press DOWN to display the minimum values
of P1 and P2. The small arrow on the display points down, indicating displayed readings are the minimums (see Figure 8).
P1 bar
124.32
P2 bar
86.56
Pressure Dierence
The upper right quadrant of the display shows the pressure difference between pressure transducer P1 and P2. Stored
maximum and minimum readings show in the left side quadrants of the display (see Figure 8).
Power
The lower right quadrant shows the instantaneous power reading in either HP or kW. See Figure 8. The pressure units are
either psi or bar, temperature readings are in either º F or º C.
It is important that the pressure entries and scaling use consistent units of psi and º F for US measurements or bar and º C for
EU measurements. Unpredictable results occur if the pressure and temperature units are mismatched.
Power Calculations
P1-P2 bar
13.55
PW kW
38.4
P1
124.32
P2 bar
24.12
Figure 8: Pressure display screens
P1-P2 bar
bar
13.55
PW HP
38.4
US
The power calculation
Examples
US–When programmed in US units of pressure (psi) and flow (gpm), the power is calculated in HP.
Pressure = 1450.4 psi
Flow = 52.84 gpm
Power (HP) =
DIN–When programmed in DIN units of pressure (bar) and flow(lpm), the power is calculated in kW.
Pressure = 100 bar
Flow = 200 lpm
Page 13 February 2015 TST-UM-00017-EN-03
Page 14

Supplementary Measurements
SCALE =
Maximum Frequency
Maximum Flow Rate
DSCALE
Input Frequency x SCALE
SCALE =
765 Hz
80 gallons
= 0.1046
SCALE =
2632 Hz
7 gallons
= 0.0026596
Two Point Flow Sensor Calibration Using the New Lin Function
The MC4000 menu contains two scaling parameters; SCALE and a scaling divisor referred to as the DSCALE. The MC4000 flow
sensor output signal is a frequency that is proportional to the rate of flow and the monitor uses the frequency information to
calculate volumetric flow rate and total flow. The raw frequency from the turbine flow sensor requires scaling by a constant
in order to achieve a display reading in the required flow units. The MC4000 refers to this constant as the SCALE defined
as follows.
The DSCALE setting is used to shift the decimal point, and is particularly useful when the SCALE parameter is a very small
number in the case of small, high frequency turbine flow sensors.
Calculated flow readings in the MC4000 use the following formula.
Display Reading =
Example
A typical 1 in. turbine flow sensor would have the following characteristics.
Maximum Flow = 80 gpm
Maximum Frequency = 765 Hz
The scale factor calculation is:
The value for this sensor entered into the SCALE parameter would be 0.1046. In this case a DSCALE value of 1.000 would give
correct readings on the MC4000 display.
Using a larger value for DSCALE offers higher resolution and is especially useful when the SCALE value has several leading
zeroes in it.
Example
A small turbine flow sensor has the following full scale values.
Maximum Flow = 7 gpm
Maximum Frequency = 2632 Hz
Because of display limitations, better results are obtained by multiplying the SCALE value by 1000 and using a DSCALE value
of 1000.
Page 14 February 2015TST-UM-00017-EN-03
Page 15
Supplementary Measurements
Three Point Flow Sensors Linearizing Using the New Tab Function
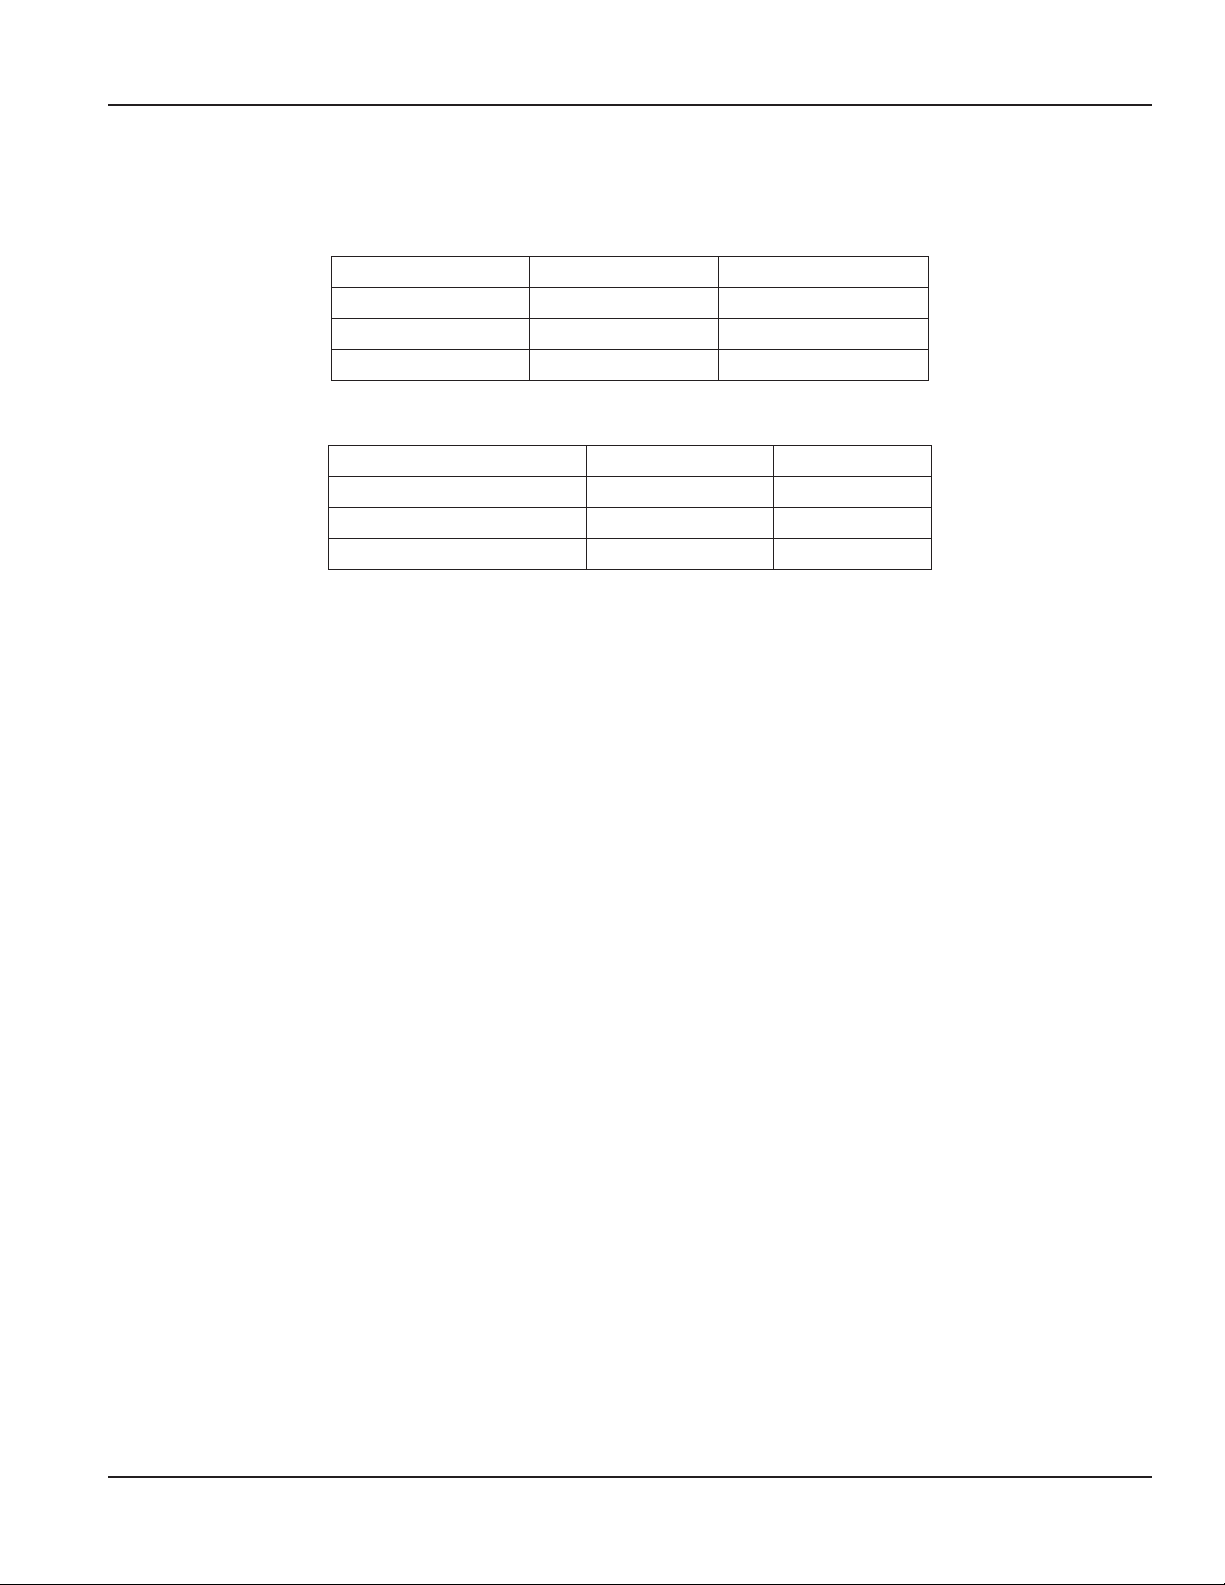
Linearization achieves better accuracy of the flow sensor connected to the MC4000. The MC4000 is capable of using up to
three linearization points. The points are entered in pairs of frequency values with their associated flow rates. The linear point
pairs can be entered using the MC4000 keyboard or from a connected PC.
Linearization Point Frequency (Hz) Flow Rate (Q)
1 Frequency F1 Flow Rate Q1
2 Frequency F2 Flow Rate Q2
3 Frequency F3 Flow Rate Q2
The linearization menu makes the assignment of both the frequencies and display readings.
Example
Linearization Pair Number Frequency Values Flow Values
Linearization Pair 1 0 Hz 0 lpm
Linearization Pair 2 166 Hz 66 lpm
Linearization Pair 3 630 Hz 150 lpm
Page 15 February 2015 TST-UM-00017-EN-03
Page 16
MC4CON Software
MC4CON
German
Spanish
Italian
MC4CON
French
setup.exe
COM Port Set
MC4CON SOFTWARE
Installation
The MC4000 datalogger connects to a PC by means of a standard USB-A to USB-B cable. The installation requires about 8MB
of disk space under Windows.
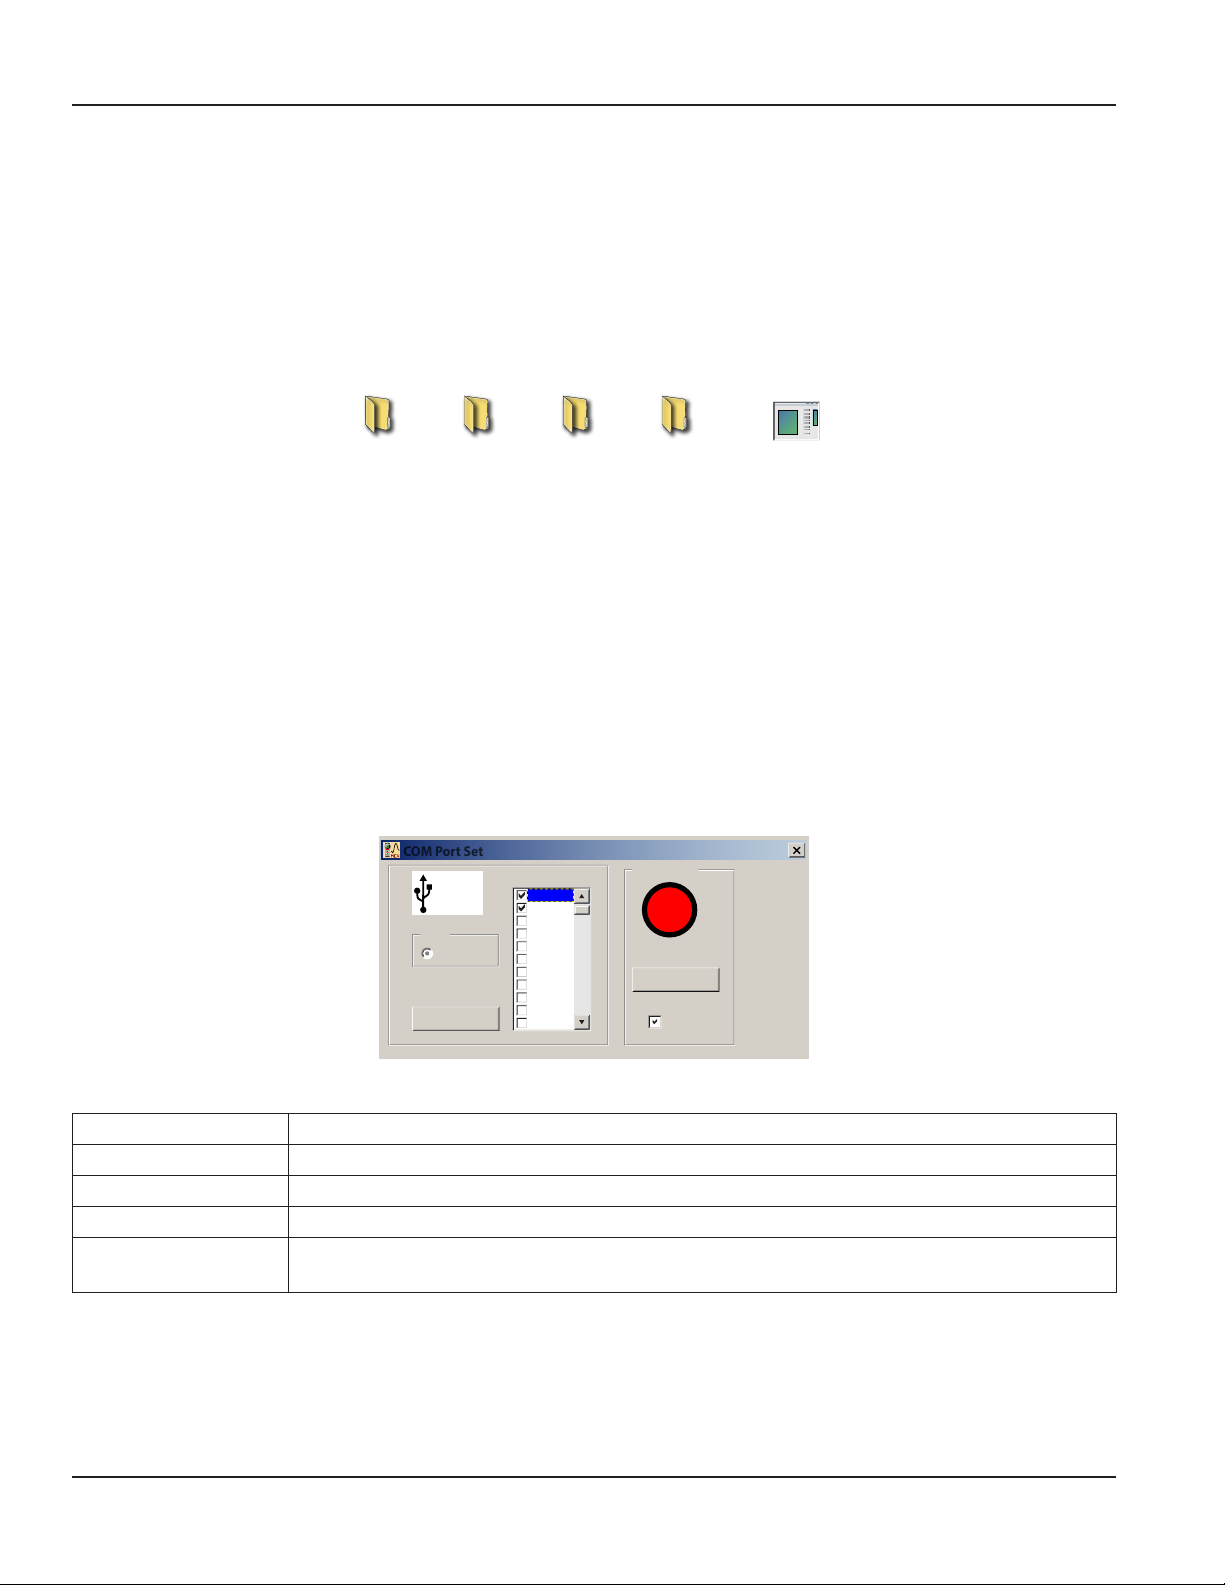
After inserting the CD into the PC's DVD/CD drive, the MC4CON.exe setup utility opens automatically and installs the MC4CON
software on the PC. If the MC4CON.exe setup utility does not start, navigate to the DVD/CD drive and open one of the setup
files as shown in Figure 9, and then double click on the setup.exe file to start the installation
MC4CON
Figure 9: Setup folders and setup icon
MC4CON
Communication
MC4CON software allows bi-directional communication between a PC and the MC4000 datalogging utility. Communications
between the MC4000 and a PC is via the USB port that runs at 230,400 baud. The datalogger function is fully programmable
from a PC using the MC4000 in download mode. In upload mode, the PC transfers all recorded data, transients and
parameters to the MC4000 for manipulation.
The program automatically searches for an available communications port. When the MC4000 software finds an open
port and establishes communications with MC4000, the Connection indicator turns green, see Figure 10 on page 16.
Disconnecting and then re-connecting the USB cable during communication severs the communication link between the PC
and the MC4000. To re-establish communications, select Find COM. The communication will automatically be re-established.
COM Port Set Controls
COM Port Set
USB
Baud
230,400
O.K.
COM
OFF
COM 1
COM 2
COM 3
COM 4
COM 5
COM 6
COM 7
COM 8
COM 9
COM 10
Connection
Find COM
Stop
Figure 10: COM port controls
Button Function
Find COM Re-establish the communication when interrupted as experienced due to a disconnected cable.
OK Starts the search for an open COM port.
Stop Stop searching for an open COM port.
Connection
Page 16 February 2015TST-UM-00017-EN-03
Turns green when communications are established between the MC4CON software and an
MC4000 MC4000 Handheld Hydraulic System Analyzer.
Page 17
Menu Structure
Exit
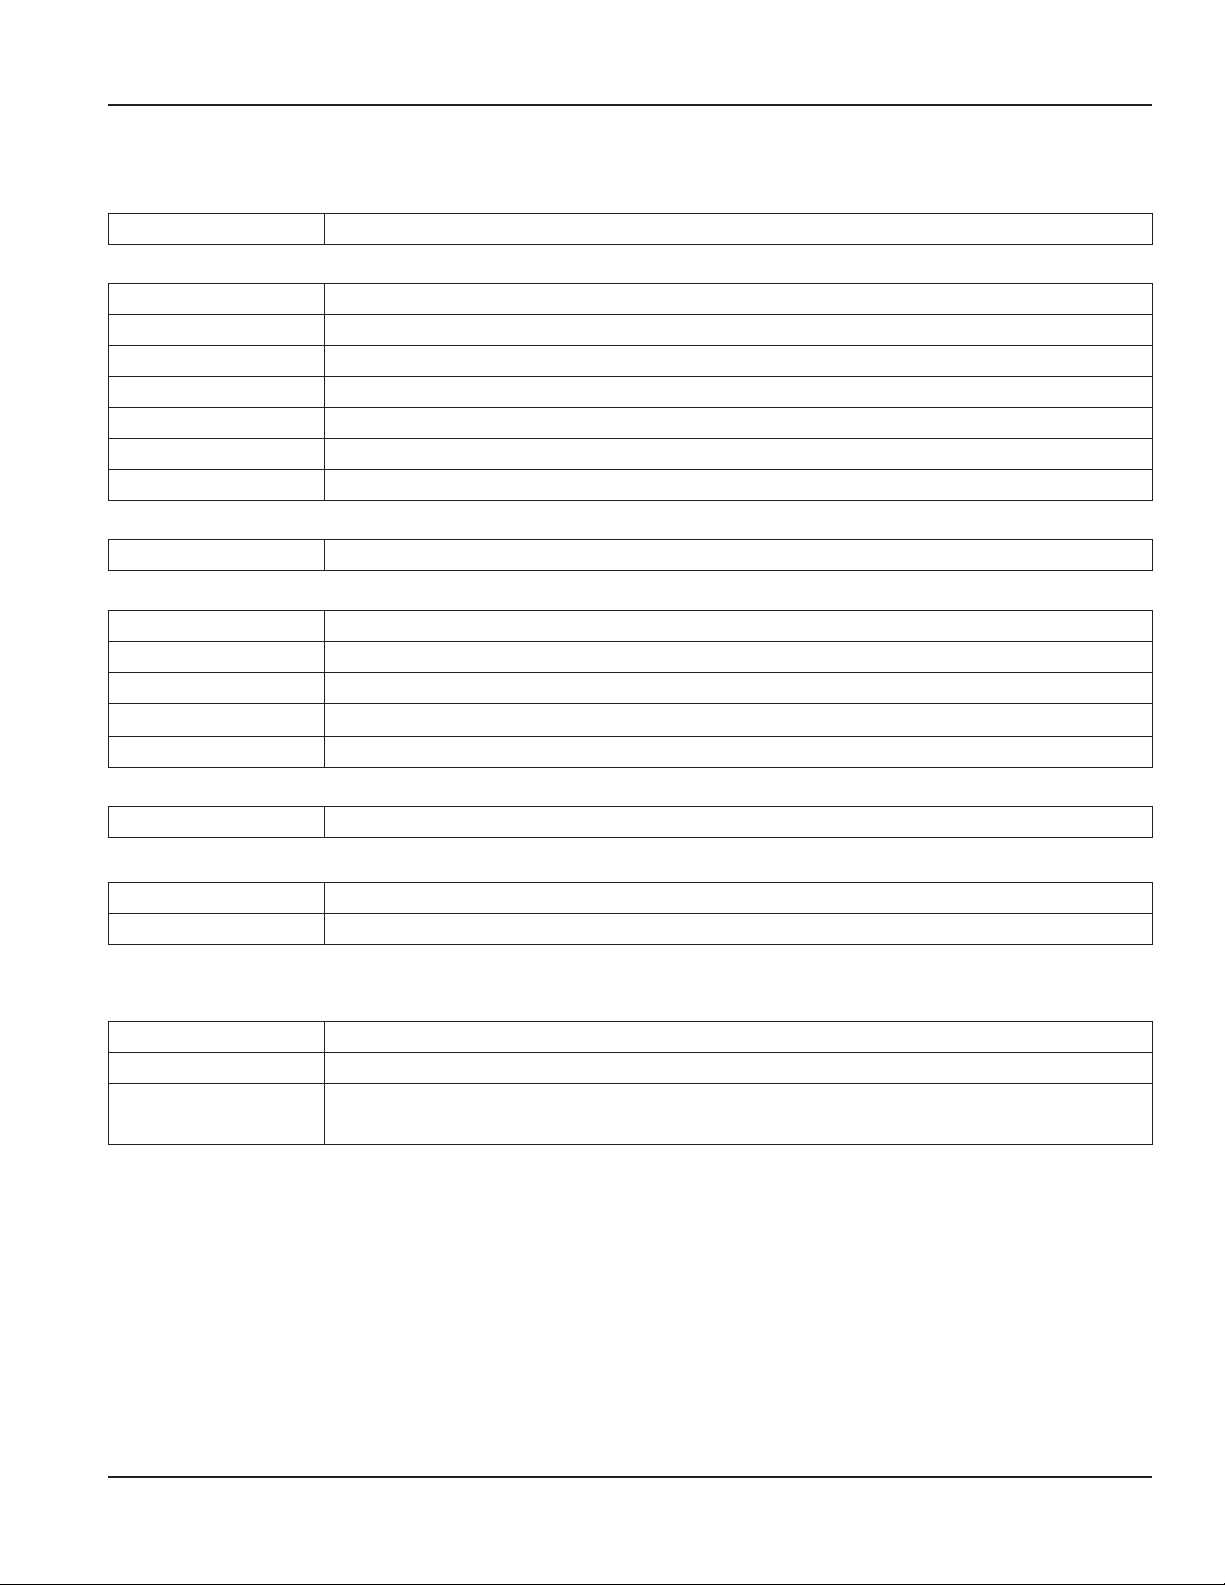
Exit Exits MC4CON software utility
File
Open Data Table Opens a text file with the file format filename.TX2 containing stored datalogger data
Save Data Table Stores datalogger data to a text file with the file format filename.TX2
Open Transient Table Opens a text file with the file format filename.TX1 containing stored transient data
Save Transient Table Stores transient data to a text file with the file format filename.TX1
File Read Reads setup data stored in a file with the file format filename.set
File Save Stores setup data in a file with the file format filename.set
Exit Exits MC4CON software utility
COM
Select COM Opens the COM port selection utility
Select
Measurement Same as selecting Measurement on the MC4000 instrument
Menu MC4000 Same as pressing MENU on the MC4000 instrument
Datalogger Same as selecting Datalogger on the MC4000 instrument
Current Data Table Same as selecting Current Data Table on the MC4000 instrument
Peak pressure P1 Same as selecting Peak Pressure P1 on the MC4000 instrument
MC4CON Software
Info
About Version number and contact information
Language
Change English / Default (local language, such as Spanish)
Install new Installs new language file into the MC4000
Menu Tabs
The menu tabs immediately below the main drop downs duplicates the most frequently used item from the Select menu.
Measurement Same as selecting Measurement on the MC4000 instrument
Menu MC4000 Same as pressing MENU on the MC4000 instrument
Datalogger Same as selecting
Datalogger on the MC4000 instrument
Page 17 February 2015 TST-UM-00017-EN-03
Page 18
MC4CON Software
Menu MC4000 Setup
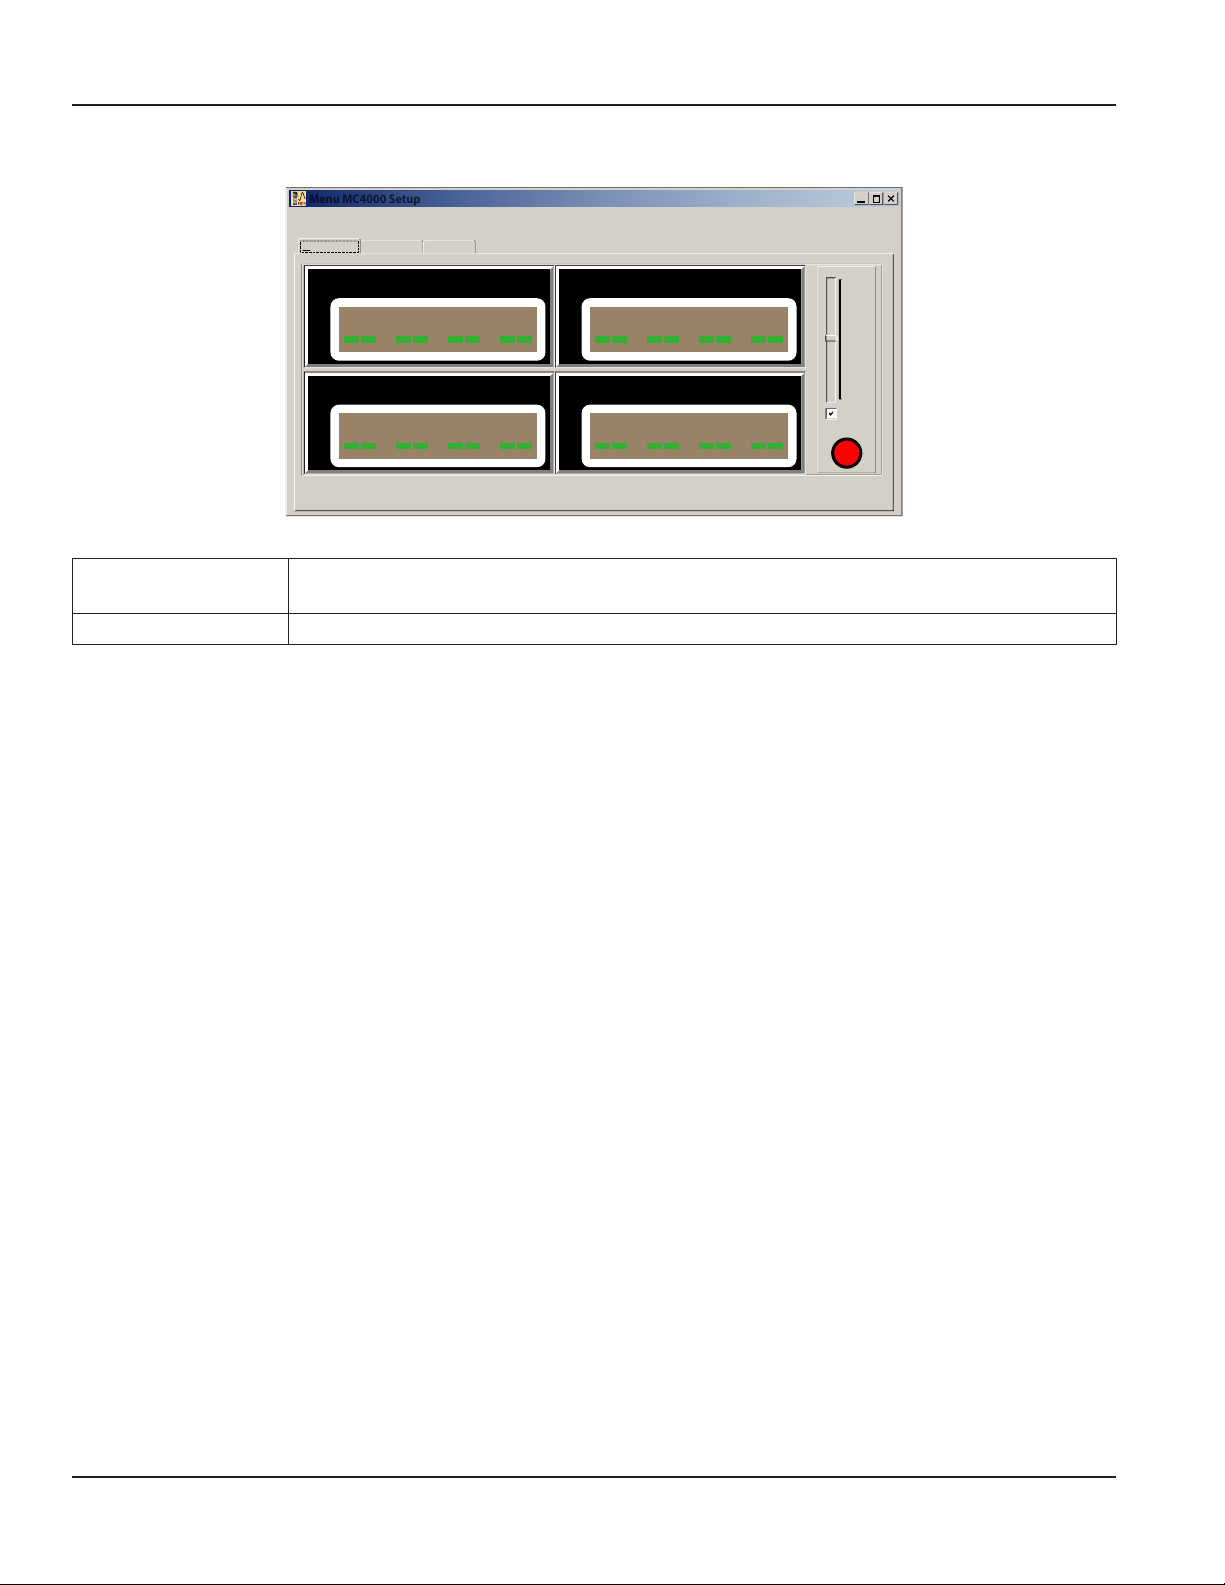
Measurement Tab
Menu MC4000 Setup
Exit File Com Select Info Language
Measurement
DataloggerMenu MC4000
No Sensor
No Sensor
No Sensor
No Sensor
Read
Figure 11: MC4000 Setup Menu
Read Clicking the Read check box in the measurement screen transfers stored data to the PC from
the MC4000.
Contrast The display contrast is set using the slider bar to the right of the sensor displays.
Page 18 February 2015TST-UM-00017-EN-03
Page 19
MC4CON Software
Menu MC4000 Setup
Menu MC4000 Setup
MC4000 Setup Tab
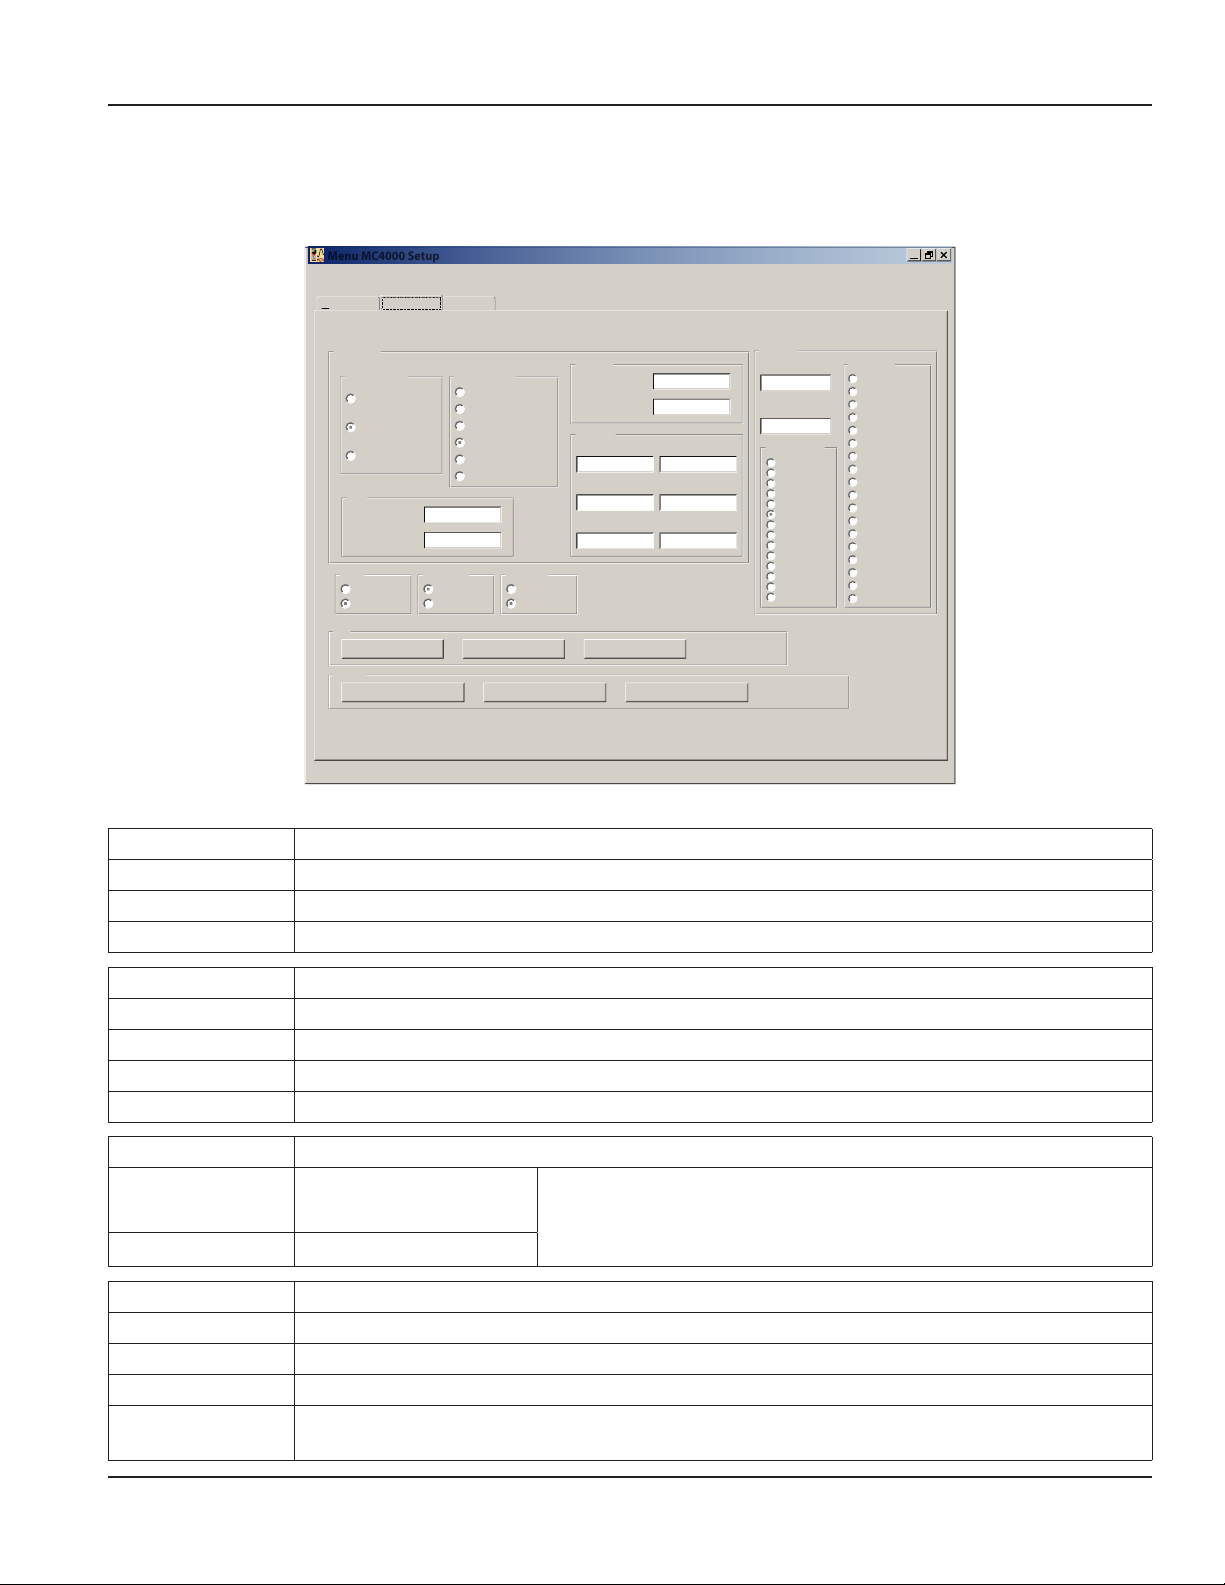
Under the Menu MC4000 tab, all instrument parameters can be set and then uploaded to the MC4000. The MC4000 also
transfers the process parameters and saved data currently displayed on this screen to the PC.
Exit File Com Select Info Language
Measurement
Menu MC4000
Name
Flow-RPM
Sel.Flow-RPM
Select o
Select Flow
Select RPM
RPM
Scale RPM
Dscale RPM
Units
EU
US
File
New device File read File save
Device
Menu MC4000 read Menu MC4000 store Menu MC4000 write
Datalogger
Language
English
Spanish
Sel.Flow type
New-Lin
New-Tab
7 gpm
40 gpm
80 gpm
160 gpm
Backlight
Light o
Light on
New-Lin
Scale RPM
Dscale RPM
New-Tab
Tab F1 INP
Tab F2 INP
Tab F3 INP
Tab Q1 OUTP
Tab Q 2 OUTP
Tab Q3 OUTP
Pressure
Scale P1
Scale P2
Save Interval
1 s
2 s
5 s
15 s
30 s
60 s
120 s
300 s
600 s
1200 s
1800 s
2700 s
3600 s
7200 s
Threshold
SIGNAL > 10%
SIGNAL < 10%
SIGNAL > 20%
SIGNAL < 20%
SIGNAL > 30%
SIGNAL < 30%
SIGNAL > 40%
SIGNAL < 40%
SIGNAL > 50%
SIGNAL < 50%
SIGNAL > 60%
SIGNAL < 60%
SIGNAL > 70%
SIGNAL < 70%
SIGNAL > 80%
SIGNAL < 80%
SIGNAL > 90%
SIGNAL < 90%
Sel. Flow-RPM Select flow and rpm settings.
Select off Flow measurement display deactivated (display shows ----)
Select Flow Flow measurement is active
Select RPM RPM measurement is active
Sel. Flow type Select the flow rate for the currently connected flow sensor.
7 gpm (25 lpm) Default parameters for 7 gpm (25 lpm) flow sensor
40 gpm (150 lpm) Default parameters for 40 gpm (155 lpm) flow sensor
80 gpm (300 lpm) Default parameters for 80 gpm (300 lpm) flow sensor
160 gpm (600 lpm) Default parameters for 160 gpm (600 lpm) flow sensor
New-Lin Two point calibration for linear flow meter.
Scale Flow
Dscale Flow Scale the division constant.
Pressure Pressure parameter settings
Scale P1 Full scale for the first pressure sensor (P1)
Scale P2 Full scale for the optional pressure sensor (P2)
Save Interval Sampling and recording rate during data collection.
Threshold
Figure 12: Main MC4000 setup screen
Scale the
multiplication constant.
See "Two Point Flow Sensor Calibration Using the New Lin Function" on page 14.
The threshold signal level for the P1 (Transient). Defines the point at which transient
recording starts
Page 19 February 2015 TST-UM-00017-EN-03
Page 20
MC4CON Software
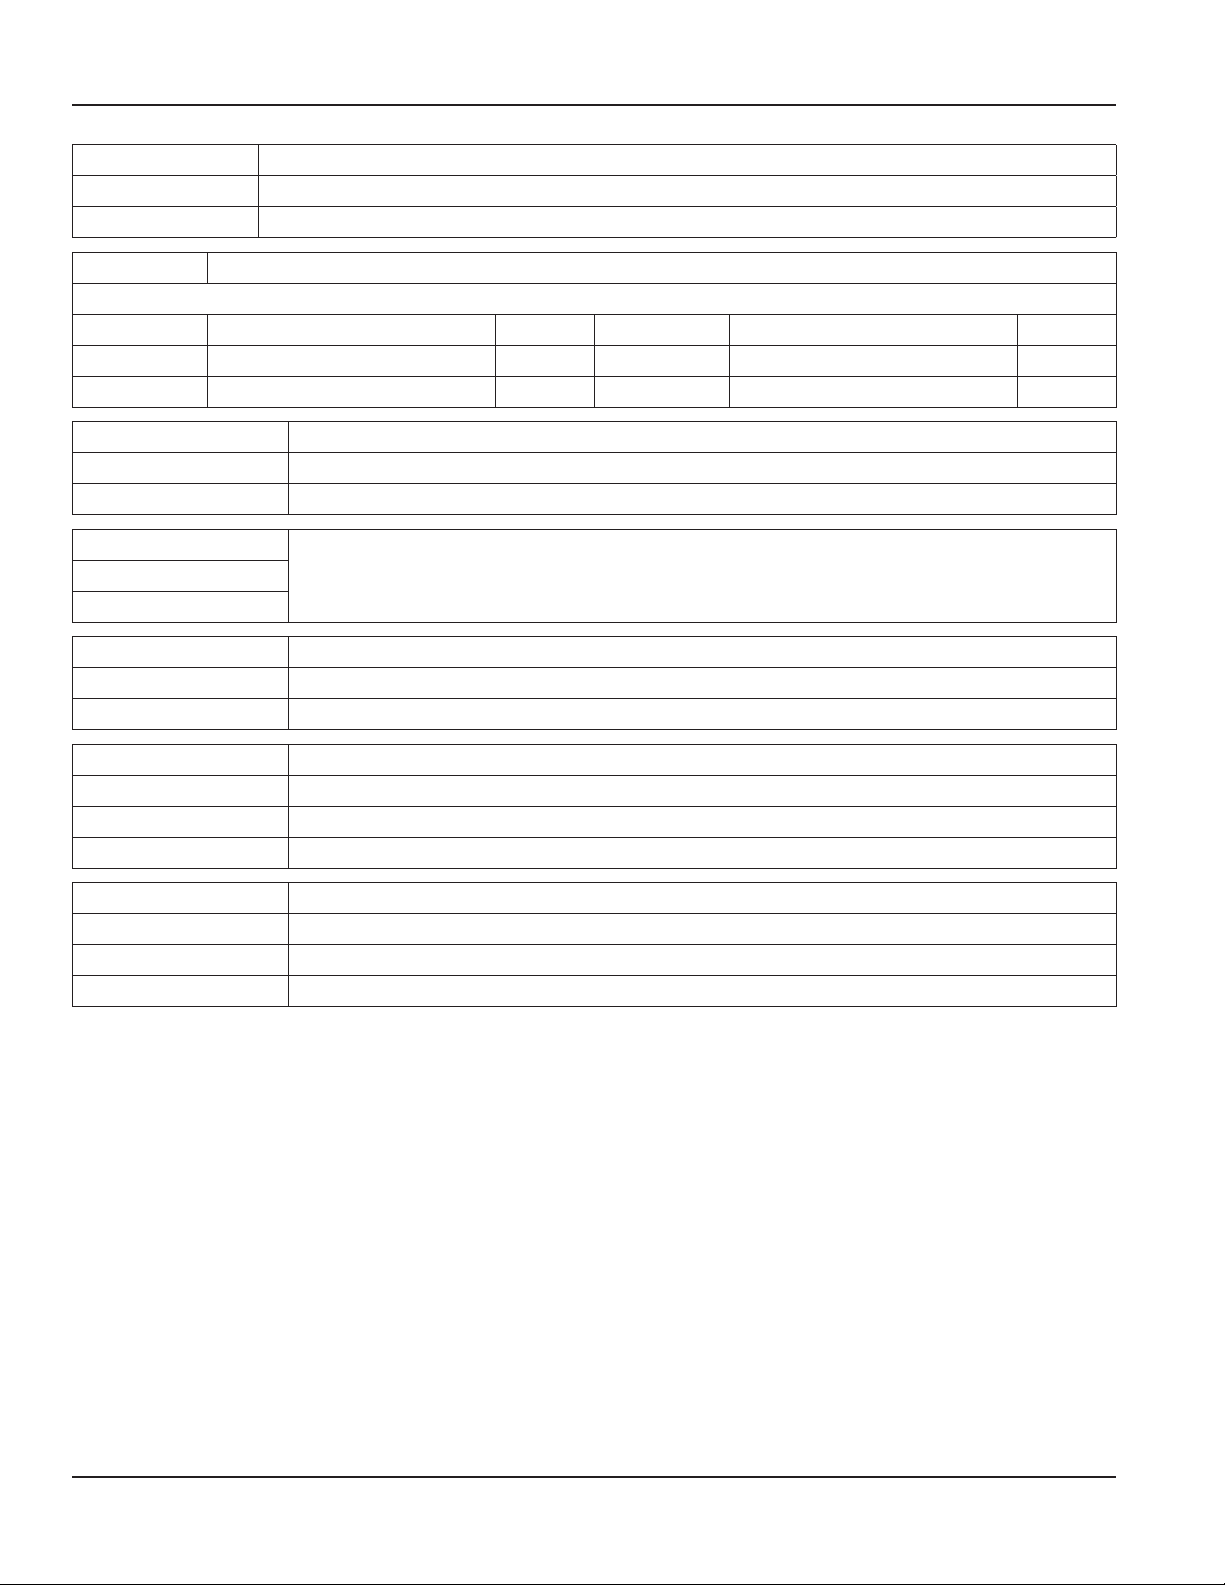
RPM RPM parameter settings
Scale rpm Multiplication constant for rpm scaling
Dscale rpm Division constant for rpm scaling
New-Tab Three point linearizing of flow sensors
Example
Tab F1 INP First frequency point 0 Hz Tab Q1 OUT First displayed flow reading 0 LPM
Tab F2 INP Second frequency point 166 Hz Tab Q2 OUT Second displayed flow reading 38 LPM
Tab F3 INP Third frequency point 630 Hz Tab Q3 OUT Third displayed flow reading. 150 LPM
Units Flow units are calculated in US or European standard units
EU Default units are lpm, bar, ° C
US Default units are gpm, psi, ° F
Language
Selection of English or default (the local country language)English
Default
Backlight Backlight control
Light off Backlight is turned off, no instrument backlight
Light on Backlight is turned on the display and illuminates for 30 seconds when any buttons are pressed
File Menu MC4000, upper tree switches
New Device Default setting
File Read Reads all the menu parameters from a file with the file format filename.set from the MC4000
File Save Stores all the menu parameters in a file with the format filename.set to the MC4000
Device Menu MC4000, lower three switches
Menu MC4000 read Reads the stored MC4000 parameters into the MC4CON software
Menu MC4000 store Reads the stored MC4CON parameters into the MC4000
Timer MC4000 write Transfer time and date values from the PC into MC4000
Page 20 February 2015TST-UM-00017-EN-03
Page 21
Datalogger Tab
Menu MC4000 Setup
MC4CON Software
Menu MC4000 Setup
Exit File Com Select Info Language
Menu MC4000Measurement
Datalogger
Transient 1
Transient 2
Record 1
#
Transient 1
Transient 2
Record 1
Record 2
Record 3
Record 4
Status
Stop
View
Records
2021
1534
368
136
72
520
Date
13.07.2013
16.07.2013
11.07.2013
11.07.2013
11.07.2013
14.07.2013
Time
15:18:05
08:47:59
07:37:01
07:38:10
07:39:10
15:51:
Record 2
Record 3
Record 4
Record 5
Record 6
Record 7
Upload
Bytes
4068
3072
1472
544
288
2090
Capacity %
50.0
50.0
0.0704
0.026
0.0138
0.0995
Peak data table
Current data table
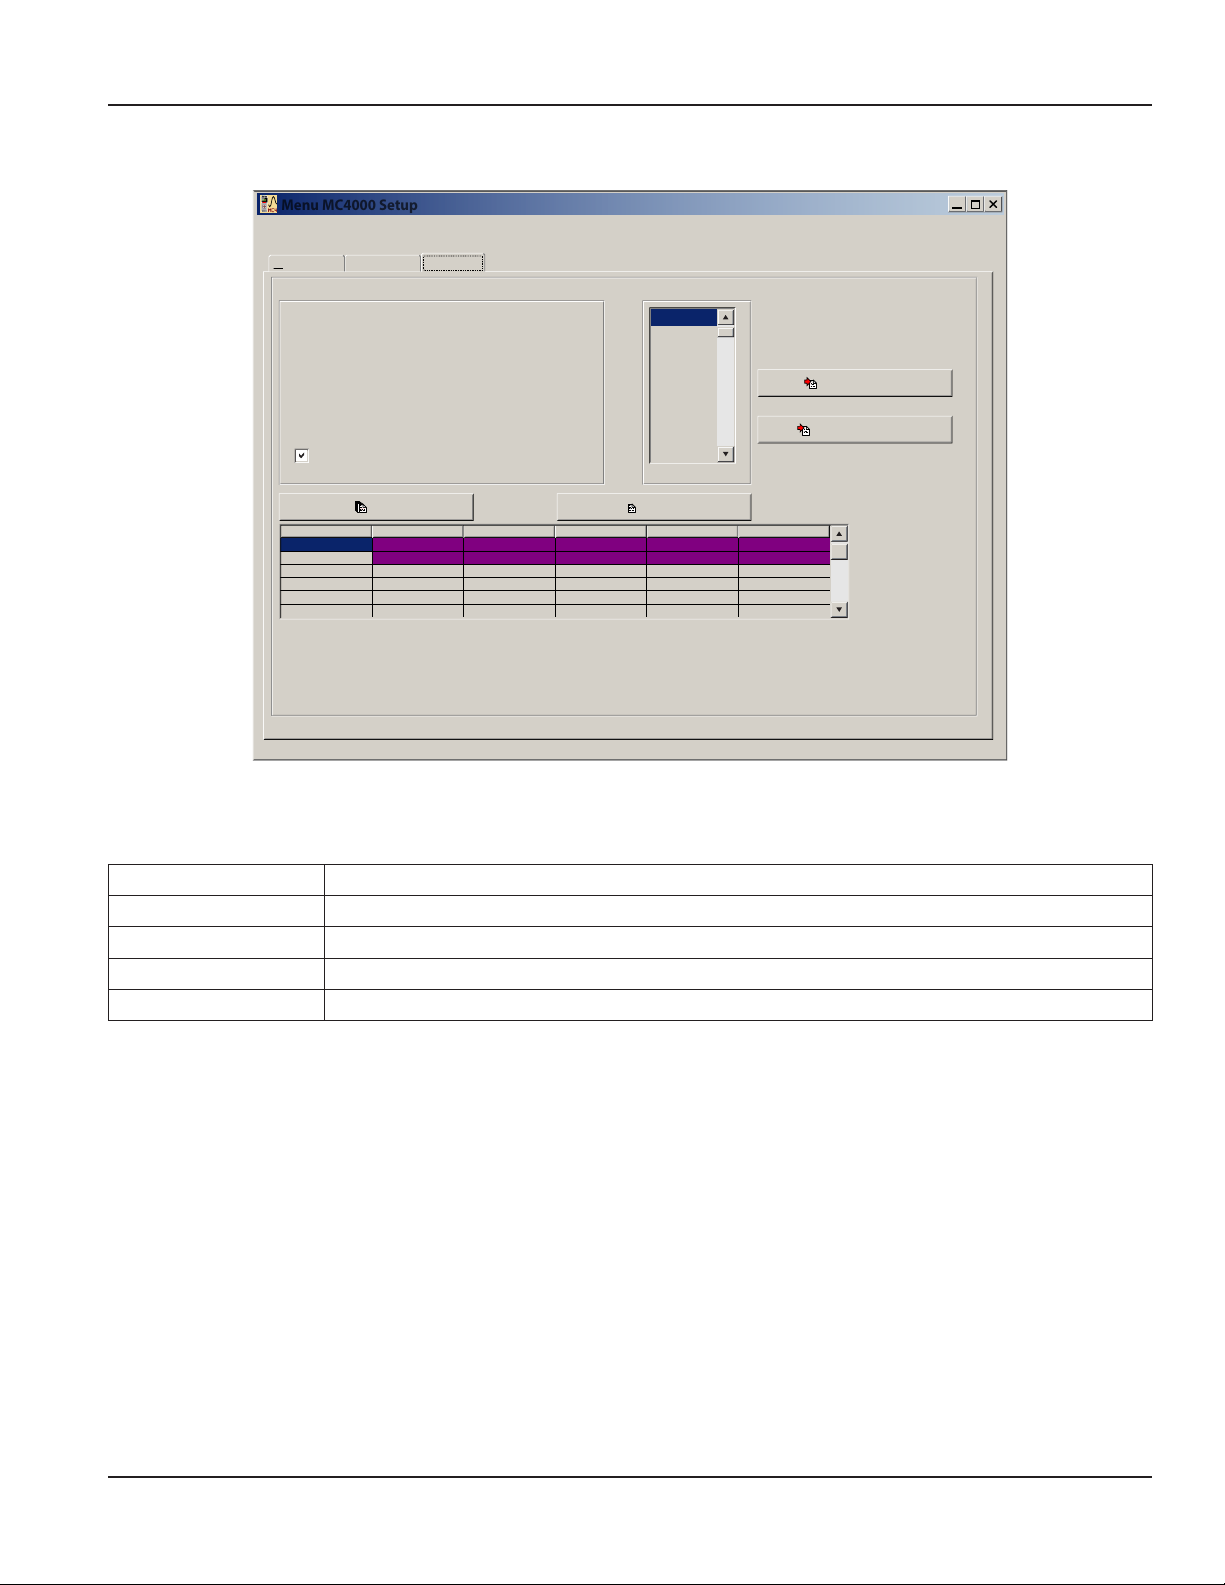
Figure 13: Datalogger view screen
The datalogger screens allow access to all recorded files shown with date, time and controls for instrument data storage.
There are also controls to show tabular views of current and peak pressure measurements.
Stop Stops the software screen updating during the data transfer from the MC4000 to the PC
Peak Data Table Transients data shown in table format
Current Data Table Datalogger data shown in table format
View Show all stored transients and records with date, time and byte content
Upload Read the selected record (Transient 1, 2, Record 1…)
Page 21 February 2015 TST-UM-00017-EN-03
Page 22
MC4CON Software
Peak Pressure P1
Peak Pressure P1 Graphics
Peak Pressure P1 Graphics
Data Table Controls
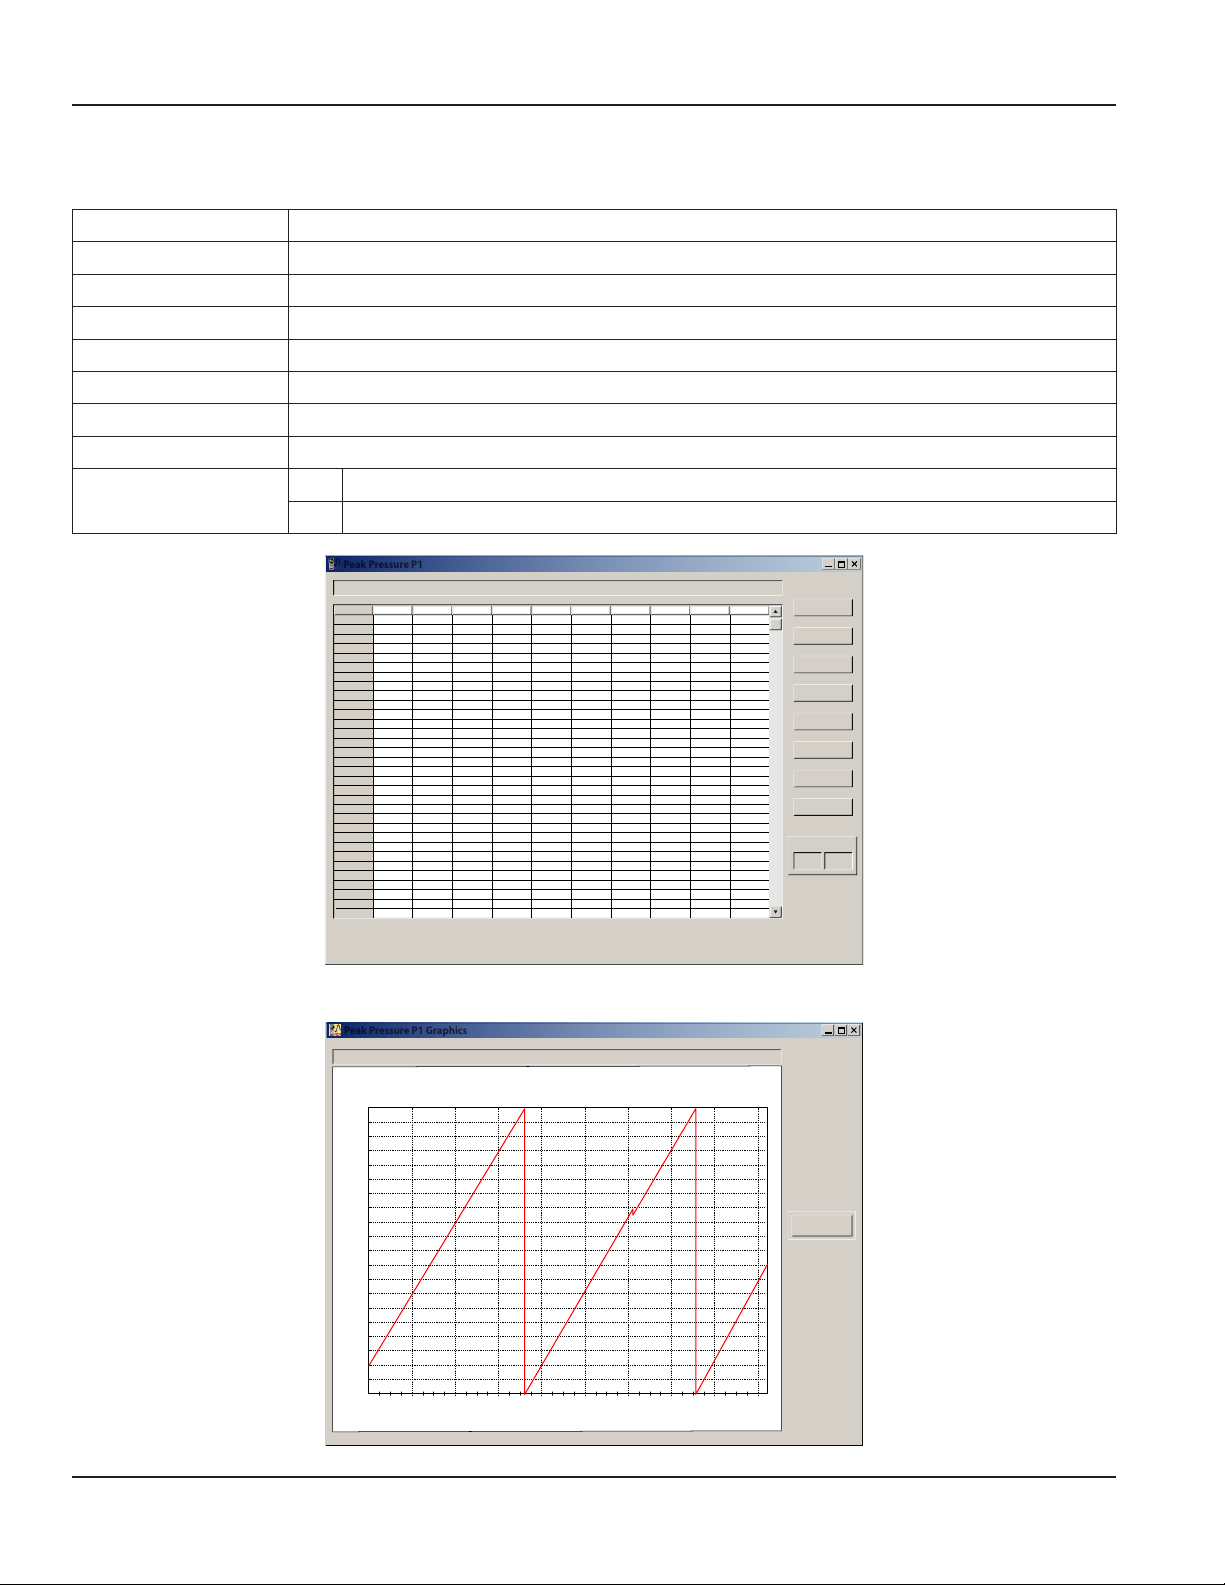
The peak pressure and current data tables use the same controls for manipulating the available data.
Save TXT Stores the table in a *.txt
Excel Open Stores the table in Microsoft Excel *.xls format
Copy Copies the current file
Delete Deletes the current file
Open TXT Opens a previously stored file
Graph Generates a graphics representation of the current table
Cancel Exits from the current data table
Print Prints the current table. The graphic view prints after the table is converted into graphic
US Uses a decimal point as number separator
Format
EU Uses a comma as number separator
Peak Pressure P1
ms Tr. (bar) +1 +2 +3 +4 +5 +6 +7 +8 +9
Date
23.07.2013
Time
08:47:59
Interval
1000
10
20
30
40
50
60
70
80
90
100
110
120
130
140
150
160
170
180
190
200
210
220
230
240
250
260
270
280
290
9,90135
9,90135
9,90135
9,90135
9,90135
9,90135
9,90135
9,90135
9,90135
9,90135
9,90135
9,90135
9,90135
9,90135
9,90135
9,90135
9,90135
9,90135
9,90135
9,90135
9,90135
9,90135
9,90135
9,90135
9,90135
9,90135
9,90135
9,90135
9,90135
9,90135
9,90135
9,90135
9,90135
9,90135
9,90135
9,90135
9,90135
9,90135
9,90135
9,90135
9,90135
9,90135
9,90135
9,90135
9,90135
9,90135
9,90135
9,90135
9,90135
9,90135
9,90135
9,90135
9,90135
9,90135
9,90135
9,90135
9,90135
9,90135
9,90135
9,90135
9,90135
9,90135
9,90135
9,90135
9,90135
9,90135
9,90135
9,90135
9,90135
9,90135
9,90135
9,90135
9,90135
9,90135
9,90135
9,90135
9,90135
9,90135
9,90135
9,90135
9,90135
9,90135
9,90135
9,90135
9,90135
9,90135
9,90135
9,90135
9,90135
9,90135
9,90135
9,90135
9,90135
9,90135
9,90135
9,90135
9,90135
9,90135
9,90135
9,90135
9,90135
9,90135
9,90135
9,90135
9,90135
9,90135
9,90135
9,90135
Figure 14: Peak pressure table
Peak Pressure P1 Graphics
95
90
85
80
75
70
65
60
55
50
bar
45
40
35
30
25
20
15
10
5
20 40 60 80 100 120 140 160 180
sec
9,90135
9,90135
9,90135
9,90135
9,90135
9,90135
9,90135
9,90135
9,90135
9,90135
9,90135
9,90135
Save TXT
Excel open
Copy
Delete
Open TXT
Graph
Cancel
Print
Format
EU
12 Lines
07.09.2013
08:07:01
Print
US
Page 22 February 2015TST-UM-00017-EN-03
Figure 15: Peak pressure graphics screen
Page 23
Current Data Table
Current Data Table
Current Data Table
Current Data Graphics
Current Data Graphics
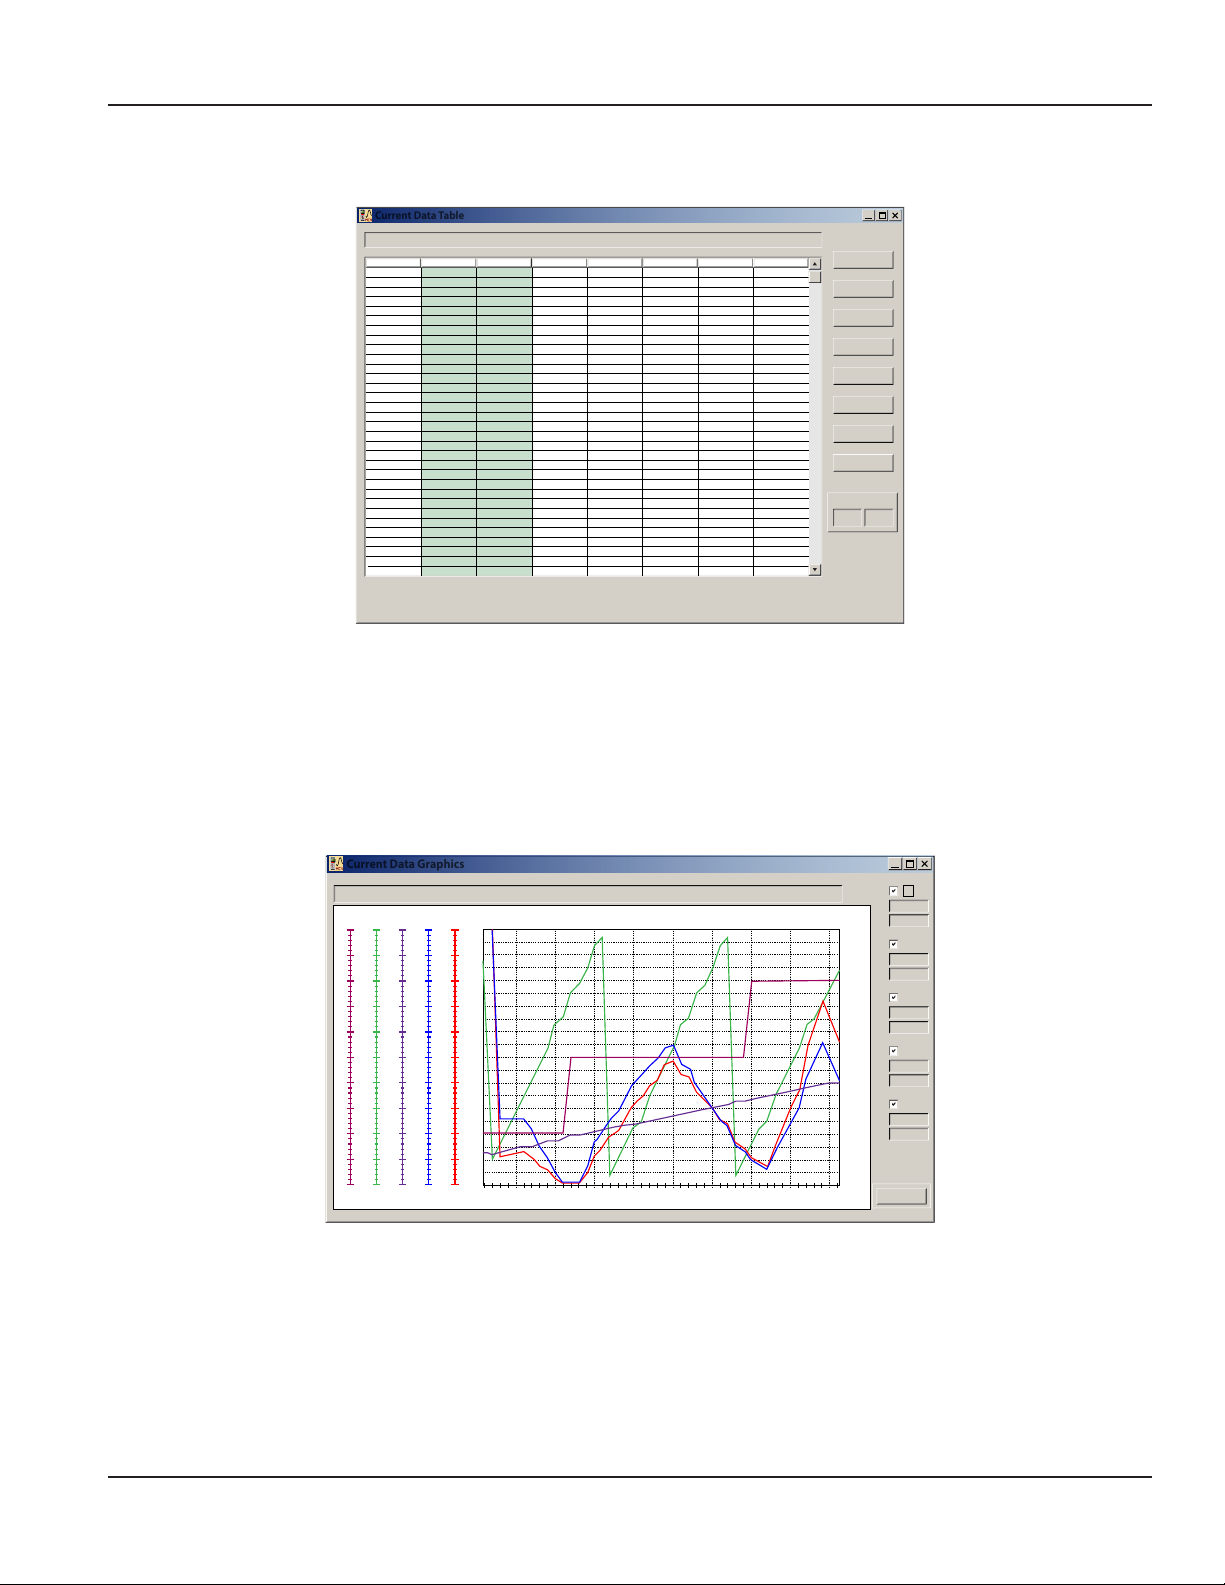
The current data table shows all four signal channels plus the calculated power.
MC4CON Software
#
Date
Time
P1 (psi)
11.07.2013
11.07.2013
11.07.2013
11.07.2013
11.07.2013
11.07.2013
11.07.2013
11.07.2013
11.07.2013
11.07.2013
11.07.2013
11.07.2013
11.07.2013
11.07.2013
11.07.2013
11.07.2013
11.07.2013
11.07.2013
11.07.2013
11.07.2013
11.07.2013
11.07.2013
11.07.2013
11.07.2013
11.07.2013
11.07.2013
11.07.2013
11.07.2013
11.07.2013
11.07.2013
11.07.2013
11.07.2013
08:46:59
08:47:00
08:47:01
08:47:02
08:47:03
08:47:04
08:47:05
08:47:06
08:47:07
08:47:08
08:47:09
08:47:10
08:47:11
08:47:12
08:47:13
08:47:14
08:47:15
08:47:16
08:47:17
08:47:18
08:47:19
08:47:20
08:47:21
08:47:22
08:47:23
08:47:24
08:47:25
08:47:26
08:47:27
08:47:28
08:47:29
08:47:30
1
2
3
4
5
6
7
8
9
10
11
12
13
14
15
16
17
18
19
20
21
22
23
24
24
26
27
28
29
30
31
32
200.5
201.5
201.2
200.9
201.3
201.3
207.5
209.8
210.1
209.8
209.2
210.7
208.9
209.5
209.9
210.3
212.1
211.9
212.3
210.7
210.5
208.6
209.1
209.9
210.2
210.5
210.5
210.9
208.9
208.5
208.2
207.7
P2 (psi)
T (F)
101.72
101.56
101.66
101.84
101.93
101.93
101.95
102.01
102.03
102.03
102.02
102.05
102.18
102.22
102.35
102.39
102.40
102.44
102.48
102.49
102.60
102.77
102.85
102.93
103.05
103.05
103.09
103.15
103.18
103.22
103.25
103.24
Q/N (g/min)
50.0
49.9
49.9
48.2
49.1
49.9
48.9
47.9
48.5
48.9
49.0
50.2
49.8
49.2
48.8
49.1
49.0
49.3
49.5
49.4
49.6
49.9
50.2
50.1
49.8
49.6
50.3
49.4
49.1
48.9
49.2
49.4
POW (HP)
5.829
5.846
5.837
5.630
5.746
5.840
5.899
5.843
5.924
5.965
5.960
6.150
6.048
5.993
5.955
6.003
6.043
6.074
6.110
6.052
6.070
6.052
6.103
6.114
6.086
6.070
6.156
6.057
5.964
5.928
5.956
5.965
Save TXT
Excel open
Open TXT
Format
EU
46 Lines
Copy
Delete
Graph
Cancel
Print
US
Figure 16: Current data table
sCurrent Data Graphics
Automatically generates and loads graphics from the Current Data Table to the display by clicking on Graph.
Graph
This function generates graphics from the Current Data Table. All five of the variables are displayed simultaneously. The right
side of the window shows the scaled values of the measured signals. The maximum and minimum values are the default. If
required, individual variables may be deselected.
Defaults
P2(bar) T(C) Q(l/min)PW(kw)P1(bar)
200 100 1000 100200
0 0 0 0
0
Variable Minimum Maximum
P1 0 200
P2 0 200
T 0 100
Q/N 0 1000
POW 0 100
Current Data Graphics
5 10 15 20 25 30 35 40 45
Time = 45s
Figure 17: Graph of current data
Max
Min
Max
Min
Max
Min
Max
Min
Max
Min
07.09.2013
08:07:01
200
0
200
0
200
0
200
0
200
0
Print
P1
P2
T
Q/N
POW
Page 23 February 2015 TST-UM-00017-EN-03
Page 24
Troubleshooting Guide
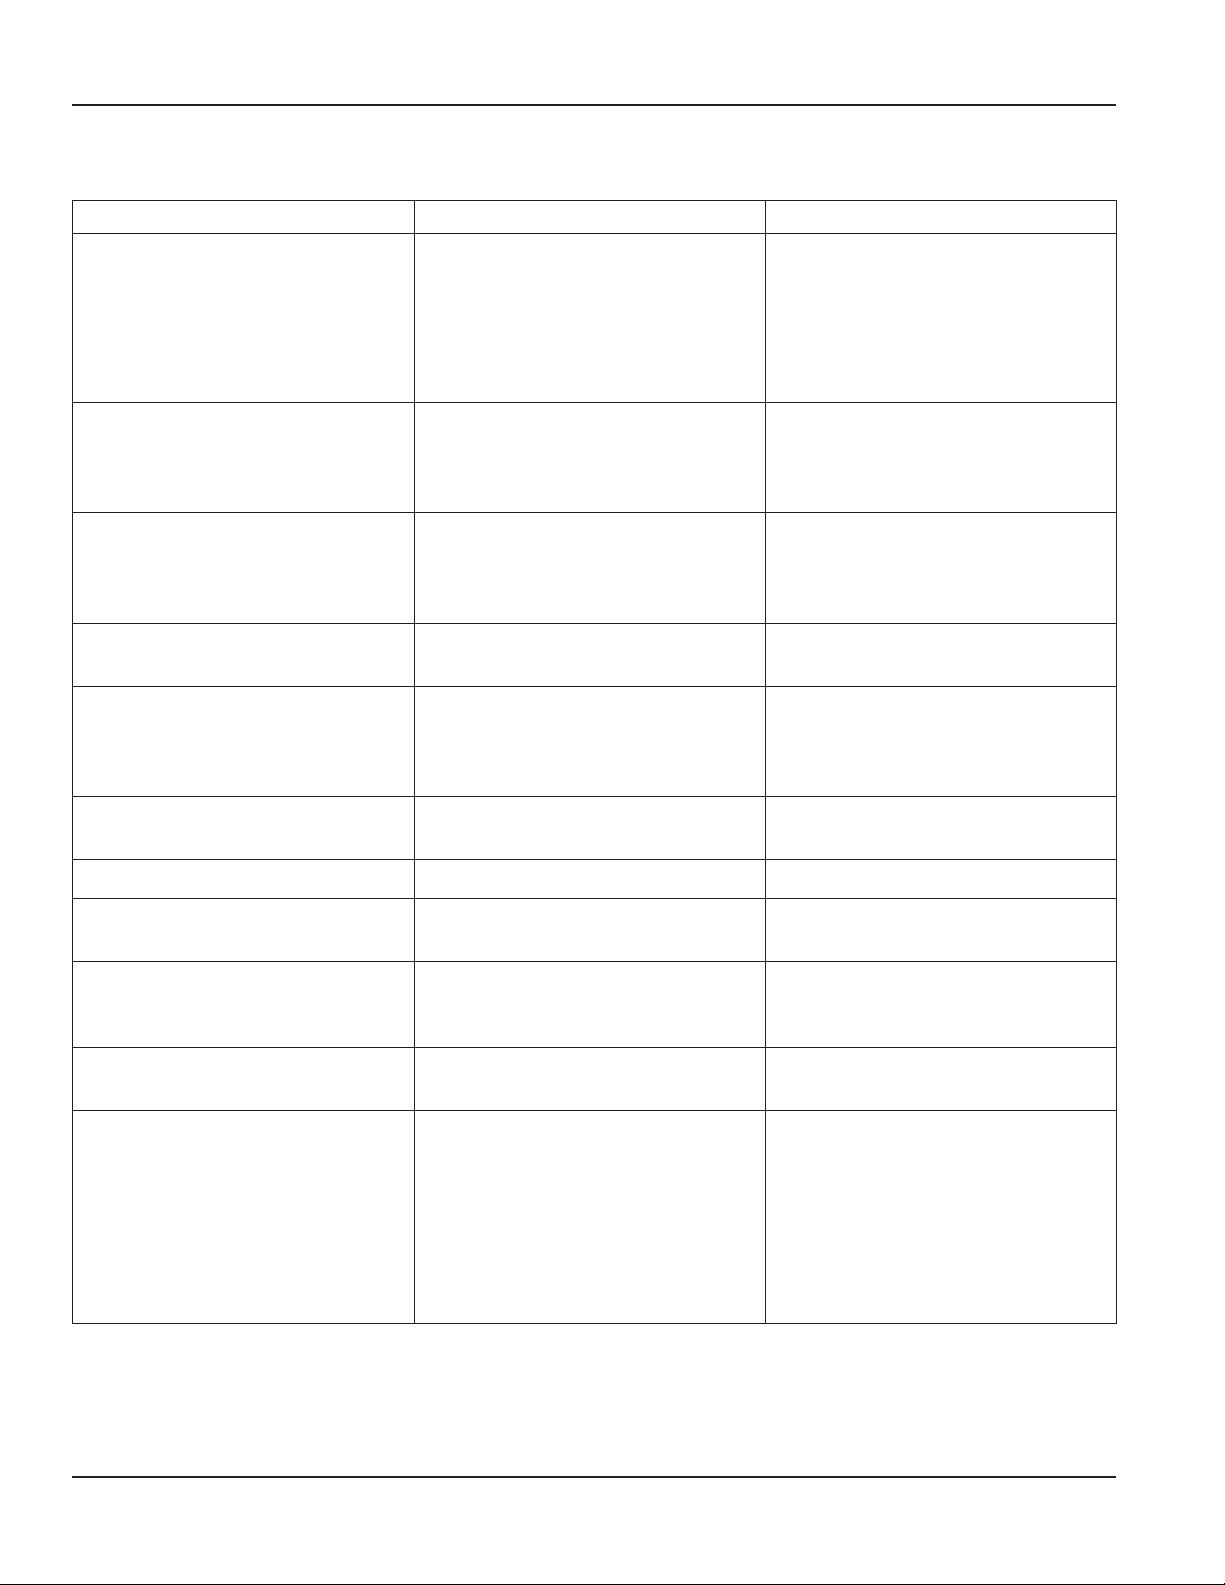
TROUBLESHOOTING GUIDE
Symptom Possible Cause Remedy
Meter indicates higher than actual
flow rate.
Meter indicates lower than actual flow
rate.
Erratic system indication, meter
alone works well (remote monitor
application only).
Indicator shows flow when shut off.
No flow indication.
Full or partial open position.
Erratic indication at low flow, good
indication at high flow.
• Cavitation
• Debris on rotor support
• Build up of foreign materials in the
meter bore
• Gas in liquid
• Debris on rotor
• Worn bearing
• Viscosity higher than calibrated
Ground loop in shielding
Mechanical vibration causes rotor to
oscillate without turning.
Fluid shock, full flow into dry meter or
impact caused bearing separation or
broken rotor shaft.
Rotor has foreign material wrapped
around it.
• Increase back pressure
• Clean meter
• Clean meter
• Install gas eliminator ahead of meter
• Clean meter and add filter
• Clean meter and add filter
• Recalibrate monitor
Ground shield one place only. Look for
internal electronic instrument ground.
Reroute cables away from electrical
noise.
Isolate meter.
Rebuild meter with repair kit and
recalibrate monitor. Move to location
where meter is full on start-up or add
downstream flow control valve.
Clean meter and add filter.
No flow indication. Faulty pickup. Replace pickup.
System works perfect, except indicates
lower flow over entire range.
Meter indicating high flow, upstream
piping at meter smaller than meter
bore.
Opposite effects of above. Viscosity lower than calibrated.
Meter doesn't respond to any changes
in process inputs or keystrokes.
By-pass flow, leak.
Fluid jet impingement on rotor. Change piping.
Processor hang due to communications
interruption.
Repair or replace by-pass valves, or
faulty solenoid valves.
Change temperature, change fluid or
recalibrate meter.
Perform a hardware reset by
inserting the end of a paperclip
into the hardware reset hole on
the left side of the enclosure. See
Figure 3 on page 6.
OTE:N For this procedure to work, the
charger must be disconnected
from the MC4000.
Page 24 February 2015TST-UM-00017-EN-03
Page 25
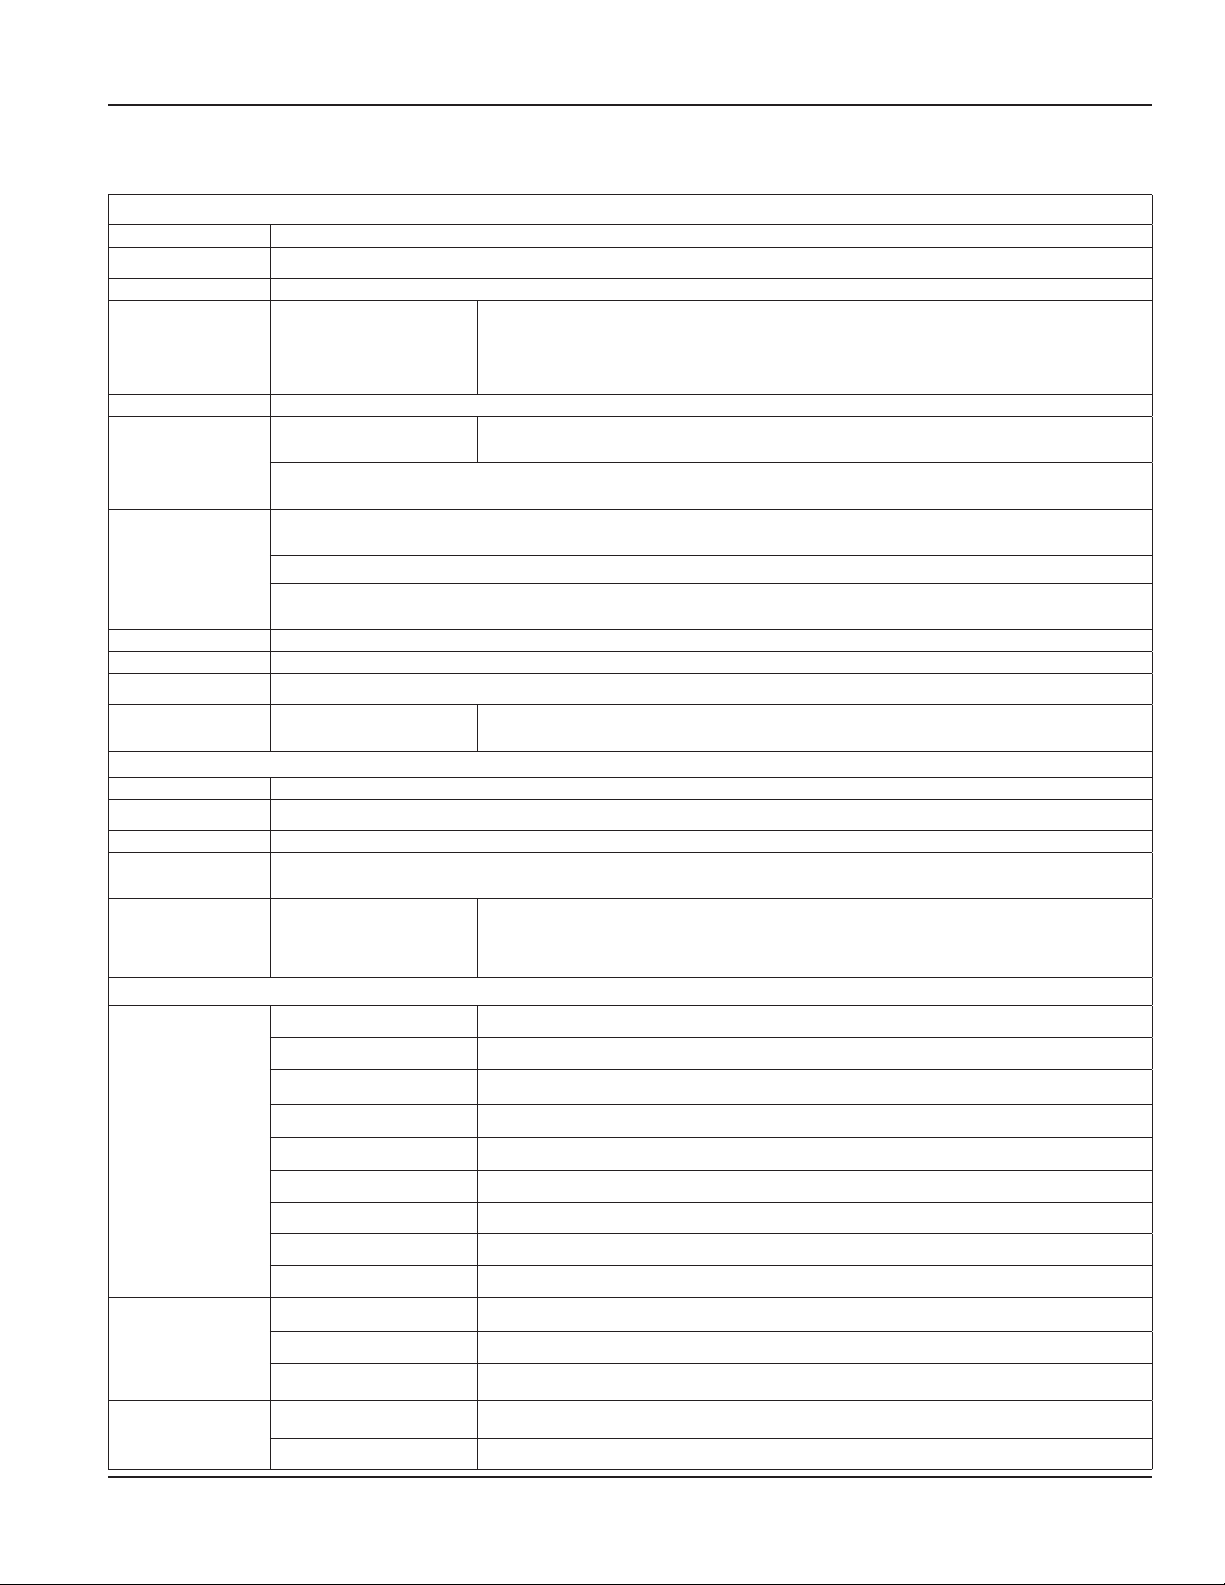
SPECIFICATIONS
Display
Accuracy ±0.1% + 1 digit from midrange
A to D 16-bit, Linearity ± (1 LSB + 1 digit)
Display Graphic LCD display with back light, 128 x 64 pixels; back light auto-off function
Flow
Inputs
Keypad Nine keys on the front; backlight is illuminated for 30 seconds after any key is pressed
Power
Memory
Tare Pressure channels P1 and P2 are independently set to zero
Connections Two eight-pin, 12 mm sensor plugs, USB data connection, battery charging connection
Indicators Green LED between the two sensor plugs indicates power to the battery charging circuit
Environmental
Sensors
Accuracy ± 1% of reading @ 32 cSt
Repeatability ± 0.2%
Pressure max 5800 psi (400 bar) max; 5000 psi (345 bar) max for SAE 20 and G 1-1/4 size models
Turbine response
time
Environmental
Materials
Turbine
Pickup
Pressure (P1/P2)
Temperature (T)
RPM
Battery
Charger
A fully charged battery permits about four hours of operation with two pressure sensors connected and
the backlight switched off
2.5 MB of datalogging memory can store up to 80,000 samples in all four signal channels, calculated
power, date and time; the sampling rate is selectable from 1 sec…120 min
Peak & valley functions stores the maximum and the minimum values of the P1 and P2 pressure sensors
Two fast transients recorders with a sampling rate of 1 ms and a capacity of 240,000 measurements
monitor pressure sensor P1. The recording trigger threshold is programmable between 0…100%
Ambient Temperature
Humidity
≤200 ms
Fluid Temperature
Ambient Temperature
Humidity
Housing 6013-T651 anodized aluminum
Turbine rotor T416 stainless steel
Rotor supports 6061-T6 aluminum alloy
Rotor shaft T303 stainless steel
Ball bearings 440 C stainless steel
Hub cones 6061-T6 aluminum alloy
Retaining rings 6061-T6 aluminum allow
Adapters/plugs 6061-T6 anodized aluminum
Seals Buna N
Housing 6016-T6 nickel plated
Nut T303 stainless steel
Connector Brass
10 mV…5V
Dual 4…20 mA
Pt-100 –50…500° C
5…24V active pickup; range 30…60,000 rpm
6V, 2 Ah
100…240V AC
–22…158° F (–30…70° C)
0…90% non-condensing.
–4…300° F (–20…150° C)
–22…158° F (–30…70° C)
0…90% non-condensing
sine wave from turbine; frequency range 0.5…10 kHz scalable
P-P
Specications
Pressure Sensor
Case 300 Series stainless steel
Diaphragm 17-4 PH stainless steel
Page 25 February 2015 TST-UM-00017-EN-03
Page 26
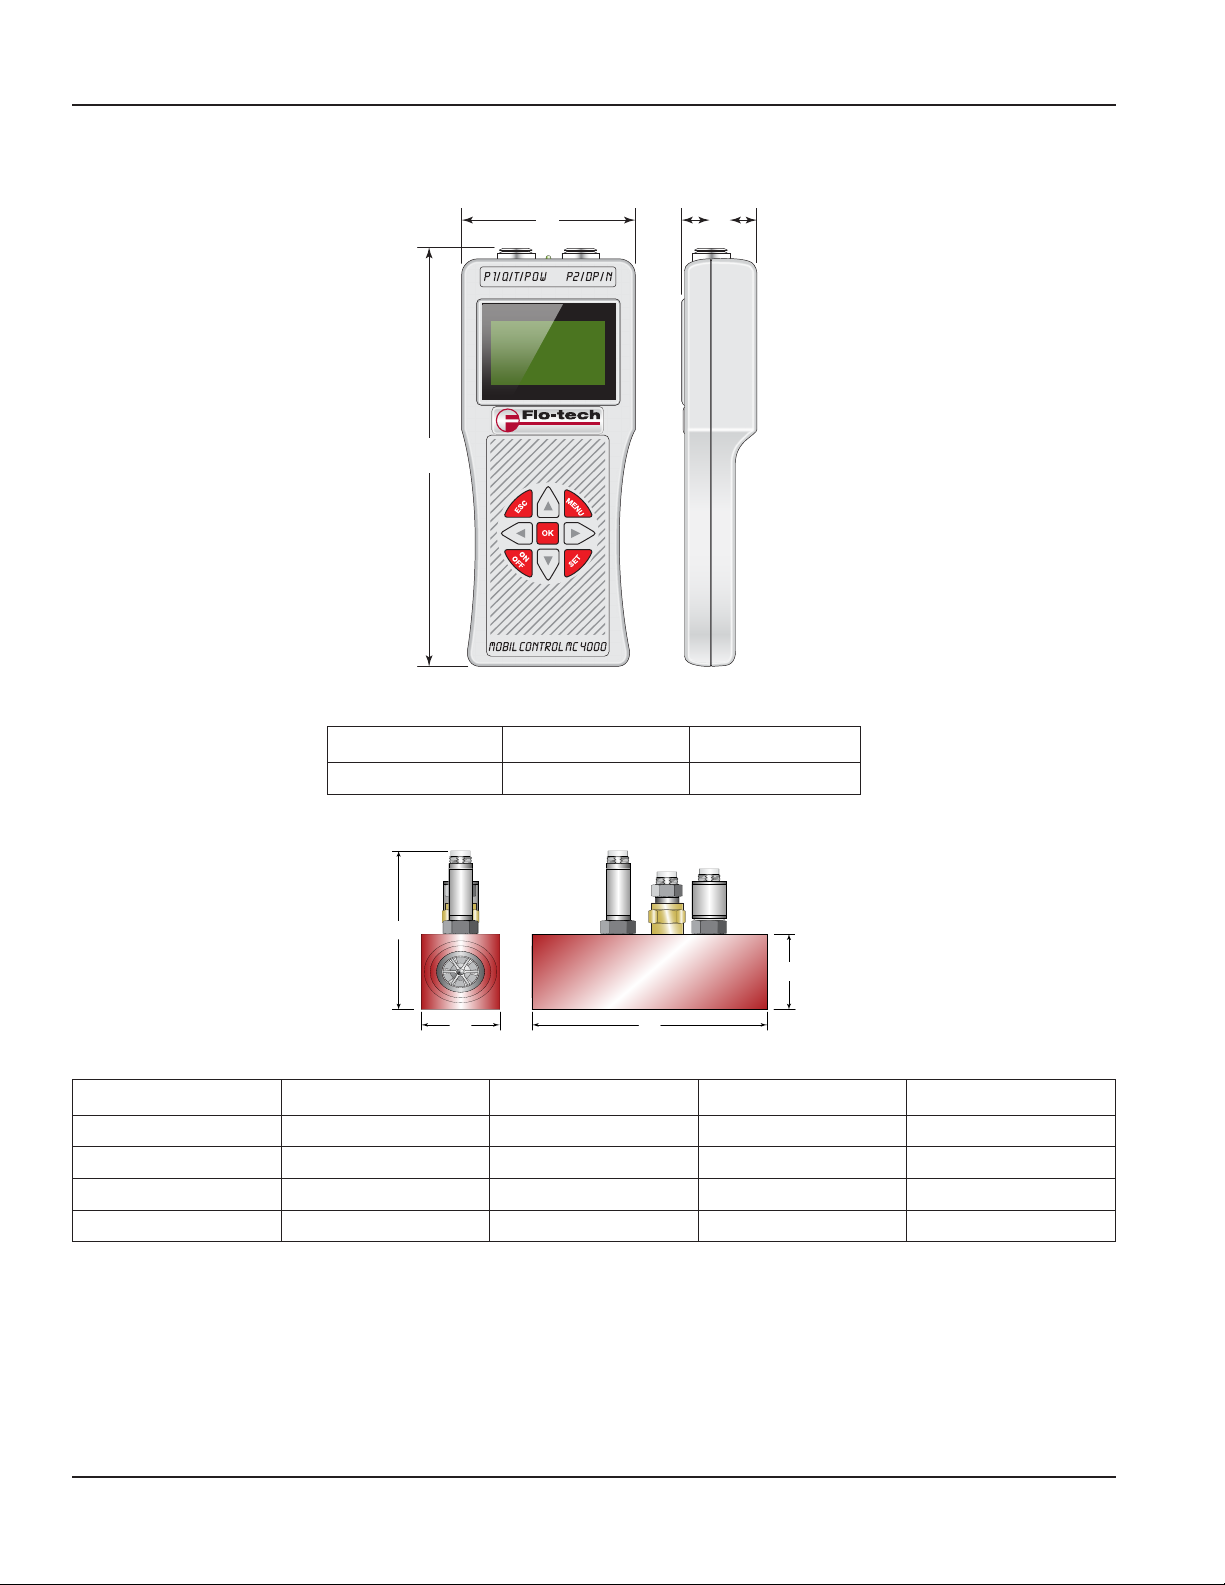
Dimensions
CB
BA
C
D
DIMENSIONS
A
Figure 18: MC4000 monitor
A B C
8.70 in. (221 mm) 3.62 in. (92 mm) 1.62 in. (41 mm)
Table 2: Monitor dimensions
Figure 19: MC4000 sensor arrays
SERIES A B C D
SAE 8 (G 1/4) 1.23 in. (31.2 mm) 4.72 in. (120.0 mm) 1.47 in. (37.3 mm) 3.91 in. (99.3 mm)
SAE 12 (G 3/4) 1.50 in. (37.6 mm) 5.08 in. (129.0 mm) 1.80 in. (45.7 mm) 4.24 in. (107.7 mm)
SAE 16 (G 1) 1.96 in. (50.3 mm) 5.87 in. (149.0 mm) 2.20 in. (56.0 mm) 4.64 in. (117.9 mm)
SAE 20 (G 1–1/4) 2.46 in. (62.5 mm) 6.81 in. (173.0 mm) 2.48 in. (63.0 mm) 4.92 in. (125.0 mm)
Table 3: Sensor array dimensions
Page 26 February 2015TST-UM-00017-EN-03
Page 27

MODEL NUMBERS
Model Numbers
MC4000 Handheld System Analyzer
Model
MC4000 Handheld System Analyzer FMC4
Language
English + Spanish 1
English + French 2
English + German 3
English + Italian 4
Power Cord
International 2
North American 3
Flow Sensor
0.4…7 gpm (1.5…26 lpm) SAE 8 1
1…40 gpm (4…151 lpm) SAE 12 2
4…80 gpm (15…302 lpm) SAE 16 3
8…160 gpm (30…605 lpm) SAE 20 4
0.4…7 gpm (1.5…26 lpm) G 1/4 5
1…40 gpm (4…151 lpm) G 3/4 6
4…80 gpm (15…302 lpm) G 1 7
8…160 gpm (30…605 lpm) G 1–1/4 8
Pressure Sensor
None N
870 psi (60 bar) 1
1450 psi (100 bar) 2
3625 psi (250 bar) 3
5800 psi (400 bar) 4
Temperature Sensor
None N
392° F (200° C) 1
–
Page 27 February 2015 TST-UM-00017-EN-03
Page 28

Turbine Flow Meter, MC4000 Handheld Hydraulic System Analyzer
Control. Manage. Optimize.
FLO-TECH is a registered trademarks of Badger Meter, Inc. Other trademarks appearing in this document are the property of their respective entities. Due to continuous research,
product improvements and enhancements, Badger Meter reserves the right to change product or system specications without notice, except to the extent an outstanding
contractual obligation exists. © 2015 Badger Meter, Inc. All rights reserved.
www.badgermeter.com
The Americas | Badger Meter | 4545 West Brown Deer Rd | PO Box 245036 | Milwaukee, WI 53224-9536 | 800-876-3837 | 414-355-0400
México | Badger Meter de las Americas, S.A. de C.V. | Pedro Luis Ogazón N°32 | Esq. Angelina N°24 | Colonia Guadalupe Inn | CP 01050 | México, DF | México | +52-55-5662-0882
Europe, Middle East and Africa | Badger Meter Europa GmbH | Nurtinger Str 76 | 72639 Neuen | Germany | +49-7025-9208-0
Europe, Middle East Branch Oce | Badger Meter Europe | PO Box 341442 | Dubai Silicon Oasis, Head Quarter Building, Wing C, Oce #C209 | Dubai / UAE | +971-4-371 2503
Czech Republic | Badger Meter Czech Republic s.r.o. | Maříkova 2082/26 | 621 00 Brno, Czech Republic | +420-5-41420411
Slovakia | Badger Meter Slovakia s.r.o. | Racianska 109/B | 831 02 Bratislava, Slovakia | +421-2-44 63 83 01
Asia Pacic | Badger Meter | 80 Marine Parade Rd | 21-06 Parkway Parade | Singapore 449269 | +65-63464836
China | Badger Meter | 7-1202 | 99 Hangzhong Road | Minhang District | Shanghai | China 201101 | +86-21-5763 5412 Legacy Document Number: MC4000_GB_2910
 Loading...