

Page 1
s
User Manual
Part Number D301686X012
Document Number D5137
October 2014
ControlWave Flow Measurement
Applications Guide
Used with
ControlWave
GFC / GFC Plus
ControlWave
Corrector
ControlWave
EFM
ControlWave
XFC
Remote Automa ti on Solution
www.EmersonProcess.com/Remote
Page 2

Be sure that these instructions are carefully read and understood before any operation is
attempted. Improper use of this device in some applications may result in damage or injury. The
user is urged to keep this book filed in a convenient location for future reference.
These instructions may not cover all details or variations in equipment or cover every possible
situation to be met in connection with installation, operation or maintenance. Should problems arise
that are not covered sufficiently in the text, the purchaser is advised to contact Emerson Process
Management, Remote Automation Solutions for further information.
IMPORTANT! READ INSTRUCTIONS BEFORE STARTING!
EQUIPMENT APPLICATION WARNING
The customer should note that a failure of this instrument or system, for whatever reason, may
leave an operating process without protection. Depending upon the application, this could result in
possible damage to property or injury to persons. It is suggested that the purchaser review the
need for additional backup equipment or provide alternate means of protection such as alarm
devices, output limiting, fail-safe valves, relief valves, emergency shutoffs, emergency switches,
etc. If additional information is required, the purchaser is advised to contact Remote Automation
Solutions.
RETURNED EQUIPMENT WARNING
When returning any equipment to Remote Automation Solutions for repairs or evaluation,
please note the following: The party sending such materials is responsible to ensure that the
materials returned to Remote Automation Solutions are clean to safe levels, as such levels are
defined and/or determined by applicable federal, state and/or local law regulations or codes. Such
party agrees to indemnify Remote Automation Solutions and save Remote Automation Solutions
harmless from any liability or damage which Remote Automation Solutions may incur or suffer due
to such party's failure to so act.
ELECTRICAL GROUNDING
Metal enclosures and exposed metal parts of electrical instruments must be grounded in
accordance with OSHA rules and regulations pertaining to "Design Safety Standards for Electrical
Systems," 29 CFR, Part 1910, Subpart S, dated: April 16, 1981 (OSHA rulings are in agreement
with the National Electrical Code).
The grounding requirement is also applicable to mechanical or pneumatic instruments that
include electrically operated devices such as lights, switches, relays, alarms, or chart drives.
EQUIPMENT DAMAGE FROM ELECTROSTATIC DISCHARGE VOLTAGE
This product contains sensitive electronic components that can be damaged by exposure to an
electrostatic discharge (ESD) voltage. Depending on the magnitude and duration of the ESD, this
can result in erratic operation or complete failure of the equipment. Read supplemental document
S14006 for proper care and handling of ESD-sensitive components.
Page 3

ControlWave Flow Measurement Applications Guide
Contents
Chapter 1 – Introduction 1-1
1.1 Components of the ControlWave Standard Gas Flow Measurement Application .................... 1-1
1.2 Overview of the Standard Gas Flow Measurem ent Ap plica t ion ............................................... 1-2
1.2.1 Data Acquisition – Static Pressure, Differential Pressure, Temperature Variables ...... 1-2
1.2.2 Flow and Volume Calculations ...................................................................................... 1-3
1.2.3 Flow Rate and Flow Time Calculations (AGA3)............................................................ 1-3
1.2.4 Flow Rate and Flow Time Calculations (AGA7)............................................................ 1-3
1.2.5 Extension Calculation and Analog Averaging ............................................................... 1-4
1.2.6 Energy Calculation ........................................................................................................ 1-4
1.2.7 Volume and Energy Integration .................................................................................... 1-4
1.2.8 Downstream Pressure Tap ........................................................................................... 1-4
1.2.9 Historical Data Storage (Audit Records/ Archive Files) ................................................ 1-4
1.2.10 Run Switching ............................................................................................................... 1-6
1.2.11 Sampler and Odorizer ................................................................................................... 1-7
1.2.12 Chromatograph Interface .............................................................................................. 1-7
1.2.13 Nominations .................................................................................................................. 1-7
1.3 Scope of the Manual ................................................................................................................. 1-7
Chapter 2 – Getting Started 2-1
2.1 Before You Begin ...................................................................................................................... 2-1
2.2 Application Files ........................................................................................................................ 2-2
2.3 Starting the Application in TechView......................................................................................... 2-3
2.3.1 Startup Sequence for ControlWave GFC, GFC Plus, Corrector ................................... 2-3
2.3.2 Startup Sequence for ControlWave EFM ...................................................................... 2-3
2.3.3 Startup Sequence for ControlWave XFC ...................................................................... 2-3
2.4 TechView Screens .................................................................................................................... 2-3
2.4.1 Logging Onto the ControlWave Flow Computer (EFM/GFC/XFC) ............................... 2-4
2.5 Accessing Pages of the Flow Measurement Application .......................................................... 2-5
Chapter 3 – Using the Measurement Group Data Tab 3-1
3.1 Accessing the Data Tab ............................................................................................................ 3-1
3.2 Meter Run Overview ................................................................................................................. 3-2
3.3 Station Summary ....................................................................................................................... 3-6
3.3.1 Forward/Reverse Summary ........................................................................................ 3-11
Chapter 4 – Using the Measurement Group Config Tab 4-1
4.1 Accessing the Config Tab ......................................................................................................... 4-2
4.2 Meter Run I/O Configuration ..................................................................................................... 4-3
4.3 Alarm Configuration ................................................................................................................ 4-13
4.4 Analog Input/Output Configuration .......................................................................................... 4-19
4.5 Auto-Adjust Configuration ....................................................................................................... 4-22
4.6 Transmitter Configuration ........................................................................................................ 4-26
4.7 Basic Flow Setup..................................................................................................................... 4-28
4.7.1 Basic Flow Setup – AGA3TERM ................................................................................ 4-28
4.7.2 Basic Flow Setup – AGA3I .......................................................................................... 4-31
4.7.3 Basic Flow Setup – AGA7 ........................................................................................... 4-35
4.7.4 Basic Flow Setup – Coriolis ........................................................................................ 4-38
4.8 Flow Equation Selection and Details....................................................................................... 4-40
Issued: Oct-2014 Contents iii
Page 4

ControlWave Flow Measurement Applications Guide
4.8.1 Differential Measurement – AGA3I (1992 equation) ................................................... 4-41
4.8.2 Differential Measurement – AGA3TERM (1985 equation).......................................... 4-45
4.8.3 Linear Measurement – AGA7 ..................................................................................... 4-48
4.8.4 Coriolis Measurement ................................................................................................. 4-51
4.9 Compressibility Setup ............................................................................................................. 4-53
4.10 GC Summary .......................................................................................................................... 4-57
4.11 Chromatograph Component Range Setup ............................................................................. 4-64
4.12 Sampler and Odorizer Output Configuration ........................................................................... 4-69
4.13 Mechanical Counter Configuration .......................................................................................... 4-72
4.14 Nominations ............................................................................................................................ 4-73
4.15 Flow Control and Valve Control .............................................................................................. 4-78
4.16 Run Switching ......................................................................................................................... 4-85
Chapter 5 – Using the Measurement Group Logs Tab 5-1
5.1 Accessing the Logs Tab ............................................................................................................ 5-1
5.2 Viewing Archives – Meter Run Archive Files / Alarms .............................................................. 5-1
5.2.1 Using the Float Format dialog box ................................................................................ 5-6
5.2.2 Working with the Archive Grid ....................................................................................... 5-7
5.3 View Audit Trail ......................................................................................................................... 5-8
5.4 Archive File Collection ............................................................................................................. 5-11
Chapter 6 – Using the Device Group Config Tab 6-1
6.1 Accessing the Config Tab ......................................................................................................... 6-1
6.2 Meter Run Save/Load Configuration ......................................................................................... 6-2
6.2.1 Creating a Recipe ......................................................................................................... 6-4
6.2.2 Saving the Recipe ......................................................................................................... 6-5
6.2.3 Recalling a Saved Recipe, and Sending Its Values to the ControlWave...................... 6-5
Chapter 7 – Using the Device Group Comm Tab 7-1
7.1 Accessing the Config Tab ......................................................................................................... 7-1
7.2 Radio Control ............................................................................................................................ 7-1
Chapter 8 – Using the Device Group Specials Tab 8-1
8.1 Accessing the Specials Tab ...................................................................................................... 8-1
8.2 RTU Date and Time .................................................................................................................. 8-1
Appendix M – Modbus Coil and Register Maps M-1
Index IND-1
iv Contents Issued: Oct-2014
Page 5

Chapter 1 – Introduction
This manual focuses on how you can configure and use the standard gas
measurement application program available with ControlWave flow
computer products.
The ControlWave flow computer products include:
ControlWave Gas Flow Computer (GFC)
ControlWave Gas Flow Computer Plus (GFC in enclosure)
ControlWave Gas Flow Corrector
ControlWave Electronic Flow Meter (EFM)
ControlWave Explosion Proof Flow Computer (XFC)
This chapter provides an overview of the ControlWave flow computer
application and details the structure of this manual.
In This Chapter
ControlWave Flow Measurement Applications Guide
1.1 Components of the ControlWave Standard Gas Flow Measurement
Application ................................................................................................ 1-1
1.2 Overview of the Standard Gas Flow Measurement Application ............... 1-2
1.2.1 Data Acquisition – Static Pressure, Differential Pressure,
Temperature Variables ................................................................ 1-2
1.2.2 Flow and Volume Calculations ...................................................... 1-3
1.2.3 Flow Rate and Flow Time Calculations (AGA3) ............................ 1-3
1.2.4 Flow Rate and Flow Time Calculations (AGA7) ............................ 1-3
1.2.5 Extension Calculation and Analog Averaging ................................ 1-4
1.2.6 Energy Calculation ........................................................................ 1-4
1.2.7 Volume and Energy Integration ..................................................... 1-4
1.2.8 Downstream Pressure Tap............................................................ 1-4
1.2.9 Historical Data Storage (Audit Records/ Archive Files) ................. 1-4
1.2.10 Run Switching ................................................................................ 1-6
1.2.11 Sampler and Odorizer ................................................................... 1-7
1.2.12 Chromatograph Interface .............................................................. 1-7
1.2.13 Nominations .................................................................................. 1-7
1.3 Scope of the Manual ................................................................................. 1-7
1.1 Components of the ControlWa ve St a nda rd Gas Flow Measurement
Application
The ControlWave standard gas flow measurement application consists of:
A ControlWave project file (*.PRO) pre-programmed for natural gas
measurement.
A customized flash configuration profile (*.FCP) file that configures
the ports, memory, audit, and archive parameters of the ControlWave
GFC/GFC Plus/EFM/XFC/Corrector.
A TechView session. This includes the TechView session file
(*.TVS), associated *.INI files, and a set of HTM menus customized
Revised Oct-2014 Introduction 1-1
Page 6

ControlWave Flow Measurement Applications Guide
for the gas measurement application. You use these menus to
configure the application.
1.2 Overview of the Standard Gas Flow Measurement Application
The ControlWave standard gas flow measurement application collects
static pressure, differential pressure and temperature data and computes
flow, energy, and volume for a station.
A station typically refers to a single flow computer and all its associated
meter runs. Each meter run refers to measurement of natural gas through
a single pipeline.
There are certain variations in the application depending upon which
ControlWave model you use. For example, the ControlWave EFM
supports up to four meter runs, whereas other models are only configured
to support one or two meter runs.
Note: If your ControlWave application requires more than four meter
runs, you should use the Station Manager application instead. See
the ControlWave Station Manager Configuration Manual (D5136)
for more information.
Similarly, certain input/output (I/O) options only apply to certain models.
Common features for all versions of the application are discussed below:
1.2.1 Data Acquisition – Static Pressure, Differential Pressure,
Temperature Variables
The application requires these process inputs for orifice measurement:
static pressure (SP) collected once per second
differential pressure (DP) collected once per second
flowing temperature (T) collected once per second
The application requires these process inputs for measurement using a
positive displacement (PD), turbine, or ultrasonic meter:
static pressure (SP) collected once per second
frequency input collected once per second
flowing temperature (T) collected once per second
The application also collects self-test and compensation variables at
intervals of four seconds or less.
Pressure data can come from any of the following sources:
Analog pressure transmitters connected to analog input points on a
process I/O module in the ControlWave flow computer.
Built-in multivariable transducer.
External multivariable transmitters (Bristol or Rosemount) using
BSAP or Modbus communications through an RS-485 communication
port.
1-2 Introduction Revised Oct-2014
Page 7

ControlWave Flow Measurement Applications Guide
1.2.2 Flow a nd V olume Calculations
Flow and volume calculations conform to American Petroleum Institute
(API) and American Gas Association (AGA) standards.
Supported flow calculations include:
AGA3-1985/NX-19
AGA3-1992 with selectable AGA8 Gross or AGA8 Detail
AGA7/NX-19
AGA7 with selectable AGA8 Gross or AGA8 Detail
Auto-adjust AGA7/NX-19
Auto-adjust AGA7 with selectable AGA8 Gross or AGA8 Detail
The application performs a complete flow calculation using the process
variables every second. Each calculation includes instantaneous rate
according to API 14.3, compressibility according to AGA 8 Detail or
Gross method, and updates of all volumes, totals, and archive averages.
1.2.3 Flow Ra t e a nd Flow Time Cal c ulations (AGA3)
For orifice flow measurement, the application compares the differential
pressure value to a low flow cutoff value every second. If the differential
pressure falls below the low flow cutoff value, flow is considered to be
zero for that second. Hourly and daily flow time is defined to be the
number of seconds for which the differential pressure exceeded the cutoff
value for the period.
The values for static and differential pressure and temperature are used as
inputs to the flow equations. You can select API 14.3 (AGA3, 1992) and
AGA8 calculations, with compressibility calculations according to AGA
Report No. 8, 1992 (with 1993 errata). The application supports both the
detail method and the two gross methods of characterization described in
AGA 8. Users may also select the AGA3, 1995 and NX-19 flow equations
to calculate the rate of flow.
1.2.4 Flow Ra t e a nd Flow Time Cal c ulations (AGA7)
When using PD meters, turbine meters or ultrasonic meters, the
application calculates flow rate by applying the correction factor computed
by the AGA7 calculations to the frequency of the input pulses. When the
frequency drops below 1 Hz, the application sets the flow rate estimate to
zero; however, volume calculations still accumulate. The flow time
recorded is the time for which the flow rate is non-zero.
Revised Oct-2014 Introduction 1-3
Page 8

ControlWave Flow Measurement Applications Guide
1.2.5 Extension Calc ulation and Analog Averaging
For orifice meters, the application calculates the flow extension every
second. The extension is the square root of the product of the absolute
upstream static pressure times the differential pressure. This extension is
used in the flow rate calculation. When there is no flow, the application
reports the arithmetic averages of static pressure and temperature. This
allows you to monitor static pressure and temperature during shut-in
periods.
1.2.6 Energy Calculation
The application offers the option of using a fixed volumetric heating value
or calculating the energy content of the gas according to AGA Report No.
5.
1.2.7 Volume and Energy Integration
The application integrates and accumulates volume and energy at the end
of every calculation cycle. The application calculates the volume for a
cycle by multiplying the calculated rate by the flow time for that cycle.
The application calculates the energy for a cycle by multiplying the
volume at base conditions by the heating value.
1.2.8 Downstream Pressure Tap
The multivariable transducer typically measures static pressure from an
integral tap on the upstream, high-pressure leg of the differential pressure
connection. The transducer can also measure static pressure at the
downstream pressure tap, with the measurement taken from the lowpressure side to the high-pressure side. In this installation, the differential
signal from the transducer is negative. If, while using the integral smart
multivariable transmitter (MVT) or an external MVT, you select the
downstream tap location during MVT configuration, the MVT firmware
changes the sign of the differential pressure to provide a positive DP
value.
1.2.9 Historical Data Storage (Audit Records/ Archive Files)
The ControlWave supports two distinct types of historical data storage –
audit records and archive files.
Where feasible, both forms of archive data conform to the requirements of
the API Chapter 21. Specifically, the averages of the process variables
stored in the data archive are for flowing periods, appropriate to their
usage in the equations, and any gas-related parameter designated an event
that is changed by an operator either remotely or locally causes an entry in
the audit log.
1-4 Introduction Revised Oct-2014
Page 9

ControlWave Flow Measurement Applications Guide
Audit Records
(Alarms and
Events)
The audit system maintains a history of alarms and certain events that
have an impact on the calculated and reported gas flow rates and
volumes.
The application stores
500 e
entries.
to prevent recurring alarms from overwriting
events
The following circumstances
You can view audit records on
See the
help on interpreting
Archive Files
(Averages,
totals, and other
values
Archive files store the value of process variables and other calculated
variables at specified intervals
entry
When archive files fill up, new values overwrite the oldes
files.
The application displays archive file data in hourly, data, and periodic
logs you can view on screen.
Log Breaks
)
the most recent 500 alarms and the most recent
vents. As new alarms/events arrive, they overwrite the oldest
Internally, the ControlWave stores alarms and events separately
configuration audit data
. The application reports alarms and events in the same log.
generate an audit record:
Any operator change to a configuration variable
Any change in the state of an alarm variable
A system restart
Certain other system events
-screen in the audit log.
Supplement to OpenBSI 5.8 Service Pack 1 documentation for
audit records.
along with the date and time of each
. This includes flow rates, volumes and other calculated values.
t entries in the
You can configure the application to support the "breaking" of a log period
when an operator-changes a parameter. When this occurs, the log period in
process closes out to make a log, and a new log begins.
Hourly Historical Data Log
Each meter run maintains an hourly data log that holds one record for
every contract hour. Hourly logs hold 840 entries or 35 days; this ensures
that the previous period of hourly data is always resident in flash memory.
The hourly data log stores the following items:
corrected volume
uncorrected volume
accumulated energy
average static pressure
average temperature
average differential pressure
Revised Oct-2014 Introduction 1-5
Page 10

ControlWave Flow Measurement Applications Guide
average specific gravity
average heating value
flow time
uncorrected count
Daily Historical Data Log
Each meter run maintains a daily data log that holds one record for every
contract gas day. You can change the contract hour the contract gas day
starts at some time other than midnight. The daily log holds 62 entries; this
ensures that the previous calendar month of daily data is always resident in
flash memory.
The daily data log stores the following items:
corrected volume
uncorrected volume
accumulated energy
average static pressure
average temperature
average differential pressure
average specific gravity
average heating value
flow time
uncorrected count
Periodic Historical Data Log
Each meter run maintains a periodic data log that holds one record for
every log interval. Each log interval is 15 minutes. The periodic historical
data log holds 1440 records, or four days of 15 minute data.
The periodic historical data log stores the following items:
flowing differential pressure
flowing static pressure
flowing temperature
frequency
1.2.10 Run Switc hing
If you use multiple meter runs in the application, you can configure run
switching. Run switching (also known as meter run staging or tube
switching) allows changes to the number of meter runs currently active to
meet the gas flow demand for the station. See Section 4.15 for more
information.
1-6 Introduction Revised Oct-2014
Page 11

1.2.11 Sampler and Odorizer
Config Tab
Provides information on the various
Logs Tab
Samplers are external devices which measure the quality of the gas stream.
Because natural gas is odorless and colorless, devices called odorizers
inject an additive to the gas stream that allows people to detect the
presence of natural gas in the event of a gas leak.
For information on configuring the application to work with a sampler or
odorizer, see Section 4.11.
1.2.12 Chromatograph Interface
If you use a chromatograph to measure gas component information you
can integrate this into the application. You can also specify fixed gas
component percentages to use if the chromatograph fails. See Section 4.10
for more information.
1.2.13 Nominations
Nominations allow you to configure the ControlWave flow computer to
allocate precise amounts of gas flow during specific time periods, called
nomination periods. See Section 4.13 for more information.
ControlWave Flow Measurement Applications Guide
1.3 Scope of the Manual
This manual contains the following chapters:
Chapter 1
Introduction
Chapter 2
Getting Started
Chapter 3
Using the
Measurement Group
Data tab
Chapter 4
Using the
Measurement Group
Chapter 5 Using the
Measurement Group
Chapter 6 – Using the
Device Group Config
Tab
Chapter 7 – Using the
Device Group Comm
Tab
Provides an overview of the features supported
by the ControlWave standard gas flow
measurement application.
Provides general information on software
installation and how to start the application.
Provides information on viewing the summary
pages for the station and the meter run.
configuration pages.
Provides information on viewing archive and
audit data on screen.
Provides information on saving/retrieving recipe
values.
Provides instructions for setting up radio
communication.
Revised Oct-2014 Introduction 1-7
Page 12

ControlWave Flow Measurement Applications Guide
Chapter 8 – Using the
Specials Tab
Provides instructions for setting the
ControlWave flow computer’s clock.
1-8 Introduction Revised Oct-2014
Page 13

Chapter 2 – Getting Started
This chapter discusses the prerequisites for running the application, and
tells you how to start the software.
In This Chapter
2.1 Before You Begin ...................................................................................... 2-1
2.2 Application Files ........................................................................................ 2-2
2.3 Starting the Application in TechView ........................................................ 2-3
2.3.1 Startup Sequence for ControlWave GFC, GFC Plus, Corrector ... 2-3
2.3.2 Startup Sequence for ControlWave EFM ...................................... 2-3
2.3.3 Startup Sequence for ControlWave XFC ...................................... 2-3
2.4 TechView Screens .................................................................................... 2-3
2.4.1 Logging Onto the ControlWave Flow Computer (EFM/GFC/XFC) 2-4
2.5 Accessing Pages of the Flow Measurement Application ......................... 2-5
2.1 Before You Begin
You must install the ControlWave flow computer (GFC, GFC Plus,
Corrector, EFM, XFC) on site and connect field devices to its I/O
module(s) or ports. For information on ControlWave hardware, see the
appropriate document:
ControlWave Flow Measurement Applications Guide
CI-ControlWave EFM
CI-ControlWave GFC
CI-ControlWave GFC Plus
CI-ControlWave Corrector
CI-ControlWave XFC
You must install OpenBSI software including TechView on your PC
workstation. See the OpenBSI Utilities Manual (D5081), the
BSI_Config User’s Manual (D5128), and the TechView User Manual
(D5131) for details.
You must connect a serial communication cable between the PC
workstation and the Control flow computer.
The ControlWave flow computer (EFM /GFC /GFC Plus /Corrector
/XFC) must be running a flash configuration profile file (*.FCP)
compatible with the gas measurement application. For information on
updating FCP files, see Chapter 5 of the OpenBSI Utilities Manual
(D5081).
The ControlWave flow computer must be running the standard
ControlWave project (*.PRO) file configured for the gas measurement
application. See Chapter 7 of the OpenBSI Utilities Manual (D5081)
for information on downloading a ControlWave project (*.PRO) file.
If you need to calibrate the pressure/temperature sensors of the
ControlWave flow computer, you can do this through TechView. See
the TechView User Manual (D5131) for details.
Revised Oct-2014 Installation and Initial Configuration 2-1
Page 14

ControlWave Flow Measurement Applications Guide
Note: If you ordered your ControlWave flow computer with the standard
gas measurement application pre-installed, the FCP and PRO files
are already loaded when the unit ships from the factory.
2.2 Application Files
If you ordered your ControlWave with the application pre-installed, you
can skip to Section 2.3.
If you purchased the application after you got the ControlWave hardware
you will need to download the appropriate PRO and FCP files to your
hardware as mentioned in Section 2.1. See Table 2-1 to locate the proper
files.
Table 2-1. Application Files
ControlWave
Platform
ControlWave
GFC
ControlWave
GFC Plus
ControlWave
EFM
ControlWave
Corrector
OpenBSI Folder Path Use this
ControlWave
Project (*.PRO)
\openbsi\webGFC\config\ mgfcx_xx.PRO mgfcx_xx.FCP CwaveGFC.TVS
\openbsi\webGFC\config\ mgfcx_xx.PRO mgfcx_xx.FCP CwaveGFC.TVS
\openbsi\webEFM\config\ mefmx_xx.PRO mefmx_xx.FCP CwaveEFM.TVS
\openbsi\webGFC\config\ mgfcx_xx.PRO mgfcx_xx.FCP CwaveGFC.TVS
Use this Flash
Configuration
Profile (*.FCP)
Use this TechView
Session File
(*.TVS)
ControlWave
XFC
2-2 Installation and Initial Configuration Revised Oct-2014
\openbsi\webXFC\config\ mxfcx_xx.PRO mxfcx_xx.FCP CwaveXFC.TVS
Page 15

ControlWave Flow Measurement Applications Guide
Notes:
The ControlWave GFC, GFC Plus, and Corrector share the same set of
application files.
You must replace the x_xx shown in filenames with the version
number. For example, for XFC version 1.58 the mxfcx_xx.pro
becomes mxfc1_58.pro.
2.3 Starting the Application in TechView
You start the application by accessing the appropriate TVS file from the
Start Program menu:
2.3.1 Startup Sequence for ControlWave GFC, GFC Plus, Corrector
Click: Start>Programs > OpenBSI Tools > Calibration &
Configuration> CWave GFC Setup
2.3.2 Startup Sequence for ControlWave EFM
Click: Start>Programs > OpenBSI Tools > Calibration &
Configuration> CWave EFM Setup
2.3.3 Startup Sequence for ControlWave XFC
Click: Start>Programs > OpenBSI Tools > Calibration &
Configuration> CWave XFC Setup
2.4 TechView Screens
Once you start the TVS file for serial operation, TechView opens the
Runtime Configuration Parameters dialog box:
Figure 2-1. Serial Runtime Parameters
Revised Oct-2014 Installation and Initial Configuration 2-3
Page 16

ControlWave Flow Measurement Applications Guide
1. Leave the number of transmitters at the default of 12.
2. Enter the BSAP local address of the ControlWave flow computer
to which you are connected.
3. Select the serial communication port on the PC which you are
using to communicate with the ControlWave flow computer.
4. Select the baud rate on the serial communication line.
5. Click OK.
6. Log onto the ControlWave flow computer as described in Section
2.4.1.
2.4.1 Logging Onto the ControlWave Flow Computer (EFM/GFC/XFC)
In the SignOn to RTU dialog box, enter a Username / Password
combination that allows full access to the ControlWave flow computer,
then click the SignOn button.
Figure 2-2. Logging onto the ControlWave Flow Computer
2-4 Installation and Initial Configuration Revised Oct-2014
Page 17

ControlWave Flow Measurement Applications Guide
2.5 Accessing Pages of the Flow Measurement Application
The flow measurement application uses two different group icons within
TechView – the Measurement Group and the Device Group. By default,
the application opens on the Measurement group.
1. To select a group different than the one displayed, click on its icon
to bring up the different group menu.
2. On the group menu, click on the desired tab.
3. Click on a button to bring up a page.
Click on tabs to bring up other
buttons to access additional
pages in this group.
Click on a button to
open its associated
page.
Measurement Group icon
Device Group icon
Figure 2-3. Calling Up Menus
Notes:
The remaining sections of this manual discuss the flow measurement
application pages within the Measurement and Device groups.
For information on other groups (On-Line Edits or Calibration) see the
TechView User Manual (D5131).
Revised Oct-2014 Installation and Initial Configuration 2-5
Page 18

This page is intentionally left blank
Page 19

ControlWave Flow Measurement Applications Guide
Data tab
Measurement group icon
Chapter 3 – Using the Measurement Group Data Tab
This chapter discusses the Data tab in the Measurement group. The Data
tab lets you view details on the meter run and the station.
In This Chapter
3.1 Accessing the Data Tab ............................................................................ 3-1
3.2 Meter Run Overview ................................................................................. 3-2
3.3 Station Summary ...................................................................................... 3-6
3.1 Accessing the Data Tab
1. Within TechView, if you are in any group other than the
3.3.1 Forward/Reverse Summary ........................................................ 3-11
Measurement group, click the Measurement group icon.
2. Click the Data tab.
Issued Oct-2014 Measurement Group Data Tab 3-1
Figure 3-1. Measurement Group Data tab
Page 20

ControlWave Flow Measurement Applications Guide
Calling up this Menu
Field
Description
Meter Run
Overview for Run#
Select the number of the meter run for which you want to
view data.
Time
The current time, in 24-hour format, reported by the flow
computer.
Pipe Diameter
Shows the diameter of the pipe for this meter run.
Orifice Diameter
Shows the diameter of the orifice for this meter run.
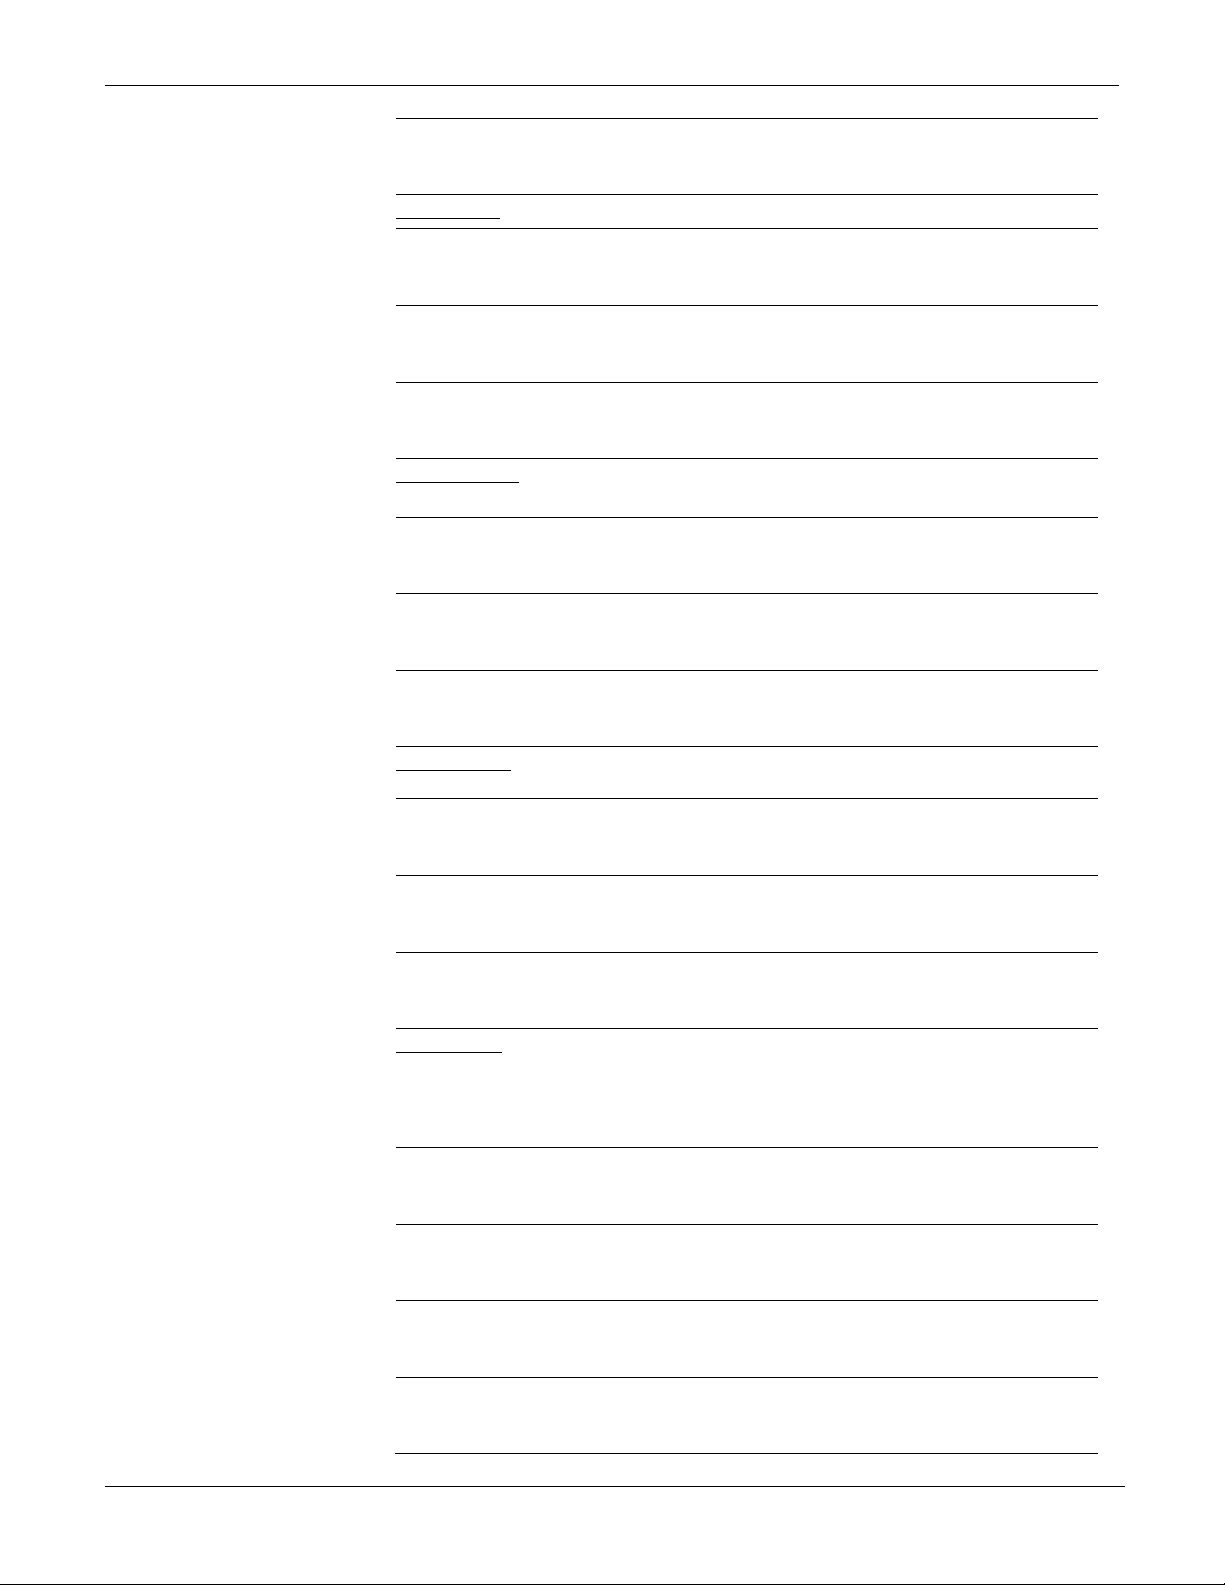
3.2 Meter Run Overview
The Meter Run Overview page displays current flow and energy rates as
well as accumulated volume and energy totals for the current/previous
hour and current/previous day.
Click
Note: The very first time you click this button after installation; the
application prompts you to select the flow measurement
equation, and automatically re-directs you to the flow
measurement selection and detail pages. See Section 4.8.
Figure 3-2. Meter Run Overview
3-2 Measurement Group Data Tab Revised Oct-2014
Page 21

ControlWave Flow Measurement Applications Guide
DP
Shows the current differential pressure reading for this
meter run.
SP
Shows the current static pressure reading for this meter
run.
T
Shows the current temperature reading for this meter run.
Hz
Shows the current frequency reading for this meter run.
Meter ID
Enter an identifying name for the meter (ControlWave
flow computer.) Typically this would be the node name,
but that is not required.
Active Flow
Calculation
Shows the currently selected flow calculation for this
meter run.
Flow Rate
Shows the current corrected flow rate of gas for this
meter run.
Corrected Flow Rate
Shows the current corrected flow rate of gas for this
meter run.
Uncorrected Flow
Rate
Shows the current uncorrected flow rate of gas for this
meter run.
Contract Hour
Shows the hour of the day (0 to 23) which marks the
beginning of the contract “gas day.”
Current Heating
Value
Shows the current calculated heating value for the gas for
this meter run.
Energy Rate
Shows the current calculated energy rate for the gas for
this meter run.
Current Hour
Accumulated
Volume
Shows the accumulated volume of gas for this meter run
for the current hour.
Corrected Volume
Shows the corrected volume of gas for this meter run for
the
Uncorrected Volume
Shows the uncorrected volume of gas for this meter run
for the current hour.
Accumulate d E ner gy
Shows the accumulated energy of gas for this meter run
for the current hour.
(Shown only for orifice type meters.)
(Shown only for linear type meters.)
(Shown only for linear type meters.)
Issued Oct-2014 Measurement Group Data Tab 3-3
(Shown only for orifice type meters.)
current hour. (Shown only for linear type meters.)
(Shown only for linear type meters.)
Page 22

ControlWave Flow Measurement Applications Guide
Flow Time
Shows the amount of time gas is flowing for the current
hour for this meter run.
Current Day
Accumulated
Volume
Shows the accumulated volume of gas for this meter run
for the current day.
Corrected Volume
Shows the corrected volume of gas for this meter run for
the current day.
Uncorrected Volume
Shows the uncorrected volume of gas for this meter run
for the current day.
Accumulate d E ner gy
Shows the accumulated energy of gas for this meter run
for the current day.
Flow Time
Shows the amount of time gas is flowing for the current
day for this meter run.
Previous Hour
Accumulated
Volume
Shows the accumulated volume of gas for this meter run
for the previous hour.
meters
Corrected Volume
Shows the corrected volume of gas for this meter run for
the previous hour.
Uncorrected Volume
Shows the uncorrected volume of gas for this meter run
for the previous hour.
.)
Accumulate d E ner gy
Shows the accumulated energy of gas for this meter run
for the previous hour.
Avg Static Pressure
Shows the average static pressure of gas for this meter
run for the previous hour.
Avg Temperature
Shows the average temperature of gas for this meter run
for the previous hour.
Avg Diff. Pressure
Shows the average differential pressure of gas for this
meter run for the previous hour.
type meters
Avg Spec. Gravity
Shows the average specific gravity of gas for this meter
run for the previous hour.
Avg Heating Va lue
Shows the average heating value of gas for this meter
run for the previous hour.
Avg FPV
Shows the average supercompressibility factor (FPV) of
gas for this meter run for the previous hour.
.)
(Shown only for orifice type meters.)
(Shown only for linear type meters.)
(Shown only for linear type meters.)
(Shown only for orifice type
(Shown only for linear type meters.)
.)
(Shown only for linear type meters
(Shown only for orifice
3-4 Measurement Group Data Tab Revised Oct-2014
Page 23

ControlWave Flow Measurement Applications Guide
Avg CO2
Shows the average carbon dioxide (CO2) within the gas
for this meter run for the previous hour.
Avg N2
Shows the average nitrogen (N2) within the gas for this
meter run for the previous hour.
Flow Time
Shows the amount of time gas is flowing for the previous
hour for this meter run.
Previous Day
Accumulated
Volume
Shows the accumulated volume of gas for this meter run
for the previous day.
Corrected Volume
Shows the corrected volume of gas for this meter run for
the previous day.
Uncorrected Volume
Shows the uncorrected volume of gas for this meter run
for the previous day.
Accumulate d E ner gy
Shows the accumulated energy of gas for this meter run
for the previous day.
Avg Static Pressure
Shows the average static pressure of gas for this meter
run for the previous day.
Avg Temperature
Shows the average temperature of gas for this meter run
for the previous day.
Avg Diff. Pressure
Shows the average differential pressure of gas for this
meter run for the previous day.
type meters
Avg Spec. Gravity
Shows the average specific gravity of gas for this meter
run for the previous day.
Avg Heating Va lue
Shows the average heating value of gas for this meter
run for the previous day.
Avg FPV
Shows the average supercompressibility factor (FPV) of
gas for this meter run for the previous day.
Avg CO2
Shows the average carbon dioxide (CO2) within the gas
for this meter run for the previous day.
Avg N2
Shows the average nitrogen (N2) within the gas for this
meter run for the previous day.
Flow Time
Shows the amount of time gas is flowing for the previous
day for this meter run.
Reset Meter Run’s
Measurement Type
If you chose the wrong flow equation type, click this
button to re
.)
(Shown only for orifice type meters.)
(Shown only for linear type meters.)
(Shown only for linear type meters.)
(Shown only for orifice
Issued Oct-2014 Measurement Group Data Tab 3-5
-select the flow equation.
Page 24

ControlWave Flow Measurement Applications Guide
The Station Summary page presents flow and energy data for the
Calling up this Menu
3.3 Station Summary
station for the current hour, current day, previous hour, and previous
day.
Click
3-6 Measurement Group Data Tab Revised Oct-2014
Page 25

ControlWave Flow Measurement Applications Guide
Field
Description
Station Identification
Firmware Major
Shows the major version number for the ControlWave
system firmware currently installed in the ControlWave
flow computer.
Firmware Minor
Shows the minor version number for the ControlWave
system firmware currently installed in the ControlWave
flow computer.
Station ID
Click in this field and type in a name to the station.
This could be the flow computer node name, a
geographic location, or other name you decide.
Program Name
Shows the name of the ControlWave project (*.PRO)
file exec
Program Revision
Shows the revision level of the ControlWave project
(*.PRO) file executing in the ControlWave flow
computer.
Web Page Version
Shows the revision level of the ControlWave
application HTML pages running on your PC.
System Voltage Input
This field shows the voltage coming to the power
supply for the
Corrector.
Note: The ControlWave GFC has two system voltage
Figure 3-3. Station Summary page
uting in the ControlWave flow computer.
Issued Oct-2014 Measurement Group Data Tab 3-7
ControlWave EFM, GFC, XFC, or
Page 26

ControlWave Flow Measurement Applications Guide
inputs.
Ram Backup Battery
Status
Displays the status of the SRAM backup battery in the
ControlWave flow computer. If the SRAM backup
battery fails and there is a power failure or reboot of
the unit, the ControlWave flow computer loses
configuration parameters, retain data, static memor
data, and pending alarm messages
Station Totals
Station totals encompass all meter runs for this
station.
Corrected Flow Rate
This field displays the current corrected flow rate of
gas
the correct units fo
Uncorrected Flow Rate
This field displays the current uncorrected flow rate of
gas
applied.
units fo
Energy Rate
This field displays the current energy rate for gas at
this
correct units for the energy rate.
Corrected Volume NonResetting A ccu mula tor
This field shows the running total corrected volume
since the last the last time you clicked
Uncorrected Volume
Non
Accumulator
This field shows the running total uncorrected volume
since the last the last time you clicked
Energy Non-Resetting
Accumulator
This field shows the running total energy since the last
the last time you clicked
Reset Non-Resetting
Accumulato rs Pus h to
Reset
The accumulators do not reset to zero automatically at
the end of the hour or day. They reset only when you
manually reset them.
Click the
zero for all of this station’s non
Go to Forward/Reverse
Totals
Click here to go to the Forward/Reverse Summary
menu.
Current Hour
This section shows readings for the current “gas hour.”
Corrected Volume
This field displays the corrected volume of gas for this
station for the current hour.
Uncorrected Volume
This field displays the uncorrected volume of gas for
this station for the current hour.
y
.
for this station. Click in the field at right to specify
r the corrected flow rate.
for this station before any correction factors are
Click in the field at right to specify the correct
r the uncorrected flow rate.
-Resetting
station. Click in the field at right to specify the
Push to Reset.
Push to Reset button to reset the totals to
-resetting accumulators.
Push to Reset.
Push to Reset.
3-8 Measurement Group Data Tab Revised Oct-2014
Page 27
ControlWave Flow Measurement Applications Guide
Accumulate d E ner gy
This field displays the accumulated energy of gas for
this station for t
Current Day
This section shows readings for the current “gas day.”
Corrected Volume
This field displays the corrected volume of gas for this
station for the current
Uncorrected Volume
This field displays the uncorrected volume of gas for
this station for the current day.
Accumulate d E ner gy
This field displays the accumulated energy of gas for
this station for the current day.
Previous Hour
This section shows readings for the previous “gas
hour.”
Corrected Volume
This field displays the corrected volume of gas for this
station for the previous hour.
Uncorrected Volume
This field displays the uncorrected volume of gas for
this station for the previous hour.
Accumulate d E ner gy
This field displays the accumulated energy of gas for
this station f
Previous Day
This section shows readings for the previous “gas
day.”
Corrected Volume
This field displays the corrected volume of gas for this
station for the
Uncorrected Volume
This field displays the uncorrected volume of gas for
this station for the previous day.
Accumulate d E ner gy
This field displays the accumulated energy of gas for
this station for the previous day.
Meter Run x
The number of meter runs varies depending upon the
ControlWave type. ControlW
four meter runs; ControlWave Corrector/GFC/GFC
Plus and XFC default to two meter runs.
ID
This field shows the name assigned to this meter run.
Corrected Flow Rate
This field displays the current corrected flow rate of
gas for this meter run.
Uncorrected Flow Rate
This field displays the current uncorrected flow rate of
gas for this meter run.
Prev. Hour Corrected
Volume
This field displays the corrected volume of gas for this
meter run for
he current hour.
day.
or the previous hour.
previous day.
ave EFM supports up to
Issued Oct-2014 Measurement Group Data Tab 3-9
the previous hour.
Page 28

ControlWave Flow Measurement Applications Guide
Prev. Hour Uncorrected
Volume
This field displays the uncorrected volume of gas for
this meter run for the previous hour.
Prev. Hour
Accumulated Ener
This field displays the accumulated energy of gas for
this meter run for the previous hour.
Prev. Day Corrected
Volume
This field displays the corrected volume of gas for this
meter run for the previous day.
Prev. Day Uncorrected
Volume
This field displays the uncorrected volume of gas for
this meter run for the previous day.
Prev. Day Accumulated
Energy
This field displays the accumulated energy of gas for
this meter run for the previous day.
Runs x and y BiDirectional Support
Enabled/Disabled
This button only shows for even-numbered meter
runs. Its label shows the current state for bi-directional
support. When you click the button you toggle the
state.
Click
which gas can flow in both forward and reverse
directions through the pipe. The
Enabled
numbered meter runs.
Click
button now displays
Corrected Volume NonResetting A ccu mula tor
This field shows a running total of the corrected
volume since the last time you clicked the
Reset
Uncorrected Volume
Non
Accumulato
This field shows a running total of the uncorrected
volume since the last time you clicked the
Reset
Energy Non-Resetting
Accumulator
This field shows a running total of the energy since the
last time you clicked the
Reset Non-Resetting
Accumulato r P ush to
Reset
Click the Push to Reset button to reset the totals to
zero for all this meter run’s non
accumulators.
gy
Disabled to activate bi-directional support in
. Reverse direction only applies to even-
button now displays
-Resetting
3-10 Measurement Group Data Tab Revised Oct-2014
Enabled to turn off bi-directional support. The
Disabled.
button.
r
button.
Push to Reset button.
-resetting
Push to
Push to
Page 29

ControlWave Flow Measurement Applications Guide
Calling up this Menu
Field
Description
Station Totals
Forward Corrected
Flow Rate
This field displays the current corrected flow rate of
gas in the forward direction for this station.
Forward Uncorrected
Flow Rate
This field displays the current uncorrected flow rate of
gas in the forward direction for this station.
Forward Energy R ate
This field displays the current energy rate of gas in the
forward direction for this station.
Reverse Corrected
Flow Rate
This field displays the current corrected flow rate of
gas in the reverse direction for this station.
3.3.1 Forward/Reverse Summary
Click > Forward/Reverse Totals
Figure 3-4. Forward/Reverse Summary
Issued Oct-2014 Measurement Group Data Tab 3-11
Page 30

ControlWave Flow Measurement Applications Guide
Reverse Uncorrected
Flow Rate
This field displays the current uncorrected flow rate of
gas in the reverse direction for this station.
Reverse Energy Rate
This field displays the current energy rate of gas in the
reverse direction for this station.
Back to Station
Summary
Click here to return to the
page.
Forward Current Hour
Forward Corrected
Volume
This field displays the corrected volume of gas in the
forward direction for this station for the current hour.
Forward Uncorrected
Volume
This field displays the uncorrected volume of gas in
the forward
hour.
Forward Accumu late d
Energy
This field displays the accumulated energy of gas in
the forward direction for this
hour.
Reverse Current Hour
Reverse Corrected
Volume
This field displays the corrected volume of gas in the
reverse direction for this
Reverse Uncorrected
Volume
This field displays the uncorrected volume of gas in
the reverse direction for this station for the current
hour.
Reverse Accumulated
Energy
This field displays the accumulated energy of gas in
the reverse direction for this station for the current
hour.
Forward Previous Hour
Forward Corrected
Volume
This field displays the corrected volume of gas in the
forward direction for this station for the previous hour.
Forward Uncorrected
Volume
This field displays the uncorrected volume of gas in
the forward direction for this station for the previous
hour.
Forward Accumu late d
Energy
This field displays the accumulated energy of gas in
the forward direction for this station for the previous
hour.
Reverse Previous Hour
Station Summary
direction for this station for the current
station for the current
station for the current hour.
3-12 Measurement Group Data Tab Revised Oct-2014
Page 31

ControlWave Flow Measurement Applications Guide
Reverse Corrected
Volume
This field displays the corrected volume of gas in the
reverse direction for this station for the previous hour.
Reverse Uncorrected
Volume
This field displays the uncorrected volume of gas in
the reverse direction for this station for the previous
hour.
Reverse Accumulated
Energy
This field displays the accumulated energy of gas in
the reverse direction for this station for the previous
hour.
Forward Current Day
Forward Corrected
Volume
This field displays the corrected volume of gas in the
forward direction for this station for the current day.
Forward Uncorrected
Volume
This field displays the uncorrected volume of gas in
the forward direction for this station for the current day.
Forward Accumu late d
Energy
This field displays the accumulated energy of gas in
the forward direction for this station for the current day.
Reverse Current Day
Reverse Corrected
Volume
This field displays the corrected volume of gas in the
reverse direction for this station for the current day.
Reverse Uncorrected
Volume
This field displays the uncorrected volume of gas in
the reverse direction for this station for the current day.
Reverse Accumulated
Energy
This field displays the accumulated energy of gas in
the reverse direction for this station for the current day.
Forward Previous Day
Forward Corrected
Volume
This field displays the corrected volume of gas in the
forward direction for this station for the previous day.
Forward Uncorrected
Volume
This field displays the uncorrected volume of gas in
the forward direction for this station for the previous
day.
Forward Accumu late d
Energy
This field displays the accumulated energy of gas in
the forward direction for this station for the previous
day.
Reverse Previous Day
Reverse Corrected
Volume
This field displays the corrected volume of gas in the
reverse direction for this station for the previous day.
Issued Oct-2014 Measurement Group Data Tab 3-13
Page 32

ControlWave Flow Measurement Applications Guide
Reverse Uncorrected
Volume
This field displays the uncorrected volume of gas in
the reverse direction for this station for the previous
day.
Reverse Accumulated
Energy
This field displays the accumulated energy of gas in
the reverse direction for this station for the previous
day.
Forward Accumulator
Forward Corrected
Volume
This field displays a running total of the corrected
volume in the forward direction since that last time the
accumulator was reset.
Forward Uncorrected
Volume
This field displays a running total of the uncorrected
volume in the forward direction since that last time the
accumulator was reset.
Forward Accumu late d
Energy
This field displays a running total of the energy in the
forward direction since that last time the accumulator
was reset.
Reverse Accumulator
Reverse Corrected
Volume
This field displays a running total of the corrected
volume in the reverse direction since that last time the
accumulator was reset.
Reverse Uncorrected
Volume
This field displays a running total of the uncorrected
volume in the reverse direction since that last time the
accumulator was reset.
Reverse Accumulated
Energy
This field displays a running total of the energy in the
reverse direction since that last time the accumulator
was reset.
3-14 Measurement Group Data Tab Revised Oct-2014
Page 33

ControlWave Flow Measurement Applications Guide
Chapter 4 – Using the Measurement Group Config Tab
This chapter discusses various flow measurement application
configuration pages for your ControlWave EFM, GFC, GFC Plus,
Corrector, or XFC.
In This Chapter
4.1 Accessing the Config Tab ............................................................................................ 4-2
4.2 Meter Run I/O Configuration ........................................................................................ 4-3
4.3 Alarm Configuration ................................................................................................... 4-13
4.4 Analog Input/Output Configuration ............................................................................. 4-19
4.5 Auto-Adjust Configuration .......................................................................................... 4-22
4.6 Transmitter Configuration ........................................................................................... 4-26
4.7 Basic Flow Setup........................................................................................................ 4-28
4.7.1 Basic Flow Setup – AGA3TERM ............................................................ 4-28
4.7.2 Basic Flow Setup – AGA3I ..................................................................... 4-31
4.7.3 Basic Flow Setup – AGA7 ...................................................................... 4-35
4.7.4 Basic Flow Setup – Coriolis .................................................................... 4-38
4.8 Flow Equation Selection and Details ......................................................................... 4-40
4.8.1 Differential Measurement – AGA3I (1992 equation) .............................. 4-41
4.8.2 Differential Measurement – AGA3TERM (1985 equation) ..................... 4-45
4.8.3 Linear Measurement – AGA7 ................................................................. 4-48
4.8.4 Coriolis Measurement ............................................................................. 4-51
4.9 Compressibility Setup ................................................................................................ 4-53
4.10 GC Summary .............................................................................................................. 4-57
4.11 Chromatograph Component Range Setup ................................................................ 4-64
4.12 Sampler and Odorizer Output Configuration.............................................................. 4-69
4.13 Mechanical Counter Configuration ............................................................................. 4-72
4.14 Nominations ............................................................................................................... 4-73
4.15 Flow Control and Valve Control ................................................................................. 4-78
4.16 Run Switching ............................................................................................................ 4-85
Revised Oct-2014 Measurement Group Config Tab 4-1
Page 34

ControlWave Flow Measurement Applications Guide
4.1 Accessing the Config Tab
1. Within TechView, if you are in any group other than the
Measurement group, click the Measurement group icon.
2. Click the Config tab.
Config
Measurement group icon
Figure 4-1. Measurement Group Config tab
4-2 Measurement Group Config Tab Revised Oct-2014
Page 35

4.2 Meter Run I/O Configuration
The Meter Run I/O Configuration page lets you specify the flow direction
of the meter run, and assign process I/O module points or transmitter
values to the pressure and temperature process variables.
ControlWave Flow Measurement Applications Guide
Calling up this Menu
Click
Figure 4-2. Meter Run I/O Configuration page
Revised Oct-2014 Measurement Group Config Tab 4-3
Page 36

ControlWave Flow Measurement Applications Guide
Field Description
Meter Run I/O
Configuration for
Run#
Flow Direction
Direction Source
Alarm Configuration
Select the number of the meter run for which you want to
configure I/O.
Use this button to specify, for the application, the direction
that gas flows through the pipe.
The label on this button shows the current configured
direction of gas flow. When you click the button you toggle
the direction.
Click Forward to specify a reverse flow direction. The
button now displays Reverse.
Click Reverse to specify a forward flow direction. The
button now displays Forward.
Use this field to specify, for the application, the source
that determines the direction of gas flow through the pipe.
Note: The EFM does not support this field; only the
GFC/XFC.
Choices are:
DP/HSC The application uses differential
DI The application uses a discrete input
Master The application switches direction based
Click here to bring up the Alarm Configuration page. See
Section 4.3.
pressure (DP) or frequency to switch
direction.
(DI) to switch direction.
on commands from the master node’s
Station Manager application.
Differential Pressure
Source
4-4 Measurement Group Config Tab Revised Oct-2014
Select the source for differential pressure data for this
meter run. The choices are:
Analog Input Data comes from a pressure transmitter
connected to a 4 to 20mA (or 1 to 5V)
analog input (AI) on the process I/O
module. You must identify the Point ID
on the process I/O module to which the
transmitter is connected.
Wet End Data comes from an internal differential
pressure (DP) sensor. “Wet” refers to the
portion of the sensor in physical contact
with the gas.
BSAP Data comes from an external Bristol
transmitter (3808 or 3508) via an RS485 communication port.
Page 37

ControlWave Flow Measurement Applications Guide
Modbus Data comes from an external transmitter
via an RS-485 communication port. This
function supports the register list of the
Rosemount 3095 multivariable
transmitter. Note: This function
requires the ControlWave EFM with
an Expansion Communication
Module (ECOM).
Point ID
Zeros & Spans Click here to go to the Analog Input/Output Configuration
BSAP Transmitter #
Modbus Transmitter
#
Live Input Value
For the EFM: Specify the analog input (AI) point ID for
differential pressure on the process I/O module. For other
units, this shows the fixed point ID.
page. See Section 4.4.
Specify the number of the BSAP transmitter. Click on the
link to open the Transmitter Configuration page, see
Section 4.6.
Specify the number of the Modbus transmitter. Click on
the link to open the Transmitter Configuration page, see
Section 4.6.
Shows the current differential pressure reading coming
from the specified Source.
OOR Shows OOR (out-of-range) if the differential pressure live
input is out of range. Otherwise this shows NORMAL.
Input Control
(Live/Override)
Value in Use
Units
Static Pressure
The label on this button shows whether the differential
pressure used by the application is a live input reading or
an override value you specify. When you click the button
you toggle between these two cases.
Click LIVE to force the application to use the override
specified by Value in Use. The button now displays
OVERRIDE.
Click OVERRIDE to force the application to use the live
input reading for differential pressure. The button now
displays LIVE.
You can specify an override value here. To force the
override, you must set Input Control to OVERRIDE.
Shows the engineering units for differential pressure.
Source
Revised Oct-2014 Measurement Group Config Tab 4-5
Select the source for static pressure data for this meter
run. The choices are:
Page 38

ControlWave Flow Measurement Applications Guide
Analog Input Data comes from a pressure transmitter
Wet End Data comes from an internal static
BSAP Data comes from an external Bristol
Modbus Data comes from an external transmitter
Point ID
Zeros & Spans Click here to go to the Analog Input/Output Configuration
For EFM: Specify the analog input (AI) point ID for static
pressure on the process I/O module. For other units, this
shows the fixed point ID.
page. See Section 4.4.
connected to a 4 to 20mA (or 1 to 5V)
analog input (AI) on the process I/O
module. You must identify the Point ID
on the process I/O module to which the
transmitter is connected.
pressure (SP) sensor.
transmitter (3808 or 3508) via an RS485 communication port.
via an RS-485 communication port. This
function supports the register list of the
Rosemount 3095 multivariable
transmitter. Note: This function
requires the ControlWave EFM with
an Expansion Communication
Module (ECOM).
BSAP Transmitter #
Modbus Transmitter
#
Live Input Value
OOR Shows OOR (out-of-range) if the static pressure live input
Input Control
(Live/Override)
Specify the number of the BSAP transmitter. Click on the
link to open the Transmitter Configuration page, see
Section 4.6.
Specify the number of the Modbus transmitter. Click on
the link to open the Transmitter Configuration page, see
Section 4.6.
Shows the current static pressure reading coming from
the specified Source.
is out of range. Othewise this shows NORMAL.
The label on this button shows whether the static
pressure used by the application is a live input reading or
an override value you specify. When you click the button
you toggle between these two cases.
Click LIVE to force the application to use the override
specified by Value in Use. The button now displays
OVERRIDE.
Click OVERRIDE to force the application to use the live
input reading for static pressure. The button now displays
4-6 Measurement Group Config Tab Revised Oct-2014
Page 39

ControlWave Flow Measurement Applications Guide
LIVE.
Value in Use
Units
Temperature
Source
Point ID
Zeros & Spans Click here to go to the Analog Input/Output Configuration
You can specify an override value here. To force the
override, you must set Input Control to OVERRIDE.
Shows the engineering units for static pressure.
Select the source for temperature data for this meter run.
The choices are:
Analog Input Data comes from a temperature
transmitter connected to a 4 to 20mA (or
1 to 5V) analog input (AI) on the process
I/O module. You must identify the Point
ID on the process I/O module to which
the transmitter is connected.
Wet End Data comes from a temperature sensor.
BSAP Data comes from an external Bristol
transmitter (3808 or 3508) via an RS485 communication port.
Modbus Data comes from an external transmitter
via an RS-485 communication port. This
function supports the register list of the
Rosemount 3095 multivariable
transmitter. Note: This function
requires the ControlWave EFM with
an Expansion Communication
Module (ECOM).
For EFM: Specify the analog input (AI) point ID for
temperature on the process I/O module. For other units,
this shows the fixed point ID.
page. See Section 4.4.
BSAP Transmitter #
Modbus Transmitter
#
Live Input Value
Revised Oct-2014 Measurement Group Config Tab 4-7
Specify the number of the BSAP transmitter. Click on the
link to open the Transmitter Configuration page, see
Section 4.6.
Specify the number of the Modbus transmitter. Click on
the link to open the Transmitter Configuration page, see
Section 4.6.
Shows the current temperature reading coming from the
specified Source.
Page 40
ControlWave Flow Measurement Applications Guide
OOR Shows OOR (out-of-range) if the temperature live input is
out of range. Otherwise this shows NORMAL.
Input Control
(Live/Override)
Value in Use
Units
Frequency Input
Source
Units
The label on this button shows whether the temperature
used by the application is a live input reading or an
override value you specify. When you click the button you
toggle between these two cases.
Click LIVE to force the application to use the override
specified by Value in Use. The button now displays
OVERRIDE.
Click OVERRIDE to force the application to use the live
input reading for temperature. The button now displays
LIVE.
You can specify an override value here. To force the
override, you must set Input Control to OVERRIDE.
Shows the engineering units for temperature.
The label on this button shows whether the frequency
input comes from a high speed counter (pulse input) or an
auto-adjust turbine meter. When you click the button you
toggle between these two cases.
Click High Speed Counter to force the application to use
the auto-adjust turbine meter as the frequency source.
The button now displays Auto Adjust Module.
Click Auto Adjust Module to force the application to use
the high speed counter (pulse input) as the frequency
source. The button now displays High Speed Counter.
Shows the engineering units for frequency.
Value in Use
(Frequency)
Pulse Input
Point ID
Low Frequency
4-8 Measurement Group Config Tab Revised Oct-2014
Shows the frequency value in use, whether the live value
or an override value.
For EFM: Specify the point ID for the pulse input on the
process I/O module. For other units, this shows the fixed
point ID.
The label on this button shows whether the frequency
input that comes from the high speed counter (pulse
input) is high frequency or low frequency. When you click
the button you toggle between these two cases.
Click ENABLED to specify for the application that the
Page 41

Input Control
(Live/Override)
# of Samples (2-50)
ControlWave Flow Measurement Applications Guide
input is high frequency. The button now displays
DISABLED.
Click DISABLED to specify for the application that the
input is low frequency. The button now displays
ENABLED.
The label on this button shows whether the frequency
input used by the application is a live input reading or an
override value you specify. When you click the button you
toggle between these two cases.
Click LIVE to force the application to use the override
specified by Override Value (Frequency). The button
now displays OVERRIDE.
Click OVERRIDE to force the application to use the live
input reading for frequency. The button now displays
LIVE.
Specify the number of samples (from 2 to 50) used by the
pulse input.
Live Input Value
(Counts)
Deadband (sec)
Override Value
(Frequency)
LF Filter
Threshold (%)
Shows the number of counts registered by the pulse
input.
Specify the deadband (in seconds). If there are no pulses
during this time, the application assumes the pulse count
is zero.
If you want to override the live input reading for the pulse
input, enter a desired value for the frequency here and
toggle the Input Control LIVE/OVERRIDE button to
OVERRIDE.
The label on this button shows whether the low frequency
(LF) filter is active for the pulse input. When you click the
button you toggle between these two cases.
Click ENABLED to specify for the application that the low
frequency (LF) filter in inactive. The button now displays
DISABLED.
Click DISABLED to specify for the application that the low
frequency (LF) filter in active. The button now displays
ENABLED.
Shows the allowable percentage above the average time
for the pulse.
Auto-Adjust Input The auto-adjust input uses both high speed counter
inputs, one for the main rotor, the other for the sense
rotor.
Revised Oct-2014 Measurement Group Config Tab 4-9
Page 42

ControlWave Flow Measurement Applications Guide
Configuration
Main Rotor Point ID
Input Control
(Live/Override)
Live Input Value
(Frequency)
Override Value
(Frequency)
Sensor Rotor Point
ID
Input Control
(Live/Override)
Live Input Value
(Counts)
Click this link to call up the Auto-Adjust Configuration
page. See Section 4.5.
For EFM: Specify the point ID for the pulse input
connected to the turbine meter’s main rotor. For other
units, this shows the fixed point ID.
The label on this button shows whether the pulse input
used by the application for the main rotor is a live input or
an override value you specify. When you click the button
you toggle between these two cases.
Click LIVE to force the application to use the override
specified by Override Value (Frequency). The button
now displays OVERRIDE.
Click OVERRIDE to force the application to use the live
pulse input for frequency. The button now displays LIVE.
Shows the current frequency reading coming from the
main rotor.
If you want to override the live input reading for this pulse
input, enter a desired value for the frequency here and
toggle the Input Control LIVE/OVERRIDE button to
OVERRIDE.
For EFM: Specify the point ID for the pulse input
connected to the turbine meter’s sense rotor. For other
units, this shows the fixed point ID.
The label on this button shows whether the pulse input
used by the application for the sense rotor is a live input
or an override value you specify. When you click the
button you toggle between these two cases.
Click LIVE to force the application to use the override
specified by Override Value (Frequency). The button
now displays OVERRIDE.
Click OVERRIDE to force the application to use the live
pulse input for frequency. The button now displays LIVE.
Shows the current frequency reading coming from the
sense rotor.
Override Value
(Frequency)
Heating Value
4-10 Measurement Group Config Tab Revised Oct-2014
If you want to override the live input reading for this pulse
input, enter a desired value for the frequency here and
toggle the Input Control LIVE/OVERRIDE button to
OVERRIDE.
Page 43

ControlWave Flow Measurement Applications Guide
Source
AGA5 Value When Source is AGA5, shows the heating value as
AGA5 Units
Select the source for heating value data for this meter run.
The choices are:
Analog Input The heating value comes from a 4 to
20mA (or 1 to 5V) analog input (AI) on
the process I/O module. You must
identify the Point ID on the process I/O
module which provides the heating
value. Note: This option is only
available for the EFM.
AGA5 The heating value comes from AGA5
calculations performed by the
ControlWave flow computer. To use this
you must enter component mole percent
values on the Chromatograph Setup
page. See Section 4.11.
Chromatograph
The heating value comes from an
external chromatograph using Modbus
communications.
Manual Entry You enter the heating value directly in
the Manual Entry Value field.
calculated based on the AGA5 equation with component
mole percent data for the chromatograph.
Shows the engineering units for the calculated AGA5
heating value.
Value in Use
Units
Point ID If the Source of the heating value is an Analog Input,
Zeros & Spans
Value
Units
Shows the heating value currently used by the
application, which could be from any of the four sources.
Shows the engineering units for the heating value
currently in use.
specify the point ID for the analog input on the process
I/O module. Note: This field is only available for the
EFM.
Click here to go to the Analog Input/Output Configuration
page. See Section 4.4. Note: This field is only available
for the EFM.
Shows the heating value as provided by the analog input.
Note: This field is only available for the EFM.
Shows the engineering units for the heating value from
the analog input. Note: This field is only available for
the EFM.
Revised Oct-2014 Measurement Group Config Tab 4-11
Page 44

ControlWave Flow Measurement Applications Guide
Chromatograph
Value When Source is Chromatograph, shows the heating
value as provided by the chromatograph.
Units
Manual Entry
Value When Source is Manual Entry, enter the known heating
Units
Specify the engineering units for the heating value from
the chromatograph.
value in this field.
Specify the engineering units for the heating value here.
4-12 Measurement Group Config Tab Revised Oct-2014
Page 45

4.3 Alarm Configuration
The Alarm Configuration page lets you configure the alarm limits and
deadbands for the pressure, temperature, frequency, and flow rate
variables used in this meter run.
ControlWave Flow Measurement Applications Guide
Calling up this Menu
Click > Alarm Configuration
Figure 4-3. Alarm Configuration page
Field Description
Alarm Configuration for
Run#
Differential Pressure
Differential Pressure
Enable/Disable
Revised Oct-2014 Measurement Group Config Tab 4-13
Select the meter run number for which you want to
configure alarms.
The label on this button shows whether alarming is
enabled for the differential pressure variable. When
you click the button you toggle between these two
cases.
Click Enabled to disable alarming for the differential
Page 46

ControlWave Flow Measurement Applications Guide
Differential Pressure
Units
pressure variable. The button now displays Disabled.
Click Disabled to enable alarming for the differential
pressure variable. The button now displays Enabled.
Shows the engineering units for the differential
pressure variable.
Differential Pressure
Current Value
Differential Pressure
HIHI Alarm Limit
Differential Pressure HI
Alarm Limit
Differential Pressure
High Deadband
Differential Pressure
Low Deadband
Differential Pressure Lo
Alarm Limit
Shows the current value of the differential pressure
variable.
When the differential pressure variable rises above this
limit, it triggers a High-High alarm state.
When the differential pressure variable rises above this
limit, it triggers a High alarm state.
This deadband is a value that, when subtracted from
the high and high-high alarm limits, defines a range
within which the alarm state remains active, even
though the value falls below the limit. The purpose of
the deadband is to avoid fluctuations in and out of the
alarm state by minor changes in the variable.
This deadband is a value that, when added to the low
and low-low alarm limits, defines a range within which
the alarm state remains active, even though the value
rises above the limit. The purpose of the deadband is
to avoid fluctuations in and out of the alarm state by
minor changes in the variable.
When the differential pressure variable falls below this
limit, it triggers a Low alarm state.
Differential Pressure
LoLo Alarm Limit
Static Pressure
Static Pressure
Enable/Disable
Static Pressure Units
4-14 Measurement Group Config Tab Revised Oct-2014
When the differential pressure variable falls below this
limit, it triggers a Low-Low alarm state.
The label on this button shows whether alarming is
enabled for the static pressure variable. When you
click the button you toggle between these two cases.
Click Enabled to disable alarming for the static
pressure variable. The button now displays Disabled.
Click Disabled to enable alarming for the static
pressure variable. The button now displays Enabled.
Shows the engineering units for the static pressure
variable.
Page 47

ControlWave Flow Measurement Applications Guide
Static Pressure Current
Value
Static Pressure HIHI
Alarm Limit
Static Pressure HI
Alarm Limit
Static Pressure High
Deadband
Static Pressure Low
Deadband
Static Pressure Lo
Alarm Limit
Shows the current value of the static pressure variable.
When the static pressure variable rises above this limit,
it triggers a High-High alarm state.
When the static pressure variable rises above this limit,
it triggers a High alarm state.
This deadband is a value that, when subtracted from
the high and high-high alarm limits, defines a range
within which the alarm state remains active, even
though the value falls below the limit. The purpose of
the deadband is to avoid fluctuations in and out of the
alarm state by minor changes in the variable.
This deadband is a value that, when added to the low
and low-low alarm limits, defines a range within which
the alarm state remains active, even though the value
rises above the limit. The purpose of the deadband is
to avoid fluctuations in and out of the alarm state by
minor changes in the variable.
When the static pressure variable falls below this limit,
it triggers a Low alarm state.
Static Pressure LoLo
Alarm Limit
Temperature
Temperature
Enable/Disable
Temperature Units
Temperature Current
Value
Temperature HIHI
Alarm Limit
When the static pressure variable falls below this limit,
it triggers a Low-Low alarm state.
The label on this button shows whether alarming is
enabled for the temperature variable. When you click
the button you toggle between these two cases.
Click Enabled to disable alarming for the temperature
variable. The button now displays Disabled.
Click Disabled to enable alarming for the temperature
variable. The button now displays Enabled.
Shows the engineering units for the temperature
variable.
Shows the current value of the temperature variable.
When the temperature variable rises above this limit, it
triggers a High-High alarm state.
Temperature HI Alarm
Limit
Revised Oct-2014 Measurement Group Config Tab 4-15
When the temperature variable rises above this limit, it
triggers a High alarm state.
Page 48

ControlWave Flow Measurement Applications Guide
Temperature High
Deadband
Temperature Low
Deadband
Temperature Lo Alarm
Limit
Temperature LoLo
Alarm Limit
Frequency
Frequency
Enable/Disable
Frequency Units
This deadband is a value that, when subtracted from
the high and high-high alarm limits, defines a range
within which the alarm state remains active, even
though the value falls below the limit. The purpose of
the deadband is to avoid fluctuations in and out of the
alarm state by minor changes in the variable.
This deadband is a value that, when added to the low
and low-low alarm limits, defines a range within which
the alarm state remains active, even though the value
rises above the limit. The purpose of the deadband is
to avoid fluctuations in and out of the alarm state by
minor changes in the variable.
When the temperature variable falls below this limit, it
triggers a Low alarm state.
When the temperature variable falls below this limit, it
triggers a Low-Low alarm state.
The label on this button shows whether alarming is
enabled for the frequency variable. When you click the
button you toggle between these two cases.
Click Enabled to disable alarming for the frequency
variable. The button now displays Disabled.
Click Disabled to enable alarming for the frequency
variable. The button now displays Enabled.
Shows the engineering units for the frequency variable.
Frequency Current
Value
Frequency HIHI Alarm
Limit
Frequency HI Alarm
Limit
Frequency High
Deadband
Frequency Low
Deadband
4-16 Measurement Group Config Tab Revised Oct-2014
Shows the current value of the frequency variable.
When the frequency variable rises above this limit, it
triggers a High-High alarm state.
When the frequency variable rises above this limit, it
triggers a High alarm state.
This deadband is a value that, when subtracted from
the high and high-high alarm limits, defines a range
within which the alarm state remains active, even
though the value falls below the limit. The purpose of
the deadband is to avoid fluctuations in and out of the
alarm state by minor changes in the variable.
This deadband is a value that, when added to the low
and low-low alarm limits, defines a range within which
the alarm state remains active, even though the value
rises above the limit. The purpose of the deadband is
to avoid fluctuations in and out of the alarm state by
Page 49

ControlWave Flow Measurement Applications Guide
minor changes in the variable.
Frequency Lo Alarm
Limit
Frequency LoLo Alarm
Limit
Flow Rate
Flow Rate
Enable/Disable
Flow Rate Units
Flow Rate Current
Value
When the frequency variable falls below this limit, it
triggers a Low alarm state.
When the frequency variable falls below this limit, it
triggers a Low-Low alarm state.
The label on this button shows whether alarming is
enabled for the flow rate variable. When you click the
button you toggle between these two cases.
Click Enabled to disable alarming for the flow rate
variable. The button now displays Disabled.
Click Disabled to enable alarming for the flow rate
variable. The button now displays Enabled.
Shows the engineering units for the flow rate variable.
Shows the current value of the flow rate variable.
Flow Rate HIHI Alarm
Limit
Flow Rate HI Alarm
Limit
Flow Rate High
Deadband
Flow Rate Low
Deadband
Flow Rate Lo Alarm
Limit
Flow Rate LoLo Alarm
Limit
When the flow rate variable rises above this limit, it
triggers a High-High alarm state.
When the flow rate variable rises above this limit, it
triggers a High alarm state.
This deadband is a value that, when subtracted from
the high and high-high alarm limits, defines a range
within which the alarm state remains active, even
though the value falls below the limit. The purpose of
the deadband is to avoid fluctuations in and out of the
alarm state by minor changes in the variable.
This deadband is a value that, when added to the low
and low-low alarm limits, defines a range within which
the alarm state remains active, even though the value
rises above the limit. The purpose of the deadband is
to avoid fluctuations in and out of the alarm state by
minor changes in the variable.
When the flow rate variable falls below this limit, it
triggers a Low alarm state.
When the flow rate variable falls below this limit, it
triggers a Low-Low alarm state.
Revised Oct-2014 Measurement Group Config Tab 4-17
Page 50

ControlWave Flow Measurement Applications Guide
Battery Alarm
Configuration
DO Point
Battery HIHI Alarm
Limit Setting
Battery HI Alarm Limit
Setting
Battery High Deadband
Setting
Battery Low Deadband
Setting
Battery Lo Alarm Limit
Setting
Select the discrete output (DO) that will serve as a
battery voltage alarm.
When the battery voltage rises above this limit, it
triggers a High-High alarm state.
When the battery voltage rises above this limit, it
triggers a High alarm state.
This deadband is a value that, when subtracted from
the high and high-high alarm limits, defines a range
within which the alarm state remains active, even
though the value falls below the limit. The purpose of
the deadband is to avoid fluctuations in and out of the
alarm state by minor changes in the variable.
This deadband is a value that, when added to the low
and low-low alarm limits, defines a range within which
the alarm state remains active, even though the value
rises above the limit. The purpose of the deadband is
to avoid fluctuations in and out of the alarm state by
minor changes in the variable.
When the battery voltage falls below this limit, it
triggers a Low alarm state.
Battery LoLo Alarm
Limit Setting
When the battery voltage falls below this limit, it
triggers a Low-Low alarm state.
4-18 Measurement Group Config Tab Revised Oct-2014
Page 51

ControlWave Flow Measurement Applications Guide
4.4 Analog Input/Output Configuration
The Analog Input/Output Configuration page allows you to configure
zeros and spans for analog I/O variables.
Calling up this Menu
(3 ways)
Click > Zeros & Spans
Click > Zeros & Spans
Click > AO Zero & Span
Figure 4-4. Analog Input/Output Configuration
Field Description
Input x
The number of input variables varies depending upon
the type of ControlWave device. ControlWave EFM
can have up to four inputs, other units can have three.
Live Value
OOR Alarm
Zero
Span Enter the value that, when added to the Zero value,
Revised Oct-2014 Measurement Group Config Tab 4-19
The current value of the analog input.
Shows ON when I/O hardware indicates this analog
input is out-of-range (OOR). Otherwise shows OFF.
Enter the value that this analog input process variable
should read when the AI field input is 4mA.
represents what the process variable should display
when the AI field input is 20mA.
Page 52

ControlWave Flow Measurement Applications Guide
Units
OOR (Software) Alarm
% Below Zero/Above
Span
Output
Variable
Live Value
The engineering units for this analog input.
If you enter a positive value here, it specifies the
percentage below zero or above span which
constitutes an out-of-range condition for the analog
input.
If you enter zero here, it specifies that the hardware
detects the out-of-range (OOR) condition, instead of
using a value you specify.
Choose which variable you want to assign to the
analog output (AO).
The current value of the analog output.
Zero
Span Enter the value that, when added to the Zero value,
Integrated Wet End
Inputs
Damping
Raw Value
Alarm Shows ON if this variable is in an alarm state.
Enter the value that this analog output process variable
should read when the AO field output is 4mA.
represents what the process variable should display
when the AO field output is 20mA.
These are the ControlWave’s integrated sensors for
differential pressure, static pressure, and temperature.
The label on this button shows the current state of the
damping function for the differential pressure input.
When you click the button you toggle the state.
Click Disabled to start damping. The button now
displays Enabled.
Click Enabled to turn off damping. The button now
displays Disabled.
Shows the value from the sensor without any damping
applied.
4-20 Measurement Group Config Tab Revised Oct-2014
Page 53

ControlWave Flow Measurement Applications Guide
Value in Use
Units
Digital Inputs These fields are not available for the ControlWave
Digital Input x
Digital Outputs
Digital Output x
Shows the value used in gas calculations. This may
differ from the raw value either because it reflects
damping of the input or an override is in effect.
The engineering units for this analog input.
EFM.
These fields show the current value of the associated
discrete input.
These fields are not available for the ControlWave
EFM.
These fields show the current value of the associated
discrete output.
Revised Oct-2014 Measurement Group Config Tab 4-21
Page 54

ControlWave Flow Measurement Applications Guide
4.5 Auto-Adjust Configuration
The Auto-Adjust Configuration page lets you enter configuration data for
using the application with an auto-adjust turbine meter.
Calling up this Menu
Click > Auto-Adjust Input
Configuration
Figure 4-5. Auto-Adjust Configuration page
Field Description
Auto-Adjust
Configuration for Run#
4-22 Measurement Group Config Tab Revised Oct-2014
Select the meter run number for which you want to
configure an auto-adjust turbine meter.
Page 55

ControlWave Flow Measurement Applications Guide
Inputs
Main Rotor Accum.
Count
Sense Rotor Accum.
Count
Main Rotor Override
Sense Rotor Override
Status There are four different status values.
Status 1
Shows the current accumulated count for the main
rotor of the auto-adjust turbine meter. The main rotor
is the upstream rotor and has a greater
blade angle to the flow of gas.
Shows the current accumulated count for the sense
rotor of the auto-adjust turbine meter. The sense rotor
is the downstream rotor and has a shallower blade
angle to the flow of gas.
Specify the frequency the main rotor of the auto-adjust
turbine meter should use when override is active.
Specify the frequency the sensor rotor of the autoadjust turbine meter should use when override is
active.
This status is for the AUTOADJUST function block
within the application.
Value Explanation
0 Successful execution
Status 2
Status 3
-4 Invalid data type in AUTOADJUST function
block
-6 Required input not configured for
AUTOADJUST function block
-17 Required input data not valid for
AUTOADJUST function block
-16001 No memory available
-16002 LIST for AUTOADJUST function block is
missing required parameters
-16003 Non-steady flow
Value Explanation
0 Successful execution
-16004 Delta A is outside normal limits
-16005 Delta A is outside abnormal limits
Value Explanation
0 Successful execution
-16005 Delta A is outside abnormal limits
Stat us 4 Value Explanation
0 Successful execution
-16006 No flow or loss of main and sensor pulses
Revised Oct-2014 Measurement Group Config Tab 4-23
Page 56

ControlWave Flow Measurement Applications Guide
Calibration Data
-16007 Leakage or resonant no net flow (with ABN=
-16005)
-16008 No main rotor pulses or leakage or resonant
no net flow
-16009 No sensor rotor pulse
Blade-Tip Sensor
Factor
Main Rotor Factor
Sensor Rotor Factor
Average Relative
Adjustment
Configuration Data
Abnormal delta-Abar
high limit in percent
Abnormal delta-Abar
low limit in percent
Normal delta-Abar high
limit in percent
Normal delta-Abar low
limit in percent
The blade tip sensor factor (BTSF) should be 1.0 for
slot sensors.
The main rotor is the upstream rotor and has a greater
blade angle to the flow of gas.
The sense rotor is the downstream rotor and has a
shallower blade angle to the flow of gas.
The expected deviation (average relative adjustment)
between main and sense rotors.
This is the high alarm limit for an abnormal deviation
between the main and sense rotors.
This is the low alarm limit for an abnormal deviation
between the main and sense rotors.
This is the high alarm limit for a normal deviation
between the main and sense rotors.
This is the low alarm limit for a normal deviation
between the main and sense rotors.
Adjusted and unadjusted flow total
scaling factor
Mechanical output
factor
Calculated Factors
Adjusted volume rate
in CF per second
Adjusted Main rotor
rate in CF per second
Adjusted Sensor rotor
rate in CF per second
4-24 Measurement Group Config Tab Revised Oct-2014
Specify a scaling factor which the software applies to
the adjusted and un-adjusted flow totals to present the
flow in the desired engineering units.
Used to determine unadjusted volume totals with only
main rotor pulses. Set to 0 if these are not needed.
Shows the adjusted volume rate in cubic feet (CF) per
second.
Shows the adjusted main rotor rate in cubic feet (CF)
per second.
Shows the adjusted sensor rotor rate in cubic feet (CF)
per second.
Page 57

ControlWave Flow Measurement Applications Guide
A
Main rotor adjusted
volume
Sensor rotor adjusted
volume
Internal 60 second
timer
Internal 512 second
timer
Internal count of Main
rotor pulses
Main rotor frequency in
pulses per second
Sensor rotor frequency
in pulses per second
Shows the main rotor adjusted volume.
Shows the sensor rotor adjusted volume.
This count increments only when main rotor frequency
is less than 3 times the blade tip sensor factor (BTSF).
When the Main rotor frequency is below 48 Hz (i.e.
more than 512 seconds to accumulate 25,000 counts)
this parameter reaches 512 and rolls over, which
forces a check of the sensor rotor frequency, and
clears the Internal count of Main rotor pulses.
t 25,000 counts this rolls over which forces a check of
the Sensor rotor frequency and clears the internal 512
second timer.
Shows the frequency of the main rotor in pulses per
second.
Shows the frequency of the sensor rotor in pulses per
second.
Delta time between
function block
executions
Calculated Outputs
Adjusted Flow rate in
CF per hour
Unadjusted Main rotor
rate in CF per second
Unadjusted Sensor
rotor rate in CF per
second
Calculated deviation of
Abar from calibration in
percent
Adjusted volume
change since the last
function block
execution
Total adjusted volume
Shows the time between executions of the
AUTOADJUST function block in the ControlWave
project.
Shows the adjusted flow rate in cubic feet (CF) per
hour.
Shows the unadjusted main rotor rate in cubic feet
(CF) per second.
Shows the unadjusted sensor rotor rate in cubic feet
(CF) per second.
The application calculates how much the meter has
changed from factory calibration.
Shows the change in the adjusted volume since the
last execution of the AUTOADJUST function block in
the ControlWave project.
Shows the total adjusted volume.
Total unadjusted
volume
Shows the total unadjusted volume.
Revised Oct-2014 Measurement Group Config Tab 4-25
Page 58

ControlWave Flow Measurement Applications Guide
4.6 Transmitter Configuration
The Transmitter Configuration page lets you specify which transmitters
provide process variable inputs to the application.
Calling up this Menu
Click > Transmitter
Figure 4-6. Transmitter Configuration page (only transmitters 1 and 2 visible)
Field Description
Transmitter x
Status
BSAP
Enabled/Disabled
Shows the transmitter type which could be:
DP/PT/TEMP, PT/TEMP, or TEMP. Shows NOT
CONFIGURED if this transmitter has not been
configured. You can view data for up to four
transmitters on this page.
Shows a status code value from the transmitter. See
the ControlWave Designer online help for the
CUSTOM function block for information on possible
status values.
The label on this button shows whether BSAP
communication is enabled for this transmitter variable.
When you click the button you toggle between these
two cases.
Click Enabled to disable alarming for the temperature
variable. The button now displays Disabled.
4-26 Measurement Group Config Tab Revised Oct-2014
Page 59

4088B/3808
BSAP Address
ControlWave Flow Measurement Applications Guide
Click Disabled to enable alarming for the temperature
variable. The button now displays Enabled.
The label on this button shows that the type of device
(3808 or 4088B) for which the application is
configured. Click the button to toggle between these
choices.
Click 4088B to configure the application to
communicate with a Bristol 3808. The button now
displays 3808.
Click 3808 to configure the application to communicate
with a Rosemount 4088B. The button now displays
4088B.
Enter the BSAP local address assigned to this
transmitter.
Value From Transmitter
Units Shows the engineering units for the associated Value
Modbus Port
Modbus Address
Transmitters can display data from up to three
variables. Typically these are differential pressure,
static pressure, and temperature.
From Transmitter.
For EFM: Enter the number of the port used for
Modbus communication. For other units shows the
fixed port.
Enter the Modbus address for this transmitter.
Revised Oct-2014 Measurement Group Config Tab 4-27
Page 60

ControlWave Flow Measurement Applications Guide
4.7 Basic Flow Setup
The Basic Flow Setup pages let you modify the most important parameters
for the flow measurement equation, and view various current values.
Note: This menu varies in appearance depending upon the flow equation
you select. If you have not previously selected the flow
measurement equation, this button will automatically re-direct you
to the flow measurement selection and detail pages. See Section
4.8.
Calling up this Menu
Click
4.7.1 Basic Flow Setup – AGA3TERM
There are two different AGA3 equations supported, the AGA3I equation
from the 1992 AGA report, and the AGA3TERM equation from the 1985
AGA report.
Figure 4-7. Basic Flow Setup – AGA3TERM
Notes:
If you want to choose the AGA3I calculation, instead of the
AGA3TERM calculation, click the Click Here to Select AGA3I
(1992) button.
4-28 Measurement Group Config Tab Revised Oct-2014
Page 61

ControlWave Flow Measurement Applications Guide
If you chose differential measurement by mistake, and need to choose
either linear measurement or coriolis measurement instead, click the
Reset Meter Run’s Measurement Type button on the Meter Run
Overview page. See Section 3.2.
Field Description
Basic Flow For Run#
Inputs
Select the meter run number for which you want to
configure AGA3 term measurement.
Pressure Tap
Low Flow Cutoff
Orifice Diam.
Pipe Diam.
Orifice Const. K
Adjust Press.
Station Elevation
Local Press.
Click this button to change the specified location of the
pressure tap. The pressure tap can be either upstream
or downstream of the meter.
Enter the low flow cutoff here. This the minimum
value for differential pressure where the application
performs measurements. If the differential pressure
drops below this value, the measured flow goes to
zero. Select the units for the low flow cutoff.
Enter the orifice bore diameter here and select the
proper units.
Enter the inside diameter of the pipe here and select
the proper units.
Specify the combined orifice constant K. This is
typically the value for orifice thermal expansion unless
other corrections are required.
Specify the average barometric pressure and select
the proper units.
Specify the station elevation above sea level and
choose the appropriate units. The default units are
feet.
Show the local atmospheric pressure calculated based
on inputs including the station elevation.
Use Adjust or Local
Press.
Revised Oct-2014 Measurement Group Config Tab 4-29
The label on this button shows whether you use the
calculated local pressure or the adjusted pressure.
When you click the button you toggle between these
two cases.
Click Adjust to specify that the application should use
local pressure. The button now displays Local.
Click Local to specify that the application should use
adjusted pressure. The button now displays Adjust.
Page 62

ControlWave Flow Measurement Applications Guide
Base Temp.
Base Press.
Contract Hour
Status
Flow
Diff. Press
Static Press.
Temperature
Specify the required (contract) base temperature of the
flowing gas and the associated engineering units.
Specify the base or contract pressure of the gas and
the associated units.
Specify the hour (0 to 23) which marks the beginning
of the “gas day.”
Shows the current calculated flow reading.
Shows the differential pressure across the orifice plate.
Shows the upstream or downstream static pressure.
Shows the temperature of the flowing gas.
Low Flow Cut Off Shows Cutoff if the flow is too low and so the low flow
cut off is currently active. Shows Flowing when cutoff
is not active.
Selected
Compressibility
Calculation
Click to Select
NX19/AGA8
Detail/AGA8 Gross
Stream x Shows Raw/GC if there are no errors. Shows Fixed if
BTU
Shows the currently selected type of compressibility
calculation.
Click the NX-19 button to select NX-19 as the
compressibility calculation.
Click the AGA8 Detail button to select AGA8 Detail as
the compressibility calculation.
Click the AGA8 Gross button to select AGA8 Gross
as the compressibility calculation.
the calculation is using fixed values for components of
the gas stream, typically because of a chromatograph
failure.
Shows the current British Thermal Units (BTU) for this
gas stream.
Gravity
Shows the gravity value for this gas stream.
4-30 Measurement Group Config Tab Revised Oct-2014
Page 63

4.7.2 Basic Flow Setup – AGA3I
There are two different AGA3 equations supported, the AGA3I equation
from the 1992 AGA report, and the AGA3TERM equation from the 1985
AGA report.
ControlWave Flow Measurement Applications Guide
Figure 4-8. Basic Flow Setup – AGA3I
Notes:
If you want to choose the AGA3TERM calculation, instead of the
AGA3I calculation, click the Click Here to Select AGA3TERM
(1985) button.
If you chose differential measurement by mistake, and need to choose
either linear measurement or coriolis measurement instead, you can
reset the equation type to undefined, so you can re-select it. To do this,
click the Reset Meter Run’s Measurement Type button on the Meter
Run Overview page. See Section 3.2.
Revised Oct-2014 Measurement Group Config Tab 4-31
Page 64

ControlWave Flow Measurement Applications Guide
Field Description
Basic Flow For Run#
Inputs
Select the meter run number for which you want to
configure AGA3 iterative measurement.
Pressure Tap
Low Flow Cutoff
Orifice Diam.
Pipe Diam.
Orifice Material
Pipe Material
Isentropic Exponent
Atmospheric Press.
Click this button to change the specified location of the
pressure tap. The pressure tap can be either upstream
or downstream of the meter.
Enter the low flow cutoff here. This the minimum
value for differential pressure where the application
performs measurements. If the differential pressure
drops below this value, the measured flow goes to
zero. Select the units for the low flow cutoff.
Enter the orifice bore diameter here and select the
proper units.
Enter the inside diameter of the pipe here and select
the proper units.
The label on this button shows the type of steel used
for the orifice. When you click the button you toggle
between these two cases.
Click CARBON to specify that stainless steel is the
orifice material. The button now displays STNLESS.
Click STNLESS to specify that carbon steel is the
orifice material. The button now displays CARBON.
The label on this button shows the type of steel used
for the pipe. When you click the button you toggle
between these two cases.
Click CARBON to specify that stainless steel is the
pipe material. The button now displays STNLESS.
Click STNLESS to specify that carbon steel is the pipe
material. The button now displays CARBON.
Specify the fluid Isentropic exponent. This value is
used in the calculation of the expansion factor, Y.
Typically you should enter 1.3 here, which is the value
given in the 1992 American Gas Association (AGA-3)
Report.
Specify the atmospheric pressure value that the
application should use for calculations.
4-32 Measurement Group Config Tab Revised Oct-2014
Page 65

ControlWave Flow Measurement Applications Guide
Station Elevation
Local Press.
Use Adjust or Local
Press.
Base Temp.
Base Press.
Specify the station elevation above sea level and
choose the appropriate units. The default units are
feet.
Show the local atmospheric pressure calculated based
on inputs including the station elevation.
The label on this button shows whether you use the
calculated local pressure or the adjusted pressure.
When you click the button you toggle between these
two cases.
Click Adjust to specify that the application should use
local pressure. The button now displays Local.
Click Local to specify that the application should use
adjusted pressure. The button now displays Adjust.
Specify the base temperature of the gas.
Specify the base pressure. This is used to calculate
the pressure base factor
Viscosity
Contract Hour
Status
Flow
Diff. Press
Static Press.
Temperature
Low Flow Cut Off Shows Cutoff if the flow is too low and so the low flow
Selected
Compressibility
Calculation
Specify the dynamic viscosity of the gas at flowing
conditions. Viscosity is used to calculate the Reynolds
number.
Specify the hour (0 to 23) which marks the beginning
of the “gas day.”
Shows the current calculated flow reading.
Shows the differential pressure across the orifice plate.
Shows the upstream or downstream static pressure.
Shows the temperature of the flowing gas.
cut off is currently active. Shows Flowing if flow is
sufficient that the low flow cut off is not active.
Shows the currently selected type of compressibility
calculation.
Revised Oct-2014 Measurement Group Config Tab 4-33
Page 66

ControlWave Flow Measurement Applications Guide
Click to Select
NX19/AGA8
Detail/AGA8 Gross
Stream x Shows Raw/GC if there are no errors. Shows Fixed if
BTU
Gravity
Click the NX-19 button to select NX-19 as the
compressibility calculation.
Click the AGA8 Detail button to select AGA8 Detail as
the compressibility calculation.
Click the AGA8 Gross button to select AGA8 Gross
as the compressibility calculation.
the calculation is using fixed values for components of
the gas stream, typically because of a chromatograph
failure.
Shows the current British Thermal Units (BTU) for this
gas stream.
Shows the gravity value for this gas stream.
4-34 Measurement Group Config Tab Revised Oct-2014
Page 67

4.7.3 Basic Flow Setup – AGA7
The AGA7 Basic Flow Setup page lets you configure linear flow
measurement for this meter run.
ControlWave Flow Measurement Applications Guide
Figure 4-9. Basic Flow Setup – AGA7
Note: If you chose linear measurement by mistake, and need to choose
either differential measurement or coriolis measurement instead,
you can reset the equation type to undefined, so you can re-select
it. To do this, click the Reset Meter Run’s Measurement Type
button on the Meter Run Overview page. See Section 3.2.
Field Description
Basic Flow Setup for
Run#
Inputs
Flow Density
Revised Oct-2014 Measurement Group Config Tab 4-35
Select the meter run number for which you want to
configure AGA7 linear measurement.
Specify the density of the flowing gas as measured by
a densitometer.
Page 68

ControlWave Flow Measurement Applications Guide
Base Density
K Factor Units
K Factor
Low Flow Cutoff
Adjust Press.
Station Elevation
Local Press.
Use Adjust or Local
Press.
Base Temp.
Specify the contract base density of the gas as
measured by a densitometer.
Specify the desired units for the output.
Specify a scale factor to adjust the output to your
desired units.
The low flow cutoff is the minimum frequency that will
still be considered valid for flow measurement. If the
frequency of the inputs from the high speed counter fall
below this number, volume will not be measured.
Enter the average barometric pressure here.
Specify the station elevation above sea level and
choose the appropriate units. The default units are
feet.
Show the local atmospheric pressure calculated based
on inputs including the station elevation.
The label on this button shows whether you use the
calculated local pressure or the adjusted pressure.
When you click the button you toggle between these
two cases.
Click Adjust to specify that the application should use
local pressure. The button now displays Local.
Click Local to specify that the application should use
adjusted pressure. The button now displays Adjust.
Specify the contract base temperature and associated
units.
Base Press.
Meter Factor
Contract Hour
Status
Flow
Frequency
4-36 Measurement Group Config Tab Revised Oct-2014
Specify the contract base pressure and associated
units.
Specify an optional meter calibration factor here. The
AGA7 calculation uses this factor to correct for known
variations in the measuring equipment.
Specify the hour (0 to 23) which marks the beginning
of the “gas day.”
Shows the calculated flow rate at base conditions.
Shows the live frequency input.
Page 69

ControlWave Flow Measurement Applications Guide
Static Press.
Temperature
Low Flow Cut Off Shows Cutoff if the flow is too low and so the low flow
Selected
Compressibility
Calculation
Click to Select
NX19/AGA8
Detail/AGA8 Gross
Stream x Shows Raw/GC if there are no errors. Shows Fixed if
BTU
Shows the static gauge pressure of the flowing gas.
Shows the temperature of the flowing gas.
cut off is currently active. Shows Flowing if flow is
sufficient that the low flow cut off is not active.
Shows the currently selected type of compressibility
calculation.
Click the NX-19 button to select NX-19 as the
compressibility calculation.
Click the AGA8 Detail button to select AGA8 Detail as
the compressibility calculation.
Click the AGA8 Gross button to select AGA8 Gross
as the compressibility calculation.
the calculation is using fixed values for components of
the gas stream, typically because of a chromatograph
failure.
Shows the current British Thermal Units (BTU) for this
gas stream.
Gravity
Shows the gravity value for this gas stream.
Revised Oct-2014 Measurement Group Config Tab 4-37
Page 70

ControlWave Flow Measurement Applications Guide
4.7.4 Basic Flow Setup – Coriolis
The Basic Flow Setup for Coriolis page lets you configure gas flow
measurement using a coriolis meter.
Figure 4-10. Basic Flow Setup – Coriolis
Note: If you chose coriolis measurement by mistake, and need to choose
either differential measurement or linear measurement instead, you
can reset the equation type to undefined, so you can re-select it. To
do this, click the Reset Meter Run’s Measurement Type button
on the Meter Run Overview page. See Section 3.2.
Field Description
Basic Flow Setup for
Run#
Inputs
Air Density
K Factor Units
Select the meter run number for which you want to
configure coriolis measurement.
Shows the density of air constant.
Select the engineering units for the coriolis meter.
K Factor
4-38 Measurement Group Config Tab Revised Oct-2014
Specify the correction factor (K) for the coriolis meter.
This information is available from the coriolis meter
data plate.
Page 71

ControlWave Flow Measurement Applications Guide
Contract Hour
Status
Flow
Frequency
Static Press.
Temperature
Stream x Shows Raw/GC if there are no errors. Shows Fixed if
BTU
Specify the hour (0 to 23) which marks the beginning
of the “gas day.”
Shows the calculated flow rate.
Shows the current frequency from the high speed
counter input connected to the coriolis meter.
Shows the static pressure of the flowing gas.
Shows the temperature of the flowing gas.
the calculation is using fixed values for components of
the gas stream, typically because of a chromatograph
failure.
Shows the current British Thermal Units (BTU) for this
gas stream.
Gravity
Shows the gravity value for this gas stream.
Revised Oct-2014 Measurement Group Config Tab 4-39
Page 72

ControlWave Flow Measurement Applications Guide
4.8 Flow Equation Selection and Details
For each meter run, you must select the type of flow measurement
equation you want to use.
Calling up this Menu
Selecting the Type of
Measurement
Click
For a particular meter run, you have a choice of one of three possible
types of measurement: Click the button that corresponds to the type of
meter you use on this meter run.
Differential Measurement - Select this if you have an orifice type
meter for this meter run. This uses either the 1992 AGA3 equation
(see Section 4.8.1) or the 1985 AGA3 equation (see Section 4.8.2).
Linear Measurement - Select this if you have a linear type meter
(ultrasonic, turbine, auto-adjust, or positive displacement) for this
meter run. This uses the AGA7 equation (see Section 4.8.3).
Coriolis Measurement - Select this if you have a coriolis meter for
this meter run (see Section 4.8.4).
Figure 4-11. Selecting the Type of Measurement
Notes:
Once you select the equation type, these buttons subsequently open up
the equation configuration page for the chosen equation.
If you inadvertently choose the wrong equation type, you can reset the
equation type to undefined, so you can re-select it. To do this, click the
Reset Meter Run’s Measurement Type button on the Meter Run
Overview page. See Section 3.2.
4-40 Measurement Group Config Tab Revised Oct-2014
Page 73

ControlWave Flow Measurement Applications Guide
4.8.1 Differential Measurement – AGA3I (1992 equation)
There are two different AGA3 equations supported, the AGA3I equation
from the 1992 AGA report, and the AGA3TERM equation from the 1985
AGA report.
Figure 4-12. Differential Measurement – AGA3I page
Notes:
If you want to choose the AGA3TERM calculation, instead of the
AGA3I calculation, click the Click Here to Select AGA3TERM
(1985) button.
If you chose differential measurement by mistake, and need to choose
either linear measurement or coriolis measurement instead, you can
reset the equation type to undefined, so you can re-select it. To do this,
click the Reset Meter Run’s Measurement Type button on the Meter
Run Overview page. See Section 3.2.
Field Description
1992 AGA3 Equation
Configuration for Run#
Inputs
Select the meter run number for which you want to
configure AGA3 iterative measurement.
Revised Oct-2014 Measurement Group Config Tab 4-41
Page 74

ControlWave Flow Measurement Applications Guide
Pressure Tap
Low Flow Cutoff
Orifice Diam.
Pipe Diam.
Orifice Material
Pipe Material
Isentropic Exponent
Adjust Press.
Station Elevation
Local Press.
Click this button to change the specified location of the
pressure tap. The pressure tap can be either upstream
or downstream of the meter.
Enter the low flow cutoff here. This the minimum
value for differential pressure where the application
performs measurements. If the differential pressure
drops below this value, the measured flow goes to
zero. Select the units for the low flow cutoff.
Enter the orifice bore diameter here and select the
proper units.
Enter the inside diameter of the pipe here and select
the proper units.
The label on this button shows the type of steel used
for the orifice. When you click the button you toggle
between these two cases.
Click Carbon to specify that stainless steel is the
orifice material. The button now displays Stainless.
Click Stainless to specify that carbon steel is the
orifice material. The button now displays Carbon.
The label on this button shows the type of steel used
for the pipe. When you click the button you toggle
between these two cases.
Click Carbon to specify that stainless steel is the pipe
material. The button now displays Stainless.
Click Stainless to specify that carbon steel is the pipe
material. The button now displays Carbon.
Specify the fluid Isentropic exponent. This value is
used in the calculation of the expansion factor, Y.
Typically you should enter 1.3 here, which is the value
given in the 1992 American Gas Association (AGA-3)
Report.
Specify the site barometric pressure and select the
proper units. This value is added to the value shown
for the Static Press. to obtain absolute pressure.
Specify the station elevation above sea level and
choose the appropriate units. The default units are
feet.
Show the local atmospheric pressure calculated based
on inputs including the station elevation.
4-42 Measurement Group Config Tab Revised Oct-2014
Page 75

ControlWave Flow Measurement Applications Guide
Use Adjust or Local
Press.
Diff. Press
Static Press.
Temperature
Spec. Gravity
Z Flowing
The label on this button shows whether you use the
calculated local pressure or the adjusted pressure.
When you click the button you toggle between these
two cases.
Click Adjust to specify that the application should use
local pressure. The button now displays Local.
Click Local to specify that the application should use
adjusted pressure. The button now displays Adjust.
Shows the differential pressure across the orifice plate.
Shows the upstream or downstream static pressure.
Shows the temperature of the flowing gas.
Shows the specific gravity of the gas at standard
conditions.
Shows the flowing compressibility factor.
Z Base
Base Temp.
Base Press.
Viscosity
Outputs
Flow
Flow Units
Low Flow Cut Off Shows Cutoff if the flow is too low and so the low flow
C Prime The C Prime factor is:
Shows the base compressibility factor.
Shows the base temperature of the gas.
Specify the base pressure. This is used to calculate
the pressure base factor
Specify the dynamic viscosity of the gas at flowing
conditions. Viscosity is used to calculate the Reynolds
number.
Shows the current calculated flow reading.
Shows the engineering units for the calculated flow
reading.
cut off is currently active. Shows Flowing if flow is
sufficient that the low flow cut off is not active.
Fn * CD * Y * Fpb * Ftb * Ftf * Fgr * Fpv
where:
Fn is the numeric conversion factor
Revised Oct-2014 Measurement Group Config Tab 4-43
Page 76

ControlWave Flow Measurement Applications Guide
Fn
CD is the orifice coefficient of discharge
Y is the expansion factor
Fpb is the pressure base factor
Ftb is the temperature base factor
Ftf is the flowing temperature factor
Fpv is the supercompressibility factor
Shows a numeric conversion factor which includes the
velocity of approach factor.
CD
E
Y
Fpb
Ftb
Ftf
Fgr
FPV
Shows the Orifice coefficient of discharge, which is the
sum of the orifice calculation factor, Fc and the orifice
slope factor Fsl.
Shows the velocity of approach factor.
Shows the expansion factor.
Shows the pressure base factor.
Shows the temperature base factor.
Shows the flowing temperature factor.
Shows the specific gravity factor.
Shows the supercompressibility factor, computed as
Zb / Zf..
Fm
Extension
Reynolds Number
BCF
Shows the internal meter correction factor, Fm , to
compensate for external equipment calibration error or
local variations in conditions such as gravity, or
Downstream tap compressibility.
Shows the extension factor for the AGA3I calculation.
Shows the pipe Reynolds number as computed by
iteration as part of the CD (coefficient of discharge)
calculation.
Shows the base correction (Zb/Zs) for Zb other than
AGA report Zs value, where Zb is the base
compressibility factor and Zs is the standard
compressibility for gas in use.
4-44 Measurement Group Config Tab Revised Oct-2014
Page 77

ControlWave Flow Measurement Applications Guide
4.8.2 Differential Measurement – AGA3TERM (1985 equation)
There are two different AGA3 equations supported, the AGA3I equation
from the 1992 AGA report, and the AGA3TERM equation from the 1985
AGA report.
Figure 4-13. Differential Measurement – AGA3TERM page
Notes:
If you want to choose the AGA3I calculation, instead of the
AGA3TERM calculation, click the Click Here to Select AGA3I
(1992) button.
If you chose differential measurement by mistake, and need to choose
either linear measurement or coriolis measurement instead, click the
Reset Meter Run’s Measurement Type button on the Meter Run
Overview page. See Section 3.2.
Field Description
1985 AGA3 Equation
Configuration for Run#
Inputs
Pressure Tap
Select the meter run number for which you want to
configure AGA3 term measurement.
Click this button to change the specified location of the
pressure tap. The pressure tap can be either upstream
or downstream of the meter.
Revised Oct-2014 Measurement Group Config Tab 4-45
Page 78

ControlWave Flow Measurement Applications Guide
Low Flow Cutoff
Orifice Diam.
Pipe Diam.
Fm / Fl
Adjust Press.
Station Elevation
Local Press.
Enter the low flow cutoff here. This the minimum
value for differential pressure where the application
performs measurements. If the differential pressure
drops below this value, the measured flow goes to
zero. Select the units for the low flow cutoff.
Enter the orifice bore diameter here and select the
proper units.
Enter the inside diameter of the pipe here and select
the proper units.
Enter the combined orifice constant here.
Specify the average barometric pressure and select
the proper units.
Specify the station elevation above sea level and
choose the appropriate units. The default units are
feet.
Show the local atmospheric pressure calculated based
on inputs including the station elevation.
Use Adjust or Local
Press.
Diff. Press
Static Press.
Temperature
Spec. Gravity
FPV
The label on this button shows whether you use the
calculated local pressure or the adjusted pressure.
When you click the button you toggle between these
two cases.
Click Adjust to specify that the application should use
local pressure. The button now displays Local.
Click Local to specify that the application should use
adjusted pressure. The button now displays Adjust.
Shows the differential pressure across the orifice plate.
Shows the upstream or downstream static pressure.
Shows the temperature of the flowing gas.
Shows the specific gravity of the flowing gas.
Shows the supercompressibility factor of the gas.
Base Temp.
Specify the required (contract) base temperature of the
flowing gas and the associated engineering units.
4-46 Measurement Group Config Tab Revised Oct-2014
Page 79

ControlWave Flow Measurement Applications Guide
Base Press.
Outputs
Flow
Flow Units
Low Flow Cut Off Shows Cutoff if the flow is too low and so the low flow
C Prime The C Prime factor is:
Fb
Specify the base or contract pressure of the gas and
the associated units.
Shows the current calculated flow reading.
Shows the engineering units for the calculated flow
reading.
cut off is currently active. Shows Flowing if flow is
sufficient that the low flow cut off is not active.
Fn * CD * Y * Fpb * Ftb * Ftf * Fgr * Fpv
where:
Fn is the numeric conversion factor
CD is the orifice coefficient of discharge
Y is the expansion factor
Fpb is the pressure base factor
Ftb is the temperature base factor
Ftf is the flowing temperature factor
Fpv is the supercompressibility factor
Show the base orifice factor.
Fr
Y
Fpb
Ftb
Ftf
Fg
Extension
Orif. Const. K
Shows the Reynolds number factor.
Shows the expansion factor.
Shows the pressure base factor.
Shows the temperature base factor.
Shows the flowing temperature factor.
Shows the specific gravity factor.
Shows the extension factor for the AGA3TERM
calculation.
Shows the combined orifice constant K. This is
typically the value for orifice thermal expansion unless
other corrections are required.
Revised Oct-2014 Measurement Group Config Tab 4-47
Page 80

ControlWave Flow Measurement Applications Guide
4.8.3 Linear Measurement – AGA7
The AGA7 Equation Configuration page lets you configure linear flow
measurement for this meter run.
Figure 4-14. AGA7 Calculation page
Note: If you chose linear measurement by mistake, and need to choose
either differential measurement or coriolis measurement instead,
you can reset the equation type to undefined, so you can re-select
it. To do this, click the Reset Meter Run’s Measurement Type
button on the Meter Run Overview page. See Section 3.2.
4-48 Measurement Group Config Tab Revised Oct-2014
Page 81

ControlWave Flow Measurement Applications Guide
Field Description
AGA7 Equation
Configuration for Run#
Inputs
Select the meter run number for which you want to
configure AGA7 linear measurement.
Flow Density
Base Density
Spec. Gravity
FPV
K Factor Units
K Factor
Frequency Input
Low Flow Cutoff
Static Pressure
Specify the density of the flowing gas as measured by
a densitometer.
Specify the contract base density of the gas as
measured by a densitometer.
Specify the specific gravity of the gas as measured by
a gravitometer.
Shows the supercompressibility factor.
Specify the desired units for the output.
Specify a scale factor to adjust the output to your
desired units.
Shows the live frequency input.
The low flow cutoff is the minimum frequency that will
still be considered valid for flow measurement. If the
frequency of the inputs from the high speed counter fall
below this number, volume will not be measured.
Shows the static gauge pressure of the flowing gas.
Temperature
Pressure Adjust
Station Elevation
Local Press.
Use Adjust or Local
Press.
Revised Oct-2014 Measurement Group Config Tab 4-49
Shows the temperature of the flowing gas.
Enter the average barometric pressure here.
Specify the station elevation above sea level and
choose the appropriate units. The default units are
feet.
Show the local atmospheric pressure calculated based
on inputs including the station elevation.
The label on this button shows whether you use the
calculated local pressure or the adjusted pressure.
When you click the button you toggle between these
two cases.
Page 82

ControlWave Flow Measurement Applications Guide
Base Pressure
Click Adjust to specify that the application should use
local pressure. The button now displays Local.
Click Local to specify that the application should use
adjusted pressure. The button now displays Adjust.
Specify the contract base pressure and associated
units.
Base Temperature
Meter Factor
Outputs
Flow
Flow Units
K Factor Used
Low Flow Cut Off Shows Cutoff if the flow is too low and so the low flow
Specify the contract base temperature and associated
units.
Specify an optional meter calibration factor here. The
AGA7 calculation uses this factor to correct for known
variations in the measuring equipment.
Shows the calculated flow rate at base conditions.
Shows the engineering units for the calculated flow
rate reading.
Shows the value of the K factor used in the calculation.
cut off is currently active. Shows Flowing if flow is
sufficient that the low flow cut off is not active.
4-50 Measurement Group Config Tab Revised Oct-2014
Page 83

4.8.4 Coriolis Measurement
The Coriolis Equation Configuration page lets you configure gas flow
measurement using a coriolis meter.
ControlWave Flow Measurement Applications Guide
Figure 4-15. Coriolis Calculation page
Note: If you chose coriolis measurement by mistake, and need to choose
either differential measurement or linear measurement instead, you
can reset the equation type to undefined, so you can re-select it. To
do this, click the Reset Meter Run’s Measurement Type button
on the Meter Run Overview page. See Section 3.2.
Field Description
Coriolis Equation
Configuration for Run#
Inputs
Air Density
Spec. Gravity
Select the meter run number for which you want to
configure coriolis measurement.
Specify the density of air constant.
Shows the specific gravity of the gas.
Revised Oct-2014 Measurement Group Config Tab 4-51
Page 84

ControlWave Flow Measurement Applications Guide
K Factor Units
K Factor
Frequency Input
Static Pressure
Temperature
Outputs
Flow
Flow Units
Select the engineering units for the coriolis meter.
Specify the correction factor (K) for the coriolis meter.
This information is available from the coriolis meter
data plate.
Shows the current frequency from the high speed
counter input connected to the coriolis meter.
Shows the static pressure of the flowing gas.
Shows the temperature of the flowing gas.
Shows the calculated flow rate.
Shows the engineering units for the calculated flow
rate reading.
K Factor Used
Shows the value of the K factor used in the calculation.
4-52 Measurement Group Config Tab Revised Oct-2014
Page 85

4.9 Compressibility Setup
The Supercompressibility Configuration page lets you enter parameters to
enable supercompressibility calculations.
ControlWave Flow Measurement Applications Guide
Calling up this Menu
Click
Figure 4-16. Supercompressibility Configuration page
Field Description
Supercompressibility
Configuration for Run#
Selected
Compressibility
Calculation
Click to Select
NX19/AGA8
Detail/AGA8 Gross
Revised Oct-2014 Measurement Group Config Tab 4-53
Select the meter run number for which you want to
configure supercompressibility calculations.
Shows the currently selected type of compressibility
calculation.
Click the NX-19 button to select NX-19 as the
compressibility calculation.
Click the AGA8 Detail button to select AGA8 Detail as
the compressibility calculation.
Click the AGA8 Gross button to select AGA8 Gross
Page 86

ControlWave Flow Measurement Applications Guide
Inputs
as the compressibility calculation.
Gross Mode
Static Pressure
Base Pressure
Temperature
The label on this button shows whether you use gross
Mode 1 or gross Mode 2. When you click the button
you toggle between these two cases.
Mode 1 uses the heating value (in BTU), the relative
density (specific gravity) and the mole fraction percent
.
of CO
2
Mode 2 uses the relative density (specific gravity) and
the mole fraction percent of N
and CO2.
2
Click Mode 1 to specify that the application should use
Mode 2. The button now displays Mode 2.
Click Mode 2 to specify that the application should use
Mode 1. The button now displays Mode 1.
Shows the static pressure of the flowing gas.
Specify the contract base pressure.
Shows the temperature of the flowing gas.
Base Temp.
BTU
Spec. Gravity.
CH4
N2
CO2
C2
Specify the contract base temperature.
Shows the heat in British Thermal Units (BTU)
Shows the specific gravity of the gas. There are no
units for specific gravity.
Shows the mole fraction percentage of methane in the
gas.
Shows the mole fraction percentage of nitrogen in the
gas.
Shows the mole fraction percentage of carbon dioxide
in the gas.
Shows the mole fraction percentage of ethane in the
gas.
4-54 Measurement Group Config Tab Revised Oct-2014
Page 87

ControlWave Flow Measurement Applications Guide
C3
IC4
NC4
IC5
NC5
NC6
NC7
NC8
Shows the mole fraction percentage of propane in the
gas.
Shows the mole fraction percentage of I-butane in the
gas.
Shows the mole fraction percentage of N-butane in the
gas.
Shows the mole fraction percentage of I-pentane in the
gas.
Shows the mole fraction percentage of N-pentane in
the gas.
Shows the mole fraction percentage of N-hexane in
the gas.
Shows the mole fraction percentage of N-heptane in
the gas.
Shows the mole fraction percentage of N-octane in the
gas.
H2O
H2S
H2
CO
O2
NC9
NC10
He2
Specify the mole fraction percentage of water in the
gas.
Specify the mole fraction percentage of hydrogen
sulfide in the gas.
Specify the mole fraction percentage of hydrogen in
the gas.
Specify the mole fraction percentage of carbon
monoxide in the gas.
Specify the mole fraction percentage of oxygen in the
gas.
Specify the mole fraction percentage of n-nonane in
the gas.
Specify the mole fraction percentage of n-decane in
the gas.
Specify the mole fraction percentage of helium in the
gas.
Ar
Revised Oct-2014 Measurement Group Config Tab 4-55
Specify the mole fraction percentage of argon in the
gas.
Page 88

ControlWave Flow Measurement Applications Guide
Outputs
FPV
Z Base
Z Flowing
Shows the calculated supercompressibility factor of
the gas.
Shows the base compressibility factor.
Shows the flowing compressibility factor.
4-56 Measurement Group Config Tab Revised Oct-2014
Page 89

4.10 GC Summary
ControlWave Flow Measurement Applications Guide
Calling up this Menu
Click
Figure 4-17. GC Summary page
Field Description
Chromatograph Setup
for Run#
Communications
Settings
Mode Disabled/Enabled
Revised Oct-2014 Measurement Group Config Tab 4-57
Select the meter run for which you want to configure a
chromatograph.
Use this button to specify, for the application, whether
a chromatograph is present (enabled) and providing
gas component data or not present (disabled) in which
Page 90

ControlWave Flow Measurement Applications Guide
Status
Common Fixed Data
Port Number
Serial or IP
case the application uses fixed values for gas
component data.
The label on this button shows the current configured
state of the chromatograph. When you click the button
you toggle the direction.
Click Disabled to specify that the chromatograph is
present and providing gas component data. The button
now displays Enabled.
Click Enabled to specify that the chromatograph is not
present and that the application should use fixed gas
component data values. The button now displays
Disabled.
Non-zero values indicate an error. See the
ControlWave Designer online help CUSTOM function
block odiStatus parameter value for the Modbus
Master communication protocol you use with the
chromatograph.
Use this button to specify, for the application,
whether the fixed component values you enter for
stream 1 should apply to all four streams (Common)
or whether each stream should use its own fixed
component value (Individual).
The label on this button shows the current choice.
When you click the button you toggle the choice.
Click Individual to specify that the application should
use the gas component data specified for stream 1 for
all four streams. The button now displays Common.
Click Common to specify that the application should
use individual gas component values specified for
each stream instead of using the stream 1 value for all
four streams. The button now displays Individual.
When a chromatograph is present, this is the port
number on the ControlWave flow computer to which
the chromatograph connects.
Use this button to specify, for the application, whether
the ControlWave flow computer communicates with
the chromatograph using a serial Modbus protocol or
an IP communication protocol.
The label on this button shows the current configured
choice of protocol. When you click the button you
toggle the protocol.
Click IP to specify that the flow computer uses a serial
Modbus protocol to communicate with the
chromatograph. The button now displays Serial..
4-58 Measurement Group Config Tab Revised Oct-2014
Page 91

Modbus Address
f
IP Address
ControlWave Flow Measurement Applications Guide
Click Serial to specify that the flow computer uses IP
protocol to communicate with the chromatograph. The
button now displays IP.
If the ControlWave communicates with the
chromatograph using a serial Modbus communication
protocol, enter the chromatograph’s Modbus Address
246),
(1-
If you communicate with the chromatograph using IP,
specify its IP address here.
Stream Assignment
GC Run Status
C6+/C9+ Mode
On Chromatograph
Failure Stream x
should
Select the chromatograph gas stream you want to
assign to the current meter run. The current meter run
is the one you selected at the top of the menu with the
Chromatograph Setup for Run# field.
Possible status messages include:
OK operating okay
DISABLED in disabled mode
OUT OF RANGE ERROR value out of range based on
the limits set
GC FAILURE the chromatograph failed
BAD RUN# Improper GC configuration for this
meter run
Use this button to specify, for the application, whether
your chromatograph supports C6+ or C9+.
The label on this button shows the current configured
choice. When you click the button you toggle the
choice.
Click C6+ to specify that the chromatograph supports
C9+. The button now displays C9+..
Click C9+ to specify that the chromatograph supports
C6+. The button now displays C6+.
Use this button to specify, for each stream, what gas
component values the application should use if the
chromatograph fails. The application can either use the
last known good value from the chromatograph, or a
fixed value you enter on this page.
The label on this button shows the current configured
choice of what gas components to use for this stream i
the chromatograph fails. When you click the button you
toggle the choice.
Click Use Fixed Values to specify that the flow
computer should use the last known component
values received from the chromatograph for this
stream if the chromatograph fails. The button now
Revised Oct-2014 Measurement Group Config Tab 4-59
Page 92

ControlWave Flow Measurement Applications Guide
Analysis Data
displays Use Last Values.
Click Use Last Values to specify that the flow
computer should use the fixed component values
entered on this page for this stream if the
chromatograph fails. The button now displays Use
Fixed Values.
Stream x BTU Raw
Shows the most recent BTU value received from the
chromatograph for gas stream x.
Stream x BTU Fixed
Enter a fixed BTU value the application can use if the
chromatograph fails for gas stream x. The application
only uses this value if the chromatograph fails and you
specified that it should Use Fixed Values for this
stream.
Stream x Gravity Raw
Shows the most recent gravity value received from the
chromatograph for gas stream x.
Stream x Gravity Fixed
Enter a fixed gravity value the application can use if the
chromatograph fails for gas stream x. The application
only uses this value if the chromatograph fails and you
specified that it should Use Fixed Values for this
stream.
Gas Components
Stream x CH
(Methane) Raw
*
Stream x CH
(Methane) Fixed
*
4
4
Shows the most recent methane value received from
the chromatograph for gas stream x.
Enter a fixed methane value the application can use if
the chromatograph fails for gas stream x. The
application only uses this value if the chromatograph
fails and you specified that it should Use Fixed Values
for this stream.
Stream x N
Raw
(Nitrogen)
2 *
Shows the most recent nitrogen value received from
the chromatograph for gas stream x.
Stream x N
Fixed
(Nitrogen)
2 *
Enter a fixed nitrogen value the application can use if
the chromatograph fails for gas stream x. The
application only uses this value if the chromatograph
fails and you specified that it should Use Fixed Values
for this stream.
Stream x CO
2 *
Raw
Shows the most recent carbon dioxide value received
from the chromatograph for gas stream x.
Stream x CO
Fixed
2 *
Enter a fixed carbon dioxide value the application can
use if the chromatograph fails for gas stream x. The
application only uses this value if the chromatograph
fails and you specified that it should Use Fixed Values
for this stream.
4-60 Measurement Group Config Tab Revised Oct-2014
Page 93

ControlWave Flow Measurement Applications Guide
Stream x C
2 *
Raw
Stream x C
2 *
Fixed
Stream x C
2 *
Raw
Stream x C
3 *
Fixed
Stream x IC
4 *
Raw
Stream x IC
4 *
Fixed
Stream x NC
Butane) Raw
(Ethane)
(Ethane)
(Propane)
(Propane)
(I-Butane)
(I-Butane)
(N-
4 *
Shows the most recent ethane value received from the
chromatograph for gas stream x.
Enter a fixed ethane value the application can use if
the chromatograph fails for gas stream x. The
application only uses this value if the chromatograph
fails and you specified that it should Use Fixed Values
for this stream.
Shows the most recent propane value received from
the chromatograph for gas stream x.
Enter a fixed propane value the application can use if
the chromatograph fails for gas stream x. The
application only uses this value if the chromatograph
fails and you specified that it should Use Fixed Values
for this stream.
Shows the most recent I-butane value received from
the chromatograph for gas stream x.
Enter a fixed I-butane value the application can use if
the chromatograph fails for gas stream x. The
application only uses this value if the chromatograph
fails and you specified that it should Use Fixed Values
for this stream.
Shows the most recent N-butane value received from
the chromatograph for gas stream x.
Stream x NC
(N-
4 *
Butane) Fixed
Stream x IC
(I-
5 *
Pentane) Raw
Stream x IC5*(I-Pentane)
Fixed
Stream x NC
(N-
5 *
Pentane) Raw
Stream x NC
(N-
5 *
Pentane) Fixed
Enter a fixed N-butane value the application can use if
the chromatograph fails for gas stream x. The
application only uses this value if the chromatograph
fails and you specified that it should Use Fixed Values
for this stream.
Shows the most recent I-pentane value received from
the chromatograph for gas stream x.
Enter a fixed I-pentane value the application can use if
the chromatograph fails for gas stream x. The
application only uses this value if the chromatograph
fails and you specified that it should Use Fixed Values
for this stream.
Shows the most recent N-pentane value received from
the chromatograph for gas stream x.
Enter a fixed N-pentane value the application can use
if the chromatograph fails for gas stream x. The
application only uses this value if the chromatograph
fails and you specified that it should Use Fixed Values
for this stream.
Revised Oct-2014 Measurement Group Config Tab 4-61
Page 94

ControlWave Flow Measurement Applications Guide
Stream x C
Stream x C
Stream x NC
6+ *
6+ *
6 *
Raw
Fixed
Hexane) Raw
Stream x NC
6 *
Hexane) Fixed
Stream x NC
7 *
Heptane) Raw
Stream x NC
7 *
Heptane) Fixed
Stream x NC
8 *
Octane) Raw
(N-
(N-
(N-
(N-
(N-
Shows the most recent C
value received from the
6+
chromatograph for gas stream x.
Enter a fixed C
value the application can use if the
6+
chromatograph fails for gas stream x. The application
only uses this value if the chromatograph fails and you
specified that it should Use Fixed Values for this
stream.
Shows the most recent N-hexane value received from
the chromatograph for gas stream x.
Enter a fixed N-hexane value the application can use if
the chromatograph fails for gas stream x. The
application only uses this value if the chromatograph
fails and you specified that it should Use Fixed Values
for this stream.
Shows the most recent N-heptane value received from
the chromatograph for gas stream x.
Enter a fixed N-heptane value the application can use
if the chromatograph fails for gas stream x. The
application only uses this value if the chromatograph
fails and you specified that it should Use Fixed Values
for this stream.
Shows the most recent N-octane value received from
the chromatograph for gas stream x.
Stream x NC
8 *
Octane) Fixed
Stream x C
Stream x C
Stream x NC
9+ *
9+ *
9 *
Nonane) Raw
Stream x NC
9 *
Nonane) Fixed
(N-
Raw
Fixed
(N-
(N-
Enter a fixed N-octane value the application can use if
the chromatograph fails for gas stream x. The
application only uses this value if the chromatograph
fails and you specified that it should Use Fixed Values
for this stream.
Shows the most recent C
value received from the
9+
chromatograph for gas stream x.
Enter a fixed C
value the application can use if the
9+
chromatograph fails for gas stream x. The application
only uses this value if the chromatograph fails and you
specified that it should Use Fixed Values for this
stream.
Shows the most recent N-nonane value received from
the chromatograph for gas stream x.
Enter a fixed N-nonane value the application can use if
the chromatograph fails for gas stream x. The
application only uses this value if the chromatograph
fails and you specified that it should Use Fixed Values
for this stream.
4-62 Measurement Group Config Tab Revised Oct-2014
Page 95

ControlWave Flow Measurement Applications Guide
Stream x NC
10 *
Decane) Raw
Stream x NC
10 *
Decane) Fixed
(N-
(N-
Shows the most recent N-decane value received from
the chromatograph for gas stream x.
Enter a fixed N-decane value the application can use if
the chromatograph fails for gas stream x. The
application only uses this value if the chromatograph
fails and you specified that it should Use Fixed Values
for this stream.
Stream x Raw Totals
Shows the sum of the gas component values in the
raw column as a percentage.
Stream x Fixed Totals
Shows the sum of the gas component values in the
fixed column as a percentage.
Stream x Out of Range Shows OOR if the raw gas stream total is out of range
of the Component Total Sum Limits defined on the
Chromatograph Component Range Setup page (see
Section 4.11), or Normal if the raw gas stream total is
within these limits.
Used
This column shows the gas component values
currently in use in calculations for the current meter
run. This could be either the fixed value or the raw
value. The current meter run is the one you selected at
the top of the menu with the Chromatograph Setup
for Run# field.
Revised Oct-2014 Measurement Group Config Tab 4-63
Page 96

ControlWave Flow Measurement Applications Guide
4.11 Chromatograph Component Range Setup
On the Chromatograph Component Range Setup page, you specify the
minimum and maximum percentages for particular gas components in
each gas stream.
If a component percentage goes outside these limits, operation is governed
by the chromatograph failure settings on the GC Summary page.
Calling up this Menu
Click
Range Setup
> Component
Figure 4-18. Component Range Setup page
4-64 Measurement Group Config Tab Revised Oct-2014
Page 97

ControlWave Flow Measurement Applications Guide
Field Description
Component Out of
Range Limits
Chromatograph Out of
Range Limits
Individual/Common
button
Stream x C
(Ethane)
2 *
Max Limit
Stream x C
(Ethane)
2 *
Min Limit
Use this button to specify, for the application,
whether the component out of range limits you enter
for stream 1 should apply to all four streams
(Common) or whether each stream should use its
own individual out of range limits (Individual).
The label on this button shows the current choice.
When you click the button you toggle the choice.
Click Individual to specify that the application should
use the out of range limits specified for stream 1 for all
four streams. The button now displays Common.
Click Common to specify that the application should
use out of range limits specified for each stream
instead of using the stream 1 limits for all four streams.
The button now displays Individual.
Specify the maximum percentage of ethane allowed in
gas stream x.
Specify the minimum percentage of ethane allowed in
gas stream x.
Stream x C
(Propane)
3 *
Max Limit
Stream x C
(Propane)
3 *
Min Limit
Stream x CH
(Methane) Max Limit
*
Stream x CH
(Methane) Min Limit
*
Stream x CO
4
4
(Carbon
2 *
Dioxide) Max Limit
Stream x CO
(Carbon
2 *
Dioxide) Min Limit
Stream x IC
(I-Butane)
4 *
Max Limit
Specify the maximum percentage of propane allowed
in gas stream x.
Specify the minimum percentage of propane allowed in
gas stream x.
Specify the maximum percentage of methane allowed
in gas stream x.
Specify the minimum percentage of methane allowed
in gas stream x.
Specify the maximum percentage of carbon dioxide
allowed in gas stream x.
Specify the minimum percentage of carbon dioxide
allowed in gas stream x.
Specify the maximum percentage of I-butane allowed
in gas stream x.
Revised Oct-2014 Measurement Group Config Tab 4-65
Page 98

ControlWave Flow Measurement Applications Guide
Stream x IC
(I-Butane)
4 *
Min Limit
Stream x IC5*(I-Pentane)
Max Limit
Stream x IC5*(I-Pentane)
Min Limit
Stream x N2*(Nitrogen)
Max Limit
Stream x N2*(Nitrogen)
Min Limit
Stream x NC4*(NButane) Max Limit
Stream x NC4*(NButane) Min Limit
Stream x NC5*(NPentane) Max Limit
Specify the minimum percentage of I-butane allowed in
gas stream x.
Specify the maximum percentage of I-pentane allowed
in gas stream x.
Specify the minimum percentage of I-pentane allowed
in gas stream x.
Specify the maximum percentage of nitrogen allowed
in gas stream x.
Specify the minimum percentage of nitrogen allowed in
gas stream x.
Specify the maximum percentage of N-butane allowed
in gas stream x.
Specify the minimum percentage of N-butane allowed
in gas stream x.
Specify the maximum percentage of N-pentane
allowed in gas stream x.
Stream x NC5*(NPentane) Min Limit
Stream x NC6*(NHexane) Max Limit
Stream x NC6*(NHexane) Min Limit
Stream x C
( Max
6+*
Limit
Stream x C
( Min Limit
6+*
Stream x NC7*(NHeptane) Max Limit
Stream x NC7*(NHeptane) Min Limit
Stream x NC8*(NOctane) Max Limit
Specify the minimum percentage of N-pentane allowed
in gas stream x.
Specify the maximum percentage of N-hexane allowed
in gas stream x.
Specify the minimum percentage of N-hexane allowed
in gas stream x.
Specify the maximum percentage of C
allowed in gas
6+
stream x.
Specify the minimum percentage of C
allowed in gas
6+
stream x.
Specify the maximum percentage of N-heptane
allowed in gas stream x.
Specify the minimum percentage of N-heptane allowed
in gas stream x.
Specify the maximum percentage of N-octane allowed
in gas stream x.
Stream x NC8*(NOctane) Min Limit
Specify the minimum percentage of N-octane allowed
in gas stream x.
4-66 Measurement Group Config Tab Revised Oct-2014
Page 99

ControlWave Flow Measurement Applications Guide
Stream x C
( Max
9+*
Limit
Stream x C
( Min Limit
9+*
Stream x NC9*(NNonane) Max Limit
Stream x NC9*(NNonane) Min Limit
Stream x NC
10*
(N-
Decane) Max Limit
Stream x NC
10*
(N-
Decane) Min Limit
Stream x Gravity Max
Limit
Stream x Gravity Min
Limit
Specify the maximum percentage of C
allowed in gas
9+
stream x.
Specify the minimum percentage of C
allowed in gas
9+
stream x.
Specify the maximum percentage of N-nonane allowed
in gas stream x.
Specify the minimum percentage of N-nonane allowed
in gas stream x.
Specify the maximum percentage of N-decane allowed
in gas stream x.
Specify the minimum percentage of N-decane allowed
in gas stream x.
Specify the maximum gravity allowed in gas stream x.
Specify the minimum gravity allowed in gas stream x.
Stream x BTU Max
Specify the maximum BTUs allowed in gas stream x.
Limit
Stream x BTU Min Limit
Component Total Sum
Limit
Max Percentage Limits
(Common to all
Streams)
Specify the minimum BTUs allowed in gas stream x.
Specify a maximum value for the total percentage of
gas components allowed in a single gas stream. This
same value is used for each one of the four gas
streams.
Min Percentage Limits
(Common to all
Streams)
Specify a minimum value for the total percentage of
gas components allowed in a single gas stream. This
same value is used for each one of the four gas
streams.
C6+/C9+ Factors The gas chromatograph reports a single value for
either C6+ or C9+. The percentage applied to each
component (C6, C7, C8, C9 and C10) will be how the
number reported by the gas chromatograph is
distributed across the components.
Stream x NC6*(N-
Specify the percentage applied to the C6 component.
Hexane) Factor %
Revised Oct-2014 Measurement Group Config Tab 4-67
Page 100

ControlWave Flow Measurement Applications Guide
Stream x NC7*(NHeptane) Factor %
Stream x NC8*(NOctane) Factor %
Stream x NC9*(NNonane) Factor %
Stream x NC
10*
(N-
Decane) Factor %
Specify the percentage applied to the C7 component.
Specify the percentage applied to the C8 component.
Specify the percentage applied to the C9 component.
Specify the percentage applied to the C10 component.
4-68 Measurement Group Config Tab Revised Oct-2014
 Loading...