

Page 1
IQS-1100/IQS-1500
Power Meters for IQS Platforms
User Guide
Page 2

Copyright © 2002–2008 EXFO Electro-Optical Engineering Inc. All rights
reserved. No part of this publication may be reproduced, stored in a
retrieval system or transmitted in any form, be it electronically,
mechanically, or by any other means such as photocopying, recording or
otherwise, without the prior written permission of EXFO Electro-Optical
Engineering Inc. (EXFO).
Information provided by EXFO is believed to be accurate and reliable.
However, no responsibility is assumed by EXFO for its use nor for any
infringements of patents or other rights of third parties that may result from
its use. No license is granted by implication or otherwise under any patent
rights of EXFO.
EXFO’s Commerce And Government Entities (CAGE) code under the North
Atlantic Treaty Organization (NATO) is 0L8C3.
The information contained in this publication is subject to change without
notice.
Trademarks
EXFO’s trademarks have been identified as such. However, the presence
or absence of such identification does not affect the legal status of any
trademark.
Units of Measurement
Units of measurement in this publication conform to SI standards and
practices.
Version number: 2.0.3
ii IQS-1100/IQS-1500
Page 3

Contents
Contents
Certification Information ....................................................................................................... vi
1 Introducing the IQS-1100/IQS-1500 Power Meters ..................................... 1
Main Features .........................................................................................................................1
Typical Applications ................................................................................................................4
Conventions ............................................................................................................................5
2 Safety Information ....................................................................................... 7
3 Getting Started with Your Power Meters ................................................... 9
Inserting and Removing Test Modules ....................................................................................9
Starting the Power Meters Application .................................................................................13
Entering Values Using Sliders and Numeric Boxes .................................................................17
Exiting the Application .........................................................................................................18
4 Setting Up Your Power Meters .................................................................. 19
Naming Channels .................................................................................................................20
Selecting the Wavelength .....................................................................................................21
Managing Wavelength Lists ..................................................................................................22
Selecting the Measurement Unit ...........................................................................................23
Setting the Display Resolution ..............................................................................................24
Setting the Refresh Rate .......................................................................................................25
Saving and Recalling Configurations .....................................................................................26
5 Preparing Your Power Meters for a Test ................................................... 29
Cleaning and Connecting Optical Fibers ...............................................................................29
Nulling Offsets ......................................................................................................................30
6 Measuring Power ....................................................................................... 33
Displaying Absolute Power ...................................................................................................33
Measuring Relative Power .....................................................................................................35
Using the Offset Function .....................................................................................................36
Averaging Measurements .....................................................................................................37
7 Performing Acquisitions ............................................................................ 39
Selecting the Sampling Type .................................................................................................39
Selecting the Acquisition Mode ............................................................................................41
Starting the Acquisition ........................................................................................................46
Consulting Acquired Data .....................................................................................................48
Power Meters iii
Page 4

Contents
8 Performing and Analyzing Graph Acquisitions .........................................53
Setting Up Graph Parameters ...............................................................................................53
Printing Graph Results ..........................................................................................................55
Clearing Graph Display .........................................................................................................55
Using the Zoom Function .....................................................................................................56
Displaying and Moving Markers ...........................................................................................58
9 Calibrating Other Power Meters with the IQS-1500 .................................59
Selecting the Calibration Option ...........................................................................................60
Entering General Calibration Information .............................................................................61
Entering Calibration Conditions ............................................................................................62
Entering DUT Information .....................................................................................................65
Entering Calibration Uncertainties ........................................................................................66
Saving a Template File ...........................................................................................................71
Nulling Offsets for Calibration ..............................................................................................72
Storing Reference Power Meter Measurements Automatically ..............................................73
Entering DUT Measurements ................................................................................................75
Viewing Calibration Summary ..............................................................................................76
Managing Calibration Reports ..............................................................................................79
10 Monitoring Power Meter Modules ............................................................83
Using Monitor Windows .......................................................................................................83
Using QuickTools ...................................................................................................................86
11 Maintenance ................................................................................................89
Cleaning Fixed Connectors ....................................................................................................90
Cleaning Detector Ports ........................................................................................................92
Recalibrating the Unit ...........................................................................................................93
Recycling and Disposal (Applies to European Union Only) ....................................................94
12 Troubleshooting ..........................................................................................95
Solving Common Problems ...................................................................................................95
Viewing Online Documentation ............................................................................................97
Contacting the Technical Support Group ..............................................................................98
Transportation ....................................................................................................................100
13 Warranty ....................................................................................................101
General Information ...........................................................................................................101
Liability ...............................................................................................................................101
Exclusions ...........................................................................................................................102
Certification ........................................................................................................................102
Service and Repairs .............................................................................................................103
EXFO Service Centers Worldwide ........................................................................................104
iv IQS-1100/IQS-1500
Page 5

Contents
A Technical Specifications ........................................................................... 105
B SCPI Command Reference ....................................................................... 107
Quick Reference Command Tree .........................................................................................107
Product-Specific Commands—Description ..........................................................................110
C Calibration Report Sample ...................................................................... 157
Index .............................................................................................................. 159
Power Meters v
Page 6

Certification Information
Certification Information
F.C.C. Information
Electronic test equipment is exempt from Part 15 compliance (FCC) in
the United States. However, compliance verification tests are
systematically performed on most EXFO equipment.
Information
Electronic test equipment is subject to the EMC Directive in the European
Union. The EN61326 standard prescribes both emission and immunity
requirements for laboratory, measurement, and control equipment.
This unit has undergone extensive testing according to the European Union
Directive and Standards.
Use of shielded remote I/O cables, with properly grounded shields
and metal connectors, is recommended in order to reduce radio
frequency interference that may emanate from these cables.
IMPORTANT
vi IQS-1100/IQS-1500
Page 7

Certification Information
Application of Council Directive(s): 73/23/EEC - The Low Voltage Directive
89/336/EEC - The EMC Directive
And their amendments
Manufacturer’s Name: EXFO Electro-Optical Engineering Inc.
Manufacturer’s Address: 400 Godin Avenue
Quebec, Quebec
Canada, G1M 2K2
(418) 683-0211
Equipment Type/Environment: Test & Measurement / Industrial
Trade Name/Model No.: IQS-1100
Power Meter
Standard(s) to which Conformity is Declared:
EN 61010-1:2001 Safety Requirements for Electrical Equipment for Measurement,
Control, and Laboratory Use, Part 1: General Requirements.
EN 61326:1997 +A1:1998
+A2:2001
Electrical Equipment for M easurement, Control and Laboratory
Use - EMC Requirements
EN 55022: 1998 Limits and Methods of Measurement of Radio Disturbance
Characteristics of Information Technology Equipment.
I, the undersigned, hereby declare that the equipment specified above conforms to the above Directive and Standards.
Manufacturer
Signature:
Full Name: Stephen Bull, E. Eng
Position: Vice-President Research and
Development
Address: 400 Godin Avenue, Quebec (Quebec),
Canada, G1M 2K2
Date: August 20, 2002
DECLARATION OF CONFORMITY
Power Meters vii
Page 8

Certification Information
Application of Council Directive(s): 73/23/EEC - The Low Voltage Directive
89/336/EEC - The EMC Directive
And their amendments
Manufacturer’s Name: EXFO Electro-Optical Engineering Inc.
Manufacturer’s Address: 400 Godin Avenue
Quebec, Quebec
Canada, G1M 2K2
(418) 683-0211
Equipment Type/Environment: Test & Measurement / Industrial
Trade Name/Model No.: IQS-1500
Calibration Power Meter
Standard(s) to which Conformity is Declared:
EN 61010-1:2001 Safety Requirements for Electrical Equipment for Measurement,
Control, and Laboratory Use, Part 1: General Requirements.
EN 61326:1997 +A1:1998
+A2:2001
Electrical Equipment for M easurement, Control and Laboratory
Use - EMC Requirements
EN 55022: 1998 Limits and Methods of Measurement of Radio Disturbance
Characteristics of Information Technology Equipment.
I, the undersigned, hereby declare that the equipment specified above conforms to the above Directive and Standards.
Manufacturer
Signature:
Full Name: Stephen Bull, E. Eng
Position: Vice-President Research and
Development
Address: 400 Godin Avenue, Quebec (Quebec),
Canada, G1M 2K2
Date: January 7, 2002
DECLARATION OF CONFORMITY
viii IQS-1100/IQS-1500
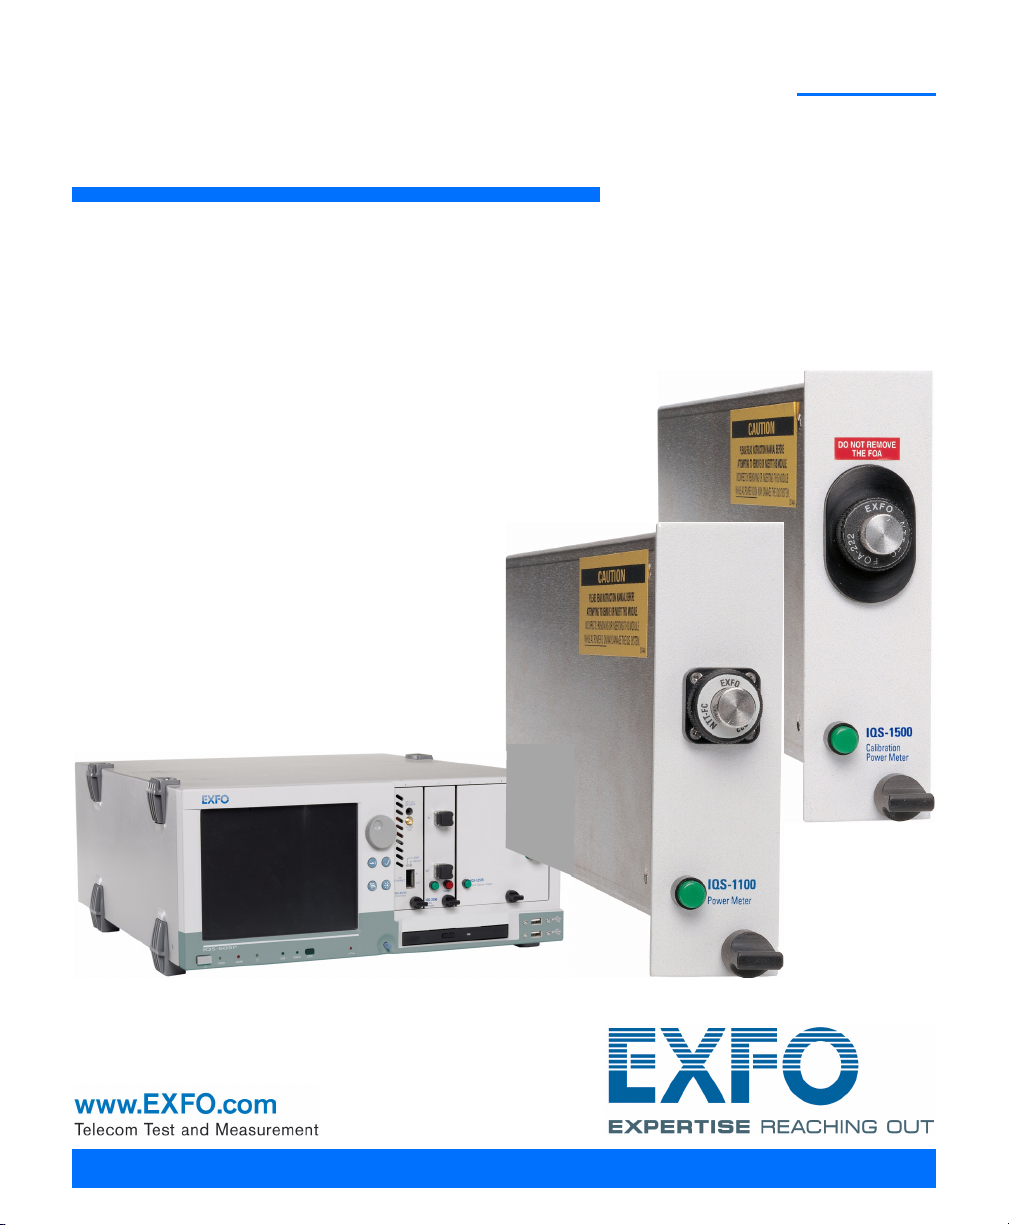
Page 9
1 Introducing the
Power Meter
IQS-1100
Optical
detector port
LED push
button
Retaining
screw knob
IQS-1100/IQS-1500 Power
Meters
Designed for the IQS platforms, the IQS-1100/IQS-1500 Power Meters can
help you perform specific power measurements according to your needs.
Main Features
The IQS-1100 Power Meter is offered with the following detector
configurations:
³ High-power germanium
³ Indium gallium arsenide (InGaAs)
The IQS-1100 Power Meter has a high resolution, excellent linearity and
provides accurate power measurements over a high dynamic range.
Power Meters 1
Page 10
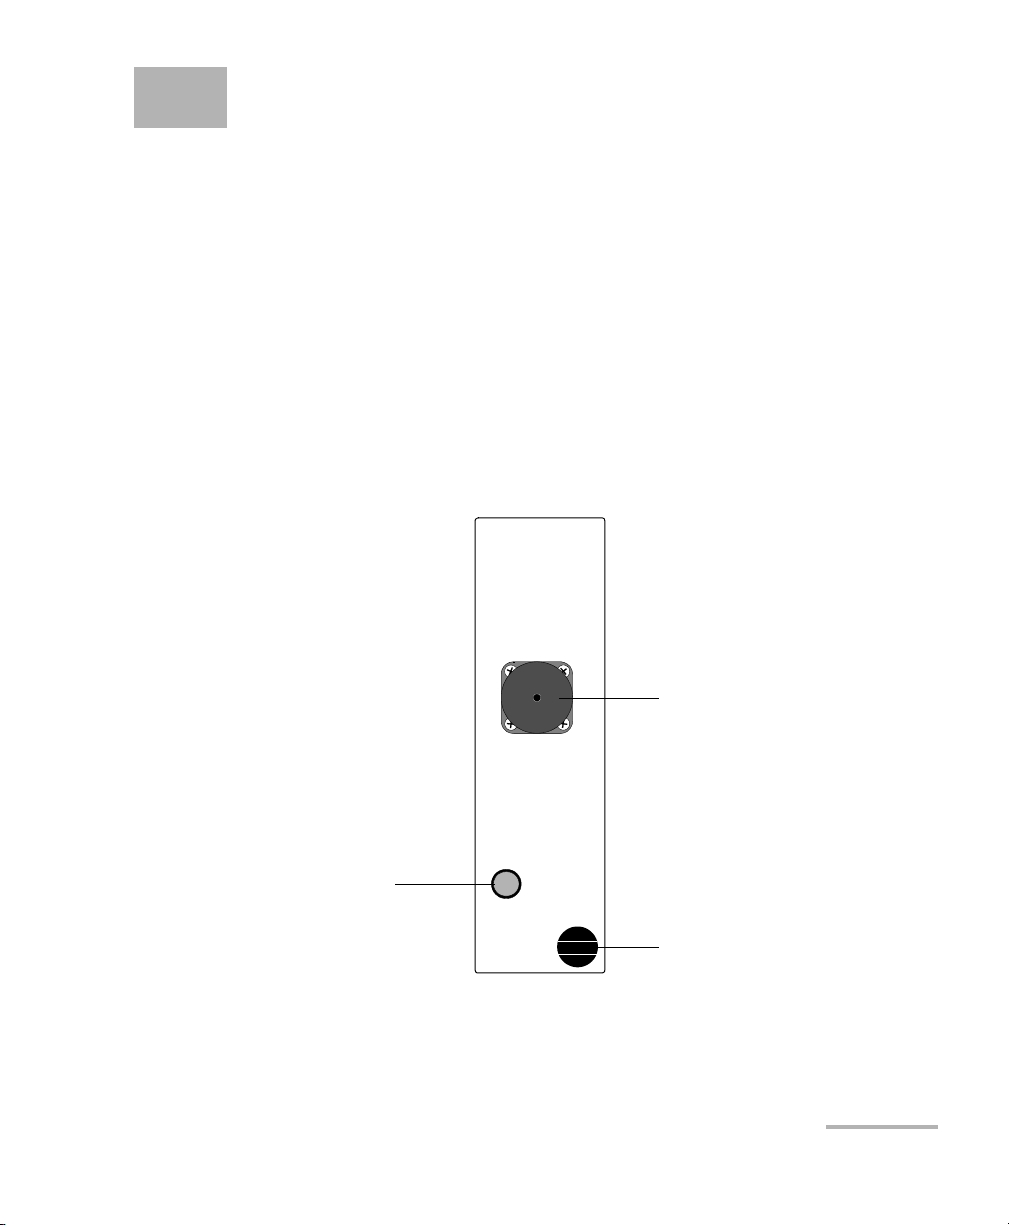
Introducing the IQS-1100/IQS-1500 Power Meters
Optical
detector port
LED push
button
E
X
F
O
N
T
T
-
F
C
F
O
A
-
2
2
2
Calibration
IQS-1500
Power Meter
Retaining
screw knob
Main Features
The IQS-1500 Calibration Power Meter is a germanium power meter
designed to be used with the IQS platforms.
It is designed to offer you highly precise readings, and is used to check
power meter calibration, both in singlemode and multimode. The
application features both a manual and step-by-step procedure for your
calibration testing needs.
2 IQS-1100/IQS-1500
Page 11

Introducing the IQS-1100/IQS-1500 Power Meters
Main Features
The graphical display mode shows all channels on a real-time graph,
which you can analyze afterwards.
The IQS-1100/IQS-1500 Power Meters supports local control (via the
IQS Manager software) and remote control (through GPIB, RS-232, or
Ethernet TCP/IP using SCPI commands or the provided LabVIEW drivers).
For more information, refer to the IQS platform user guide.
The IQS-1500 Calibration Power Meter is offered in two options, depending
on the level of uncertainty desired:
³ ±2 to 3%
³ ≤ ± 0.9 % at 3 λ, when calibrated at NIST
Power Meters 3
Page 12

Introducing the IQS-1100/IQS-1500 Power Meters
Typica l A p p l i cations
Typical Applications
Your power meter is suitable for numerous applications, including the
following:
³ Insertion loss of passive components in the production environment
³ Component and system monitoring
³ Source stability characterization
³ Absolute power measurements
³ Multicomponent testing
³ Remote monitoring and alarm activation
³ WDM component testing
³ Multiport coupler testing
³ Linearity verification
³ Power meter verification
³ Periodic multichannel monitoring
³ Power meter calibration (IQS-1500)
4 IQS-1100/IQS-1500
Page 13

Introducing the IQS-1100/IQS-1500 Power Meters
Conventions
Conventions
Before using the product described in this manual, you should understand
the following conventions:
WARNING
Indicates a potentially hazardous situation which, if not avoided,
could result in death or serious injury. Do not proceed unless you
understand and meet the required conditions.
CAUTION
Indicates a potentially hazardous situation which, if not avoided,
may result in minor or moderate injury. Do not proceed unless you
understand and meet the required conditions.
CAUTION
Indicates a potentially hazardous situation which, if not avoided,
may result in component damage. Do not proceed unless you
understand and meet the required conditions.
IMPORTANT
Refers to information about this product you should not overlook.
Power Meters 5
Page 14

Page 15

2 Safety Information
Your power meter does not contain laser components in itself. However,
you will be using it with light sources.
WARNING
Do not install or terminate fibers while a light source is active.
Never look directly into a live fiber and ensure that your eyes are
protected at all times.
WARNING
Use of controls, adjustments and procedures for operation and
maintenance other than those specified herein may result in
hazardous radiation exposure or impair the protection provided by
this unit.
Power Meters 7
Page 16

Page 17
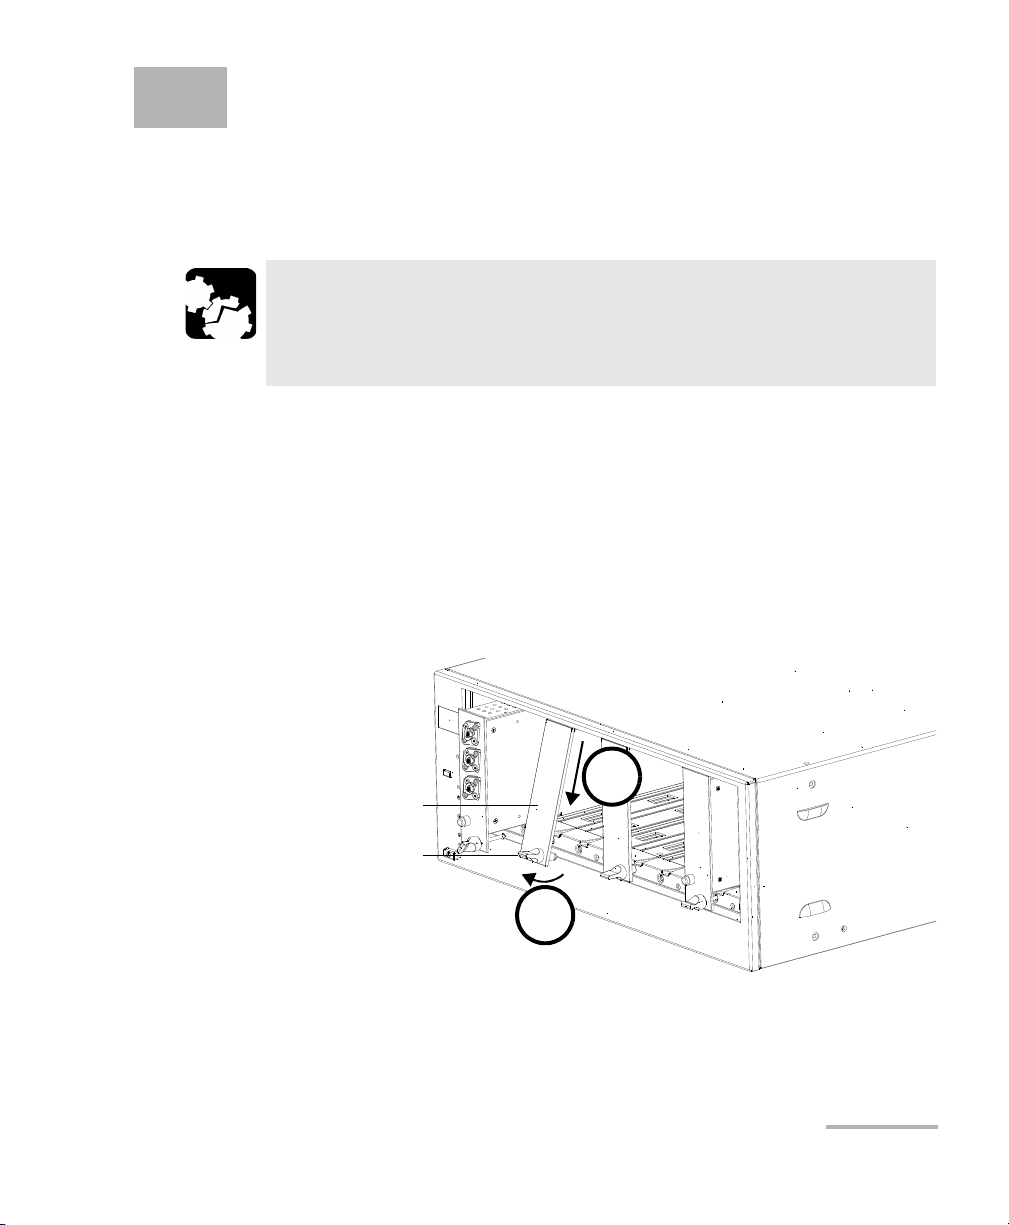
3 Getting Started with Your
Retaining screw
knob
Protective cover
2b
2a
Power Meters
Inserting and Removing Test Modules
CAUTION
Never insert or remove a module while the controller unit and its
expansion units are turned on. This will result in immediate and
irreparable damage to both the module and unit.
To insert a module into the controller or expansion unit:
1. Exit IQS Manager and turn off all your units.
2. Remove the protective cover from the desired unused module slot.
2a. Pull the retaining screw knob firmly towards you and release the
bottom of the cover.
2b. Gently pull the top of the protective cover downwards, to remove
it from the unit grooves.
3. Position the module so that its front panel is facing you and the top and
bottom protruding edges are to your right.
Power Meters 9
Page 18
Getting Started with Your Power Meters
Retaining screw
Retaining screw knob
Protruding edges
(right side of module)
5
6
Inserting and Removing Test Modules
4. Insert the protruding edges of the module into the grooves of the unit’s
module slot.
5. Push the module all the way to the back of the slot, until the retaining
screw makes contact with the unit casing.
6. While applying slight pressure to the module, turn the retaining screw
knob (located at the bottom of the panel) clockwise until the knob is
horizontal.
This will secure the module into its “seated” position.
10 IQS-1100/IQS-1500
Page 19
Getting Started with Your Power Meters
Retaining screw knob
Inserting and Removing Test Modules
The module is correctly inserted when its front panel is flush with the front
panel of the controller or expansion unit.
When you turn on the controller unit, the startup sequence will
automatically detect your module.
Note: You can insert IQ modules into your controller or expansion unit; the
IQS Manager software will recognize them. However, the
IQS-1100/IQS-1500 locking mechanism (retaining screw) will not work for
IQ modules.
To remove a module from your controller or expansion unit:
1. While pulling gently on the knob, turn it counterclockwise until it stops.
The module will slowly be released from the slot.
Power Meters 11
Page 20
Getting Started with Your Power Meters
YES
NO
Retaining screw
knob
Connector
Inserting and Removing Test Modules
2. Place your fingers underneath the module or hold it by the retaining
screw knob (NOT by the connector) and pull it out.
CAUTION
Pulling out a module by a connector could seriously damage both
the module and connector. Always pull out a module by the
retaining screw knob.
3. Cover empty slots with the supplied protective covers.
3a. Slide the top of the protective cover into the upper grooves of the
unit.
3b. Snap the cover into place by pushing the retaining screw knob.
Failure to reinstall protective covers over empty slots will result in
ventilation problems.
12 IQS-1100/IQS-1500
CAUTION
Page 21
Getting Started with Your Power Meters
Highlighted module
(white background)
Starting the Power Meters Application
Starting the Power Meters Application
Your IQS-1100/IQS-1500 Power Meters module can be configured and
controlled from its dedicated IQS Manager application.
Note: For details about IQS Manager, refer to the IQS platform user guide.
To start the application:
1. From the Current Modules function tab select the module to use.
It will turn white to indicate that it is highlighted.
2. Click Start Application.
OR
Press the green LED push button on the front of the corresponding
module.
You can also double-click its row.
Power Meters 13
Page 22
Getting Started with Your Power Meters
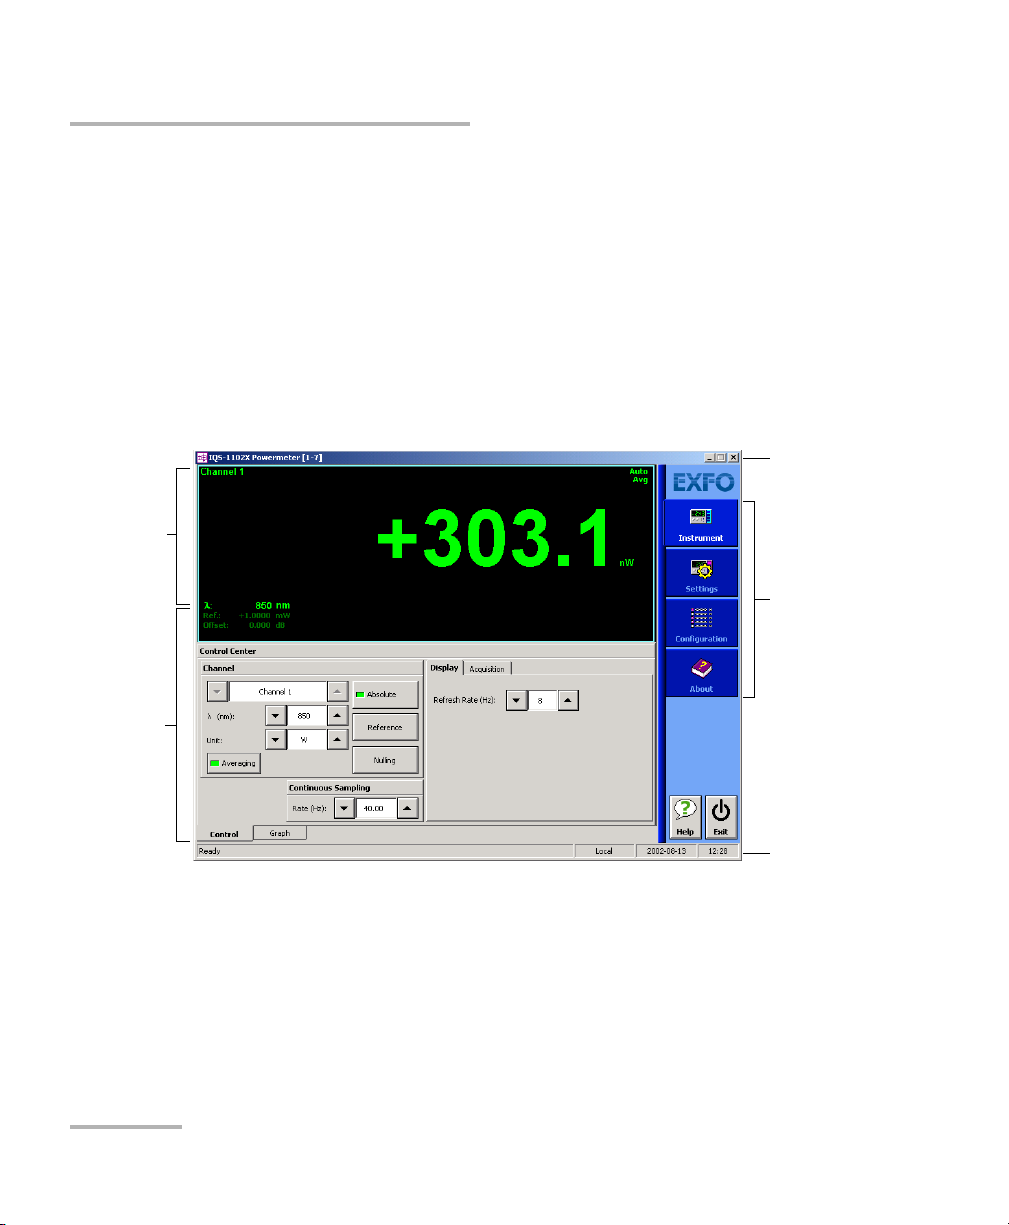
Data
display
Control
Center
Title bar
Function
tabs
Status bar
Starting the Power Meters Application
Note: Pressing the LED push button will not activate or turn on the module.
Note: To start the corresponding monitor window at the same time, click Start
App. & Monitor. The window opens on the Monitors function tab.
The main window (shown below) contains all the commands required to
control the Power Meters:
IQS-1100
14 IQS-1100/IQS-1500
Page 23
Getting Started with Your Power Meters
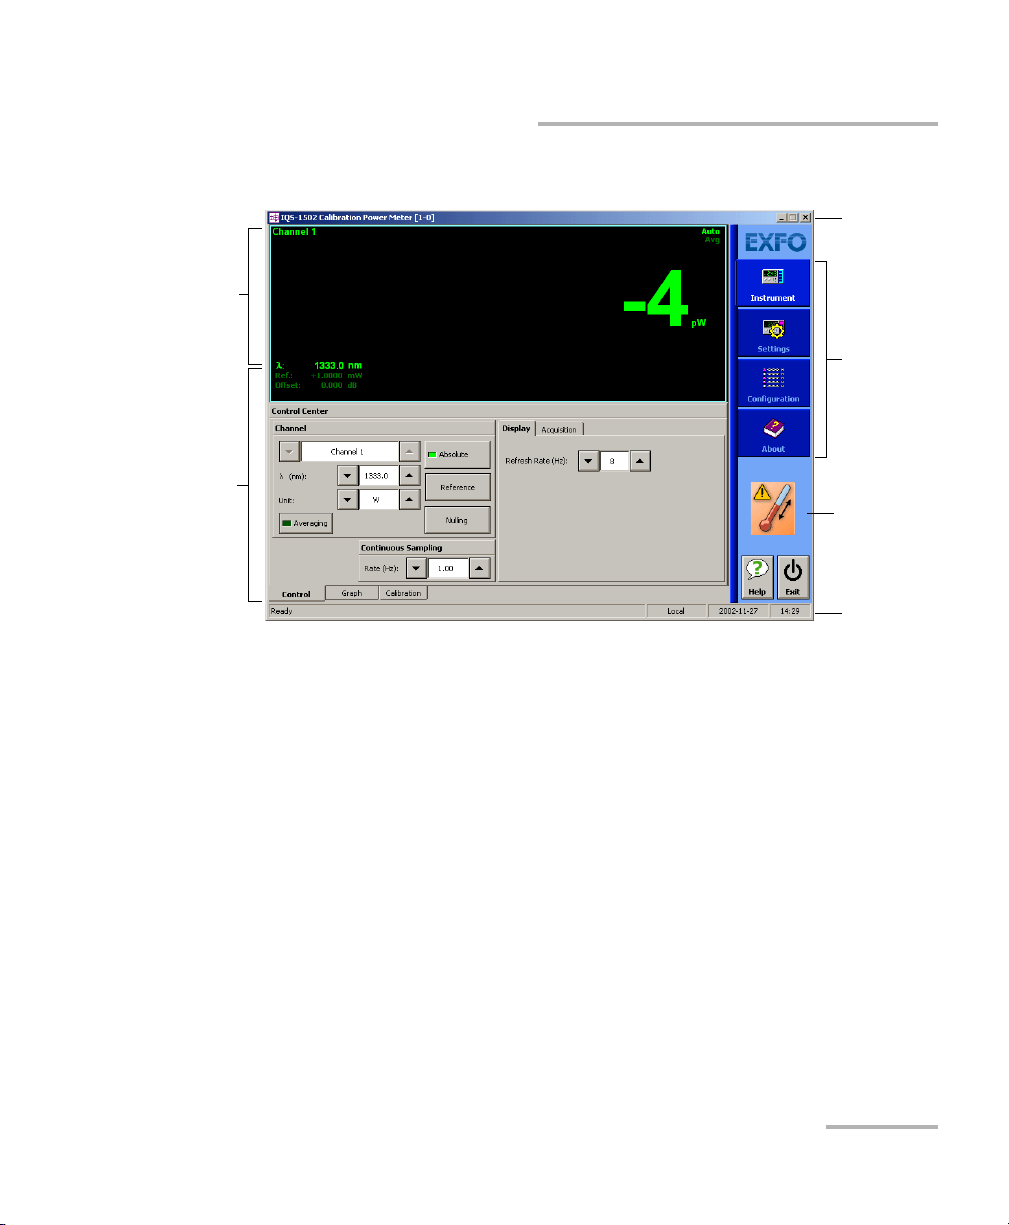
Data
display
Control
Center
Title bar
Function
tabs
Status bar
Warmup
period
indicator
Starting the Power Meters Application
IQS-1500
When you start the IQS-1500 Calibration Power Meter application, you will
notice a thermometer icon under the function tabs. This is the warmup
period indicator; it will remain on until the initial warmup time is over
(approximately 15 minutes).
If the external temperature fluctuates outside the normal operation
temperature, the thermometer icon will reappear until the temperature is
back within the required range (23
o
C ± 5 oC).
You can still perform measurements while the icon is present, but EXFO
recommends postponing critical measurements until the warmup period
is over, as you might not benefit from the maximum stability and precision
your power meter can offer.
Power Meters 15
Page 24

Getting Started with Your Power Meters
Slot number in which module is inserted
(0 identifies first slot)
Controller unit or expansion unit (1 to 999) housing
the module
[ 999 – 1 ]
Current date and timeModule/unit status
Local: Module controlled locally only.
Remote: Module controlled remotely, but
local commands can also be used.
Lockout: Module controlled remotely only.
Control mode
Starting the Power Meters Application
Title Bar
The title bar is located at the top of the main window. It displays the
module name and its position in the controller or expansion unit. The
module position is identified as follows:
Status Bar
The status bar, located at the bottom of the main window, identifies the
operational status of the IQS-1100/IQS-1500 Power Meters.
For more information about automating or remotely controlling the
IQS-1100/IQS-1500 Power Meters, refer to your platform user guide.
16 IQS-1100/IQS-1500
Page 25
Getting Started with Your Power Meters
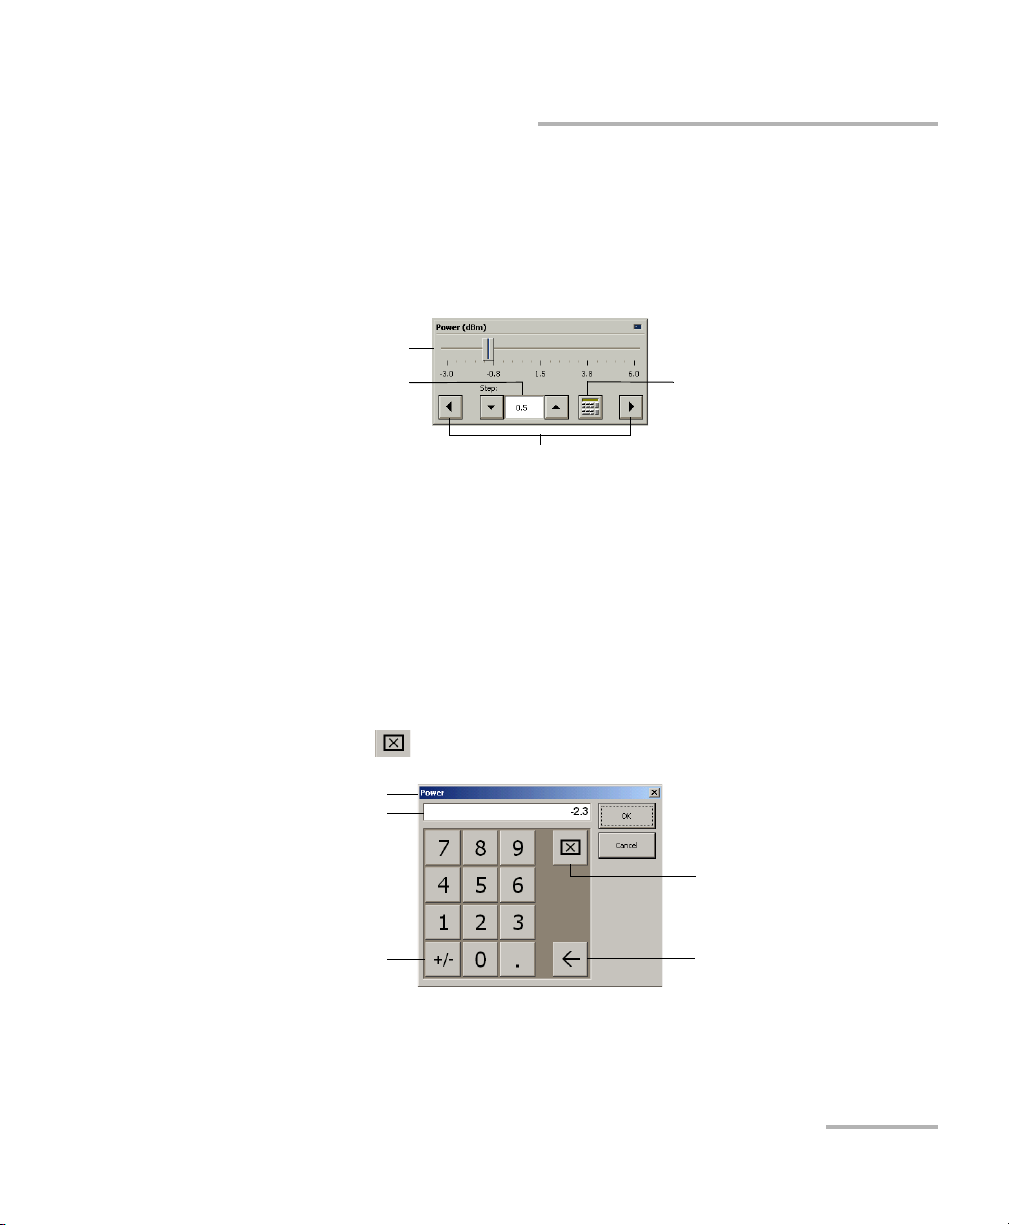
Numeric box
button
Fine-tuning
box
Slider
Navigation buttons
Parameter identification
Toggle button
Backspace button
(to correct a value)
Clear button
Entry display
Entering Values Using Sliders and Numeric Boxes
Entering Values Using Sliders and Numeric
Boxes
Many parameters in IQS Manager and module applications can be set
using the following tools.
³ Slider: Drag it to the desired value on the scale below.
³ Navigation buttons: Click either buttons to move the slider. The slider
moves by steps corresponding to the number in the fine-tuning box,
which you can change by using the up and down arrow buttons next to
the box. You cannot change the list of fine-tuning values from here.
³ Numeric box: Click it to display the on-screen numeric pad, which you
can use to enter a powe value.
Power Meters 17
To enter a value using the numeric box:
1. Use the button to clear the entry display.
2. Enter the value.
3. Click OK to confirm the value.
Page 26

Getting Started with Your Power Meters
Exiting the Application
Exiting the Application
Closing any application that is not currently being used helps freeing
system memory.
To close the application from the main window:
Click in the top right corner of the main window.
OR
Click the Exit button located at the bottom of the function bar.
To close all currently running applications:
From IQS Manager, click Close All Applications.
18 IQS-1100/IQS-1500
Page 27

4 Setting Up Your Power Meters
You can set the following parameters on your IQS-1100/IQS-1500:
³ Chanel display
³ Wavelength selection and management
³ Measurement unit selection
³ Display resolution
³ Refresh rate
³ Measurement range
³ Saving and recalling configuration
Power Meters 19
Page 28
Setting Up Your Power Meters
Naming Channels
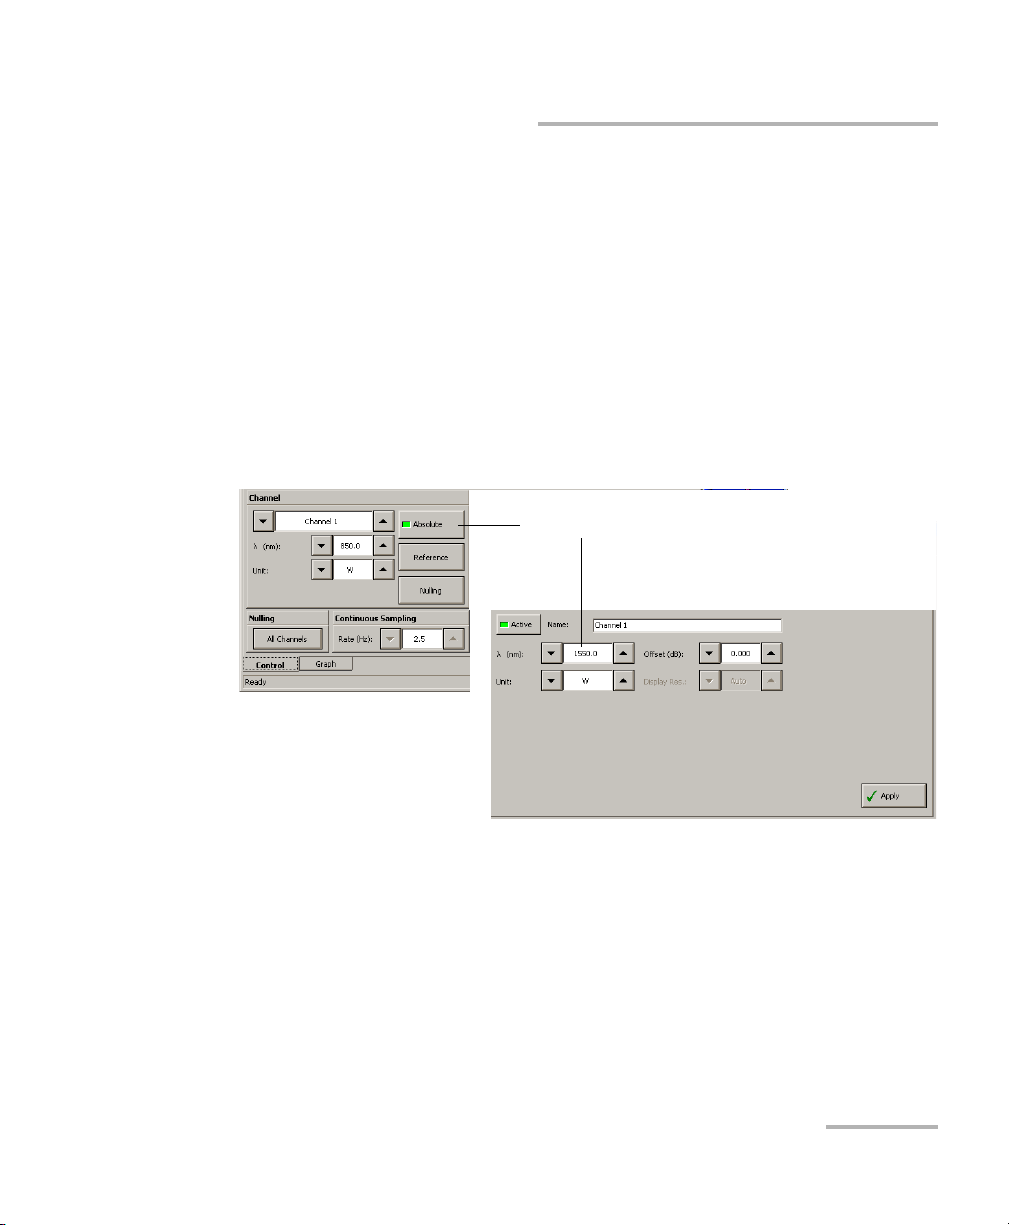
Naming Channels
A user-selected name can be given to each power meter channel. The
channel name appears in the main window. Naming individual channels is
particularly useful when you need to display more than one power channel
at the same time, especially in Monitor Window mode with several optical
power meters displayed simultaneously. The name should be as
self-explanatory as possible (for example, Power-Fiber 3).
To enter a channel name:
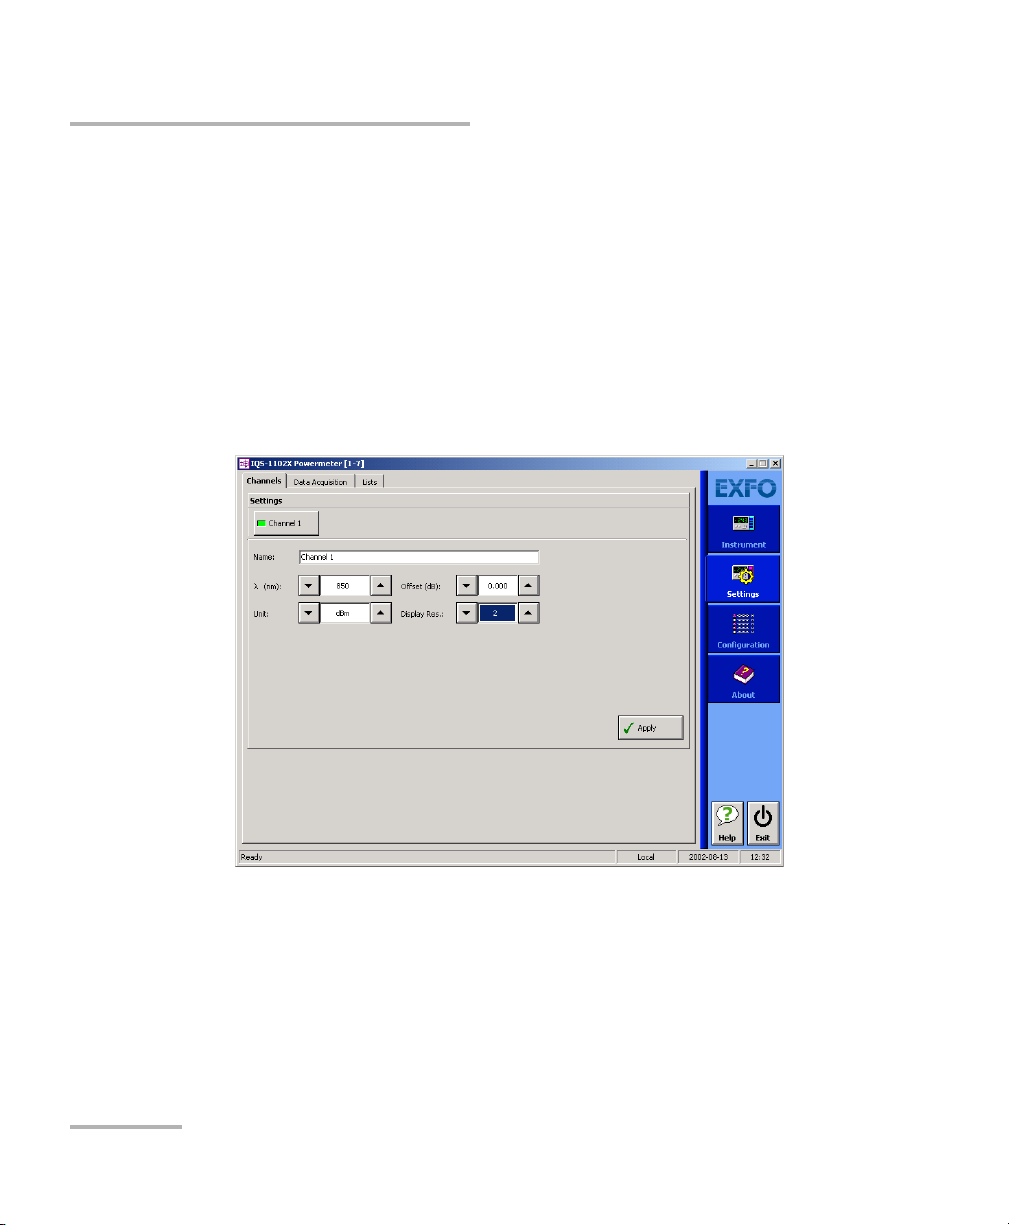
1. Click the Settings function tab.
2. Type in a self-explanatory name in the Name box.
3. Click Apply to confirm your new setting.
20 IQS-1100/IQS-1500
Page 29
Setting Up Your Power Meters
Wavelength list
Selecting the Wavelength
Selecting the Wavelength
When taking accurate measurements, your power meter must be set to
the correct wavelength to compensate for the photodetector responsivity
at the incident wavelength. Ideally, the power meter’s wavelength should
be set as close as possible to that of the optical source being used.
The wavelength must be selected from the wavelength list. To set the
wavelength list, see Managing Wavelength Lists on page 22.
To select the wavelength (either from the Instrument or Settings
function tab):
1. Select the wavelength using the arrow buttons next to the λ list.
2. If you are in the Channels tab of the Settings function tab, click Apply
to confirm your new setting.
Power Meters 21
Page 30
Setting Up Your Power Meters
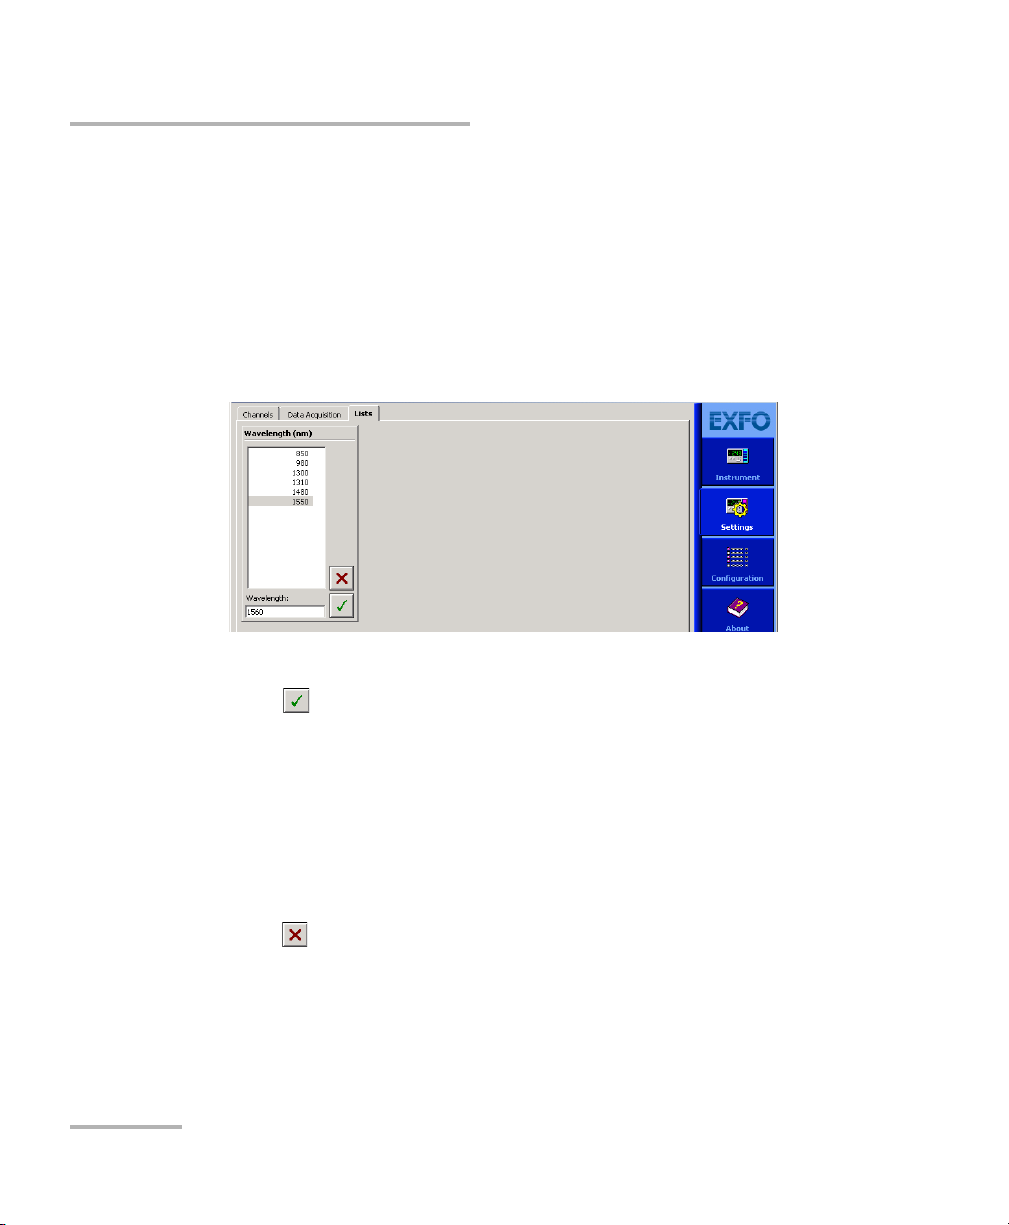
Managing Wavelength Lists
Managing Wavelength Lists
The wavelengths you want to use with your IQS-1100/IQS-1500 must be
entered in the Wavelengt h list. Please refer to the Certificate of
Compliance supplied with your power meter for information on the
wavelength range.
To add a wavelength to the list:
1. From the Settings function tab, select the Lists tab.
In the New Value list, enter the wavelength value to be added.
2. Click to confirm the new wavelength.
Note: A warning message is displayed if the new wavelength is not within the
power meter’s wavelength range.
To delete a wavelength from the list:
1. From the Settings function tab, click the List tab.
2. From, the Wa v e l e ngth list, select the wavelength to be deleted.
3. Click to confirm the operation.
Note: It is not possible to delete a wavelength that is currently being used.
22 IQS-1100/IQS-1500
Page 31

Setting Up Your Power Meters
Unit list
Selecting the Measurement Unit
Selecting the Measurement Unit
Power measurements can be displayed in dB, dBm, W, or W/W (the latter
indicating the ratio between the power received and the reference for the
current wavelength and channel). When W or W/W is selected, the
software automatically selects W units (pW, nW, μW, mW), depending on
the measured power and sensitivity of the detector.
When a relative unit is selected (dB or W/W), the most recent reference
value used will become the current reference value.
To select the measurement unit (either from the Instrument or
Settings function tab):
1. Use the arrow buttons next to the Unit list to change the value.
2. click Apply to confirm your new setting.
Power Meters 23
Page 32

Setting Up Your Power Meters
Setting the Display Resolution
Setting the Display Resolution
Depending on the required resolution and operating power level, 0, 1, 2, 3,
or 4 digits can be displayed after the decimal point. When the auto setting
is selected, the display resolution is determined by the power level being
measured.
To select the display resolution of a power measurement
expressed in dB or dBm:
1. Click the Settings function tab, then click the Channels tab.
2. Use the arrow buttons to select the value in the Display Res. list.
If you have previously selected watts as units, the Display Res. list will
be grayed out (as illustrated above).
3. Click Apply to confirm your new setting.
Note: When W or W/W is selected, the display resolution changes to Auto (the
appropriate W unit will be used according to the power of the signal
detected). It is then impossible to access the display resolution list.
24 IQS-1100/IQS-1500
Page 33

Setting Up Your Power Meters
Setting the Refresh Rate
Setting the Refresh Rate
This function allows you to define the refresh rate of the power readings on
the display. The refresh rate is the number of times per second that a new
power measurement will be displayed on the screen. The refresh rate
applies to all channels when using a multichannel power meter.
To set the refresh rate:
1. From the Instrument tab, select the Display tab.
2. Use the arrow buttons to select the refresh rate you want to use.
Note: The refresh rate can be faster or slower than the sampling rate; however,
only a refresh rate slower than the sampling rate will have an effect.
Power Meters 25
Page 34

Setting Up Your Power Meters
To save parameters being used
just before shutting down,
overwriting the previous file.
To always use the last saved
parameters when starting.
Saving and Recalling Configurations
Saving and Recalling Configurations
Once you have set the IQS-1100/IQS-1500 Power Meters parameters, you
can save your custom configuration and recall it at any time. You can also
recall the factory-defined settings.
Saved configurations include all parameters set in the Control Center
(Instrument function tab) and in the Settings function tab (if present).
To save a configuration:
1. Select the Configuration function tab.
2. In the Current Module Configuration panel, enter the name you wish
to use for your configuration file.
It will be saved in
D:\IQS Manager\Configuration Files\(your_module)\.
3. Click Save.
26 IQS-1100/IQS-1500
Page 35

Setting Up Your Power Meters
Saving and Recalling Configurations
To recall a configuration:
1. Select the Configuration function tab.
2. Click Open.
3. Select the configuration file you wish to recall and confirm your action.
You are returned to the application and the new parameters are set.
To revert to factory settings:
1. Select the Configuration function tab.
2. Click the Reset Module to Factory Settings button.
IMPORTANT
Reverting to the factory settings will interrupt any module
operation in progress.
IMPORTANT
The operation may take a few seconds to complete.
Note: Reverting to factory settings will not change the name given to the
channels.
Power Meters 27
Page 36

Page 37

5 Preparing Your Power Meters
for a Test
Cleaning and Connecting Optical Fibers
IMPORTANT
To ensure maximum power and to avoid erroneous readings:
³ Always clean fiber ends as explained below before inserting
them into the port. EXFO is not responsible for damage or
errors caused by bad fiber cleaning or handling.
³ Ensure that your patchcord has appropriate connectors. Joining
mismatched connectors will damage the ferrules.
To connect the fiber-optic cable to the port:
1. Clean the fiber ends as follows:
1a. Gently wipe the fiber end with a lint-free swab dipped in isopropyl
alcohol.
1b. Use compressed air to dry completely.
1c. Visually inspect the fiber end to ensure its cleanliness.
2. Carefully align the connector and port to prevent the fiber end from
touching the outside of the port or rubbing against other surfaces.
If your connector features a key, ensure that it is fully fitted into the
port’s corresponding notch.
3. Push the connector in so that the fiber-optic cable is firmly in place,
thus ensuring adequate contact.
If your connector features a screwsleeve, tighten the connector
enough to firmly maintain the fiber in place. Do not overtighten, as this
will damage the fiber and the port.
Note: If your fiber-optic cable is not properly aligned and/or connected, you will
notice heavy loss and reflection.
Power Meters 29
Page 38

Preparing Your Power Meters for a Test
Nulling Offsets
IMPORTANT
To obtain optimal results with your IQS-1500 Calibration Power
Meter, always use the FOA and patchcord included with the unit.
Nulling Offsets
Temperature and humidity variations affect the performance of electronic
circuits and optical detectors, which can offset measurement results. To
compensate for this offset, the unit is equipped with an offset nulling
function.
Your unit is designed not to require offset nulling under normal operation,
but you should perform it whenever environmental conditions change
significantly or when measuring very low power values.
Your IQS-1100/IQS-1500 Power Meters automatically performs nulling of the
offset each time you turn it on.
However, you might need to perform a manual nulling of the offset when
environmental conditions change significantly or when you are measuring
very low power.
Note: The manual nulling offset is valid for the current test session only; it no
longer applies when you turn off your power meter. The next time you turn
it on, the automatic offset nulling is performed again. You will achieve
better results if you perform the manual offset nulling at a temperature
around 23
o
C after a running period of 45 minutes.
IMPORTANT
Light must not reach the detector when performing an offset
nulling operation. Always use a protective screw cap. Do not use a
soft rubber cover
30 IQS-1100/IQS-1500
Page 39

Preparing Your Power Meters for a Test
Nulling Offsets
To perform an offset nulling:
1. Install the protective cap over the detector port.
2. Under Channel, click the Nulling button. A message prompts you to
ensure that the detector cap is properly installed.
3. Select OK to perform the offset nulling, or Cancel to exit.
A red message appears beneath the power value.
Power Meters 31
Page 40

Page 41

6 Measuring Power
Power measurements can be displayed in two ways:
³ absolute
³ relative
It is also possible to add an offset value to your power measurement.
Displaying Absolute Power
When in absolute power, measured values are displayed in either dBm or
W units (pW, nW, μW, mW...) and the displayed value represents the
absolute optical power reaching the detector within specified uncertainty.
Power Meters 33
Page 42

Measuring Power
Displaying Absolute Power
To display absolute power:
1. Select the Instrument function tab or the Channels tab of the Settings
function tab (you can use either).
Note: Step 2 is not mandatory, but will help you achieve more precise results.
2. Select the appropriate wavelength by using the arrow buttons next to
the corresponding list.
3. Select the appropriate unit by using the arrow buttons next to the
corresponding list (W or dBm).
4. If you are in the Settings function tab, click Apply to confirm your new
setting.
5. Return to the Instrument function tab and click Absolute to activate
the mode.
An absolute power measurement in negative W units indicates that the
nulling of the offset was improperly done. If this happens, repeat the offset
nulling operation (see Nulling Offsets on page 30).
34 IQS-1100/IQS-1500
Page 43

Measuring Power
Measuring Relative Power
Measuring Relative Power
Power measurements can be displayed as a deviation from an absolute
reference value. The relative power is particularly useful when performing
loss measurements.
Relative power is displayed in dB when the reference value is measured in
dBm. In this case, the value will be either positive or negative, as the actual
measured power is higher or lower than the reference power.
If the reference value is in W, the relative power will be displayed in W/W.
In this case, the relative power is the deviation ratio from the reference and
will always be a positive value (unless operation was improperly done).
To display significant relative power values, it is important to have an
appropriate reference value, which you activate by clicking the Reference
button in the Instrument function tab.
Power Meters 35
Page 44

Measuring Power
Using the Offset Function
Using the Offset Function
The offset function is used when you want to take into account, in the
power displayed, a known gain or loss in the link that is not already
included in the signal reaching the detector.
To enter an offset value:
1. From the Settings function tab, select the Channels tab.
2. From the Offset list, use the arrow buttons to adjust the value.
3. Click Apply to confirm your new setting.
36 IQS-1100/IQS-1500
Page 45

Measuring Power
Averaging Measurements
Averaging Measurements
When the averaging function is enabled on the Power Meters, the eight
most recent measurement samples are used to compute an unweighted
average. This average is displayed as the measured value. You will notice
the AVG marker at the right of the value, indicating that averaging is
enabled.
In the case of the IQS-1100 Power Meter, you can benefit from an extended
absolute power measurement range, up to −100 dBm if the following
conditions are met:
³ You must enable the averaging function.
³ You must have a sampling rate of 0.1 or 0.5 samples per second.
³ You must set the display resolution to Auto (seeSetting the Display
Resolution on page 24 for details).
To toggle between averaged and unaveraged power
measurement:
Click the Averaging button to activate or deactivate it.
Power Meters 37
Page 46

Page 47

7 Performing Acquisitions
You can set a location where the acquisitions will be stored when you do
your tests.
To select a path for storing your acquisitions:
1. From the Settings function tab, select the Data Acquisition tab.
2. Use to select the folder to save your file.
Selecting the Sampling Type
You can perform different types of samplings with your power meter:
³ Continuous sampling signifies that power measurements are
constantly updated on the measurement display for an unlimited time
period. You can select a rate that will optimize instrument flexibility
and measurement stability as well as determine the quantity of data
generated during data acquisition.
³ User Defined sampling signifies that you can enter the rate and the
time units you wish to use. The value you enter in the 1/ list is the
number of time units the acquisition process will use. For example, if
you enter a value of 10, and select seconds as the unit, an acquisition
will be performed once every ten seconds; if you enter a value of 1 and
select seconds as the unit, an acquisition will occur every second, etc.
Power Meters 39
Page 48

Performing Acquisitions
Selecting the Sampling Type
To select a sampling type:
1. From the Settings function tab, select the Data Acquisition tab.
2. Select the sampling type by clicking the corresponding button.
If you select Continuous, select the rate to use with the arrow buttons.
You can also change the continuous sampling rate in the Instrument
function tab in the same manner.
If you select User Defined, select the rate by entering a value in the 1/
list, then select a time unit using the arrow buttons. Remember to click
to confirm your settings.
Note: Use a lower sampling rate with averaging set to active (see Averaging
Measurements on page 37) for greater repeatability when measuring very
low power.
40 IQS-1100/IQS-1500
Page 49

Performing Acquisitions
Selecting the Acquisition Mode
Selecting the Acquisition Mode
You can use three data acquisition modes, regardless of the type of
acquisition you are performing.
³ Timer: the acquisition will last for the length of time you have
previously set.
³ Trigger: the power meter will wait for an incoming trigger signal
before starting its next acquisition.
³ Delay: the power meter will wait for a set length of time between
acquisitions.
Note: You can use one, several or all modes at the same time. If you use both the
trigger and delay modes simultaneously, the power meter will first wait for
the set delay time to elapse, then wait again for the incoming trigger signal.
If you add the timer mode, the acquisitions will be performed during a set
length of time, using both the trigger and delay modes.
In each case, measurements are taken at the selected sampling rate and
saved to a user-specified data file. The size of the data files created during
acquisition is proportional to the sampling rate and duration of the
acquisition. Higher sampling rates and longer durations generate larger
quantities of data.
Power Meters 41
Page 50

Performing Acquisitions
Selecting the Acquisition Mode
To select the acquisition mode:
1. From the Settings function tab, select the Data Acquisition tab.
2. From Mode, select the desired mode or combination of modes.
Setting Up Timed Acquisition Duration
A timed acquisition starts when you start the process, and continues for the
time you have previously specified.
To set the duration for your acquisition:
Click inside the Timer edit box of the Data Acquisition tab and enter the
value (or use the arrow buttons next to the list to adjust it).
If you are using the numeric box, enter the value in seconds
(for example, 120 seconds if you want to enter two minutes).
42 IQS-1100/IQS-1500
Page 51

Performing Acquisitions
Selecting the Acquisition Mode
Setting Up Delayed Acquisition Delay
Delayed acquisition starts at a specified time after you start the process,
and continues for the time you have previously specified if you have
selected a combination of Timed and Delayed acquisition types.
To set a delay for your acquisition:
1. From the Data Acquisition tab, locate Delay.
2. Click inside the corresponding edit box and enter the value using the
numeric box, or use the arrow buttons to adjust the value.
If you are using the numeric box, enter the value in seconds
(for example, 120 seconds if you want to enter two minutes).
Power Meters 43
Page 52

Performing Acquisitions
Selecting the Acquisition Mode
Setting Trigger Acquisition Parameters
Conditional data acquisition can be performed using a triggered
acquisition, meaning that data recording begins when a specified
condition is met. Different trigger conditions are available, which are
explained in the following table, where A and/or B represent the channel
on which the condition is to be met, and x and/or y represent the desired
power level threshold.
Trigger Description
A > x Acquisition will start when measured power is greater
A < x Acquisition will start when measured power is lower
A > x AND A < y Acquisition will start when measured power in
A or B < x Acquisition will start when power in either channel A
than the specified x value.
than the specified x value.
channel A is inside the interval set by the values
xandy.
or channel B is lower than the specified x value.
x<A or B<y
(multichannel
power meters
only)
A<B
(multichannel
power meters
only)
Note: The trigger defines the condition for starting data acquisition. Once begun,
acquisitions will continue for the specified duration, regardless of the
measured power.
44 IQS-1100/IQS-1500
Acquisition will start when measured power in
channel A goes over a specified value (A > x).
OR
Acquisition will start when measured power in
channel B falls under a specified value (B < y).
Acquisition will start when measured power of
channel A is lower than measured power of channel B.
Page 53

Performing Acquisitions
Selecting the Acquisition Mode
To set up the power level trigger condition:
1. From Trigger of the Data Acquisition tab, use the arrow buttons next
to the Type list to select the desired condition.
Note: The X and Y values are displayed in the currently selected unit.
2. Enter the appropriate X or Y values in the corresponding lists.
3. Click to confirm your setting.
Power Meters 45
Page 54

Performing Acquisitions
Starting the Acquisition
Starting the Acquisition
Once you have set your parameters, you can start the acquisition.
To start an acquisition:
1. Select the Instrument function tab.
2. From the Acquisition tab, press Start.
Data acquisition can be terminated at any time by clicking Stop. The
accumulated data is available in the data file.
If you want to start a graph acquisition at the same time, you must enable
the Graph function in the same tab (for more information on the graph
acquisition and visualization mode, see Performing and Analyzing Graph
Acquisitions on page 53).
Note: You cannot activate Graph mode after the acquisition has already been
started.
46 IQS-1100/IQS-1500
Page 55

Performing Acquisitions
Starting the Acquisition
You can also start the acquisition in the Graph tab by clicking the Start
button the same way you would in the Control tab.
IMPORTANT
If you change units on the channel using Relative or Absolute mode
and that you had enabled Graph mode, the Graph and Start
buttons might automatically disable themselves if the resulting
changes are not compatible with the base unit used in the graph.
To enter a name for your acquisition, type it in the File box of Data
Acquisition File. The default extension is .tra.
Power Meters 47
Page 56

Performing Acquisitions
Consulting Acquired Data
Consulting Acquired Data
Once you have acquired data, it is possible to view the results in
IQS Manager.
To view data previously acquired:
1. In IQS Manager, select the Work on Results (Offline) function tab.
2. Click the tab, then click the button corresponding to the application for
which you want to see information.
48 IQS-1100/IQS-1500
Page 57

Performing Acquisitions
Consulting Acquired Data
3. In the viewer, retrieve the corresponding file using the button.
³ To view the details pertaining to the channels used for the
acquisition, select the General tab.
Power Meters 49
Page 58

Performing Acquisitions
Consulting Acquired Data
³ To view your acquisition data, select the Data tab.
50 IQS-1100/IQS-1500
Page 59

Performing Acquisitions
Consulting Acquired Data
³ To view the graph corresponding to your acquisition data, select
the Graph tab.
To move along the time scale, use the arrow buttons.
The single arrow buttons will move by increments or decrements
representing 10 % of the current trace scale value.
The double arrow buttons will move by increments or
decrements of the current screen display (for example, the 10 to
40 seconds display would become 40 to 70 seconds in the figure
above).
To center on a specific value, type it in the Set position time scale
to box.
The other buttons and tabs are identical to those found in your
power meter application’s Graph tab. See Performing and
Analyzing Graph Acquisitions on page 53 for details.
Power Meters 51
Page 60

Performing Acquisitions
Consulting Acquired Data
If you want to save your acquisition file as a text file, use the Export button
located on the upper right-hand corner of the window. Save the file as you
would any other text file, then confirm your choice. You can now view your
data in any word processing program.
Note: If your acquisition file is too large for the viewer, you will be notified by a
pop-up message. Only the first part of your acquisition file will be displayed
in the viewer; to see complete results, you must export the file and view it in
a word processing program.
To exit the window and return to IQS Manager, click Exit.
52 IQS-1100/IQS-1500
Page 61

8 Performing and Analyzing
Graph Acquisitions
The Graph mode of your power meter allows you to view your acquisition
as it is performed, and analyze it once it has been completed.
Setting Up Graph Parameters
Before acquiring data, you should set the parameters that will help you
achieve a better viewing afterwards.
To select which type of display to use during the acquisition:
Go to the Settings tab of the Graph Center and click the button
corresponding to your choice:
³ Continuous Scroll: The display will scroll along to the right as the
acquisition progresses.
³ Wraparound: Once the acquisition has reached the end of the screen
to the right, it will begin on the left again and cover the previous trace.
Power Meters 53
Page 62

Performing and Analyzing Graph Acquisitions
Setting Up Graph Parameters
To change the base unit of the acquisition (dBm or watts):
Use the arrow buttons in the Settings tab to toggle between them.
If you set the base unit before performing an acquisition, you will have the
choice between W, dBm, dB, and W/W. If you change the unit while an
acquisition is in progress, you will only have the choice between absolute
units (dBm or W) or relative units (dB or W/W), depending on your base
unit at the start of the acquisition.
If you have selected either W or W/W as the base unit, the Displayed Unit
list becomes available, and you can change it during the acquisition using
the arrow buttons, depending on the sub-unit that suits the current
situation. For example, if at the beginning of the acquisition, no light goes
through, the display will be in pW. When light goes through, you might
want to switch to μW or nW to get a more appropriate reading.
To change the displayed time scale:
Use the arrow buttons in the Settings tab to increase or decrease the
value. The display will change accordingly.
IMPORTANT
If you change the base unit after acquiring data, you will lose the
graph you have obtained, as well as the data acquired. Ensure you
set your values before acquiring data.
IMPORTANT
If you change the base unit, the channels in the Display tab will
automatically change when you switch from a relative unit to an
absolute unit or vice versa.
To show or hide the grid in the background of the graph display:
Click the corresponding button in the Settings tab.
54 IQS-1100/IQS-1500
Page 63

Performing and Analyzing Graph Acquisitions
Printing Graph Results
Printing Graph Results
Once you have acquired data and displayed a graph, it is possible to print
out this information.
To print your graph results:
Click in the Graph Center.
Use the arrow buttons to select the printer to use. You can enter a title for
your document in the corresponding box. The Print Graphic button will
start the printout, the Cancel button will bring you back you to the Graph
tab, and the Set As Default button will keep the selected printer for future
printouts.
The button will be disabled if no graph is displayed.
Clearing Graph Display
The graph display will automatically clear itself when you start a new
acquisition. However, you can also clear the graph display manually.
To clear the graph display:
Click in the Graph Center.
Note: Changing items such as the units or display options will also clear the graph
display. Ensure that you have set your parameters beforehand.
Power Meters 55
Page 64

Performing and Analyzing Graph Acquisitions
Using the Zoom Function
Using the Zoom Function
Once you have performed an acquisition, you can use various zooming
tools to help you analyze it.
To access and use the zoom tools:
Click the Zoom Control tab of the Graph Center.
³ allows you to enlarge a precise portion of the trace by dragging a
zone over it. Simply drag the cursor to cover the area you wish to see
and release the mouse button to enlarge the area.
³ allows you to enlarge a precise portion of the trace horizontally,
meaning that the time scale will enlarge and the power scale will
remain the same.
³ allows you to enlarge a precise portion of the trace vertically,
meaning that the power scale will enlarge and the time scale will
remain the same.
³ allows you to enlarge the trace display at the precise location
where you click. Click the area repeatedly until you reach the desired
zoom factor.
³ allows you to reduce the trace display at the precise location
where you click. Click the area repeatedly until you reach the desired
zoom factor.
56 IQS-1100/IQS-1500
Page 65

Performing and Analyzing Graph Acquisitions
Using the Zoom Function
³ allows you to move around the trace to view areas not currently
displayed. You can pan upwards and downwards, as well as to the left
and right.
Note: You can only pan to the right and left if the time scale length is larger than
the portion displayed on the screen.
To revert to the original trace size, click in the Graph Center.
Power Meters 57
Page 66

Performing and Analyzing Graph Acquisitions
Displaying and Moving Markers
Displaying and Moving Markers
Once you have acquired a trace, you can use markers to take precise
measurements.
To enable the markers:
1. Select the channel you want to use from the Channel pull-down list in
the Markers tab.
2. Click the On button.
The two markers, A and B, will appear on the display.
You can move the markers to the desired position by clicking them and
dragging them to the left or right; or you can use the arrow buttons next to
each marker to move them. The markers will move automatically to the
next available point when you move them either by dragging or with the
arrow buttons.
Note: If you have enabled the markers and you move to another tab (than the
Zoom tab), the markers will still be visible, but you cannot move them. You
must return to the Markers tab to do so.
You will notice that the difference between the markers (B − A) is
automatically refreshed on the lower part of the tab as you move the
markers.
58 IQS-1100/IQS-1500
Page 67

9 Calibrating Other Power
Wizard navigation
buttons
Current step
Unavailable
step (in red)
Meters with the IQS-1500
In addition to performing usual power meter functions, your IQS-1500
Calibration Power Meter can be used to calibrate other power meters. This
is performed through a step-by-step wizard.
As you move along the steps, you will notice that the current step is
identified on the left by a circle.
Steps in red are not available at this moment in the calibration process. For
example, the Report step is not available until you have taken
measurements.
To access the Calibration mode:
Select the Calibration tab in the lower part of the Instrument function tab.
To navigate between the wizard steps:
Use the Back, Next, and Cancel buttons at the bottom of the window.
Power Meters 59
Page 68

Calibrating Other Power Meters with the IQS-1500
Selecting the Calibration Option
Selecting the Calibration Option
When you access the Calibration tab of your IQS-1500 Calibration Power
Meter, you can select from three different options.
³ Starting a calibration from scratch
³ Using a template you have previously saved (see Saving a Template
File on page 71 for details)
³ Viewing an existing report file
To select the calibration option:
Select the option button corresponding to your choice.
If you selected View report rile, the different reports are now available;
click the desired file once to select it.
Click Next to proceed to the following step, or to view the report, according
to what you have chosen.
60 IQS-1100/IQS-1500
Page 69

Calibrating Other Power Meters with the IQS-1500
Entering General Calibration Information
Entering General Calibration Information
The General window allows you to enter information pertaining to the
person performing the calibration (the user), the company employing this
person, and details pertaining to the Calibration Power Meter used to
perform the calibration.
Note: This information is kept in memory when using the template option, as
explained in Selecting the Calibration Option on page 60.
Fill in the corresponding information, including the calibration date and
due date. Do not forget to select the power unit to be used by your
Calibration Power Meter.
Once you are done, click Next to continue.
Power Meters 61
Page 70

Calibrating Other Power Meters with the IQS-1500
Entering Calibration Conditions
Entering Calibration Conditions
The Conditions window allows you to define the calibration conditions.
This is also where you enter information pertaining to the source or
sources used in your calibration process, as well as for the environmental
conditions in which the calibration will be performed.
Note: This information is kept in memory when using the template option as
explained in Selecting the Calibration Option on page 60.
To select a source already in the list:
Click it once in the list of available modules.
Since you do not need to enter additional information at this point, the
lower part of the window is grayed out.
Once you have selected the source you want to use, click Next.
62 IQS-1100/IQS-1500
Page 71

Calibrating Other Power Meters with the IQS-1500
To add a source to the list:
1. Click Add.
The lower part of the window becomes available.
Entering Calibration Conditions
2. Enter the information pertaining to the new source, including the
humidity and temperature values.
Note: The humidity and temperature values are the same for all sources in your
list.
3. Click Apply to add the source to the list.
Power Meters 63
Page 72

Calibrating Other Power Meters with the IQS-1500
Entering Calibration Conditions
To modify an already existing source:
1. Select the source you want to modify by clicking it once.
2. Click Modify.
The lower part of the window is now available.
3. Modify the details about this source.
4. Click Apply to confirm your changes.
To remove a source from the list:
1. Select the source from the list by clicking it once.
2. Click Remove.
64 IQS-1100/IQS-1500
Page 73

Calibrating Other Power Meters with the IQS-1500
Entering DUT Information
Entering DUT Information
The DUT window allows you to enter information about the calibrated DUT
(power meter), including details on the DUT (serial number, description,
etc.), on the company owning the DUT, plus any useful comment.
Note: This information is kept in memory when using the template option as
explained in Selecting the Calibration Option on page 60.
The Wav e l e ngth List allows you to enter any wavelength or wavelengths at
which the DUT will be calibrated.
To add a wavelength to the list:
Enter the value in the New Value (nm) box, then click .
To remove a wavelength from the list:
Select it by clicking it once, then click .
Once you have entered the information about the DUT and managed the
wavelength list, click Next to proceed to the next step.
Power Meters 65
Page 74

Calibrating Other Power Meters with the IQS-1500
Entering Calibration Uncertainties
Entering Calibration Uncertainties
The Uncertainties window allows you to enter the values that will be used
for calibration uncertainty calculations.
Note: This information is kept in memory when using the template option as
explained in Selecting the Calibration Option on page 60.
To establish total uncertainty, the components are divided into the
following:
³ The Calibration (Reference) Power Meter uncertainty
³ Type A uncert ainties
³ Type B uncertainties
The Calibration (or Reference) Power Meter uncertainty is provided in the
IQS-1500 Power Meter’s calibration report and must be at a 95 % (2σ)
confidence level. For example, if the confidence level is specified at
68 % (1σ), you must multiply the uncertainty by a factor of 2.
66 IQS-1100/IQS-1500
Page 75

Calibrating Other Power Meters with the IQS-1500
Entering Calibration Uncertainties
Type A uncertainties are characterized by taking a series of measurements
and calculating the standard deviation. The standard deviation of the
calibration factor for the DUT is automatically calculated and displayed in
the Standard Deviation box of the calibration summary (see Viewing
Calibration Summary on page 76).
Type B uncertainties must be half width, U
from −U
to +UBi (in percentage).
Bi
, of a rectangular distribution
Bi
The Source power stability is very important since the calibration is
sequential; that is, measurements are first taken on the IQS-1500
Calibration Power Meter, and then on the power meter under test (DUT).
This first error source can be evaluated by measuring the variation of the
source power on the Calibration Power Meter over the time of calibration
at one wavelength (about 30 seconds).
The Reference Meter spectral sensitivity slope, in %/nm, around the
wavelength of the source influences calibration because of the uncertainty
about the exact knowledge of the source wavelength. If not already
known, the slope can be calculated using the following procedure:
To calculate the reference meter spectral sensitivity slope:
1. With a stable light illuminating the detector, set the IQS-1500 to the
wavelength of the source, for instance, 1550.0 nm, and record the
displayed power, for instance 1.000 mW.
2. Increase the wavelength of the IQS-1500 by the uncertainty of the
wavelength of the source, for instance, if ± 0.1 nm, set 1550.1 nm.
3. Record the second displayed power, for instance, 1.001 mW.
4. Calculate the slope. In this case, the variation is
([1.001−1.000]/1.000)/0.1 nm=1 %/nm; the uncertainty is then 0.1 %.
The DUT spectral sensitivity slope has a similar effect. It can be evaluated
the same way if the spectral resolution of the DUT is also 0.1 nm. If not, an
estimate can be obtained by setting the second wavelength as close as
possible, for instance, 1540 nm. The evaluation will then be less precise,
and judgment is important to have a good estimate.
Power Meters 67
Page 76

Calibrating Other Power Meters with the IQS-1500
Entering Calibration Uncertainties
If a fiber different than the one used for the calibration of the IQS-1500 is
used, a large error can occur, especially because of the connector. Even
though the same fiber is used, the repeatability of the connection on both
power meters must be measured and taken into account.
The Setup reproducibility also has to be measured and recorded.
Movements of the fibers are mainly responsible for this error type.
Note: APC connectors should be avoided at the detector port because of their
sensitivity to polarization.
In addition, any other systematic error may be entered and included in the
total uncertainty calculation.
Type B uncertainty components are assumed to be independent and have
rectangular distributions. The following sources of information may be
helpful in evaluating these Type B uncertainties:
³ Previous measurement data
³ Manufacturer’s specifications
³ Data provided in calibration and other reports
Type A uncertainties are also assumed to be independent, but normally
distributed; therefore, they can be estimated by performing a series of
measurements and calculating a standard deviation.
68 IQS-1100/IQS-1500
Page 77

Calibrating Other Power Meters with the IQS-1500
Ut2
U
2
Bi
3
-----------
⎝⎠
⎛⎞
i
∑
U
2
Ai
N
------------
⎝⎠
⎛⎞
i
∑
U
1500
2
-------------
⎝⎠
⎛⎞
2
++×=
Entering Calibration Uncertainties
The total uncertainty is calculated by adding (using the root of the sum of
the squares) the Type B, Type A and Reference Meter uncertainties and
multiplying the results by a factor of two to obtain a confidence level of
95 %, as shown in the following equation:
where
U
= total uncertainty
t
U
= Type B uncertainties
Bi
U
= Type A uncertainties
Ai
U
= IQS-1500 calibration uncertainty
1500
The mandatory Type B uncertainties are:
³ Source power stability
³ Reference Meter spectral sensitivity
³ DUT spectral sensitivity
³ Setup reproducibility
Power Meters 69
Page 78

Calibrating Other Power Meters with the IQS-1500
Entering Calibration Uncertainties
The remaining uncertainties are optional, but to have the best possible
estimation, all uncertainties must be considered.
To set the uncertainties values for your calibration test:
1. Select the wavelength for which you want to enter uncertainties.
2. Enter the Type A uncertainty contribution in the box if needed.
3. Select the Other check box so that the entry is included in the
calculations.
4. Enter the Type B uncertainty values according to the calculations
performed earlier.
5. Enter the Reference Meter expanded uncertainty in the corresponding
box.
Once you are done entering the uncertainty values, click Next to proceed
to the next step.
70 IQS-1100/IQS-1500
Page 79

Calibrating Other Power Meters with the IQS-1500
Saving a Template File
Saving a Template File
At this point of the wizard step, you might want to save all the information
you have entered in order to reuse it for other calibrations.
To save a template for a later use:
1. In the Uncertainties window, type in the name you want to use for
your template in the Template Name box.
2. Click Save Template.
The next time you start a calibration session, you can select this template
from the Start window (see Selecting the Calibration Option on page 60).
Power Meters 71
Page 80

Calibrating Other Power Meters with the IQS-1500
Nulling Offsets for Calibration
Nulling Offsets for Calibration
The Null window allows you to perform an offset nulling on your modules
(both the Calibration Power Meter and the DUT Power Meter). This will
provide you with a “clean” measurement, with no electrical offsets to
impede your calibration process.
To perform an offset nulling on your modules:
1. Place a protective cap on the detector ports.
2. Confirm that you have used the protective caps by checking the
corresponding box in the window.
3. Click Start NULL Session to start the process.
72 IQS-1100/IQS-1500
Page 81

Calibrating Other Power Meters with the IQS-1500
Storing Reference Power Meter Measurements Automatically
Storing Reference Power Meter Measurements
Automatically
The Ref. Meter Measurement window allows you to take a series of power
measurements automatically on your Calibration Power Meter. You can
specify the number of power measurements you want to take, and the
time interval between each measurement.
This window is there to help you by:
³ Avoiding repetitive power measurements
³ Calculating the standard deviation of the power measurements taken
on the IQS-1500.
This value is a good indication of the stability of the source used for
calibration. When the standard deviation exceeds 1%, a message will
appear warning you that the source might not be stable enough.
Power Meters 73
Page 82

Calibrating Other Power Meters with the IQS-1500
Storing Reference Power Meter Measurements Automatically
To enter auto-store details and start the associated calculations:
1. Select the wavelength at which you want to perform the calibration
using the arrow buttons on each side of the Select Wavelength box.
2. Select the source you want to use for your calibration using the arrow
buttons on each side of the Select Source box.
3. Type in the delay (in seconds) you want the power meter to wait
between measurements.
4. Type in the number of measurements to be performed in the (M) box.
5. Click Start to start the calculations.
If this result is not satisfactory, you can start over by clicking Erase this
result. You must then restart the calculation with Start.
Once you are satisfied with your results, proceed to the next step by
clicking Next.
74 IQS-1100/IQS-1500
Page 83

Calibrating Other Power Meters with the IQS-1500
Entering DUT Measurements
Entering DUT Measurements
After taking the measurements on your reference power meter, you must
take them on the DUT, in the DUT Meter Measurement window. You can
enter as many measurements as needed.
To add DUT measurements to your calibration procedure:
1. Refer to the DUT display and read the power value.
2. In the DUT Meter Measurement window, enter this value in the New
Value box, then select the proper units using the up and down arrow
buttons.
3. Add the value to the list by clicking .
Note: At this point, the unit selection will be grayed out so as not to change it by
mistake in another entry.
4. Repeat steps 1 through 3 for each measurement you want to add.
Power Meters 75
Page 84

Calibrating Other Power Meters with the IQS-1500
CF
P
1500
W()
P
DUT
W()
------------------------
⎝⎠
⎛⎞
=
Viewing Calibration Summary
The average value for your measurements will automatically be
updated below the New Value box.
If you want to remove a value from the list, click .
Once you have entered all of the DUT measurements, proceed to the next
step by clicking Next.
Viewing Calibration Summary
Once your calibration is complete, you can view a summary of the results
in the Summary window. This is also where you can manage the results
you have obtained. You can delete erroneous results, or go back to a
previous step to obtain more measurements.
The calibration factor (CF) is calculated using the following equation:
where
P
= IQS-1500 measured power
1500
P
= DUT measured power
DUT
76 IQS-1100/IQS-1500
Page 85

Calibrating Other Power Meters with the IQS-1500
Std. Dev.
CF
i
2
()
i
∑
1
N
----
CF
i
i
∑
⎝⎠
⎜⎟
⎛⎞
2
–
⎝⎠
⎜⎟
⎛⎞
N1–()
----------------------------------------------------------------
⎜⎟
⎜⎟
⎜⎟
⎜⎟
⎜⎟
⎛⎞
100
CF
---------
×=%()
Calibration
factor
Average
power
measured on
IQS-1500
Source
wavelength
Sequential
number of
calibration
factor
measurement
series
Viewing Calibration Summary
The standard deviation (all wavelengths) of the mean calibration factor
(CF) is calculated using the following equation:
The Single Wavelength tab allows you to see the results for each series of
measurements taken on the DUT on a particular wavelength.
To switch between wavelengths in the tab:
Use the up and down arrows next to the wavelength list. The tab will be
updated accordingly.
If you want to sort the columns using a particular criterion, simply click on
the header of the corresponding columns. A first click will display the list in
alphabetical order, a second click will reverse the order.
Power Meters 77
Page 86

Calibrating Other Power Meters with the IQS-1500
Source
wavelength
(may differ
slightly from
DUT)
Wavelength
of the power
meter under
test (DUT)
Average
power
measured on
IQS-1500
Number of
calibration factor
measurement
sets
Mean
calibration
factor by
which the DUT
readings must
be multiplied
Standard
deviation of
the calibration
factor
To ta l
uncertainty of
the calibration
factor
Viewing Calibration Summary
To delete erroneous values:
If you need to delete values in the list, select them, then click Delete the
selected items.
The All Wavelengths tab allows you to see all of the wavelengths for the
particular power meter under test.
78 IQS-1100/IQS-1500
Page 87

Calibrating Other Power Meters with the IQS-1500
Managing Calibration Reports
To sort the results according to a precise criterion:
Click the corresponding header.
A first click will sort the columns alphabetically, while a second click will
reverse the order.
To add more measurements to your test:
In either tab, click Loop for more measurements.
This will return you to the Ref. Meter Measurement step (see Storing
Reference Power Meter Measurements Automatically on page 73 for
details).
Managing Calibration Reports
Once your calibration is complete, you can view the corresponding report
on screen in the Report window. This report is available as a short and
long form, the difference between the two being that in the short report,
you will not see more detailed information pertaining to uncertainties.
You can store your report for further use or consultation from this window,
as well as print it if a printer is connected to your IQS platform (refer to the
corresponding user guide for more information on how to connect and use
a printer with your system).
You can also personalize your reports by adding your own company logo.
Power Meters 79
Page 88

Calibrating Other Power Meters with the IQS-1500
Managing Calibration Reports
To toggle between the long and short report forms:
1. In the Report window, select the type of report you want to view by
using the up and down arrow buttons.
2. Click View Report to update the report window and see the type of
report you have chosen.
To save the report for a later use:
1. Type the name of the report in the Report Name box.
2. Click Save Report.
You will be prompted to navigate to the desired location for storing the
file.
3. Confirm your choice. You will be returned to the Report window.
80 IQS-1100/IQS-1500
Page 89

Calibrating Other Power Meters with the IQS-1500
Managing Calibration Reports
To print the report:
Click Print.
A standard Windows print dialog box appears and allows you to select the
printing details pertaining to your setup.
To change the logo on your report:
1. Locate where your report files are stored.
The usual path should be [drive where IQS Manager is installed]/IQS
Manager/User Files/Iqs 1x00/Res/. If not, use Windows Explorer to
locate the files.
2. Replace the Logo.jpg file by the picture file of your choice.
The reports will now print with your chosen picture file.
Power Meters 81
Page 90

Page 91

10 Monitoring Power Meter
Modules
When using your IQS-1100/IQS-1500 Power Meters module, either alone or
with other modules in a test setup, you can view module data and status
using its monitor window in IQS Manager.
Using Monitor Windows
Monitor windows display basic data about modules. A combination of
resizable windows allows you to create an integrated data display (refer to
the platform user guide).
From the monitor window, you can change module parameters either by:
³ opening the module application to access all the functions
OR
³ using the QuickTools utility, which provides frequently used functions
from the application.
Power Meters 83
Page 92

Monitoring Power Meter Modules
Selected modules
(checked)
Using Monitor Windows
To select modules and display their monitor windows:
1. On the Current Modules function tab, select the controller or
expansion unit containing the modules you want to monitor.
2. In the Monitor column, select the box next to each module you want
to monitor.
If you want to monitor all the modules in the current unit, click Select
All Monitors. If you want to clear your choices, click Deselect All
Monitors.
84 IQS-1100/IQS-1500
Page 93

Monitoring Power Meter Modules
Close
monitor
window
Rearrange
monitors
in columns
Reposition
monitor windows
Close all
monitor windows
Using Monitor Windows
3. Click Start Monitor to apply your selection.
IQS Manager will display the selected monitor windows on the
Monitors function tab.
Note: To start t h e highlighted module’s corresponding application at the same
time, click Start App. & Monitor. The application will appear in a different
window.
Power Meters 85
Page 94

Monitoring Power Meter Modules
IQS-1100
IQS-1500
Using QuickTools
Using QuickTools
With QuickTools, you can fine-tune your module directly, while keeping an
eye on your entire test setup.
Note: You can only access QuickTools if the module’s monitor window is selected
from the Monitors function tab and is currently active.
To start QuickTools:
1. From the Monitors function tab, elect the monitor window of the
module you wish to control.
2. Using the arrow button in the upper left corner, select QuickTools.
The corresponding monitor window flashes when QuickTools is
activated.
Note: If you want to open the actual application for your module rather than
QuickTools, click Show Controller.
86 IQS-1100/IQS-1500
Page 95

Monitoring Power Meter Modules
Using QuickTools
To c l os e Q u ic k Too ls :
Click the Close button located at the top of the window.
OR
Click outside the QuickTools window.
To close a monitor window:
Click the button on the upper left of the monitor window and select
Remove Monitor.
OR
Click the Close All button at the bottom of the window.
Power Meters 87
Page 96

Page 97

11 Maintenance
To help ensure long, trouble-free operation:
³ Always clean fiber-optic connectors before using them.
³ Keep the unit free of dust.
³ Clean the unit casing and front panel with a cloth slightly dampened
with water.
³ Store unit at room temperature in a clean and dry area. Keep the unit
out of direct sunlight.
³ Avoid high humidity or significant temperature fluctuations.
³ Avoid unnecessary shocks and vibrations.
³ If any liquids are spilled on or into the unit, turn off the power
immediately and let the unit dry completely.
Use of controls, adjustments, and procedures for operation and
maintenance other than those specified herein may result in
hazardous radiation exposure.
WARNING
Power Meters 89
Page 98

Maintenance
Cleaning Fixed Connectors
Cleaning Fixed Connectors
Regular cleaning of connectors will help maintain optimum performance.
Do not try to disassemble the unit. Doing so would break the connector.
To clean fixed connectors:
1. Fold a lint-free wiping cloth in four to form a square.
2. Moisten the center of the lint-free wiping cloth with only one drop of
isopropyl alcohol.
Alcohol may leave traces if used abundantly. Avoid contact between
the tip of the bottle and the wiping cloth, and do not use bottles
that distribute too much alcohol at a time.
3. Gently wipe the connector threads three times with the folded and
moistened section of the wiping cloth.
IMPORTANT
IMPORTANT
Isopropyl alcohol takes approximately ten seconds to evaporate.
Since isopropyl alcohol is not absolutely pure, evaporation will
leave microscopic residue. Make sure you dry the surfaces before
evaporation occurs.
4. With a dry lint-free wiping cloth, gently wipe the same surfaces three
times with a rotating movement.
5. Throw out the wiping cloths after one use.
6. Moisten a cleaning tip (2.5 mm tip) with only one drop of isopropyl
alcohol.
90 IQS-1100/IQS-1500
Page 99

Maintenance
7
8
9
Cleaning Fixed Connectors
IMPORTANT
Alcohol may leave traces if used abundantly. Avoid contact between
the tip of the bottle and the cleaning tip, and do not use bottles
that distribute too much alcohol at a time.
7. Slowly insert the cleaning tip into the connector until it reaches the
ferrule inside (a slow clockwise rotating movement may help).
8. Gently turn the cleaning tip one full turn.
9. Continue to turn as you withdraw the cleaning tip.
10. Repeat steps 7 to 9, but this time with a dry cleaning tip (2.5 mm tip
provided by EXFO).
Note: Make sure you don’t touch the soft end of the cleaning tip and verify the
cleanliness of the cotton tip.
11. Throw out the cleaning tips after one use.
Power Meters 91
Page 100

Maintenance
Cleaning Detector Ports
Cleaning Detector Ports
Regular cleaning of detectors will help maintain measurement accuracy.
Always cover detectors with protective caps when unit is not in use.
To clean detector ports:
1. Remove the protective cap and adapter (FOA) from the detector.
2. If the detector is dusty, blow dry with compressed air.
3. Being careful not to touch the soft end of the swab, moisten a cleaning
tip with only one drop of isopropyl alcohol.
Alcohol may leave traces if used abundantly. Do not use bottles that
distribute too much alcohol at a time.
IMPORTANT
IMPORTANT
4. While applying light pressure (to avoid breaking the detector window),
gently rotate the cleaning tip on the detector window.
5. Repeat step 4 with a dry cleaning tip or blow dry with compressed air.
6. Discard the cleaning tips after one use.
92 IQS-1100/IQS-1500
 Loading...