

Page 1

Instruction Manual
245364-V
May 2002
Model 755A
Oxygen Analyzer
http://www.processanalytic.com
Page 2

ESSENTIAL INSTRUCTIONS
READ THIS PAGE BEFORE PROCEEDING!
Rosemount Analytical designs, manufactures and tests its products to meet many national and
international standards. Because these instruments are sophisticated technical products, you
MUST properly install, use, and maintain them to ensure they continue to operate within their
normal specifications. The following instructions MUST be adhered to and integrated into your
safety program when installing, using, and maintaining Rosemount Analytical products. Failure to
follow the proper instructions may cause any one of the following situations to occur: Loss of life;
personal injury; property damage; damage to this instrument; and warranty invalidation.
• Read all instructions prior to installing, operating, and servicing the product.
• If you do not understand any of the instructions, contact your Rosemount Analytical representative
for clarification.
• Follow all warnings, cautions, and instructions marked on and supplied with the product.
• Inform and educate your personnel in the proper installation, operation, and maintenance of
the product.
• Install your equipment as specified in the Installation Instructions of the appropriate
Instruction Manual and per applicable local and national codes. Connect all products to the
proper electrical and pressure sources.
• To ensure proper performance, use qualified personnel to install, operate, update, program, and
maintain the product.
• When replacement parts are required, ensure that qualified people use replacement parts specified by
Rosemount. Unauthorized parts and procedures can affect the product’s performance, place the safe
operation of your process at risk, and VOID YOUR WARRANTY. Look-alike substitutions may result
in fire, electrical hazards, or improper operation.
• Ensure that all equipment doors are closed and protective covers are in place, except when
maintenance is being performed by qualified persons, to prevent electrical shock and personal
injury.
The information contained in this document is subject to change without notice.
Teflon is a registered trademark of E.I. duPont de Nemours and Co., Inc.
SNOOP is a registered trademark of NUPRO Co.
Emerson Process Management
Rosemount Analytical Inc.
Process Analytic Division
1201 N. Main St.
Orrville, OH 44667-0901
T (330) 682-9010
F (330) 684-4434
e-mail: gas.csc@EmersonProcess.com
http://www.processanalytic.com
Page 3

Model 755A
PREFACE...........................................................................................................................................P-1
Definitions ...........................................................................................................................................P-1
Intended Use Statement.....................................................................................................................P-2
Safety Summary .................................................................................................................................P-2
General Precautions For Handling And Storing High Pressure Gas Cylinders .................................P-4
Documentation....................................................................................................................................P-5
Compliances .......................................................................................................................................P-5
1-0 DESCRIPTION AND SPECIFICATIONS..............................................................................1-1
1-1 Overview................................................................................................................................1-1
1-2 Oxygen Range on Front Panel Digital Display ......................................................................1-1
1-3 Oxygen Ranges for Recorder Readout .................................................................................1-2
1-4 Recorder Voltage and Current Outputs.................................................................................1-2
1-5 Automatic Pressure Compensation.......................................................................................1-2
1-6 Options ..................................................................................................................................1-2
a. Alarm...............................................................................................................................1-2
b. Case Mounting ................................................................................................................1-2
c. Electrical Power ..............................................................................................................1-2
1-7 Specifications ........................................................................................................................1-4
a. General ...........................................................................................................................1-4
b. Sample ............................................................................................................................1-4
c. Electrical..........................................................................................................................1-5
d. Physical...........................................................................................................................1-5
Instruction Manual
245364-V
May 2002
TABLE OF CONTENTS
2-0 INSTALLATION ....................................................................................................................2-1
2-1 Unpacking..............................................................................................................................2-1
2-2 Location And Mounting..........................................................................................................2-1
2-3 Voltage Requirements...........................................................................................................2-1
2-4 Electrical Connections ...........................................................................................................2-1
a. Line Power Connections .................................................................................................2-1
b. Recorder Connections ....................................................................................................2-2
c. Potentiometric Output .....................................................................................................2-2
d. Isolated Current Output (Optional)..................................................................................2-4
e. Output Connections for Dual Alarm Option ....................................................................2-4
f. Alarm Output Connections..............................................................................................2-4
g. Alarm Relay Characteristics............................................................................................2-5
2-5 Calibration Gases ..................................................................................................................2-7
a. Zero Calibration Gas.......................................................................................................2-7
b. Downscale Standard Gas ...............................................................................................2-7
c. Upscale Standard Gas ....................................................................................................2-7
2-6 Sample Handling ...................................................................................................................2-7
a. Sample Temperature Requirements...............................................................................2-7
b. Sample Pressure Requirements: General ......................................................................2-7
c. Normal Operation at Positive Gauge Pressures.............................................................2-9
d. Operation at Negative Gauge Pressures........................................................................2-9
e. Sample Flow Rate...........................................................................................................2-9
f. Corrosive Gases .............................................................................................................2-10
2-7 Leak Test ...............................................................................................................................2-10
2-8 Purge Kit (Optional) ...............................................................................................................2-11
Rosemount Analytical Inc. A Division of Emerson Process Management Contents i
Page 4

Instruction Manual
245364-V
May 2002
3-0 OPERATION .........................................................................................................................3-1
3-1 Overview................................................................................................................................3-1
3-2 Selection of Recorder Oxygen Range...................................................................................3-1
a. Recorder Oxygen Range Selection Procedure...............................................................3-1
b. Readout of Applied Zero-Suppression Voltage on Digital Display .................................3-3
3-3 Startup Procedure .................................................................................................................3-4
3-4 Calibration..............................................................................................................................3-4
a. Calibration Using Digital Readout for Oxygen Readout..................................................3-4
b. Calibration Using Recorder for Oxygen Readout ...........................................................3-4
c. Calibration with Downscale and Upscale Standard Gases ............................................3-8
d. Calibration of Automatic Pressure Compensation ..........................................................3-8
3-5 Compensation for Composition of Background Gas .............................................................3-10
a. Oxygen Equivalent Values of Gases ..............................................................................3-10
b. Oxygen Equivalents of Gas Mixtures..............................................................................3-10
c. Computing Adjusted Settings for Zero and Span Controls .............................................3-10
3-6 Dual Alarm Option .................................................................................................................3-12
a. Initial Calibration and Selection of Setpoints for Alarms .................................................3-12
b. Selection of Deadband....................................................................................................3-13
3-7 Routine Operation .................................................................................................................3-14
3-8 Effect of Barometric Pressure Changes on Instrument Readout ..........................................3-14
3-9 Calibration Frequency ...........................................................................................................3-14
Model 755A
4-0 THEORY................................................................................................................................4-1
4-1 Principles of Operation ..........................................................................................................4-1
a. Magnetic Displacement Force ........................................................................................4-1
b. Physical Configuration of Detector/Magnet Assembly....................................................4-2
4-2 Variables Influencing Paramagnetic Oxygen Measurements ...............................................4-5
a. Pressure Effects..............................................................................................................4-5
b. Temperature Effects .......................................................................................................4-5
c. Interferents ......................................................................................................................4-5
d. Vibration Effects ..............................................................................................................4-5
4-3 Electronic Circuitry.................................................................................................................4-6
a. Detector/Magnet Assembly.............................................................................................4-6
b. Control Board and Associated Circuitry..........................................................................4-6
c. Case Board .....................................................................................................................4-7
d. Isolated Current Output Board (Optional) .......................................................................4-8
e. Alarm Option ...................................................................................................................4-8
5-0 CIRCUIT ANALYSIS.............................................................................................................5-1
5-1 Overview................................................................................................................................5-1
5-2 ±15VDC Power Supply..........................................................................................................5-1
5-3 Case Heater Control Circuit...................................................................................................5-1
5-4 Detector Heater Control Circuit .............................................................................................5-6
5-5 Detector Light Source Control Circuit....................................................................................5-7
5-6 Detector with First Stage Amplifier and Pressure Compensation Circuits ............................5-8
a. Pressure Compensation Circuit ......................................................................................5-9
b. Pressure Signal Circuit ...................................................................................................5-9
c. Positive and Negative Reference Voltage Circuits .........................................................5-9
5-7 Buffer Amplifiers U10 and Associated Anticipation Function ................................................5-11
5-8 Digital Output Circuit..............................................................................................................5-12
5-9 Analog Output Circuits for Recorder and Alarms ..................................................................5-12
ii Contents Rosemount Analytical Inc. A Division of Emerson Process Management
Page 5

Model 755A
6-0 SERVICE AND MAINTENANCE ..........................................................................................6-1
6-1 Initial Checkout with Standard Gases ...................................................................................6-1
6-2 Detector Component Checks ................................................................................................6-2
a. Detector...........................................................................................................................6-2
b. Source Lamp...................................................................................................................6-2
c. Photocell .........................................................................................................................6-2
d. Suspension .....................................................................................................................6-2
6-3 Detector Component Replacement .......................................................................................6-3
a. Detector Replacement ....................................................................................................6-3
6-4 Source Lamp Replacement ...................................................................................................6-5
a. Photocell Replacement and Adjustment.........................................................................6-7
6-5 Heating Circuits .....................................................................................................................6-7
a. Case Heater Control Circuit ............................................................................................6-7
b. Detector/Magnet Heating Circuit.....................................................................................6-8
7-0 REPLACEMENT PARTS ......................................................................................................7-1
7-1 Circuit Board Replacement Policy .........................................................................................7-1
7-2 Selected Replacement Parts.................................................................................................7-1
7-3 Matrix .....................................................................................................................................7-2
Instruction Manual
245364-V
May 2002
8-0 RETURN OF MATERIAL ......................................................................................................8-1
8-1 Return Of Material .................................................................................................................8-1
8-2 Customer Service ..................................................................................................................8-1
8-3 Training..................................................................................................................................8-1
APPENDIX A - VAISALA BAROMETRIC PRESSURE TRANSDUCER..........................................A-1
A-1 Overview................................................................................................................................A-1
A-2 Circuit Function......................................................................................................................A-1
A-3 Installation..............................................................................................................................A-1
A-4 Adjustment.............................................................................................................................A-2
A-5 High Altitude Version (Option)...............................................................................................A-2
Rosemount Analytical Inc. A Division of Emerson Process Management Contents iii
Page 6

Instruction Manual
245364-V
May 2002
Figure 1-1. Model 755A Oxygen Analyzer ............................................................................... 1-1
Figure 1-2. Model 755A Component and Adjustment Locations ............................................. 1-3
Figure 2-1. Electrical Connections ........................................................................................... 2-2
Figure 2-2. Control Board......................................................................................................... 2-3
Figure 2-3. Connections for Potentiometric Recorder with Non-Standard Span ..................... 2-3
Figure 2-4. Model 755A Connected to Drive Several Current-Activated Output Devices ....... 2-4
Figure 2-5. Typical Alarm Settings ........................................................................................... 2-6
Figure 2-6. Relay Terminal Connections for Typical Fail-Safe Application.............................. 2-6
Figure 2-7. Connection of Typical Gas Selector Panel to Model 755A Oxygen Analyzer ....... 2-8
Figure 2-8. Installation of Purge Kit (Optional)....................................................................... 2-12
Figure 3-1. Model 755A Front Panel Controls ......................................................................... 3-2
Figure 3-2. Model 755A Internal Adjustments Locations ......................................................... 3-7
Figure 3-3. Calibration by Pressure Decrease Setup .............................................................. 3-9
Figure 3-4. Schematic Circuit of Alarm Relay Assembly ....................................................... 3-13
Figure 4-1. Spherical Body in Non-Uniform Magnetic Field..................................................... 4-2
Figure 4-2. Functional Diagram of Model 755A Paramagnetic Oxygen Measurement
Figure 4-3. Detector/Magnet Assembly.................................................................................... 4-4
Figure 5-1. Two-Comparator OR Circuit .................................................................................. 5-2
Figure 5-2. Ramp Generator .................................................................................................... 5-3
Figure 5-3. Case Heater Control Circuit................................................................................... 5-4
Figure 5-4. Case Heater Circuit ............................................................................................... 5-5
Figure 5-5. Detector Heater Control Circuit.............................................................................. 5-6
Figure 5-6. Detector Light Source Control Circuit .................................................................... 5-7
Figure 5-7. Detector with First Stage Amplifier and Pressure Compensation Circuits .......... 5-10
Figure 5-8. Pressure Signal and Reference Voltage Circuits ................................................ 5-10
Figure 5-9. Buffer, Anticipation, and Digital Output Circuit .................................................... 5-11
Figure 5-10. Simplified Analog Output Circuit for Recorder (Showing Three Ranges) ........... 5-14
Figure 6-1. Detector/Magnet Assembly.................................................................................... 6-4
Figure 6-2. Detector/Magnet Assembly Wiring ........................................................................ 6-4
Figure 6-3. Detector Adjustment .............................................................................................. 6-5
Figure 6-4. Modification of 633689 Connector Board for Compatibility with Replacement
Figure 6-5. Lamp Alignment..................................................................................................... 6-6
Model 755A
LIST OF ILLUSTRATIONS
System ................................................................................................................... 4-3
Lamp ...................................................................................................................... 6-6
LIST OF TABLES
Table 3-1. Standard Gases Recommended for Calibration of Various Oxygen Ranges on
Analog Output........................................................................................................ 3-5
Table 3-2. Model 755A Internal Adjustments.......................................................................... 3-6
Table 3-3. Oxygen Equivalents of Common Gases.............................................................. 3-11
iv Contents Rosemount Analytical Inc. A Division of Emerson Process Management
Page 7

Model 755A
617186 Schematic Diagram, Master Board (Case)
617731 Pictorial Wiring Diagram, Model 755A
620434 Schematic Diagram, Current Output
632349 Installation Drawing, Model 755A
652219 Schematic Diagram, Control Board
652222 Schematic Diagram, Transducer
Instruction Manual
245364-V
May 2002
LIST OF DRAWINGS
(Located in rear of manual)
Rosemount Analytical Inc. A Division of Emerson Process Management Contents v
Page 8

Instruction Manual
245364-V
May 2002
Model 755A
vi Contents Rosemount Analytical Inc. A Division of Emerson Process Management
Page 9

Instruction Manual
Model 755A
PREFACE
The purpose of this manual is to provide information concerning the components,
functions, installation and maintenance of the 755A.
Some sections may describe equipment not used in your configuration. The user should
become thoroughly familiar with the operation of this module before operating it. Read
this instruction manual completely.
DEFINITIONS
The following definitions apply to DANGERS, WARNINGS, CAUTIONS and NOTES found throughout
this publication.
DANGER .
245364-V
May 2002
Highlights the presence of a hazard which will cause severe personal injury, death, or substantial
property damage if the warning is ignored.
WARNING .
Highlights an operation or maintenance procedure, practice, condition, statement, etc. If not
strictly observed, could result in injury, death, or long-term health hazards of personnel.
CAUTION.
Highlights an operation or maintenance procedure, practice, condition, statement, etc. If not
strictly observed, could result in damage to or destruction of equipment, or loss of effectiveness.
NOTE
Highlights an essential operating procedure,
condition or statement.
Rosemount Analytical Inc. A Division of Emerson Process Management Preface P-1
Page 10

Instruction Manual
245364-V
May 2002
Model 755A
INTENDED USE STATEMENT
The Model 755A is intended for use as an industrial process measurement device only. It is not intended
for use in medical, diagnostic, or life support applications, and no independent agency certifications or
approvals are to be implied as covering such applications.
SAFETY SUMMARY
If this equipment is used in a manner not specified in these instructions, protective systems may be
impaired.
AUTHORIZED PERSONNEL
To avoid explosion, loss of life, personal injury and damage to this equipment and on-site
property, all personnel authorized to install, operate and service the this equipment should be
thoroughly familiar with and strictly follow the instructions in this manual. SAVE THESE
INSTRUCTIONS.
DANGER.
ELECTRICAL SHOCK HAZARD
Do not operate without doors and covers secure. Servicing requires access to live parts which can
cause death or serious injury. Refer servicing to qualified personnel.
For safety and proper performance this instrument must be connected to a properly grounded
three-wire source of power.
WARNING.
PARTS INTEGRITY
Tampering or unauthorized substitution of components may adversely affect safety of this product.
Use only factory documented components for repair.
WARNING.
POSSIBLE EXPLOSION HAZARD
This analyzer requires periodic calibration with known zero and standard gases. Refer to Sections
2-5 (page 2-7) and 2-6 (page 2-7). See also General Precautions for Handling and Storing High
Pressure Cylinders, page P-4.
P-2 Preface Rosemount Analytical Inc. A Division of Emerson Process Management
Page 11

Instruction Manual
Model 755A
WARNING .
POSSIBLE EXPLOSION HAZARD
This analyzer is of a type capable of analysis of sample gases which may be flammable. If used for
analysis of such gases, the instrument must be either in an explosion-proof enclosure suitable for
the gas, or, protected by a continuous dilution purge system in accordance with Standard
ANSI/NFPA-496-1086 (Chapter 8) or IEC Publication 79-2-1983 (Section Three).
If gases are introduced into this analyzer, the sample containment system must be carefully leakchecked upon installation and before initial start-up, during routine maintenance and any time the
integrity of the sample containment system is broken, to ensure the system is in leak-proof
condition. Leak-check instructions are provided in Section 2-7, page 2-10.
Internal leakage of sample resulting from failure to observe these precautions could result in an
explosion causing death, personal injury, or property damage.
CAUTION .
245364-V
May 2002
PRESSURIZED GAS
This module requires periodic use of pressurized gas. See General Precautions for Handling and
Storing High Pressure Gas Cylinders, page P-4
Rosemount Analytical Inc. A Division of Emerson Process Management Preface P-3
Page 12

Instruction Manual
245364-V
May 2002
Model 755A
GENERAL PRECAUTIONS FOR HANDLING AND STORING HIGH
PRESSURE GAS CYLINDERS
Edited from selected paragraphs of the Compressed Gas Association's "Handbook of Compressed
Gases" published in 1981
Compressed Gas Association
1235 Jefferson Davis Highway
Arlington, Virginia 22202
Used by Permission
1. Never drop cylinders or permit them to strike each other violently.
2. Cylinders may be stored in the open, but in such cases, should be protected against extremes of
weather and, to prevent rusting, from the dampness of the ground. Cylinders should be stored in the
shade when located in areas where extreme temperatures are prevalent.
3. The valve protection cap should be left on each cylinder until it has been secured against a wall or
bench, or placed in a cylinder stand, and is ready to be used.
4. Avoid dragging, rolling, or sliding cylinders, even for a short distance; they should be moved by using a
suitable hand-truck.
5. Never tamper with safety devices in valves or cylinders.
6. Do not store full and empty cylinders together. Serious suckback can occur when an empty cylinder is
attached to a pressurized system.
7. No part of cylinder should be subjected to a temperature higher than 125
never be permitted to come in contact with any part of a compressed gas cylinder.
8. Do not place cylinders where they may become part of an electric circuit. When electric arc welding,
precautions must be taken to prevent striking an arc against the cylinder.
°
F (52°C). A flame should
P-4 Preface Rosemount Analytical Inc. A Division of Emerson Process Management
Page 13

Instruction Manual
Model 755A
DOCUMENTATION
The following May 2002 instruction materials are available. Contact Customer Service or the local
representative to order.
245364 Instruction Manual (this document)
COMPLIANCES
The Model 755A Oxygen Analyzer (General Purpose Enclosure) has been designed to meet the applicable
requirements of the U.S. Occupational Safety and Health Act (OSHA) of 1970 if installed in accordance
with the requirements of the National Electrical Code (NEC) of the United States in non-hazardous areas
and operated and maintained in the recommended manner.
This product may carry approvals from a certifying agency or may be in compliance with EMC Directive. If
so, the product will carry approval insignia, like those shown here, on the product name rating plate.
245364-V
May 2002
®
Rosemount Analytical Inc. A Division of Emerson Process Management Preface P-5
Page 14

Instruction Manual
245364-V
May 2002
Model 755A
P-6 Preface Rosemount Analytical Inc. A Division of Emerson Process Management
Page 15
Model 755A
Instruction Manual
245364-V
May 2002
SECTION 1
DESCRIPTION AND SPECIFICATIONS
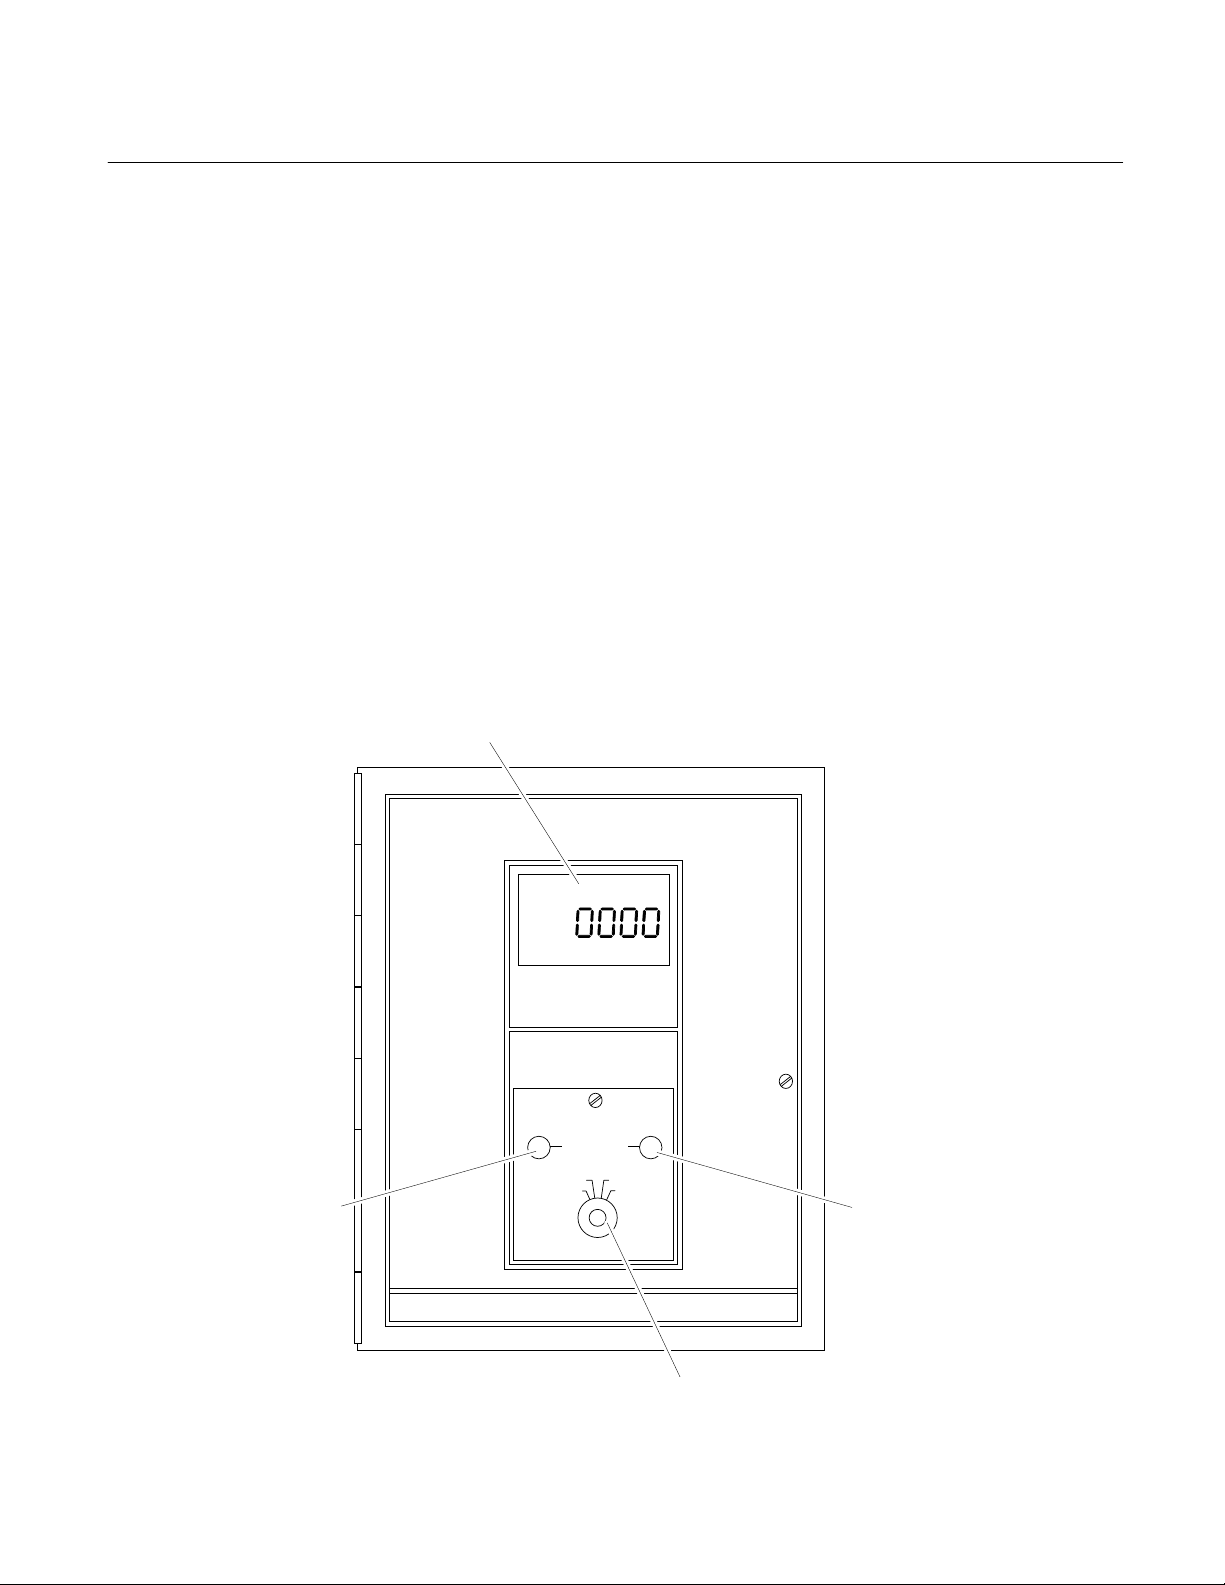
1-1 OVERVIEW
The Model 755A Oxygen Analyzer provides
digital readout of the oxygen content of a
flowing gas sample. Oxygen is strongly
paramagnetic; other common gases, with only
a few exceptions, are weakly diamagnetic.
A front panel liquid crystal display provides
direct digital readout of oxygen concentration.
In addition a field-selectable voltage output is
provided as standard. An isolated current
output of 0 to 20 mA or 4 to 20 mA is
obtainable with the optional Current Output
Board. Current and voltage output may be
utilized simultaneously if desired.
6 Digit LCD Display
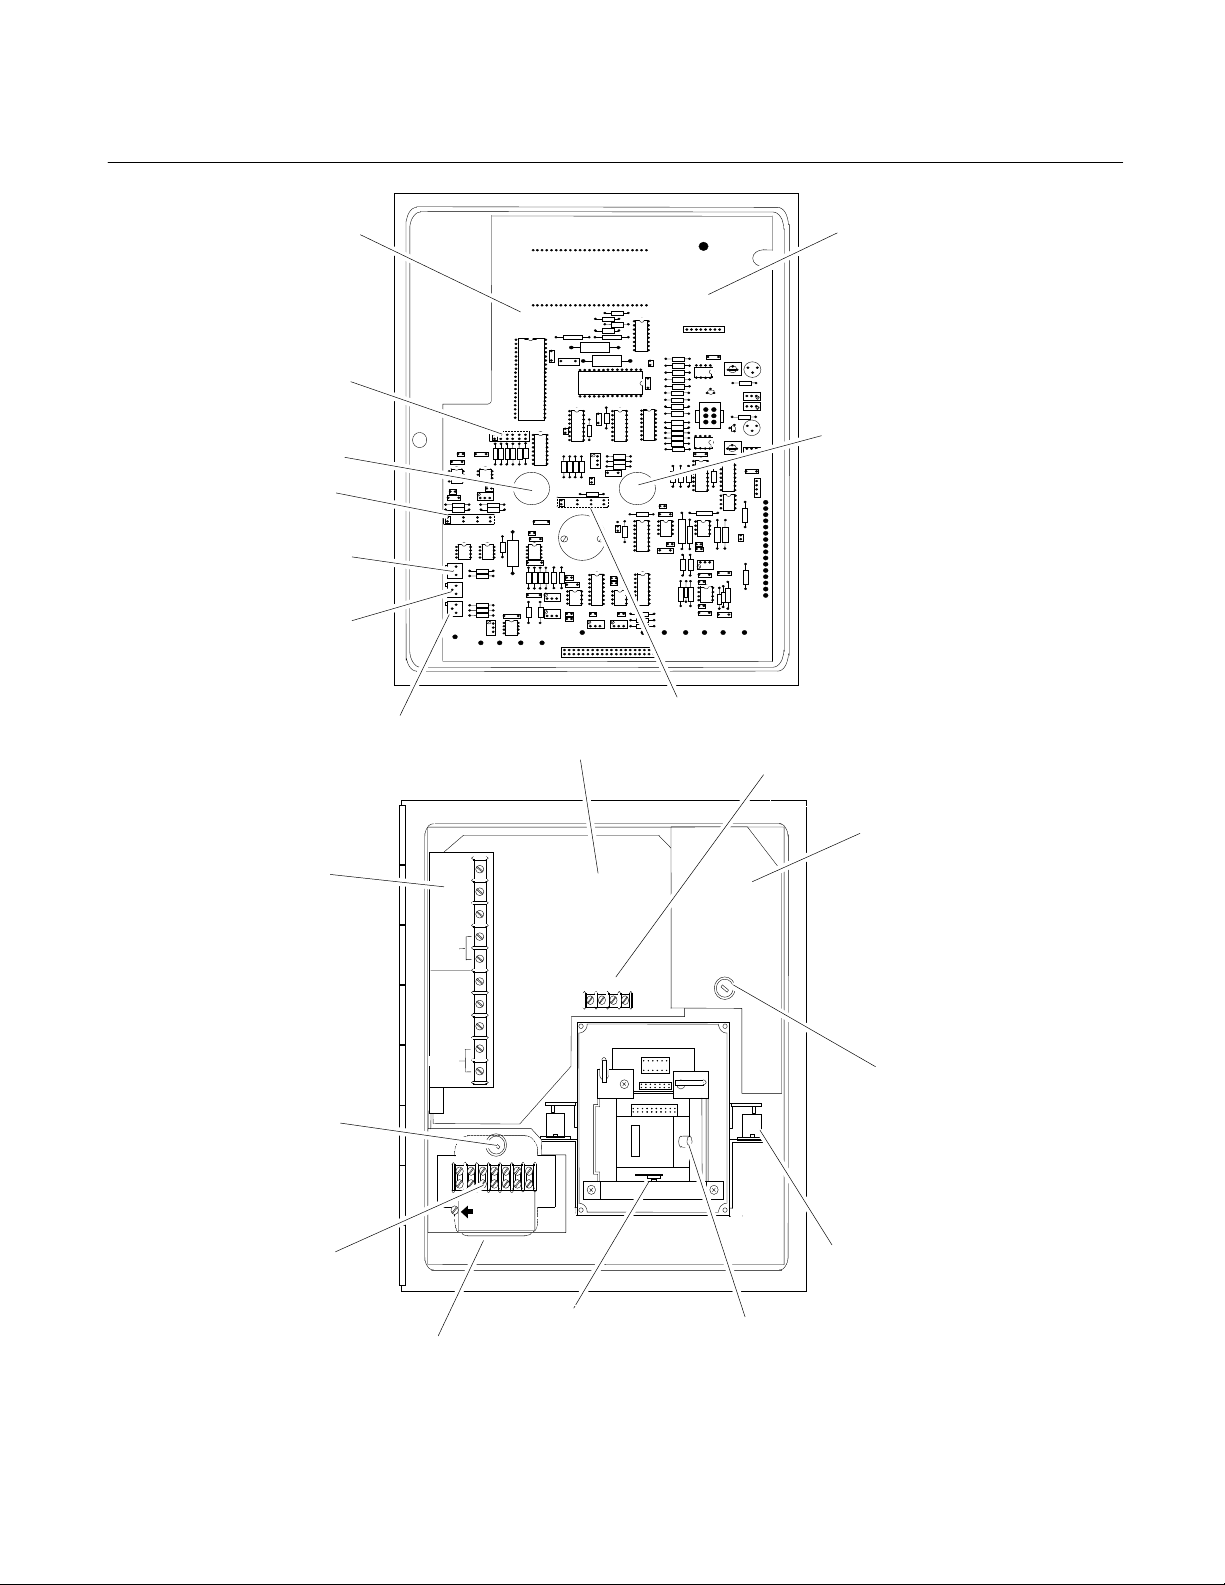
The basic electronic circuitry is incorporated
into two master boards: The Control Board
Assembly and the Case Circuit Board
Assembly (see Figure 1-2, page 1-3). The
Control Board has a receptacle which accepts
optional circuit boards, thus permitting
inclusion of such features as current output.
1-2 OXYGEN RANGE ON FRONT PANEL
DIGITAL DISPLAY
The front panel LCD (liquid crystal display)
provides direct readout of oxygen
concentration from 0.00% to 100.00%.
ZERO
PRESS CAL1 PRESS CAL 2
NORM REC OFFSET
ZERO Adjust
Rosemount Analytical
Model 755A
Oxygen Analyzer
TEST Switch
SPAN Adjust
Figure 1-1. Model 755A Oxygen Analyzer
Rosemount Analytical Inc. A Division of Emerson Process Management Description and Specifications 1-1
Page 16

Instruction Manual
245364-V
May 2002
Model 755A
1-3 OXYGEN RANGES FOR RECORDER
READOUT
If desired, the recorder output may be set for
a fullscale range of 0 to 100% oxygen.
Alternatively, a desired portion of this overall
range may be selected for fullscale
presentation on the recorder. The selection is
made by an appropriate combination of scale
expansion and zero suppression.
Scale Expansion
Fullscale oxygen span for the recorder is
switch selectable for 1%, 2%, 5%, 10%, 20%,
or 100% oxygen.
Zero Suppression
The desired zero suppression is obtained as
the sum of (a) a jumper selectable fixed value
of 0%, 20%, 40%, 60% or 80% oxygen and
(b) a continuously adjustable value of 0% to
25% oxygen. Thus the electronic circuitry
provides the capability of setting the total zero
suppression for any desired value from 0% up
to a theoretical maximum of 105% oxygen.
However, the maximum usable zero
suppression is 99%, which is used in
establishing a range of 99% to 100%.
The effective zero suppression, in volts, may
be read on the digital display by placing the
front panel TEST Switch in position 4 and the
Reorder Oxygen Span Selection Switch in 1 X
gain position (i.e., 100% oxygen)
Example:
Desired oxygen range for recorder output:
99% to 100% oxygen.
Required span is 1% oxygen, obtained by
jumper position.
Required zero suppression is 99% oxygen.
Thus, fixed zero suppression of 80% oxygen
is selected by jumper position, and adjustable
zero suppression is set for 19% oxygen.
1-4 RECORDER VOLTAGE AND CURRENT
OUTPUTS
Voltage Outputs (Standard)
Provided a standard is a jumper selectable
voltage output of 0 to 10 mV, 0 to 100 mV, 0
to 1 V, or 0 to 5 V DC.
Isolated Current Output (Option)
An isolated current output is obtainable with
the optional Current Output Board, either
included with the Model 755A or added at a
later date in the field.
This option provides a current output of either 0 to
20mA or 4 to 20mA for a maximum of 850 ohms.
Refer to Section 8 Replacement Parts, for the
part number of the Isolated Current Output
option.
NOTE
Voltage and current outputs may be used
simultaneously, if desired.
1-5 AUTOMATIC PRESSURE COMPENSATION
The oxygen readout is automatically corrected for
pressure variations within 3% of the target value,
which may be set anywhere within the range of -
2.7 to 3.3 psig ±3 psig (-18.6 to 22.8 kPa ±21 kPa.
1-6 OPTIONS
a. Alarm
The analyzer has an alarm relay assembly
consisting of two single-pole, double-throw
relays, one each for the ALARM 1 and
ALARM 2 contacts. These relays may be
used to drive external, customer-supplied
alarm and/or control devices.
b. Case Mounting
The analyzer is supplied, as ordered, with
hardware for one of three mounting
arrangements: Panel, wall, or pipe stanchion.
c. Electrical Power
The analyzer is supplied, as ordered, for
operation on either 120 VAC, 50/60 Hz, or
240 VAC, 50/60 Hz.
1-2 Description and Specifications Rosemount Analytical Inc. A Division of Emerson Process Management
Page 17
Model 755A
Instruction Manual
245364-V
May 2002
Control Board
Span Jumper Select
SPAN Control
Recorder Output Jumper Select
Zero Suppression
Adjustment
CAL2 Adjustment,
Pressure Compensation
CAL1 Adjustment,
Pressure Compensation
Location for Optional Current
Output Board
ZERO Control
Zero Offset Jumper Select
Case Board
Recorder Output
TB2
Alarm Relay Assembly
(Alarm Option)
Fuse
AC Power
AC Power
TB1
Transformer, Power T1
(Behind TB1)
NO. 1
RESE
NO. 2
RESET
COM
CO
Case Heater
Assembly
NO
NC
NO
NC
-
+
TB2
HOT
Fuse
Case Heater
N
H
E
O
U
T
Detector/Magnet Assembly Shock
Transducer
Mount
Detector/Magnet
Assembly
Figure 1-2. Model 755A Component and Adjustment Locations
Rosemount Analytical Inc. A Division of Emerson Process Management Description and Specifications 1-3
Page 18

Instruction Manual
245364-V
May 2002
1-7 SPECIFICATIONS
Model 755A
a. General
1
Operating Range ........................... 0.00% to 100.0% oxygen
Recorder Range ............................ Selectable for 0% to 100% oxygen or for any desired span of 1%,
2%, 5%, 10%, 20% or 100% oxygen within the overall range.
Response Time ............................. (90% of fullscale) recorder output factory set for 20 seconds;
adjustable from 5 to 25 seconds.
Reproducibility (Digital Display)..... ±0.01% Oxygen ±2 counts.
Ambient Temperature Limits
Maximum ............................... 49°C (120°F) EXCEPT 38°C (100°F) for 99% to 100% oxygen.
Minimum ................................ -7°C (20°F) EXCEPT 4°C (40°F) for 99% to 100% oxygen.
Zero and Span Drift
2
...................... Within ±1% of fullscale (±2% of fullscale for 99% to 100% range)
per 24 hours, provided that ambient temperature does not change
by more than 11.1°C (20°F).
±2.5% of fullscale per 24 hours with ambient temperature change
over entire range.
Barometric Pressure
Compensation ....................... Oxygen readout automatically corrected to within ±1% of fullscale
for barometric pressure variations within ±3% of target value and
within ±2% of fullscale for barometric pressure variations within
±5% of target value.
The target may be set anywhere within range of -2.7 to 3.3 psig ±3
psig (-18.6 to 22.8 kPa ±21 kPa).
Exhaust vented to atmosphere.
b. Sample
Dryness ......................................... Sample dewpoint below 43°C (110°F), sample free of entrained
liquids.
Temperature Limits
Maximum ............................... 66°C (150°F)
Minimum ................................ 10°C (50°F)
Operating Pressure
Maximum ............................... 69 kPa (10 psig).
Minimum ................................ -13.1 kPa (-1.9 psig)
Flow Rate
3
Maximum ............................... 500 cc/min
Minimum ................................ 50 cc/min
Recommended ...................... 250 ±20 cc/min
Materials in Contact with
Sample Gas........................... 316 stainless steel, glass, titanium, Paliney No. 7, epoxy resin,
Viton-A, platinum, nickel.
1
Performance specifications based on recorder output.
2
Zero and span drift specifications based on following conditions: Operating pressure constant; ambient temperature change
from initial calibration temperature, less than 11.1 Celsius degrees (20 Fahrenheit degrees); deviation from set flow held to
within ±10% or ±20 cc/min, whichever is smaller.
3
Deviation from set flow would be held to within ±10% or ±20 cc/min, whichever is smaller. If so, zero and span drift will be
within specifications, provided that operating temperature remains constant.
1-4 Description and Specifications Rosemount Analytical Inc. A Division of Emerson Process Management
Page 19

Model 755A
c. Electrical
Supply Voltage and Frequency
Standard ................................ 115 VAC ±10 VAC, 50/60 Hz
Optional ................................. 230 VAC ±10 VAC, 50/60 Hz
Power Consumption
Maximum ............................... 300 watts
Nominal.................................. 75 watts
Output
Standard ................................ Field selectable voltage output of 0 to 10mV, 0 to 100mV, 0 to 1V,
Optional ................................. Isolated current output of 0 to 20mA or 4 to 20mA (with Current
Alarm Option.................................. High-Low Alarm
Contact Ratings ..................... 5 amperes, 240V AC, resistive load
Setpoint ......................................... Adjustable from 1% to 20% of fullscale
Deadband ...................................... Adjustable from 1% to 20% of fullscale (Factory set at 10% of
Instruction Manual
245364-V
May 2002
or 0 to 5VDC
Output Board)
5 amperes, 120V AC, resistive load
5 amperes, 28V DC, resistive load
fullscale)
d. Physical
Mounting
Standard ................................ Panel mount
Optional ................................. Surface or stanchion mount accessory available
Enclosure Classification ................ Meets requirements for NEMA 3R
Air Purge Option
1
................... NFPA 496 (1989) Type Z purge
Weight ........................................... Approximately 32.5 lbs (14.74 Kg)
Dimensions.................................... Height: 13.5 (343 mm)
Width: 11.5 (294 mm)
Depth: 7.12 (181 mm)
1
When installed with user supplied components, meets requirements for Class I, Division 2 locations per National Electrical
Code (ANSI/NFPA 70) for analyzers sampling nonflammable gases. Analyzers sampling flammable gases must be protected by a continuous dilution purge system in accordance with Standard ANSI/NFPA 496-1986, Chapter 8. Consult factory
for recommendations.
Rosemount Analytical Inc. A Division of Emerson Process Management Description and Specifications 1-5
Page 20

Instruction Manual
245364-V
May 2002
Model 755A
1-6 Description and Specifications Rosemount Analytical Inc. A Division of Emerson Process Management
Page 21

Model 755A
Instruction Manual
245364-V
May 2002
SECTION 2
INSTALLATION
2-1 UNPACKING
Carefully examine the shipping carton and
contents for signs of damage. Immediately
notify the shipping carrier if the carton or its
contents are damaged. Retain the carton and
packing materials until the instrument is
operational.
2-2 LOCATION AND MOUNTING
The analyzer is designed to meet NEMA 3R
enclosure requirements and may be mounted
outdoors. Permissible ambient temperature
range is 20°F to 120°F (-7°C to 49°C).
Avoid mounting outside in direct sunlight, or
inside in a closed building, where ambient
temperature may exceed the allowable
maximum.
Shock and mechanical motion can reduce
instrument accuracy; therefore, mount the
instrument in an area that is as vibration free
as possible.
CAUTION
ENCLOSURE INTEGRITY
With reference to Installation Drawing
642349, any unused cable conduit
openings must be securely sealed by
permanent closures in order to provide
enclosure integrity in compliance with
personnel safety and environmental
protection requirements. The plastic
closures provided are for shipping
protection only.
NOTE
For NEMA 3R service, all conduit must be
connected through approved fittings.
This instrument was shipped from the factory
configured to operate on 115 VAC or 240
VAC, 50/60 Hz electric power. Verify that the
power source conforms to the requirements of
the individual instrument, as noted on the
name-rating plate.
2-3 VOLTAGE REQUIREMENTS
WARNING
ELECTRICAL SHOCK HAZARD
live parts which can cause death or
serious injury. Refer servicing to qualified
personnel.
For safety and proper performance this
instrument must be connected to a
properly grounded three-wire source of
power.
NOTE
Refer to Installation Drawing 642349 at the
rear of this manual for recommended cable
conduit openings.
Rosemount Analytical Inc. A Division of Emerson Process Management Installation 2-1
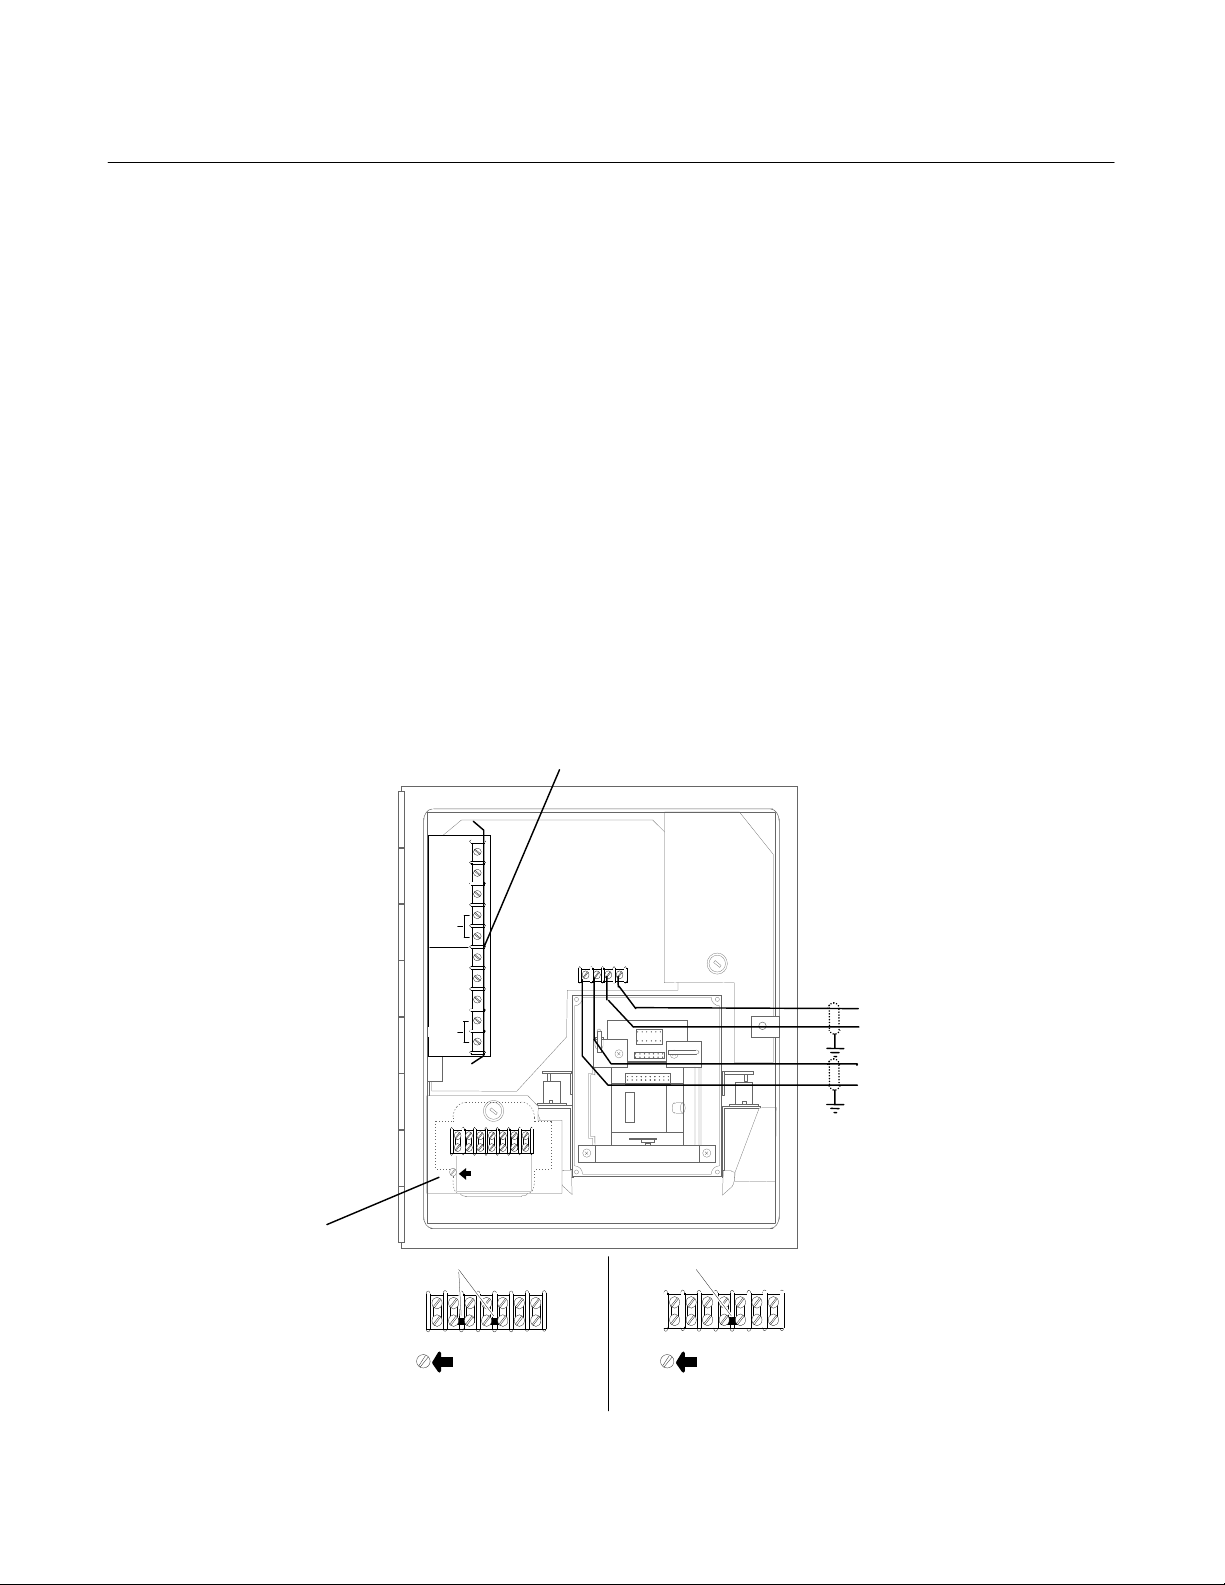
2-4 ELECTRICAL CONNECTIONS
a. Line Power Connections
Electrical power is supplied to the
analyzer via a customer-supplied, threeconductor cable, type SJT, minimum wire
size 18 AWG. Route power cable through
conduit and into appropriate opening in
the instrument case (see Installation
Drawing 642349). Connect power leads
to HOT, NEUT, AND GND terminals on
TB1, see Figure 2-1 (page 2-2). Connect
analyzer to power source via an external
fuse, in accordance with local codes.
NOTE
Do not draw power for associated
equipment from the analyzer power
cable.
Page 22
Instruction Manual
245364-V
May 2002
Model 755A
b. Recorder Connections
NOTE
Route recorder cable through a
separate conduit, not with power cable
or alarm output cable.
If a recorder, controller, or other output
device is used, connector it to the
analyzer via a 24-22 AWG two-conductor
shielded cable.
Route the cable through conduit to the
analyzer and into the case through the
appropriate opening shown in Installation
Drawing 642349. Connect the shield only
at the recorder or computer, if used.
Cable connections and output selection
for potentiometric and current actuated
devices are explained in below.
Optional Alarm Kit
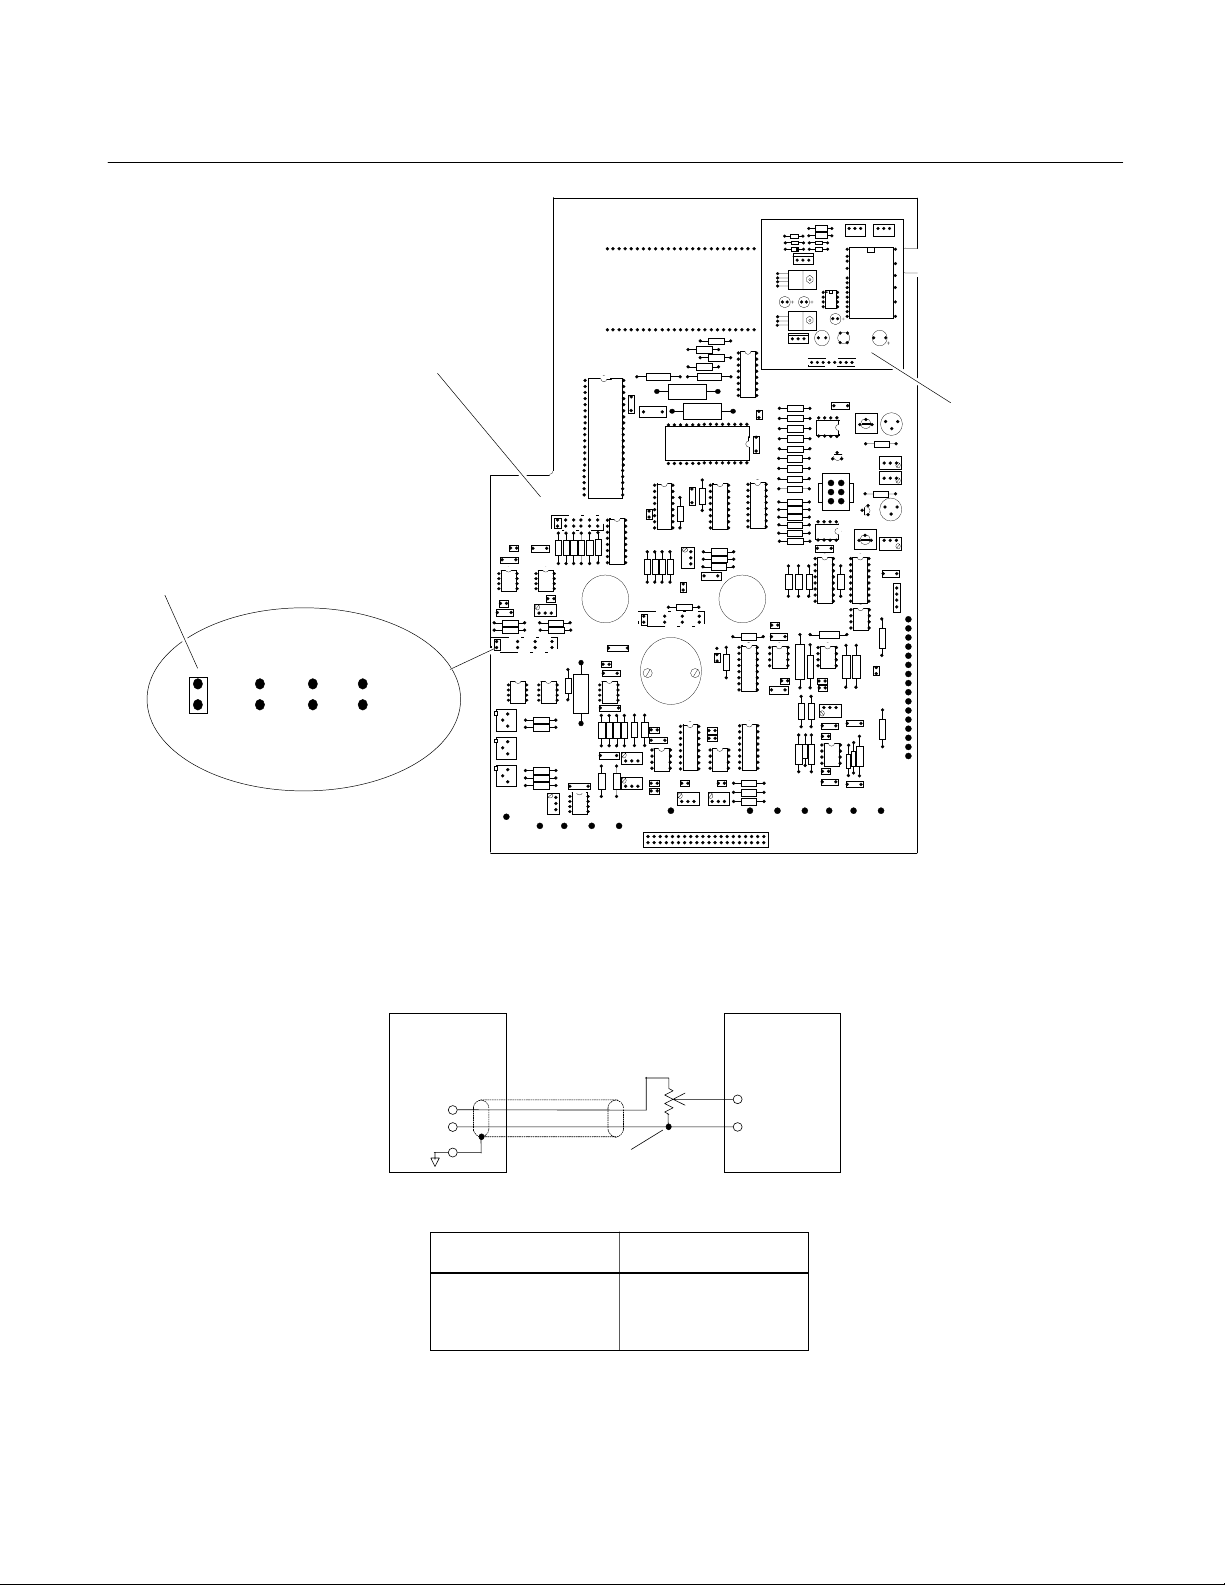
c. Potentiometric Output
Insert Recorder Output Selection Jumper,
Figure 2-2 (page 2-3), in position
appropriate to the desired output; 10 mV,
100 mV, 1V or 5V.
On TB2, Figure 2-1 (page 2-2), connect
leads of shielded recorder cable to "MV+"
AND "COM" terminals.
Connect free end of output cable to
appropriate terminals of recorder or other
potentiometric device.
For device with a span of 0 to 10mV, 0 to
100mV, 0 to 1V, or 0 to 5V, connect cable
directly to input terminals of the device,
making sure polarity is correct.
For device with intermediate span, i.e.,
between the specified values, connect
cable to device via a suitable external
voltage divider, as shown in Figure 2-3
(page 2-3).
Power Connections
(see below)
NO. 1
NO
COM
NC
RESET
NO. 2
NO
COM
NC
RESET
TB1
N
H
GND
E
O
U
T
T
Jumpers
TB1
N
GND GND
120 VAC CONFIGURATION 240 VAC CONFIGURATION
H
E
O
U
T
T
COM
+ - +
TB2
Jumper
HOT
N
E
U
T
TB1
H
O
T
+
mV Recorder
-
+
mA Recorder
-
Figure 2-1. Electrical Connections
2-2 Installation Rosemount Analytical Inc. A Division of Emerson Process Management
Page 23
Model 755A
Recorder Output Voltage
Selection Jumper
Control Board
Instruction Manual
245364-V
May 2002
R3
R4
R8
R9
CR2
1
2
3
4
I
G
O
U5
I G O
C5
I G O
R5
R6
U6
U3
U2
C4
C2
U4
C3 CR1 C1
R2 R1
U1
J1
Current Output
Board
5V 1V 0.1V 0.01V
JP3
Figure 2-2. Control Board
755A
Analyzer
Position of Recorder Output
Selector Plug
10 mV 1K Ohm
100 mV 10K Ohm
1 V 100K Ohm
5 V 2K Ohm
Voltage Divider
(Customer Supplied)
Minimum Permissible
Resistance for R1 + R2
Potentiometric
Recorder
Input
Terminals
(Make sure polarity
is correct)
Figure 2-3. Connections for Potentiometric Recorder with Non-Standard Span
Rosemount Analytical Inc. A Division of Emerson Process Management Installation 2-3
Page 24
Instruction Manual
245364-V
May 2002
Model 755A
d. Isolated Current Output (Optional)
1. Verify that the Current Output Board
appropriate to desired output is
properly in place. See Figure 2-2,
page 2-3. If originally ordered with
analyzer, the board is factory
installed.
2. On TB2, Figure 2-1 (page 2-2),
connect leads of shielded recorder
cable to "MA+" and "-" terminals.
+
mA
-
755A
Analyzer
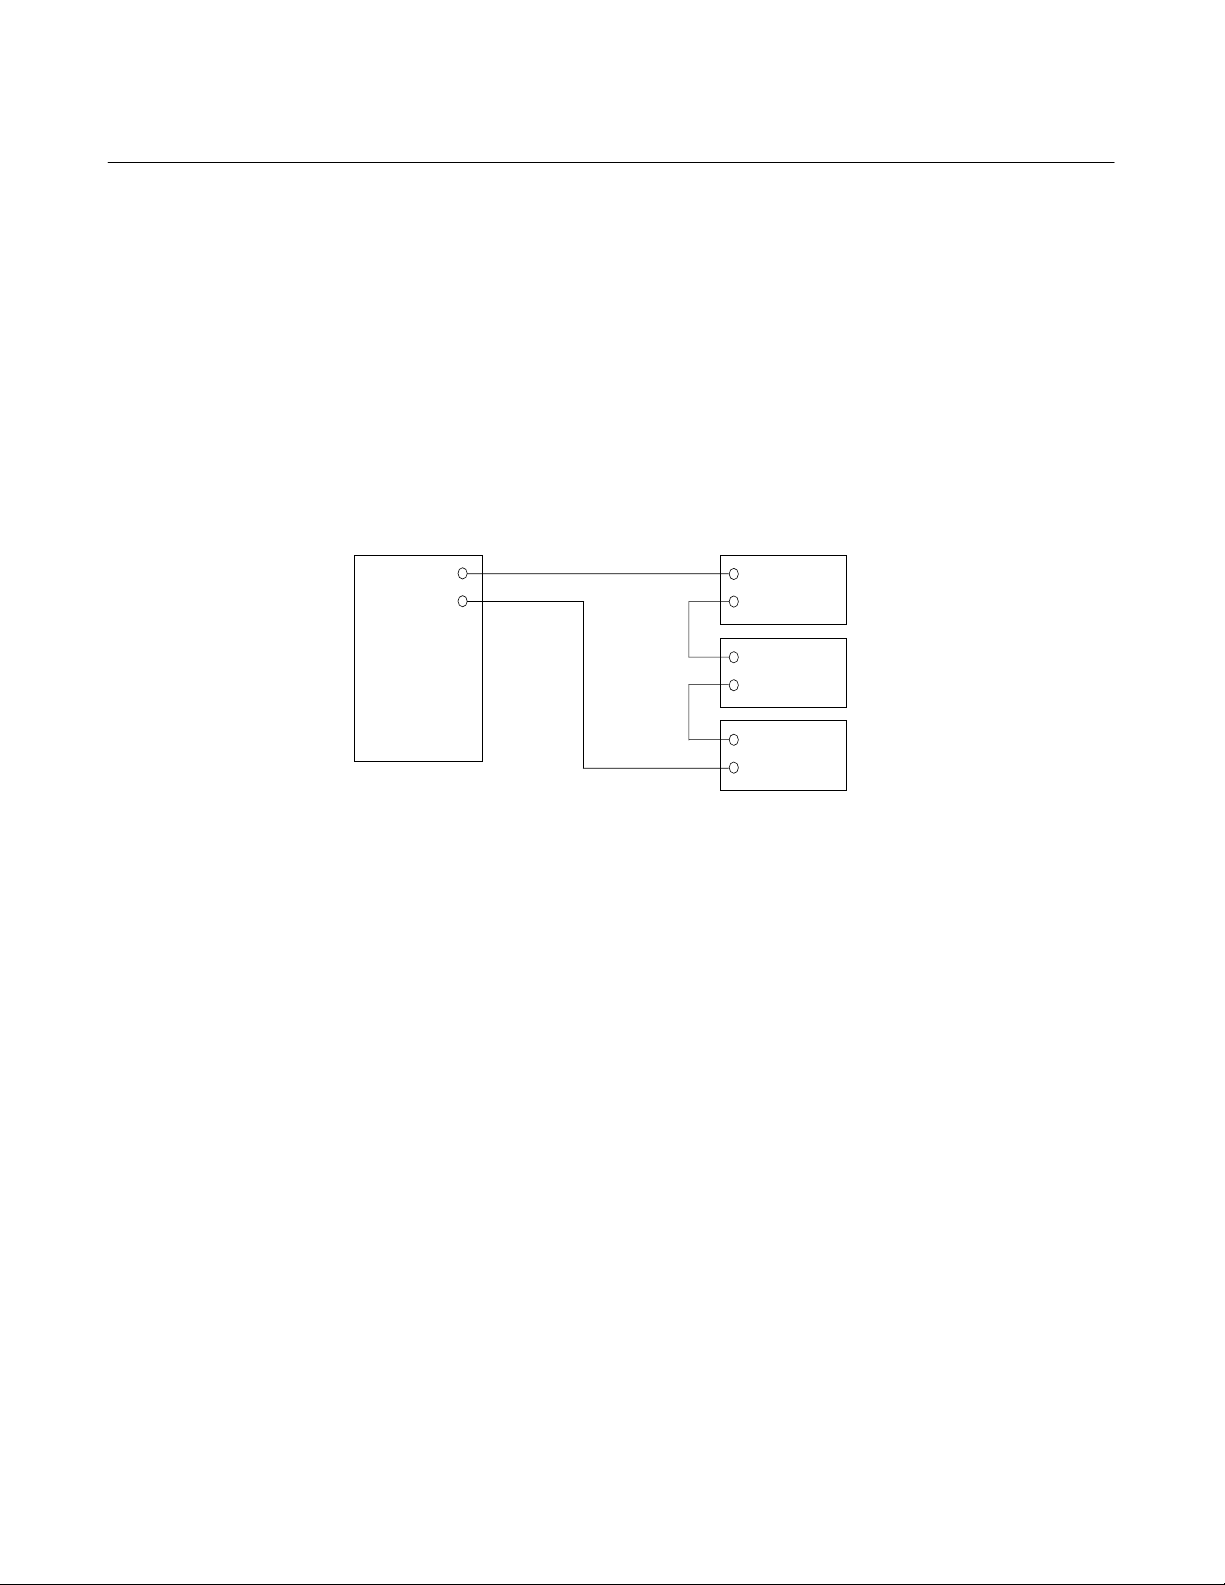
3. Connect free end of output cable to
input terminals of recorder or other
current actuated device, making sure
that polarity is correct. If two or more
current-actuated devices are to be
used, they must be connected in
series as shown in Figure 2-4 below
Total resistance of all output devices and
associated interconnection cable must not
exceed 850 ohms.
Current and voltage outputs may be
utilized simultaneously, if desired.
+
Recorder
-
+
Controller
-
+
Remote
-
Indicator
Figure 2-4. Model 755A Connected to Drive Several Current-Activated Output Devices
e. Output Connections for Dual Alarm
Option
power supply and the alarm relay
terminals on the Alarm Relay
Assembly.
If so ordered, the analyzer is factoryequipped with alarm output. Alternatively,
the alarm feature is obtainable by
subsequent installation of the 618083
Alarm Relay Kit.
2. If the alarm contacts are connected to
any device that produces radio
frequency interference (RFI), it should
be arc-suppressed. Rosemount
Analytical Arc Suppression (PN
f. Alarm Output Connections
The alarm output provides two sets of
relay contacts for actuation of alarm
and/or process control functions. Leads
858728) is recommended.
3. If possible, the analyzer should
operate on a different AC power
source to avoid RFI.
from the (customer-supplied) external
alarm system connect to terminals on the
638254 Alarm Relay Assembly (see
Figure 2-1, page 2-2).
4. Do not allow internal cable service
loop to touch the detector assembly
or associated inlet and outlet tubing.
This precaution ensures against
Note the following recommendations:
possible transmission of mechanical
vibration through the cable to the
1. A line fuse should be installed in the
line between the (customer-supplied)
detector, which can cause loss of
accuracy.
2-4 Installation Rosemount Analytical Inc. A Division of Emerson Process Management
Page 25

Model 755A
Instruction Manual
245364-V
May 2002
g. Alarm Relay Characteristics
The ALARM 1 and ALARM 2. Outputs of
the Alarm Relay Assembly are provided
by two identical single-pole double-throw
relays. Relay contacts are rated:
5 amperes 240 VAC resistive
1 ampere 240 VAC inductive
5 amperes 120 VAC resistive
3 amperes 120 VAC inductive
5 amperes 30 VDC resistive
3 amperes 30 VDC inductive
Removal of AC power from the analyzer,
as in a power failure, de-energizes both
relays, placing them in alarm condition.
Switching characteristics of the ALARM 1
and ALARM 2 relays are as follows:
ALARM 1 Relay - The ALARM 1 relay
coil is de-energized when the meter
needle moves downscale through the
value that corresponds to setpoint minus
deadband. This relay coil is energized
when the needle moves upscale through
the value that corresponds to setpoint
plus deadband. See Figure 2-5A, page 2-
6.
ALARM 2 Relay - The ALARM 2 relay
coil is de-energized when the meter
needle moves upscale through the value
that corresponds to the setpoint plus
deadband. This relay coil is energized
when needle moves downscale through
the value that corresponds to setpoint
minus deadband. See Figure 2-5B, page
2-6.
Alarm Reset - Normally both the ALARM
1 and ALARM 2 functions incorporate
automatic reset. When the meter reading
goes beyond the pre-selected limits, the
corresponding relay is de-energized.
When the meter reading returns within the
acceptable range, the relay is
automatically substituting an external
pushbutton or other momentary-contact
switch for the jumper that normally
connects the RESET terminals on the
Alarm Relay Assembly. If the
corresponding relay is now de-energized,
i.e., in alarm condition, the relay remains
de-energized until the operator
momentarily closes the switch.
Fail-Safe Applications - By appropriate
connection to the double-throw relay
contacts, it is possible to obtain either a
contact closure or a contact opening for
an energized relay. Also, either a contact
closure or a contact opening may be
obtained for a de-energized relay.
It is important that, for fail-safe
applications, the user understand wheat
circuit conditions are desired in the event
of power failure and the resultant relay
de-energization. Relay contacts should
then be connected accordingly. Refer to
Figure 2-6, page 2-6.
Rosemount Analytical Inc. A Division of Emerson Process Management Installation 2-5
Page 26
Instruction Manual
245364-V
May 2002
Model 755A
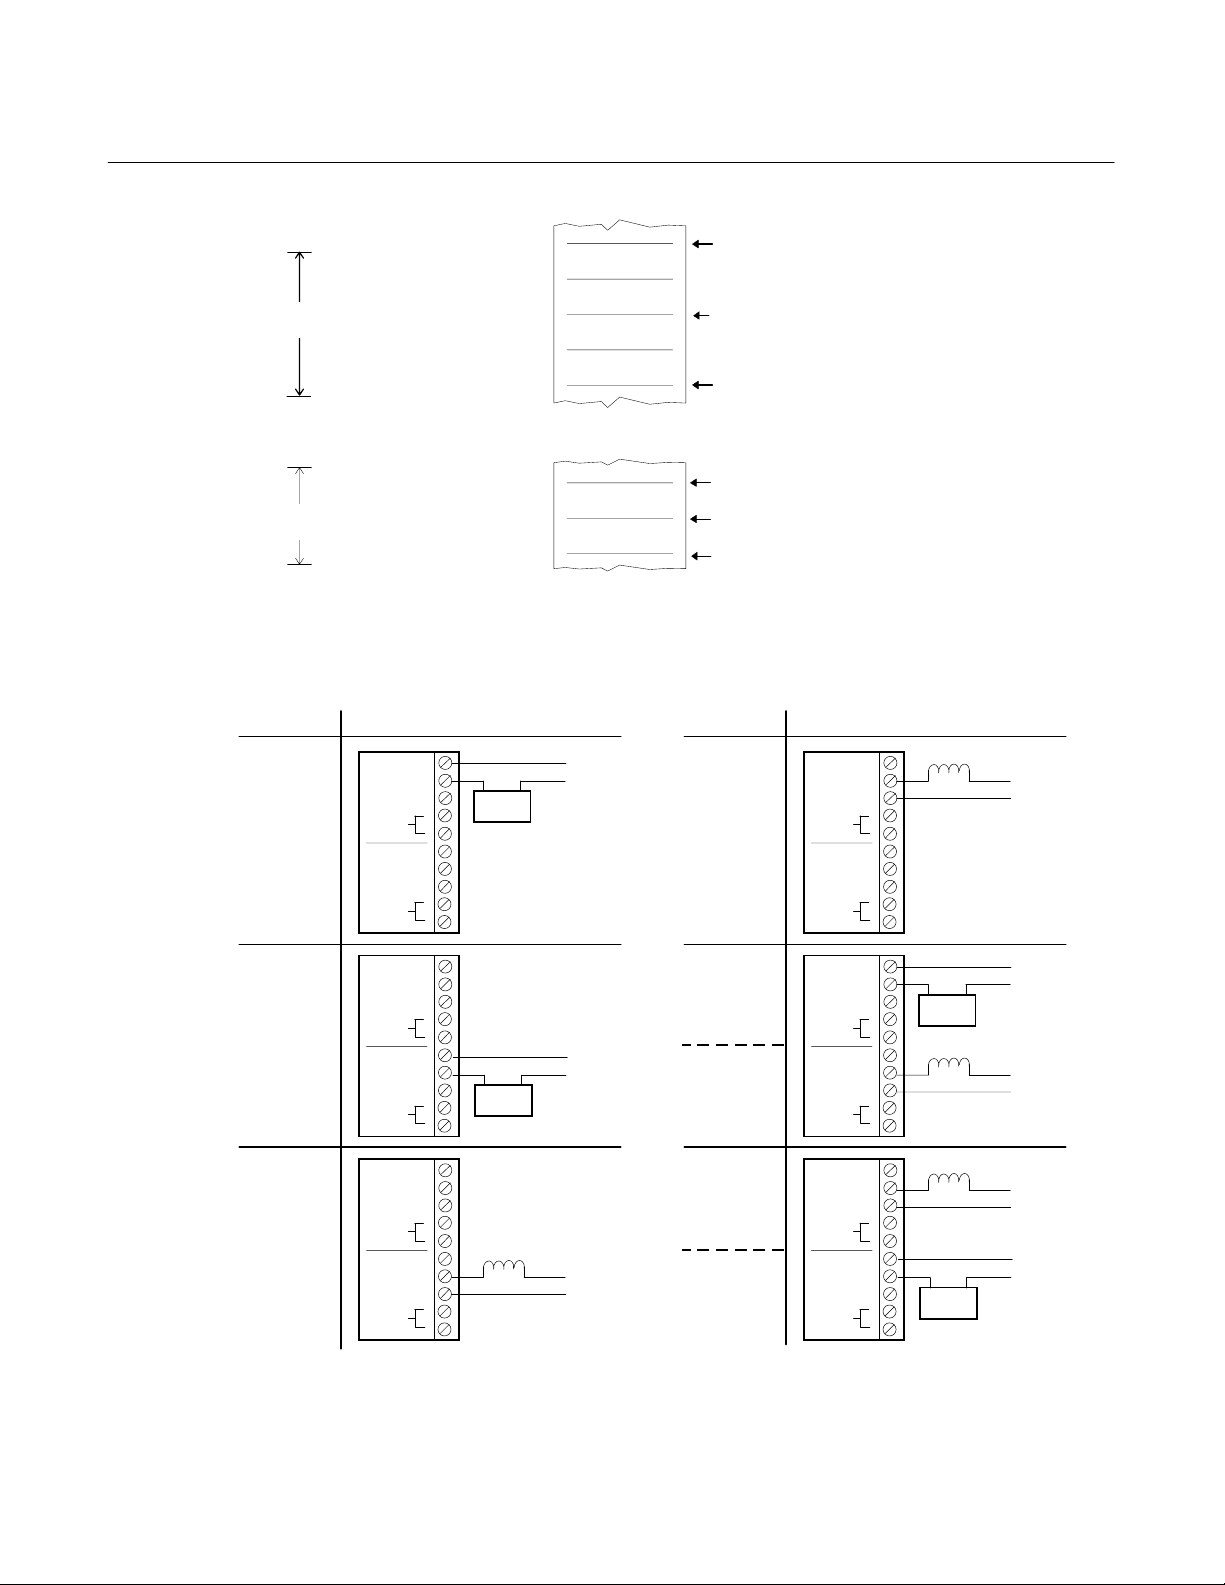
A. Typical ALARM 1 Setting
DEADBAND SET FOR
20% OF FULLSCALE
B. Typical ALARM 2 Setting
DEADBAND SET FOR
10% OF FULLSCALE
Low Alarm,
Fail-Safe
No. 1
RESET
RESET
No. 2
40
INPUT SIGNAL
Percent of Fullsc ale
30
20
55
INPUT SIGNAL
Percent of Fullsc ale
50
45
Figure 2-5. Typical Alarm Settings
COM
COM
NO
NC
NO
NC
Alarm Bell
or Lamp
115 VAC
N
H
When input signal moves upscale through this point, the coil of
ALARM 1 relay (K1) is energized, providing continuity between the
common and normally-closed contacts of the relay.
ALARM 1 Setpoint
When input signal moves downscale through this point, the coil of
ALARM 1 relay (K1) is de-energized, providing continuity between the
common and normally- open contacts of the relay.
When input signal moves upscale through this point, the coil of ALARM
2 relay (K2) is de-energized, pr oviding continuity between the common
and normally-open c ontacts of the relay.
ALARM 2 Setpoint
When input signal moves upscale through this point, the coil of ALARM
2 relay (K2) is energized, providing continuity between the common
and normally-closed contacts of the relay.
REQUIREMENT TYPICAL CONNECTIONSREQUIREMENT TYPICAL CONNECTIONS
Solenoid
Valve
115 VAC
Low Control
Limit,
Fail-Safe
No. 1
RESET
RESET
No. 2
NO
COM
NC
NO
COM
NC
H
N
High Alarm,
Fail-Safe
Low Control
Limit,
Fail-Safe
No. 1
RESET
RESET
No. 2
No. 1
RESET
RESET
No. 2
COM
COM
COM
COM
NO
NC
NO
NC
NO
NC
NO
NC
Alarm Bell
or Lamp
Solenoid
Valve
115 VAC
115 VAC
N
H
H
N
Lower
Low Alarm
Indicator,
Fail-Safe
Low Control,
Fail-Safe
High Control,
Fail-Safe
Higher
High Alarm
Indicator,
Fail-Safe
No. 1
RESET
RESET
No. 2
No. 1
RESET
RESET
No. 2
NO
COM
NO
COM
NO
COM
NO
COM
N
H
NC
NC
NC
NC
Alarm Bell
or Lamp
Solenoid
Valve
Solenoid
Valve
Alarm Bell
or Lamp
115 VAC
115 VAC
115 VAC
115 VAC
H
N
H
N
N
H
Figure 2-6. Relay Terminal Connections for Typical Fail-Safe Application
2-6 Installation Rosemount Analytical Inc. A Division of Emerson Process Management
Page 27

Model 755A
Instruction Manual
245364-V
May 2002
2-5 CALIBRATION GASES
a. Zero Calibration Gas
Zero-based range - Normally uses a
oxygen-free gas, typically nitrogen.
Zero-suppressed range - Uses a blend
consisting of a suitable percentage of
oxygen contained in a background gas,
typically nitrogen.
b. Downscale Standard Gas
Digital Display - Typically, although not
necessarily, the downscale standard gas
will be oxygen-free, such as nitrogen.
Recorder Readout - The downscale
standard gas is selected to establish a
calibration point at or near the lower
range limit.
c. Upscale Standard Gas
available for applications involving corrosive
gases. With corrosive gases, complete drying
of the sample is desirable, as most of these
gases are practically inert when totally dry.
For specific corrosive applications, consult the
factory.
a. Sample Temperature Requirements
Sample temperature at the analyzer inlet
should be in the range of 50°V to 150°F
(10°C to 66°C). With a thoroughly dry
sample, entry temperature can be as high
as 150°F (66°C) without affecting readout
accuracy. Normally, a maximum entry
temperature of 110°F (43°C) is
recommended so that the sample
temperature will rise during passage of
the sample through the analyzer. This
precaution ensures against cooling of the
sample and possible condensation of
moisture. Such condensation should be
avoided as it may damage the detector.
Digital Display - Typically, the upscale
standard gas will be a readily obtained
gas such as dry air (20.93% oxygen) or
1005 oxygen.
Recorder Readout - A suitable upscale
standard gas is required to establish a
calibration point at or near the upper
range limit. If this range limit is 21% or
somewhat above 21%, the usual standard
gas is dry air (20.93% oxygen).
2-6 SAMPLE HANDLING
CAUTION
PRESSURE LIMIT
Under no circumstances allow pressure to
exceed 10 psig (69 kPa) as irreparable
damage to the detector may result.
Many different sample handling systems are
available, depending on the requirements of
the individual user. Most sample handling
systems have copper or brass components;
however, stainless steel components are
b. Sample Pressure Requirements:
General
Operating pressure limits are the
following: maximum, 10 psig (69 kPa
gauge pressure); minimum, -1.9 psig (-
13.1 kPa).
CAUTION
OPERATING LIMITS
Operation outside the specified limits may
damage the detector and will void the
warranty.
Oxygen readout is automatically corrected
for atmospheric pressure variations within
±3% of the target value, which may be set
anywhere within the range of -2.7 to 3.3
psig ±3 psig (-18.6 to 22.8 kPa ±21 kPa).
The basic rule for pressure of sample and
standard gases supplied to the inlet is to
calibrate the analyzer at the same
pressure that will be used during
subsequent operation and to maintain this
Rosemount Analytical Inc. A Division of Emerson Process Management Installation 2-7
Page 28

Instruction Manual
245364-V
May 2002
Model 755A
pressure during operation. The
arrangement required to obtain
appropriate pressure control will depend
on the application. Refer to special
instructions included in Section 2-6c
Needle
Valves
Sample In
Downscale
Standard
Gas
Upscale
Standard
Gas
(page 2-9), Normal Operation at Positive
Gauge Pressures; or Section 2-6d (page
2-9), Operation at Negative Gauge
Pressures.
Model 755A
Oxygen Analyzer
Two Micron
Flowmeter
Filter
To Vent
Figure 2-7. Connection of Typical Gas Selector Panel to Model 755A Oxygen Analyzer
2-8 Installation Rosemount Analytical Inc. A Division of Emerson Process Management
Page 29

Model 755A
Instruction Manual
245364-V
May 2002
c. Normal Operation at Positive Gauge
Pressures
Pressure at Sample Inlet (All
Instruments) - Normally, the sample is
supplied to the analyzer inlet at a positive
gauge pressure in the range of 0 to 10
psig (0 to 69 kPa).
CAUTION
HIGH PRESSURE SURGES
High pressure surges during admission of
sample or standard gases can damage the
detector.
Sample Exhaust - The analyzer exhaust
is vented directly to the atmosphere
through an exhaust line with inner
diameter sufficiently large as not to cause
any back pressure. Internal circuitry
automatically corrects the oxygen readout
to within ±1% of fullscale for atmospheric
pressure variations within ±3% of target
value and within ±2% of fullscale for
barometric pressure variations within ±5%
of target value. The target value may be
set anywhere within range of -2.7 to 3.3
psig ±3 psig (-18.6 to 22.8 kPa ±21 kPa).
d. Operation at Negative Gauge
Pressures
Operation below this limit may damage
the detector and will void the warranty.
e. Sample Flow Rate
Operating limits for sample flow rate are
the following: Minimum 50 cc/min.;
maximum 500 cc/min. A flow rate of less
than 50 cc/min. is too slow to sweep out
the detector and associated flow system
efficiently resulting in a slow system
response. Too rapid a flow will cause a
back pressure that will affect the reading.
The optimum flow rate is between 200
and 300 cc/min.
Deviation from the set flow should be held
to within ±1% or ±2 cc/min, whichever is
smaller. If so, zero and span drift will be
within the limits given on the
specifications page, provided that
operating pressure remains constant.
Bypass Flow - Preferably the analyzer
should be installed near the sample
source to minimize transport time.
Otherwise the time lag may be
appreciable. For example, assume that
sample is supplied to the analyzer via a
100 foot (30.5 m) length of 1/4 inch (6.35
mm) O.D. thin walled tubing. With a flow
rate of 100 cc/min., sample transport time
is approximately 6 minutes.
Operation at negative gauge pressures is
not recommended but may be used in
certain special applications. A suction
pump is connected to the analyzer
exhaust port to draw sample into the inlet
and through the analyzer. Such operation
necessitates special precautions to
ensure accurate readout. There is the
basic consideration of supplying the
standard gases to the analyzer at the
same pressure that will be used for the
sample during subsequent operation. In
addition, any leakage will result in
decreased readout accuracy as compared
with operation at atmospheric pressure.
The minimum permissible operating
pressure is -1.9 psig (-13.1 kPa).
Rosemount Analytical Inc. A Division of Emerson Process Management Installation 2-9
Sample transport time may be reduced by
piping a greater flow than is required to
the analyzer, then routing only the
appropriate portion of the total flow
through the analyzer. The unused portion
of the sample may be returned to the
stream or discarded.
Page 30

Instruction Manual
245364-V
May 2002
Model 755A
f. Corrosive Gases
In applications where the sample stream
contains corrosive gases, a complete
drying of the sample is desirable, as most
of these gases are practically inert when
totally dry.
For corrosive applications, consult the
factory.
WARNING
RADIOACTIVE SAMPLE GASES
Radioactive sample gases require the
stainless steel tubing option.
2-7 LEAK TEST
WARNING
POSSIBLE EXPLOSION HAZARD
This analyzer is of the type capable of
analysis of sample gases which may be
flammable. If used for analysis of such
gases, the instrument must be either in an
explosion-proof enclosure suitable for the
gas, or, protected by a continuous dilution
purge system in accordance with Standard
ANSI/NFPA-496 (Chapter 8) or IEC
Publication 79-2-1983 (Section Three)
Leaks must be corrected before introduction
of flammable sample and/or application of
electrical power. Liberally cover all fittings,
seals, and other possible sources of leakage
with a suitable leak test liquid such as
SNOOP (PN 837801). Bubbling or foaming
indicates leakage. Checking for bubbles will
locate most leaks but could miss some
because some are inaccessible to application
of SNOOP. For positive assurance that
system is leak-free, use the flow stoppage
test.
If explosive gases are introduced into this
analyzer, the sample containment system
must be carefully leak-checked upon
installation and before initial start-up,
during routine maintenance and any time
the integrity of the sample containment
system is broken, to ensure the system is
in leak-proof condition.
Internal leaks resulting from failure to
observe these precautions could result in
an explosion causing death, personal
injury and/or property damage.
Supply air or inert gas, such as nitrogen, at 10
psig (69 kPa) to analyzer via a flow indicator
with range of 0 to 250 cc/min. Set flow at 125
cc/min. Plug sample outlet. Flow reading
should drop to zero. If not, system is leaking.
2-10 Installation Rosemount Analytical Inc. A Division of Emerson Process Management
Page 31

Model 755A
Instruction Manual
245364-V
May 2002
2-8 PURGE KIT (OPTIONAL)
The Purge Kit (PN 643108) is designed to
equip the Model 755A with Type Z Air Purge
per National Fire Protection Association
Standard NFPA496-1986, Chapter 2
WARNING
POSSIBLE EXPLOSION HAZARD
This analyzer is of the type capable of
analysis of sample gases which may be
flammable. If used for analysis of such
gases, the instrument must be either in an
explosion-proof enclosure suitable for the
gas, or, protected by a continuous dilution
purge system in accordance with Standard
ANSI/NFPA-496 (Chapter 8) or IEC
Publication 79-2-1983 (Section Three)
If explosive gases are introduced into this
analyzer, the sample containment system
must be carefully leak-checked upon
installation and before initial start-up,
during routine maintenance and any time
the integrity of the sample containment
system is broken, to ensure the system is
in leak-proof condition.
NOTE:
To conform to NFPA Type Z requirements,
the warning label must be applied to the
analyzer front cover. If the analyzer is
1
.
ordered factory equipped with the Purge
Kit, this label is applied at the factory.
Installation options are shown in Figure 2-8
(page 2-12). Use only clean dry air or suitable
inert gas for the purge supply.
Recommended supply pressure is 20 psig
(138 kPa), which provides a flow of
approximately 8 cubic feet per hour (4 liters
per minute) and a case pressure of
approximately 0.2 inch of water (50 Pa).
With a flow rate of 4 liters per minute, four
case volumes of purge gas pass through the
case in 10 minutes.
All conduit connections through the case must
be sealed thoroughly with the sealant supplied
in the kit. The sealant (applied from the
interior of the case) must thoroughly cover all
existing leads, as well as the conduit fitting.
Internal leaks resulting from failure to
observe these precautions could result in
an explosion causing death, personal
injury and/or property damage.
The kit consists of the following:
PART NO. DESCRIPTION
190697 Purge Inlet Fitting
645835 Purge outlet Fitting
082787 Warning Label
856156 Sealant (Duxseal)
1
These standards are not applicable to enclosures into
which a flammable gas or vapor mixture is introduced,
such as by a continuous sample containment system that
is subject to accidental leakage.
Rosemount Analytical Inc. A Division of Emerson Process Management Installation 2-11
Page 32

Instruction Manual
245364-V
May 2002
A. Option with Flow Indicator B. Option with Pressure Indicator or Alarm
Model 755A
Affix Warning
Label
Analyzer
Door
190697 Purge
Inlet Fitting
Flow
Indicator
645835 Purge
Outlet Fitting
Purge Supply
Components in dashed line are supplied by customer.
Figure 2-8. Installation of Purge Kit (Optional)
Affix Warning
Label
Analyzer
Door
190697 Purge
Inlet Fitting
Purge
Supply
645835 Purge
Outlet Fitting
Pressure
Indicator or
Alarm
2-12 Installation Rosemount Analytical Inc. A Division of Emerson Process Management
Page 33

Model 755A
3-1 OVERVIEW
Preparatory to startup and calibration, the
operator should study Figure 3-1 (page 3-2),
Figure 3-2 (page 3-7) and Table 3-1 (page 3-
5). Together they give locations and
summarized descriptions of operating controls
and adjustments of the Model 755A.
Instruction Manual
245364-V
May 2002
SECTION 3
OPERATION
3. Select the required zero suppression
by appropriate settings of the
following:
a. Set Recorder Zero Suppression
Jumper for fixed value of 0%,
20%, 40%, 60% or 80% oxygen.
3-2 SELECTION OF RECORDER OXYGEN
RANGE
The digital display provides readout over the
full range of 0.00% to 100.00% oxygen,
eliminating the requirement for expandedscale operation. With a recorder, however,
resolution is normally limited to approximately
1% of fullscale. Thus, if the recorder output is
to be the important display medium for the
particular application, expanded-scale
operation may be necessary to obtain the
desired readout accuracy. Such operation is
obtained by an appropriate combination of
scale expansion and zero suppression.
a. Recorder Oxygen Range Selection
Procedure
Refer to Table 3-1 (page 3-5) and Figure
3-2 (page 3-7).
1. Verify that Recorder Voltage Output
Jumper is in the position appropriate
to the recorder: 10 mV, 100 mV, 1 V
or 5 VDC.
2. Place the Recorder Oxygen Span
Jumper in the position appropriate to
the desired span. Note that on the
circuit board switch positions are
marked according to the amplifier
gain.
b. Set Recorder Zero Suppression
Coarse Adjustment R41 for
appropriate value in the range of
05 to 25% oxygen.
NOTE:
The actual applied zero suppression
may be measured and established via
readout on the digital display per the
procedure of Section 3-2b (page 3-3).
Example 1, Selection of a Zero-Based
Recorder Output Range:
•
Desired oxygen range for recorder
output: 0 to 100%.
•
Required span of 100% oxygen is
selected when Recorder Oxygen
Span Jumper is in the 1X position.
•
Required Zero Suppression is 0%,
thus Recorder Zero Suppression
Jumper, is removed, and R41,
Recorder Zero Suppression Coarse
Adjustment, and R104, Recorder Zero
Suppression Fine Adjustment, are
adjusted for 0% oxygen.
Desired Oxygen
Span for Recorder
100% 1X
20% 5X
10% 10X
5% 20X
2% 50X
1% 100X
Rosemount Analytical Inc. A Division of Emerson Process Management Operation 3-1
Amplifier Gain
Marking on Board
Page 34

Instruction Manual
245364-V
May 2002
ZERO Adjust
6 Digit LCD Display
ZERO
PRESS CAL1 PRESS CAL 2
NORM REC OFFSET
Model 755A
SPAN Adjust
TEST Switch
CONTROL
Digital Display (LCD)
Rosemount Analytical
Readout of sample oxygen content (0.00% to 100.00%) or selected test function,
depending on position of TEST switch.
Model 755A
Oxygen Analyzer
FUNCTION
TEST Switch (S1) Selects variable desired for readout on digital display.
Switch Position Readout on Digital Display Designation
1 Oxygen content of sample (0.00% to 100.00%) NORM
2 Pressure/Voltage CAL 1 CAL 1
3 Pressure/Voltage CAL 2 CAL 2
4
Zero suppression applied to analog output circuit
(0.00 to 10.00 VDC)
Used to establish downscale calibration point on digital display or recorder chart.
ZERO Control (R13)
With suitable downscale standard gas flowing through the analyzer, the ZERO
Control is adjusted for appropriate reading on display.
Used to establish upscale calibration point on digital display or recorder chart. With
SPAN Control (R16)
suitable upscale standard gas flowing through the analyzer, the SPAN Control is
adjusted for appropriate reading on display or recorder.
ZERO SUPPRESSION
Figure 3-1. Model 755A Front Panel Controls
3-2 Operation Rosemount Analytical Inc. A Division of Emerson Process Management
Page 35

Model 755A
Instruction Manual
245364-V
May 2002
NOTE:
The Zero and Span adjustments on the
analyzer door are used only for the
calibration of the digital readout for 0
to 100% oxygen.
The suppressed recorder ranges may
only be set up after the digital readout
has been calibrated. When setting up
a suppressed recorder range, use only
R41, R104 (setpoint) and R88 (Span)
for adjustments. DO NOT RE-ADJUST
THE ZERO AND SPAN CONTROLS ON
THE ANALYZER DOOR.
Example 2, Selection of a ZeroSuppressed Recorder Oxygen Range.
•
Desired oxygen range for recorder
output: 90% to 100%.
•
Required span of 10% oxygen (100%
- 90%) is selected when Recorder
Oxygen Span Jumper is placed in the
10X gain position.
•
Required zero suppression is 90%
oxygen, thus Recorder Zero
Suppression Jumper, is placed in
80% position, the highest setting
below the zero suppression level, and
R41, Recorder Zero Suppression
Coarse Adjustment, and R104,
Recorder Zero Suppression Fine
Adjustment, are adjusted for the
additional 10% required to reach the
desired zero suppression level (90%
desired level - 80% zero suppression
Jumper).
b. Readout of Applied Zero-Suppression
Voltage on Digital Display
In order to establish the precise zero
suppression required for the desired
recorder oxygen range, the actual applied
zero suppression voltage may be read on
the digital display.
Procedure:
1. Verify that Recorder Voltage Output
Jumper is in the position appropriate
to the recorder: 10 mV, 100 mV, 1 V
or 5 VDC.
2. Place the front panel TEST switch in
position 4, thus disconnecting the
signal input to permit display of the
zero-suppression voltage only.
3. Temporarily place Recorder Oxygen
Span Jumper in 100% oxygen (i.e.,
1X gain) position. The digital display
will now read the applied zero
suppression voltage in the range of
0.00 volt (equivalent to 0% oxygen) to
10.00 volts (equivalent to 100%
oxygen).
4. Obtain the required zero suppression
by appropriate combination of settings
on the Recorder Zero Suppression
Jumper and Recorder Zero
Suppression Adjustments R41 and
R104, as indicated by an exactly
correct reading on the digital display.
5. Return the Recorder Oxygen Span
Jumper to the normal operating
position for the selected range.
6. Set the front panel TEST switch to
position 1.
Example: With a highly expanded scale
such as the 99% to 100% oxygen range
of this example, a slight readjustment of
R104 may be required to set the recorder
pen at the precisely correct position on
the chart.
Rosemount Analytical Inc. A Division of Emerson Process Management Operation 3-3
Page 36

Instruction Manual
245364-V
May 2002
Model 755A
• Desired oxygen range for recorder
output: 99% to 100%.
•
Front panel TEST switch is set to
position 4, and Recorder Oxygen
Span Jumper is placed in 100%
oxygen (1X gain) position.
•
Required zero suppression is 99%
oxygen, thus Recorder Zero
Suppression Jumper is set in 80%
position, and Recorder Zero
Suppression Adj4ustments R41 and
R104 are set for a reading of 99.00
volts on the digital display.
•
Recorder Oxygen Span Jumper is
returned to 1% oxygen (100X gain)
position, normal span setting for 99%
to 100% oxygen range. R88 may be
used for fine span adjustment.
•
Set front panel TEST switch to
position 1.
3-3 STARTUP PROCEDURE
WARNING
POSSIBLE EXPLOSION HAZARD
If gases are introduced into this analyzer,
the sample containment system must be
carefully leak-checked upon installation
and before initial start-up, during routine
maintenance and any time the integrity of
the sample containment system is broken,
to ensure the system is in leak-proof
condition. Leak-check instructions are
provided in Section 2-7, page 2-10.
Internal leakage of sample resulting from
failure to observe these precautions could
result in an explosion causing death,
personal injury, or property damage.
Pass suitable on-scale gas (not actual
sample) through the analyzer. Turn power
ON. If digital display gives over-range
indication, the probable cause is hang-up of
the suspension within the detector assembly.
To correct this condition, turn power OFF; tap
detector compartment with fingers; wait 30
seconds; re-apply power.
When on-scale reading is obtained, allow
analyzer to warm up for at least one hour with
gas flowing. This warm-up is necessary
because a reliable calibration is obtainable
only after the analyzer reaches temperature
stability. Moreover, the resultant elevated
temperature will ensure against condensation
within, and possible damage to the detector
assembly.
After analyzer warm-up, the digital display or
recorder should give stable, drift-free readout;
if so, proceed to Section 3.3. Otherwise refer
to Section 6, Service and Maintenance.
3-4 CALIBRATION
Calibration for oxygen readout consists of
establishing a downscale and upscale point.
a. Calibration Using Digital Readout for
Oxygen Readout
The digital display covers the full range of
0.00% to 100.005 oxygen and thus will
normally be used as the readout device
during calibration. If so, almost any
down-scale and upscale standards may
be used. Typically the downscale
standard will be an oxygen-free gas such
as nitrogen, and the upscale standard will
be some readily obtained gas such as dry
air (20.93% oxygen) or 100% oxygen.
Purity requirements will be dictated by the
accuracy requirements of the application.
b. Calibration Using Recorder for Oxygen
Readout
In some applications the recorder readout
may be the important display and may
thus be used during calibration. If so, the
down-scale standard gas is selected to
establish a calibration point at or near the
lower range-limit of the selected range:
1. A zero-based range normally uses an
oxygen-free gas, typically nitrogen.
3-4 Operation Rosemount Analytical Inc. A Division of Emerson Process Management
Page 37

Model 755A
Instruction Manual
245364-V
May 2002
2. A zero-suppressed range uses a
blend consisting of a suitable
percentage of oxygen contained in a
background gas, typically nitrogen.
The upscale standard gas is required to
establish a calibration point at or near the
upper range limit. For example, if this
A. TYPICAL ZERO-BASED RANGES
0 to 1 Nitrogen 0.9% O2 Balance N2
0 to 10 Nitrogen 9% O2 Balance N2
0 to 100 Nitrogen 100% O2
B. TYPICAL ZERO-SUPPRESSED RANGES
RANGE
% O2
20 to 21
11 to 21
99 to 100
90 to 100
20.2% ±0.2% O2
11.2% ±0.2% O2 Balance N2
High Purity O2 with 0.8% ±0.05% High Purity N2
91% ±0.5% O2 Balance N2
RECOMMENDED STANDARD GAS
range limit is 21% (or somewhat greater
than 21%), the usual upscale standard
gas is dry air (20.93% oxygen).
Typical examples of standard gases for
recorder oxygen ranges are shown in
Table 3-2, page 3-6.
RECOMMENDED UPSCALE
STANDARD GAS
Air (20.93% O2)
Air (20.93% O2)
High Purity O2
High Purity O2
Table 3-1. Standard Gases Recommended for Calibration of Various Oxygen Ranges on Analog Output
Rosemount Analytical Inc. A Division of Emerson Process Management Operation 3-5
Page 38

Instruction Manual
245364-V
May 2002
ITEM CONTROL DESCRIPTION
Model 755A
Recorder Oxygen Span
1
Selection Jumper
Recorder Zero
2
Suppression Selection
Jumper
Recorder Zero
3
Suppression Coarse
Adjustment R41
Recorder Zero
4
Suppression Fine
Adjustment R104
Recorder Voltage
5
Output Selection Jumper
Recorder Span
6
Adjustment R88
CAL 1 Potentiometer
7
R98
CAL 2 Potentiometer
8
R99
Detector Coarse Zero
9
Adjustment R9
Response Time
10
Adjustment R30
Response Ratio Timing
11
Potentiometer R29
ALARM 2 Calibration
12
Adjustment R67
ALARM 2 Setpoint
13
Adjustment R68
ALARM 2 Deadband
14
Adjustment R78
ALARM 1 Calibration
15
Adjustment R63
ALARM 1 Setpoint
16
Adjustment R64
ALARM 1 Deadband
17
Adjustment R73
Current Output Zero
8
Adjustment R1
Current Output Span
19
Adjustment R2
Provides selectable span of 100%, 20%, 10%, 5%, 2%, or 1% oxygen for analog output
to recorder and alarms. Note that on the circuit board the jumper positions are marked
according to the amplifier gain.
Used in combination with item 3 to establish required zero suppression to obtain desired
range for analog output to recorder and alarms. Jumper provides selectable zero
suppression of 20%, 40%, 60%, or 80%
Continuously adjustable from 0% to 25% oxygen. Thus the total suppression range is
0% to 105% oxygen.
Adjustable range of 2%.
Provides selectable output of 10mV, 100mV, 1V or 5V for a voltage recorder.
Provides ±5% span adjustment of recorder output.
Used in calibration of automatic pressure compensation.
Used in calibration of automatic pressure compensation.
Provides coarse adjustment of detector zero by shifting the null position of the detector
within the magnetic field. It is adjusted at the factory and does not require readjustment
except after replacement of detector.
Provides adjustment range of 5 to 25 seconds for electronic response time (0 to 90% of
fullscale). Adjusting clockwise decreases response time.
Permits compensation for slight gain changes that may result from adjustment of R20.
At the factory, R29 is adjusted to establish the exact resistance ratio required and is
then secured with locking compound.
Used for initial calibration of ALARM 2 circuit.
Provides continuously variable adjustment of setpoint for ALARM 2 circuit on alarm
accessory, for actuation of external, customer supplied alarm and/or control device(s).
Adjustment range is 0 to 100% of fullscale span.
Permits adjusting deadband of ALARM 2 circuit from 1% of fullscale (counterclockwise
limit) to 20% of fullscale (clockwise limit). Deadband is essentially symmetrical with
respect to setpoint.
See item 12 above.
See item 13 above.
See item 14 above.
Use to set zero-level current output, i.e., 4mA for 4 to 20mA board, 0mA for 0 to 20mA
board.
Use to set fullscale current output at 20mA for 4 to 20mA or 0 to 20mA board or at
50mA for 10 to 50mA board.
Refer to Figure 3-2, page 3-7, for component locations.
Table 3-2. Model 755A Internal Adjustments
3-6 Operation Rosemount Analytical Inc. A Division of Emerson Process Management
Page 39

Model 755A
Door
Instruction Manual
245364-V
May 2002
Control Board
19
R3
U5
I G O
C5
I G O
R4
R5
R6
U6
U3
U2
C4
C2
U4
C3 CR1 C1
R2 R1
U1
J1
R8
R9
CR2
1
2
3
4
I
G
O
1
2
6
18
15
16
17
14
13
7
5
3
12
4
8
9
1110
Refer to Table 3-2, page 3-6, for descriptions.
Figure 3-2. Model 755A Internal Adjustments Locations
Rosemount Analytical Inc. A Division of Emerson Process Management Operation 3-7
Page 40

Instruction Manual
245364-V
May 2002
Model 755A
c. Calibration with Downscale and
Upscale Standard Gases
1. Set downscale calibration point as
follows:
a. Set TEST switch (on analyzer
door) to NORM.
b. Pass downscale standard gas
through analyzer at suitable flow
rate, preferably 250 cc/min.
Allow gas to purge analyzer for
minimum of 3 minutes.
NOTE:
The Zero and Span adjustments on
the analyzer door are used only for
the calibration of the digital readout
for 0 to 100% oxygen.
The suppressed recorder ranges may
only be set up after the digital
readout has been calibrated. When
setting up a suppressed recorder
range, use only R41, R104 (setpoint)
and R88 (Span) for adjustments. DO
NOT RE-ADJUST THE ZERO AND
SPAN CONTROLS ON THE
ANALYZER DOOR.
c. Adjust ZERO Control so that
the reading on the digital
display or recorder is
appropriate to the downscale
standard gas. (The required
reading may be the actual
oxygen content of the
downscale standard gas or
may be an adjusted value,
depending on the relative
magnetic susceptibilities
involved. Refer to Section 35c, page 3-10). If proper
reading is not obtained by an
adjustment of the ZERO
Control, refer to Section 6,
Service and Maintenance.
2. Set upscale calibration point as
follows:
a. Verify that front panel TEST
switch is set to NORM.
b. Pass upscale standard gas
through analyzer at same flow
rate as was used for downscale
standard gas. Allow gas to
purge analyzer for minimum of 3
minutes.
c. Adjust SPAN Control so that
reading on digital display or
recorder is appropriate to the
upscale standard gas. (The
required reading may be the
actual oxygen content of the
upscale standard gas or may be
an adjusted value, depending
on the relative magnetic
susceptibilities involved. Refer
to Section 3-5c, page 3-10). If
proper reading is unobtainable
by adjustment of the SPAN
control, refer to Section 6,
Service and Maintenance.
Repeat steps 1 and 2 to ensure no
interaction has occurred.
d. Calibration of Automatic Pressure
Compensation
Oxygen readout is automatically
corrected to within ±1% of fullscale for
barometric pressure variations within
±3% of the target value and is corrected
to within ±2% of fullscale for variations
within ±5% of the target value. The
target value may be set anywhere within
the range of -2.7 to 3.3 psig ±3 psig (-
18.6 to 22.8 kPa ±21 kPa). The factory
setting is 0 psig (0 kPa). This setting is
suitable for applications where (a) the
analyzer exhaust port is vented directly
to the atmosphere, and (b) the
installation site is at or near sea level. If
conditions are otherwise, the pressure
compensation circuit must be recalibrated by the following procedure:
3-8 Operation Rosemount Analytical Inc. A Division of Emerson Process Management
Page 41

Model 755A
Instruction Manual
245364-V
May 2002
Pressure
Gauge
PR1
Sample In
10 psig
V1
Figure 3-3. Calibration by Pressure Decrease Setup
Standard Procedure: Calibration by
Pressure Decrease
1. Verify that the Pressure
Compensation Option is selected,
i.e., Jumper inserted between E1
and E3 on the Control Board.
2. Connect a compound range
pressure gauge (or mercury
manometer), pressure gauge,
pressure regulator, flowmeter,
needle valves and vacuum pump as
shown in Figure 3-3 above.
3. Open V2, set PR1 to approximately
10 psig (69 kPa) and adjust V1 for a
flow rate of 250 cc/min. into the
sample inlet line. Compound range
pressure gauge (or mercury
manometer) should indicate close to
atmospheric pressure (0.00).
F1
cc/min
250
Compound Range
Pressure Gauge or
Mercury Manometer
Sample
755A
In
Vacuum
Pump
V3
V2
V4
5. Set TEST switch to NORM and note
display reading.
6. Start vacuum pump.
7. Close V2 and adjust V3 and V4 to
decrease the pressure on the
sample exhaust by about 3%. (-
12.00 inches of water; -0.4 psi; -23
mm of mercury; -3 kPa).
8. Adjust CAL 2 potentiometer R99
(see Table 3-2, page 3-6, and
Figure 3-2, page 3-7) until reading
on display is the same noted in step
5.
9. Repeat steps 3 through 7 as many
times as necessary to ensure
repeatability of compensation
calibration.
4. Set TEST switch to PRESS CAL 1
and adjust CAL 1 potentiometer R98
(see Table 3-2, page 3-6, and
Figure 3-2, page 3-7) for a reading
of 00.00±5 counts on the display.
Although not mandatory, it is
desirable, in order to obtain
maximum accuracy, that the oxygen
concentration of the gas used during
NOTE
calibration be close to that of the
process stream which is to be
analyzed.
Rosemount Analytical Inc. A Division of Emerson Process Management Operation 3-9
Page 42

Instruction Manual
245364-V
May 2002
3-5 COMPENSATION FOR COMPOSITION OF
BACKGROUND GAS
Model 755A
Any gas having a compensation other than
100% oxygen contains background gas.
The background gas comprises all nonoxygen constituents.
Although instrument response to most gases
other than oxygen is comparatively slight, it
is not in all cases negligible. Contribution of
these components to instrument response
cab be computed for each individual case.
If the downscale and upscale standard
gases contain the same background gas as
the sample, the routine standardization
procedure automatically compensates for
the background components; therefore, they
introduce no error. If the background gas in
the sample is different from that in the
downscale and/or upscale standard gas(es),
however, background effects must be taken
into consideration to ensure correct readout.
During adjustment of the ZERO and SPAN
controls (on the analyzer door), the
instrument is set to indicate, not the true
oxygen content of the downscale and
upscale standard gases, but slightly different
values calculated to provide correct readout
during subsequent analysis of the sample
gas. The calculations are explained in
Section 3-5c below.
a. Oxygen Equivalent Values of Gases
For computation of background corrections, the
analyzer response to each component of the
sample must be shown.
Table 3-3 (page 3-11) lists the
percentage oxygen equivalent values for
many common gases.
To select a random example from Table
3-3 (page 3-11), if analyzer response to
oxygen is +100%, the response to
xenon would be -1.34%.
b. Oxygen Equivalents of Gas Mixtures
The oxygen equivalent of a gas mixture
is the sum of the contribution of the
individual gas components.
Example: At lower range limit, i.e., 0%
oxygen, composition of sample is 80%
CO
2
, 20% N2.
From Table 3-3(page 3-11), the %
oxygen equivalents are CO
2
N
, -0.358.
2
. -0.623 and
% oxygen equivalent of the mixture =
0.8 x (-0.623) + 0.2 x (-0.358) = (-
0.4984) + (-0.0716) = -0.570
c. Computing Adjusted Settings for
Zero and Span Controls
During instrument calibration, Adjusted
Values may be required in setting the
ZERO and SPAN control to correct for
the magnetic susceptibility of the
background gas. Terms used in the
equation are defined as:
Standard Oxygen equivalent of
background gas in the standard. Refer
to Table 3-3 (page 3-11).
Special Oxygen equivalent of
background gas in the sample. Refer to
Table 3-3 (page 3-11) for values.
The percentage oxygen equivalent of a
gas is the instrument response to the
given gas compared to the response to
oxygen, assuming that both gases are
supplied at the same pressure.
In equation form:
%O2 Equivalent of Gas =
Analyzer Response to Gas
Analyzer Response to O
3-10 Operation Rosemount Analytical Inc. A Division of Emerson Process Management
2
X 100
Calibration and measurement must be
made at the same pressure in the
detector cell unless the user makes the
compensation referred to in Section 3-8,
page 3-14.
Adjusted value = % O2 in Std +
% O2 in Std
100
[100(Spl-Std)]-100(Spl-Std)
100
Page 43

Model 755A
Instruction Manual
245364-V
May 2002
Example:
Sample is oxygen in a background of
2
CO
. (Oxygen equivalent of CO2 is -
0.623).
Standard is the following:
Pure nitrogen for ZERO gas.
21% oxygen, 79% nitrogen for SPAN gas.
(Oxygen equivalent of nitrogen is -0.358).
With nitrogen ZERO gas flowing, Adjusted
Value is the following:
0
[100((-0.623)-(-0.358))]-100((-0.623)-(-0.358))
100
0 + =
0-100(-0.265)
100
= 0.265
100
Display should be made to read 0.265%
oxygen with ZERO control.
With SPAN gas (21% oxygen, 79%
nitrogen) flowing, Adjusted Value is the
following:
21
[100((-0.623)-(-0.358))]-100((-0.623)-(-0.358))
100
21+ =
0-211(-26.5)-(-26.5)
21+ = 21 + = 21.21%
100
100
-5.565+26.5
100
Display should be made to read 21.21%
oxygen with SPAN control.
In limiting cases the general equation
reduces to simpler forms:
1. If the SPAN gas is 100% oxygen,
there is no background gas and thus
no correction.
2. If the ZERO gas is oxygen-free, the
adjusted value for setting the ZERO
control becomes -((-0.623)-(-0.358)).
When the ZERO gas is more
diamagnetic than the background gas
in the sample, this difference is
negative. Use a recorder with belowzero capability to set negative values.
GAS EQUIV. % AS O
Acetylene, C2H
Allene, C3H
Ammonia, NH
2
4
3
-0.612
-0.744
-0.479
Argon, A -0.569
Bromine, Br
1,2-Butadiene C4H
1,3-Butadiene C4H
n-Butane, C4H
iso-Butane, C4H
Butene-1, C4H
cis Butene-2, C4H
iso-Butene, C4H
trans butene-2, C4H
Carbon Dioxide CO
2
6
6
10
10
8
8
8
8
2
-1.83
-1.047
-1.944
-1.481
-1.485
-1.205
-1.252
-1.201
-1.274
-0.623
Carbon Monoxide, CO -0.354
Ethane, C2H
Ethylene, C2H
Helium, H
n-Heptane, C7H
n-Hexane, C6H
cyclo-Hexane, C6H
Hydrogen, H
6
4
e
16
12
12
2
-0.789
-0.553
-0.059
-2.508
-2.175
-1.915
-0.117
Hydrogen Bromide, Hbr -0.968
Hydrogen Chloride, HC1 -0.651
Hydrogen Fluoride, HF -0.253
Hydrogen Iodide, HI -1.403
Hydrogen Sulphide, C2S -0.751
Kryton, Kr -0.853
Methane, CH
4
-0.512
Neon, Ne -0.205
Nitric Oxide, NO +44.2
Nitrogen, N
Nitrogen Dioxide, NO
n-Octane, C8H
Oxygen, O
n-Pentane, C5H
iso-Pentane, C5H
neo-Pentane, C5H
Propane, C3H
Propylene, C3H
2
2
18
2
12
12
12
8
6
-0.358
+28.7
-2.840
+100.0
-1.810
-1.853
-1.853
-1.135
-0.903
Water, H2O -0.381
Xenon, Xe -1.340
2
Table 3-3.Oxygen Equivalents of Common Gases
Rosemount Analytical Inc. A Division of Emerson Process Management Operation 3-11
Page 44

Instruction Manual
245364-V
May 2002
3-6 DUAL ALARM OPTION
a. Initial Calibration and Selection of
Setpoints for Alarms
The ALARM 1 and ALARM 2 circuits have
independent setpoint and deadband
adjustments (see Table 3-1, page 3-5,
and Figure 3-2, page 3-7). Initially the
ALARM 1 and ALARM 2 setpoint
adjustments must be calibrated by means
of the ALARM 1 and ALARM 2 calibration
adjustments.
1. Set TEST switch to NORM.
2. Pass upscale standard gas through
the analyzer at a flow rate of 50 to
500 cc/min.
Model 755A
Calibration of ALARM 2, LOW:
1. Rotate setpoint potentiometer R67 full
counterclockwise.
2. Adjust SPAN control to obtain a display
or recorder reading exactly fullscale. . If
the fullscale setting cannot be reached,
then set to a reading higher than the
desired alarm setpoint.
3. Set ALARM 1 calibration adjustment,
R67, to its clockwise limit. Turn R63
counterclockwise the minimum required
to energize ALARM 1 (relay K1, Figure
3-4, page 3-13). Energization may be
verified by connecting an ohmmeter to
relay terminals on 638254 Alarm Relay
Assembly (Figure 2-1, page 2-2).
Setpoint of ALARM 1, HIGH
3. Verify that ALARM 1 and ALARM 2
deadband adjustments are fully
counterclockwise to set deadband at
minimum. Normally these
potentiometers are factory-set for
minimum deadband. Both
potentiometers must remain at this
setting throughout calibration of the
alarm setpoints.
Calibration of ALARM 1, HIGH:
Rotate setpoint adjustment R64 full
counterclockwise.
Adjust SPAN control to obtain a display or
recorder reading exactly fullscale. If the
fullscale setting cannot be reached, then
set to a reading higher than the desired
alarm setpoint.
Set ALARM 1 calibration adjustment,
R63, to its clockwise limit. Turn R63
counterclockwise the minimum required to
energize ALARM 1 (relay K1, Figure 3-4,
page 3-13). Energization may be verified
by connecting an ohmmeter to relay
terminals on 638254 Alarm Relay
Assembly (Figure 2-1, page 2-2).
1. With span gas flowing, adjust SPAN
Control to read desired alarm setpoint
on display or recorder.
2. Turn setpoint adjustment, R64,
clockwise to energy relay.
3. Check this setting by adjusting the
SPAN Control to lower the output
below the setpoint. This will reenergize the relay. Turning R64
above the setpoint will energize the
relay.
Setpoint of ALARM 2, LOW
1. With span gas flowing, adjust SPAN
Control to read desired alarm setpoint
on display or recorder.
2. Turn setpoint adjustment, R68,
clockwise to energy relay.
3. Check this setting by adjusting the
SPAN Control to lower the output
below the setpoint. This will reenergize the relay. Turning R68
above the setpoint will energize the
relay.
3-12 Operation Rosemount Analytical Inc. A Division of Emerson Process Management
Page 45

Model 755A
b. Selection of Deadband
The desired deadband may be selected
with the appropriate trimming
potentiometer:
ALARM 1 = R73
ALARM 2 = R78
For any setpoint, deadband is adjustable
from 1% of fullscale (counterclockwise
limit) to 20% of fullscale (clockwise limit).
Deadband is essentially symmetrical with
respect to setpoint.
Instruction Manual
245364-V
May 2002
2. CR1 AND CR2 ARE ANY 600V, 1A DIODE.
1. RELAYS SHOWN IN ENERGIZED POSITION.
NOTES:
+15V
-15V
ALARM 1
COMMAND
ALARM 2
COMMAND
J5
1
2
4
6
CR1
14
K1
CR2
14
K2
13
13
1
5
12 8
1
5
12 8
NO
9
COM
NC
ALARM 1
RESET
NO
9
COM
NC
ALARM 2
RESET
Figure 3-4. Schematic Circuit of Alarm Relay Assembly
Rosemount Analytical Inc. A Division of Emerson Process Management Operation 3-13
Page 46

Instruction Manual
245364-V
May 2002
3-7 ROUTINE OPERATION
Model 755A
3-8 EFFECT OF BAROMETRIC PRESSURE
CHANGES ON INSTRUMENT READOUT
After the calibration procedure of Section 3-4
(page 3-4), admit sample gas to the analyzer
at the same pressure and the same flow rates
used for the zero and span gases. The
instrument will now continuously indicate the
oxygen content of the sample gas.
At this time, an adjustment of electronic
response time (R30 on the Control Board, see
Table 3-1, page 3-5, and Figure 3-2, page 3-
7), may be desirable to obtain the optimum
compromise between response speed and
noise.
If the analyzer exhaust port is vented through
a suitable absolute backpressure regulator,
and the installation site is at or near sea level,
barometric pressure changes do not affect the
percent oxygen readout. If conditions are
otherwise, the pressure compensation circuit
must be re-calibrated per Section 3-4d, page
3-8.
3-9 CALIBRATION FREQUENCY
The appropriate calibration interval will
depend on the accuracy required in the
particular application, and is best determined
by keeping a calibration log.
3-14 Operation Rosemount Analytical Inc. A Division of Emerson Process Management
Page 47

Model 755A
Instruction Manual
245364-V
May 2002
SECTION 4
THEORY
4-1 PRINCIPLES OF OPERATION
Oxygen is strongly paramagnetic while most
other common gases are weakly diamagnetic.
The paramagnetism of oxygen may be
regarded as the capability of an oxygen
molecule to become a temporary magnet
when placed in a magnetic field. This is
analogous to the magnetization of a piece of
soft iron. Diamagnetic gases are analogous to
non-magnetic substances.
With the Model 755A, the volume magnetic
susceptibility of the flowing gas sample is
sensed in the detector/magnet assembly. As
shown in the functional diagram of Figure 4-2,
(page 4-3), a dumbbell-shaped, nitrogen-filled,
hollow glass test body is suspended on a
platinum/nickel alloy ribbon in a non-uniform
magnetic field.
Because of the “magnetic buoyancy” effect,
the spheres of the test body are subjected to
displacement forces, resulting in a
displacement torque that is proportional to the
volume magnetic susceptibility of the gas
surrounding the test body.
Measurement is accomplished by a
null-balance system, where the displacement
torque is opposed by an equal, but opposite,
restorative torque. The restorative torque is
due to electromagnetic forces on the spheres,
resulting from a feedback current routed
through a titanium wire conductor wound
lengthwise around the dumbbell.
In effect, each sphere is wound with a
one-turn circular loop. The current required to
restore the test body to null position is directly
proportional to the original displacement
torque, and is a linear function of the volume
magnetic susceptibility of the sample gas.
light from the source lamp is reflected off the
square mirror attached to the test body, and
onto the dual photocell.
The output current from the dual photocell is
equal to the difference between the signals
developed by the two halves of the photocell.
This difference, which constitutes the error
signal, is applied to the input of an amplifier
circuit that provides the restoring current.
When the test body is in null position, both
halves of the photocell are equally illuminated,
the error signal is zero, and the amplifier is
unequal. As soon as the test body begins to
rotate, the amounts of light becomes unequal,
resulting in application of an error signal to the
input of the amplifier circuit. The resultant
amplifier output signal is routed through the
current loop, thus creating the
electromagnetic forces required to restore the
test body to null position.
a. Magnetic Displacement Force
Because the magnetic forces on the
spherical ends of the test body are the
basis of the oxygen measurement, it is
worthwhile to consider the force acting on
one of these spheres alone and to
disregard, for the present, the remainder
of the detector. A small sphere
suspended in a strong non-uniform
magnetic field, Figure 4-1 (page 4-2), is
subjected to a force proportional to the
difference between the magnetic
susceptibility of this sphere and that of the
surrounding gas.
Magnitude of the force is expressed by
the following (simplified) equation:
F
k = c (k - ko)
The restoring current is automatically
maintained at the correct level by an
electro-optical feedback system. A beam of
Rosemount Analytical Inc. A Division of Emerson Process Management Theory 4-1
Page 48

Instruction Manual
245364-V
May 2002
Where:
c = A function of the magnetic field
strength and gradient
k = Magnetic susceptibility of the
surrounding gas
k
o = Magnetic susceptibility of the
sphere
The forces exerted on the two spheres of
the test body are thus a measure of the
magnetic susceptibility of the sample and,
therefore, of its oxygen content.
Shaded
Pole
Piece
Sphere
(Magnetic Susc eptibility = k
F
k
Model 755A
b. Physical Configuration of
Detector/Magnet Assembly
As shown in Figure 4-3A (page 4-4), the
Detector/Magnet Assembly consists of
three major components; the magnet
assembly, the detector assembly and the
optical bench assembly.
The magnet assembly includes a sample
pre-heating coil. It is connected into the
sample line upstream from the detector
and is heated to approximately the same
temperature as the detector assembly.
For convenience in servicing, the detector
and the optical bench are self-aligning
assemblies that utilize slip-on sample
connections and plug-in electrical
connections.
Within the detector assembly, Figure 4-3B
)
o
(page 4-4), the incoming preheated
sample passes through an integral 5
micron diffusion screen. It protects the
test body by preventing entry of
particulate matter and/or entrained liquid
mist. Additionally, the screen isolates the
test body from flow effects, ensuring that
instrument readout is relatively
independent of flow rate within the
optimum range of 200 to 300 cc/min.
Sample Gas
(Magnetic Susc eptibility = k )
As percentage of oxygen in sample gas increases,
displacement force (F
Note:
) increases.
k
At the rear of the detector are an integral
temperature sensor (RT1) and an integral
heater (HR2). Another heater (HR1) is
attached to the magnet. Sensor RT1
provides the input signal to the detector
temperature control circuit of the Case
Board assembly, Section 4-3c (page 4-7).
This circuit controls application of
Figure 4-1. Spherical Body in Non-Uniform
electrical power to both HR1 and Hr2.
Magnetic Field
On the optical bench assembly, Figure
4-3C (page 4-4), the source lamp and the
photocell plate are externally accessible,
permitting convenient replacement.
4-2 Theory Rosemount Analytical Inc. A Division of Emerson Process Management
Page 49

Model 755A
Displacement
Torque
Instruction Manual
245364-V
May 2002
Balancing
Wei ght
Electromagnetic
Axis
Restoring
Platinum/Nickel Alloy
Suspension Ribbon
TEST BODY DETAIL
Displacement
Torque
Restoring
Torque
Current
Mirror
Restoring
Torque
Titanium W ire Conductor
Restoring
Current
Electromagnetic
Axis
Balancing W eight
Nitrogen-Filled Hollow Glass
Test Body
Restoring
Magnet
Shaded Pole Pieces (4)
Dual Photocell
BT1, BT 2
Test Body
Source Lamp
DS1
DETECTOR/MAGNET
Current
ASSEMBLY
Zero
CONTROL
ASSEMBLY
Span
% Oxygen
Readout
Figure 4-2. Functional Diagram of Model 755A Paramagnetic Oxygen Measurement System
Rosemount Analytical Inc. A Division of Emerson Process Management Theory 4-3
Page 50

Instruction Manual
)
245364-V
May 2002
Model 755A
Sample Pre-Heating Coil
Sample Inlet Tube
Sample Outlet Tube
Magnet Assembly
Detector Assembly
Optical Bench Assem bly
Mounting Screws (2)
A. Exploded View of Detector/Magnet Assembly
Integral Temperature
➋
Integral Heater (HR2
➋
Dual Photocell
➊
Optical Bench Assem bly
➊
Detector Assembly
➋
Sensor (RT1)
➊
Integral 5-Micron
➋
Diffusion Screen
Tes t B od y
➋
Mirror
Source Lamp
B. Sectional Top View of Optical Bench
and Detector Assemblies
Connector J12
Connector J12
Photocell
Lock S crews (2)
Lamp Retaining
Set Screw
Lamp Viewing Hole
Source Lamp
Assembly
C. Exploded View of Optical Bench
Assembly
Dual Photocell
Figure 4-3. Detector/Magnet Assembly
4-4 Theory Rosemount Analytical Inc. A Division of Emerson Process Management
Page 51

Model 755A
Instruction Manual
245364-V
May 2002
4-2 VARIABLES INFLUENCING
PARAMAGNETIC OXYGEN
MEASUREMENTS
Variables that influence paramagnetic oxygen
measurements include: operating pressure,
Section 4-2a below; sample temperature,
Section 4-2b below; interfering sample
components, Section 4-2c (page 4-5); and
vibration 4-2d (page 4-5).
a. Pressure Effects
Although normally calibrated for readout
in percent oxygen, the Model 755A
actually responds to oxygen partial
pressure. The partial pressure of the
oxygen component in a gas mixture is
proportional to the total pressure of the
mixture. Thus readout is affected by
pressure variations. However, the
instrument incorporates electronic
circuitry that provides automatic pressure
compensation for pressure variations
within ±3% of the target value, which may
be set anywhere in the range of -2.7 to
3.3 psig ±3 psig (-18.6 to 22.8 kPa ±21
kPa).
passing through a coil maintained at
approximately the same temperature
as the detector.
3. The detector is maintained at a
controlled temperature of 150°F
(66°C).
c. Interferents
Instrument response to most non-oxygen
sample components is comparatively
slight but is not, in all cases, negligible.
Table 3-3 (page 3-11) lists the readings
that would be obtained with various gases
on an instrument previously calibrated
with 100% oxygen, assuming that all
gases are admitted at the same pressure.
During initial installation of an instrument
for a given application, effects of the
background gas should be calculated to
determine if correction is required. See
Section 3-5c, page 3-10.
d. Vibration Effects
Instrument Design
WARNING
POSSIBLE EXPLOSION HAZARD
Never subject the sensing unit to an
absolute pressure of less than 500 mm Hg
(66.7 kPa).
b. Temperature Effects
Magnetic susceptibilities and partial
pressures of gases vary with temperature.
In the Model 755A, temperature-induced
readout error is avoided by control of
temperatures in the following areas:
1. Interior of the analyzer case is
maintained at 140°F (60°C) by an
electronically controlled heater and
associated fan.
2. Immediately downstream from the
inlet port, prior to entry into the
detector, the sample is preheated by
To minimize vibration effects, the
detector/magnet assembly is contained in
a shock-mounted compartment, Figure
1-2 (page 1-3).
Installation
Avoid excessive vibration. In making
electrical connections, do not allow any
cable to touch the shock-mounted
detector/magnet assembly or the
associated internal sample inlet and outlet
tubing. This precaution ensures against
possible transmission of mechanical
vibration through the cable to the
detector, which would cause noisy
readout.
Electronic Response Time
If readout is noisy despite precautions
mentioned above, obtain slower electronic
response by counterclockwise adjustment
of Response Time Adjust R30 (see Table
3-2, page 3-6, and Figure 3-2, page 3-7).
Rosemount Analytical Inc. A Division of Emerson Process Management Theory 4-5
Page 52

Instruction Manual
245364-V
May 2002
Model 755A
4-3 ELECTRONIC CIRCUITRY
Electronic circuitry and internal
interconnection wiring is shown in the
schematic diagrams and wiring diagram in the
rear of this manual. For detailed circuit
analysis, refer to Section 5.
a. Detector/Magnet Assembly
A cross-sectional view of the optical
bench and detector assemblies is shown
in Figure 5-3B. Source lamp DS1,
powered by a supply circuit on the Case
Board (Section 4-3c, page 4-7), directs a
light beam onto the mirror attached to the
test body. The mirror reflects the beam
onto dual photocell BT1, BT2.
The difference between the signals
developed by the two halves of the
photocell constitutes the error signal
supplied to the input of amplifier U1 on
the Control Board. Amplifier U1 drives U2
which, in turn, supplies the restoring
current to the titanium wire loop on the
test body (see Section 4-1, page 4-1).
Elements of Detector Temperature
Control Circuit
Detector temperature is sensed by
thermistor RT1, an integral part of the
detector assembly (see Figure 4-3B, page
4-4). The thermistor provides the input
signal to the detector temperature control
circuit on the Case Board:
The output from this circuit is applied to
the two heaters within the
detector/magnet assembly; HR1,
mounted on the top of the magnet, and
HR2, mounted permanently on the rear of
the detector assembly.
b. Control Board and Associated
Circuitry
The Control Board contains signal
conditioning and control circuitry. The
Control Board is mounted on the inside of
the analyzer door (see Figure 1-2 on page
1-3).
The Control Board contains the following:
Input Amplifier U1
This amplifier receives the error signal
from the dual photocell of the detector
assembly and drives amplifier U2.
Amplifier U2 and Associated Zero
Adjustment
Amplifier U2 supplies the restoring current
to the titanium wire loop of the test body
within the detector assembly. Front panel
ZERO Control R13 applies an adjustable
zero biasing signal to the input of U2 to
permit establishing a zero calibration point
on the display or recorder. With
downscale zero standard gas flowing
through the analyzer, the ZERO control is
adjusted for the appropriate reading.
Amplifier U4 and A
Adjustment
Amplifier U4 and associated feedback
resistors provide a signal amplification of
X4, resulting in a signal level suitable for
analog divider circuit U6. Front panel
SPAN adjustment R16 modifies the value
of the input resistance and hence the
signal amplification factor. Adjustment
range is approximately ±30%.
The SPAN adjustment permits
establishing an upscale calibration point
on the display or recorder. With upscale
standard gas flowing through the
analyzer, the SPAN control is adjusted for
the appropriate reading.
Pressure Compensation Circuit
The pressure compensation circuit
consists of divider U6 and associated
components. This circuit provides a
pressure-corrected output signal
conditioned to the range of 0 to 10 VDC.
The circuit solves the follow equation:
Vo = k (Vx/Vz)
sociated Span
S
4-6 Theory Rosemount Analytical Inc. A Division of Emerson Process Management
Page 53

Model 755A
Instruction Manual
245364-V
May 2002
where
Vo = the corrected output signal
Vx = the amplified detector-output
signal, which includes a pressure
factor
Vz = the pressure signal derived
from: (a) The pressure sensor and
associated amplifiers, and (b) the
positive reference voltage power
supply
k = the constant that is characteristic
of the circuit
Amplifier U8
This amplifier works in conjunction with
analog divider U6, providing conditioned
output signal Vo as described in
Pressure Compensation Circuit above.
Amplifier U10
U10 is an non-inverting buffer amplifier
that incorporates an anticipation
arrangement in its input network, thus
providing slightly faster response time
(90% of fullscale on the readout device(s).
Potentiometer R30 provides a
continuously variable adjustment of 5 to
25 seconds for the electronic anticipation
time and is factory-set for 20 seconds.
provides zero suppression, scale
expansion, and amplification preparatory
to use for potentiometric recorder,
voltage-to-current conversion for current
recorder, and/or alarm functions.
Zero suppression is obtained as the sum
of (1) a jumper selectable, fixed value of
0%, 20%, 40%, 60%, or 80% and (2) a
continuously adjustable value of 0% to
25%.
The scale expansion factor is jumper
selectable for 1, 10, or 100.
Potentiometric output is jumper selectable
for 0 to 10mV, 0 to 100mV, 0 to 1V, or 0
to 5VDC.
c. Case Board
The Case Board contains power supply
and temperature control circuits. The
board is mounted inside of the analyzer
case (see Figure 1-2 on page 1-3).
The various circuits operate on main
power transformer T1. The two primary
windings of T1 are configured (at the
factory) for operation on either 120 VAC
or 220 VAC.
The Case Board consists of the following:
Source Lamp Power Supply
Since the anticipation network attenuates
the signal, a gain of 10 is provided in U10
to restore the signal to the desired
fullscale range of 0 to 10 VDC.
The pressure-corrected signal from U10 is
routed to two output circuit:
Digital Output Circuit. The signal from
U10 passes through TEST switch SW1
and a filter circuit to an integrating analogto-digital converter. The resulting digital
signal drives the liquid crystal display.
Analog Output Circuit . The output from
U10 is provided as an input to the
recorder output amplifier. This circuitry
Rosemount Analytical Inc. A Division of Emerson Process Management Theory 4-7
This circuit provides a regulated output of
2.30 VDC to operate incandescent source
lamp DS1 within the optical bench
assembly. One secondary of main power
transformer T1 drives a fullwave rectifier
consisting of CR7 and CR8. The output
of DS1 is held constant by a voltage
regulator circuit utilizing U7, Q4, and Q5.
±15V Power Supply
This circuit provides DC voltages
required for various amplifiers and other
circuits. Fullwave rectifier bridge CR5
provides both positive and negative
outputs. Each is routed through an
associated series-type integrated circuit
Page 54

Instruction Manual
245364-V
May 2002
Model 755A
voltage regulator, providing regulated
outputs of +15V and -15V.
Detector Temperature Control
This circuit maintains the detector at a
controlled temperature of 150°F (66°C).
Temperature is sensed by RT1, a
resistance element permanently attached
to the detector assembly.
The signal from the sensors is applied to
amplifier U6, which drives transistors Q2
and Q3, thus controlling application of DC
power from fullwave rectifier bridge CR6
to the two heaters within the
detector/magnet assembly; HR1,
mounted on the top of the magnet, and
HR2, mounted permanently on the rear of
the detector assembly.
Case Temperature Control
This circuit maintains the interior of the
analyzer case at a controlled temperature
of 140°F (60°C). Temperature is sensed
by a thermistor on the Control Board
adjacent to critical electronic components.
The circuit provides on-off control of
heater element HR3 via TRIAC Q7.
Heater HR3 is located in the heater/fan
assembly.
d. Isolated Current Output Board
(Optional)
An isolated current output is obtainable by
insertion of an optional plug-in circuit
board into receptacle J1 on the Control
Board assembly (See Figure 1-2 on page
1-3). The current outputs available by this
board are 0 to 20 mA or 4 to 20 mA.
e. Alarm Option
The alarm option provides two sets of
relay contacts for actuation of (customersupplied) alarm and/or process control
device(s). The alarm relay assembly has
two single-pole, double-throw relays, one
each for the ALARM 1 and ALARM 2
contacts. Alarm output connections are
on the terminal board shown in Figure 2-1
on page 2-2.
4-8 Theory Rosemount Analytical Inc. A Division of Emerson Process Management
Page 55

Model 755A
Instruction Manual
245364-V
May 2002
SECTION 5
CIRCUIT ANALYSIS
5-1 OVERVIEW
The electronic circuitry of the Model 755A
Oxygen Analyzer consists of the following:
•
A detector compartment heater circuit.
•
A detector heater circuit.
•
A ±15VDC power supply.
•
A voltage regulating circuit for a stable
light source.
•
A detector circuit with a first-stage
amplifier to provide a feedback current for
mechanical feedback to the detector and
a scaling amplifier circuit to give an output
change of 0 to +2.5V for a 0 to 100%
change of the operating span.
•
A digital output circuit for the digital readout.
•
An analog output circuit for recorder,
optional alarms and current output.
5-2 ±15VDC POWER SUPPLY
The components of the ±VDC power supply
circuit are located in the lower left-hand corner
of the Case Board. 19VAC should be
measured with respect to ground at CR5
(WO4). +15VDC should be measured at the
C27 (+) lead and -15VDC at the C28 (-) lead.
If the specified voltage measurements are
obtained, the power supply is working
correctly.
5-3 CASE HEATER CONTROL CIRCUIT
The case heater control circuit utilizes four
voltage-comparators (LM339 quad comparator). An understanding of how one of
these comparators functions is necessary
before any circuit analysis can be attempted.
In Figure 5-1 on page 5-2, comparators 1 and
2 are depicted having a comparator within an
overall comparator symbol. Also within this
symbol, the base of the NPN transistor is
connected to the output of the comparator.
-15VDC is supplied to the emitter. The
collector is illustrated as the overall output for
the comparator package.
The use of a transistor, built into the output of
the comparator, allows comparators to be
placed together in an OR circuit.
Comparators 1 and 2 (in Figure 5-1 on page
5-2) illustrate this logic principle.
When the non-inverting terminal of
comparator 2 is more positive than the
inverting terminal, the transistor does not
conduct and the collector of the transistor or
comparator output is at whatever potential is
then present on the collector.
When the non-inverting terminal of
comparator 2 is less positive (more negative)
than the inverting terminal, the transistor
conducts and the output of the comparator is
-15V. This value is the output of the OR
circuit.
Comparator 2 is biased at 0 volts on the
inverting terminal. Comparator 1 is biased at
about 159 mV on the non-inverting terminal.
Positive feedback or hysteresis is built into
each comparator circuit for stability or positive
action. This is achieved by the 20M ohm
resistances, R70 and R73.
Rosemount Analytical Inc. A Division of Emerson Process Management Circuit Analysis 5-1
Page 56

Instruction Manual
245364-V
May 2002
Model 755A
INPUT
R69
2M
R71
21.5K
4.75K
COMP 1
COMP 2
+15V
R72
-1.7V
-15V
159mV
3.3K
R68
0
°
ON ONOFF
OFF OFFON
-
+
C38
0.18uF
1
100µ
180
+15V
-15V
R70
20M
360
°
°
0
°
180
°
OUTPUT
+15V
-
2
+
-15V
R73
20M
-1.88 VDC
Source
Figure 5-1. Two-Comparator OR Circuit
An approximate 8V peak-to-peak AC signal is
applied to comparators 1 and 2. As the signal
starts going positive, comparator 2 transistor
ceases conducting and comparator 1
transistor is off. When the signal exceeds the
+159 mV on the non-inverting terminal, it
Summing the effects of the two comparators
in the OR circuit results in no output from the
comparators for about 4° of the sinewave, 2°
after the signal goes positive (0 to 2°) and 2°
before the positive signal reaches 180° (178°
to 180°).
turns on comparator 1 and the output is -15V.
During the period that neither comparator is
Comparator 1 stays on until the signal drops
below +159 mV, at which time the output will
be the value of the OR bus. As the AC signal
goes negative with respect to ground, the
transistor of comparator 2 conducts and the
output is again -15V. The output remains at
-15VDC until the incoming signal crosses zero
value and the positive signal causes the
comparator 2 transistor to cease to conduct.
5-2 Circuit Analysis Rosemount Analytical Inc. A Division of Emerson Process Management
conducting, the value on the OR bus is the
potential from the temperature-sensing bridge
plus the effect of the ramp generator, probably
-1.88 ±0.03V.
The on-off effect of the comparators to the OR
circuit results in application of a positive-going
pulse (from -15V to -1.89V) to the temperature
bridge at the rate of 120 pulses per second.
Page 57

Model 755A
Instruction Manual
245364-V
May 2002
Capacitor C36 is added to the input circuit to
delay the incoming AC signal so that the pulses
will occur at or just after the line frequency
crossover point.
-15V
INPUT FROM
MULTIVIBRATOR
OFF OFF
R82
9.09K
RT1
OFF
-15V to 1.88V ±0.3V
R83
63.4K
-15V
R84
169K
R74
590K
C37
1.0uF
TO
COMPARATOR
Figure 5-2. Ramp Generator
+2.3V
-2.3V
R76
37.4K
Circuits for a ramp generator (Figure 5-2 below)
and a temperature-sensing bridge are part of
the case heater control circuit (Figure 5-3, page
5-4 and Figure 5-4, page 5-5).
R77
10K
R79
10K
R80
10K
6 Hz
+15V
Q6
T2
R81
56.2
R87
10K
-15V
C38
.18uF
R78
249K
+15V
-
3
+
-15V
R75
210K
C40
2200uF
On initial application of power to comparator 3
(Figure 5-3 on page 5-4), no potential exists
on the inverting terminal because no charge
exists on capacitor, C37. If the transistor of
comparator 3 does not conduct, +15V is at the
output terminal. With +15V at the output, the
potential on the non-inverting terminals will be
about ±2.3V because of the resistance
divider, R75, R76. Capacitor C37 will now
start to charge positively through R78.
When the positive potential across C37 and at
the inverting terminal of comparator 3
exceeds the potential on the non-inverting
terminals, the transistor conducts. The output
is -15V. A full 30V drop appears across R77.
The potential on the non-inverting terminal will
now be about -2.3V. C37 will not discharge
through R78 until its potential exceeds that on
the non-inverting terminal. At that time,
comparator 3 will switch polarity and start
charging C37 again. The result is that the
potential across C37 will vary almost linearly
with time and form a ramp signal of about 6
Hz.
As the potential across C37 increases and
decreases linearly, it affects the potential at
the top of the bridge circuit between R82 and
R83 through R74. Because of the ramp action
charging and discharging C37, the potential
between R82 and R83 varies approximately
from -1.85V to -1.92VDC.
The temperature sensing device, RT1, in the
bridge circuit is a thermistor. The bridge is
designed to control the temperature in the
case at 135°F (57°C). When the temperature
is 135°F (57°C), the resistance of the
thermistor RT1 will be at its lowest and the
potential at the junction of RT1 and R84
should be the same as the junction of R82
and R83. Comparator 4 (Figure 5-4 on page
5-5) does not allow pulses from the OR circuit
(comparators 1 and 2) to operate Q6 or Triac
Q7 in the case heater (Figure 5-5 on page 5-
6).
Rosemount Analytical Inc. A Division of Emerson Process Management Circuit Analysis 5-3
Page 58
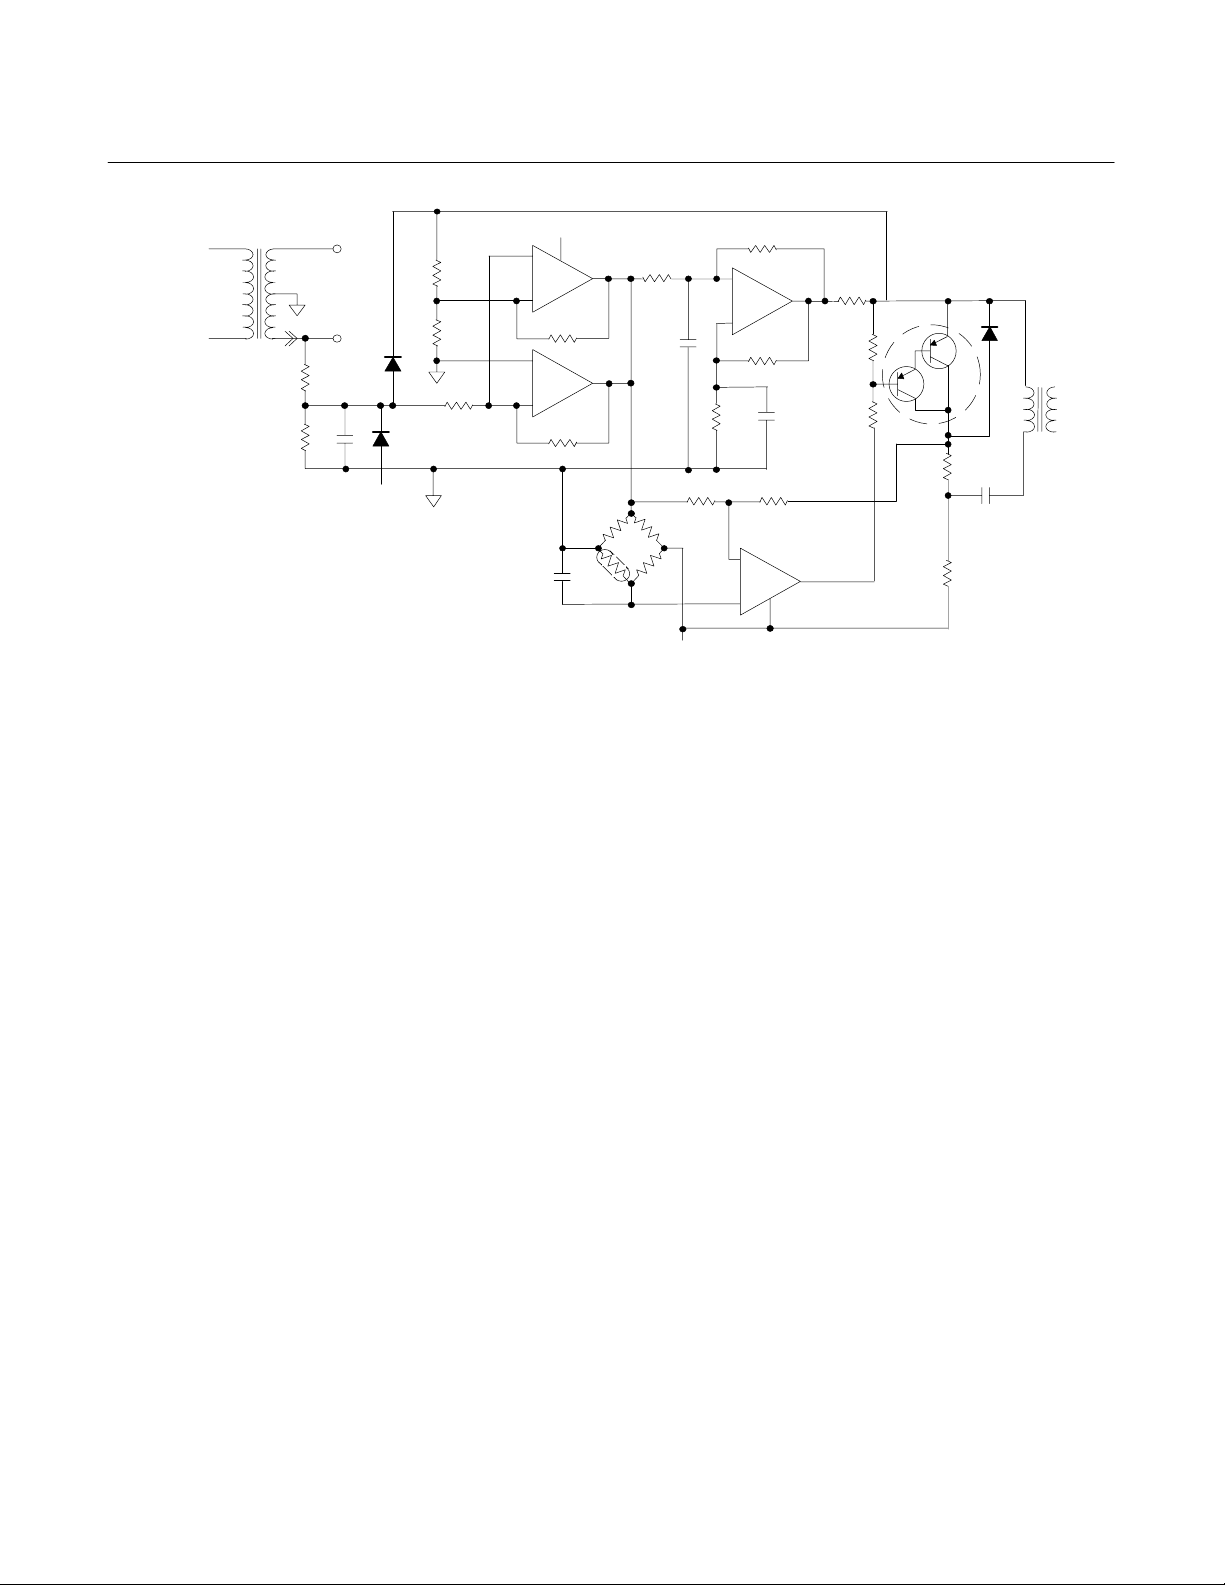
Instruction Manual
245364-V
May 2002
Model 755A
C39
.01uF
+15V
-
1
+
R70
20M
-
2
+
R73
20M
120 V
RMS
T1
R72
4.75K
19 VAC
12
TO POWER
SUPPLY
19 VAC
R67
10K
C36
.18uF
CR9
-15V
CR10
R69
2 M
R71
21.5K
R68
3.3K
Figure 5-3. Case Heater Control Circuit
Theoretically, at 135°F (57°C) the potential at
the junction of RTR1 and R84 is -1.85VDC.
This is equivalent to a resistance of 21.2 K. By
substituting a decade box for the thermistor
and placing 20.2 K into the bridge, the heater
should be off. With 22.7 K, the heater should
be full on.
Since the potential at the junction of R82 and
R83 can vary between 1.85V and 1.92V
according to the 6 Hz ramp, and the potential at
the junction of RT1 and R84 may vary around or
within these limits, depending on temperature,
the error signal to comparator 4 may vary from
0 mV to some absolute value. The polarity of the
error signal will depend on the deviation from
the desired temperature and the ramp value at
the function of R82 and R83.
The input from the OR circuit comparator (See
Figure 5-1 on page 5-2) is either -15VDC or the
ramp effect on the bridge. When -15V, the
junction of R82 and R83 is also this value. The
error signal into comparator 4 is negatively large
to the inverting terminal. Comparator 4 output
transistor does not conduct. The base of Q6 is
positive; therefore, Q6 does not conduct and a
charge builds up on capacitor C38.
R82
9.07K
RT1
R74
590K
1.0uF
R83
63.4K
R84
169K
R78
249K
C37
-15V
R85
11.0K
-
+
R76
37.4K
-
+
3
R75
210K
R86
20M
4
C40
2200uF
R77
10K
R79
10K
R80
10K
CR11
Q6
R81
56.2
C38
.18uF
R87
10K
The input from the OR comparators 1 and 2, a
form of multivibrator circuit, pulses 120 times a
second. For about 100 microseconds the
junction of R82 and R83 is some value between
-1.85V and -1.92V, depending on the ramp
generator. For this brief period of time (one
pulse), comparator 4 compares the potential of
junction R82, R83 with junction RT1, R84 of the
bridge circuit. If the temperature at RT1 is low,
the potential at the non-inverting terminal of
comparator 4 is more negative and the output is
-15V.
The base of Q6 is zero, because of the
voltage drops across R79 and R80; therefore,
Q6 conducts. Energy, stored in C38, flows
through Q6 as current and capacitor C38
discharges to zero potential. No current flows
through the primary winding of transformer
T2. At the end of the 100 microsecond pulse,
the NPN transistor in the output of comparator
4 ceases to conduct, so the signal on the
base of Q6 is +15V. Q6 ceases to conduct.
C38 starts to charge, driving electrons
(current) through the primary of T2. This
induces a pulse into the secondary of T2 and
to the gate of Triac Q7 (Figure 5-5 on page 5-
6) turning it on.
T2
5-4 Circuit Analysis Rosemount Analytical Inc. A Division of Emerson Process Management
Page 59

Model 755A
Instruction Manual
245364-V
May 2002
At the beginning of the next 100 microsecond
pulse, comparator 4 output is again -15V, with
zero volts on the base of Q6. Q6 again
conducts, discharging C38. At the end of the
100 microsecond pulse, Q6 ceases to
conduct. C38 charges and a pulse appears at
the gate of Triac Q7, turning it on again. The
charging time for C38 is about one-half a time
constant (C38, R87) and ten time constants
(R81, C38) are available for discharging C38.
The above action is repeated as long as the
temperature is low, causing an error between
R82, R83 junction and RT1, R84 junction. As
the temperature approaches the desired case
temperature of 135°F (57°C), differences
between these two junctions will exist for only
part of each ramp and the number of pulses
operating Q7 will be proportional to the
amount of error sensed by the 6 Hz ramp.
The pulses arrive at Q7 just as the supply AC
line voltage is passing the zero-volt crossover
point. The purpose of C36 (Figure 5-2 on
page 5-3 and Figure 5-4 below) is to delay the
timing pulse, relative to line frequency, so that
a pulse arrives at the gate of Triac Q7 as the
line potential just passes the zero-volt
crossover point (0° and 180° of line phase).
Varistor, RV1 is a temperature sensitive
resistance device. When case temperature is
low, such as ambient, the value of RV1 is low.
Applying power at that temperature might
cause a current surge to damage Triac Q7.
RV1 with its low initial value of resistance acts
as a bypass and most of the current is
shunted through it.
As the temperature increases and approaches
the desired case temperature, the resistance
of RV1 increases to a large value. This limits
the current through it and gives fine control of
the heater to Triac Q7 and the
temperature-sensing circuit.
HEATER
HR3
F2
FAN
MOTOR
MT2
Q7
MT1
RV1
NEUTRAL
120V
RMS
HOT
Figure 5-4. Case Heater Circuit
T1
Rosemount Analytical Inc. A Division of Emerson Process Management Circuit Analysis 5-5
Page 60

Instruction Manual
245364-V
May 2002
Model 755A
5-4 DETECTOR HEATER CONTROL CIRCUIT
Figure 5-5 below is a simplified heater control
circuit drawing for the detector. Heaters 1 and
2 are actually connected in parallel and have
a combined resistance of about 17 ohms.
The thermistor resistance (RT1) in the
resistance bridge varies inversely with
temperature. The bridge is designed to maintain
the temperature of the detector at 150°F
(65.5°C).
The junction point between R55 and R56 is
maintained at a specific voltage since these
resistances maintain a definite ratio. The
thermistor resistance is 149 K at 150°F (65.5°C)
and increases rapidly as the temperature
decreases. R59 in this bridge circuit represents
the setpoint value for temperature. Suppose
that, at temperature, resistance of the bridge
(R55, R56, R59 and RT1) equals 149 K.
If the temperature goes down, RT1 increases in
resistance and causes the junction of RT1 and
R59 to go positive in voltage value. Since R55
and R56 are of equal resistance, their junction is
at zero volts. Therefore, terminal 3 of AR6 is
more positive than terminal 2 and the base of
Q2 is positive. Q2 conducts, allowing alternating
current to flow through heaters 1 and 2. The
voltage drop across the heaters, when
completely cold, would be about 20VAC and,
when controlling, would be AC of very low
amplitude.
As the temperature increases, the resistance
of RT1 decreases and the junction point
between RT1 and R59 becomes less positive.
Terminal 3 of AR6 becomes less positive with
respect to terminal 2. The output of AR
causes Q2 and Q3 to conduct less. When
terminal 3 equals terminal 2, or is less than
terminal 2, the output of AR6 is zero or less.
Q2 and Q3 do not conduct and the heater
would not be supplying heat energy to the
detector.
120 V
RMS
R59
700K
RT1
HR1 +2
C31
.01uF
2
3
R88
5M
CR6
WO4
R58
5M
-
U6
+
F1
25 VAC
+15V
R55
700K
R56
149K
-15V
Figure 5-5. Detector Heater Control Circuit
R60
100
R62
1K
6
CR12
Q3
Q2
R61
2.0
5-6 Circuit Analysis Rosemount Analytical Inc. A Division of Emerson Process Management
Page 61

Model 755A
Instruction Manual
245364-V
May 2002
5-5 DETECTOR LIGHT SOURCE CONTROL
CIRCUIT
Refer to Figure 5-6 below. The detector light
source control circuit maintains the light
output from the bulb (DS1) as uniform as
possible, regardless of voltage fluctuations or
aging of the bulb.
The power source for the light bulb is a
center-tapped secondary of transformer T1.
This AC voltage is rectified by CR7 and CR8
and filtered (C32), presenting an approximate
+8.5V bus to the current-limiting Darlington
configuration of Q4. Q4 controls the basic
amount of current through DS1.
Amplifier AR7 has a fixed value,
approximately +2.2VDC on terminal 3. The
output of AR7 is positive, causing Q4 to
conduct. As Q4 conducts, electrons flow from
the center-tap of T1 to ground and from
ground through DS1 for an input voltage to
terminal 2 of AR7, through R66 to develop a
bias on the base of Q5, through Q4 to the
+8.5V bus, and back to the secondary. As Q5
conducts, some of the current going through
DS1 is shunted from the main current path,
and goes through Q5, which acts as a
variable feedback resistance, goes to the
positive output potential of AR7.
As DS1 ages, its light emission decreases
and its resistance increases. The current
through DS1 tends to decrease, causing a
decrease in the voltage drop across DS1 and
the input potential to terminal 2 of AR7. Now
the output AR7 will increase, causing Q4 to
conduct more current through R66. As the
potential across R66 increases, Q5 will
conduct more current, causing a further
increase in current flow through DS1. The net
result is that the voltage across DS1 will
remain uniform and the operation of Q4 and
Q5 will adjust the gain of AR7 to maintain the
light emission from DS1 uniform for a long
period of time.
Voltage fluctuations in the 115VAC supply
could cause some variation in the amount of
current flowing through the bulb DS1.
However, the voltage drop across DS1 would
cause AR7 to adjust Q4 and the voltage drop
across R66 to adjust Q5. The net result would
still be uniform current flow through DS1 and
uniform light emission.
T1
6.1 VAC
120 V
RMS
6.1 VAC
CR7
CR8
2000uF
C31
VR3
9.0V
+
+15V
R63
7.5K
R64
14K
R65
4530
α
α
+8.5V BUS
2
-
+
3
2.2V
AR7
C34
.01uF
C35
.01uF
Q5
Q4
R66
1.0
DS1
Figure 5-6. Detector Light Source Control Circuit
Rosemount Analytical Inc. A Division of Emerson Process Management Circuit Analysis 5-7
Page 62

Instruction Manual
245364-V
May 2002
Model 755A
5-6 DETECTOR WITH FIRST STAGE AMPLIFIER
AND PRESSURE COMPENSATION
CIRCUITS
Refer to Figure 5-7 on page 5-10. The
detector assembly consists of a test body
suspended on a platinum wire and located in
a non-uniform magnetic field.
The test body is constructed of two hollow
glass spheres forming a dumbbell shape.
They are filled and sealed with pure, dry
nitrogen. Around the test body, a titanium wire
is chemically etched in order to form a
feedback loop that can create a counteracting
magnetic force to the test body displacement
caused by oxygen concentration in the test
assembly magnetic field.
Attached to the center arm of the test body
dumbbell is a diamond-shaped mirror.
Attached to the mirror are two separate
platinum wires in tension with the supports for
the test body. The supports are isolated from
ground and are electrically connected to the
feedback loop and the electronics for that
loop. The platinum wires form a fulcrum
around which the test body pivots.
The detector operates in the following fashion.
If the sample gas contains oxygen, it collects
in the non-uniform magnetic field around the
test body. Oxygen, because of its
paramagnetic qualities, gathers along the
magnetic lines of flux and forces the dumbbell
of the test body out of the magnetic field.
A light source is focused on the test body
mirror. As the test body moves out of the
magnetic field, the mirror distributes light
unevenly on two photocells (BT1 and BT2).
The photocells create a potential at
comparator U1. The output of U1 goes to U2.
The output of U2 causes current to flow
through the feedback loop attached to the
dumbbell and mirror into the test assembly
magnetic field until the mirror reflects light
almost uniformly on each photocell. A current
proportional to the oxygen concentration in
the magnetic field of the test assembly has to
be flowing through the feedback loop in order
to maintain balance and provide a reading of
the oxygen content of the sample.
Resistances R5, R17 and the resistance of
the wire in the feedback loop determine the
gain of amplifier AR2. The mirror on the
dumbbell is positioned by the amount of
current in the feedback loop. The mirror
reflects light from the source (DS1) to the
photocells (BT1, BT2). This repositioning of
the mirror is a form of mechanical feedback to
the input of the amplifier U1. The net result is
that the output of U1 could vary from 0 to -70
mV, or 0 to -7.0V, depending on the range of
the instrument
On application of AC power, capacitor C6 has
no charge. The current will have to flow
through R18. Initially the full 30V drop (the
difference between the ±15VDC power) will
appear cross R18. The cathode of CR2 will be
initially at -15VDC. The anode of CR2 will be
some value more positive than -15VDC. CR2
will conduct. The input terminal of U1 will be
negative and the current through the feedback
loop around U2 will cause the dumbbell and
mirror to be positioned correctly in the test
body.
As the charge on C6 increases, the cathode
of CR2 becomes more positive. When it
exceeds that on the anode, CR2 ceases to
conduct and isolates the ±15VDC power
supply from the input circuit.
Coarse Zero Adjust R9 and front panel ZERO
potentiometer R13 permit adding an
appropriate voltage to the input of U2 to
counteract any electrical offset resulting from
imbalance in the detector and/or photocells
BT1 and BT2.
The output current that U2 must provide to
restore the dumbbell is a measure of the
displacing force and thus is a function of both
(a) the % oxygen concentration of the sample
and (b) the sample pressure.
The output from U2 is further amplified by U4
to provide a 0 to 10VDC output that
constitutes signal Vx for the pressure
compensation circuit described in Section 56a on page 5-9 .
5-8 Circuit Analysis Rosemount Analytical Inc. A Division of Emerson Process Management
Page 63

Model 755A
Instruction Manual
245364-V
May 2002
a. Pressure Compensation Circuit
This circuit provides a pressure-corrected
output signal conditioned in the range of 0
to 10VDC. The circuit solves the
following equation:
Vo = k (Vx/Vz)
where
Vo = the corrected output signal
Vx = the amplified detector-output
signal, which includes a pressure
factor
Vz = the pressure signal derived
from: (a) The pressure sensor and
associated amplifiers, and (b) the
positive reference voltage power
supply
k = the constant that is characteristic
of the circuit
Circuit function is such that, assuming a
constant % oxygen concentration in the
sample stream, the output from the
analog divider U6 (and thus also the
conditioned output from amplifier U8) will
remain constant regardless of pressure
variations within the specified range.
b. Pressure Signal Circuit
Refer to Figure 5-8 on page 5-10. The
pressure signal circuit consists of the
pressure sensor (transducer) and two
associated amplifiers. The sensor
provides a voltage output that is
proportional to pressure. This signal is
ratioed and combined with the negative
voltage reference so as to provide a zerobased signal at the output of the first
amplifier, where it is available for
measurement and display for calibration
and setup purposes.
The second amplifier adds the 10V
reference back ;into the pressure signal.
The output from the second amplifier is
then appropriately attenuated to provide
signal Vz for analog divider U6. Signal Vz
is also made available to the display and
measurement circuit for calibration
purposes.
c. Positive and Negative Reference
Voltage Circuits
These circuits provide precisely controlled
voltages that set overall system
performance and accuracy for the oxygen
measurement system. While the absolute
accuracy is of importance, more important
yet is the ability of these circuits to remain
stable despite temperature variations that
may occur during normal instrument
usage.
Rosemount Analytical Inc. A Division of Emerson Process Management Circuit Analysis 5-9
Page 64

Instruction Manual
245364-V
May 2002
Model 755A
BT2
FEEDBACK
LOOP
DS1
+15V
-15V
BT1
C6
R9
110
1000pf
R19
10
R18
24.9K
C3
.47uF
CR2
R7
118K
R8
1.69K
R6
2M
C2
.01uF
-
U1
+
FRONT
PANEL
SPAN
R16
R5
R17
R44
200K
30K
C1
.0022uF
-
U2
+
-
U4
+
From Pressure
Signal Circuit
Figure 6-8
+15V
R13
20K
-15V
+15V
R9
20K
-15V
FRONT
PANEL
ZERO
DETECTOR
COARSE
ZERO
Vx
U6
Vz
-
U8
+
To Digital and
Analog Circuits
Figure 5-7. Detector with First Stage Amplifier and Pressure Compensation Circuits
Reference Voltage Circuit
+10.00V
REFERENCE
R19
TRIM
PRESS
SENSOR
+10V
U3
REFERENCE
R98
Reference
Voltages
-
U5
-
U7
-
U9
-10.00V
CAL 1
CAL2
To Analog
Divider U6
To Test
Switch
R99
-10V
Figure 5-8. Pressure Signal and Reference Voltage Circuits
5-10 Circuit Analysis Rosemount Analytical Inc. A Division of Emerson Process Management
Page 65

Model 755A
Instruction Manual
245364-V
May 2002
5-7 BUFFER AMPLIFIERS U10 AND
ASSOCIATED ANTICIPATION FUNCTION
Refer to Figure 5-9 below. U10 is a noninverting buffer amplifier that incorporates an
anticipation arrangement in its input network,
thus providing slightly faster response on the
readout device(s).
Potentiometer R30 provides a continuously
variable adjustment of 5 to 25 seconds for the
electronic response time (90% of fullscale)
and is factory-set for 20 seconds.
Differentiator
Network
R30
-
U10
+
Since the anticipation network attenuates the
signal, a gain of 10 is provided by the
feedback network associated with U10 to
restore the signal to the desired fullscale
range of 0 to 10VDC.
The pressure-corrected output signal from
U10 is routed to two output circuits:
•
Digital Output Circuit, Section 5-8 on page
5-12
•
Analog Output Circuits for Recorder and
Alarms, Section 5-9 on page 5-12
8052A
REF
DIGITAL
ADC
71C03
DISPLAY
DRIVER AND
CONTROL
DISPLAY
R29
To Analog Output Circuit
(Figure 6-9)
Figure 5-9. Buffer, Anticipation, and Digital Output Circuit
5V
U18
5V
REGULATOR
+15V
Rosemount Analytical Inc. A Division of Emerson Process Management Circuit Analysis 5-11
Page 66

Instruction Manual
245364-V
May 2002
Model 755A
5-8 DIGITAL OUTPUT CIRCUIT
Refer to Figure 5-10 on page 5-14. With front
panel TEST Switch in position 1, the output
signal from buffer amplifier U10 is routed
through an attenuator and filter network to an
integrating analog-to-digital converter. It
converts the signal into an equivalent digital
value in the range of 0.00% to 99.99%. Any
value above 99.99% will be preceded by an
over-range bit, for example, 1.1123.
The output of the ADC consists of
binary-coded decimal characters that are
input to the liquid crystal controller and display
chip characters sequentially in time. The BCD
characters are converted into seven-line
codes to drive the bar segments of the liquid
crystal display.
A separate regulator circuit, which operates
from the +15VDC supply, provides a
regulated 5VDC for the digital functions
associated with the display.
5-9 ANALOG OUTPUT CIRCUITS FOR
RECORDER AND ALARMS
The desired zero suppression is obtained as
the sum of (a) a jumper-selectable fixed value
of 0%, 20%, 40%, or 80% oxygen and (b) a
continuously adjustable value of 0% to 25%
oxygen. Thus the total zero suppression may
be set for any desired valued from 0% to
105% oxygen.
In order to establish the precise zero
suppression required for the recorder output,
the actual applied zero suppression may be
read on the digital display by placing the front
panel TEST Switch in position 4 and the
recorder scale-expansion jumper in the 100%
(i.e., 1X gain) position.
Note that, in this mode the signal input is
disconnected, allowing only the input offset
current for the zero-suppression function to
flow into the amplifier summing node.
Example 1, Selection of a Zero Based
Recorder Oxygen Range:
Desired oxygen range for recorder output:
0% to 100%
Refer to Figure 5-10 on page 5-14. The
analog output circuits utilize two amplifiers:
First Stage Amplifier
This amplifier permits selecting the desired
fullscale oxygen range for the recorder by an
appropriate combination of scale expansion
and zero suppression.
Scale expansion is accomplished by selecting
the appropriate feedback resistor in a switchselectable network, thus establishing one of
six values for amplifier gain:
DESIRED OXYGEN
SPAN FOR
RECORDER
100% 1X
20% 5X
10% 10X
5% 20X
2% 50X
1% 100X
REQUIRED
AMPLIFIER GAIN
Required span is 100% oxygen; thus a
gain of 1 is selected with the jumper.
Required zero suppression is 0%; thus,
the Zero Suppression Selection Jumper is
removed, and the Zero Suppression
Potentiometer is set for 0%.
Example 2, Selection of a Zero Suppression
Recorder Oxygen Range:
Desired oxygen range for recorder output:
90% to 100%.
Required span is 10% oxygen; thus, a
gain of 10 is selected with the jumper.
Required zero suppression is 90%
oxygen; thus the Zero Suppression
Selection Jumper is placed in the 80%
position, and the Zero Suppression
Potentiometer is set for 10% oxygen.
5-12 Circuit Analysis Rosemount Analytical Inc. A Division of Emerson Process Management
Page 67

Model 755A
Instruction Manual
245364-V
May 2002
Second Stage Amplifier
This amplifier is an inverting configuration that
provides a signal attenuation of 2X, thus
reducing the 10-volt fullscale input signal to
obtain a 5-volt fullscale output. This output is
routed to:
Recorder Output Resistor Network. It provides
a jumper-selectable output of 0 to 10 mV, 0 to
100 mV, 0 to 1V, or 0 to 5VDC for a
potentiometric recorder.
Current Output Receptacle J1. This connector
accepts the optional plug-in current-output
board.
Dual Alarm Amplifier Circuit. This circuit drives
the optional 638254 Alarm Relay Assembly.
Rosemount Analytical Inc. A Division of Emerson Process Management Circuit Analysis 5-13
Page 68

Instruction Manual
+
+
245364-V
May 2002
Model 755A
+REF
Continuously
Variable
Recorder
Zero
Suppression
(0% to 25%
Oxygen)
-REF
.1uF
1X
5X
10X
20X
50X
100X
Amplifier Gain
(Jumper Selectable)
R50A
20K
-
U16
20K
.1uF
To Alarm and V/I
5V
1V
100mV
Recorder Output
(Jumper Selectable)
10mV
10
To Recorder
20K
100K
200K
1M
2M
Front
Panel
TEST
1
2
3
17.8K
20K
4
80%
75K
20K
-
U13
25K
Recorder
Zero
Suppression
(Jumper
Selectable)
60%
40%
8.33K
25K
Resistor Values are in Ohms.
25K
20%
25K
Figure 5-10. Simplified Analog Output Circuit for Recorder (Showing Three Ranges)
5-14 Circuit Analysis Rosemount Analytical Inc. A Division of Emerson Process Management
Page 69

Model 755A
Instruction Manual
245364-V
May 2002
SECTION 6
SERVICE AND MAINTENANCE
WARNING
POSSIBLE EXPLOSION HAZARD
If gases are introduced into this analyzer,
the sample containment system must be
carefully leak-checked prior to initial startup, during routine maintenance and any
time the integrity of the sample
containment system is broken, to ensure
the system is in leak-proof condition.
Leak-check instructions are provided in
Section 2.3.8.
WARNING
ELECTRICAL SHOCK HAZARD
Do not operate without doors and covers
secure. Servicing requires access to live
parts which can cause death or serious
injury. Refer servicing to qualified
personnel.
CAUTION
PARTS INTEGRITY
Tampering or unauthorized substitution of
components may adversely affect safety of
this product. Use only factory
documented components for repair.
6-1 INITIAL CHECKOUT WITH STANDARD
GASES
If instrument readings do not meet
specifications, the first step in troubleshooting
is to isolate the analyzer from the sample
stream and the sample-handling system.
Admit downscale and upscale standard gases
to the analyzer. Observe readout on digital
display and on recorder (if used).
Digital display reads correctly with
standard gases but not with sample gas,
the sample and sample-handling systems are
suspect. Check these areas.
Digital display reads correctly with
standard gases, but the alarm or output
devices do not, these devices must be
checked individually.
Digital display reads overrange or erratic
with standard gases as well as with
sample gas, the problem is probably in the
detector or the electronic circuitry.
•
Overrange - Turn power to analyzer OFF.
Tap detector compartment with fingers.
Wait 30 seconds, reapply power. If the
suspension within the detector assembly
is hung up, this procedure may correct the
condition. If not, proceed with tests of the
detector and electronics.
The information provided in this section will
aid in isolation of a malfunction to a particular
assembly or circuit. No detailed procedures
for component service and maintenance are
provided, as they are beyond the scope of this
manual. A few detailed checks are included,
but only for location of the defective assembly.
It is recommended that those familiar with
circuit analysis refer to the circuit theory in
Section 5 of this manual.
Rosemount Analytical Inc. A Division of Emerson Process Management Service and Maintenance 6-1
•
Erratic - Problem probably in the detector
or the temperature control circuits.
Proceed with tests of the detector and
electronics. Verification that all circuits
are operating properly should be
performed before replacing detector.
Page 70

Instruction Manual
245364-V
May 2002
Model 755A
6-2 DETECTOR COMPONENT CHECKS
a. Detector
Before concluding that the detector is
defective and must be replaced, verify
that all components and circuits that could
cause erratic readings are operating
properly.
To isolate the detector as a source of a
problem, the source lamp, photocells and
suspension should be checked for proper
operation.
b. Source Lamp
To verify that the source lamp in operating
properly:
1. Verify that lamp is lit.
2. Voltage at U7 pin 2 should be 2.2±0.2
VDC.
If lamp is not operating properly, replace
per instructions in Section 6-4 on page 6-
5.
c. Photocell
To verify that photocell is operating
properly, perform the following steps:
If photocell readings not correct, replace
photocell per Section 1-1a on page 6-7.
d. Suspension
If the suspension has been damaged, the
cause may by improper operating
conditions.
Maximum permissible operating pressure
for the detector is 10 psig (69 kPa gauge
pressure). To ensure against overpressurization, a pressure relief valve
may be inserted into the sample inlet line.
In addition, a check valve should be
inserted into the vent line, if connected to
a manifold associated with a flare or other
outlet that is not at atmospheric pressure.
If the detector is over-pressurized, the
suspension could break.
To verify correct operation:
1. Turn electrical power to analyzer
OFF.
2. Remove optical bench assembly (see
Section 6-4 on page 6-5, steps 1
through 4.)
3. With 100% nitrogen flowing through
the analyzer, note the position of the
suspension.
1. Keeping power source ON,
disconnect the leads of the photocell
from connector J12. See Figure 6-1
on page 6-4.
2. Note the current measurement
between the gray and orange wires
(between 300 to 450 mA).
3. Measure between the orange and red
wires. The reading should be
approximately the same as step 2.
6-2 Service and Maintenance Rosemount Analytical Inc. A Division of Emerson Process Management
4. Admit air and note response of
suspension. It should rotate
clockwise (as viewed from the top)
and to the right (as viewed through
the window).
Failure to rotate indicates that the
suspension has been damaged and that
the detector assembly must be replaced.
See Section 6-3a on page 6-3.
Page 71

Model 755A
6-3 DETECTOR COMPONENT REPLACEMENT
a. Detector Replacement
Prior to removal of the detector, remove
power from instrument and stop flow of
sample gas.
1. Remove the four screws securing the
detector cover plate.
2. Disconnect cable from J12 on the
detector assembly.
NOTE
Instruction Manual
245364-V
May 2002
5. Install replacement detector assembly
and connect cable to J12.
6. Seat the detector assembly firmly
against the magnet pole pieces and
tighten attaching screws.
7. Reconnect rubber sample lines to
metal inlet and outlet tubes on
detector assembly.
8. Apply power to instrument and allow
to warm up approximately one hour.
9. Set the front panel ZERO control
(R13) at mid-range (i.e., five turns
from either end).
Note how the rubber sample lines are
looped into a "long coil". When
reinstalling the sample lines they must
be configured in the same way. This
precaution isolates the detector from
the effects of mechanical vibration.
Otherwise vibration waves could travel
upward along the tubing walls,
resulting in noisy readout.
3. Refer to Figure 6-1 on page 6-4.
Using needle-nose pliers, squeeze
the hose clamps to disconnect the
rubber sample lines from the metal
inlet and outlet tubes of the detector
assembly.
4. Remove the two screws at the bottom
of the detector assembly, slide
detector out.
10. Refer to Table 3-2 on page 3-6,
Figure 3-2 on page 3-7 and Figure
6-3 on page 6-5. Connect a digital
voltmeter (four digit resolution) from
the slider of Coarse Zero
potentiometer (R9) to chassis ground.
With a steady flow of 50 to 500
cc/min. of nitrogen gas passing
through the instrument, adjust Coarse
Zero (R9) for zero volts.
11. Connect the voltmeter between TP10
and circuit ground. Adjust front panel
ZERO control (R13) for reading of
exactly zero on voltmeter.
With all internal adjustments now properly
set, the instrument may be calibrated in
the normal manner.
Rosemount Analytical Inc. A Division of Emerson Process Management Service and Maintenance 6-3
Page 72

Instruction Manual
p
p
y
p
245364-V
May 2002
A. Detector/Magnet Assembly - Exploded View B. Optical Bench - Exploded View
Sample Pre-Heating
Coil
Photocell
Lock Screws (2)
Connector
Board
Sample Inlet
Tube
Sample Outlet Tube
Optical Bench Assembly
Mounting Screws (2)
Detector Assembly
Magnet
Assembly
Lamp Retaining
Set Screw
Lamp Viewing
Hole
Model 755A
Connector
J12
Dual
Photocell
Source Lamp
Assembly
Figure 6-1. Detector/Magnet Assembly
A. Connections to Source Lamp and Photocell B. Connections to Suspension and Heater Circuits
10 18
BRN
YEL
Dual
Photocell
Sense
Old St
J12
le Lam
RED
BLU
1
ORN
GRY
When dual photocell is
installed, the gap between
the two photocells should
be in position indicated by
this line.
10
J12
Optical Bench
18
1
WHT
WHT
BLK
BLK
PUR
GRN
Hole for Source Lamp
RT1
HR2
Suspension
Heater
Suspension
Terminals
C. Removal and Insertion of Pin/Leads in Connector J12
Upper Slot
Keeper
Side View
of Connector
Lower Slot
Connector Pin/
Leads in Place
Im
rovised Pin Removal Tool, Such as a Paper Cli
Connector Pin Removed
Figure 6-2. Detector/Magnet Assembly Wiring
6-4 Service and Maintenance Rosemount Analytical Inc. A Division of Emerson Process Management
Page 73

Model 755A
C1
Instruction Manual
245364-V
May 2002
R13
U2
6-4 SOURCE LAMP REPLACEMENT
1. Remove the four screws securing the
detector assembly cover plate.
2. Refer to Figure 6-1 on page 6-4.
Carefully remove the small rubber hose
connected from the detector/magnet
assembly to the detector.
3. If retaining set screw for lamp is
accessible, proceed to step 6. If the set
screw is not accessible continue to step 4.
4. Remove the two screws holding the
optical bench assembly/detector
assembly to the magnet assembly.
Carefully remove optical bench and
detector assembly.
Voltmeter
Lead
R9
Figure 6-3. Detector Adjustment
Depending on date of manufacture of the
analyzer, the original lamp assembly may
be either of two types:
Old style lamp assembly with four
color coded leads: Red, blue, brown
and yellow.
Red
Blue
Brown
Yellow
New style lamp assembly with two
leads color coded either both red or
both black.
Two Red or
Two Black Leads
5. Remove the two lock screws (2-56 X 5/16
pan head) holding the photocell in the
optical bench. Carefully remove
photocell.
8. The replacement lamp assembly is the
new style with two leads. On J12, insert
one lead into the position formerly used
for the brown lead to the old style lamp
and the other lead into the position for the
6. Loosen lamp retaining set screw, remove
lamp.
7. Note location of lamp wires in connector
J12. Disconnect leads of lamp assembly
from connector J12, Figure 6-2A on page
6-4, using method shown in Figure 6-2C
blue lead of the old lamp. See Figure
6-2A on page 6-4
9. Insert the lamp into the assembly. After
reassembly and application of power, the
lamp will have to be rotated to place the
lamp filaments in proper orientation.
on page 6-4.
If the lamp assembly removed from the
instrument has two wires, proceed to step
13.
Rosemount Analytical Inc. A Division of Emerson Process Management Service and Maintenance 6-5
Page 74

Instruction Manual
245364-V
May 2002
Model 755A
If the lamp assembly removed from the
instrument has four wires, the 633689
Connector Board requires modification.
Continue to step 10.
10. Refer to Figure 6-1 on page 6-4. Remove
the two screws holding the Connector
Board to the magnet assembly. Carefully
remove Connector Board.
11. Place Connector Board on a clean
working surface, with solder side (no
components) up.
12. Per Figure 6-4 below, add straps or solder
bridges at the two points shown.
NOTE
If the Connector Board cannot be
satisfactorily modified, a modified 633689
Connector Board may be ordered from the
factory. See Section 7.
13. Reassemble detector, etc., in reverse
order of disassembly.
14. Refer to Figure 6-5 below. The red line
on the lamp must be aligned with the
retaining set screw. Insert lamp into
mounting hole until it extends 1/4 inch.
Tighten set screw.
15. Realign the photocell per Section 1-1a on
page 6-7.
Add Straps or Solder Bridges
F3
HR1
Solder Side of Board (Backside)
Figure 6-4. Modification of 633689 Connector Board for Compatibility with Replacement Lamp
1/4"
Set Screw
Red Mark for
Alignment
Figure 6-5. Lamp Alignment
6-6 Service and Maintenance Rosemount Analytical Inc. A Division of Emerson Process Management
Page 75

Model 755A
Instruction Manual
245364-V
May 2002
a. Photocell Replacement and
Adjustment
1. To remove the photocell from the
optical bench, perform steps 1
through 5 in Section 6-4 on page 6-5.
2. Install replacement photocell by
reversing removal procedure.
3. The photocell must now be adjusted.
With zero gas flowing:
a. Place a digital voltmeter on the
wiper of the front panel ZERO
control (R13) and ground (TP7)
ground on the Control Board.
Adjust front panel ZERO control for
0.0 VDC.
b. Place the voltmeter from the bottom
of R10 and TP7 (see Figure 6-5 on
page 6-6), adjust R9 for 0 VDC.
c. Place the voltmeter on TP8 and
TP7, move the photocell to obtain a
DC voltage as close to 0mV as
possible but not more than ±750mV.
d. Perform steps 8 through 11 in Section
6-3a on page 6-3.
With all internal adjustments now properly
set, the instrument may be calibrated in
the normal manner.
6-5 HEATING CIRCUITS
a. Case Heater Control Circuit
The case heater control circuit receives
power via thermal fuse F2 (76°C). This
fuse, located on the Case Board, can be
checked for continuity.
Case heater element HR3, located on the
heater/fan assembly, has a normal
resistance of 20 ohms.
To verify heater operation, place a hand
beside the right-hand side of the detector
housing. Heated air should be felt. If it is
not, check the case heating circuit.
Temperature sensor RT1 has a cold
resistance of 22.7K ohms and a normal
operating resistance of 20.2K ohms,
indicating normal operating temperature
of 140°F (60°C). Until thyristor RV1
reaches operating temperature, it
bypasses most of the current that would
otherwise flow through Triac Q7.
As a further check, disconnect connector
plug P8 on the Control Board, thus
disconnecting temperature sensor RT1.
Substitute a decade resistor box to
simulate the resistance of RT1. Also,
connect an AC voltmeter from the hot side
of the line to the neutral side of F2.
Set the decade box for 20.2K ohms to
simulate RT1 resistance at controlling
temperature. The voltmeter should now
show pulses of 1 VAC.
To ensure against damage from overheating
in the event of malfunction, the heating
circuits are protected by thermal fuses F2 and
F3. If temperature of a heated area exceeds
the permissible maximum, the associated fuse
melts, opening the circuit.
NOTE
Thermal fuses F2 and F3 are to be plugged
in, never soldered. If soldered, the fuse
element may melt and open the circuit.
Rosemount Analytical Inc. A Division of Emerson Process Management Service and Maintenance 6-7
Avoid prolonged operation with the
decade box set at 22.2K ohms.
Overheating may result.
OVERHEATING HAZARD
Set the decade box for 22.2K ohms to
simulate RT1 resistance at ambient
temperature. The voltmeter should now
show pulses of 120 VAC.
CAUTION
Page 76

Instruction Manual
245364-V
May 2002
Model 755A
b. Detector/Magnet Heating Circuit
Heater HR1 is attached to the magnet.
Heater HR2 is attached to the rear of the
detector. Combined resistance of these
two parallel connected heaters, as
measured at pins 15 and 16 of detector
connector J12, should be approximately
17 ohms. If not, remove pin/leads 14 and
15 from the connector to measure the
resistance of HR2 alone. This resistance
should be approximately 89 ohms.
If resistance the resistance of HR2 is
correct, and yet the combined resistance
is incorrect, heater HR1 may be open.
To reach the leads of HR1, remove the
printed circuit board on the heater
assembly. Resistance of HR1 should be
approximately 21 ohms.
To check operation of the heater circuit,
connect a voltmeter across R61 on the
Case Board. Normally, the voltage will be
4 VDC when cold and will drop to
approximately 0.4 VDC at control
temperature. Temperature sensor RT1 is
mounted in the detector, with leads
accessible at pins 10 and 11 of detector
connector J12. The sensor resistance, as
measured at these pins, should be 1M
ohm at 25°C and approximately 149K
ohms at operating temperature of 65°C.
6-8 Service and Maintenance Rosemount Analytical Inc. A Division of Emerson Process Management
Page 77

Model 755A
Instruction Manual
245364-V
May 2002
SECTION 7
REPLACEMENT PARTS
The following parts are recommended for
routine maintenance and troubleshooting of
the Model 755A Oxygen Analyzer. If the
troubleshooting procedures in Section 6 do
not resolve the problem, contact Rosemount
Analytical Customer Service Center (see
Section 8-1).
CAUTION
PARTS INTEGRITY
Tampering or unauthorized substitution of
components may adversely affect safety of
this product. Use only factory
documented components for repair.
7-1 CIRCUIT BOARD REPLACEMENT POLICY
In most situations involving a malfunction of a
circuit board, it is more practical to replace the
board than to attempt isolation and
replacement of the individual component. The
cost of test and replacement will exceed the
cost of a rebuilt assembly. As standard
policy, rebuilt boards are available on an
exchange basis.
replacement of an individual component,
which can be identified by inspection or from
the schematic diagrams, obtain the
replacement component from a local source
of supply.
7-2 SELECTED REPLACEMENT PARTS
809374 Fuse, Power 3/4A (120VAC)
092114 Fuse, Power 1/2A (240VAC)
777362 Fuse, Heater 3A 120VAC Pkg of 15
777361 Fuse, Heater 1.5A 240VAC Pkg of 15
861469 Thermal Fuse (F2,F3)
656189 Detector/Optical Bench Assembly 0 to
1%
656190 Detector/Optical Bench Assembly 0 to
1% Corrosion Resistant
616418 Source Lamp Kit
622350 Photocell
652225 Transducer Assembly
621023 Current Output Board (0 to 20mA, 4
to 20mA)
631773 Case Board
652220 Control Board
Because of the exchange policy covering
circuit boards, the following list does not
include individual, circuit board mounted
components. If circumstances necessitate
Rosemount Analytical Inc. A Division of Emerson Process Management Replacement Parts 7-1
Page 78

Instruction Manual
245364-V
May 2002
Model 755A
7-3 MATRIX
Each Model 755A Oxygen Analyzer is
configured per the customer sales order.
Below is the Model 755A sales matrix which
lists the various configurations available.
755A MODEL 755A OXYGEN ANALYZER - DIGITAL METER
Code Ranges
0.0-100% Oxygen on Display
1
(Recorder Output can be selected for any fullscale span of 1%, 2%, 5%, 10%, 20%, 50% or
100% using any zero offset)
0.0-100% Oxygen on Display
2
(Recorder Output span of 5% or greater for zero based ranges)
9 Special
Code Corrosion Resistance
1 Standard detector
2 Detector with rhodium plated current loop
3 Detector with stainless steel tubing
4 Detector with rhodium plated current loop and stainless steel tubing.
09 Special
Code Output
01 Voltage: 0-10 mV, 0-100 mV, 0-1 V or 0-5 VDC
02 Current: 0, 4-20 mA, Isolated
99 Special
To identify the configuration of your analyzer,
locate the analyzer name-rating plate. The
sales matrix identifier number appears on the
analyzer name-rating plate.
(2)
(3)
Code Alarm Relays
00 None
01 Dual
99 Special
Code Case
01 General Purpose (NEMA-3R)
02 General Purpose W/ISA Type Z Purge
03 General Purpose W/Tropicalization
04 General Purpose with Purge with Tropicalization
99 Special
Code Operation
01 115V, 50/60 Hz
02 230V, 50/60 Hz
99 Special
Code
00 Features as selected above
99 Special
755A 1 3 01 00 01 01 00 Example
(1)
7-2 Replacement Parts Rosemount Analytical Inc. A Division of Emerson Process Management
Page 79

Model 755A
Instruction Manual
245364-V
May 2002
SECTION 8
RETURN OF MATERIAL
8-1 RETURN OF MATERIAL
If factory repair of defective equipment is
required, proceed as follows:
1. Secure a return authorization from a
Rosemount Analytical Inc. Sales Office or
Representative before returning the
equipment. Equipment must be returned
with complete identification in accordance
with Rosemount instructions or it will not
be accepted.
Rosemount CSC will provide the shipping
address for your instrument.
In no event will Rosemount be
responsible for equipment returned
without proper authorization and
identification.
2. Carefully pack the defective unit in a
sturdy box with sufficient shock absorbing
material to ensure no additional damage
occurs during shipping.
3. In a cover letter, describe completely:
• The symptoms that determined the
equipment is faulty.
• The environment in which the
equipment was operating (housing,
weather, vibration, dust, etc.).
• Site from where the equipment was
removed.
• Whether warranty or non-warranty
service is expected.
• Complete shipping instructions for the
return of the equipment.
4. Enclose a cover letter and purchase order
and ship the defective equipment
according to instructions provided in the
Rosemount Return Authorization, prepaid,
to the address provided by Rosemount
CSC.
Rosemount Analytical Inc.
Process Analytical Division
Customer Service Center
1-800-433-6076
If warranty service is expected, the defective
unit will be carefully inspected and tested at
the factory. If the failure was due to the
conditions listed in the standard Rosemount
warranty, the defective unit will be repaired or
replaced at Rosemount’s option, and an
operating unit will be returned to the customer
in accordance with the shipping instructions
furnished in the cover letter.
For equipment no longer under warranty, the
equipment will be repaired at the factory and
returned as directed by the purchase order
and shipping instructions.
8-2 CUSTOMER SERVICE
For order administration, replacement Parts,
application assistance, on-site or factory
repair, service or maintenance contract
information, contact:
Rosemount Analytical Inc.
Process Analytical Division
Customer Service Center
1-800-433-6076
8-3 TRAINING
A comprehensive Factory Training Program of
operator and service classes is available. For
a copy of the Current Operator and Service
Training Schedule contact the Technical
Services Department at:
Rosemount Analytical Inc.
Customer Service Center
1-800-433-6076
Rosemount Analytical Inc. A Division of Emerson Process Management Return of Material 8-1
Page 80

Instruction Manual
245364-V
May 2002
Model 755A
8-2 Return of Material Rosemount Analytical Inc. A Division of Emerson Process Management
Page 81

Model 755A
VAISALA BAROMETRIC PRESSURE TRANSDUCER
Instruction Manual
245364-V
May 2002
APPENDIX A
A-1 OVERVIEW
This is applicable if your instrument has a
Vaisala Barometric Pressure Transducer
installed in it, or, if you are retrofitting a 755A
with a Vaisala transducer kit.
The Vaisala PTB100 series Analog Barometer
is a N.I.S.T. traceable precision silicon
capacitive atmospheric pressure transducer.
The sensor delivers an analog voltage output
that is inversely proportional to it’s inlet
pressure. It has an operational ambient
pressure range of 800 to 1060 hPa.
The original 755A instrument was designed
for use with a resistance bridge type of
pressure transducer requiring an external
amplifier with a gain factor of 334. The
Vaisala transducer contains an integral gain
amplifier that is scaled for a 0 to +5 Vdc
output. The 755A “Door Board” can
accommodate either transducer type with a
single (R97) resistor change.
A-2 CIRCUIT FUNCTION
The 755A “Door Board” pressure transducer
interface is configured as a Precision Voltage
referenced “Whetstone Bridge” circuit. The
Vaisala Interface Circuit board adapts the
single ended analog output of the Vaisala
sensor into a Precision Voltage referenced,
balanced bridge (at 1 atmosphere) input
configuration. A “Bridge Balance” pot on the
Vaisala Interface Circuit board provides the
fine trim “Bridge Balancing” calibration
adjustment that is required to set up each
individual transducer at a known ambient air
pressure. Test points are provided on the
circuit board for this adjustment.
An adjustable, precision regulated voltage
divider consisting of R1, R2, & VR1 on the
Interface Board provide a bridge offset voltage
range of + 0.26 to + 0.79 Vdc.
The Vaisala transducer output range is 0 to
+5 Vdc.
The Vaisala analog output voltage is fed into a
voltage divider formed by R3 and R4 on the
Interface Board. This divider reduces the
Vaisala 0 to +5 Vdc output to 0 to +0.568
Volts, a reduction factor of 8.8 to 1.
These voltage divided bridge offset and
output signals are then applied to the original
Whetstone Bridge input circuit at connector J3
on the Door Board.
A-3 INSTALLATION
1. Remove the original transducer, located inside
the detector housing (if present).
2. Install the transducer using the mounting bracket
provided into the lower right hand corner of the
instrument.
3. Install the Interface board using the extended
mounting screw and spacer (provided) to the
top, left corner of the door board.
4. Connect the 4-pin cable (P1) from the interface
board (noting pin polarity) to J3 on the door
board.
5. Solder the Interface board WHITE wire to door
board J4-10 (+15 Vdc), and the BLACK wire to
J4-14 (Gnd).
6. Replace R97 on the door board with a 2 Meg
Ohm, 1/4W, 1% resistor (provided).
Rosemount Analytical Inc. A Division of Emerson Process Management Appendix A – Vaisala Pressure Transducer A-1
Page 82

Instruction Manual
245364-V
May 2002
A-4 ADJUSTMENT
Circuit adjustment can be made using the built
in display together along with a Digital
voltmeter.
1. Select position 2 on the front panel selector
switch. Connect the DVM (+) to TP1, (-) to TP2
on the INTERFACE Board. Adjust for zero volts
as closely as possible using potentiometer VR1
(DMM set to the mVDC range) on this same
board.
2. Move the DVM to (TP) 14 and ground (TP10).
Adjust the AD625 zero offset adjustment for the
lowest zero voltage output. Note! All these
adjustments are made at ambient pressure and
the display on position 2 should now read zero.
The noise should be less than ±1 count.
Model 755A
A-5 HIGH ALTITUDE VERSION OPTION
For applications where the instrument is to be
used above 5400 Feet (MSL) an alternate
transducer option is available from the factory.
This version consists of a Vaisala model
PTB100B transducer (900-1100 hPa range),
and an interface board with modified values
for resistors R2 and R4. Contact Rosemount
Customer Service Center if you require this
option.
Procedure is complete.
A-2 Appendix A – Vaisala Pressure Transducer Rosemount Analytical Inc. A Division of Emerson Process Management
Page 83

WARRANTY
Goods and part(s) (excluding consumables) manufactured by Seller are warranted to be free from
defects in workmanship and material under normal use and service for a period of twelve (12)
months from the date of shipment by Seller. Consumables, glass electrodes, membranes, liquid
junctions, electrolyte, o-rings, etc., are warranted to be free from defects in workmanship and
material under normal use and service for a period of ninety (90) days from date of shipment by
Seller. Goods, part(s) and consumables proven by Seller to be defective in workmanship and/or
material shall be replaced or repaired, free of charge, F.O.B. Seller's factory provided that the
goods, part(s) or consumables are returned to Seller's designated factory, transportation charges
prepaid, within the twelve (12) month period of warranty in the case of goods and part(s), and in
the case of consumables, within the ninety (90) day period of warranty. This warranty shall be in
effect for replacement or repaired goods, part(s) and the remaining portion of the ninety (90) day
warranty in the case of consumables. A defect in goods, part(s) and consumables of the
commercial unit shall not operate to condemn such commercial unit when such goods, part(s)
and consumables are capable of being renewed, repaired or replaced.
The Seller shall not be liable to the Buyer, or to any other person, for the loss or damage directly
or indirectly, arising from the use of the equipment or goods, from breach of any warranty, or from
any other cause. All other warranties, expressed or implied are hereby excluded.
IN CONSIDERATION OF THE HEREIN STATED PURCHASE PRICE OF THE GOODS,
SELLER GRANTS ONLY THE ABOVE STATED EXPRESS WARRANTY. NO OTHER
WARRANTIES ARE GRANTED INCLUDING, BUT NOT LIMITED TO, EXPRESS AND IMPLIED
WARRANTIES OR MERCHANTABILITY AND FITNESS FOR A PARTICULAR PURPOSE.
Limitations of Remedy. SELLER SHALL NOT BE LIABLE FOR DAMAGES CAUSED BY
DELAY IN PERFORMANCE. THE SOLE AND EXCLUSIVE REMEDY FOR BREACH OF
WARRANTY SHALL BE LIMITED TO REPAIR OR REPLACEMENT UNDER THE STANDARD
WARRANTY CLAUSE. IN NO CASE, REGARDLESS OF THE FORM OF THE CAUSE OF
ACTION, SHALL SELLER'S LIABILITY EXCEED THE PRICE TO BUYER OF THE SPECIFIC
GOODS MANUFACTURED BY SELLER GIVING RISE TO THE CAUSE OF ACTION. BUYER
AGREES THAT IN NO EVENT SHALL SELLER'S LIABILITY EXTEND TO INCLUDE
INCIDENTAL OR CONSEQUENTIAL DAMAGES. CONSEQUENTIAL DAMAGES SHALL
INCLUDE, BUT ARE NOT LIMITED TO, LOSS OF ANTICIPATED PROFITS, LOSS OF USE,
LOSS OF REVENUE, COST OF CAPITAL AND DAMAGE OR LOSS OF OTHER PROPERTY
OR EQUIPMENT. IN NO EVENT SHALL SELLER BE OBLIGATED TO INDEMNIFY BUYER IN
ANY MANNER NOR SHALL SELLER BE LIABLE FOR PROPERTY DAMAGE AND/OR THIRD
PARTY CLAIMS COVERED BY UMBRELLA INSURANCE AND/OR INDEMNITY COVERAGE
PROVIDED TO BUYER, ITS ASSIGNS, AND EACH SUCCESSOR INTEREST TO THE GOODS
PROVIDED HEREUNDER.
Force Majeure. Seller shall not be liable for failure to perform due to labor strikes or acts beyond
Seller's direct control.
Page 84

Instruction Manual
245364-V
May 2002
Model 755A
Emerson Process Management
Rosemount Analytical Inc.
Process Analytic Division
1201 N. Main St.
Orrville, OH 44667-0901
T (330) 682-9010
F (330) 684-4434
E gas.csc@emersonprocess.com
ASIA - PACIFIC
Fisher-Rosemount
Singapore Private Ltd.
1 Pandan Crescent
Singapore 128461
Republic of Singapore
T 65-777-8211
F 65-777-0947
http://www.processanalytic.com
© Rosemount Analytical Inc. 2001
Fisher-Rosemount GmbH & Co.
Industriestrasse 1
63594 Hasselroth
Germany
T 49-6055-884 0
F 49-6055-884209
EUROPE, MIDDLE EAST, AFRICA
Fisher-Rosemount Ltd.
Heath Place
Bognor Regis
West Sussex PO22 9SH
England
T 44-1243-863121
F 44-1243-845354
LATIN AMERICA
Fisher - Rosemount
Av. das Americas
3333 sala 1004
Rio de Janeiro, RJ
Brazil 22631-003
T 55-21-2431-1882
Page 85

Page 86

Page 87

Page 88

Page 89

Page 90

 Loading...