

Page 1

CI-22
BASIC ELECTRONIC EXPERIMENTS
with computer interface
Experiments PC1-PC8
Instruction Manual
Elenco Electronics, Inc.
Copyright © 2003 by Elenco Electronics, Inc. All rights reserved. No part of this book shall be reproduced by
any means; electronic, photocopying, or otherwise without written permission from the publisher.
Sample Controls Display
See these Oscilloscope Signals
See these Spectrum Analyzer Signals
Page 2
Looking at Electronic Signals using the WINSCOPE Software:
Electronics engineers use specialized test equipment to “see” electronic signals and make performance measurements.They use an oscilloscope to look at the waveform of the signal in time and use
a spectrum analyzer to look at its frequency content.This equipment is specialized and usually very
expensive.
The Winscope software simulates this equipment using your personal computer.The PC-interface
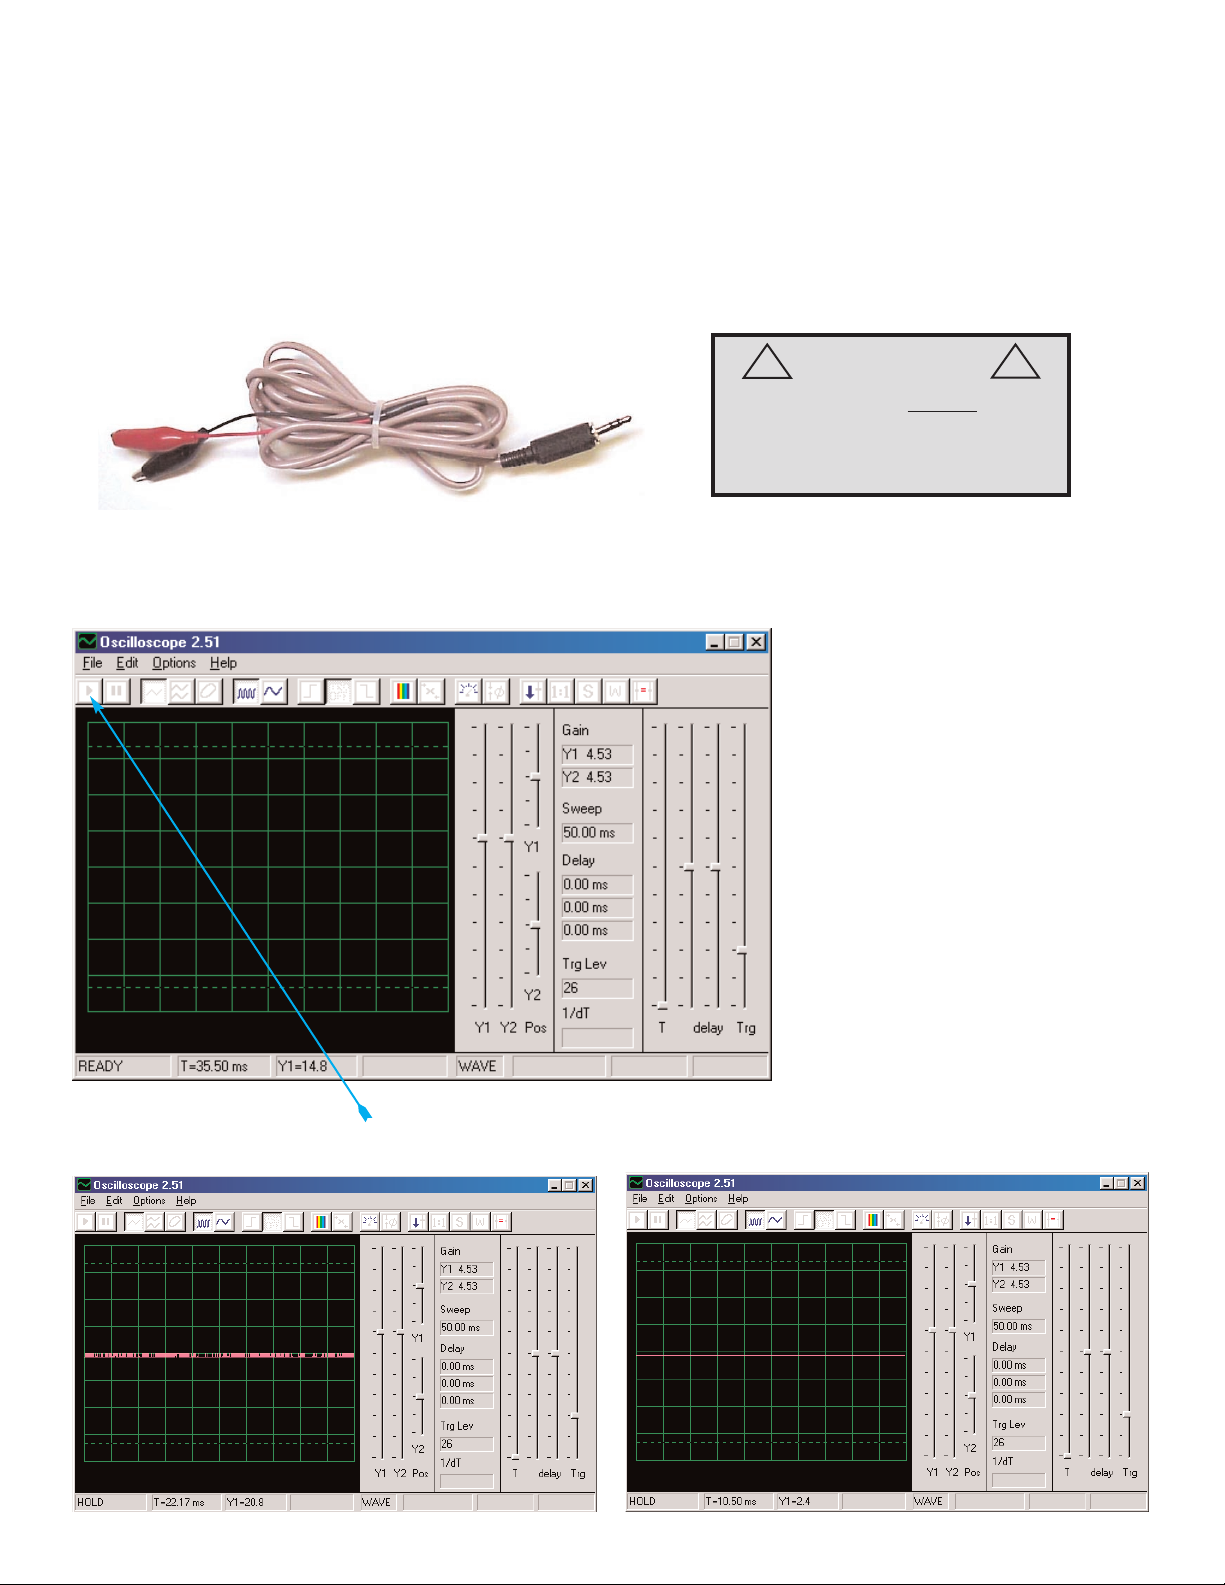
cable can be connected across any 2 points in your circuit to look at the signal.
It is usually connected to the output of a circuit, as in the circuits shown for the CI-22.Connect the
plug end of the probe to the microphone input on the back of your personal computer. Run the
Winscope application (from the CI-22 menu). It will come up in Hold mode looking like this:
Click on the On-Line button to turn it on.You should now get one of the following 2 pictures, depending on whether your microphone input is properly turned on:
-2-
WARNING:
SHOCK HAZARD - NEVER connect
the probe to AC power or a wall
electricity outlet for any reason since
serious injury or damage may result.
!
!
Page 3
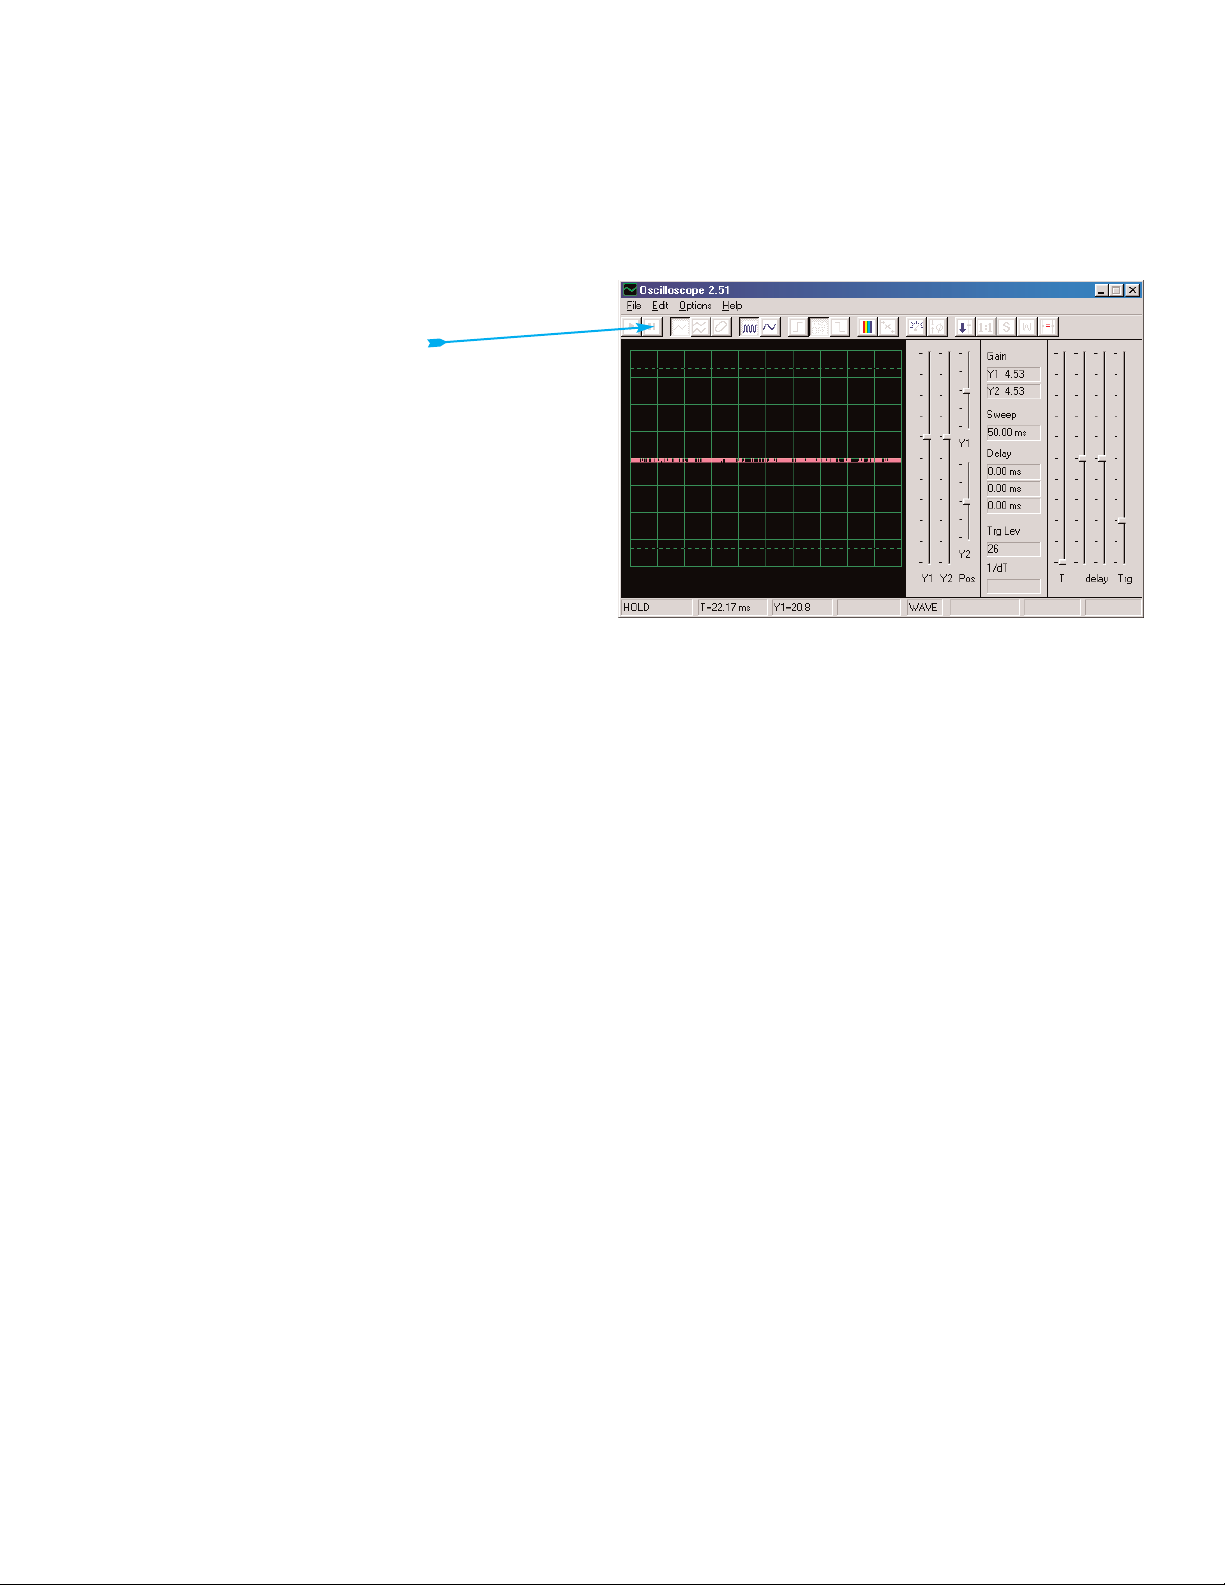
If you get the picture on the right then your microphone input is not properly turned on, go to the
“Turning On Your Microphone Input” to tur n it on. There may also be other sound card controls on
your computer that you need to set, when your input is properly configured then you will get a picture like the left one above.Touch the red and black “alligator” clips on the PC-interface cable to
each other and you should see the random pattern on the winscope screen change as you do so.
You are now ready to proceed with the first CI-22 experiment or you may investigate the Winscope
software on your own.
You may freeze a waveform on the screen by
clicking on the Hold mode button
(just to the right of the On-Line button).
WARNING:Do not “save setup” in Winscope.
Many of the buttons on Winscope control features
that this manual will not be using. If you accidentally place the Winscope software into an
unknown mode, you may always close and restart Winscope. Doing so will reset all settings to
those described in this booklet unless you have
done a “save setup”.
PROJECT PC1 SHOWS HOW TO USE THE MAIN FUNCTIONS
OF WINSCOPE SO DO IT FIRST!
NOTES:
1. It is recommended that you disable or turn down the volume to the speakers on your computer. CI-22’s use of the microphone input port will also channel the same signal to the
speakers, and the result is often ver y annoying.
2. It is recommended that you be familiar with the PK-101 parts and assembly methods before
building any of the circuits in this manual.
-3-
Page 4
IMPORTANT NOTE: The designs for the microphone input port vary throughout the computer
industry. Hence you may get waveforms different from those shown in your manual even though the
circuit is actually performing the same way. Here are some types of differences:
A.The gain of your microphone input may be significantly different from that indicated on
pages 8-10 (and similarly for the other circuits). Page 6 describes how to turn on the microphone
input and adjust its volume to about 40% of max, you may want to adjust this volume higher or lower
so that your results better match those shown.Note that having the volume set too high may “clip
off ” the top or bottom portion of a waveform.
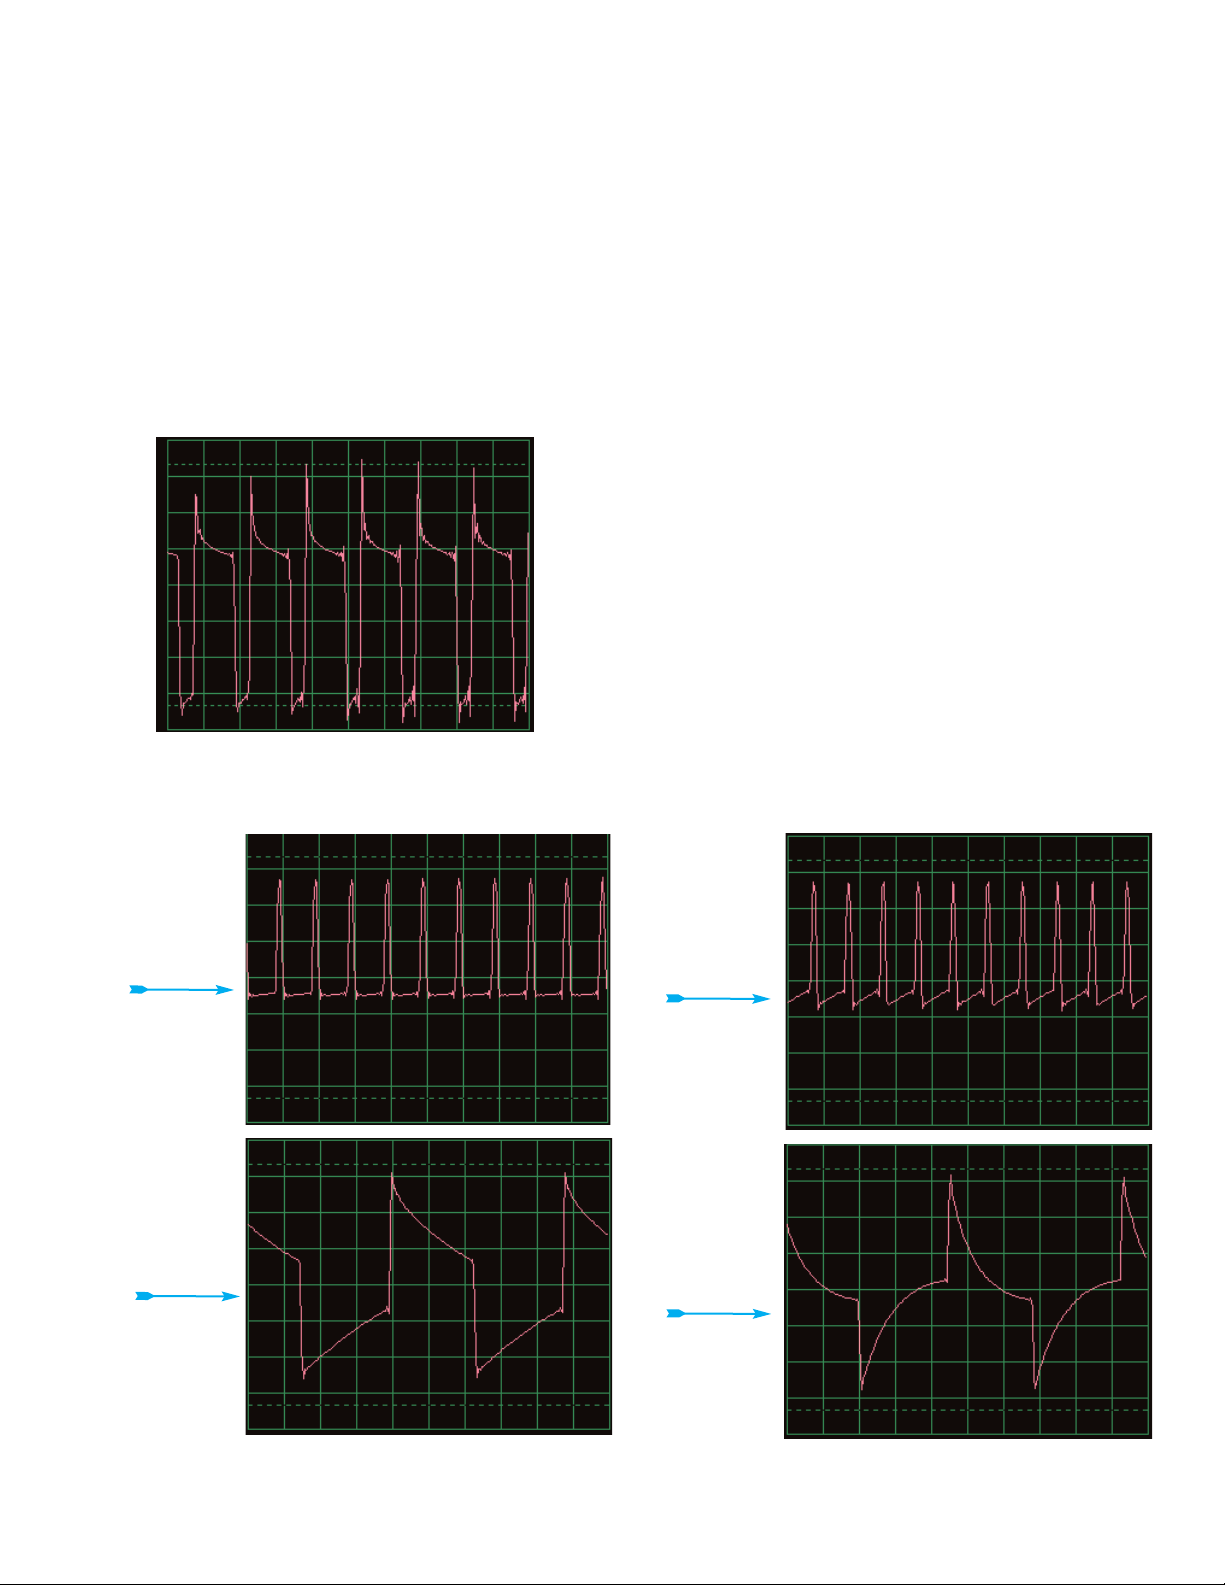
B.The oscilloscope waveforms shown on your display may appear upside down (“inverted”)
from those shown throughout this document. For example the waveform shown on the top of page 9
would look like this:
If this is the case then swap the connections of
the red and black clips of the Winscope probe in
all circuits.
C.The shape of waveforms may appear distorted for some circuits, due to protection circuitry
that acts as a filter.For example:
This
waveform
might look
like this.
And this
waveform
might look
like this.
-4-
Page 5

And this
waveform
might look
like this.
Contact Elenco Electronics if you have any questions about this.
Limitations of Winscope and its interface:
By using the microphone audio input and the flexible processing power of the personal computer,
we have created an inexpensive and easy-to-use way of looking at electronic signals. However, no
electronic oscilloscope or spectrum analyzer ever made works on all electronic signals, and similarly Winscope has limitations.The projects in this booklet were written to minimize those limitations.
Winscope can only measure changing signals (AC voltages, >20 Hz frequency) and cannot measure fixed voltages (DC voltages, such as a battery), due to the design of the microphone input.
Fixed voltages are not very exciting to look at anyway. Slow-changing or transient signals (such as
when you first turn on power to a circuit) will be displayed in a distorted form.
Winscope works best on signals up to about 5 KHz, since its sampling rate is limited to 44 KHz. If
you attempt to measure signals that are higher than this then you will get wrong results due to
undersampling.This is a narrow range but it covers human voice and most (but not all) music. AM
and FM radio frequencies cannot be measured. Every measurement you make will have some
amount of random “chatter” superimposed on the signal of interest. This chatter is due to the limited sampling rate and from the PC-interface cable picking up energy from other electronic instruments in the vicinity (including room lights and your computer), hence it cannot be avoided.
-5-
Page 6
Using Winscope’s full capabilities:
Winscope has 2 input channels that can be displayed at the same time.This is commonly done by
electronic engineers using an oscilloscope, to show the relationship of one (or more) signals to
another.However use of this requires a second microphone input, which most computers do not
have. If the sound card in your computer has this then you may use all of Winscope features for 2
channels, which include X-Y and correlate modes. Use of these Winscope capabilities is beyond
the introductory level of this product, use the Help menu in Winscope for information about using
these features.
If you have any questions contact:
Elenco Electronics, Inc.
150 W. Carpenter Avenue
Wheeling, IL 60090
(847) 541-3800
http://www.elenco.com
e-mail: elenco@elenco.com
-6-
Turning On Your Microphone
(For Windows 98, other Windows versions may be slightly different.)
If you don’t get any signal from the PC-interface cable then your microphone may be disabled on
your computer.To turn it on, follow these instructions which begin by pressing the <Start> button
on the lower-left corner:
1. Select <Start> - <Programs> - <Accessories> - <Enter tainment> (or <Multimedia>) - <Volume
Control>.
2. Select <Options>.
3. Select <Properties>.
4. Select <Recording> in the “Adjust Volume For” box.
5. In the “Show the Following Controls” box, check <Microphone>.
6. Select <OK>.
7. In the “Microphone - Volume” box, check <Select> and set volume to about 40% of max.
Your microphone should now be turned on.
WARNING:
SHOCK HAZARD - NEVER connect
the probe to AC power or a wall
electricity outlet for any reason since
serious injury or damage may result.
!
!
Page 7
SPEAKER
+9V
S
P
10kΩ
3.3kΩ
473
-7-
Project # Description Page #
PC1 Pitch 7
PC2 Speaker Microphone 13
PC3 Siren PC 15
PC4 Space Gun PC 16
Project # Description Page #
PC5 Electronic Noisemaker PC 18
PC6 Noisy Blinker PC 21
PC7 Electronic Sound PC 23
PC8 Electronic Rain PC 25
PROJECT LISTINGS
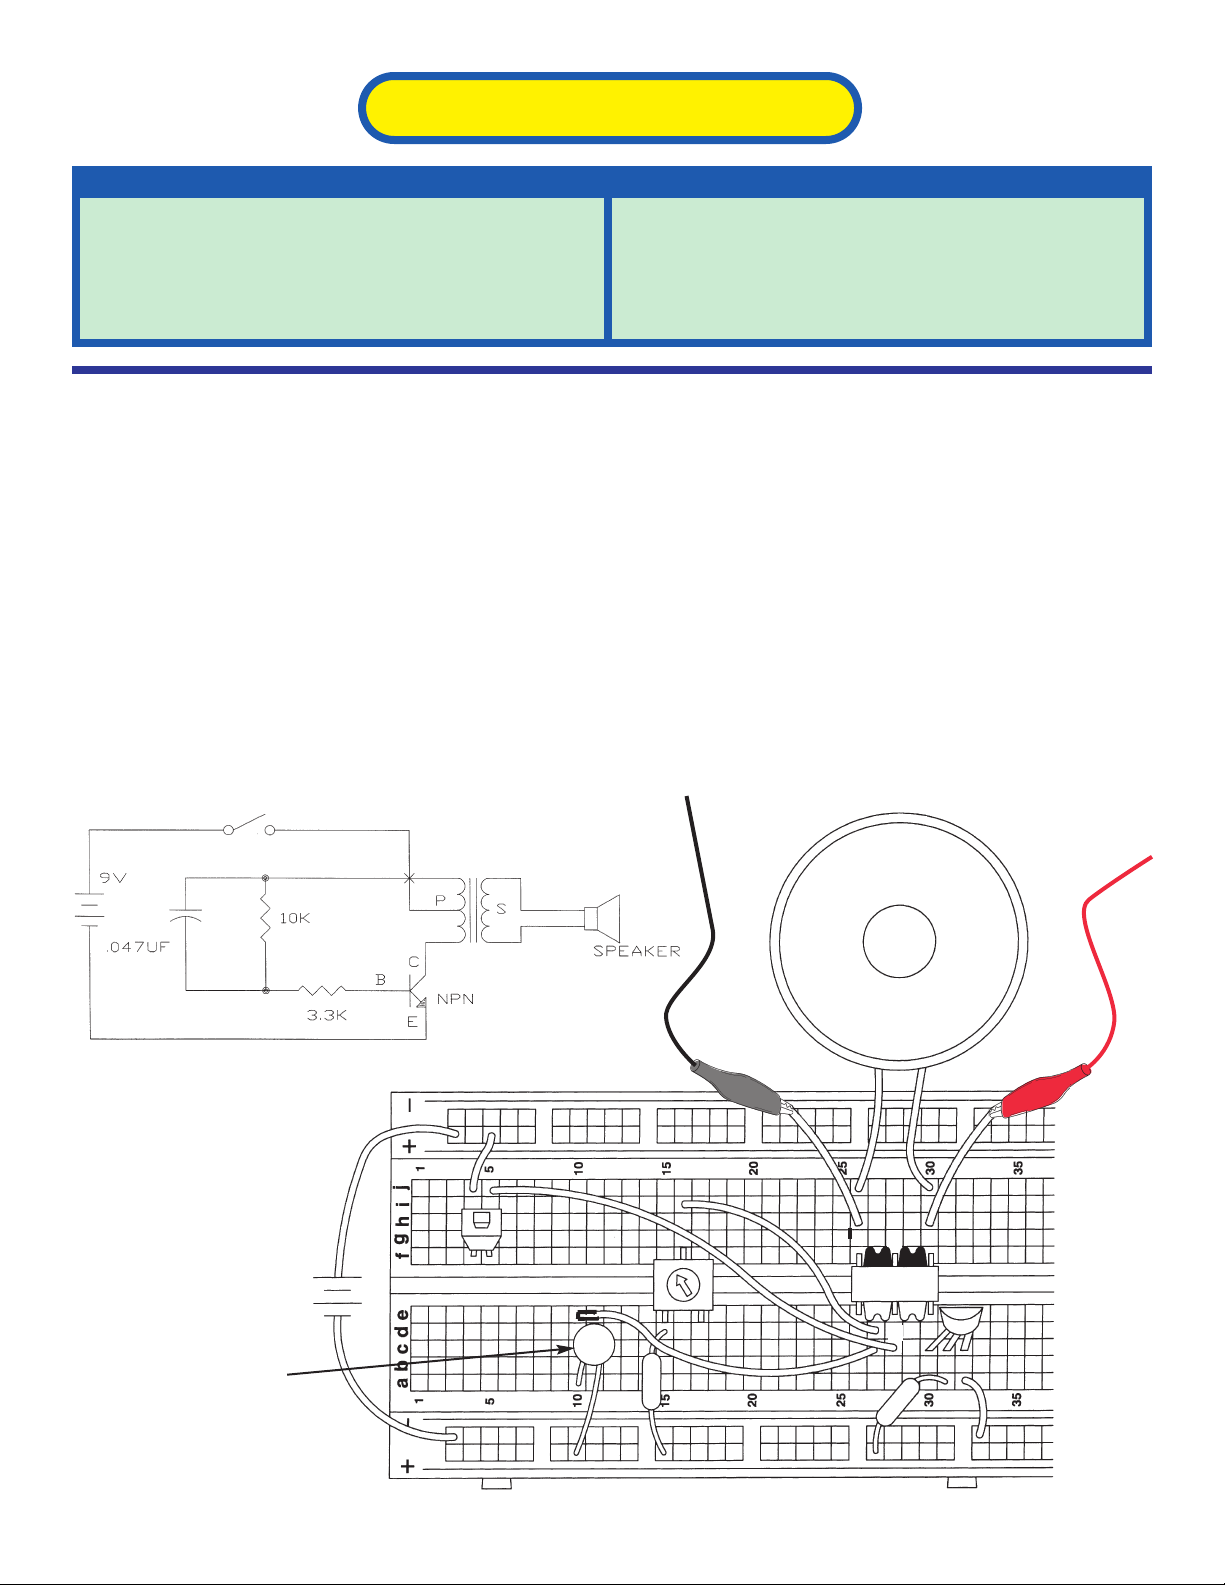
Project PC1
OBJECTIVE:To look at the output signal from a transistor oscillator while
changing the pitch of the sound.
Pitch
You will now be introduced to the Winscope features, and thereby become familiar with oscilloscopes
and spectrum analyzers, and see some of the most important concepts in electronics. It is recommended that you already be familiar with the parts and assembly methods from the other manual.
Build the circuit shown and connect the PC-interface cable to the microphone input on your computer.
Press the switch and vary the variable resistor. The frequency or pitch of the sound is changed. Run
the Winscope software and be sure your microphone input is configured properly, as described earlier.Winscope will be used to view the electrical signal to the speaker.
DISC CAPACITOR
473 marking = .047µF
Page 8
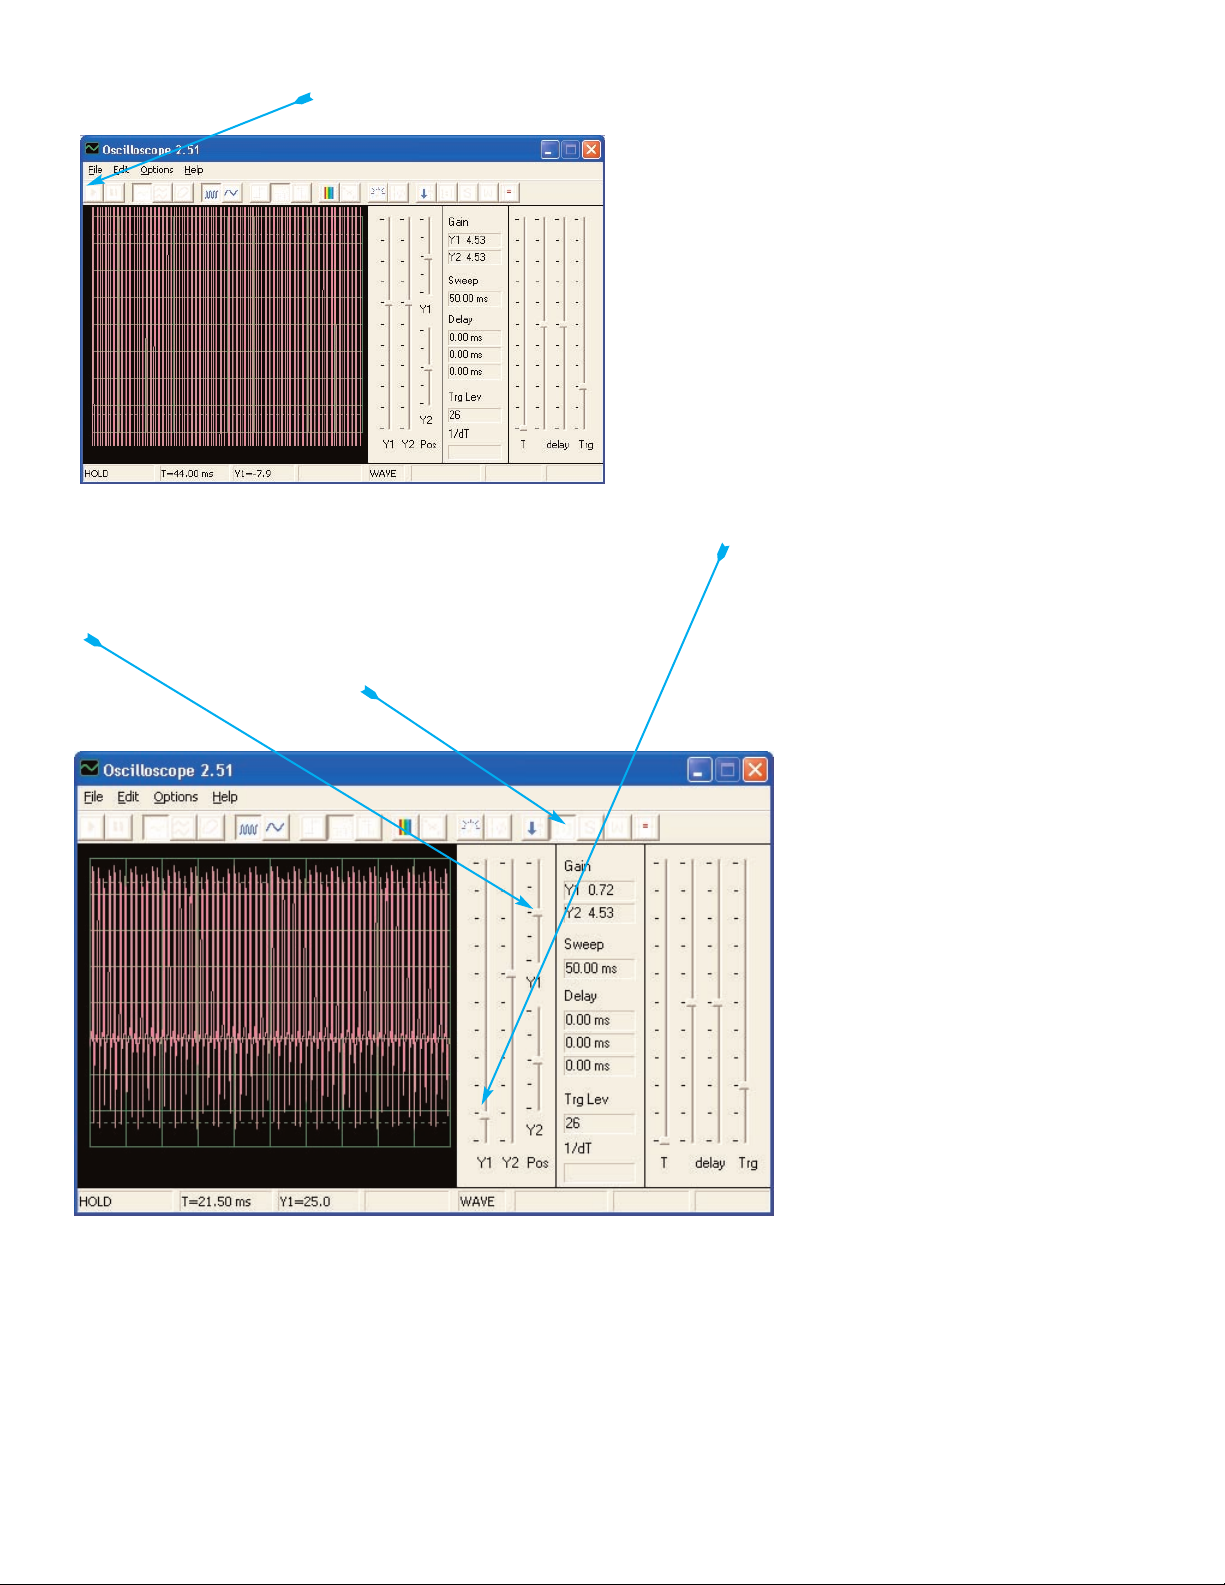
Click on the On-Line button if Winscope is currently in Hold mode and you should get a picture similar to this one:
The waveform peak is off the top of the screen because the scope gain (amplification) is set too
high.You may adjust this gain by moving the Y1 gain control around (try it).
Similarly, you may adjust the position of the waveform on the screen by moving the Y1 position control around (try it).
Now click on the 1:1 button to set the gain to x1 and disable the Y1 controls.You should now have a
picture similar to this one:
Note that your picture may not
exactly match this picture due to
variances in the microphone input
gain between computers, which is
beyond software control.You may
want to adjust the volume control
of your microphone input to compensate, see note A on page 6
for more details.You may also disable 1:1 mode by clicking on its
button again and then adjust the
gain using the Y1 control.
The gain and position control features just described enable electronics engineers and technicians
to “see” the amplitude (voltage level) of a signal.By adjusting the settings on an oscilloscope, they
can look at both very large and very small voltage waveforms.
-8-
Page 9

Move the variable resistor knob and watch how it changes the waveform on the computer screen.
Now click on the 0.5ms/div button to change the time scale on the display. (The button to the left of it
is for 5ms/div, the default.) Move the variable resistor knob around again.You may click on the Hold
button to freeze the waveform on the screen, then click on On-Line to re-start.
With the time scale at 0.5ms/div
and the adjustable resistor set for
middle position, you should now
have a picture similar to this one.
Your picture may appear different
due to variations in the microphone input designs between
computers. Although this is
beyond software control, in some
cases you may be able compensate externally. See notes B and
C on page 4 for details.
Notice that the waveform seems to be randomly dancing across the screen, making it hard to study.
We can fix this.Click on the “trigger positive level” button and make sure the trigger bar is in the
position shown here. Notice that a small “-” appears on the left of the display as you do so.
The small slash “-” represents the
trigger voltage, when the signal
reaches this voltage level it activates the display.This makes it
easy to observe a stream of pulses like you have now, and also to
record a single (non-repeating)
pulse.
Move the variable resistor control
and watch how it changes the
waveform on the computer
screen. Now you can see how
changing the variable resistor
changes the time between the
pulses, which changes the tone of
the sound you hear.
The waveform you see here is the voltage across the speaker, the peaks of the pulses occur when
the transistors turn on and provide current to the speaker. Changing the amplitude of the peaks
changes the loudness of the sound, changing their separation changes the tone or “pitch” of the
sound.The time scale and tr igger control features just described enable electronics engineers and
technicians to see the relationship between parts of a waveform on their oscilloscope.
-9-
Page 10

Now its time to look at your electronic signal in a different way.The oscilloscope features you have
been using show you voltage (amplitude) vs time, now you will see voltage vs frequency. Engineers
use expensive instruments called spectrum analyzers to do this, but Winscope uses a mathematical
transformation called an FFT to do this.Set the Y1 gain control back to its default position for now.
Click on the 5ms/div button to display a wider range, then click on the FFT button.Your display
should be similar to this:
You are seeing the frequency
spectrum of your signal, up to 22
KHz. Notice that most of the energy is at the low frequencies
(below 7 KHz), and there is very
little as you go higher.
The 1:1 gain mode does not apply to the FFT screen, so move the Y1 gain control down to here so
you can see the peak energy at the low frequencies.
Move the variable resistor control
and watch how it changes the frequencies on the display.
-10-
Page 11

Set the variable resistor control to mid-range.In addition to the 5ms/div and 0.5ms/div settings for
the horizontal scale, there is also a variable setting.See if you can set it so that all the signal peaks
line up with the grid lines, as shown.
As you can see, all the peaks are
equally spaced in frequency.
Move your computer mouse
directly over the first peak, the
software displays the frequency
you are pointing at. Move the
mouse to the other peaks and you
see they are multiples of the first
frequency.
Now you can see that the tone you hear is actually a range of related frequencies combined together.The first peak is considered to be the main signal (and it is usually but not always the highest),
the energy at all the other peaks determine the waveform of the signal you see on an oscilloscope.
Now modify your circuit by replacing the 0.047µF capacitor on top of the 10µF capacitor (+ side to
breadboard point a10). By increasing circuit capacitance, you lower the oscillation frequency and
your display should now look something like this:
-11-
Page 12

Now you can click on the FFT box to return to oscilloscope mode and look at the waveform with the
0.1µF capacitor in the circuit.You can observe it with the same settings as before for comparison,
but these settings usually work best:
Now adjust the horizontal scale so the peaks line up with the gridlines as they did before.
Notice that all the peaks went
down in frequency by a corresponding amount and many
changed in amplitude, that is why
your ears hear a different sound.
Notice also that in this case the
left-most frequency peak no
longer is the highest in voltage
(your results may vary).
-12-
Page 13

Project PC2
OBJECTIVE:To see what your voice looks like in electrical form.
Speaker Microphone
A speaker uses electrical energy to create mechanical vibrations.These vibrations create v a riations in
air pressure, called sound waves, which travel across the room.You “hear” sound when your ears feel
these air pressure variations.But if air pressure variations reach the speaker from another source, they
will cause it to vibrate too.This, in turn, causes the speaker to create a small electrical signal just like
a microphone does (though not very efficiently, since speakers were not designed to be microphones).
Connect the PC-interface cable directly the speaker as shown; no other parts are needed here. If continuing from the previous experiment then close the Winscope program and run it again, to reset the
settings. Click on the On-Line button to activate.
Hold the speaker next to your mouth and talk into it to see what your voice looks like after the speaker converts it to electrical energy. Adjust the Y1 gain control to get the best view of it, since the ampli-
tude is greater if you talk louder or
are closer to the microphone. You
may also want to increase the gain
of your microphone input for this
project only (see page 6 for
details). Notice how the waveform
is different depending on which
words or tones you say.
-13-
Page 14

Smooth, well-rounded, and repetitive waveforms (in oscilloscope mode) have nearly all of their energy at a specific frequency. “Square” or “rectangular” looking waveforms and most music have a
series of mathematically-related peaks, while “random” waveforms (like from blowing into the speaker or several people talking at the same time) have a frequency “blob” instead of distinct peaks.
Click on the FFT b utton to look at the frequency spectrum for these signals .Try the amplitude and time
scales shown here to start, but your best settings will depend on what sounds you make , ho w loud y ou
speak, and how close you are to the speaker.
Notice that most women have
higher-frequency voices than most
men, and so their frequency peaks
are further to the right on your display.
-14-
Page 15

Build the circuit shown. If continuing from the previous experiment then close the Winscope program
and run it again, to reset the settings.Click on the On-Line button to activ ate and press the switch.The
circuit makes a siren sound that slowly fades away.Try the settings shown here to view it.
The waveform at left shows the
signal just after pressing the
switch, the waveform below
uses the same settings and
shows the waveform just before
the sound stops.You see the
pulses slowly spread out as the
tone of the sound changes.
-15-
+9V
S
P
10kΩ
473
470Ω
1MΩ
10µµF
+
-
Project PC3
OBJECTIVE:To look at the output of a slowly changing circuit.
Siren PC
SPEAKER
Page 16

Now change to FFT mode to look at the frequency spectrum as the sound fades away.Try the settings
shown here.
The spectrum at left is for just
after pressing the switch. The
spectrum below uses the same
settings and shows the spectrum
just before the sound stops. The
frequencies and amplitude slowly
get lower as the sound fades away.
-16-
+9V
S
P
33kΩ
473
10µµF
470Ω
+
-
Project PC4
OBJECTIVE:To look at the output of a space gun circuit.
Space Gun PC
SPEAKER
Page 17

Build the circuit shown. If continuing from the previous experiment then close the Winscope program
and run it again, to reset the settings.Click on the On-Line button to activ ate and press the switch.The
circuit makes a space war sound that quickly fades away. Try the settings shown here to view it.
Now change to FFT mode to look at the frequency spectrum.Tr y the settings shown here.The spectrum varies depending on when you pressed and released the switch.
-17-
Page 18

+9V
S
P
33kΩ
473
470Ω
502
Project PC5
OBJECTIVE:To demonstrate storage mode.
Electronic Noisemaker PC
Build the circuit shown, connecting the battery last since it will turn the circuit on. If continuing from the
previous experiment then close the Winscope program and run it again, to reset the settings.Click on
the On-Line button to activate , and press the switch sev eral times.Set Winscope to the settings shown
below, and move the knob on the variable resistor around to change the waveform and the sound. A
sample waveform is shown here, but the pattern and shape of the pulses depends on the variable
resistor setting.
-18-
SPEAKER
Page 19

Winscope has a mode that can display multiple scans at the same time, called Stor age mode .T urn the
variable resistor knob to the right, change the Winscope time scale, place Winscope in Storage mode,
and watch the results.
without Storage mode: with Storage mode:
What you see here is the effect of timing variations on the trigger used for synchronization.Turn off the
trigger and you will see how much variation there is without using the trigger:
You can use Storage mode on any of the other circuit waveforms if desired.
-19-
Page 20

Now turn off storage mode and turn on FFT mode to look at the frequency spectrum, try the settings
shown here. Moving the variable resistor knob will change the spectrum shown.
You can also use storage mode when in FFT mode, so turn it on now.
In this way you can show the peak
energy achieved at each frequency. But this is only useful on a stable waveform, so if you move the
variable resistor knob now the signal will fill the screen as the peaks
move across the display.
Most oscilloscopes and spectrum analyzers have a storage mode like this of some form.
-20-
Page 21

+9V
100kΩ
1kΩ
3.3kΩ
470Ω
S
P
473
502
Project PC6
OBJECTIVE:To demonstrate wait mode with multiple colors.
Noisy Blinker PC
Build the circuit shown. If continuing from the previous experiment then close the Winscope program
and run it again, to reset the settings.Click on the On-Line button to activ ate , and press the switch.Set
Winscope to the settings shown below, and move the the variable resistor knob around to change the
waveform and the sound. A sample waveform is shown here, but the pattern and shape of the pulses
depends on the variable resistor setting.
-21-
SPEAKER
Page 22

Place Winscope in Wait mode by clicking on the button for it, hold down the pushbutton switch, and
then slowly press the On-Line button several times.Now release the switch and press On-Line again.
Then press the switch again.You see that in Wait mode Winscope scans (“waits”) until it sees a wave-
form that exceeds the trigger level
you set, then stops. With a strong
signal it will make one scan and
then stop, whereas if no signal is
present it keeps scanning until it
finds one. You could use this to
sense when someone has turned
on the circuit.
You can change the color of the waveform: select <Options>, then select <Colors>, then select <Y1
Trace>. Now select the color you like and click <OK>.
Now we will combine the wait and storage modes to displa y se v er al wa v ef orms that this circuit can create.You should have the circuit on with the variable resistor at mid-range and Winscope in Wait mode.
Now turn on Storage mode. Now change the color of the Y1 trace. Move the variable resistor knob a
little, then hold the circuit switch on and press On-Line once to record another waveform. Now change
the color of Y1 again. Move the resistor knob again, hold down the circuit switch, and press On-Line
once. Change the Y1 color, adjust the resistance, hold down the switch, and press On-Line. Change
the Y1 color, adjust the resistance, hold down the switch, and press On-Line. Do this as many times
as you like.Now your display should look something like this:
Now you see the range of waveforms this circuit can create, all at
the same time. Engineers often do
this to compare signals during
analysis.
You can use Wait mode and different colors like this on the other circuits if you like.
-22-
Page 23

Now turn off storage mode and turn on FFT mode to look at the frequency spectrum, tr y the settings
shown here.Wait mode does not apply in FFT mode, so it has no effect here. Moving the variable
resistor knob will change the spectrum shown.
-23-
SPEAKER
LOOSE WIRES
+9V
100
µµ
F
1MΩ
S
P
10
µµ
F
10kΩ
33kΩ
100kΩ
3.3kΩ
473
502
+
-
Project PC7
OBJECTIVE:To look at the
output signal from a transistor oscillator while
changing the pitch of the
sound.
Electronic Sound PC
Page 24

Build the circuit and connect the Winscope PC-interface cable as shown.There are 4 resistors and 4
capacitors connected to the 3.3kΩ resistor (we are using the (+) row of holes at the bottom to make
the connections easier) and 2 loose wires connected to the transformer. Connect the transformer to
one resistor and one capacitor at a time, then press the switch.
Use Winscope to view the waveforms in oscilloscope mode and the frequency spectrum using spectrum analyzer mode just like in project PC1.You may need to adjust the horizontal (time/frequency)
scale depending on which resistor-capacitor combination you select. If continuing from the previous
experiment then you may want to close the Winscope program and run it again, to reset the settings.
All the combinations are listed below, you don’t need to try all of them but try some and see if there is
a pattern in the frequency or pitch (a term used in music) of the sound. Record a few comments about
the sounds you hear and the waveforms that correspond to them.
10kΩ 33kΩ 100kΩ 1MΩ
0.005µF
0.047µF
10µF
100µF
You will see that the frequency increases when you lower the resistance or capacitance. It also
increases if you lower the inductance, but you don’t have any other inductors you can substitute.
-24-
Page 25

Build the circuit shown. If continuing from the previous experiment then close the Winscope program
and run it again, to reset the settings.Click on the On-Line button to activ ate , and press the s witch.You
hear a sound like raindrops. Set Winscope to the settings shown below, and move the the variable
resistor knob around. The “raindrops” only occur about every second and will be hard to view using
Winscope.
+9V
S
P
10kΩ
10µµF
100
µµ
F
+
-
-
+
Project PC8
OBJECTIVE:To demonstrate wait mode with multiple colors.
Electronic Rain PC
-25-
SPEAKER
Page 26

The wav eform will be easier to view if you adjust the horizontal delay, as shown.Using Wait mode also
helps (press the On-Line button to trigger).
You may also view the frequency spectrum if desired, try these settings.
You’ve finished! Congratulations!
You may use Winscope to view signals on some of the other PK-101 circuits or to look at other
points in the circuits. Just remember that Winscope cannot measure DC voltages and should only be
used with signals of 20-5KHz frequency (see limitations on page 5 for details).
-26-
Page 27

Elenco Electronics, Inc.
150 W. Carpenter Avenue
Wheeling, IL 60090
(847) 541-3800
http://www.elenco.com
e-mail: elenco@elenco.com
 Loading...