

Page 1

High-Frequency Oscillatory Ventilation:
Theory and Practical Applications
Jane Pillow
Page 2

2 I I 3Foreword I
Important note:
Medical knowledge is subject to constant change as a consequence of research
and clinical experience. The author of this booklet has taken great care to make
certain that the views, opinions and assertions included, particularly those concerning
applications and effects, correspond with the current state of knowledge. However,
this does not absolve readers from their obligation to take clinical measures on their
own responsibility.
All rights to this booklet are reserved by Prof J. Pillow and Drägerwerk
AG & Co. KGaA, in particular the right of reproduction and distribution. No part
of this booklet may be reproduced or stored in any form either by mechanical,
electronic or photographic means without the express permit of Drägerwerk
AG & Co. KGaA, Germany.
1 Foreword
High-frequency ventilation (HFV) has progressed over the last thirty years from its
initial status as a novel ventilatory tool, to become a routine ventilatory strategy.
High-frequency ventilation comprises several different modalities including
high-frequency positive pressure ventilation, high frequency flow interruption,
high-frequency jet ventilation and high-frequency oscillatory ventilation (HFOV or
HFO). This booklet concentrates on HFOV, the principal distinguishing feature of
which is the inclusion of active inspiratory and expiratory phases.
A number of oscillatory devices are commercially available. They differ in
technology, performance, versatility, user-friendliness, and cost. Where possible,
recommendations in this booklet have been kept general in nature and apply across
devices. References specific to the Dräger Babylog VN500
within an appendix at the end of the booklet using software version 2.4n (Drägerwerk
AG & Co. KGaA, Lübeck, Germany). It is important to note that other oscillators may
function differently.
This booklet aims both to help less experienced clinicians become familiar with
high-frequency oscillation, whilst also providing additional detail to enhance the
understanding of more experienced HFOV users. The chapters that follow outline
the theory, control mechanisms, strategies and complications of HFOV. Particular
emphasis is placed on understanding the basis for practical application approaches
that maximise the potential benefits and minimise the risk of adverse outcomes of
HFOV therapy. It should be clear that there is a steep learning curve that needs to
be climbed to ensure safe and effective ventilation with HFOV: neonatal teams
considering use of HFOV for the first time are advised to obtain comprehensive
guidance from experienced users and preferably also practical experience using
HFOV in a unit where HFOV is practiced routinely and successfully.
Throughout the text, key points and more advanced concepts are highlighted in
text boxes. The theory and recommendations contained herein represent current
knowledge and understanding of HFOV theory and application and my experience
evaluating the pitfalls and benefits of HFOV over a twenty year period. Nonetheless,
as foreseen in the section on future directions of HFOV, rapid advances in medical
technology and its miniaturisation to meet the challenges imposed by the neonatal
patient will result in new HFOV knowledge and options. Consequently, the descriptions
and recommendations contained herein will likely need revision over time.
Perth, September 2016
J. Jane Pillow
1
are largely contained
1
Part of Infinity Acute Care System
Workstation Neonatal Care.
Page 3

4 I I 52 Table oF ConTenTs I
2 Table of Contents
1 Foreword ................................................................................................... 3
2 Table of Contents ..................................................................................... 4
3 High-frequency ventilation ........................................................................7
3.1 Introduction ........................................................................................................................ 7
3.2 Definition ............................................................................................................................. 7
3.3 Devices and mechanisms for generating active expiratory flow ....................... 7
4 Gas mixing during high-frequency oscillations ....................................... 9
4.1 Augmented longitudinal gas transport and enhanced dispersion ................. 10
4.2 Asymmetric flow profiles ..............................................................................................10
4.3 Branching angle asymmetries .................................................................................... 12
4.4 Direct alveolar ventilation............................................................................................. 12
4.5 Intra-alveolar pendelluft ................................................................................................ 12
4.6 Cardiogenic mixing ........................................................................................................ 13
4.7 Molecular diffusion ........................................................................................................ 13
5 HFV ventilator parameters and control variables ...................................14
5.1 Mean airway pressure ................................................................................................... 14
5.2 Pressure amplitude – oscillatory volume................................................................ 15
5.3 Oscillatory frequency ................................................................. ................................... 16
5.4 Inspiratory to expiratory ratio ...................................................................................... 17
5.5 The coefficient of gas transport: DCO
.................................................................. 17
2
6 Understanding transmission of pressure amplitude ..............................19
6.1 Pressure damping .......................................................................................................... 19
6.2 Pressure amplitude transmission and respiratory mechanics ........................ 19
6.2.1 Lung compliance ............................................................................................................20
6.2.2 Resistance ........................................................................................................................ 21
6.2.3 Inertance ...........................................................................................................................23
6.2.4 Inhomogeneous lung disease ....................................................................................24
6.3 Pressure damping and frequency .............................................................................25
6.4 Corner frequency and pressure cost of oscillatory flow...................................25
6.4.1 Corner frequency in different clinical settings ..................................................... 27
7 Understanding tidal volume delivery during HFOV ............................... 29
7.1 Determinants of tidal volume ..................................................................................... 30
7.1.1 Oscillatory amplitude .................................................................................................... 31
7.1.2 Frequency .........................................................................................................................32
7.1.3 I:E ratio ...............................................................................................................................32
7.1.4 Lung mechanics ............................................................................................................. 33
8 Distending lung volume and mean airway pressure ............................. 34
8.1 Determinants of distending lung volume during HFOV ................................... 35
8.1.1 Control of mean airway pressure ............................................................................. 35
8.1.2 Determinants of mean intrapulmonary pressure ................................................. 35
8.2 Achieving optimal lung volume ..................................................................................37
8.2.1 Approaches to recruiting and optimising lung volume during HFOV...........37
8.2.2 Avoiding volutrauma during lung volume recruitment ........................................37
8.2.3 Maintaining optimal lung volume in HFOV............................................................ 39
8.2.4 Avoiding atelectasis ...................................................................................................... 40
8.3 Avoiding overdistension .............................................................................................. 40
9 Management of HFOV .............................................................................41
9.1 Transition from conventional ventilation .................................................................. 41
9.1.1 Prepare the patient and the monitoring environment ......................................... 41
9.1.2 Setting the mean airway pressure ............................................................................ 41
9.1.3 Setting oscillatory pressure amplitude (pressure controlled HFOV) .......... 41
9.1.4 Setting oscillatory tidal volume
(volume targeted, pressure limited HFOV) .......................................................... 43
9.2 Continuation of HFOV ................................................................................................. 44
9.2.1 Management of oxygenation ...................................................................................... 44
9.2.2 Management of carbon dioxide ................................................................................ 44
9.3 Humidification ................................................................................................................ 46
9.4 Weaning from HFOV .................................................................................................... 46
10 Monitoring during HFOV ..........................................................................47
10.1 Monitoring of gas exchange and respiratory mechanics .................................. 47
10.2 Monitoring of lung volume ........................................................................................... 47
10.3 Monitoring of circulatory system and systemic perfusion ............................... 48
11 Indications for HFOV .............................................................................. 49
12 Strategies for HFOV in various lung diseases ........................................51
12.1 Diffuse homogeneous lung diseases ...................................................................... 51
12.2 Inhomogeneous lung diseases .................................................................................. 52
12.3 Airleaks ............................................................................................................................. 53
12.4 Persistent pulmonary hypertension of the newborn (PPHN) ......................... 54
13 Complications, relative contraindications and limits of HFOV ............. 54
13.1 Complications and side effects ................................................................................ 54
13.1.1 Irritation ............................................................................................................................. 54
13.1.2 Secretions ........................................................................................................................ 55
Page 4

6 I I 72 Table oF ConTenTs I
2 Table of Contents 3 High-frequency ventilation
13.1.3 Necrotising tracheobronchitis .....................................................................................55
13.1.4 Haemodynamics .............................................................................................................. 55
13.1.5 Intracranial haemorrhages ............................................................................................55
13.1.6 Overinflation .................................................................................................................... 56
13.2 Relative contraindications .......................................................................................... 56
13.3 Limitations of HFOV ..................................................................................................... 56
14 Failure of HFOV ....................................................................................... 58
15 The future directions of HFOV ................................................................ 58
16 Summary ................................................................................................. 59
17 Appendix .................................................................................................60
17.1 High Frequency Ventilation with the Dräger Babylog VN500 ........................ 60
17.1.1 Adjusting HFOV with the Babylog VN500 .............................................................62
17.2 Clinical Case Report – Benefits of HFOV with Volume Guarantee ............ 65
17.3 Example: DCO
Volume Guarantee ........................................................................................................ 68
17.4 Abbreviations .................................................................................................................. 69
18 References ...............................................................................................71
19 Index ........................................................................................................74
during lung volume recruitment with/without
2
COLOR CODE of text boxes
i
DEFINITION
3.1 Introduction
Many infants continue to require invasive ventilation, despite major advances in
perinatal care including widespread use of antenatal steroid therapy, exogenous
surfactant therapy and non-invasive respiratory support. Ventilation induced lung
injury (VILI) is a complication of invasive ventilatory support that prolongs duration
of supportive care. Ventilation induced lung injury in the developing lung has lifelong
implications for respiratory well-being due to failure of alveolarisation and abnormal
airspace development. The propor tion of infants requiring mechanical ventilation
increases at lower gestations: ex tremely preterm infants are additionally extremely
vulnerable to injury. Consequently, ventilation research and device development over
the past t wo to three decades has focused intensely on new therapies that facilitate life
support with minimal risk of iatrogenic injury. Both extracorporeal membrane
oxygenation (ECMO) and high-frequency ventilation offer opportunities for lung
protective ventilation whilst minimising rheotrauma resulting from either excessive
cyclic volume oscillations or repeated re-inflation of atelectatic air spaces.
High-frequency oscillation is a unique and the most well-known and used form of
high-frequency ventilation. HFOV arose initially from observations by Henderson of
patterns of smoke blown down a tube, and was subsequently described in more
detail by Lunkenheimer in the early seventies (4, 28). HFOV has now emerged into a
comprehensive ventilator y strategy applied throughout the world as both an a priori
and rescue ventilatory modality.
3.2 Definition
Distinguishing characteristics of contemporary HFOV include:
1. a frequency range from 3-20 Hz (180 to 1200 breaths/minute);
2. active inspiratory and expiratory phases;
3. tidal volumes approximating anatomical dead space volume.
S
T
SUMMARY
PRACTICAL TIPS
3.3 Devices and mechanisms for generating active expiratory flow
A range of technical principles are used to produce oscillatory ventilatory
waveforms in different devices. The oscillations divert small volumes of gas to the
patient at high frequency: the mechanically driven oscillations resulting in active
inspiration and active expiration. Mean airway pressure is created through the
pressure drop of the bias flow in combination with an expiratory resistance. True
oscillators achieve roughly matching magnitude of the negative and positive pressure
deflections when equal inspiratory and expiratory cycle durations are used. Matched
Page 5

8 I I 93 HIgH-FrequenCy venTIlaTIon I deFInITIon and devICes
AB
negative and positive pressure deflections can be achieved via several different
mechanisms including a linear motor piston pump, an electromagnetically driven
vibrating diaphragm (loudspeaker) or via a combination of servo controlled inspiratory
valve and an expiratory venturi jet (which is generating sub-atmospheric pressures).
Examples of contemporary oscillators include the Sensormedics SM3100A, SM3100B,
Humming V, the Flowline Dragonfly, the Heinen and Löwenstein Leoni Plus, the
Acutronics Fabian, the Stephan SHF3000, the SLE5000 and the Dräger Babylog
8000plus and Babylog VN500.
Although oscillators are traditionally classified according to the oscillatory flow
generating mechanism, the function, capabilities and limitations of each device
are of greater clinical relevance to practical application and potential physiological
efficacy. A key differentiation is the frequency composition of the oscillatory
waveform: oscillators generating sine waves with relatively “pure” fundamental
frequency content contrast with those producing more complex and often
square waveforms comprising multiple frequencies (1, 2). Although more complex
waveforms may enhance gas mixing and regional ventilation homogeneity, the effect
of the potential shear effects arising from more turbulent and inertive
flow on airway wall properties is unknown (see Figure 3-1).
A second feature of clinical relevance is the practical ease of switching from
conventional ventilation to HFOV, or even of combined conventional and HFO
ventilation. The emergence of hybrid ventilators that can combine conventional
and high frequency modalities will increase access to oscillatory ventilation and
potentially encourage earlier a priori use of HFOV for lung protective respiratory
support. A downside of this combination is that hybrid ventilators often have more
limited power than standalone oscillators such as the SM3100 series. To a large
extent, these limitations can be overcome by either switching to a lower oscillatory
frequency, or changing from a 1:2 to a 1:1 inspiratory to expiratory ratio (I:E). Other
features with practical implications for inter- and intra-hospital transport include
minimum bias flow requirements and availability of inbuilt battery backup. The
importance of incorporated tidal volume monitoring is recognised increasingly as
clinical strategies are revised to include monitoring of volume and the diffusion
coefficient to optimise ventilation and lung protection.
2
Inertive flow refers to the variable flow occurring with sudden accelerations and decelerations
accompanying reversal in flow direction at high frequencies.
2
oscillatory
Low
shear
zone
High
shear
zone
D-8063-2016
Figure 3 -1: Reversing oscillatory flow at high frequencies may distort cells due to shear stress
A) Turbulent flows and formation of eddies creates high shear zones. B) Shear stress applied to the
surface of an airway epithelial cell will promote deformation of the cell sur face, whilst the base of the
cell remains fixed. In HFOV, a reversing oscillating shear effect occurs due to shear effec t in
opposing directions during inspiration and expiration.
4 Gas mixing during high-frequency oscillations
High frequency oscillatory ventilation offers unique and highly efficient gas mixing,
contributing to its success in both a priori and rescue treatment of patients with
severe respiratory disease and impaired gas exchange. The gas mixing efficiency
of HFOV over conventional ventilation is due to fundamental differences in the
behaviour of gases in the airways and alveoli.
Gas mixing during conventional ventilation is primarily dependent on direct
ventilation of the alveoli via bulk convective flow. To be effective, delivered tidal
volumes need to be of sufficient size to fill the anatomical dead space of the
airways as well as to distend and fill the volume of the alveolar compartment.
Decreasing tidal volume to volumes at or below anatomical dead space volume, whilst
delivering these volumes at conventional breathing frequencies, impedes
clearance of the waste carbon dioxide from the alveolar compartment (dead space
ventilation). Low tidal volume ventilation at conventional breathing frequency thus
contributes to development of atelec tasis and impaired oxygenation due to inadequate
transmission of a distending pressure (reduction of mean airway pressure).
Page 6

10 I I 114 gas mIxIng durIng HIgH-FrequenCy osCIllaTIons I
Pressure amPlITude and resPIraTory meCHanICs
In sharp contrast to mechanical ventilation at conventional breathing frequencies,
HFOV offers highly effective oxygenation and clearance of waste gas, despite use of
tidal volumes at or below dead space volume. The efficiency of HFOV in ventilating
the lung at very low tidal volumes is attributed to highly effective mixing of fresh and
exhaled gases in the airways and alveolar compartment. The mechanisms contributing
to this augmented gas mixing are multiple (3), and influenced by the ventilator
waveform (sinusoidal or complex, multiple harmonic) and settings (eg frequency,
mean airway pressure and oscillatory amplitude) as well as the respiratory mechanics
(airway and parenchymal), homogeneity of ventilation and cardiac function.
4.1 Augmented longitudinal gas transport and enhanced dispersion
The concept of augmented longitudinal gas transport and potential penetration of
the alveoli of gas delivered in volumes less than the anatomical dead space were
foreseen by the early simple yet elegant studies by Henderson and colleagues in
1915 (4). Blowing tobacco smoke down a tube, they observe the formation of long
thin spikes of smoke, and showed that importance of frequency with their conclusion
that the “quicker the puff, the thinner and sharper the spike”. Because the velocity
and concentration profiles of oxygen are not flat (with higher concentrations of oxygen
at the core of the flow profile, fresh gas can penetrate the alveoli despite very low
tidal volumes). Taylor showed that this flow profile contributes to longitudinal mixing
of gas, which can be described as a process of diffusion that increases with average
velocity and tube diameter, exceeding the molecular diffusion by many fold (5).
Consequently, this mechanism of gas mixing appears particularly important in the
large airways. At the same time as fresh gas is propelled forward, there is also lateral
(radial) mixing of gas with movement of particles from the centre to the periphery of
the gas flow, resulting in enhanced dispersion of gas. Finally, together with the
accelerated projection of fresh gas into the lung, co-axial flow results in a slower
moving peripheral expiratory gas flow, effectively pushed out of the lung by the force
of the incoming gas.
4.2 Asymmetric flow profiles
Gas mixing is further enhanced by differences in flow profiles between
inspiration and expiration. Whereas the inspiratory flow profiles are sharp and pointed,
expiratory flow profiles are more blunt in appearance.
a
0
2
0
2
0
2
0
2
Figure 4-1: Augmented longitudinal flow and enhanced dispersion: boundary. Flow profile and
boundary surface between two gases with different flows: a) low flow with flat profile; b) high flow
with tapering, peaked flow profile. In high flow, fresh gas (O
gas exchange at the boundary surface.
) diffuses radially (laterally) permitting
2
CO
O
2
Figure 4-2: Asymmetric inspiratory and expiratory flow profiles. The peaked inspiratory flow profile
penetrates the broader expiratory flow profile, permitting net movement of fresh gas distally, and
expired CO
moves towards the airway opening via lateral pathways.
2
b
2
D-8051-2016
D-8052-2016
Page 7

12 I I 134 gas mIxIng durIng HIgH-FrequenCy osCIllaTIons I
Pressure amPlITude and resPIraTory meCHanICs
4.3 Branching angle asymmetries
Secondary gas movements occur at airway bends and bifurcations creating
turbulent eddies that enhance radial gas mixing (movement of gas particles from
the centre of flow to the stationary boundary layer along the wall) at the expense of
longitudinal gas transport. Turbulences occurring at asymmetric airway branches
induce pendelluft (see section 4.5), potentially further enhancing gas mixing.
D-8054-2016
abc
Figure 4-4: Pendelluft. Gas mixing occurs through asynchronous filling and emptying of lung units
with different time constants. Each phase lasts only a fraction of the full oscillator y cycle.
4.6 Cardiogenic mixing
Low-frequency cardiogenic mixing additionally augments gas mixing in the lung
zones adjacent to the heart. Cardiogenic mixing may account for up to half of the
oxygen uptake in the presence of totally apnoeic respiration (7).
D-8053-2016
Figure 4-3: Branching angle asymmetries. Gas flow profiles and boundary surfaces deform at airway
bifurcations, together with generation of secondary eddying gas movements to enhance gas mixing.
4.4 Direct alveolar ventilation
Proximal alveoli (i.e. alveoli in close proximity to the central airways) continue to
receive ventilation directly via bulk convective gas flow. Consideration of these
airways is impor tant in selecting frequency of ventilation, as lower frequencies
require higher tidal volumes for effective gas exchange, which may be injurious to
proximal alveoli.
4.5 Intra-alveolar pendelluft
Some degree of regional inhomogeneity is present even in the healthy lung.
Intra- and inter-regional differences in compliance and resistance result in
ventilation of neighbouring alveolar units out of phase: each alveolar or acinar
compartment will fill and empty at different time constants. The resulting
asynchronous behaviour results in intra-alveolar pendelluft – a form of mutual gas
exchange in the peripheral gas exchanging compartments (6). Even small fresh-gas
volumes are able to reach a large number of alveoli.
4.7 Molecular diffusion
The same early observations by Henderson and colleagues in 1915 on the
behaviour of tobacco smoke in a glass tube contributing to the concept of
augmented longitudinal gas transport, also demonstrated the rapidity with
which the boundary layer of a gas disappears when flow stops – a process
referred to as molecular diffusion (see Figure 4-5: Henderson’s Molecular Diffusion
Experiment). Henderson and colleagues visualised the movement of gas in a glass
tube using smoke. Their observations included that: a) centrally located particles
were propelled further down the tube than expected from the volume of the smoke
puff; b) slowing or cessation of flow resulted in instantaneous mixing or “diffusion”
of the smoke particles (4). Molecular diffusion is especially important in the lung
periphery where it occurs extremely rapidly and is enhanced further by the effects of
cardiogenic mixing. Molecular diffusion and Taylor dispersion together account for
almost all of the gas transport occurring during HFOV (8).
Page 8

14 I I 15
5 HFv venTIlaTor ParameTers and ConTrol varIables I
Pressure amPlITude and resPIraTory meCHanICs
a
b
D-8078-2016
Figure 4-5: Henderson’s Molecular Diffusion Experiment. Henderson and colleagues
visualised the movement of gas in a glass tube using smoke. Their observations included
that: a) centrally located par ticles are propelled fur ther down the tube than expec ted from the
volume of the smoke puff; and b) slowing or cessation of flow resulted in instantaneous mixing
or “diffusion” of the smoke particles.
5 HFV ventilator parameters and control variables
Compared to conventional ventilation, control of HFOV is limited to four main
ventilatory parameters (Figure 5-1):
1. the pressure waveform oscillates around a mean airway pressure;
2. the amplitude of the oscillatory pressure waveform defines the oscillatory
volume delivered to the patient for any given set of mechanical conditions;
3. the oscillatory frequency defines the number of oscillatory cycles per second; and
4. the inspiratory to expiratory ratio (determined in some ventilators by a %
inspiratory time setting) determines the relative duration of forward and reverse
flow within each oscillatory cycle.
The strict definition of inspiratory and expiratory time is determined from the zero
crossing points of the flow waveform when air starts to move in and out of the
airway. Many ventilators determine the I:E time from the on/off time of the mechanism
generating the oscillatory flow.
5.1 Mean airway pressure
Mean airway pressure in HFOV is ideally targeted to keep the lung inflated
without over-distension. Mean airway pressures greater than the lower inflection
point on the inflation limb of the pressure volume curve are required initially to
inflate the collapsed lung. However, once open, the mean airway pressure is usually
reduced substantially to achieve optimal distending volume at the lowest
effective distending pressure. Mean airway pressure is the principle parameter used
to control oxygenation and matching of ventilation-perfusion, avoiding unwanted
intrapulmonary right-to-left shunting.
Pressure
Amplitude
MAP
Time
Figure 5-1: HFOV pressure waveform parameters. Amplitude is usually determined as the
difference between peak and trough of the pressure waveform.
D-8055-2016
5.2 Pressure amplitude – oscillatory volume
The clinician sets the pressure amplitude on the ventilator as the principle modifiable
parameter controlling oscillatory volume – which is ultimately the key determinant
removal. Above approximately 3-5 Hz, oscillatory volume influences CO
of CO
2
elimination exponentially (9, 10)3.
Tidal volumes required for effective gas exchange depend on frequency, ranging
from around 3.5 mL/kg at 5 Hz decreasing to 1.5-2 mL/kg at 15 Hz. The tidal volume
delivered to the patient depends on the pressure amplitude, frequency, set I:E and
compliance and resistance of the patient’s respiratory system. Consequently,
accumulation of secretions, changes in tracheal tube, and lung inflation all affect the
oscillatory tidal volume delivered to the patient at any given pressure amplitude. The
volume delivered by the ventilator is substantially greater than the tidal volume
delivered to the patient. The volume delivered to the patient for any given oscillatory
pressure amplitude is mainly dependent on the compliance of the patient circuit and
humidifier chamber, as the ventilator has to fill the patient circuit with gas in order to
build up the set pressure amplitude.
Pressure amplitude measured at the airway opening is dampened as it is transmitted
down the air ways to the alveolar compar tment (see Chapter 6).
3
Interestingly, the frequency at which this transition occurs depends on the ratio of the metabolic
rate to dead space: consequently the transition frequency is lower in adults than for infants.
2
Page 9

16 I I 175 HFv venTIlaTor ParameTers and ConTrol varIables I
Pressure amPlITude and resPIraTory meCHanICs
Pressure
A
B
Time
I:E = 1:1
A = B
Figure 5-2: Influence of I:E ratio on symmetry of the oscillatory pressure waveform. At an I:E of 1:1,
the peak and trough of the oscillatory pressure waveform are equidistant from the mean airway pressure. However, at I:E of 1:2, the trough of the pressure waveform is approximately half as far below the
mean air way pressure as the peak of the pressure waveform is above the mean airway pressure. A
larger inspiratory ΔP is required at I:E of 1:2 to achieve equivalent tidal volume delivery to an I:E of 1:1.
Pressure
A
B
Time
I:E = 1:2
A ≠ B
5.3 Oscillatory frequency
Oscillatory frequency (f) is a ventilator parameter measured in units of Hertz (Hz =
1/s). The frequency influences the oscillatory volume: as frequency increases, the
available time for inflation and deflation decreases, limiting the delivered tidal volume
for any given oscillatory amplitude and prevailing lung and circuit mechanics.
Frequency selection has important implications for the proportional transmission
of pressure amplitude to the alveolar compartment (see Chapter 6), with smaller
pressure amplitudes delivered as frequency increases. This fact is often not
appreciated by clinicians, as the required amplitude (displayed by the ventilator)
usually decreases as frequency is lowered.
Although amplification of alveolar pressure amplitudes may occur at frequencies
close to the resonance frequency (11), amplification is rarely a problem in the overdamped neonatal lung.
Optimal oscillatory frequency needs to be adjusted according to the prevailing
mechanical condition of the lung and associated disease characteristics. Frequency
selection is covered in more detail in section 6.3 and section 7.1.2.
5.4 Inspiratory to expiratory ratio
The inspiratory to expiratory ratio (I:E) determines the proportion of time spent when
oscillatory pressure is above (inspiratory) or below (expiratory) the mean airway
pressure, resulting in similar fluctuations of positive and negative flow. The peak
and trough of the oscillatory pressure waveform are similarly distant (in opposing
directions) from the mean airway pressure when inspiratory and expiratory cycle
durations are of equal value (I:E = 1:1). However, equidistance of the peak/trough
from the mean does not apply when using I:E other than 1:1, to ensure that the
area under the flow curve is the same during inflation and deflation and complete
removal of any delivered volume. At I:E of 1:2 for example, the trough of the oscillatory
pressure waveform will be approximately half the distance of the peak of the
oscillatory pressure waveform away from the mean airway pressure, but the relative
D-8070 -2016
negative pressure will be maintained for twice as long (see Figure 5-2).
I:E of 1:2 were initially used in HFOV due to concerns about potential gas
trapping at high-frequencies. However, gas trapping is not a relevant concern when
active expiration is used. As the peripheral pressures are damped, the difference
between inspiratory peak pressure and expiratory trough pressures is much smaller
than seen at the airway opening, resulting in negligible differences between
inspiratory and expiratory resistance. If mean airway pressures are high enough,
the airways will be stented sufficiently to prevent collapse during expiration.
Importantly, intra-thoracic expiratory pressures remain positive, despite potential for
subatmospheric pressures at the airway opening (12). An exception occurs when
extremely low mean airway pressures are set, creating opportunities for choke point
formation with resultant airway collapse and gas trapping. I:E ratio may have
implications for gas mixing efficiency and potential shear effects, however these
have yet to be elucidated fully.
5.5 The coefficient of gas transport: DCO
2
Whilst not currently a controlled ventilator parameter, the gas transport/diffusion
coefficient (DCO
) is a vital, and often under-recognised variable in HFOV as a
2
critical determinant of the efficiency of gas mixing and hence success of HFO
ventilation.
Removal of carbon dioxide in conventional ventilation is determined by the
product of alveolar tidal volume and respiratory rate, known as alveolar minute
volume, or alveolar minute ventilation. As alveolar tidal volume is difficult to measure,
the minute volume (determined by the product of tidal volume and respiratory rate)
is used instead.
Page 10

18 I I 19
5 HFv venTIlaTor ParameTers and ConTrol varIables I
Pressure amPlITude and resPIraTory meCHanICs
Several studies show that the relationship between carbon dioxide removal and the
factors tidal volume and respiratory rate changes as respiratory frequency increases.
Above 5 Hz in particular, there is a transition such that CO
2
approximately correlated to ƒ* V
to as the CO
DCO
2
diffusion (gas transport) coefficient, DCO2.
2
is generally measured and displayed by oscillatory ventilators using flow
(9, 10). The ƒ* V
T
and tidal volume monitoring. An increase in DCO
2
product is commonly referred
T
decreases PaCO2. As DCO2 is
2
elimination becomes
2
only linearly related to frequency, but increases exponentially with increases in tidal
volume, improved CO
volume. For example, a 10 % and 20 % increase in tidal volume increase DCO
removal is achieved most efficiently by increasing tidal
2
by
2
21 % and 44 % respectively.
In contrast, changes in DCO
with changes in frequency are dependent on
2
whether HFOV is used with or without Volume Guarantee: if HFOV is used without
Volume Guarantee, increase in frequency may be offset by a decrease in tidal volume,
resulting in a decrease in DCO
the setting of Volume Guarantee, an increase in frequency will increase DCO
unless ΔP is increased simultaneously; however, in
2
, as
2
the set tidal volume will be maintained as long as the oscillatory pressure amplitude
required to achieve that tidal volume is achieved.
It is important to recognise that DCO
is an absolute value dependent on the
2
tidal volume. As tidal volume requirements increase with increasing size of the
patient, DCO
calculated relative to the square of an infant’s body weight (i.e. f * V
reliable variable to predict the absolute DCO
will similarly increase, but in an exponential fashion. However, DCO2
2
required for any given patient (see
2
2
/kg2) is a more
T
section 9).
6 Understanding transmission of pressure
amplitude
6.1 Pressure damping
A key purported advantage of HFOV is the achievement of adequate gas exchange
with small tidal volumes and low intrapulmonary pressure amplitudes. During HFOV,
the amplitude of the pressure waveform is damped progressively from the airway opening to the alveoli (Figure 6-1). In contrast, the full inspiratory pressure is
transmitted from the airway opening to the alveoli during conventional ventilation
(provided a sufficiently long inspiratory time is allowed).
For many years, clinicians assumed that the intrathoracic damping of pressure
amplitudes in HFOV occurred regardless of the patient’s condition, and that the
babies were therefore protected from barotrauma. However, systematic reviews of
HFOV versus conventional rate ventilation show increased pulmonary air leak for
infants (13). Although at first this result seems surprising, an understanding of how
mechanical factors influence the extent to which the pressure waveform is damped
will help the clinician to use HFOV without causing barotrauma.
Whereas tidal volumes are inevitably lower during HFOV than conventional
ventilation, research has shown that these low tidal volumes are not always
associated with similarly low oscillatory pressure amplitudes.
6.2 Pressure amplitude transmission and respiratory mechanics
Damping of the oscillatory pressure amplitude as it traverses the airways to the
alveoli is determined by the impedance to flow of the intubated respirator y system.
THE COEFFICIENT OF GAS TRANSPORT
S i
■ DCO2 is the critical determinant of the effciency of gas mixing.
■ The removal of carbon dioxide in HFOV is approximately f * V
■ DCO
■ CO
is an absolute value and depends on the tidal volume.
2
removal is most efficiently achieved by increasing the tidal volume.
2
IMPEDANCE
Impedance is a general mechanical term that describes the mechanical
2
.
T
barrier to flow. Impedance incorporates the volume dependent (elastic),
flow-dependent (resistive) and acceleration dependent (inertive) properties
of the respiratory system. In the clinical setting, elastance (E) is more commonly
understood as compliance (C) of the lung where C = 1/E.
Page 11

20 I I 21
6 undersTandIng TransmIssIon oF Pressure amPlITude I
Pressure amPlITude and resPIraTory meCHanICs
6.2.1 Lung compliance
Clinical understanding regarding marked damping of the oscillatory pressure
waveform (illustrated in Figure 6-1A) arose out of studies in healthy compliant lung
models. However, HFOV was developed and applied initially for the extremely
non-compliant and immature lung of the preterm infant with respiratory distress
syndrome (RDS). Low compliance increases impedance to flow. Consequently,
in the presence of low compliance (Figure 6-1B), higher pressure amplitudes are
required to generate the same tidal volume and achieve effective gas exchange.
Clinically, the importance of compliance to damping of the oscillatory pressure
waveform was demonstrated clearly in animal models. Studies using alveolar
capsules to measure alveolar oscillatory pressure swings in preterm lambs during
lung volume recruitment showed the proportionally higher transmission of oscillatory
pressure amplitude from the airway opening to the alveolus when compliance was
4
low (14). Similarly, the oscillatory pressure ratio
is lowest at the point of maximal
compliance during the inflation and deflation limbs of a pressure volume recruitment
manoeuvre (29).
LOW LUNG COMPLIANCE AND HFO
S
If HFO is applied to immature, low-compliant lungs:
■ higher ventilator pressure amplitudes (compared to more compliant
lungs) are required to generate the same tidal volume.
■ the inspiratory and expiratory lung time constants are shorter with lower
compliance.
■ the percentage transmission of pressure amplitude from the airway
opening to the alveoli is higher compared to normally compliant lungs.
4
ratio of oscillatory pressure amplitude at the distal end of the tracheal tube to amplitude at the
airway opening
Airway Opening
25
O)
2
A
(cmH
ao
Compliant Non-compliant
5
P
35
O)
2
B
(cmH
ao
5
P
0.2 0.6 0.4 0.8 1.0
High Frequency Ventilation
Conventional Ventilation
Figure 6-1: Pressure damping during HFOV. At physiological breathing rates (black line), there is
sufficient time for the pressure waveform to be completely transmit ted from the air way opening
(patient wye) to the alveoli. In contrast, during HFOV (blue line), the very shor t inspiratory times are
insufficient to fully transmit the complete pressure waveform. Instead, there is progressive damping
of the pressure waveform as it travels from the airway opening to the alveolar compartment
(Figure 6-1A). In the presence of low-compliance (Figure 6 -1B), the inspiratory and expirator y time
constants are shor ter and higher peak inspiratory pressures (or ΔP) needs to be delivered to the
airway opening to achieve the same tidal volume as is achieved in the compliant healthy lung using
physiological breathing rates. For HFOV, not only are higher delta pressures required at the airway
opening, but the extent of pressure damping is reduced. Consequently, in the poorly compliant lung,
there is a higher percentage transmission of pressure from the airway opening to the alveolus.
25
35
Large Airways
5
5
0.2 0.6 0.4 0.8 1.0
Time (s)
25
5
35
5
Alveoli
0.2 0.6 0.4 0.8 1.0
D-8064-2016
6.2.2 Resistance
Peripheral Resistance
Increased peripheral resistance, associated with interstitial emphysema or
collapsed peripheral airways also increases impedance to flow at the point of
obstruction and beyond. Increasing peripheral resistance reduces the cyclic
volume change in the alveolus accompanied by reduced alveolar oscillatory pressure
amplitude. Consequently, higher ventilator oscillatory pressures are required to
restore tidal volume to the same level as obtained prior to development of the
increased peripheral resistance (14). The ventilation that is achieved however, is
delivered at the cost of increased proportional transmission of oscillator y pressure
amplitudes to the airways proximal to the site of increased peripheral resistance (14).
Consequently, the use of HFOV in the patient with increased peripheral resistance
presents a risk of barotrauma to the proximal airways.
Page 12

22 I I 23
6 undersTandIng TransmIssIon oF Pressure amPlITude I
Pressure amPlITude and resPIraTory meCHanICs
Tracheal Tube and Large Airway Resistance
Resistance in the tracheal tube and the large airways is flow dependent, due to the
turbulent nature of high flow through a tube of narrow diameter at high-frequencies.
Consequently, as flow increases, the resistive contribution of the tracheal tube and
large airways to overall respiratory system impedance also increases, necessitating
increased pressure amplitudes to maintain flow delivery (and tidal volumes) (14).
RESISTANCE OF TRACHEAL TUBE
Flow dependent resistance in the tracheal tube and large airways is
calculated as:
= k1 + k2V
R
TT
where R
V. is the oscillatory flow.
.
is the resistance of the tracheal tube, k1 and k2 are constants and
TT
HIGH PERIPHERAL RESISTANCE AND HFO
If HFOV is applied to lungs with high peripheral resistance:
■ higher pressure amplitudes (compared to lower resistive lungs)
are required to generate the same tidal volume.
■ the risk of barotrauma to proximal airways might be higher.
■ the tidal volume is lower compared to normal resistive lungs.
i
S
6.2.3 Inertance
Complex (eg square wave) oscillatory pressure waveforms have higher inertive
content than sinusoidal waveforms with more abrupt acceleration and
decelerations in flow. Whether square waves are more beneficial or more harmful to
the infant than sinusoidal oscillatory pressure waveforms remains unclear. The more
abrupt changes in flow of square waveforms may enhance gas mixing efficiency,
but also may exert more injurious shear effects on the air way wall and compromise
airway wall stiffness. However, the complex waveform becomes more sinusoidal in
morphology as it transverses the air ways, hence most of the effect of different
waveform morphologies (square versus sinusoidal) are likely to be effected in
the large airways with minimal beneficial or adverse impacts on the distal lung
parenchyma. Iner tance per se does not impact the transmission of the oscillatory
pressure amplitude from the airway opening to the alveolar compartment (14).
INERTANCE
If a certain mass needs to be accelerated, a force is required to overcome
the inertia. In mechanical ventilation, inertance is the pressure difference
required to change flow (i.e. acceleration/ deceleration). Inertance has a
negligible contribution to total impedance during tidal breathing at normal
breathing frequencies, but contributes more substantially to the overall
impedance during high-frequency ventilation. Inertance primarily arises from
gas flow in the tracheal tube and major airways.
i
Page 13

24 I I 25
CONVECTION & DIFFUSIONCONVECTIONDIFFUSION
6 undersTandIng TransmIssIon oF Pressure amPlITude I
Pressure amPlITude and resPIraTory meCHanICs
6.3 Pressure damping and frequency
Proximal alveolar
units are exposed
to central airway
oscillatory pressures
Oscillatory pressure applied at
airway opening is damped by flow-
dependent resistance and inertance
of tracheal tube and central airways
As frequency increases, the propor tion of the pressure waveform transmitted to the
lung periphery decreases. What is not often appreciated by clinicians, is that whilst
lowering frequency often results in a lower oscillatory pressure amplitude on the
ventilator display the distal lung is exposed to at least the same pressure and likely
higher oscillatory amplitudes (Figure 6-3): this effect occurs due not only to the
higher proportional transmission of that oscillatory pressure to the lung periphery
Expanded &
aerated alveoli
protected from
high oscillatory
pressures
Atelectatic
compartments
exposed to increased
oscillatory pressures
Figure 6-2: Factors influencing damping of the oscillatory pressure waveform amplitude.
The extent to which the oscillator y pressure waveform is damped is influenced by the mechanical
characteristics of the respiratory system. Atelectatic alveoli experience higher oscillatory pressure
amplitudes than normally aerated alveoli, for the same unit change in cyclic volume. Increased
peripheral resistance increases the oscillatory pressure transmitted to proximal airways and
neighbouring alveolar units. Adapted from (3).
High peripheral resistance increases
pressure transmission to more
proximal airways and nearby alveoli
Alveoli distal to a zone of
increased peripheral
resistance see low pressures
due to decreased flow
6.2.4 Inhomogeneous lung disease
High frequency oscillatory ventilation has cemented its place in the recruitment and
ventilation of the homogeneously collapsed or atelectatic lung. However, the value
at low frequency. Higher volumes are required to maintain the same efficacy of CO
removal (ie DCO
35
6 Hz
O)
2
5
35
D-8073-2 016
Pressure (cmH
12 Hz
5
Figure 6-3: Effect of oscillatory frequency on transmission of oscillatory pressure. The proportion
of the oscillatory pressure amplitude at the air way opening transmitted to the alveolus is higher at
low frequency (eg top panel) than at higher frequencies (eg lower panel). Importantly, although the
absolute oscillatory pressure displayed by the ventilator may be lower at the airway opening than that
required for high frequencies, the absolute alveolar oscillatory pressure amplitude may actually be
higher at lower frequencies, as a higher tidal volume is required to achieve equivalent CO
(ie to maintain DCO
).
2
Airway Opening
0.2 0.6 0.4 0.8 1.0
).
2
Large Airways
35
5
35
5
0.2 0.6 0.4 0.8 1.0
Time (s)
Alveoli
35
5
35
5
0.2 0.6 0.4 0.8 1.0
exchange
2
2
D-8081-2016
of HFOV in the inhomogeneous lung is less certain.
As suggested by Figure 6-2, co-existence of high and low compliance alveolar
compartments and areas of increased peripheral resistance may co-exist within the
same lung. Areas with longer time constants will have reduced oscillatory pressure
transmission whilst higher oscillatory pressures are transmitted to the short-time
constant (eg low compliance) segments. Although increased oscillatory pressure
transmission to low compliant lung zones increases risk of barotrauma in those
areas, the increased oscillatory pressures may also promote recruitment of alveolar
volume if the peak oscillatory pressures exceed the opening pressure of that lung
region.
6.4 Corner frequency and pressure cost of oscillatory flow
Impedance decreases rapidly with increasing frequency, reaching a minimum at
the resonance frequency (ƒ
damping
of the oscillatory pressure is achieved above the corner frequency (ƒC).
). However, in the neonatal lung, minimal additional
0
Consequently, targeting oscillatory frequency to the corner frequency of the lung
potentially achieves the minimum pressure cost per unit of oscillatory flow (15).
In more simple terms, using frequencies above the corner frequency may achieve
small additional falls in the oscillatory pressure amplitude delivered to the alveolar
compartment. However, this additional reduction in oscillatory pressure amplitude
Page 14

26 I I 27
50
6 undersTandIng TransmIssIon oF Pressure amPlITude I
Pressure amPlITude and resPIraTory meCHanICs
is achieved at the expense of higher oscillatory pressure amplitude to the more
proximal components of the respiratory system, such as the large airways.
RESONANCE FREQUENCY
i
The resonance frequency of a system is the frequency at which the response
amplitude to a defined input is a relative maximum compared to the response
at other frequencies. At resonance frequencies, small periodic driving forces
may produce large amplitude oscillations due to storage of vibrational energy.
Resonance frequency is calculated as ƒ
=1(2π√——IC) where ƒ0 is the resonance
0
frequency, C is the compliance and I is the inertance.
DAMPING
i
Damping refers to the reduction, restriction or prevention of oscillations
within or upon that system. Damping in physical systems is a result of a
process that dissipates the energy stored within the oscillation.
In an overdamped system the system returns (exponentially decays) to
equilibrium without oscillating.
CORNER FREQUENCY
i
Corner frequency represents the point (boundary) within the frequency
response of any system, at which the energy flowing through the system
starts to be reduced rather than passing completely through. Corner
frequency is related to the compliance and resistance (R) of the system,
expressed as: ƒ
below the resonance frequency (ƒ
=1/(2πRC). In the overdamped neonatal lung, ƒC is usually
C
).
0
A graphical representation of the relation between corner frequency and the
time constant of the lung is shown below. As time constant increases, the corner
frequency decreases.
Corner Frequency
Figure 6 -4: Effect of time constant on the corner frequency of the lung. The time constant (τ)
is the product of resistance and compliance (τ = R x C). As the time constant shortens, the corner
frequency of the respiratory system increases. A 600g preterm infant with a compliance of 0.1 mL/
O (severe HMD) and a resistance of 100 cmH2O/L/s has a time constant of 10 ms and a corner
cmH
2
frequency of 15.9 Hz.
(Hz)
40
30
20
10
0
01020304050
Time Constant (ms)
D-8059-2016
6.4.1 Corner frequency in different clinical settings
Understanding the concept of corner frequency helps in the selection of frequency
for different disease conditions. As time constant decreases, the corner frequency
increases. Consequently, infants with RDS and non-compliant (short time-constant)
atelectatic lungs have a higher corner frequency than infants with healthy, normally
compliant lungs with relatively longer time constants. In contrast, infants with high
airway resistance (long time-constant) will have an even lower corner frequency than
the infant with healthy lungs.
The most important pressure for determining the potential for barotrauma during
HFOV is the peak carinal pressure. Figure 6-5 illustrates the normal fall in peak carinal
pressure with increasing frequency at a constant distending pressure of 10 cmH
O
2
for a normal newborn infant. The figure clearly shows the shift of the corner
frequency to the right for the infant with low compliance, highlighting the benefits of
higher frequency selection in the infant with acute atelectatic disease. Similarly, as
the atelectatic lung is recruited and compliance normalises, then the optimum
ventilation frequency shifts to the left and lower frequency selection is appropriate.
Page 15

28 I I 29
6 undersTandIng TransmIssIon oF Pressure amPlITude I
THe ConCePT oF Corner FrequenCy
In contrast, there are penalties for incorrect frequency selection in the presence of
increased airway resistance, with a more narrow frequency range across which peak
carinal pressures are minimised. High airway resistance in the newborn most
Peak Carinal
Pressure
RawC
commonly occurs in the setting of pulmonary interstitial emphysema or acute
meconium aspiration syndrome. Figure 6-5 also shows that similar penalties are
evident for the patient who has high resistance as well as low compliance, such as
might occur with heterogeneous chronic lung disease, or evolving meconium
aspiration when chemical pneumonitis reduces alveolar volume and stiffens the lung
parenchyma. High resistance combined with low compliance shifts the corner
R
aw
healthy
C
frequency to the right (ie to higher frequencies). What is evident, however, is that for
both high resistance settings, the peak carinal pressure is relatively high compared
to normal and low compliance lung.
THE CONCEPT OF CORNER FREQUENCY
S
Figure 6 -5: Effect of mechanical properties on the peak pressures transmitted to the carina.
Adapted from (15). Corner frequency is shown by the dashed lines, representing the point at which
most gain in minimising carinal peak pressures are achieved. Low compliance (C) shifts the optimal
frequency to the right, whereas lower frequencies are more optimal for settings in which airway
resistance (R
aw
0
0102030
) is increased.
Frequency (Hz)
D-8080-2016
High Frequency Oscillatory Ventilation undertaken at a frequency around the
corner frequency will minimize pressure costs per unit of oscillatory flow.
As the time constant of the lung increases, the corner frequency decreases
and vice versa.
7 Understanding tidal volume delivery during HFOV
The used frequency should be adjusted according to the underlying
mechanical properties of the airways and the lung:
■ Lower frequencies in high resistance and/or high compliant lungs.
■ Higher frequencies in low compliant lungs with normal resistance.
High-frequency oscillatory ventilation is widely understood to achieve effective
ventilation using tidal volumes of less-than or equal to anatomical dead space (ie 2-3
mL/kg). However, as many oscillators used in the clinical setting did not measure or
report delivered tidal volume, many HFOV users have an incomplete understanding
of how tidal volume changes with changes in ventilatory settings and/or respiratory
mechanics. The principles of volume delivery during HFOV are the same as in
pressure-controlled/limited ventilation at more conventional physiological rates.
Understanding the determinants of tidal volume helps us to understand how
tidal volume in high-frequency ventilation changes with different ventilator settings.
Taking the inspired tidal volume as an example, the inspiratory tidal volume waveform
—TI/RC
resulting from V=(CΔP)(1 — e
) shown in Figure 7-1: the plateau of this waveform
is defined by the product of the compliance and the pressure amplitude; how quickly
the maximum tidal volume is delivered is a function of the respiratory time constant
(RC); the absolute volume delivered is determined by the elapsed inspiratory time
), relative to the time constant.
(t
I
Page 16

30 I I 31
7 undersTandIng TIdal volume delIvery durIng HFov I
lung volume and mean aIrway Pressure
7.1.1 Oscillatory amplitude
During conventional ventilation, ΔP is the difference between the peak
CALCULATION OF TIDAL VOLUME
i
inspiratory pressure and the positive end expiratory pressure, with each parameter
being set independently. During HFOV, oscillatory amplitude (ΔP) is set directly at the
Delivery of tidal volume follows the general formula of:
—TI/RC
V=(CΔP)(1 — e
) Equation where VT is tidal volume, C is compliance,
ΔP is ΔP (PIP-PEEP) and R is resistance. The product of R x C is the time
constant (τ).
ventilator. As oscillatory amplitude increases, the maximum achievable tidal volume
will also increase (see Figure 7-2).
Volume (mL/kg)
4
3
2
Tidal Volume
(mL)
10
Plateau
Slope
5
0
0 100 200 300 400 500
Inspiratory
Time (ms)
D-8060-2016
Figure 7-1: Waveform for inspired tidal volume pressure controlled conventional ventilation.
The plateau (ie ma ximum tidal volume) delivered is determined by the product of compliance and
ΔP (peak inspiratory pressure – positive end expiratory pressure). The rate at which the plateau
tidal volume is achieved is determined by the time constant (τ = RC). How much tidal volume is
actually delivered for any given combination of ventilatory pressure settings and respiratory
mechanics is determined by the elapsed time (t).
7.1 Determinants of tidal volume
With this background understanding, it is possible to understand how changing
HFOV settings such as amplitude, frequency and I:E ratio alter the delivery of tidal
volume to the lung. We can also understand why tidal volume delivery varies as the
mechanical properties of the lung change.
1
0
010203040
Amplitude
(cmH
2
O)
Figure 7-2: Effect of oscillatory amplitude on delivered tidal volume. For any given lung
compliance, as amplitude increases, the delivered tidal volume also increases. Figure shows
tidal volume/kg for a compliance of 0.1 mL/ cmH
inspirator y time of 33 ms (f=10 Hz, I:E 1:2) in a 1 kg infant .
O, and resistance of 100 cmH2O/L/s, and an
2
15 Hz10Hz7
Hz5 Hz
Tidal Volume
(mL)
6
4
2
0
020406080 100
Inspiratory
Time (ms)
Figure 7-3: Decrease in absolute inspiratory time with increasing frequency.
Graph shows inspiratory times with an I:E ratio of 1:2 (ie 33 % inspiratory time).
D-8079-2016
D-8058-2016
Page 17

32 I I 33
15 Hz
5 Hz
7 undersTandIng TIdal volume delIvery durIng HFov I
lung volume and mean aIrway Pressure
7.1.2 Frequency
As frequency increases, the absolute oscillatory time for each volume delivery
cycle decreases. If the inspiratory to expirator y ratio does not change, the absolute
inspiratory time will decrease with increasing frequency. Because there is less time
available, the tidal volume delivered will decrease with increasing frequency if all
other ventilator settings and lung mechanical properties remain the same (see Figure
7-3).
7.1.3 I:E ratio
As I:E ratio increases from 1:2 to 1:1, the absolute inspiratory time also increases,
allowing more time for volume to be delivered to the lung (see Figure 7-4). The effect
that I:E ratio has on the absolute tidal volume delivered also depends on frequency
and lung mechanics. As the steepest part of the change in tidal volume occurs early
in the inspiratory phase, there is a larger percentage increase in tidal volume when I:E
ratio is change from 1:2 to 1:1 at high frequencies than at low frequencies. Similarly,
because the absolute time to reach maximum tidal volume increases as time
constant of the lung increases, there is a larger percentage increase in tidal volume
with an I:E ratio change from 1:2 to 1:1, as the time constant of the lung increases.
Tidal Volume
(mL)
1:2 1:1
6
1:2 1:1
7.1.4 Lung mechanics
As the inspiratory time during ventilation at conventional physiological rates usually
exceeds 5 time constants, there is sufficient time for tidal volumes in the order of 4-6
mL/kg to be delivered to the lung.
However, during HFOV, the inspiratory times are much shorter than those used
during conventional ventilation, and usually the inspiratory times during HFOV are
well below the time taken for 3 to 5 time constants of the lung to elapse. Furthermore,
the absolute inspiratory time usually changes with change in oscillatory frequency
because the clinician sets the percent inspiratory time or defines an inspiratory/
expiratory time ratio, rather than setting an absolute inspiratory time. Cycle length
decreases as frequency increases: consequently, providing I:E is held constant, the
absolute inspiratory time becomes shorter as frequency increases.
Figure 7-5 illustrates how limiting inspiratory time in HFOV results in the delivery of
much smaller tidal volumes during HFOV than during conventional ventilation. Figure
7-5 also shows how the mechanical properties of the respiratory system markedly
influence the tidal volume delivered during HFOV. The lung with very short time
constant (ie low compliance), achieves the maximum tidal volume rapidly whereas
the healthy and high resistance lungs may not reach their maximum potential tidal
volumes before the inspiratory phase of the HFOV waveform is terminated.
Tidal Volume
(mL/kg)
4
healthy
4
2
0
020406080 100
Figure 7-4: Change in absolute inspiratory time and delivered volume as I:E ratio changes.
Graph illustrates changes at 5 Hz and 15 Hz frequencies.
Inspiratory
Time (ms)
2
0
D-8057-2016
Figure 7-5: Effect of lung mechanics on inspiratory tidal volume during HFOV. Three lines are
shown, representative of infants with healthy compliant (1.0 mL/cmH
compliance (0.1 mL/cmH
compliance (0.6 mL/cmH
020406080 100
O) lungs (green line), or high resistance (250 cmH2O/L/s), reduced
2
O) lungs (eg BPD: orange line).
2
C R
C
Time (ms)
O) lungs (blue line), very low
2
D-8056-2016
Page 18

34 I I 35
8 dIsTendIng lung volume and mean aIrway Pressure I
lung volume and mean aIrway Pressure
8.1 Determinants of distending lung volume during HFOV
Distending lung volume is changed by altering the mean intrapulmonary pressure –
HFO VENTILATOR PARAMETERS AND TIDAL VOLUME
S
ie the distending pressure within the lungs (P
pressure is not easily measured, it is the mean airway opening pressure (P
). However, as the intrapulmonary
L
) (the
ao
pressure measured at the air way opening or “patient wye”) that is used by the
CO2 removal is mainly dependent on tidal volume and frequency (see chapter
5.5). The tidal volume is usually smaller or equal than anatomical dead space
(i.e. 2-3 ml/kg).
clinician as a guide to the pressure in the lung. Understanding the determinants of
both of these pressures is essential to understanding how to optimise lung volume
under different clinical settings.
Tidal volume is adjusted by changing the following control parameters:
■ Amplitude
• Higher amplitude leads to higher tidal volume.
■ Frequency
• Tidal volume delivered will decrease with increasing frequency (with-
out Volume Guarantee).
• Tidal volume is increased by decreasing the frequency (only if Volume
Guarantee is not activated), at a cost of increased transmission
(reduced damping) of the oscillatory pressure amplitude.
■ Percent inspiratory time
• Decreased percent inspiratory time (I:E = 1:2 or 1:3) will reduce tidal
volume as less time is available to deliver flow.
Tidal volume increases with a higher percent inspiratory time (I:E = 1:1).
•
■ I:E ratio
• Tidal volume increases when changing from I:E ratio of 1:2 to 1:1 or 1:3
to 1:2.
8 Distending lung volume and mean airway pressure
Maintaining a well-recruited lung during HFOV that is neither overdistended or
underinflated is essential to minimising injury to the lung and optimising arterial
oxygenation. Lung recruitment is achieved primarily through the adjustment of mean
airway pressure. Understanding the determinants of distending lung volume and
how to achieve optimal distending lung volume during HFOV is essential to maximise
the benefits and minimise harm when using this ventilatory modality.
8.1.1 Control of mean airway pressure
Mean airway pressure during HFOV is usually adjusted directly by the clinician using
a ventilator control. The ventilator achieves these increases or decreases in mean
airway pressure settings by adjusting either the bias flow and/or the resistance to
flow in the expiratory valve.
8.1.2 Determinants of mean intrapulmonary pressure
During conventional ventilation, the mean airway pressure at the airway opening
is usually very similar to the mean intrapulmonary pressure (the pressure actually
distending the lung). However, during HFOV, mean pressures in the lung may be
either higher or lower than the mean pressure set or shown on the ventilator from
recorded at the airway opening.
A mean intrapulmonary pressure higher than the mean airway opening pressure is
usually a result of applying insufficient mean airway pressure and development of
gas trapping. Increasing the mean airway pressure to splint the airways open will
prevent the air from becoming trapped in the lung periphery.
More commonly, mean intrapulmonary pressure is lower than the pressure measured
at the airway opening and displayed by the ventilator. As shown in Figure 8-1, this
pressure loss (shown by a negative value for P
– Pao) is only present when an I:E
L
ratio of 1:2 (or 1:3) is used and does not occur at an I:E ratio of 1:1. Furthermore,
for the same tidal volume or pressure amplitude, the pressure drop from air way
opening to th e alveolar compar tment in the lung in creases with i ncreasing frequ ency or
decreasing tracheal tube size. This dependence of pressure drop on the I:E ratio is
important to remember when changing from conventional ventilation to high-frequency
oscillatory ventilation: the mean pressure set on the ventilator needs to be set higher
when using a 1:2 ratio compared to 1:1 ratio to achieve the same mean intrapulmonary
pressure.
Page 19

36 I I 37
09
8 dIsTendIng lung volume and mean aIrway Pressure I
lung volume and mean aIrway Pressure
I:E ratioDifferent Frequencies Different ET Tube Size
O)
2
0
-2
-4
-6
090
Ventilator Amplitude(cmH2O)
Mean intrapulmonary pressure (cmH
1:2
0
1:1
-2
-4
15Hz10Hz5
-6
090
Ventilator Amplitude(cmH2O)
Hz
0
-2
-4
-6
2.5 mm
Ventilator Amplitude(cmH2O)
3.5 mm
3.0 mm
MEAN INTRAPULMONARY PRESSURE AND I:E RATIO
S
■ The mean intrapulmonary pressure is the effective pressure distending
the lungs. It cannot be measured directly.
■ The mean intrapulmonary pressure is closest to the set mean airway
0
D-8062-2016
pressure at an I:E ratio of 1:1.
■ At I:E ratios of 1:2 or 1:3, the mean intrapulmonary pressure will be lower
than the set mean airway pressure.
Figure 8 -1: Effect of I:E ratio, frequency and tracheal tube size on fall in mean intrapulmonary
pressure. Left panel: There is minimal difference in mean pressure between the airway and the
alveolar compartment when I:E of 1:1 are used. However, at I :E of 1:2, there is a progressive fall in
mean air way pressure as ventilator amplitude increases. Middle and right panel: At I:E of 1:2, the fall
in pressure from airway opening to alveolar compartment becomes steeper as frequency increases,
or as tracheal tube internal diameter decreases.
8.2 Achieving optimal lung volume
8.2.1 Approaches to recruiting and optimising lung volume during HFOV
There are several different methods for recruiting lung volume during HFOV. Most
commonly, a stepwise incremental and then decremental change in mean airway
RESISTIVE PRESSURE DROP
i
pressure is used as this approach is the most effective in fully recruiting the lung and
finding the optimal distending pressure on initiation of HFOV in the atelectatic lung.
Resistive pressure drop during HFOV follows the general form of:
P
Where P
res
= k1V
.
2
+ k2(V. )
is the resistive pressure drop, k1 and k2 are constants and V
res
is the flow in the tracheal tube. At I:E of 1:1, the inspiratory and expiratory
are approximately equal, and no net pressure drop results across the
P
res
cycle. At I:E of 1:2, the inspiratory flow is higher than the expiratory flow,
resulting in a greater pressure drop during inspiration than expiration.
Mathematically, the magnitude of the pressure drop is proportional to the
difference between the squared mean inspiratory and squared mean
expiratory velocities (12).
.
An example of how the stepwise approach is used to recruit the lung of an infant
with atelectatic lung due to respiratory distress syndrome is outlined in Figure 8-2.
8.2.2 Avoiding volutrauma during lung volume recruitment
As the lung is recruited, the compliance of the lung will change: initially, the
compliance increases as the lung volume increases on the steep part of the
inflation limb (step 2 in Figure 8-2). As the opening pressure is achieved and the lung
starts to become overdistended (step 3 in Figure 8 -2), the compliance falls (step 3
in Figure 8 -2). Then, as the pressure is reduced, the compliance will again increase,
before falling again as the closing pressure is reached (step 4 in Figure 8-2).
Page 20

38 I
Tidal Volume (mL)
82
8 dIsTendIng lung volume and mean aIrway Pressure I
lung volume and mean aIrway Pressure
I 39
Set mean airway pressure (MAP) at
6-8 cmH
SpO
O and adjust FiO2 to give an
2
90-95%.
2
1
Increase MAP by 1-2 cmH2O every 2-3 min.
Reduce FiO
SpO
2
stepwise by 0.05-0.10 to maintain
2
90-95%.
2
Stop increasing MAP when FiO2 is smaller than
0,25 or when FiO
with an increase in MAP.
is not able to be decreased
2
3
Decrease MAP by 1-2 cmH2O every 2-3 min
until SpO
falls.
2
4
Recruit the lung again by returning to the
known CDP
decrease MAP to 2 cmH
closing pressue (CDP
(step 3) for 2-3 min then
O
O above the
2
) from step 4.
C
5
5-10 min after surfactant, reduce MAP by
1-2 cmH
O every 5 min until SpO2 falls.
2
6
Increase M AP by 1-2 cmH2O every 5 min
until SpO
of step 5.
returns to previous value at end
2
7
Pre-surfactant opening continious
distanding pressure (CDP
)
O
Pre-surfactant closing pressure
)
(CDP
C
Pre-surfactant optimal pressure
)
(CDP
OPT
Obtain chest X-ray & give
surfactant
Post-surfactant closing pressure
)
(CDP
C
Post-surfactant opening pressure
)
(CDP
O
These changes in compliance have important consequences for tidal volume.
Figure 8-3 shows that the tidal volume will change markedly during recruitment If
Volume Guarantee is not being used, and the oscillatory amplitude remains the
same throughout the recruitment procedure. Fluctuating tidal volumes may result in
similar marked fluctuations in arterial partial pressure of carbon dioxide, and consequent unwanted fluctuations in cerebral blood flow. It is therefore very important to
monitor carbon dioxide, tidal volume and the DCO
continuously during a recruitment
2
procedure and to continuously adjust the oscillatory amplitude to avoid potentially
adverse consequences of abrupt changes in cerebral blood flow or turn on Volume
Guarantee.
9
8
7
6
5
4
8101214161820
Mean Airway Pressure (cmH2O) Mean Airway Pressure (cmH2O)
Figure 8 -3: Change in tidal volume and PaCO2 during lung recruitment. This figure illustrates
changes observed if amplitude is held constant as mean pressure is first incremented (solid line/
filled circles), then decremented (broken lines, open circles) during a volume recruitment manoeuvre.
Adapted from (17).
7
6
(kPa)
2
5
PaCO
4
8101214161
D-8065-2016
0
Figure 8-2: Algorithm for recruitment of the atelectatic lung during HFOV. Adapted from (16).
Set MAP at 2 cmH2O above post-surfactant
closing pressure (CDP
) identified in step 6.
C
Post-surfactant optimal continious
distending pressure (CDP
8
OPT
8.2.3 Maintaining optimal lung volume in HFOV
)
Once the lung is optimally recruited, it remains important to maintain the lung at this
optimal volume to minimise the risk of ongoing iatrogenic lung injury. The optimal
distending pressure will decrease as lung disease improves: consequently, mean
airway pressure is reduced gradually until the patient is able to maintain gas
exchange with mean airway pressure at approximately the same level as pressure
used for continuous positive airway pressure (CPAP).
Page 21

40 I
TLC
8 dIsTendIng lung volume and mean aIrway Pressure I
lung volume and mean aIrway Pressure
I 41
8.2.4 Avoiding atelectasis
Atelectatrauma is a consequence of ventilating the collapsed (atelectatic) lung.
Atelectasis during HFOV may follow aspiration of secretions, overly enthusiastic
weaning of mean airway pressure or consequent to prolonged HFOV with low
tidal volumes in the absence of spontaneous breathing effort. Careful attention to
maintaining appropriate humidification may reduce the risk of developing thick
tenacious secretions that block small airways and promote collapse. Attention to
prompt re-recruitment of the lung after suction is important to avoid unintended
adverse lung collapse. Infrequent sigh breaths (approximately 1 per minute) with a
moderate peak inspiratory pressure may facilitate maintenance of lung volume
during prolonged HFOV with low tidal volumes.
8.3 Avoiding overdistension
Volutrauma during HFOV may result from both static overdistension as well as cyclic
overdistension of the lung. The peak alveolar distension is the volume reached at the
peak of inspiration and should not exceed 90% of the total lung capacity as shown
in Figure 8 -4 (15). As the lung is kept open at a level above functional residual
capacity at high mean airway pressures, the MAP needs to be reduced if lung
disease improves in order not to overdistend the more compliant lung.
Volutrauma
Lung Volume
FRC
Atelectatrauma
D-8066-2016
Figure 8-4: Difference in distending lung volume during HFO and conventional ventilation. The
lung is maintained closer to total lung capacity (TLC) than functional residual capacity (FRC) during
HFO compared to conventional ventilation.
9 Management of HFOV
9.1 Transition from conventional ventilation
Prior to commencing HFOV, it is important to consider the nature of the underlying
disease and to have a clear plan for ventilation strategy as different diseases benefit
from slightly different approaches to delivery of HFOV. The guidelines given below
are appropriate for recruitment of the homogeneously derecruited lung such as
occurs with RDS due to surfactant deficiency. Suggested approaches for other lung
diseases are provided in section 12.
9.1.1 Prepare the patient and the monitoring environment
Ensure that appropriate monitoring is available and ready to facilitate informed
adjustment and optimisation of HFOV ventilator settings after initiation of HFOV (see
section 10). It is useful to note the current ΔP (PIP-PEEP) and mean airway pressure
applied during conventional ventilation, as these variables guide initial selection of
HFOV ventilator settings. Airway secretions present a major impediment to achieving
adequate tidal volume during HFOV (much more so than during conventional
ventilation) and pose a risk for increased oscillatory pressure transmission to
proximal alveoli (see section 6.2.2). Consequently, it is advisable to also perform
tracheal suction prior to commencement of HFOV to avoid clinical deterioration on
commencement of HFOV.
9.1.2 Setting the mean airway pressure
Mean airway pressure is the primary determinant of distending lung volume, and also
influences pulmonary vascular resistance, and hence the flow of blood through the
pulmonary capillaries. Consequently, mean airway pressure is the primary determinant
of oxygen transfer from the alveolus to the pulmonary capillary. A strategy for
identification of optimal mean distending pressure for first intention HFOV treatment
in the setting of neonatal respiratory distress syndrome is shown in Figure 8-2. A similar
approach can also be applied in the initial recruitment of the atelectatic lung when
HFOV is used in the rescue setting. In the rescue setting, as useful guide for initial
mean airway pressure approximately the same (I:E of 1:1) or 2-3 cmH
of 1:2) than the mean airway pressure used during conventional ventilation.
9.1.3 Setting oscillatory pressure amplitude (pressure controlled HFOV)
If commencing HFOV at 10 Hz, a ΔP on the HFOV ventilator approximately 1.5 times
the ΔP (PIP-PEEP) used during conventional ventilation provides a reasonable
conservative starting oscillatory pressure amplitude during HFOV. Higher initial
O higher (I:E
2
Page 22

9 managemenT oF HFov I
lung volume and mean aIrway Pressure
I 4342 I
oscillatory pressure amplitudes need to be set on the ventilator at frequencies above
10 Hz, whereas lower amplitudes are required for frequencies below 10 Hz.
Immediately after commencing HFOV, adequacy of the oscillatory ΔP should be
reassessed by the delivered tidal volume: as the tidal volume required varies
according to frequency, the clinician is referred to the table below for approximate
“target” tidal volumes for specific frequencies. In the absence of tidal volume
monitoring in HFOV, visual confirmation of adequate chest wall vibration (“wiggle”)
is a useful alternative guide to adequacy of oscillatory amplitude. Regardless, close
monitoring of arterial CO
ensure amplitude is set such that changes in pCO
via transcutaneous measurement of pCO2 is essential to
2
are gradual: rapid fluxes in pCO2
2
may be accompanied by sudden and deleterious changes in cerebral blood flow.
INITIAL DCO2 FOR DIFFERENT PATIENT WEIGHTS
Weight (kg) 5 Hz 7 Hz 10 Hz 15 Hz
3.46 mL/kg 2.93 mL/kg 2.45 mL/kg 2.00 mL/kg
0,5 15 15 15 15
1 60 60 60 60
2 240 240 240 240
3 540 540 540 540
4 960 960 960 960
Table 1: Different combinations of frequency and tidal volume to reach same DCO2 for
permissive hypercapnoea.
9.1.4 Setting oscillatory tidal volume (volume targeted, pressure limited HFOV)
Commencement of volume targeted pressure limited HFOV (HFOV+VG) focuses
similarly on a controlled optimisation of pCO
. Rather than selecting a starting
2
oscillatory amplitude, the strategy is to set the volume target (Volume Guarantee)
appropriate to the selected frequency for oscillation.
A DCO
of 40-60 mL2/kg2/s will generally achieve PaCO2 in the mild permissive
2
hypercapnoeic range. Suggested tidal volumes to achieve mild permissive
hypercapnoea during volume targeted HFOV are provided in Table 1 and illustrated
in Figure 9-1. Importantly, larger tidal volumes are required at lower frequencies
to achieve the same DCO
and consequently rate of CO2 removal from the lung.
2
Therefore, the decision to use a low frequency needs to be offset against the
potential of increased risk of volutrauma to the alveolus because the higher tidal
volumes required have potential to “overdistend” the immature alveolus.
Oscillators delivering volume targeted HFOV usually do so in a pressure-limited
setting. For volume-targeted pressure-limited HFOV, setting the maximum oscillatory
pressure amplitude (ΔP
volume-target conventional ventilation. During HFOV, ΔP
the initial stabilisation period, to remain approximately 5 cmH
) is the equivalent of setting the maximum PIP during
max
should be adjusted after
max
O above the ΔP used
2
to deliver the targeted volume required at the selected frequency that achieves the
desired target PaCO
. The 5 cmH2O buffer in ΔP
2
provides the ventilator with
max
capacity to maintain ventilation in the event of brief, or sustained minor deterioration
in oscillatory tidal volumes. It is important to avoid setting the ΔP
5 cmH
O above the average ΔP, to avoid a significant deterioration in lung
2
more than
max
mechanics (and hence aeration of the lung) without notification to the clinician/
nurse that the clinical status of the patient may have changed.
Inadequate or excessive chest wall motion should result in prompt readjustment
of the ΔP to prevent hypocapnoea or hypercapnoea. If tidal volume monitoring is
in place, adequacy of delivered tidal volumes and DCO
should be considered.
2
In the event that HFOV is commenced in the setting of significant hypercapnoea,
oscillatory ΔP should be adjusted to achieve a gradual fall in transcutaneous pCO
of about 2-3 mmHg/min (0.3-0.4 kPa/min) to avoid very rapid changes in cerebral
blood volume that may result in intracerebral haemorrhage.
1000
DCO2
2
(mL
/s)
800
600
2
Figure 9 -1: Target range for frequency and DCO2 relative to frequency and patient weight.
Graph indicates estimated lower (orange) and upper (blue) targets for each variable.
400
200
0
012345
D-8067-2016
Weight (kg)
Tidal Volume
(mL/kg)
4
3
2
1
0
0 5.0 7.5 10.0 12.5
Frequency (Hz)
Page 23

lung volume and mean aIrway Pressure
I 4544 I 9 managemenT oF HFov I
9.2 Continuation of HFOV
Once HFOV is established, careful monitoring is required to maintain optimal patient
condition. In particular, attention to lung distension and oxygenation inform on the
need to adjust mean airway pressure; in contrast, fluctuations in transcutaneous
carbon dioxide levels, high frequency tidal volume or chest wall vibration and
perfusion may reflect more on the effectiveness of gas mixing and volume delivery.
New equilibriums in PaCO
with alterations in oscillatory amplitude are achieved
2
rapidly (within minutes) due to the highly efficient gas mixing that occurs during
HFOV. However, recruitment of lung volume resulting from changes in mean airway
pressure occur more slowly, and after the initial recruitment period, effects of
changes in mean airway pressure are best assessed after an interval of 15 minutes.
Careful and informed interpretation of monitored variables during HFOV will inform
required adjustments to HFOV parameters to appropriately manage the patient’s
condition.
9.2.1 Management of oxygenation
If oxygenation is satisfactory, the FiO
should be weaned to approximately 0.25 –
2
0.30 Vol.%. Subsequently, the mean airway pressure may be carefully, and gradually
reduced (1 – 2 cmH
O every 1 – 4 hours).
2
The cause of acute onset hypoxia will determine whether mean airway pressure
needs to be increased again (eg atelectasis) or decreased (eg overinflated lung).
When uncertain, it is often prudent to first decrease the mean airway pressure to
avoid inadvertent progression towards overdistension. Increases in mean airway
pressure, if necessary, may be achieved through a brief re-recruitment procedure, or
through intermittent, sustained inflations using slightly higher airway pressures (ie
increased pressure with minimal additional volume delivered to the lung). Avoidance
of high mean airway pressures that impair systemic blood pressure, significantly
increase central venous pressure and/or impede pulmonary blood flow is paramount.
If overinflation develops and persists despite appropriate decreases in mean airway
pressure, a decrease in the oscillatory frequency and use of 1:2 (or shorter) I:E
ratios may permit more effective egress of air during exhalation phase (25).
9.2.2 Management of carbon dioxide
Hypercapnoea may occur secondary to airway obstruction with secretions, or as a
result of changes in lung volume (either over- or under-distention). Airway obstruction
needs to be dealt with promptly as it markedly impedes effectiveness of HFOV, and
increases risk of injury due to excessive pressure transmission to proximal segments.
Deflation of the lung during suction will result in subsequent respiratory deterioration,
if post-suctioning recruitment measures are not used: effective post-suctioning
recruitment is often achieved with brief small increases in mean airway pressure (2-4
O ) or transient (5 min) increases in sigh frequency (max 2-5 breaths/min) or
cmH
2
application of 2-3 manual sustained inflations of 2-3 s each. The objective of any sigh
is to raise mean pressure enough to reopen any collapsed alveoli, rather than
delivery of significant tidal volumes. Consequently, the sigh may be best delivered
with a long inspiratory time (ie 0.5 – 2.0 s), and a peak pressure as little as 5 cmH
O
2
above mean pressure.
Hypercapnoea/hypocapnoea is ultimately best managed through maintenance of
the DCO
variable. Careful and constant monitoring of the delivered tidal volume
2
(where volume monitoring is available) and/or chest wall vibration is essential in the
absence of volume targeting as DCO
may change rapidly with any change in
2
condition of the lung (improvement or deterioration) resulting in either hypocapnoea
or hypercapnoea respectively.
Unless the nature of the lung condition changes, carbon dioxide elimination is
optimally managed through increases in DCO
have a dedicated DCO
are normally achieved through changes in tidal volume and frequency.
DCO
2
Altering DCO
via changes in tidal volume is usually the preferred option, unless the
2
dial that can be adjusted on the ventilator; rather changes in
2
. HFOV ventilators generally do not
2
nature of the lung disease changes. In the absence of volume targeting, tidal volume
(and hence DCO
) is altered by changing ΔPhf. In volume targeted HFOV, DCO2 is
2
controlled directly by changing tidal volume, provided the maximum pressure
amplitude remains at or above the oscillatory amplitude required to deliver that volume.
As indicated above, using frequency to change carbon dioxide elimination may have
unwanted effects. In the absence of volume targeting, decreasing frequency will
increase the tidal volume for any given oscillatory amplitude – but also increases the
iatrogenic cost of ventilation with increased pressure transmission to the distal
airways a source of potential barotrauma. It is important to remember that the
ventilator displayed oscillatory pressure amplitude is a poor and somewhat misleading
indicator of pressure changes happening distally. Lower ventilator amplitudes at
lower frequencies do not mean that the distal oscillatory pressure amplitudes within
the airways and alveolar compartments have decreased! (see section 6). In contrast, in
the presence of volume targeting, changing frequency has minimal, if any, effect on
tidal volume delivery within the limits of the power of any given device.
Consequently, a decrease in frequency in volume targeted HFOV will actually
decrease DCO
and PaCO2 will rise!
2
Page 24

lung volume and mean aIrway Pressure
I 4746 I 9 managemenT oF HFov I
9.3 Humidification
Adequate heating and humidification (90% relative humidity) of the inspiratory gas is
essential to avoid irreversible damage to the epithelial surfaces of the respiratory
tract. In the absence of sufficient humidification, viscous secretions develop that
obstruct the bronchi, promoting consolidation and collapse of the alveolar
compartment and impaired gas exchange. The resultant reduced compliance also
increases the risk of barotrauma as low compliance promotes increased transmission
of the oscillatory pressures to the lung periphery. In contrast, excessive humidification
promotes condensation in the patient circuit, the tracheal tube and the airways, and
compromises delivery of adequate tidal volumes.
9.4 Weaning from HFOV
As with any ventilatory modality, the goal of weaning during HFOV is to gradually
withdraw support and encourage spontaneous breathing. Although many clinicians
still wean from high-frequency back to conventional ventilation (possibly due to
relative availability of different ventilators), weaning from HFOV directly to a noninvasive mode of respiratory support is possible, and often the preferred mode.
Weaning from HFOV to spontaneous ventilation is an intuitive process. Mean airway
pressure is gradually reduced until levels consistent with the airway support
provided with non-invasive respiratory support is attained. Oscillatory amplitude is
gradually reduced until the patient assumes primary responsibility for CO
elimination
2
through gentle spontaneous breathing. Although a theoretical argument can be put
forward to decrease frequency as lung mechanics normalise and the corner
frequency decreases, alterations to frequency are generally not necessary during
the weaning phase in HFOV.
The time required for weaning will depend on the underlying pulmonary disease. In
acute illnesses such as respiratory distress syndrome and persistent pulmonary
hypertension of the newborn, weaning may be extremely rapid, lasting only hours.
More chronic diseases such as bronchopulmonary dysplasia may require weaning of
HFOV support over a period of days to weeks, and will vary from baby to baby
according to concomitant morbidities.
10 Monitoring during HFOV
Careful continuous monitoring is essential to clinical management of any patient on
mechanical respiratory support. Monitoring is especially important during HFOV as
the reliance of gas exchange on the square of the tidal volume exaggerates changes
in PaCO
circuit.
10.1 Monitoring of gas exchange and respiratory mechanics
Essential monitoring tools that should be in place prior to commencement of HFOV
include peripheral oxyhaemoglobin saturation (SpO
dioxide, and flow/tidal volume monitoring. Ideally, the tidal volume display should
include a field for tidal volume/kg. As CO
DCO
facilitate stability of PaCO
different stages of lung disease and/or mechanics.
Measurement of lung mechanics is more complex in HFOV than in conventional
ventilation due to the damping of the oscillatory pressure waveform from the airway
opening to the lung, and the dependence of this damping on both ventilatory
settings and mechanics of the intubated respiratory system. When using intermittent
conventional cycles as sigh breath, the tidal volume and the difference between PIP
and PEEP measured during the conventional inspiration can be used to calculate
dynamic compliance (C
Although it is tempting to apply a similar approach to assessment of compliance
during HFOV in the absence of such intermittent conventional breaths, frequency
dependent damping of the oscillatory pressure waveform makes this impossible to
apply or interpret in a meaningful manner across the frequency spectrum.
Indeed, at frequencies of 15 Hz, tidal volume is relatively independent of lung
compliance.
10.2 Monitoring of lung volume
With the importance of optimising lung volume being increasingly recognised as
paramount to safe and lung-protective application of HFOV, tools to assess lung
volume remain a focus of HFOV research. Periodic chest radiographs provide a
crude indication of lung expansion: lung volume is optimal when expanded to the 8
or 9th posterior rib assessed in the mid-clavicular line (depending on gestation
with any change in the mechanics of the respiratory system and ventilatory
2
), transcutaneous carbon
2
removal during HFOV is dependent on the
(frequency x V
2
2
), DCO2 monitoring is a useful adjunct monitoring variable to
T
if ventilation frequency is changed to accommodate
2
) provided an inspiratory pressure plateau is achieved5.
dyn
2
th
5
C
= V
⁄(PIPCV—PEEP)
dyn
T,CV
Page 25

48 I I 4910 monITorIng durIng HFov I
lung volume and mean aIrway Pressure
and the presence/absence of pulmonary hypoplasia). Respiratory inductance
plethysmography and electrical impedance tomography are proven in the research
setting as useful tools to monitor relative and temporal changes in lung volume
during initial volume recruitment procedures. Electrical impedance tomography is
also useful for the detection of pneumothorax. Lung ultrasound is used increasingly
in the setting of conventional ventilation to assess lung parenchymal pathology;
application to HFOV is likely in the near future.
MONITORING DURING HFOV
Ventilatory parameters
Frequency
ΔP and ΔP
(Volume Guarantee mode)
max
Mean airway pressure
and delivered VT (Volume Guarantee mode)
Set V
T
I:E ratio (or % inspiratory time)
2
)
T
and pCO
2
2
Gas exchange
Lung volume &
respiratory mechanics
(frequency x V
DCO
2
FiO
2
Blood gases
Transcutaneous pO
SpO
2
Chest X- ray
Respiratory inductance plethysmography
Electrical impedance tomography
Circulatory system &
systemic perfusion
Oscillatory pressure ratio (ΔP
(intermittent mandatory sigh breath)
C
dyn
trachea
Heart rate
Systemic arterial blood pressure
/ΔP
ventilator
)
Central venous pressure
Urine output
Table 2: Monitoring during HFOV.
10.3 Monitoring of circulatory system and systemic perfusion
The continuous application of moderately high distending pressures during HFOV
places additional burdens on the interaction of the circulatory and respiratory
systems. Additional beneficial monitoring in seriously ill infants on HFOV thus
includes regular or continuous central venous pressure and system blood pressure.
Increased central venous pressure may provide warning of cardiorespiratory
decompensation in the presence of very high mean airway pressures. Compromised
cardiac function may also be evident from prolonged capillary filling time and
reduced urine output. Intermittent functional echocardiography also provides
information about cardiac contractility, cardiac output and right-ventricular pressure:
this functional information may help clinicians identify early any adverse circulatory
effects of changes in mean airway pressure strategy. Near infra-red spectroscopy
(NIRS) recording of cerebral and peripheral tissue oxygen saturations may also
inform on systemic impact of changes in HFOV strategy.
11 Indications for HFOV
Oscillatory ventilation has been applied in the clinical setting since the early 1980s.
HFOV was used initially for rescue of infants failing conventional ventilation, and in
many countries this remains the primary indication for use of HFOV. HFOV is an
efficacious rescue treatment in lung diseases characterised by low distending lung
volume and is a feasible alternative to ECMO under these conditions, providing that
appropriate volume recruitment strategies are applied. The goal of rescue HFOV is
to optimise the distending lung volume and in so doing. Achieving this goal will
improve gas exchange through the highly efficient gas mixing that occurs during gas
exchange whilst protecting the lung from the barotrauma that would result to achieve
the same gas exchange at conventional breathing frequencies.
There is no clear evidence to guide clinicians when to commence rescue treatment
with HFOV. Such guidelines need to consider the potential recruitable lung volume
which is influenced by disease (eg hyaline membrane disease versus pulmonary
hypoplasia) and also gestation (less mature infants have absent/underdeveloped
INDICATIONS FOR HFOV RESCUE TREATMENT
Extreme Preterm Very Preterm Term
Tidal volume (mL/kg)
Peak inspiratory pressure
O)
(cmH
2
Breathing frequency
(breaths/min.)
Table 3: Suggested conventional ventilation settings to consider commencement of HFOV as a
rescue treatment.
4.5 – 5.0 5.0 – 6.0 6.0 – 7.0
22 – 25 24 – 27 25 – 30
70 – 80 60 – 70 50 – 60
Page 26

50 I I 5111 IndICaTIons For HFov I
41
lung volume and mean aIrway Pressure
alveoli and may become over distended at lower total lung capacities and tidal
volumes relative to their weight). Rather than using absolute limits for peak pressure
as the indication for switching to rescue HFOV, in clinical settings where HFOV is
used primarily for rescue, clinicians should consider the nature of the disease being
treated, the stage in the natural history of the lung disease, the susceptibility/
resilience of that infant to iatrogenic injury and departure from gestation appropriate
healthy breathing patterns when deciding when to initiate rescue HFOV.
The promise of low tidal volumes and optimised distending lung volume offered
by HFOV makes first intention, lung protective HFOV an attractive theoretical
proposition for effective gas exchange at minimal cost of iatrogenic injury.
Nonetheless, systematic meta-analysis of HFOV clinical trials suggest HFOV offers
only a marginal reduction in the outcome of bronchopulmonary dysplasia and/or
death for preterm infants with RDS (13, 18). Reasons for the equivocal outcomes of
HFOV versus conventional ventilation frequency trials are varied, but undoubtedly
include the timing of commencement (some infants will improve and wean ventilation
rapidly regardless of ventilation modality) and the expertise of the clinical staff in
understanding and applying both conventional and high-frequency ventilation
modalities.
However, with the exception of early or a priori HFOV use, there remain relatively few
controlled studies of the use of HFOV in many of the different clinical scenarios.
Nonetheless, there remain theoretical advantages and anecdotal reports of success
in using HFOV outside the immediate application of acute respiratory distress
syndrome which are worthy of consideration and ongoing investigation. Homogeneous
lung diseases are particularly amenable to HFOV. Successful application of lung
protective HFOV for treatment of congenital diaphragmatic hernia may be in part
responsible for recent trends to improved survival for this complex surgical condition.
Similarly, HFOV is an effective treatment of persistent pulmonary hypertension of the
newborn (PPHN), especially in the setting of secondary PPHN complicating a
derecruited or consolidated lung.
The application of HFOV to inhomogeneous lung diseases is less clear. Successful
HFOV rescue treatment of meconium aspiration (19) and exacerbations of
bronchopulmonary dysplasia (20) are reported. The use of HFOV in the setting of
pulmonary interstitial emphysema (PIE) is less clear. The only clinical trial of HFOV
in the setting of PIE showed that HFOV offers benefits when applied to lungs with
only mild PIE, but no advantage and possible harm in the setting of moderate to
severe PIE (21). Systematic reviews highlight an association between HFOV and
increased development of air leak, suggesting caution in the application of HFOV in
the clinical setting of PIE (13, 18).
12 Strategies for HFOV in various lung diseases
12.1 Diffuse homogeneous lung diseases
Diffuse homogeneous lung disease includes respiratory distress syndrome, diffuse
pneumonia and bilateral lung hypoplasia. Homogeneous lung diseases are ideal for
treatment with HFOV. The primar y goal is uniform recruitment and maintenance of lung
volume to optimise oxygenation and ventilation with minimal barotrauma or volutrauma.
Oscillation frequency is ideally set at or around the anticipated corner frequency of
the lung. For more mature infants, a frequency of 10 Hz is appropriate. Ex tremely
preterm and extremely low birthweight infants with homogeneous lung disease
may be effectively and optimally ventilated at even higher frequencies of 12-15 Hz.
Inspiratory to expiratory ratios of either 1:1 or 1:2 may be used.
PRACTICAL TIPS
HFOV FREQUENCY
Preterm HMD
Congenital diaphragmatic hernia
Term lung disease
Meconium aspiration
Severe PIE
56 78 9101112131
Frequency (Hz)
Figure 12-1: Suggested HFOV frequency ranges for common neonatal conditions.
Recruitment of the homogeneously collapsed lung ideally follows the algorithm
shown in Figure 8-2 (Section 8.2.1) to find optimal distending volume, including
administration of surfactant after initial recruitment, if suspicion of surfactant deficiency
remains high. FiO
long as oxygenation improves and FiO
volume is achieved, subsequent weaning of mean airway pressure continues more
is weaned throughout the process. Recruitment continues as
2
exceeds 0.25. Once optimal distending
2
T
Early PIE
5
D-8068-2016
Page 27

52 I I 5312 sTraTegIes For HFov In varIous lung dIseases I
lung volume and mean aIrway Pressure
slowly as the patient improves, until mean airway pressures consistent with
extubation to nasal continuous positive airway pressure are achieved.
Use of volume targeting (Volume Guarantee) during recruitment will ensure the
patient is protected from both excessive cyclic tidal volumes and resultant rapid
shifts in PaCO
during the recruitment process. Volume targeting also facilitates
2
automated weaning from active oscillatory ventilation, towards predominantly
spontaneous ventilation. In the absence of volume targeting, oscillatory amplitude
should be decreased manually as the infant improves to encourage self-sustaining
spontaneous efforts and ultimately extubation.
12.2 Inhomogeneous lung diseases
Inhomogeneous lung diseases are characterised by pathologies that differ markedly
in presence and severity within different regions of the lung: they include focal
pneumonia, pulmonary haemorrhage, meconium aspiration, unilateral lung hypoplasia
and bronchopulmonary dysplasia. The primary goal of treatment is to oxygenate and
ventilate effectively, allowing injured areas to heal whilst simultaneously avoiding
new injury to more healthy lung regions: ultimately guiding the lung towards a more
homogeneous state. Achievement of this goal is a significant therapeutic challenge
due to regional differences in compliance and/or resistance: there is a risk of
significantly over-distending or traumatising the more compliant lung units.
Theoretically, inhomogeneous lung conditions are likely to be better treated using
a range of frequencies simultaneously, to target varying regional mechanical
properties (22). This option is not yet commercially available. Clinicians therefore
need to consider the likely mechanics and clinical course of the underlying pathologies
and adapt their ventilation strategy accordingly.
Reduction of regional inhomogeneities – particularly when these are characterised by
regional atelectasis -is enhanced by the use of higher rather than lower frequencies
(23). The explanation for this homogenisation effect at higher frequencies is the higher
flow velocities and increased acceleration of the flow waveform promote greater pressure
losses in normally ventilated areas whilst simultaneously allowing pressure in atelectatic
areas to increase to the threshold pressure at which recruitment occurs (24).
Although yet unproven, lower frequencies and shor t inspiratory to expiratory ratios
may be more ideal in the setting of acute airtrapping and predominantly high
resistance pathologies: the combination of a longer cycle time (low frequency) and
relatively longer expiration than inspiration results in lower flow velocities and longer
absolute expiratory times that will facilitate complete expiration of the lung (25).
However, overcoming airtrapping is also critically dependent on maintaining a mean
airway pressure sufficiently high to stent open the airways and hence avoid airway
collapse during active expiration that may promote worsening of the gas trapping
condition and may cause pneumothorax.
As with homogeneous lung diseases, the clinician must remain vigilant in adapting
ventilatory strategy to the evolving disease process. Meconium aspiration, for
example, commences as a condition with increased airway secretions, the removal of
which may be enhanced by asymmetric inspiratory to expiratory ratios (eg I:E = 1:2).
The presence of the secretions reduces airway diameter and impedes flow, whilst
the meconium promotes acute inflammation of the airway walls: together these
response promote high airway resistance and a downward shift of (optimal) corner
frequency of the lung (see section 6.3). As the condition evolves, however, the
pathology predominantly becomes more consistent with a chemical pneumonitis and
patchy regional atelectasis. Consequently, later in the disease process a shift back
to higher frequencies and consideration of lung recruitment may be beneficial.
12.3 Airleaks
Diseases characterised by air leak include pulmonary interstitial emphysema (PIE),
bullous emphysema, pneumomediastinum, and pneumothoraces. Whereas HFOV
should protect the lung from air leak, this protective effect is not well supported by
the literature: systematic meta-analyses consistently show that HFOV is associated
with a small increase in the presence of any air leak – which appears largely due to
increased interstitial emphysema (13,18). Careful attention to avoidance of over
distention (passive or cyclic) and targeting of treatment frequency to avoid inadvertent
transmission of high oscillatory pressures may reduce the likelihood of developing
air leak phenomena.
In the presence of gross air leak (eg pneumothorax), strategy should prioritise low
tidal volume ventilation. Consequently, higher frequencies and avoidance of any
superimposed conventional ventilation breaths are preferred. If significant PIE is
present, then using lower frequencies with short I:E (eg I:E = 1:2) may enhance
resolution of the disease (25).
Management of mean airway pressure is critical in the presence of air leak: aggressive
lung volume recruitment is best avoided. Mean airway pressure should be reduced
where possible then maintained at a pressure sufficient to stent small airways open
(particularly in PIE when alveolar/airway attachments may be missing or damaged)
to avoid progression of the air leak. Once the patient improves, continuation of
HFOV for a further 24-48 hours may avoid recurrence. In the presence of unilateral
PIE, positioning and/or selective single lung ventilation to promote collapse and rest
of the affected lung, followed by gentle reinflation 1-2 days later may facilitate more
rapid resolution.
Page 28

54 I I 5513 ComPlICaTIons, relaTIve ConTraIndICaTIons and lImITs oF HFov I
lung volume and mean aIrway Pressure
12.4 Persistent pulmonary hypertension of the newborn (PPHN)
Strategy for use of HFOV in the presence of persistent pulmonary hypertension of
the newborn needs to consider the underlying cause.
For infants with primary PPHN, with no significant underlying lung disease, the focus
is on optimising the cardiocirculatory status: exclude or treat hypovolaemia and
hypotension prior to commencement of HFOV; strive for normoventilation; and
select a mean airway pressure that promotes lung perfusion by neither under- or
over-distending the lung. Frequency selection is guided more by patient size than
disease: higher frequencies are used for smaller and more immature babies. Babies
with primary PPHN are often over-ventilated on conventional ventilation such that
mean airway pressure on commencement of HFOV rarely needs to exceed that used
during the preceding conventional ventilation. Often a decrease in mean air way
pressure will increase cardiac output and significantly improve the patient’s
condition. Monitoring of central venous pressure is advantageous.
In contrast, when PPHN is secondary to another disease process, treatment needs
to target the underlying pathology. Recruitment of underlying atelectasis, for
example, may result in marked improvements in patient condition.
Concomitant treatment with HFOV and inhaled nitric oxide is more often successful
than treatment with HFOV or iNO alone in the presence of severe PPHN,
particularly for secondary PPHN associated with respiratory distress syndrome or
meconium aspiration (26).
13 Complications, relative contraindications and
limits of HFOV
13.1 Complications and side effects
13.1.1 Irritation
Commencement of HFOV is often associated with the patient becoming more
unsettled. Irritation may be exacerbated by passive over distension of the lung and
excessive oscillatory amplitude. Maintenance of quiet spontaneous breathing during HFOV will enhance oxygenation (30). Spontaneous breathing is encouraged by
adjusting oscillatory amplitude to target permissive hypercapnoea. When patient
discomfort or distress occurs, deeper sedation should be considered. Sedation
should be reduced once hypercapnoea is settled, volume recruitment is complete
and the patient is improving.
13.1.2 Secretions
Attention to provision of appropriate humidification is essential to ensure that
secretions do not accumulate and plug the airways. Even small amounts of secretion
or foam in the air ways after surfactant administration can have a marked effect on the
efficacy of HFOV: the increase in airway impedance (especially airway resistance)
significantly decreases oscillatory tidal volumes and hence also the DCO
2
Importantly, oscillatory pressures also increase proximal to the build up of secretions
and may promote local trauma.
13.1.3 Necrotising tracheobronchitis
Irritation progressing to necrosis of the tracheobronchial system may complicate
HFOV, most often attributed to inadequate humidification and excessive mean
airway pressure. There is no evidence that the incidence of necrotising
tracheobronchitis is any different in HFOV to that occurring after conventional
ventilation.
13.1.4 Haemodynamics
Increased vagal activity during HFOV may result in a slight reduction in heart rate. In
contrast, high mean airway pressures may compromise both venous return to the
heart and cardiac output as well as result in increased pulmonary vascular
resistance. Clinically, the patient may try to compensate for reduced venous return
with an increased heart rate. Each of these problems are minimised by careful
attention to optimising blood volume and myocardial function and careful attention to
mean airway pressure strategy to avoid lung over-distension and development of
pulmonary hypertension. Development of peripheral oedema may be present due to
the high intrathoracic pressures.
13.1.5 Intracranial haemorrhages
Concern about intracranial haemorrhage during HFOV stems from early studies
when the use of HFOV was associated with adverse neurological outcomes (27).
However, systematic reviews of more recent HFOV trials do not show the incidence
of intracranial haemorrhage during HFOV to be different to that during conventional
ventilation (13). Avoidance of intracranial haemorrhage is critically dependent on the
use of appropriate lung volume recruitment and the use, correct interpretation and
response to changes in monitoring variables: for example, as the lung is recruited
with HFOV, early and responsive adjustment of ventilator settings such as ΔP
hf
or
tidal volume (volume-targeted modes) avoids inadvertent over-ventilation. Rapid
fluxes in arterial carbon dioxide arising with breath to breath changes in tidal volume
.
Page 29

56 I I 57
13 ComPlICaTIons, relaTIve ConTraIndICaTIons and lImITs oF HFov I
lung volume and mean aIrway Pressure
associated with altered lung mechanics may translate to rapid changes in the
intracerebral circulation: such fluctuations may be avoided with use of volume
targeting, such as Volume Guarantee during HFOV, or careful adjustment of
PRACTICAL TIPS
T
oscillatory amplitude in response to change in transcutaneous carbon dioxide when
HFOV is operated without volume targeting.
FOR THE OPTIMAL SET-UP:
13.1.6 Overinflation
Overinflation is the most frequent complication and cause for failure of oscillatory
ventilation. It occurs most often in obstructive lung diseases such as meconium
aspiration syndrome and pulmonary interstitial emphysema. Careful attention to
appropriate frequency selection for the nature and stage of the underlying disease
is essential to avoid this complication.
The set- up of patient circuit has a higher impact on ventilator performance
during high frequency ventilation compared to during conventional ventilation.
The patient circuit can be optimized as follows:
■ Use breathing circuits with very stiff tubing walls and minimal volume in
order to reduce the compressible gas volume and minimize compliance
of the breathing circuit:
• Use a circuit as short as possible.
13.2 Relative contraindications
Acute pulmonary obstruction is the only relative contraindication to the use of HFOV.
• Use a circuit with stiff tubing walls (smooth bore, no standard
corrugated circuit).
Acute obstruction may be present in the early stages of meconium aspiration, as well
as during pulmonary haemorrhage, RSV bronchiolitis and bronchopulmonary
dysplasia. Use of HFOV in the presence of obstruction risks barotrauma to the
proximal airways, acutely inadequate gas exchange and exacerbation of gas trapping
if a ball valve effect is present due to secretions.
■ Prepare humidifier chamber as follows in order to reduce compressible
volume to a minimum:
• Use a small humidifier chamber to minimize chamber volume The
chamber shall be filled with water to the maximum level as fluids are
not compressible.
13.3 Limitations of HFOV
Assuming a disease and patient appropriate strategy is selected, the success of
HFOV is dependent on the capabilities of the high frequency ventilator to meet the
proposed strategy. Even adults can be oscillated with an appropriately powered
ventilator. Key to this goal is the achievement of adequate oscillatory volumes at
disease specific optimal frequencies. Compliance of the patient circuit has a crucial
impact on delivery of oscillatory tidal volumes: cyclic tidal volumes delivered to the
patient are increased considerably with a low-compliant circuit including the use of
a low volume humidifier chamber. Patient lung mechanics additionally influence the
ability of the ventilator to deliver adequate tidal volumes for efficient gas exchange.
The same ventilator that easily ventilates a large healthy patient may struggle to
deliver adequate tidal volumes to a smaller patient. In this setting, effective ventilation
may be achieved using increased I:E (eg I:E = 1:1) and lower frequency.
• Avoid the use of incubator extensions as these increase tubing
compliance
high and extensions
and compressible volume. If the incubator temperature is
are needed, select the shortest extension with
stiff tubing walls.
■ Use heated circuits, if possible:
• Use no or low- volume water trap in order to reduce the compressible
volume.
■ Avoid condensation in the breathing circuit to minimize resistance to air
flow:
• Avoid temperature drops in patient circuit by air conditioning or air
draft.
• Avoid restrictions of tube diameters by hose kinks or adapters.
Recent and emerging modifications including volume targeting and inclusion of
capability to use sigh breaths may also allow refinement of the strategy to achieve
oxygenation and ventilatory goals whilst minimising iatrogenic complications.
Page 30

58 I I 5914 FaIlure oF HFov I
14
Failure of HFOV
16
Summary
In most instances, HFOV improves the critical respiratory condition, at least
temporarily. Failure is often a consequence of inappropriate strategy – that does not
fully consider the patient’s disease, the ventilator’s capabilities, or the interactions
between the two. Inappropriate HFOV strategy can lead to a rapid worsening of the
patient’s condition. Patients with homogeneous lung diseases are more likely
(70- 87%) to respond to HFOV than inhomogeneous diseases (50-79%), airleaks
(63- 80%), PPHN (39-69%), or CDH (22-27%) (21). Early identification of HFOV
failure (persistently high FiO
and/or low A/a ratio) allows for prompt commencement of alternative therapies (eg
high-frequency jet ventilation in inhomogeneous lung disease), and if necessary,
transfer to a medical centre offering extracorporeal membrane oxygenation. In one
study, an A/a ratio (Alveolar-arterial ratio) of < 0.08 six hours after commencement of
HFOV best predicted HFOV failure and need for ECMO in neonates (31). Any patient
with an increase in PaCO
HFOV that is not due to an immediate mechanical problem (eg blocked tube) is at
risk of failed HFOV.
15
The future directions of HFOV
HFOV continues to evolve, despite being in clinical use for over 30 years. The
introduction of volume targeting heralds further modifications such as targeted
DCO
ventilation that will facilitate not only automated weaning, but also take the
2
guess work out of appropriate changes to oscillatory amplitude with changes in
frequency as disease state evolves. Future research will target more effective and
lung protective ventilation for inhomogeneous lung diseases, where the use of
multi-frequency ventilation may be particularly effective. Work also on the interaction
between patient and ventilator, including the incorporation of demand flow, will allow
patients to be treated with HFOV without the complications associated with deep
sedation with/without paralysis, potentially increasing rapidity of recovering and
ventilator weaning. Importantly, given the importance of effective monitoring (and its
appropriate interpretation) to optimal HFOV strategy, we can expect further developments
in bedside technologies such as respiratory plethysmography, electrical
tomography and oscillatory mechanics that facilitate identification of optimal
distending lung volumes and early detection of adverse events such as pneumothorax.
, oxygenation index, PaCO2, or mean airway pressure
2
and/or oxygenation index 2-6 hours after commencing
2
impedance
HFOV is a mode of ventilation in clinical use for over thirty years. In many centres,
is now an established alternative first-intention ventilation approach for
HFOV
respiratory disease not amenable to non-invasive therapies. It is also widely used as
an alternative to conventional ventilation, when the latter fails. HFOV is often used to
treat diseases such as respiratory distress syndrome, pneumonia, meconium aspiration
syndrome, persistent pulmonary hypertension of the newborn and lung hypoplasia
more successfully and more gently than ventilation at more conventional breathing
frequencies. Compared to conventional ventilation, the greatest assets of correctly
applied HFOV in this regard are improved oxygenation and ventilation with reduced
risk of barotrauma and volutrauma.
A thorough understanding of the device being used, the complexities of interactions
between ventilator and patient, and particularly the implications of lung mechanics
for lung protective ventilation during HFOV is paramount to the successful clinical
application of HFOV. Although we have made much progress in this regard, the
learning curve remains steep: clinicians with an incomplete understanding of the
concepts of HFOV and experience in its use may not observe the benefits that it
offers – indeed, the potential for harm remains and hence vigilance in both
application, monitoring, maintenance and ultimately weaning of the patient receiving
HFOV remains of the utmost importance.
Page 31

60 I I 6117 aPPendIx I
17
Appendix
17.1 High Frequency Ventilation with the Dräger Babylog VN500
High-frequency in the Babylog VN500 provides active inspiration and active
expiration with a sinusoidal pressure waveform (at I:E of 1:1) at a stable mean airway
pressure. The HFOV settings are frequency (f
), amplitude (Amplhf), mean airway
hf
pressure (MAP) and inspiratory to expiratory ratio (I:E). The Babylog VN500
incorporates three major improvements relative to its Babylog 8000 plus predecessor
to enhance the power and quality of HFOV:
1. the inclusion of a stronger mechanism to ensure that the oscillatory pressure
becomes negative during expiration;
2. the servo control of inspiratory flow;
3. the ability of volume targeted HFOV;
4. the ability to directly control I:E by the user.
Pulsed inspiratory flow
Safety
breathing
valve
Servo valve
PEEP/MAP
Frequency
Amplitude
Exp. valve
Venturi Jet
Strong venturi jet for generation
of subatmospheric pressures
Figure 17-1: Principle of operation of the Babylog VN500.
Safety valve actively closed by
microprocessor during HFO
by fast servo valve
Directly driven, fast
expiration valve
D-8074-2016
Different actuators are used by the Babylog VN500 system to control the HFOV
pressure waveform: the inspiratory valve, the expiratory valve and the ejector inside
the expiratory valve. All three actuators are used to generate a pressure signal
(waveform) at the y-piece (airway opening) with the operator determined settings of
frequency, amplitude, mean airway pressure and I:E ratio. The integration of a powerful
(suction nozzle) into the expiratory valve allows the Babylog VN500 to reach
ejector
higher amplitudes at low mean air way pressures. The ejector creates a sub-atmospheric
pressure at the expiration valve, actively removing air out of the hose system. This
mechanism allows generation of even sub-atmospheric peak pressures at the
ensuring rapid pressure reduction to actively empty the patient’s lung, and
y-piece,
consequently avoidance of intrinsic increased endexpiratory pressure (airtrapping).
As explained in chapter 5, this sub-atmospheric pressures do not reach alveolar level.
The Babylog VN500 provides a base flow within the patient circuit during HFOV,
facilitating spontaneous breathing. Spontaneous breathing is important to enhance
ventilation distribution during HFOV, and becomes increasingly important for
maintenance of gas exchange during weaning. Additional flow is provided during the
inspiratory phase of each HFOV cycle, to achieve the set pressure amplitude.
The Babylog VN500 monitors the average inspiratory device flow delivered to the
patient circuit which is important information in the application of nitric oxide.
Inspiratory device flow is not stable under all conditions and is dependent on the
selected HFOV setting, presence of leak around the tube, hose resistance and
compliance. This measured value of device flow only indicates flow delivered by the
ventilator to the patient circuit and not the flow delivered to the patient’s lungs. External
flow sources are not taken into account.
Amplitudes as high as 90 cmH2O are achievable at frequencies of 5 Hz. As in other HFO
ventilators, the maximum amplitude decreases with increasing frequency: absolute
amplitudes achieved are dependent on circuit configuration and patient mechanics.
Use of a stiff, dedicated HFOV patient circuit and low volume humidifier chamber is
recommended in larger patients to fully access the capabilities of the Babylog VN500.
The adjustable I:E ratio is depending
on frequency: I:E of 1:1 are available
over the complete frequency range
from 5-20 Hz, whilst I:E of 1:2 are
achievable from 5-15 Hz and 1:3 from
5-10 Hz.
SETTING RANGES
I:Ehf Oscillation frequency range
1:1 5 to 20 Hz
1:2 5 to 15 Hz
1:3 5 to 10 Hz
The airway pressure is measured from inspiratory and expiratory pressure sensors
after consideration of inspiratory and expiratory hose resistances. The inspirator y and
expiratory valves are controlled such that the measured mean airway pressure (MAP)
equals a set MAP.
In the Babylog VN500, mean airway pressure is adjustable from 5 to 50 cmH
O.
2
Page 32

62 I I 6317 aPPendIx I
DRÄGER PATIENT CIRCUITS
T
By default, the Ventilation settings dialog window has a number of tabs (B)
permanently assigned to specific ventilation modes. By default these are set at the
factory to include PC-CMV, PC-AC, PC-SIMV and PC-PSV. These start up default
modes can be changed to include PC-HFO as an option.
Dräger provides a circuit portfolio, which is optimized for use with Drägerventilators. The following breathing circuits are recommended for HFOV, if
highest performance is needed. Also other circuits can be used with the
Babylog VN500 but the HFO performance might be diminished.
■ BlueSet heated HFV (N) (reusable)
■ VentStar Helix heated (N) Plus (disposable)
17.1.1 Adjusting HFOV with the Babylog VN500
Commencement of HFOV is achieved via the Ventilation settings dialog window,
which can be opened in one of 3 ways:
1. Touching the Ventilation settings button (A) in the main menu bar (on the right).
2. Touching the up arrow (↑, B) button in the therapy bar.
3. Touching the displayed ventilation mode (C) in the header bar.
C
123
A
VENTILATION SETTINGS
B B B B
Figure 17-3: Ventilation settings dialog window.
C
A
D-8076-2016
Alternatively, the user can access PC-HFO by first selecting Other modes (D) tab,
and then touching the button for PC-HFO from the available modes (E). This action
turns the D tab to yellow. The user must confirm the change in ventilatory modality to
PC-HFO with the rotary knob. Once confirmed, PC-HFO will be displayed in the (C)
tab, and will be the active ventilation mode.
VENTILATION SETTINGS
C
D
E
B
D-8075 -2016
Figure 17-2: Options for opening the ventilation settings dialog window from the main screen.
D-8077-2016
Figure 17- 4: PC-HFV is activated from the Other Modes window.
Additional options for PC-HFO are accessed by pressing the tab for additional
settings (G). These options include activation and setting of parameters for PCHFO with Volume Guarantee (VG), and PC-HFO with Sigh. A sigh under high
frequency oscillation is an intermediate conventional cycle.
Page 33

64 I I 65
17 aPPendIx I
PC-HFO-Volume Guarantee
During PC-HFO with Volume Guarantee, the Babylog VN500 automatically
determines the oscillatory amplitude required to achieve the set oscillatory tidal
volume VT
switched on. If VT
. The Amplhf therapy control is inactive when Volume Guarantee is
hf
can not be achieved a low tidal volume alarm is generated.
hf
PC-HFO-Sigh
Sighs are a normal physiological protective mechanism for lung volume homeostasis.
In the absence of airleak, incorporation of a sigh in HFOV may facilitate short-term
re-recruitment of the lung after suction, or as an infrequent sigh to maintain lung
volume and prevent development of atelectasis.
The frequency of the sigh is adjusted by altering RRsigh. The Psigh is the pressure
applied during the resulting conventional pressure-controlled breath, which is maintained for a duration (Tisigh) set by the operator. The rise time and rise form of the
sigh breath are determined by the Slope or Insp Flow according to the configuration
of the ventilator interface. Sighs can also be manually triggered at any time with the
Man. Insp/hold function: for manually triggered sighs, the duration of the sigh is
determined by how long the operator continues to hold the Man. Insp/hold button.
Paw
Psigh
MAPhf
t
Flow
Figure 17-5: Ventilator parameters for sigh breaths during HFO.
Ti sigh
t
D-8072-2016
17.2 Clinical Case Report – Benefits of HFOV with Volume Guarantee
Mother (G
) presented with ruptured membranes 6 days prior to delivery. Labour
6P0
induced due to appearance of malodourous liquor discharge suggestive of antibiotics.
Maternal antenatal steroids and antibiotics administered 8.5 hours prior to delivery.
Preterm female infant born vaginally at 22 w and 5 days gestation with a birthweight
of 430 g and head circumference of 19 cm. Apgar scores were 5 at 1 min, 6 at 5
minutes and 6 at 10 minutes. Electively intubated with a 2.5 mm tracheal tube and
surfactant administered within first 10 minutes (200 mg/kg Curosurf
TM
, Chiesi
Farmaceutici).
Ventilation was commenced in the delivery room with peak inspiratory pressure
(PIP) of 25 cmH
fractional inspired oxygen (FiO2) of 0.4. Ventilation was increased during resuscitation
to 32/6 with an FiO
O, positive end expiratory pressure (PEEP) of 6 cmH2O and a
2
of 1.0, before infant started to improve and FiO2 could be
2
decreased.
The initial arterial blood gas at 30 min of life reflected the significant difficulties
experienced gaining control of ventilation and gas mixing: pH 6.9, PaCO
78 mmHg, BE -9.7 mmol/L , Lactate 8.3 mmol/L. The arterial blood gas im-
PO
2
95 mmHg,
2
proved over the next 75 min although a moderately severe mixed respiratory/metabolic acidosis persisted at 2 hours of age: pH 7.13, PaCO
mmHg, BE – 6.4 mmol/L with an FiO
of 0.9 and mean airway pressure 13 cmH2O
2
66.5 mmHg, PaO2 47. 6
2
(oxygenation index (OI) = 24.6).
An X-ray at 2 hours of age was suggestive of early pulmonary interstitial emphysema.
Volume Guarantee had been turned off, as even the minimum tidal volume of 2 mL
was excessive for this 440 gm infant. At 4 hours of age the mean airway pressure
was 10 cmH
O, PIP 26 cmH2O and PEEP 6 cmH2O. The attending physician
2
consulted with a colleague experienced with use of the Babylog VN500: a decision
was made to commence HFOV with concomitant Volume Guarantee to minimise
further lung damage to the infant from excessive ventilatory pressures.
As the treating consultant was concerned about early evolution of PIE, HFOV was
commenced with a frequency of 5 Hz and an I:E ratio of 1:2 and an amplitude of 20
O, adjusted to obtain appropriate chest vibrations. Measured tidal volume was
cmH
2
.3 mL (3 mL/kg = lower end of recommended VT at 5 Hz – see section 12). HFOV was
1
commenced with mean airway pressure of 10 cmH
O (approximately the same as the
2
mean airway pressure on conventional ventilation) to avoid further progression of PIE.
Due to the infant’s extreme prematurity and fragile skin, transcutaneous blood gas
monitoring was not used. A blood gas obtained 5 min after commencing HFOV
showed pH 7.31, PaCO
to 0.3 with a MAP of 10 cmH
40 mmHg, PaO2 72.7, BE – 5.6 mmol/L. FiO2 had decreased
2
O. (OI = 3)
2
Page 34
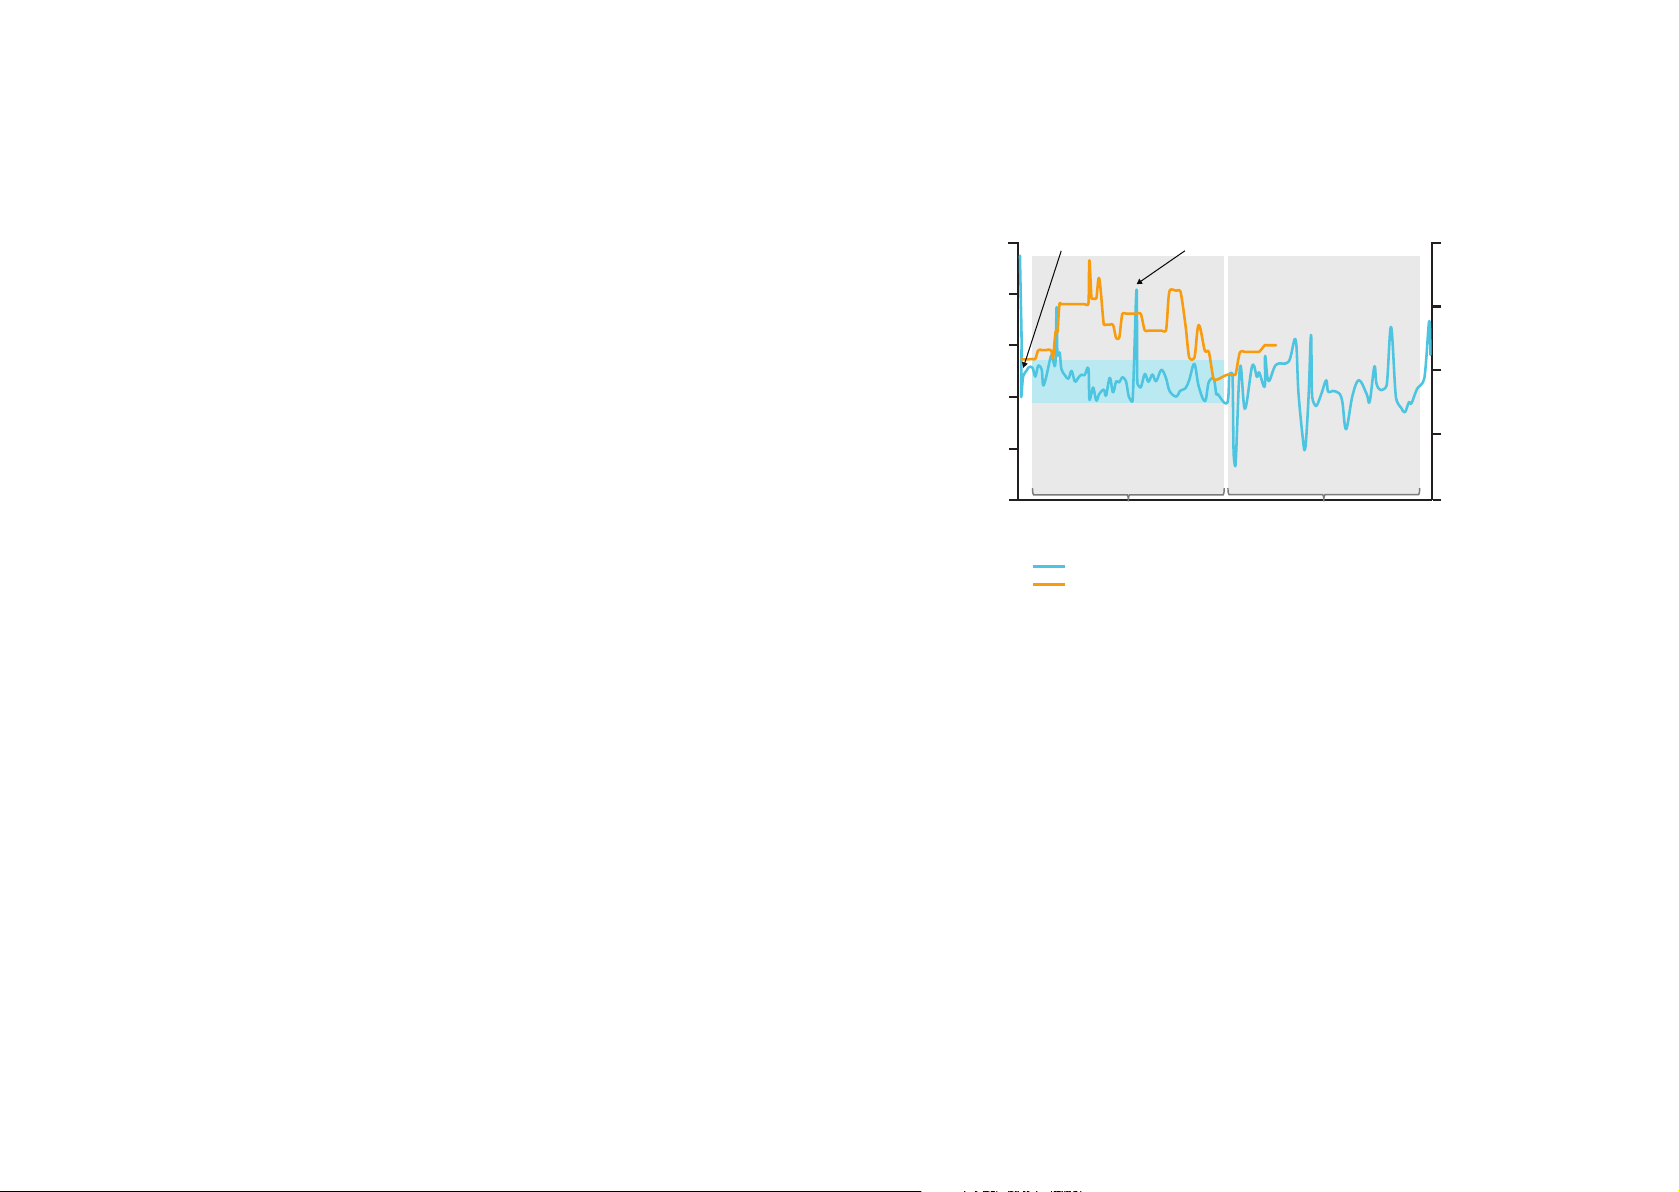
66 I I 6717 aPPendIx I
In the absence of transcutaneous monitoring and to avoid excessive blood sampling,
Volume Guarantee was added to HFOV. Initial V T
1.3 mL with Ampl
weaned automatically to 15 cmH
set at 22 cmH2O. FiO2 decreased to 0.21. Amplitude was
hfmax
O. A repeat blood gas 15 min later showed these
2
settings were maintaining stable blood gases: pH 7.3, PaCO
BE-5.3. A further repeated blood gas two hours later showed PaCO
stable. Satisfied that the DCO
target was appropriate, the intervals between blood
2
was set at the measured VThf of
hf
41.5 mmHg, PaO2 57,
2
was remaining
2
gas sampling were extended with confidence.
A repeat chest x-ray on day 2 suggested PIE is improved. The frequency was
gradually
frequency, the set VT was decreased to maintain a stable DCO
increased to 9 Hz, and further to 13 Hz by day 4. With each increase in
, reaching 0.9 mL
2
(2 mL/kg) at a frequency of 13 Hz. Low dose inhaled nitric oxide (<5 ppm) was
commenced by the attending consultant on day 4 when the OI has increased again
from 4.7 to 8.4, and continued for 5 days.
Despite an episode of coagulase negative septicaemia, the ventilatory course
remains relatively stable over the nex t 10 days, with the HFOV with Volume Guarantee
maintained until day 13, when the loan Babylog VN500 ventilator was returned. The
infant was placed back on conventional ventilation however deteriorated clinically
with increasing FiO
. After 36 hours, HFOV was recommenced with a different
2
oscillator without capability of tidal volume monitoring or volume targeted HFOV.
With increase of FiO
to 1.0, and non-response to volume recruitment, inhaled nitric
2
oxide was recommenced (10 ppm) and a modified course of dexamethasone
commenced (total cumulative dose 1.2 mg/kg over 3 weeks). Response to the
intensification of treatment was moderately rapid. Oscillatory amplitude, FiO
, MAP
2
and iNO were weaned over a 12 day period and the infant was extubated from HFOV
4
to nasal CPAP at 5 weeks postnatal age when she was 27
5
Nasal CPAP was ceased at 35
w postmenstrual age, with cessation of all oxygen
w postmenstrual age.
support at 42 w postmenstrual age and discharge at 5 months (44 w postmenstrual
age).
Of interest is Figure 17-6 which shows the changes in the infants’ PaCO
first 3 weeks of her illness. The stability of the PaCO
during HFOV with Volume
2
over the
2
Guarantee is clearly evident. The two deviations from the status quo representing
brief episodes when she was briefly returned to conventional ventilation. Increased
fluctuation in her PaCO
occuring after 2 weeks corresponds with the period when
2
she was on HFOV without volume targeting or monitoring. Rapid fluxes in arterial
partial pressure of carbon dioxide may translate to unwanted rapid changes in
intracerebral circulation, that can be prevented with the usage of Volume Guarantee.
This graph provides a clear illustration of the benefits of volume targeting for
stability of PaCO2 during HFOV, which was particularly beneficial in this extremely
low gestational age infant.
100
80
60
(mmHg)
2
40
PaCO
20
HFOV with VG
0
0510 15 20
PaCO
DCO
2
Figure 17-6: Stability of PaCO2 and required DCO2. Blue line: PaCO2, orange line: DCO2. Note increased
variability (with some extreme values) after change in ventilator and discontinuation of HFOV with Volume
Guarantee (VG). DCO
the period of Volume Guarantee was 51.6 mL
is corrected to the square of the body weight (kg2). Average DCO2 during
2
Brief trial CMVHFOV commenced
HFOV (no VG)
Age (d)
2
2
s/kg2. No DCO2 was recorded after VG was turned off.
80
60
)
2
s/kg
40
2
(mL
2
DCO
20
0
D-8071-2016
The subsequent course of this extremely premature infant who received 96 % of her
ventilation on HFOV is truly remarkable. Her initial cranial ultrasound scans were all
normal, with only minor changes of calcifying vasculopathy within her basal ganglia
at 415 w postmenstrual age. She has mild retinopathy (max Grade I, no plus) which
resolved spontaneously. At 3 years of age, she had had only 8 hospital readmissions
and a total of 16 days in hospital after initial hospital discharge. The majority of her
readmissions were for bronchiolitis and lower respiratory tract infections and her
admissions were primarily for oxygen support overnight during acute illness. Her
current therapy is inhaled steroid and intermittent salbutamol. She has no
th
respiratory symptoms between episodes. Growth centiles are weight (26
th
height (12
centile) and head circumference 3rd centile. Her 3 year
assessment with the Griffiths Mental Developmental Scale – Extended
centi le);
developmental
Revised
shows a General Quotient of 101. Her main issues were distractibility and some
delay in vocalisation although she was speaking in short sentences.
Page 35
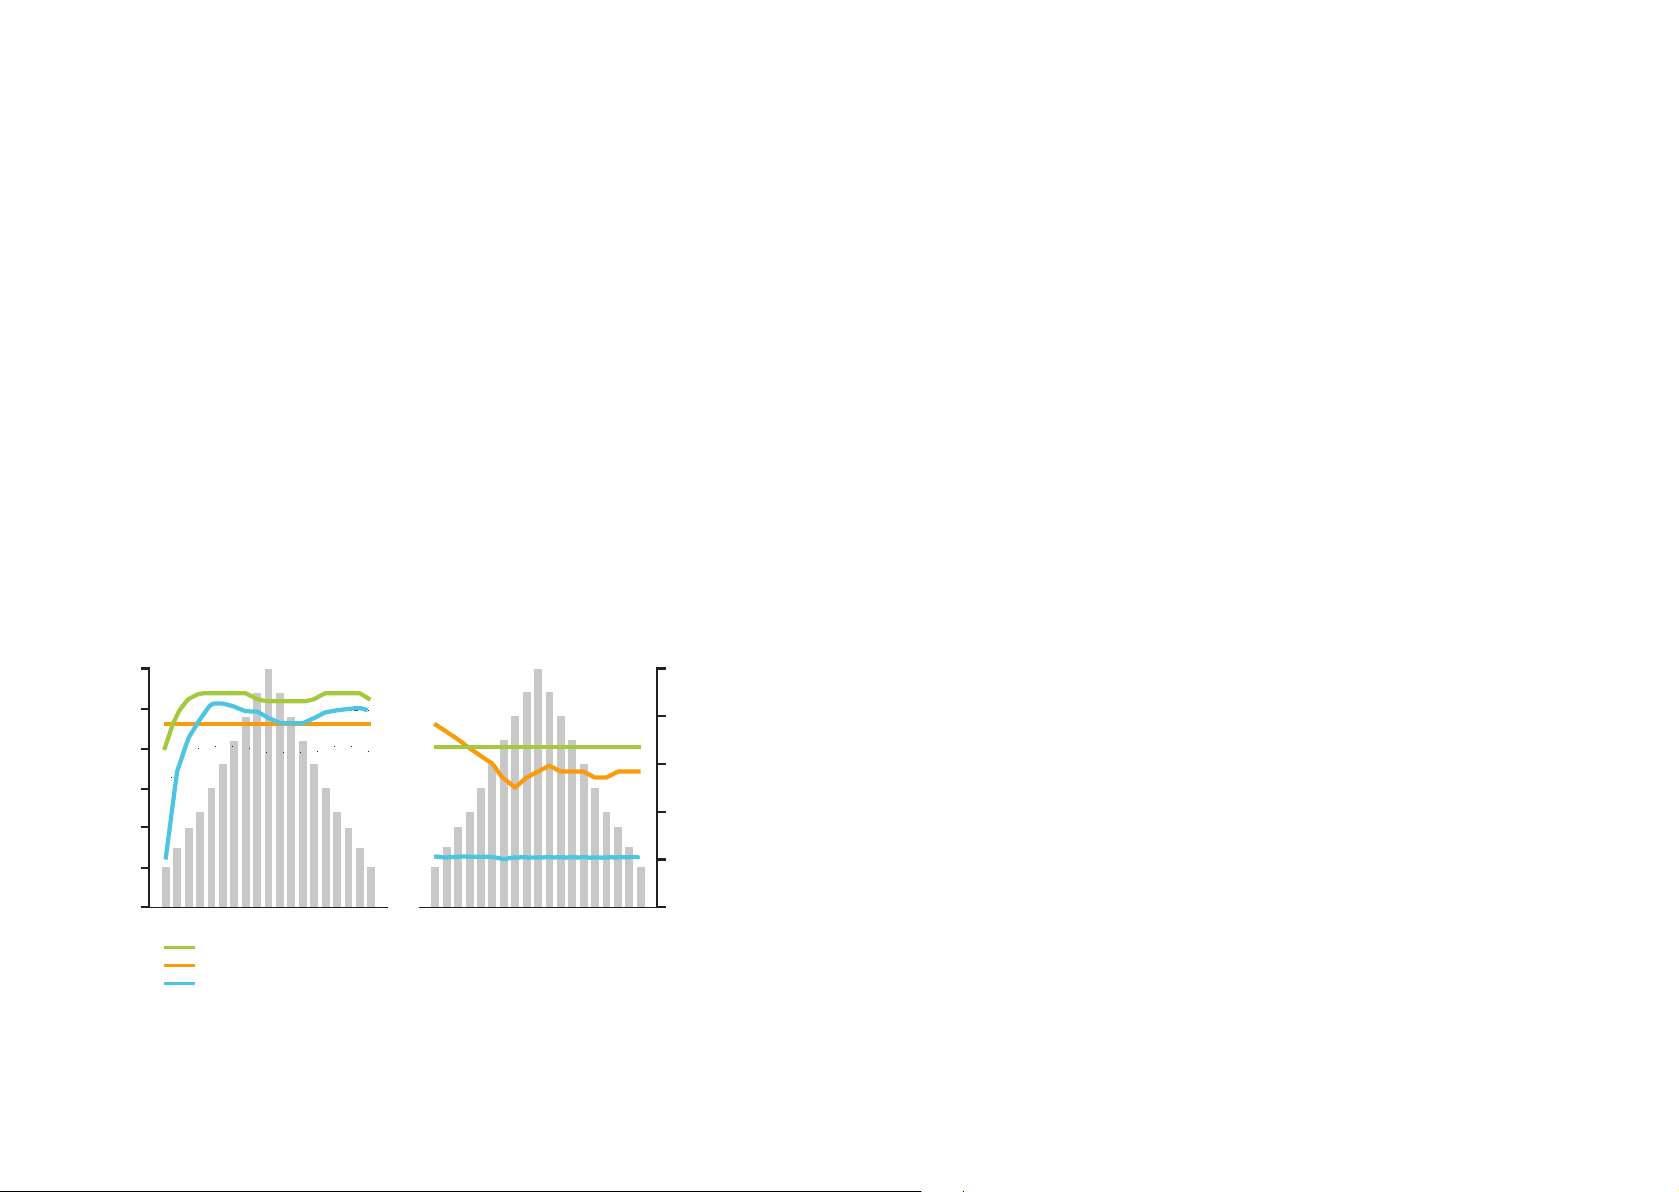
68 I 17 aPPendIx I I 69
17.3 Example: DCO2 during lung volume recruitment with/without
Volume Guarantee
A collapsed plasticised adult porcine lung (Nasco, Fort Atkinson, WI) was intubated
(8.0 mm with a cuffed tracheal tube) and connected to the Babylog VN500 in HFO
mode. Initial ventilator settings were frequency of 5 Hz, mean airway pressure
(5 cmH
O) and amplitude I:E 1:1. The lung was recruited then derecruited by
2
stepwise increments then decrements in mean airway pressure with pressure
changes made at 2 minute intervals. The recruitment was performed initially using
Volume Guarantee at constant set tidal volume (20 mL) and a maximum pressure
amplitude of 30 cmH
starting VT
of 20 mL) without Volume Guarantee. Figure 17-7 shows the recorded
hf
tidal volumes, ventilator displayed pressure amplitude and DCO
O then repeated using constant amplitude (23 cmH2O =
2
recorded for each
2
step change in mean air way pressure. Recruitment at a constant oscillatory pressure
amplitude (ΔPhf) results in considerable fluctuations in tidal volume and
consequently also DCO
. Clinically, PaCO2 and cerebral blood flow may also
2
fluctuate considerably unless the clinician remains at the bedside to constantly
adjust oscillatory amplitude in response to changes in lung mechanics. In contrast,
when HFO is used in a Volume Guarantee mode, both tidal volume and DCO
HFOV HFOV + VG
30
25
20
O)
2
15
VThf (mL)
∆Phf(cmH
10
5
0
VThf
∆Phf
DCO
2
Figure 17-7: Changes in DCO2, pressure amplitude and tidal volume during lung recruitment.
Graphs show recruitment using HFOV without (left) and then with (right) Volume Guarantee.
The orange line is the pressure amplitude. The green line is the tidal volume. The blue line is the
.
DCO
2
Time (ms)Time (ms)
remain
2
4000
3500
3000
2500
2000
1500
D-8069-2016
/s)
2
(mL
DCO
constant, and the oscillatory amplitude is automatically adjusted according to
hfmax
2
changes in lung mechanics. In this setting, the patient will have more stable PaCO
and the clinician may focus on other issues. Setting Ampl
critical, however, to the safe use of Volume Guarantee. The Ampl
appropriately is
hfmax
effectively
hfmax
triggers the low tidal volume alarm, and hence the clinician should set the Ampl
to reflect the amount of change in oscillatory amplitude they are prepared to accept
automatic ventilator adjustment before notification of a change in the patient’s
condition. A buffer of 5 cmH
O for Ampl
2
sonable buffer. It is similarly important that the Ampl
above the average ΔPhf provides a rea-
hfmax
is decreased as the
hfmax
patient’s condition improves so that any deterioration in condition is picked up early.
17.4 Abbreviations
AC Assist control
BPD Bronchopulmonary dysplasia
C Compliance
CgDH Congenital diaphragmatic hernia
Dynamic compliance
C
dyn
CLD Chronic lung disease
CPAP Continuous positive airway pressure
CV Conventional ventilation
Gas transport coefficient
DCO
2
delta P Peak inspiratory pressure minus PEEP
E Elastance
ECMO Extracorporeal membrane oxygenation
2
ƒ Frequency
Resonance frequency
ƒ
0
Corner frequency
ƒ
c
Fraction of inspiratory O2 concentration
FiO
2
FRC Functional residual capacity
HFV High-frequency ventilation
HFJV High-frequency jet ventilation
HFO High-frequency oscillation
HFOV High-frequency oscillatory ventilation
HMD Hyaline membrane disease
Hz Hertz: unit of frequency (cycles/second)
I inertance
ICH Intracranial haemorrhage
Page 36

70 I I 7117 aPPendIx I
I:E Inspiratory to expiratory ratio
IMV Intermittent mandatory ventilation
IPPV Intermittent positive pressure ventilation
Kg Kilogram
MAP Mean airway pressure
MV Minute volume
Par tial pressure of oxygen in arterial blood
PaO
2
Partial pressure of carbon dioxide in arterial blood
PaCO
2
Partial pressure of oxygen
PO
2
Partial pressure of carbon dioxide
PCO
2
Paw Airway pressure
PEEP Positive end expiratory pressure
PIE Pulmonary interstitial emphysema
PIP Peak inspiratory pressure
Ampl
Maximum oscillatory amplitude
hfmax
PPHN Persistent pulmonary hypertension of the newborn
PVL Periventricular leukomalacia
R Resistance
RDS Respiratory distress syndrome
RSV Respiratory syncytical virus
SIMV Synchronised intermittent mandatory ventilation
SIPPV Synchronised intermittent positive pressure ventilation
Saturation of peripheral oxyhaemoglobin
SpO
2
τ Time constant
Ti Inspiratory time
Te Expiratory time
TLC Total lung capacity
TT Tracheal tube
V. Oscillatory flow
Tidal volume
V
t
Tidal volume during high frequency
VT
hf
18
References
1. Harcourt ER, John J, Dargaville PA, Zannin E, Davis PG, Tingay DG. Pressure
and flow waveform characteristics of eight high-frequency oscillators. Pediatr
Crit Care Med. 2014;15(5):e234-40.
2. Pillow JJ, Wilkinson MH, Neil HL, Ramsden CA. In vitro performance
characteristics of high-frequency oscillatory ventilators. Am J Respir Crit Care
Med. 2001;164(6):1019-24.
3. Pillow JJ. High-frequency oscillatory ventilation: mechanisms of gas exchange
and lung mechanics. Critical care medicine. 2005;33(3 Suppl):S135-41.
4. Henderson Y, Chillingworth FD, Whitney JL. The respiratory dead space. Am J
Physiol 1915;38:1-19.
5. Taylor G. The dispersion of matter in turbulent flow through a pipe. Proc R Soc
London. 1954;223:446.
rd
6. Allen JL, Fredberg JJ, Keefe DH, Frantz ID, 3
. Alveolar pressure magnitude and
asynchrony during high-frequency oscillations of excised rabbit lungs. Am Rev
Respir Dis. 1985;132(2):343-9.
7. Slutsky AS, Brown R. Cardiogenic oscillations: a potential mechanism enhancing
oxygenation during apneic respiration. Med Hypotheses. 1982;8(4):393-400.
8. Fredberg JJ. Augmented diffusion in the air ways can support pulmonary gas
exchange. J Appl Physiol. 1980;49(2):232-8.
9. Slutsky AS, Kamm RD, Rossing TH, Loring SH, Lehr J, Shapiro AH, et al. Effects
of frequency, tidal volume, and lung volume on CO2 elimination in dogs by high
frequency (2-30 Hz), low tidal volume ventilation. J Clin Invest. 1981;68(6):
1475-84.
10. Rossing TH, Slutsky AS, Lehr JL, Drinker PA, Kamm R, Drazen JM. Tidal volume
and frequency dependence of carbon dioxide elimination by high-frequency
ventilation. N Engl J Med. 1981;305(23):1375 -9.
11. Dorkin HL, Stark AR, Werthammer JW, Strieder DJ, Fredberg JJ, Frantz ID, 3
rd
Respiratory system impedance from 4 to 40 Hz in paralyzed intubated infants
with respiratory disease. J Clin Invest. 1983;72(3):903-10.
.
12. Pillow JJ, Neil H, Wilkinson MH, Ramsden CA. Effect of I/E ratio on mean
alveolar pressure during high-frequency oscillatory ventilation. J Appl Physiol.
1999;87(1):407-14.
Page 37

72 I I 7318 reFerenCes I
13. Cools F, Offringa M, Askie LM. Elective high frequency oscillatory ventilation
versus conventional ventilation for acute pulmonary dysfunction in preterm
infants. Cochrane Database Syst Rev. 2015;3:CD000104.
14. Pillow JJ, Sly PD, Hantos Z, Bates JH. Dependence of intrapulmonary pressure
amplitudes on respiratory mechanics during high-frequency oscillatory ventilation
in preterm lambs. Pediatr Res. 2002;52(4):538-44.
15. Venegas JG, Fredberg JJ. Understanding the pressure cost of ventilation: why
does high-frequency ventilation work? Critical care medicine. 1994;22(9 Suppl):
S49- 5 7.
16. De Jaegere A, van Veenendaal MB, Michiels A, van Kaam AH. Lung recruitment
using oxygenation during open lung high-frequency ventilation in preterm infants.
Am J Respir Crit Care Med. 2006;174(6):639-45.
17. Miedema M, de Jonge F, Frerichs I, van Veenendaal MB, Van Kaam AH. The
effect of airway pressure and oscillation amplitude on ventilation in preterm
infants. The European respiratory journal. 2012;Accepted Dec 2011.
18. Cools F, Askie L, Offringa M, PreVILIG C. Individual patient data meta-analysis:
novel approach to interpreting HFOV trials in preterm infants. PAS Meeting; 2
th
May; Baltimore, MD2009. p. 2849.490.
5
nd
19. Chen DM, Wu LQ, Wang RQ. Efficiency of high-frequency oscillatory ventilation
combined with pulmonary surfactant in the treatment of neonatal meconium
aspiration syndrome. Int J Clin Exp Med. 2015;8(8):14490-6.
20. Cheung PY, Prasertsom W. High-frequency oscillatory ventilation as rescue
therapy in sick preterm neonates (</=1250 g): outcome and its prediction.
Pediatr. 1996;97(3):437-8.
21. Randomized study of high-frequency oscillatory ventilation in infants with severe
respiratory distress syndrome. HiFO Study Group. J Pediatr. 1993;122(4):609-19.
22. Kaczka DW, Herrmann J, Zonneveld CE, Tingay DG, Lavizzari A, Noble PB, et
al. Multifrequency Oscillatory Ventilation in the Premature Lung: Effects on Gas
Exchange, Mechanics, and Ventilation Distribution. Anesthesiology. 2015;123
(6):1394 -403.
24. Bauer K, Brucker CH, Simbruner G, Rudiger M. The role of ventilation frequency
in airway reopening. In: Vander Sloten J, Verdonck P, Nyssen M, Haueisen J,
editors. IFMBE Proceedings. Berlin: Springer-Verlag; 2009. p. 2040-4.
25. Squires KA, De Paoli AG, Williams C, Dargaville PA. High-frequency oscillatory
ventilation with low oscillatory frequency in pulmonary interstitial emphysema.
Neonatology. 2013;104(4):243-9.
26. Kinsella JP, Truog WE, Walsh WF, Goldberg RN, Bancalari E, Mayock DE, et al.
Randomized, multicenter trial of inhaled nitric oxide and high-frequency oscillatory
ventilation in severe, persistent pulmonary hypertension of the newborn. J Pediatr.
1997;131(1 Pt 1):55-62.
27. High-frequency oscillatory ventilation compared with conventional mechanical
ventilation in the treatment of respiratory failure in preterm infants. The HIFI
Study Group. N Engl J Med. 1989;320(2):88-93.
28. Lunkenheimer, P., W. Rafflenbeul, H. Keller, I. Frank, H. Dickhut, and C.
Fuhrmann. Application of transtracheal pressure-oscillations as a modification
of “diffusing respiration”. Br J Anaesth. 1972;44:627.
-
29. Van Genderingen HR, van Vught AJ, Duval EL, Markhorst DG, Jansen JR. Attenuation of pressure swings along the endotracheal tube is indicative of optimal distending pressure during high-frequency oscillatory ventilation in a model
of acute lung injury. Pediatr Pulmonol. 2002 Jun;33(6):429-36.
30. Van Heerde M, Roubik K, Kopelent V, Kneyber MC, Markhorst DG. Spontaneous breathing during high-frequency oscillatory ventilation improves regional
lung characteristics in experimental lung injury. Acta Anaesthesiol Scand. 2010
Nov;54(10):1248-56.
31. Paranka MS, Clark RH, Yoder BA, Null DM Jnr. Predictors of failure of highfrequency oscillatory ventilation in term infants with severe respiratory failure.
Pediatrics. 1995;95(3):400-4.
23. Tsuzaki K, Hales CA, Strieder DJ, Venegas JG. Regional lung mechanics and
gas transport in lungs with inhomogeneous compliance. J Appl Physiol. 1993;75
(1):206-16 .
Page 38

74 I I 75Index I
Index
A
Airleak 53, 58, 64
Airtrapping 52, 61
Airway pressure 46, 53, 54
Amplitude 14, 15, 24, 31
Atelectasis 40
B
Barotrauma 19, 21, 22, 24, 27, 45, 46, 49, 51, 56, 59
BPD 33
Breathing circuit 57, 62
Bronchopulmonary dysplasia 46, 50, 52, 56
C
elimination 15, 18, 46, 71
CO
2
Compliance 56
Complications 54
Corner frequency 25, 27, 28, 46, 51, 53
CPAP 39, 66
D
17, 18, 39, 42, 43, 45, 47, 48, 55, 58, 66, 67, 68
DCO
2
Dispersion 11
E
ECMO 7, 49, 58
F
44, 51, 58, 65, 66
FiO
2
Flow 11, 64
Frequency 16, 27, 32, 48
G
Gas exchange 48
H
Heart rate 48
Hypercapnoea 44, 45
I
I:E ratio 17, 31, 32, 35, 36, 44, 48, 60, 65
M
MAP 60, 65, 66
Mean airway pressure 7, 14, 35, 41, 46, 48, 53, 61
Meconium aspiration 28, 50, 52, 53, 54, 56, 59, 72
Molecular diffusion 13
Monitoring 47, 48, 54
N
Necrotising tracheobronchitis 55
O
Oscillatory frequency 16
Overinflation 56
P
PEEP 30, 41, 47, 65
Pendelluft 13
Persistent pulmonary hypertension of the newborn 54
PIP 30, 41, 43, 47, 65
Pneumonia 51, 52, 59
Pneumothorax 48, 53, 58
PPHN 50, 54, 58
Pulmonary haemorrhage 52, 56
R
RDS 20
Resistance 21, 22
Resonance frequency 16, 26
RSV bronchiolitis 56
S
SIMV 63
Strategy 54
Surfactant 7, 51, 55, 65, 72
T
Tidal volume 15, 71
Time constant 24, 27, 30, 32, 33
Transcutaneous carbon dioxide 42, 44, 47, 56
V
Volume Guarantee 39, 43, 48, 52, 63, 64, 65, 66, 67, 68
Volume targeting 45, 52, 56, 58, 66
W
Weaning 46
Page 39

CORPORATE HEADQUARTERS
Drägerwerk AG & Co. KGaA
Moislinger Allee 53–55
23558 Lübeck, Germany
www.draeger.com
Locate your Regional Sales
Representative at:
www.draeger.com/contact
Fabricant:
Drägerwerk AG & Co. KGaA
Moislinger Allee 53–55
23558 Lübeck, Allemagne
REGION DACH
Drägerwerk AG & Co. KGaA
Moislinger Allee 53–55
23558 Lübeck, Germany
Tel +49 451 882 0
Fax +49 451 882 2080
[email protected]
REGION EUROPE
Drägerwerk AG & Co. KGaA
Moislinger Allee 53–55
23558 Lübeck, Germany
Tel +49 451 882 0
Fax +49 451 882 2080
[email protected]
REGION MIDDLE EAST, AFRICA
Drägerwerk AG & Co. KGaA
Branch Office
P.O. Box 505108
Dubai, United Arab Emirates
Tel +971 4 4294 600
Fax +971 4 4294 699
[email protected]
REGION ASIA / PACIFIC
Draeger Medical
South East Asia Pte Ltd.
25 International Business Park
#04-27/29 German Centre
Singapore 609916, Singapore
Tel +65 6572 4388
Fax +65 6572 4399
[email protected]
REGION CENTRAL
AND SOUTH AMERICA
Dräger Panama Comercial S. de R.L.
Complejo Business Park,
V tower, 10th floor
Panama City
Tel +507 377 9100
Fax +507 377 9130
[email protected]
CANADA
Draeger Medical Canada Inc.
2425 Skymark Avenue, Unit 1
Mississauga, Ontario, L4W 4Y6
Tel +1 905 212 6600
Toll-free +1 866 343 2273
Fax +1 905 212 6601
[email protected]
91 02 693 | 16.10-1 | HQ | CR | Subject to modifications | © 2016 Drägerwerk AG & Co. KGaA
 Loading...