

Page 1
35
10
Casio fx-82AU
Statistical calculations
Learning Skills
The math will disappear from
the screen. While in Math
mode your answer will be
given as fractions, even if you
put in the information using
the ÷ key. This is mentioned
in our math handout
Until this is reversed your
answers will be read as
decimals.
Introduction:
This sheet will teach you how to use the Casio fx82AU calculator to perform statistical operations. See also
our handout for mathematical functions. Any further queries please contact Student Central.
This sheet will teach you to:
Change settings on your calculator
Put your calculator into statistical mode
Enter observations
Display the descriptive statistics
Enter group data
Perform linear regression
1. Settings on your calculator
To turn your calculator on: ON
Your screen should show a small D and Math at the top of the screen
You need to change a couple of default settings before you start.
Once you change these they will stay changed and will enable
you to better use your calculator.
1. Get out of Math mode into linear mode
Calculator steps: shift setup 2
2. Change the default so that small decimal answers read in decimal format rather than exponent
format. To check if this needs to happen
Enter 1 ÷ 200 =
If your answer shows as
Calculator steps: shift setup 8 2
Page 1 of 7 Learning Skills @ CSU
Page 2
Frequency mode
This will enable you to enter a
score and its frequency. Each
score will have a frequency of 1
unless you use the right-arrow to
enter a frequency cell and
overwrite that frequency. See
the section entering
observations from a frequency
table on how to enter data.
2. Calculation Mode
This is the mode where you perform all your standard or non-statistical functions
Calculator steps: MODE 1
3. Statistics Mode
This will enable you to enter data for descriptive statistical analysis. To put your calculate into statistical
mode
Calculator steps: MODE 2 1
If you are entering data that is in a frequency table you then
need to do the following
Calculator steps: SHIFT SETUP down arrow 3 1
To turn the frequency off
Calculator steps: SHIFT SETUP down arrow 3 2
To clear the statistical memory, exit stats mode back to comp
mode and re-enter stats mode, this should be done before entering any new data
Calculator steps: MODE 1 MODE 2 1
To check stored data: SHIFT 1 2
Page 2 of 7 Learning Skills @ CSU
Page 3
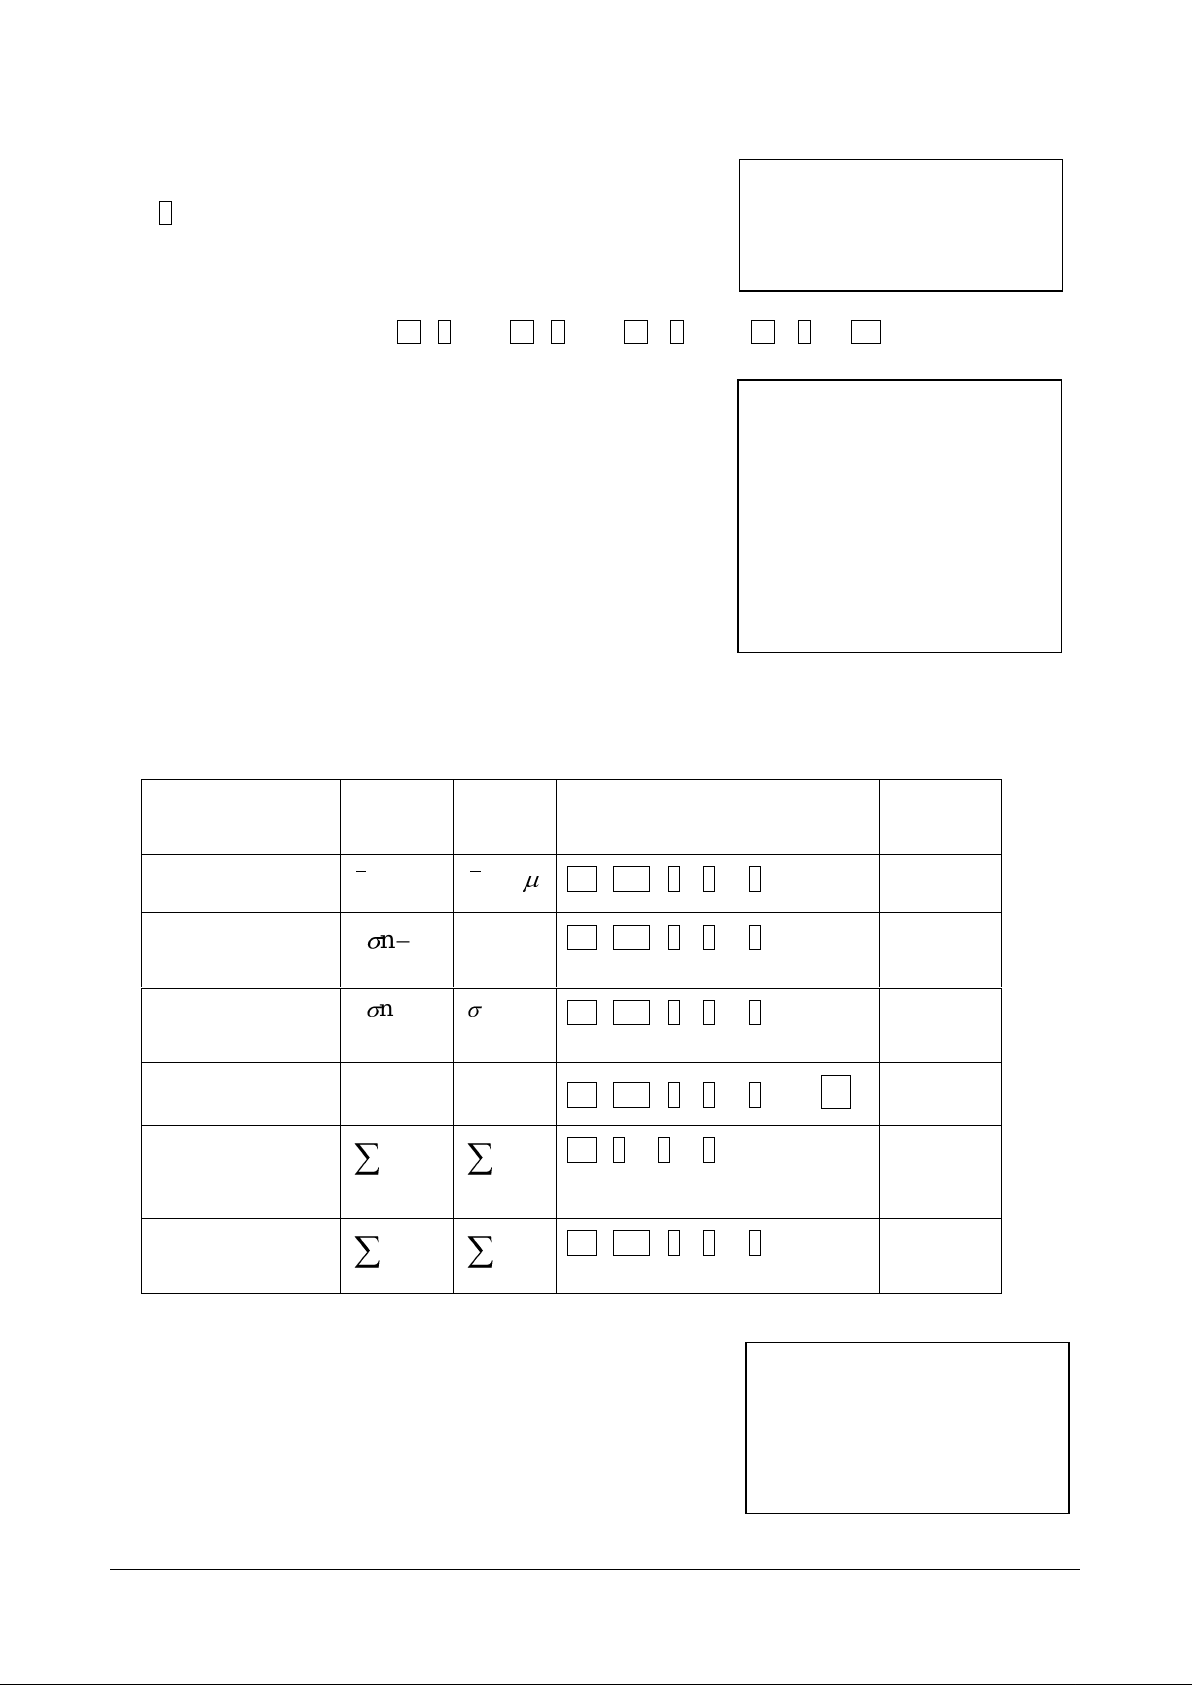
4. Entering single variable observations
Calculator
symbol
Common
symbol
Calculator steps
answer
mean
x
or x
AC shift 1 5 2 =
12.75
Sample standard
deviation
1nx
s
AC shift 1 5 4 =
2.5
Population
standard deviation
nx
AC shift 1 5 3 =
2.165
Sample variance
2
s
AC shift 1 5 3 =
2
x
6.25
Scores added up
x x
AC 1 4 2 =
51
Scores squared
then added up
2
x
2
x
AC shift 1 4 1 =
669
Number of scores
The number of scores (n) is 4
this is displayed while entering
AC after entering
You press AC after you have
finished entering data to tell the
calculator that you have
completed.
It is also necessary in between
displaying the descriptive
statistics to clear the previous
value
Descriptive Statistics
The equal sign must be pressed
at the end to bring up the value
of the descriptive statistic you
are after.
To enter observations press
= after entering the observation
Example 2.1
Enter 10, 12, 13, 16
Calculator steps: 10 = 12 = 13 = 16 = AC
5. Display the Descriptive Statistics
Page 3 of 7 Learning Skills @ CSU
Page 4

6. Entering observations from a frequency table
score
frequency
10
12
12
5
13
9
16
7
If the scores are a sample
If the scores are a population
394.12x
394.12
263.2s
228.2
121.5
2
s
966.4
2
409x 409x
5233
2
x 5233
2
x
Note
1. Remember when entering new
data you must clear the memory
first
2. The total number of observations
is 33
To enter observations from a frequency table firstly ensure you have put it in the frequency mode as
above, then type in;
= after entering the observation (as above)
Now put in the frequencies;
Using the arrow keys move the curser to the frequency column then type in
= after entering the frequency
Then AC
Example 6.1:
Enter the following table into your calculator
Calculator steps:
MODE 1 MODE 2 1
SHIFT SETUP down arrow 3 1
10 = 12 = 13 = 16 =
move the curser to the frequency column
12 = 5 = 9 = 7 = AC
Once the observations are entered the mean and standard deviation are found as above.
Page 4 of 7 Learning Skills @ CSU
Page 5

7. Entering Grouped data
group
frequency
> 0 up to and including 10
25
>10 up to and including 20
33
>20 up to and including 30
21
>30 up to and including 40
30
If the scores are a sample
If the scores are a population
Approximate:
138.20x
Approximate:
138.20
Approximate:
272.11s
Approximate:
220.11
Approximate:
064.127
2
s
Approximate:
898.125
2
Note
The mean and standard
deviation are only
approximate because we
are using each class centre
to approximate the
individual observations
(n = 109)
To enter grouped data you first have to find the midpoint of each group. This is done by adding together
the lowest and highest value from each group and then dividing it by two. We then use these as our
observations.
Example 5.1:
To find the midpoint of each group:
(0+10)/2=5
(10+20)/2=15
(20+30)/2=25
(30+40)/2=35
Calculator steps:
MODE 1 MODE 2 1
SHIFT SETUP down arrow 3 1
5 = 15 = 25 = 35 =
move the curser to the frequency column
25 = 33 = 21 = 30 = AC
Page 5 of 7 Learning Skills @ CSU
Page 6

8. Linear Regression Mode
x score
(independent variable)
y score
(dependent variable)
5
20 8 18
6
22
7
28
10
27
To put your calculator into statistics mode press
MODE 2 2
9. Entering x and y data sets
To enter x and y observations, it is the same as entering data from a frequency table except the second
column is the y column
= after entering the x observation
Now put in the y observations;
Using the arrow keys move the curser to the y column then type in
= after entering the frequency
Then AC
Example 9.1
Calculator steps:
MODE 1 MODE 2 2
5 = 8 = 6 = 7 = 10 =
move the curser to the y column
20 = 18 = 22 = 28 = 27 = AC
10. Regression output
AC SHIFT 1 7 1 =
this will give A – the y-intercept of the regression line A = 16.189
AC SHIFT 1 7 2 =
this will give B – the slope of the regression line B = 0.946
AC SHIFT 1 7 3 =
this will give r – the correlation coefficient r = 0.417
Page 6 of 7 Learning Skills @ CSU
Page 7

2
x
2
x
x
x
2
y
2
y
y
y
xy
xy
To find the various sums
AC SHIFT 1 4 1 =
AC SHIFT 1 4 2 =
AC SHIFT 1 4 3 =
AC SHIFT 1 4 4 =
AC SHIFT 1 4 5 =
Press MODE 1 when you are finished with that data and wish to clear it. Re-enter stats mode when you
want to enter further scores.
= 274
= 36
= 2721
= 115
= 842
11. For more information
Visit our Learning Skills website at http://www.csu.edu.au/division/studserv/learning
Other useful websites are available at:
http://www.casio.edu.shriro.com.au/downloads/products/fx82/fx-82AU Beginners Guide.pdf
Copyright
© Learning Skills, Charles Sturt University, December 2008
Page 7 of 7 Learning Skills @ CSU
 Loading...