

Page 1

Instruction manual
FlowPlot
Software tool for monitoring FLOW-BUS
parameter values and optimizing
controller settings of digital instruments
Doc. no .: 9.17.03 0O Date: 24 -10- 2013
ATTENTION
Please read this instruction manual carefully before installing and operating the instrument.
Not following the guidelines could result in personal injury and/or damage to the equipment.
Head Office: Nijverheidsstraat 1a, NL-7261 AK Ruurlo, The Netherlands, Tel. +31 573 458800, info@bronkhorst.com
Page 2
BRONKHORST®
Disclaimer
The information in this manual has been reviewed and is believed to be wholly reliable. No responsibility, however, is
assumed for inaccuracies. The material in this manual is for information purposes only, and is subject to change
without notice.
Bronkhorst High-Tech B.V.
May 2011
Symbols
Important information. Discarding this information could cause injuries to people or damage to the
Instrument or installation.
Helpful information. This information will facilitate the use of this instrument.
Additional info available on the internet or from your local sales representative.
Page 2 FlowPlot 9.17.030
Page 3

BRONKHORST®
Table of contents
1 GENERAL PRODUCT INFORMATION ................................................................................................. 4
1.1 INTRODUCTION ................................................................................................................................................ 4
1.2 REFERENCES TO OTHER APPLICABLE DOCUMENTS ..................................................................................................... 4
1.3 SUPPORTED INSTRUMENTS ................................................................................................................................. 4
1.4 SYSTEM REQUIREMENTS..................................................................................................................................... 4
1.5 INSTALLATION AND START UP .............................................................................................................................. 4
2 OPERATION ..................................................................................................................................... 5
2.1 SELECT PARAMETERS ........................................................................................................................................ 5
2.1.1 Connect plot lines ........................................................................................................................................ 5
2.1.2 Channel & control mode ............................................................................................................................. 5
2.1.3 Realtime measurement ............................................................................................................................... 6
2.2 MAIN WINDOW ............................................................................................................................................... 7
2.2.1 Basic controls .............................................................................................................................................. 7
2.2.2 Advanced controls ....................................................................................................................................... 8
2.3 SCRIPT ........................................................................................................................................................... 8
2.4 OPTIONS ........................................................................................................................................................ 9
2.4.1 Plot settings ................................................................................................................................................ 9
2.4.2 Trigger ....................................................................................................................................................... 10
2.4.3 File locations ............................................................................................................................................. 10
2.5 PRINTING ......................................................................................................................................................11
2.6 INSTRUMENT SETTINGS .....................................................................................................................................12
2.6.1 General description ................................................................................................................................... 12
2.6.2 Saving and loading sensor and controller settings ................................................................................... 12
2.6.3 Channel & control mode ........................................................................................................................... 12
2.6.4 Setpoint controller .................................................................................................................................... 13
2.6.5 Basic settings ............................................................................................................................................ 13
2.6.6 Controller settings ..................................................................................................................................... 14
2.6.7 Alarm and counter settings ....................................................................................................................... 17
3 SPREADSHEET DATA ...................................................................................................................... 19
4 SERVICE ........................................................................................................................................ 20
Page 3 FlowPlot 9.17.030
Page 4
BRONKHORST®
Processor
x86 or x64 700 MHz or higher
Memory (RAM)
64 MB
Hard disk
20 MB available disk space
Display
800 x 600 or higher resolution, 256 colors or more
Operating system
Windows XP, Vista (x86 or x64) or 7 (x86 or x64)
The digit grouping symbol of currency must always differ from the number’s decimal symbol. Having
other problems as well. See Microsoft’s KB198098.
1 GENERAL PRODUCT INFORMATION
1.1 INTRODUCTION
This manual will explain the operation of the software tool FlowPlot. It has been written based on FlowPlot V3.30, but
should be suited for former (and future) versions as well, although functionality may differ from what is described.
Flowplot is an applicaton meant for service purposes on Bronkhorst
good insight in the dynamic behaviour of digital instruments. Its mean features are signal monitoring, up to eight plots
of value versus time, and an easy way to adjust instrument settings, like controller, alarm and counter parameters.
FlowPlot is a Dynamic Data Exchange (DDE) client and relies on FlowDDE to handle all communication to the
instruments and provides the data to applications.
1)
Bronkhorst: This includes Bronkhorst High-Tech B.V., Bronkhorst Cori-Tech B.V. and M+W Instruments GmbH.
1.2 REFERENCES TO OTHER APPLICABLE DOCUMENTS
Manuals and guides for digital instruments are modular. General instructions give information about the functioning
and installation of instruments. Operational instructions explain the use of the digital instruments features and
parameters.
Manuals:
Operation instructions digital instruments (document nr. 9.17.023)
FlowDDE (document nr. 9.17.067)
1)
digital instruments and readout units. It gives
Manuals and Software tooling can be found at:
http://www.bronkhorst.com/en/downloads
1.3 SUPPORTED INSTRUMENTS
FLOW-BUS instruments using a RS232/FLOW-BUS interface and instruments with an RS232 interface.
1.4 SYSTEM REQUIREMENTS
equal symbols is not valid (not just in this situation, but also in other situations) and will probably cause
1.5 INSTALLATION AND START UP
Follow on-screen instructions when installing FlowPlot.
FlowPlot will be installed in C:\Program Files\Bronkhorst\FlowPlot.
Start FlowPlot through the Start menu: Start >> (All) Programs >> Bronkhorst >> FlowPlot.
C:\Program Files is a system folder and is followed by (x86) on 64-bit Windows versions and may differ
on non-English Windows versions.
Page 4 FlowPlot 9.17.030
Page 5
BRONKHORST®
2 OPERATION
2.1 SELECT PARAMETERS
After startup, FlowPlot will automatically detect if the communication by FlowDDE to the instrument is open. If not, a
message will appear in the status bar at the bottom and most buttons will be disabled.
If the communication is open, FlowPlot will pop up the Select Parameters window. The first time FlowPlot is started,
the default plot lines are:
- Line 1, green, connected to the first suitable instrument to parameter measure (output flow or pressure).
- Line 2, red, connected to the first suitable instrument to parameter setpoint (desired flow or pressure).
- Line 3, yellow, connected to the first suitable instrument to parameter valve output (actuator signal).
When FlowPlot is started the next time and the bus configuration is the same, FlowPlot will load the parameter
settings. The default parameter settings will be used if the bus configuration has changed. Be aware that the color
settings will not be default in that case.
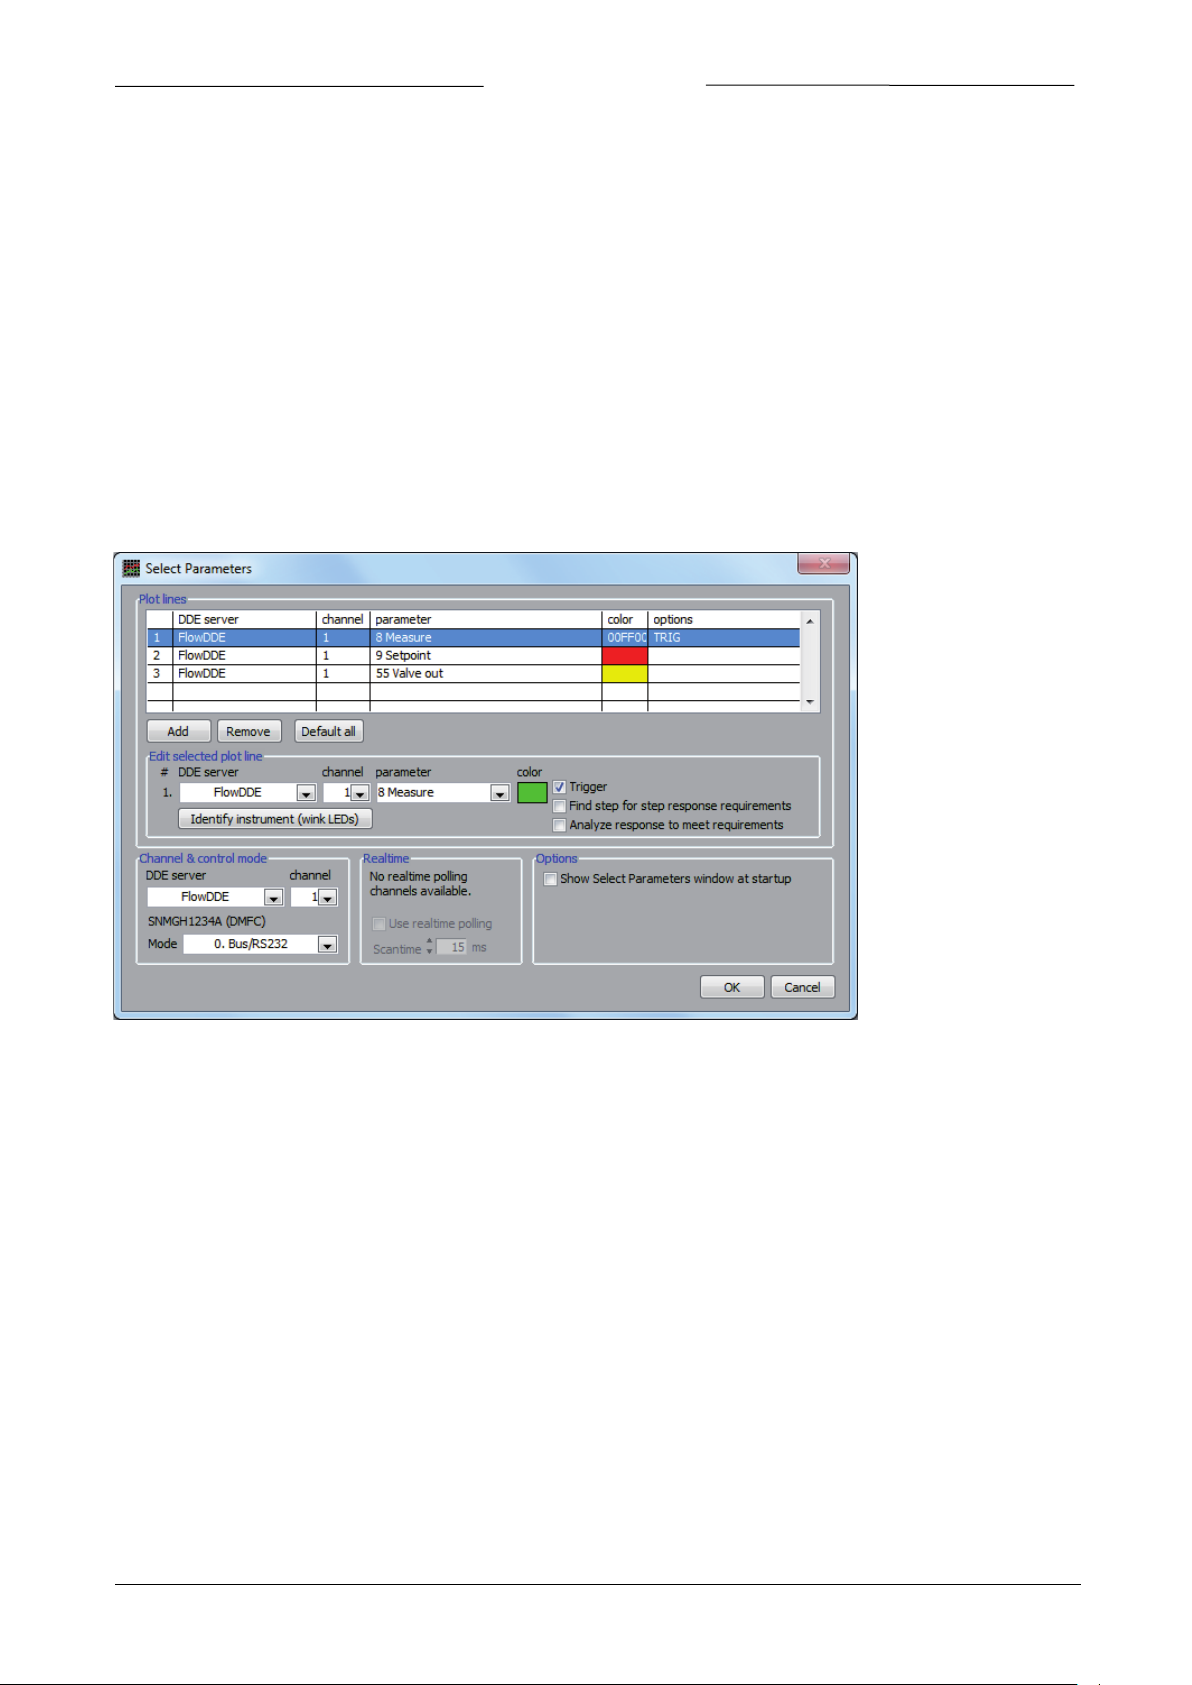
2.1.1 Connect plot lines
The upper part of the Select Parameters window is used to set the connection of a plot line to a parameter of a
channel. A channel is a DDE-channel, assigned by the FlowDDE server to each instrument or readout unit on the
FLOW-BUS system. When a single instrument is connected, only one channel is available.
To identify an instrument, it is possible to view the FLOW-BUS configuration in FlowDDE (FLOW-BUS >> Configuration,
or on the keyboard F5). This gives an overview of the assigned channels, node addresses, processes and identification
of the instruments. Once selected in FlowPlot, the selection can be verified by pressing the Identify instrument (wink
LEDs) button, after which the instruments LEDs will wink for a few seconds.
To set the desired DDE server, channel, parameter and color of a plot line, click the plot line in the table and change
its properties in the Edit selected plot line frame below the table. For one plot line, the trigger feature can be used. To
use the selected plot for this, check Trigger, after which TRIG appears in de options field of the selected plot line. See
2.4.2 for more information about the trigger feature.
It is possible to Add an additional plot or to Remove the selected plot. Default all will set the three default plot
parameters. The colors will not be affected by the Default all action.
2.1.2 Channel & control mode
The setpoint buttons in the main window are connected to the instrument, from which the channel is selected in this
frame. An instrument or readout unit will only respond to a setpoint when the control mode of the instrument is at a
value that will allow it to receive setpoints. Common suitable control modes are set out in the table below.
Page 5 FlowPlot 9.17.030
Page 6

BRONKHORST®
Device
Control mode
Description
Situation
Digital meter
0 – Bus/RS232
Setpoint via bus or RS232
At normal communication with
fieldbus.
18 – RS232
Setpoint via bus or RS232, neglecting safe
state (for multibus instruments)
When no communicaton with
fieldbus, but only via RS232
Readout unit
0 – Bus/RS232
Setpoint via bus or RS232
At normal communication with
fieldbus.
11 – Keyboard &
FLOW-BUS
Setpoint via E-7000 keyboard, bus or
RS232
At normal communication with
fieldbus.
Using FlowDDE and FlowDDE2 simultaneously and at least one of them is using realtime measurement,
from different DDE servers is advised to be used non-realtime only. FlowPlot will warn the user for this.
or controller
(E-7000)
Control mode 1 – Analog input means setpoint from analog input is active.
More detailed information about control modes can be found in document no. 9.17.023.
2.1.3 Realtime measurement
Realtime measurement will be only available in combination with the RS232/FLOW-BUS hardware interface. This
interface contains buffers and several extra processes for high speed data acquisition. When using realtime
measurement, up to four special processes in the interface will be programmed by FlowPlot. All data for the selected
parameters connected to a plot line will be collected by means of this interface. The interface collects the data and
adds time stamp information to it. While the PC may be temporarily busy, the interface will continue collecting data
and it will be less likely to miss important data. The graph may lag a little, but will contain more accurate information.
FlowPlot will detect automatically if this interface is connected and if realtime facilities can be used. Realtime
measurement is not available when a multibus instrument, connected via RS232, acts as the interface to the PC.
It is possible to disable realtime measurement manually. When realtime measurement is not available, the selection
box will be grayed and cannot be checked.
The Scantime can be changed in FlowPlot to set the sample time for data acquiring by the realtime processes in the
interface. This scantime is determined automatically based on the realtime poll time in FlowDDE and in most cases it is
not required to change it.
several timing issues may result in incorrectly synchronized plots for the different DDE servers. Plotting
Additional information about poll times in FlowDDE and FlowPlot
The FlowDDE poll time is the default sample time for non-realtime processes, i.e. all normal polling actions. FlowDDE
will read the actual values from the instrument. Besides this, the poll time has influence on the speed FlowDDE (and
thus FlowPlot) sends setpoints and reads instrument parameter settings. Preferably don’t set this value too high (max.
500 ms). On the other hand, a value too low may slow down the overall bus system performance because too much
data is sent or requested via the bus.
The default poll time is 100 ms and is quite well for bus systems consisting of several instruments. For very small bus
systems (up to five instruments), the FlowDDE poll time can be set lower (to e.g. 75 ms or 50 ms) without slowing
down the bus system or the PC too much. For a single instrument connected via the RS232 interface on the
instrument, the poll time can be set even lower (to e.g. 25 ms) to achieve fast measurements.
In non-realtime mode FlowPlot will ask FlowDDE for actual values at the same interval as the poll time, unless the
sample time is manually set in FlowPlot. The Data acquisition time in the Options window determines how fast
FlowPlot samples values from FlowDDE (which is independent of the poll time in FlowDDE). In automatic mode, this
will be equal to the FlowDDE poll time.
The realtime poll time in FlowDDE is the sample time for FlowDDE to sample the realtime processes in the FLOWBUS/RS232 interface. It determines how often FlowDDE ‘looks’ into the interface to see if there are new samples. For
this, it is required that the interface has already read a value out of the instrument. Therefore it is needed that the
scantime in the interface module is at least equal, but better, lower than the realtime poll time in FlowDDE. Otherwise
the interface will frequently return no data. FlowPlot has an indicator Invalid data which will be lit in this case. If this
indicator is lit often, it is advised to change the settings for realtime poll time and scantime (i.e. higher the realtime
poll time or lower the scantime).
Page 6 FlowPlot 9.17.030
Page 7
BRONKHORST®
Setting
Short, fast measurement (<=600 s)
Long, slow measurement (>600 s)
Fast changes visible
Fast changes not visible
FlowDDE Poll time
100 ms (or lower for small systems)
100 ms
FlowDDE Realtime poll time
25 ms
25 ms
Scantime
15 ms
15 ms
Data acquistion time
auto
500 ms
Graph update time
200 ms (or lower on fast PCs)
500 ms
The poll times described here are not exact sample times. Therefore, the sample rate is not constant.
processing functions require a constant sample rate.
In realtime mode FlowPlot will ask FlowDDE for actual values at the same interval as the realtime poll time, unless the
sample time is manually set in FlowPlot. By default, the realtime poll time in FlowDDE is 25 ms and normally should
not be changed.
The Graph update time in the Options window in FlowPlot indicates how often FlowPlot will update the graph. Default
this is set to 200 ms, but on fast PCs it may be set lower for smoother plotting.
It is not necessarily true that FlowDDE will poll for new values exactly once per poll time. Also, the timestamp information from the interface will contain a millisecond value at which the data reached it.
For data acquisition and signal processing this is not an ideal situation, since most standard signal
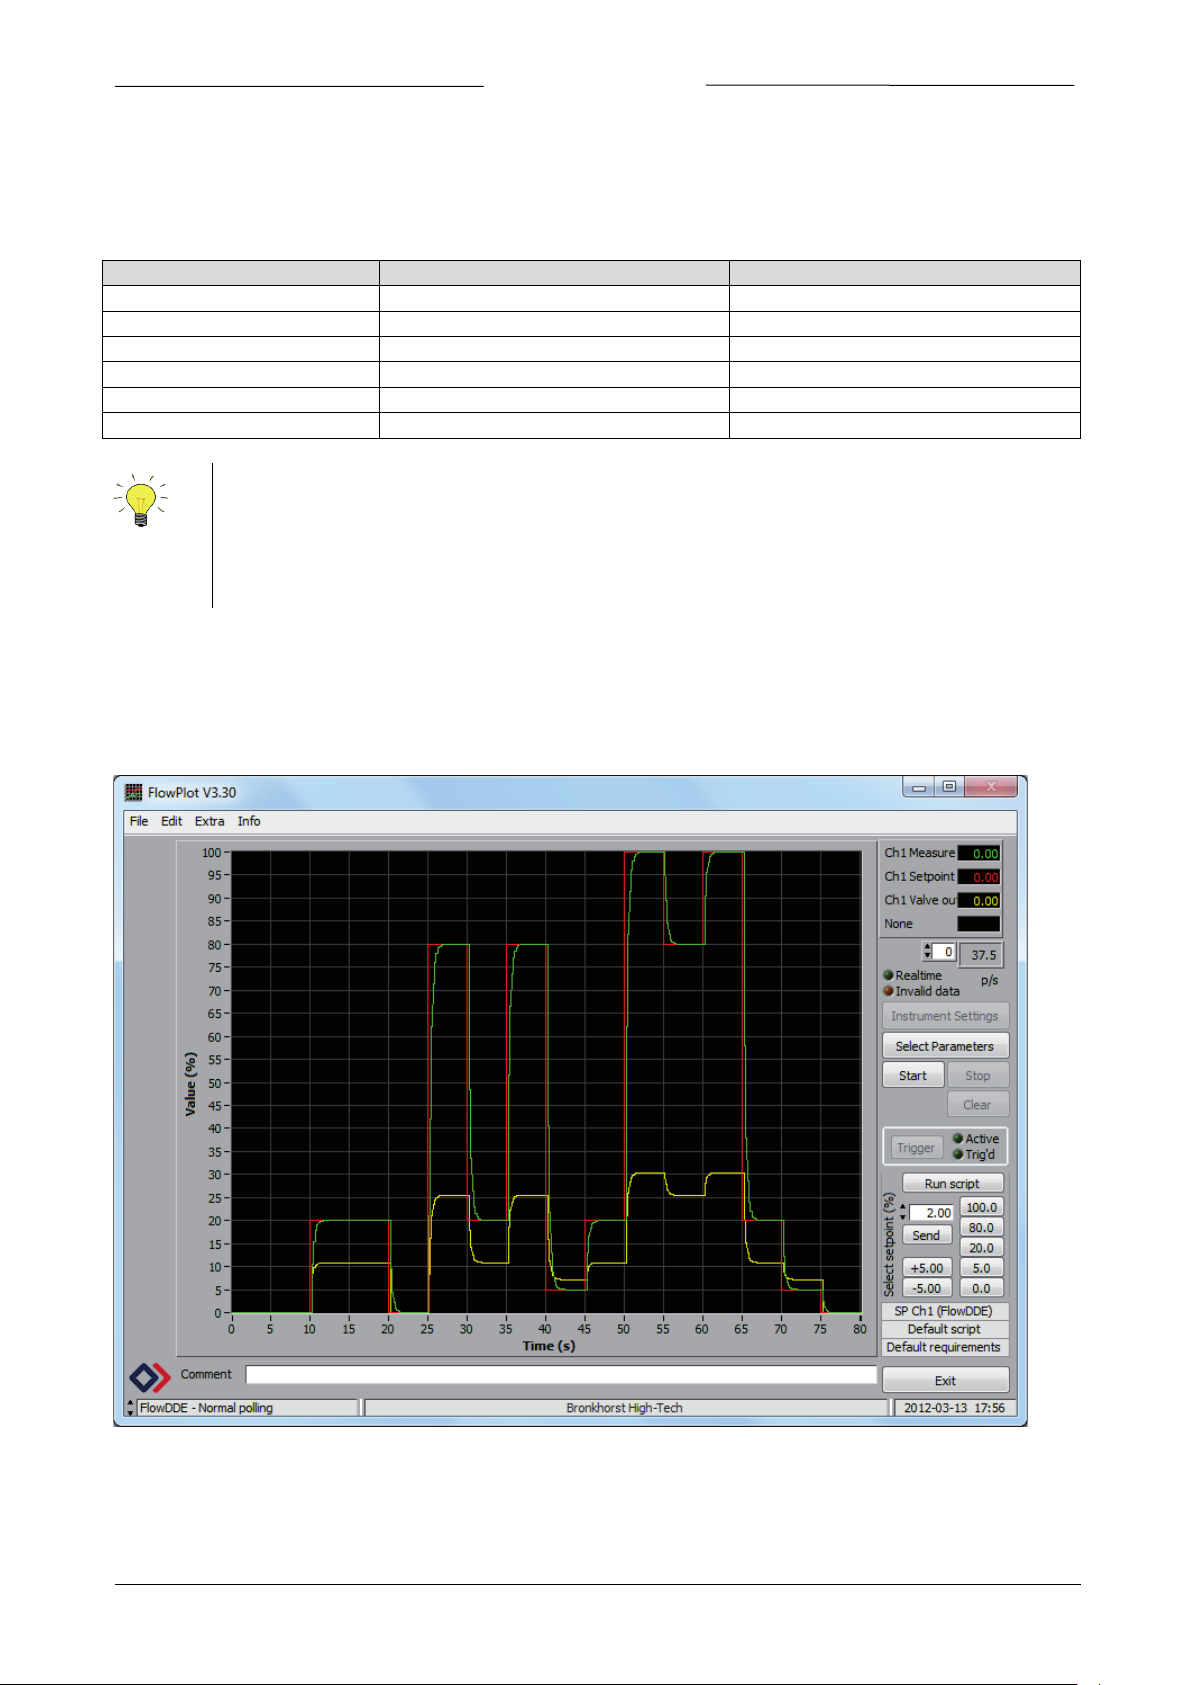
2.2 MAIN WINDOW
The main window is divided into several areas. The graph with all plots is presented in the largest. To the right of the
graph, below the legend, most controls are located.
2.2.1 Basic controls
Three controls are used to control the plot. Start will start acquiring data and plotting the graph and Stop will stop it.
Clear will clear the graph and remove the actual plot lines, but plotting continues from 0.
Page 7 FlowPlot 9.17.030
Page 8

BRONKHORST®
The setpoint is the desired value for an instrument or readout unit. 100% will normally be the nominal calibrated
value. The buttons at Select setpoint enable five fixed-value setpoints and two delta-setpoint commands. The setpoint
values are sent to the instrument at the setpoint channel, as indicated in the upper text line below the buttons. The
fixed-value setpoints will set the setpoint for the instrument to that value, whereas the delta-setpoints (default +5%
and -5%) will increase or decrease the actual setpoint. The values of the buttons can be programmed in the Options
window.
Pressing the Run script button will start the currently loaded setpoint script selected at the Setpointscript window.
The script name is indicated in the second text line below the setpoint buttons.
To be able to zoom in the graph, it is possible to enable slidebars near the X- and Y-axis. When the time-slidebar is not
visible, a text line below the graph will allow the user to add a Comment to the graph before printing it. More details
about changing to the X- and Y-axes (time and signal level) will be described in 2.4 ‘Options’.
In the status bar at the bottom of the window, the current FlowDDE server and its status is displayed, a message line,
and the current date and time.
Exit will stop and unload the program. All open realtime measurements will be closed.
2.2.2 Advanced controls
Left-clicking a description on the legend, at the upper right, will pop up facilities to change the color or type of the plot
lines (e.g. dashed line, sample-points in the lines).
The text box right below this legend gives an indication per plot line how many samples per second are put into the
graph. The up/down control in front of it allows to view the points per second indication of other plots. 0 will
correspond to the first plot, 1 to the second, and so on.
Realtime is an indicator that will be lit if realtime measurement is used. The Invalid data indicator blinks when
samples are missed (so called ‘No events’). See 2.1.3 ‘Realtime measurement’ for more details about this.
Trigger will set the program sharp to the value where it has been programmed to trigger on. More details about this in
2.4.2 ‘Trigger’. The indicator Active will be lit if the trigger is enabled and Trig’d will be lit if the trigger condition has
been met and the trigger delay is counting down.
Instrument Settings will open a window with several actual settings for an instrument. The user may change one or
more settings and watch the effects performing setpoint steps. See 2.6 ‘Instrument Settings’ for more details.
Select Parameters will call the Select Parameters window, as described in 2.1 ‘Select Parameters’.
From the menu, Print file and Print printer will allow the user to make a hardcopy of the last graph, either directly to a
printer or to a file printer to allow further processing, e.g. PDF-conversion. See 2.5 ‘Printing’ for more details.
2.3 SCRIPT
Scripts are sequences of setpoint values, which can be sent to the instrument. They can be entered manually or can be
read from a file with extension ‘.fps’. These scripts can be used to test the dynamic behavior of an instrument in a
reproducable way. For each type of controller (or process condition) a dedicated setpoint script can be made by
editing the channel, setpoint or duration per step and store the script to a file.
The Setpointscript window can be opened from the main windows menu Extra >> Script.
Page 8 FlowPlot 9.17.030
Page 9

BRONKHORST®
In the channel box, the value ‘0’ can be set to let FlowPlot use the setpoint channel. The current setpoint channel is
presented at the top of the window. The amount of repeats for this script can be adjusted, which can be set to infinite
by entering ‘0’.
The Script window will always show five setpoint steps at a time. When Scroll is used, it is possible to go to
next/previous steps for editing. Entering ‘0’ for the duration, the channel and the setpoint value, will be interpreted as
the end of the script. All script entries after the first ‘0’, ‘0’, ‘0’ will be ignored and will not be saved or executed. Clear
clears the script, while Default sets the script to the default script, as set in the Options window.
Optionally, After script is stopped, send setpoint 0% can be checked to send the ‘safe’ setpoint of 0% after the script
has finished, without showing this in the plot.
Load and Save can be used to load from and save the script to a file.
The script functionality is not suited for process control!
2.4 OPTIONS
The Options window can be reached by the menu Extra >> Options in the main window.
2.4.1 Plot settings
At Time-axis the Total history (time) and the Visible
history (time) can be set. The total history is the total
time of which the collected data will be kept in
memory. The visible history is the time which is
visible when plotting is in progress. After plotting has
been stopped and the time slidebar is enabled, it is
possible to make the samples visible for as long as
the total history.
As mentioned, the Time slidebar can be enabled or
disabled to be visible at the main window below the
axis to zoom-in/out on the signal.
At Y-axis the upper and lower limit of this axis can be
set. Also the Y slidebar can be enabled or disabled to
be visible at the main window near the axis to zoom in/out on the signal.
Page 9 FlowPlot 9.17.030
Page 10

BRONKHORST®
At Mode, the way the graph behaves when the plot reaches the ‘end’ of the time axis, can be selected:
- Scroll: plot lines will be drawn from left to right. As soon as the end of the visible time axis has been
reached, the plot lines will shift to the left, so the first samples will disappear from the screen.
- Jump visible: plot lines will be drawn from left to right. As soon as the end of the visible time axis has
been reached, the plot will jump plotting continues from the left.
- Once: plot lines will be drawn from left to right only once. As soon as the end of the total history time
axis has been reached, the plot will stop.
At Colors the color for the Background and Gridlines can be selected.
At Setpoints the values of the setpoints and delta-setpoint selections which can be given manually at the main
window can be adjusted. By clicking Default, the default values will be restored, meaning 100, 80, 20, 5 and 0% for the
fixed setpoints and 5% and -5% for the delta-setpoints.
At Timing settings the Data acquisition interval time can be set, which determines how fast FlowPlot samples values
from DDE. In automatic mode, this will be equal to the FlowDDE poll time, which is recommended in most cases.
The Graph update time is the time which FlowPlot uses to refresh the graph on the screen. If this time is set to a high
value (e.g. 2000 ms), the graph will be refreshed every 2 seconds and several samples will be added per update. In this
case the PC has more CPU time to read samples from the instrument(s), which will result in a higher sample rate. If
this time is set to a low value (e.g. 10 ms), the graph will be updated very often and plotting will look very smooth.
Disadvantage is that there is less time left to read from the instrument(s) because the PC will be busy drawing the
graph on the screen. This will result in a lower
sample rate. By default the graph refresh time is set
to 200 ms.
2.4.2 Trigger
FlowPlot allows stopping the plot after a certain
value or value change has been reached. Several
settings can be made for this.
At Trigger settings the desired plot can be selected to
detect the trigger. The Post trigger delay is the time
after which plotting stops when triggered. The
trigger level is the level at which triggering occurs.
This can be a Signal change or a Signal value.
2.4.3 File locations
Several folders and files can be set to determine
where FlowPlot saves and loads files:
- Personal folder: this is the initial folder
presented for opening and saving files,
e.g. saving controller settings and
setpoint scripts. Default this will be the
My Documents folder.
- Setpointscript folder: this is the initial
folder presented for opening setpoint
scripts.
- Controller settings folder: this is the
initial folder presented for opening
controller settings.
- Plotdata spreadsheet file: the plotdata
can be stored in a spreadsheet file set
here. The checkbox at Options will allow
the user to enable or disabled the spreadsheet logging.
- Default setpointscript file: the default setpoint script will be loaded at startup and can be loaded from
the Setpointscript window.
Page 10 FlowPlot 9.17.030
Page 11
BRONKHORST®
2.5 PRINTING
Printing a hardcopy of the graphs can be very useful to store the measurements. All graphs will be send to printer or
file in a fixed color setting for background, gridlines and plot lines.
In preparation for printing not directly to a printer, but printing to a file printer (e.g. a PDF-converter), FlowPlot
contains two menu options for printing:
- Print printer: meant to let the user select a printer manually from the Windows printer list.
- Print file: a printer from the Windows printer list can be preselected (chosen without user action) as a
file printer by means of editing a flowplot.ini file. This may be a non-file printer as well.
Actually, both printers can be preselected, also the one meant to let the user select a printer manually from the
Windows printer list. Therefore, edit the flowplot.ini file in the roaming user profile folder (C:\Documents and
settings\<username>\Application Data\Bronkhorst\FlowPlot) and add the following:
[Printing]
FilePrinter=<printer name file printer>
Printer=<printer name paper printer>
If one or both of the entries is/are not available or incorrectly set, the Select Printer window will pop up and the user
may select a printer manually.
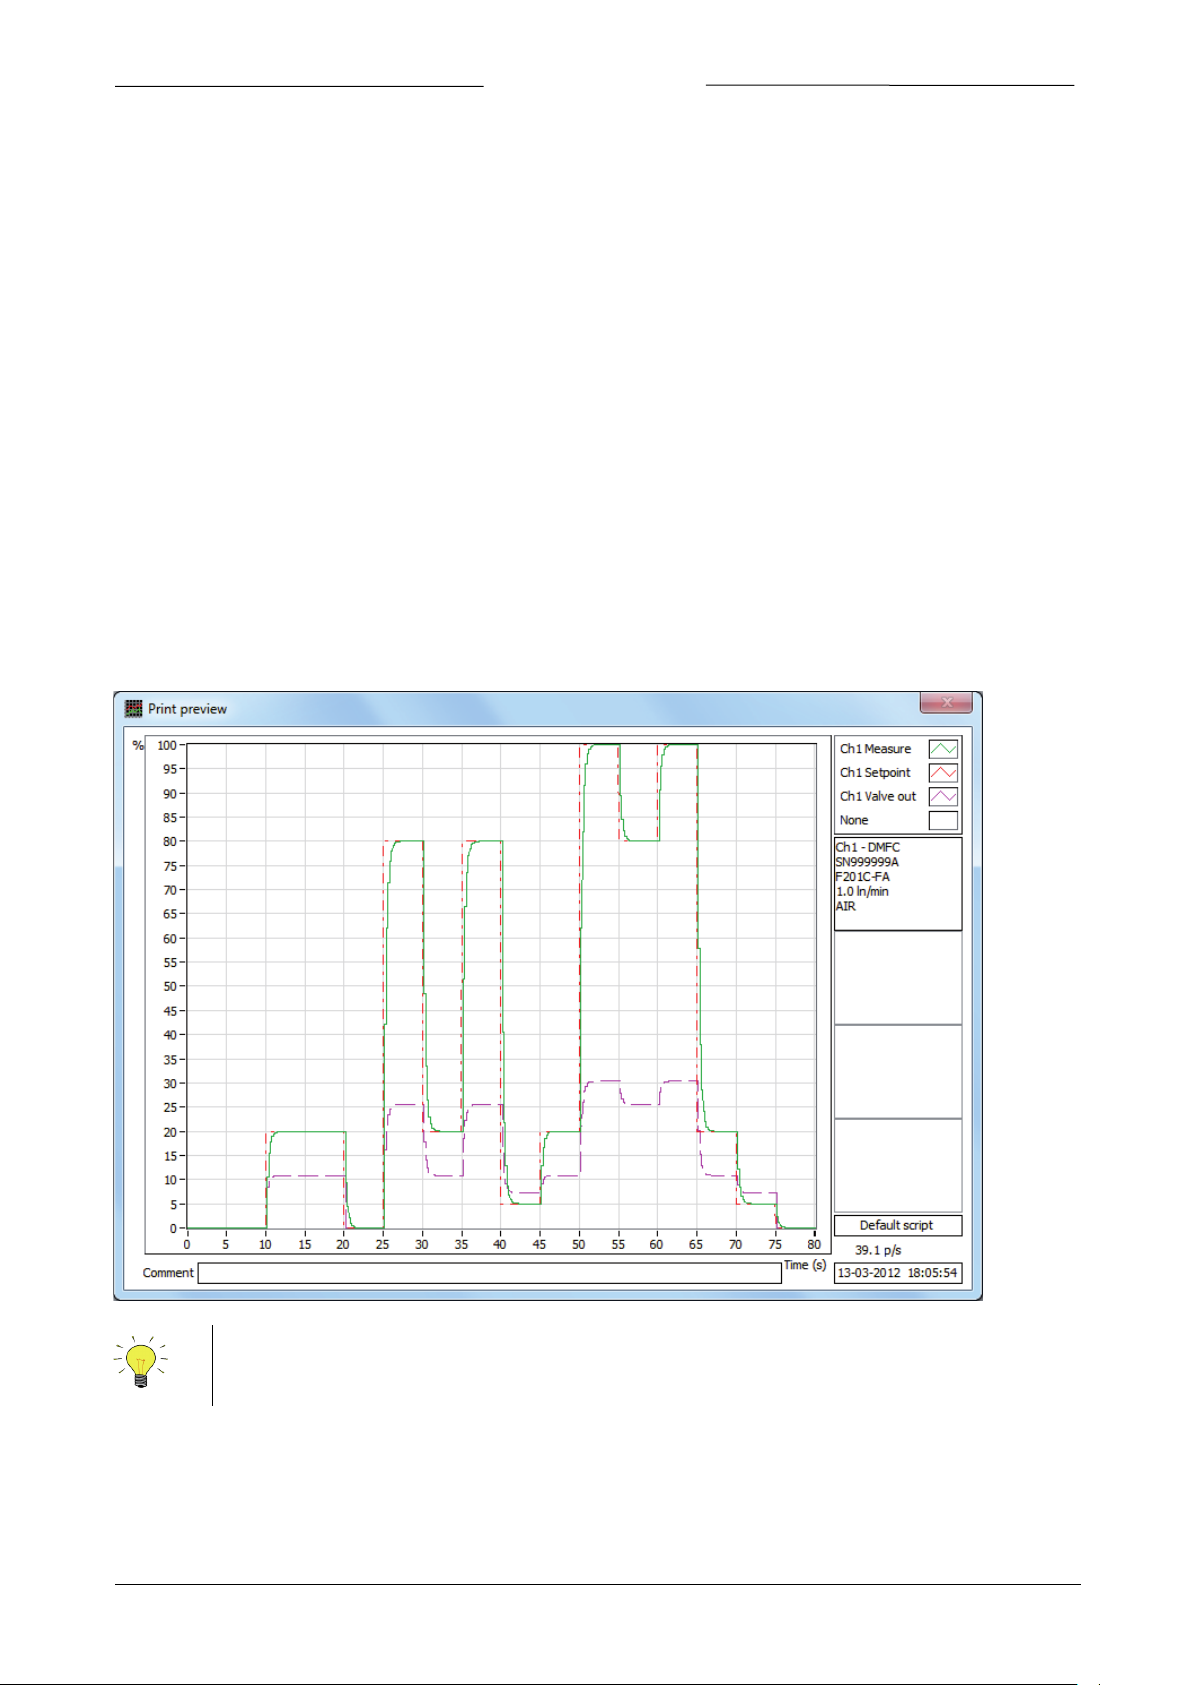
Prior to printing, FlowPlot will show a preview. First, FlowPlot will read several identification parameters of the
instrument(s) connected. Information about up to four instruments or readout units will be shown.
Before pressing any print button, the user may add comment to the graph using the Comment field in the main
window.
FlowPlot doesn’t contain a PDF-converter. Conversion to PDF should be performed by other software.
Page 11 FlowPlot 9.17.030
Page 12

BRONKHORST®
Control mode
Description
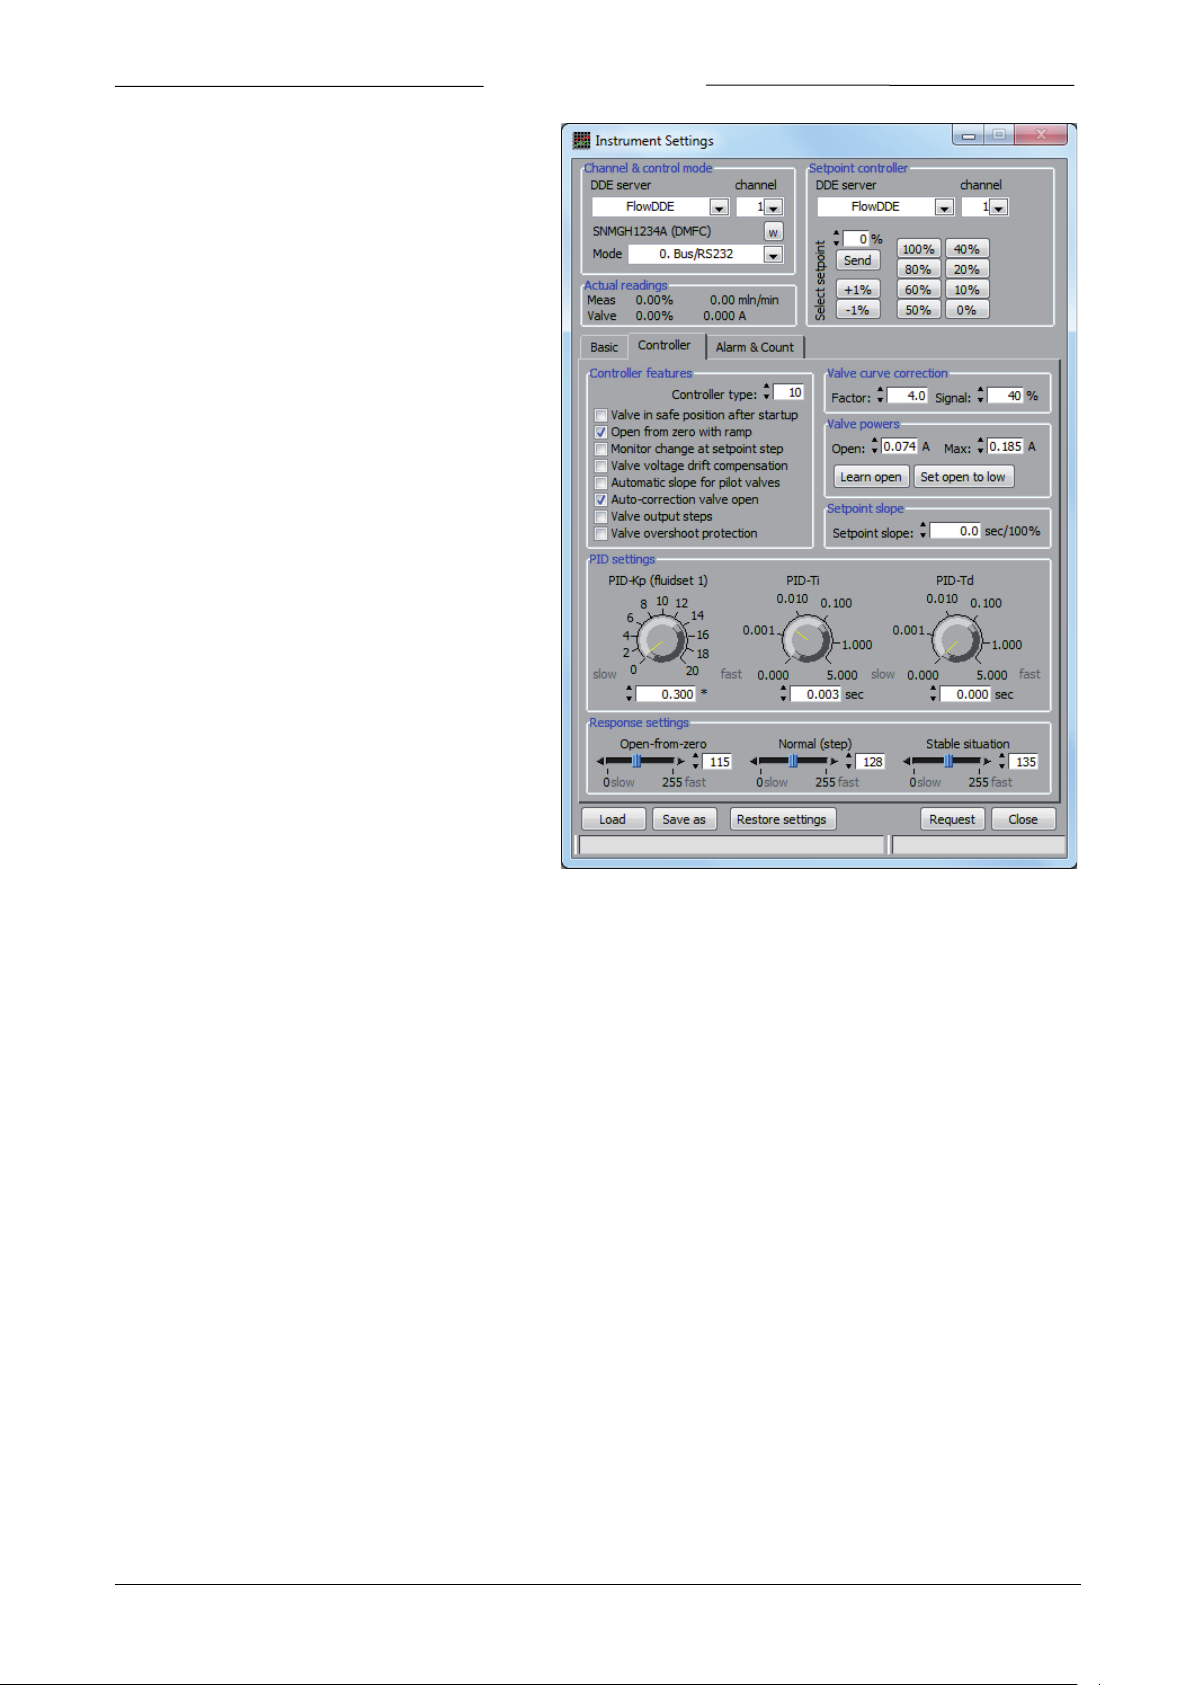
2.6 INSTRUMENT SETTINGS
2.6.1 General description
This window allows the user to read and change
several settings of digital meters and controllers.
Changing these parameters will need special
knowledge about the instruments and the behavior
of the instruments. This document may not be
enough to optimize an instrument. Bronkhorst HighTech B.V. offers special trainings for field users for
this. Please ask your local representative about this.
From the moment the window appears, it will take a
few seconds to read all the actual parameter values
and update the screen. After that, changing a setting
will immediately send the change to the instrument
and the effect of the change can be viewed in the
plot window.
At Channel & control mode the Instrument Settings
window can be connected to the desired
instrument. Also the needed control mode can be
selected. See 2.6.3 ‘Channel & control mode’ for
more details.
Close will close this window and leave the settings
as shown.
Request will force a read out of the settings from
the instrument.
Restore factory settings will get back all settings for
the instrument from the moment a backup of these
settings has been made. Normally this will be at the
final test in the factory before the instrument will be transported. This option is very useful for those who made things
worse instead of better and can be seen as a fast way out. Pressing Yes will restore all instrument settings to settings
from the moment of last backup. Pressing No will result in no further action.
2.6.2 Saving and loading sensor and controller settings
The Save as button will allow the user to save the controller settings to a controller settings file (.fpc). A browse
window is opened to select the file or to type in a new filename.
Load will allow the user to load a controller settings file (.fpc). After the file has been loaded, the settings will be
shown on screen in which the user may decide to accept the new settings and send them to the instrument by
pressing Accept, or decide to keep the original instrument settings by pressing Decline. In the latter case, the loaded
settings will be ignored and no instrument settings are changed. The Instrument Settings window will show the actual
instrument settings after one of the options is chosen.
2.6.3 Channel & control mode
This field contains the DDE server, the channel, the serial number and the control mode and is needed to connect the
screen to an actual instrument. Select the desired instrument by the correct DDE server and channel number. If the
channel number of the instrument is unknown, the configuration window of FlowDDE (FLOW-BUS >> Configuration or
pressing F5 on the keyboard) gives an overview of all connected instruments. Each instrument will be identified by a
unique serial number, which is also displayed in the Instrument Settings window for the actual instrument. The control
Mode can be used to force the controller of the instrument to respond in the selected mode. The most important
control modes are given in the table below.
Page 12 FlowPlot 9.17.030
Page 13

BRONKHORST®
0 – Bus/RS232
Digital setpoint via fieldbus or RS232
1 – Analog input
Setpoint via analog input
3 – Valve fully closed
Valve fully closed and stays closed under all circumstances
8 – Valve fully open
Valve fully opened (purge) and stays opened under all circumstances
11 – Keyboard & FLOW-BUS
Setpoint via E-7000 keyboard, bus or RS232
18 – RS232
Digital setpoint via RS232 neglecting safe state (valve action when no fieldbus
communication present)
For convenience the actual readings of Measure and Valve out of the instrument are shown in percent of maximum
calibrated value and in direct reading.
More detailed information about control modes can be found in document no. 9.17.023.
2.6.4 Setpoint controller
At the Setpoint controller field FlowPlot enables the user to send setpoints to another instrument than the instrument
selected at Channel & Control mode. This can be useful when the connected instrument is not a controller, but a
meter only. It is also possible that this separate controller is connected via another instance of FlowDDE (FlowDDE2 or
vice-versa). The combo box at DDE server will be enabled as soon as FlowPlot determines that there are two FlowDDE
servers running.
Using channel enables the user to connect to a channel of the DDE server. Use the configuration window of the
specific FlowDDE to determine on which channel the instrument can be reached.
At Select setpoint several setpoint steps can be given as a help for taking points for calibration. The setpoints are the
setpoints normally used by Bronkhorst High-Tech to obtain a calibration curve. Eventually use -1% or +1% buttons to
adjust the setpoints.
2.6.5 Basic settings
The Basic tab of the Instrument Settings window is shown in 2.6.1 on page 12.
Identification
The Identification frame is used to display some of the identification properties of the instrument. The Serial number
is a unique number assigned to every instrument. In addition to the serial number, a Service number is assigned to an
instrument which has been serviced by Bronkhorst. Instruments that did not return for service, mostly have this
number set to 000000.
The Model number and the Customer model show the name of the series of the instrument.
The instrument can also be identified by a customizable Usertag, which can be used to easily recognize the
instrument.
Fluid settings
This frame shows which of the eight fluidsets an instrument can contain, is currently active. At Active fluidset the
active fluidset can be easily changed. From the active fluidset, the capacity, the unit, the fluid name and the Controller
speed are shown. The Controller speed slider can be used to adjust the controller speed (it adjusts the controller
gain). The default value is 1.
Output filter
By means of a Dynamic and a Static display factor, the filter for the measured signal going out to either fieldbus or
analog output can be adjusted. The used filter can be influenced by means of a floating point value between 0 and 1.
When the value is 0, the filter is filtering maximal and will not pass any signal change at the input to the output. When
the value is 1, filtering is minimal and the output will be equal to the input signal.
The filter switches to the dynamic factor at large changes of the sensor signal (e.g. sudden pressure or setpoint
changes), while the static factor is used when sensor signal is stable (small signal changes during over time). This
behavior can offer a low-noise sensor signal to the display/output with a relatively low lag in time compared to the
real flow (or other signal). Some advised values are given in the table below.
Page 13 FlowPlot 9.17.030
Page 14

BRONKHORST®
Factor
Responses >= 2 seconds
Responses < 2 seconds
Dynamic display factor
1.00E-3
3.00E-3
Static display factor
1.00E-2
2.00E-2
Factor
Slow responses
Normal resp.
Fast reponses
Very fast resp.
Exponential smoothing
0.05
0.1
0.2
0.5 to 1.0 (not advised)
Valve type
Advised factor
Advised signal
001
1.0 1 002
5.0
30
003
5.0
30
004
4.0
50
Sensor filter
The Exponential smoothing factor is used to filter the signal from the sensor circuitry before it is further processed.
For EL-FLOW types of instruments, this will be the ‘slow’ (not-differentiated), non-linearized sensor signal. Only in case
of much noise on the sensor signal, filtering needs to be enabled and another value than 1.0 should be used. It is
advised to keep this value above 0.8, so the sensor response is not slowed down to much. The default setting of 1.0
will do in most circumstances. For CORI-FLOW instruments, the table below shows some advised values.
Sensor zero
Pressing Auto zero will perform an automatic zero action at the sensor bridge circuitry. It will adjust the potmeter
and/or zero scale factor setting to ensure the sensor output is zero at no flow. Before using this action, make sure
instrument has warmed-up for at least 30 minutes and that there has been, and is, no flow.
2.6.6 Controller settings
Valve curve correction
The valve curve correction is an extra amplification of the signal to the valve in a certain area. The valve curve
correction can be used to neutralize the influence of the valve non-linearity on the controller response. Especially pilot
valves respond slowly on low level setpoint steps, e.g. 5% to 10%, and fast on e.g. 80% to 100%.
The curve correction consists of two values: Factor and Signal. The first is the correction factor for speeding-up the
controller output. The second value is the percentage of sensor signal where this factor turns to one. The speed-up
factor will turn from the correction factor to one as function of a second grade polynomial, which is an approximation
of the valve curve.
The curve correction may also be used to speed-up the controller when opening from zero (e.g. for F-201C
instruments). The valve curve correction will influence the output of the controller. The curve correction will linearize
the controller output until the percentage where amplification becomes (almost) constant (for larger percentages the
correction factor is one (no correction)). Factor/ratio between low and high amplification can be filled in. The values
can be entered directly. The curve correction can be disabled entering the values 1.0 and 1.
PID settings
PID-Kp, PID-Ti and PID-Td can be used to adjust the controller speed. Set PID-Kp to a fixed value (e.g. 1 or 10), then
adjust PID-Ti until controller is fast without overshoot. Finally, increase PID-Kp until the controller is fastest without
overshoot. Advised setpoint step for tuning is 20%-80%-20%-80%, etc.
Page 14 FlowPlot 9.17.030
Page 15
BRONKHORST®
PID-Td is only used if the volume between the
sensor and valve is relatively large (e.g. when the
sensor and valve are mounted away from each
other).
Settings may be changed by means of
potentiometers between (common) minimum and
maximum values. It is also possible to enter value in
the text box directly, even out of the minimummaximum range.
Response settings
The valve output at setpoint steps from zero will go
through several stages:
- Setpoint is zero: no action.
- Setpoint larger than zero and measure
is still zero: the first step of the valve
output is the Valve open
voltage/current minus a safety margin
or valve output via a ramp or via PID
controller until the measure is above
2%. The initial action depends on the
controller features setting.
- Measure differs more than 2% from
setpoint: normal situation, PID
controller is normally active.
- Measure differs less than 2% from
setpoint for a short time: stable
situation for controller.
The last two stages are valid for all other setpoint
steps as well.
The response settings influence the controller gain by a factor depending on the stage the controller is in. The extra
factor influences the controller gain as follows, in which a setting of 128 has no effect:
total controller gain = Controller speed * PID-Kp * 1.05
(response setting – 128)
Response settings, three different stages:
- Open from zero will influence the PID controller speed or ramp size (depends on controller features
setting) when valve is opening from 0%. Its advised value is lower than 128 to prevent overshoot. It’s
value also depends on the used valve curve correction.
- Normal (step) is used at each setpoint step larger than 2%, not coming from 0%. Actually the measure
differs more than 2% from the setpoint in this situation. Its value should always be 128. Use this function
only in special cases; preferably adjust the PID-Kp value (factory) or the controller speed (customer) value
to adjust the overall controller speed.
- Stable situation is when the measure differs less than 2% from the setpoint for a short time. Depending
on the situation, the value can be a bit higher or lower than 128, but should usually be between 118 and
138.
Valve powers
The value in the textbox Open is the voltage or current the valve output will get immediately after a setpoint step has
been given when actual setpoint was 0% (first step). From that point on, the valve output will be increased by a ramp
function or by the PID-controller. For current controlled instruments, the values in amperes will be the correct value,
whereas for values in volts (DC) it is only an approximation.
The button Set to low will set the Open value to a safe low voltage or current. For current-driven NC valves, this will
be 0.040 A, and for voltage-driven valves it depends on the maximum supply voltage to the valve:
- 2.5 V in case of a 15 V NC valve.
- 4.0 V in case of a 24 V NC valve.
Page 15 FlowPlot 9.17.030
Page 16

BRONKHORST®
When using the buttons in this window automatic correction (learning) of valve open at controller
opens.
The actual valve open voltage or current may be determined automatically once by pressing the button Learn and
store. A setpoint step will be needed for this, so be sure to supply the correct pressure to the instrument before doing
this.
The maximum valve current can be changed in the Max box. The valve current will not exceed this value. Setting the
maximum valve current too low may result in the controller not to reach its maximum setpoint, however in this case
the valve heats a lot in case of zero pre-pressure. For current-driven instruments, the default value is 0.200 A.
features should be switched off, otherwise the valve open power is overwritten the next time the valve
Controller features
Several options of the controlling algorithm can be switched on or off to obtain certain behavior. Safety and
controlling speed can be adjusted for certain events. Most options are used to make difference between fast and
slower control when opening the valve from zero. These settings go together with the valve Open voltage or current
and the Open from zero response setting.
Valve in safe position after startup means that the valve output will start at 0 the first time the instrument powers
up. This will prevent a possible first overshoot, but will take more time to open the valve.
Open from zero with ramp function will ramp up the valve output from 0 until the valve opens, instead of using the
PID-output.
In both situations the response setting for open-from-zero will influence how fast the valve output will increase from
first step until point of opening.
Monitor change at setpoint step will switch off the display filter for the measure signal during a setpoint step. Though
filter settings can be already fine-tuned to give a stable signal and a fast response, sometimes it may be useful to
switch it off temporarily. It should only be used if the measured value lags the real flow/pressure too much. When
switched on, the measured value will be equal to unfiltered fast sensor value at a setpoint step until controller is in
stable situation (i.e. the measure differs less than 2% from setpoint for some time). Then, the measured value will
become normally filtered again. Advantage of this is a very fast signal at the output measure signal (the signal which is
used for the PID-controller). Disadvantage is high level of measure noise during setpoint steps.
Valve voltage drift compensation will take into account the change in open voltage due to warming-up and coolingdown of the valve coil. It will correct voltage drift in time for better approximation of the open point. This feature was
removed from instruments that are able to current-drive the valve (i.e. MBC2 and later).
Automatic slope for pilot valves can be used for pilot valves (e.g. types 033, 002AC, 003AC/BC) in combination with a
setpoint slope. Setpoint slope with a value of at least one second is able to improve behavior of these valves regarding
overshoots. However, this setpoint slope setting will mainly have influence when the main valve opens for the first
time. Automatic slope is able to detect when this valve opens and will use the setpoint slope only then when really
necessary. This option is to be used in combination with the Setpoint slope. The setpoint slope is defined as the
(ramp) time a setpoint will need to go from 0 to 100%. See also ‘Setpoint slope’ below.
If Auto-correction valve open is enabled, the valve open power will be determined automatically each time the valve
opens. This value (minus a safety margin) will be used by the controller next time to open the valve as fast as possible.
After an eventual overshoot the first time, the next open from zero voltage will be corrected in stable situation. Using
this option should be considered carefully. Automatic correction of the valve open voltage will always be an
approximation. Under circumstances overshoots may occur. For example when a valve coil is heated-up (after several
working hours) and valve open power will be detected at a new setpoint step coming from zero, this value will be
stored. This is fine when the valve should be opened immediately afterwards, but when the valve will be closed for a
long time before a setpoint is given, the last detected value for opening the valve may be too high, and an overshoot
may occur. Using Valve in safe position after startup builds in safety here, but only after a power-up.
When no overshoots at all are allowed, it is advised to set the valve Open by Set to low or Learn and store (determine
once right after power-up when the valve is still cool). Then, the valve will start opening from a safe value, but the
controller will need more time to open it.
Page 16 FlowPlot 9.17.030
Page 17

BRONKHORST®
Valve output steps is a special feature and will set the instrument into a mode in which from the last two setpoints
the valve output values will be stored. Sending one of these setpoints to the instrument will immediately result in
setting the valve to the stored output value, than the PID-controller will take over. This option is for very special
applications only. This option is not to be used with pilot-valves because of hysteresis!
Valve overshoot protection will prevent the valve from overshooting, but still open from zero quite fast.
Setpoint slope
Smooth setpoint control can be established using the Setpoint slope. The setpoint will be linearly increased over time
from the old setpoint value to the new setpoint value. A value between 0 and 3000 seconds, with a resolution of 0.1
seconds, can be given to set the time for the integrator on the setpoint signal.
The setpoint will reach its end value after this many seconds:
0.01 * setpoint slope * | new setpoint – old setpoint |
Example: when the setpoint slope is 10 seconds, how long will it take to go from setpoint 20% to 80%?
0.01 * 10 * | 80 – 20 | = 6 seconds
Apart from the normal application purposes, the setpoint slope appeared to be very useful for the internal (software)
controlling mechanism of steering pilot operated valves (e.g. 033, 002AC, 003AC/BC). Due to the mechanical
construction of these valves (containing a small pilot and a bigger main valve), there could be a little overshoot the
first time the main valve opens. Giving setpoint slope a value of about 1 second may reduce this behavior significantly.
This option could be used in combination with special controller feature Automatic slope for pilot valves.
2.6.7 Alarm and counter settings
Alarm settings
Digital instruments contain features to raise an alarm
when a certain event happens. Some of these alarms
indicate an error or warning, showing some
diagnostic information about the state of the
instrument.
On the other hand, the user may select a scenario in
which an alarm is raised. At Mode, the desired
scenario can be selected, which can be one of the
following:
- Min/max will raise an alarm when the
sensor signal is out of the limits set by
the Minimum and the Maximum value
in percent of the full scale capacity.
- Reponse will raise an alarm when the
measure of a controller is out of limits
around the setpoint. The limits in
percent of the full scale capacity can be
set at Min and Max.
- Power-up will raise an alarm when the
instrument is powered-up, e.g. after a
power loss.
To avoid excessive alarms, a Delay time can be set to
delay the alarm event. If the condition for the alarm is
met shorter than this delay time, the alarm is not
raised.
When the alarm is raised, it is possible to
automatically change the setpoint to another value.
The new value can be entered at New setpoint and the automatic setpoint change will be effective when the
checkbox Setpoint change on alarm is checked.
Page 17 FlowPlot 9.17.030
Page 18

BRONKHORST®
Certain readout units contain a relay, which can be switched in case of an alarm. Two modes can be selected at
Output: Continuously, the relay is closed when the alarm is active, or Alternating, the relay is repeatedly closed and
opened while the alarm is active.
Once an alarm is set, it must be reset to clear it. There are several possibilities to reset an alarm:
- Keyboard: the alarm can be reset through the keyboard of a readout unit.
- External: the alarm can be reset through an external signal, supplied to the appropriate input of a
readout unit.
- FLOW-BUS: the alarm can be reset by another device connected to the same FLOW-BUS.
- Automatic: the alarm is reset automatically when the cause of the alarm is cancelled.
At Reset the desired method or a combination of these methods can be selected. When one of the reset methods is
FLOW-BUS, the alarm can also be reset by the button Reset alarm.
At the bottom of the Alarm frame, the actual alarm status is indicated by a series of LEDs. The upper three indicate the
user configurable alarms. The other four indicate the status of the device or the connection to its master instrument
(only applicable in a FLOW-BUS system with a master/slave setup).
Counter settings
Most flow meter and controller instruments contain an integrated batch counter, to totalize the total amount of mass
(or volume) that passed through an instrument. This function can be configured at the Counter frame.
At Mode, the desired counter method can be selected, which can be one of the following:
- Up will count the total amount of mass (or volume) until the counter is reset.
- Up to limit counts the total amount of mass (or volume) and raises an alarm when a certain limit is
reached. The amount at which the alarm should be raised, can be specified at Limit. For mini CORI-FLOW
controllers with integrated CORI-FILL
®
technology, highly accurate batch dosing is possible by selecting
this mode. For these instruments two additional counter control options are available: an Overrun
correction setting and the Counter control gain. The latter can be used to adjust the proportional
counter control function when a control valve (not a shut-off) is connected.
When the mode Up to limit is selected and the limit is reached, several actions can be taken. These are very similar to
the possible actions on other alarms, but can be configured just for the ‘Counter limit reached’ alarm. A description of
these possibilities is given in ‘Alarm settings’. The button Reset counter resets the counter to zero.
At the bottom of the Counter frame, the actual counter value is indicated as well as a LED which indicates if the
counter limit is reached and the alarm is raised.
Page 18 FlowPlot 9.17.030
Page 19

BRONKHORST®
Empty cells mean that samples have been missed. Check if the Invalid data indicator on the main
settings in FlowPlot or the realtime poll time in FlowDDE.
3 SPREADSHEET DATA
While FlowPlot is plotting, in the background a comma separated file can be filled with the samples that are taken.
The location and filename of this file can be set at the Options window at the File locations tab, as can saving to the
file be enabled or disabled.
Each time FlowPlot runs from the start of the graph, a new file is generated by adding the actual date and time to the
specified filename. The spreadsheet file can be opened by means of e.g. Excel for further data analysis. Every odd
column contains the time value, while every even column contains the value of the parameter.
Changing the poll times in FlowDDE (poll time for normal and realtime poll time for realtime measurement) will
influence the amount of samples in this file if the data acquisition mode is set to automatic at the Options window. In
case of a manually data acquisition time, the sample rate in the file is related to this data acquisition time. When the
poll times get smaller, more samples will be taken and more values will be put into the file.
window blinks in case of realtime measurement. In this case, it can be necessary to adjust the realtime
Page 19 FlowPlot 9.17.030
Page 20

BRONKHORST®
4 SERVICE
For current information on Bronkhorst and service addresses please visit our website:
Do you have any questions about our products? Our Sales Department will gladly assist you selecting the right product
for your application. Contact sales by e-mail:
For after-sales questions, our Customer Service Department is available with help and guidance. To contact CSD by email:
No matter the time zone, our experts within the Support Group are available to answer your request immediately or
ensure appropriate further action. Our experts can be reached at:
http://www.bronkhorst.com
sales@bronkhorst.com
support@bronkhorst.com
+31 573 45 88 39
Page 20 FlowPlot 9.17.030
 Loading...