

Page 1
Manual | EN
TF3500
TwinCAT 3 Analytics Logger
8/12/2020 | Version: 1.0
Page 2

Page 3

Table of contents
Table of contents
1 Foreword ....................................................................................................................................................5
1.1 Notes on the documentation..............................................................................................................5
1.2 Safety instructions .............................................................................................................................6
2 Overview.....................................................................................................................................................7
3 Installation..................................................................................................................................................8
3.1 System requirements.........................................................................................................................8
3.2 Licensing ...........................................................................................................................................8
4 Analytics Workflow - First Steps............................................................................................................11
4.1 Recording data from the machine ...................................................................................................11
4.2 Communication................................................................................................................................14
4.3 Historicize data ................................................................................................................................15
4.4 Analyse data....................................................................................................................................20
4.5 24h Analytics application .................................................................................................................24
5 Technical introduction ............................................................................................................................34
5.1 Basic Concepts................................................................................................................................34
5.2 MQTT...............................................................................................................................................35
5.3 Data Compression...........................................................................................................................39
6 Configuration ...........................................................................................................................................41
6.1 Basic settings ..................................................................................................................................41
6.1.1 TLS .................................................................................................................................. 43
6.2 Data Streams...................................................................................................................................46
6.2.1 Data Handling .................................................................................................................. 49
6.3 Using the Programming Interface....................................................................................................51
7 Samples....................................................................................................................................................53
8 Appendix ..................................................................................................................................................54
8.1 FAQ - frequently asked questions and answers..............................................................................54
TF3500 3Version: 1.0
Page 4

Table of contents
TF35004 Version: 1.0
Page 5

Foreword
1 Foreword
1.1 Notes on the documentation
This description is only intended for the use of trained specialists in control and automation engineering who
are familiar with applicable national standards.
It is essential that the documentation and the following notes and explanations are followed when installing
and commissioning the components.
It is the duty of the technical personnel to use the documentation published at the respective time of each
installation and commissioning.
The responsible staff must ensure that the application or use of the products described satisfy all the
requirements for safety, including all the relevant laws, regulations, guidelines and standards.
Disclaimer
The documentation has been prepared with care. The products described are, however, constantly under
development.
We reserve the right to revise and change the documentation at any time and without prior announcement.
No claims for the modification of products that have already been supplied may be made on the basis of the
data, diagrams and descriptions in this documentation.
Trademarks
Beckhoff®, TwinCAT®, EtherCAT®, EtherCAT G®, EtherCAT G10®, EtherCAT P®, Safety over EtherCAT®,
TwinSAFE®, XFC®, XTS® and XPlanar® are registered trademarks of and licensed by Beckhoff Automation
GmbH.
Other designations used in this publication may be trademarks whose use by third parties for their own
purposes could violate the rights of the owners.
Patent Pending
The EtherCAT Technology is covered, including but not limited to the following patent applications and
patents:
EP1590927, EP1789857, EP1456722, EP2137893, DE102015105702
with corresponding applications or registrations in various other countries.
EtherCAT® is a registered trademark and patented technology, licensed by Beckhoff Automation GmbH,
Germany
Copyright
© Beckhoff Automation GmbH & Co. KG, Germany.
The reproduction, distribution and utilization of this document as well as the communication of its contents to
others without express authorization are prohibited.
Offenders will be held liable for the payment of damages. All rights reserved in the event of the grant of a
patent, utility model or design.
TF3500 5Version: 1.0
Page 6
Foreword
1.2 Safety instructions
Safety regulations
Please note the following safety instructions and explanations!
Product-specific safety instructions can be found on following pages or in the areas mounting, wiring,
commissioning etc.
Exclusion of liability
All the components are supplied in particular hardware and software configurations appropriate for the
application. Modifications to hardware or software configurations other than those described in the
documentation are not permitted, and nullify the liability of Beckhoff Automation GmbH & Co. KG.
Personnel qualification
This description is only intended for trained specialists in control, automation and drive engineering who are
familiar with the applicable national standards.
Description of symbols
In this documentation the following symbols are used with an accompanying safety instruction or note. The
safety instructions must be read carefully and followed without fail!
DANGER
Serious risk of injury!
Failure to follow the safety instructions associated with this symbol directly endangers the life and health of
persons.
WARNING
Risk of injury!
Failure to follow the safety instructions associated with this symbol endangers the life and health of persons.
CAUTION
Personal injuries!
Failure to follow the safety instructions associated with this symbol can lead to injuries to persons.
NOTE
Damage to the environment or devices
Failure to follow the instructions associated with this symbol can lead to damage to the environment or
equipment.
Tip or pointer
This symbol indicates information that contributes to better understanding.
TF35006 Version: 1.0
Page 7

Overview
2 Overview
The TwinCAT Analytics Logger records process and application data of the machine controller in
synchronization with task cycles. The logger is characterized by its high performance as it operates directly
in the real-time context of the TwinCAT controller.
The TwinCAT Analytics Logger may either act as an MQTT client and transmit the data to a MQTT message
broker on a regular basis (called MQTT-mode) or store the data locally in a file on the hard disk of the
machine controller (called file-mode). The configuration required is performed in Microsoft Visual Studio®. All
variables of the process image and the PLC application can be added easily to the configuration via check
boxes without the need for programming.
When used as an MQTT Client the Logger is able to bypass short disconnects to the Message Broker using
a ring buffer functionality to prevent loss of data temporarily. Used in file-mode, a ring buffer can also be
configured, which may be useful in case of limited storage capacity or if there is no need for data to be
recorded (henceforth referred to as logged) permanently, instead focusing on a fixed time interval.
The logged data may be used in various ways but its main intention is data analysis with TwinCAT Analytics
as wells as data visualization with TwinCAT Scope.
Components
• Configuration surface in TwinCAT project tree
• Description files TcAnalytics.tmc and TcIotBase.tmc
• Drivers TcAnayltics.sys and TcIotDrivers.sys
List of key features
Functionality TC3 Analytics Logger as MQTT Client TC3 Analytics Logger for local storage
Programable
record control
Configuration
Interface
RT Context Yes Yes
MQTT Yes No
Analytics Binary
Format
JSON Format No No
File Storage No Yes
Ring Buffer Yes Yes
Authentication Yes No
Encryption Yes Yes
Compression Yes Yes
Yes Yes
Yes Yes
Yes Yes
TF3500 7Version: 1.0
Page 8
Installation
3 Installation
The TwinCAT Analytics Logger is installed with TwinCAT XAE and XAR. Therefore, the Logger should
always be available but in order to use it, one “TC3 Analytics Logger” license per target device is needed
which may either be a permanent or a 7-day trial license.
For general information about licensing, please refer to the licensing paragraph below.
3.1 System requirements
Technical Data TF3500 TC3 Analytics Logger
Operating System Windows 7, Windows 8, Windows 10, WinCE
PC (x86, x64 und ARM)
Min. TwinCAT Version 3.1.4022.31
Min. TwinCAT Level TC1100 TC3 | I/O
3.2 Licensing
The TwinCAT3function can be activated as a full version or as a 7-day test version. Both license types can
be activated via the TwinCAT 3 development environment (XAE).
Licensing the full version of a TwinCAT3Function
A description of the procedure to license a full version can be found in the Beckhoff Information System in
the documentation "TwinCAT3Licensing".
Licensing the 7-day test version of a TwinCAT3Function
Note: A 7-day test version cannot be enabled for a TwinCAT 3 license dongle.
1. Start the TwinCAT 3 development environment (XAE).
2. Open an existing TwinCAT 3 project or create a new project.
3. If you want to activate the license for a remote device, set the desired target system. To do this, select
the target system from the Choose Target System drop-down list in the toolbar.
ð The licensing settings always refer to the selected target system. When the project is activated on
the target system, the corresponding TwinCAT 3 licenses are automatically copied to this system.
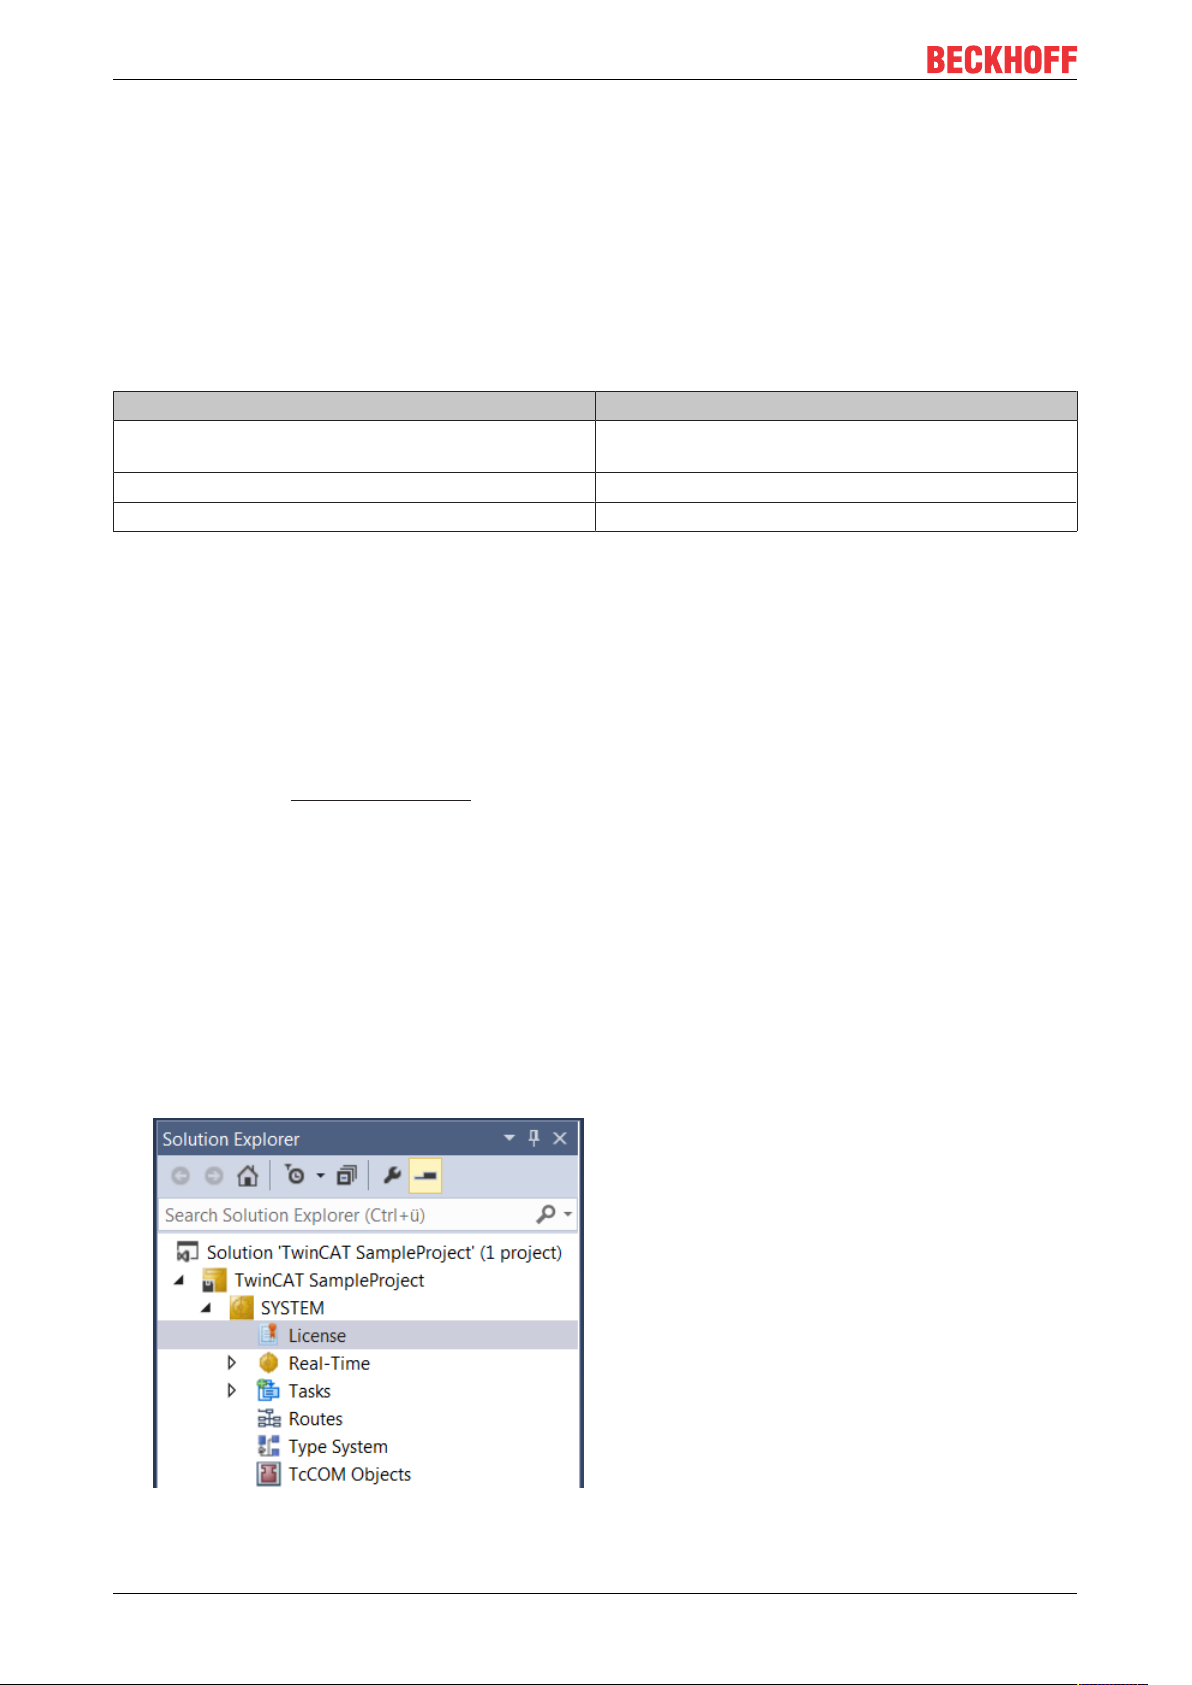
4. In the Solution Explorer, double-click License in the SYSTEM subtree.
ð The TwinCAT 3 license manager opens.
TF35008 Version: 1.0
Page 9
Installation
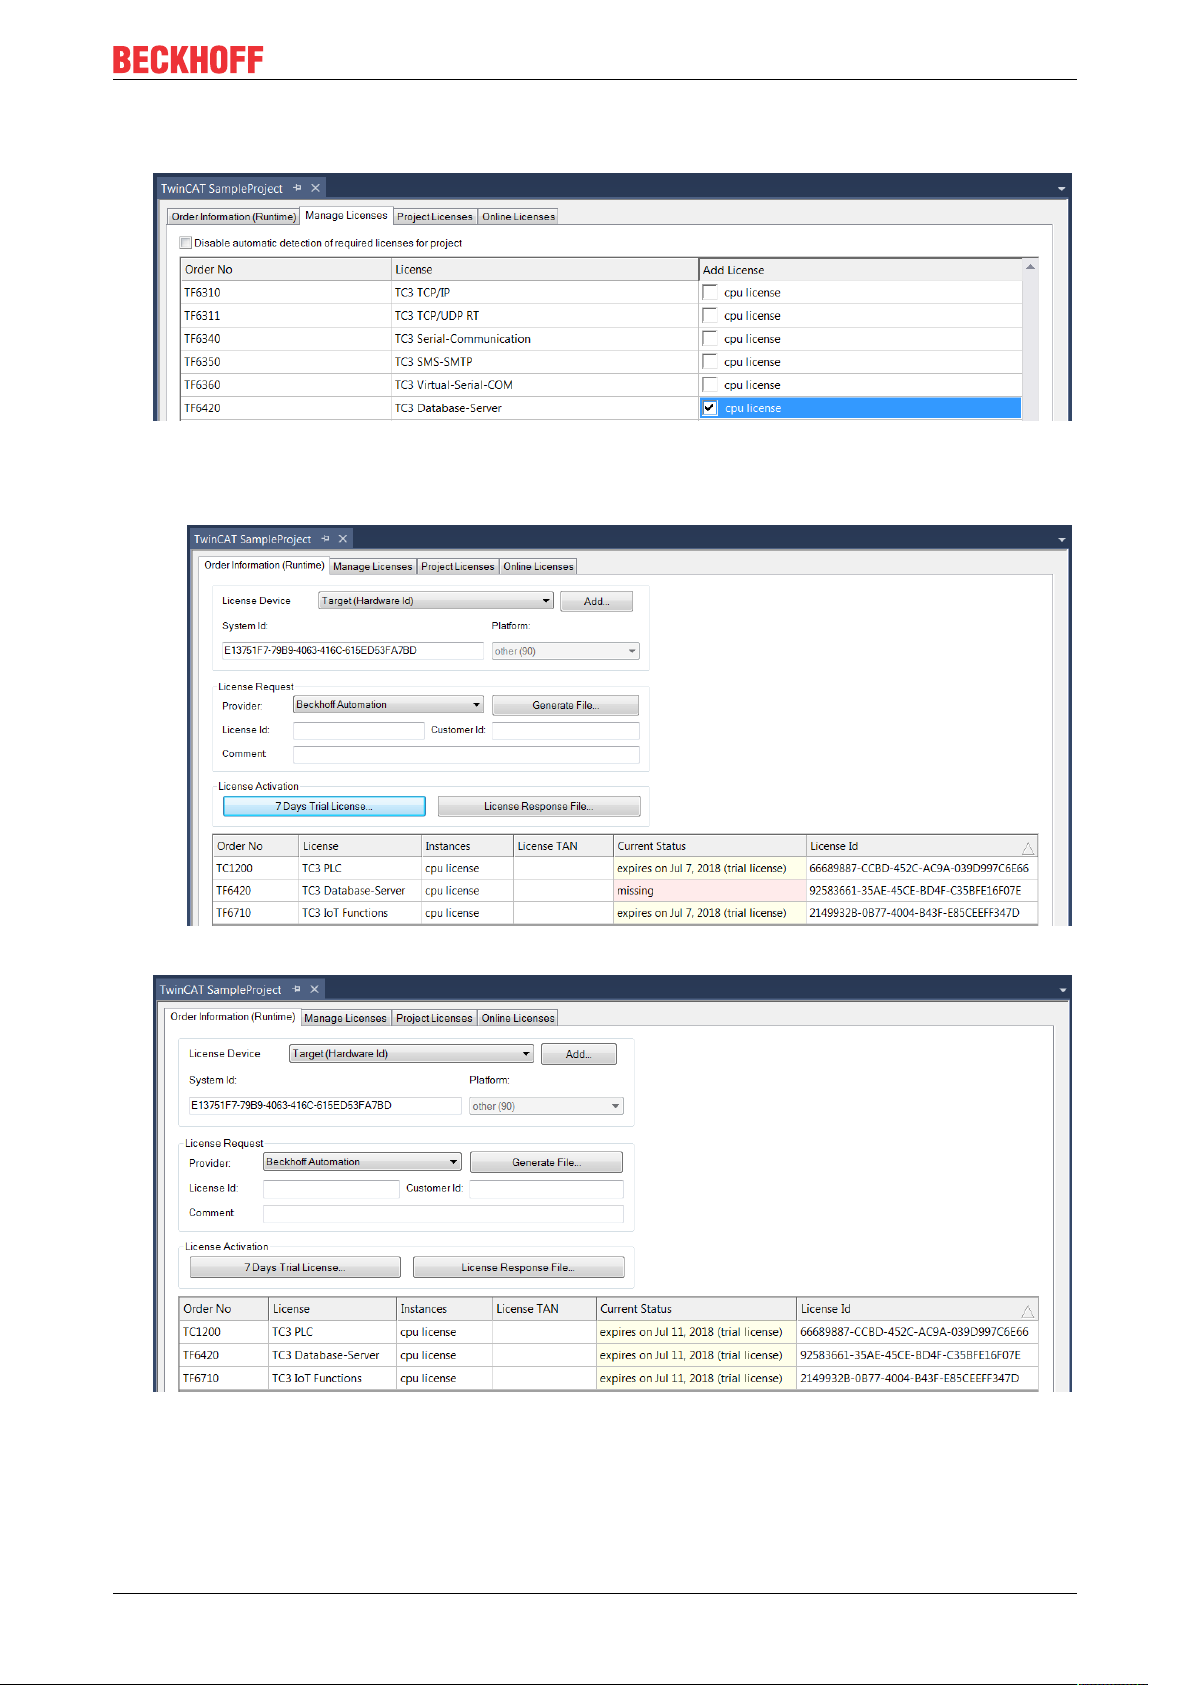
5. Open the Manage Licenses tab. In the AddLicense column, check the check box for the license you
want to add to your project (e.g."TF6420:TC3DatabaseServer").
6. Open the Order Information (Runtime) tab.
ð In the tabular overview of licenses, the previously selected license is displayed with the status
“missing”.
7. Click7-DayTrialLicense... to activate the 7-day trial license.
ð A dialog box opens, prompting you to enter the security code displayed in the dialog.
8. Enter the code exactly as it appears, confirm it and acknowledge the subsequent dialog indicating
successful activation.
ð In the tabular overview of licenses, the license status now indicates the expiry date of the license.
9. Restart the TwinCAT system.
TF3500 9Version: 1.0
Page 10

Installation
ð The 7-day trial version is enabled.
TF350010 Version: 1.0
Page 11
Analytics Workflow - First Steps
4 Analytics Workflow - First Steps
This step by step documentation presents the complete TwinCAT Analytics workflow. From the data
acquisition over the communication and historizing up to the evaluation and analysis of the data and to the
presentation of the data in web-based dashboard.
4.1 Recording data from the machine
On the machine side is the Analytics Logger the recorder of process data from the machine image, PLC, NC
and so on. The Logger is working in the real-time context of TwinCAT.
The TwinCAT Analytics Logger is installed with TwinCAT XAE and XAR. The Logger can act as MQTT Client
to communicate the recorded data to a native MQTT Message Broker or store the data in the same data
format in a local binary file. By the usage as MQTT Client the Logger is able to bypass short disconnects to
the Message Broker with a ring buffer functionality. You can configure a ring buffer as well for the local
binary file storage.
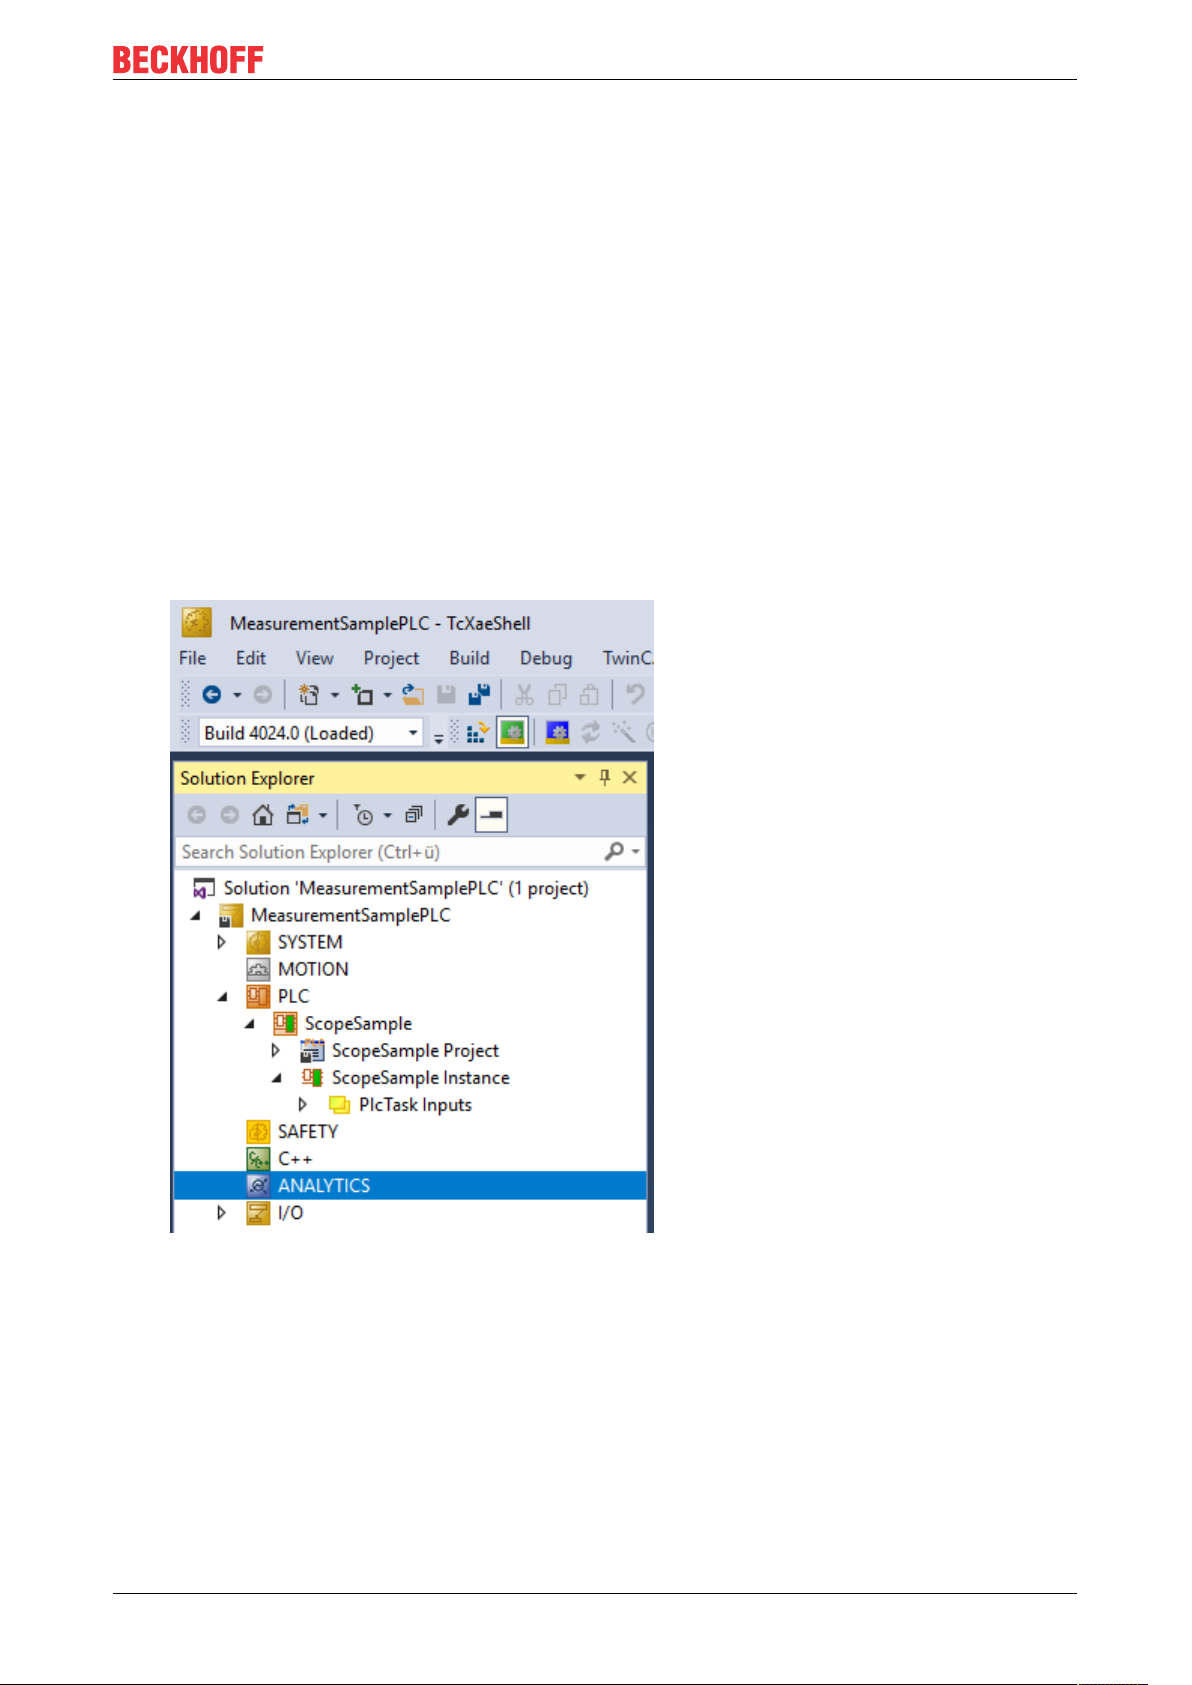
• To configure the Analytics Logger you have to navigate in your existing TwinCAT Project to the
Analytics tree node
TF3500 11Version: 1.0
Page 12
Analytics Workflow - First Steps
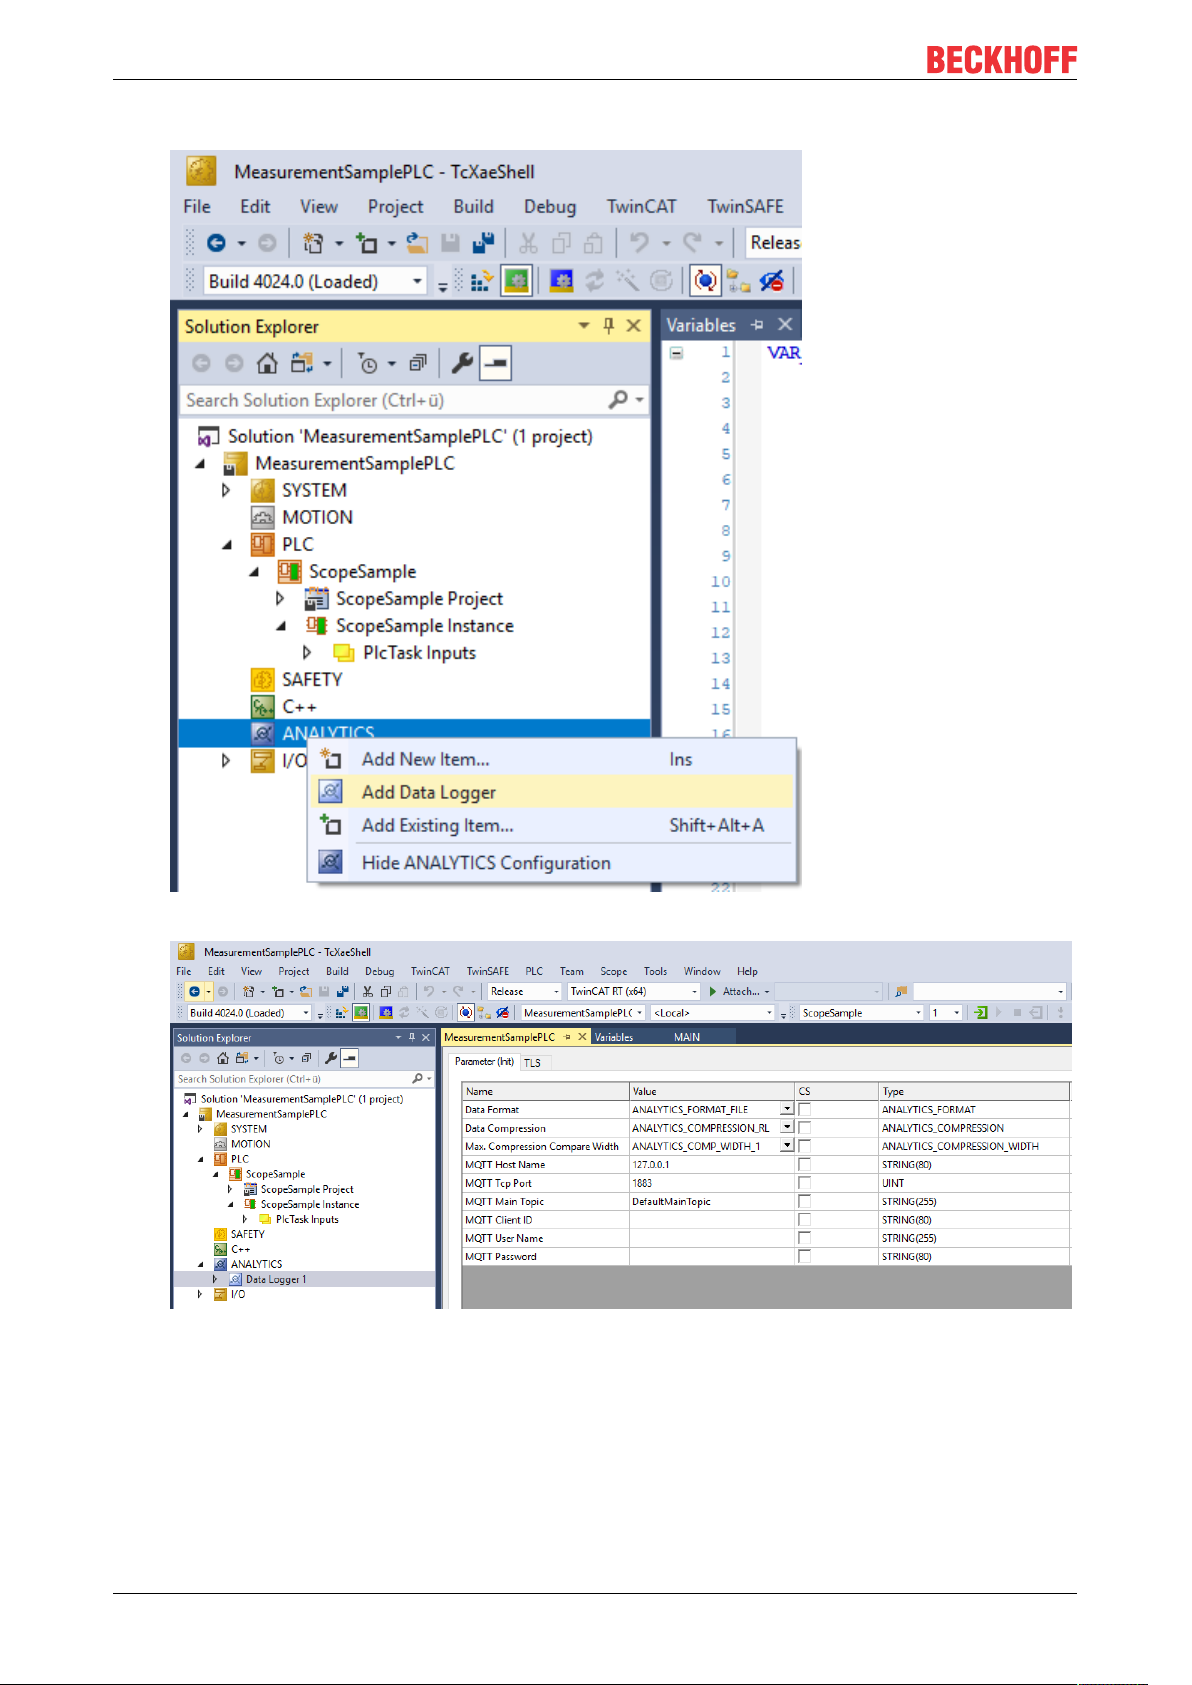
• Right click on this node and click on “Add Data Logger” to add one new instance to your configuration
• For configuring the base settings, please double click on the new tree item
You can make your specific Analytics Logger settings
-Data Format: Binary file or MQTT stream
-FILE format: Analytics Logger stores the data in local binary files and all other settings are not
necessary anymore. The files will be stored in C:\TwinCAT\3.1\Boot\Analytics.
-BINARY: Data will be sent to the configured MQTT Message Broker. You can have multiple Logger in
one TwinCAT project to communicate data to different MQTT Message Broker.
-Data Compression: on (default) or off
TF350012 Version: 1.0
Page 13
Analytics Workflow - First Steps
-Max Compression: mode of the compression
-MQTT host name
-MQTT Tcp port
-MQTT main topic for own hierarchical levels to keep the identification easy
-MQTT Client ID should be unique in the network
-MQTT username
-MQTT password to make authentication at the message broker
-At the TLS (Transport Layer Security) tab, security settings can be configured. TLS is a secure
communication channel between client and server. By the usage of certificates, the TCP port 8883 is
exclusively reserved for MQTT over TLS. Analytics Logger is supporting the modes CA Certificates, CA
Certificates & Client Certificate and Preshared Key (PSK) mode.
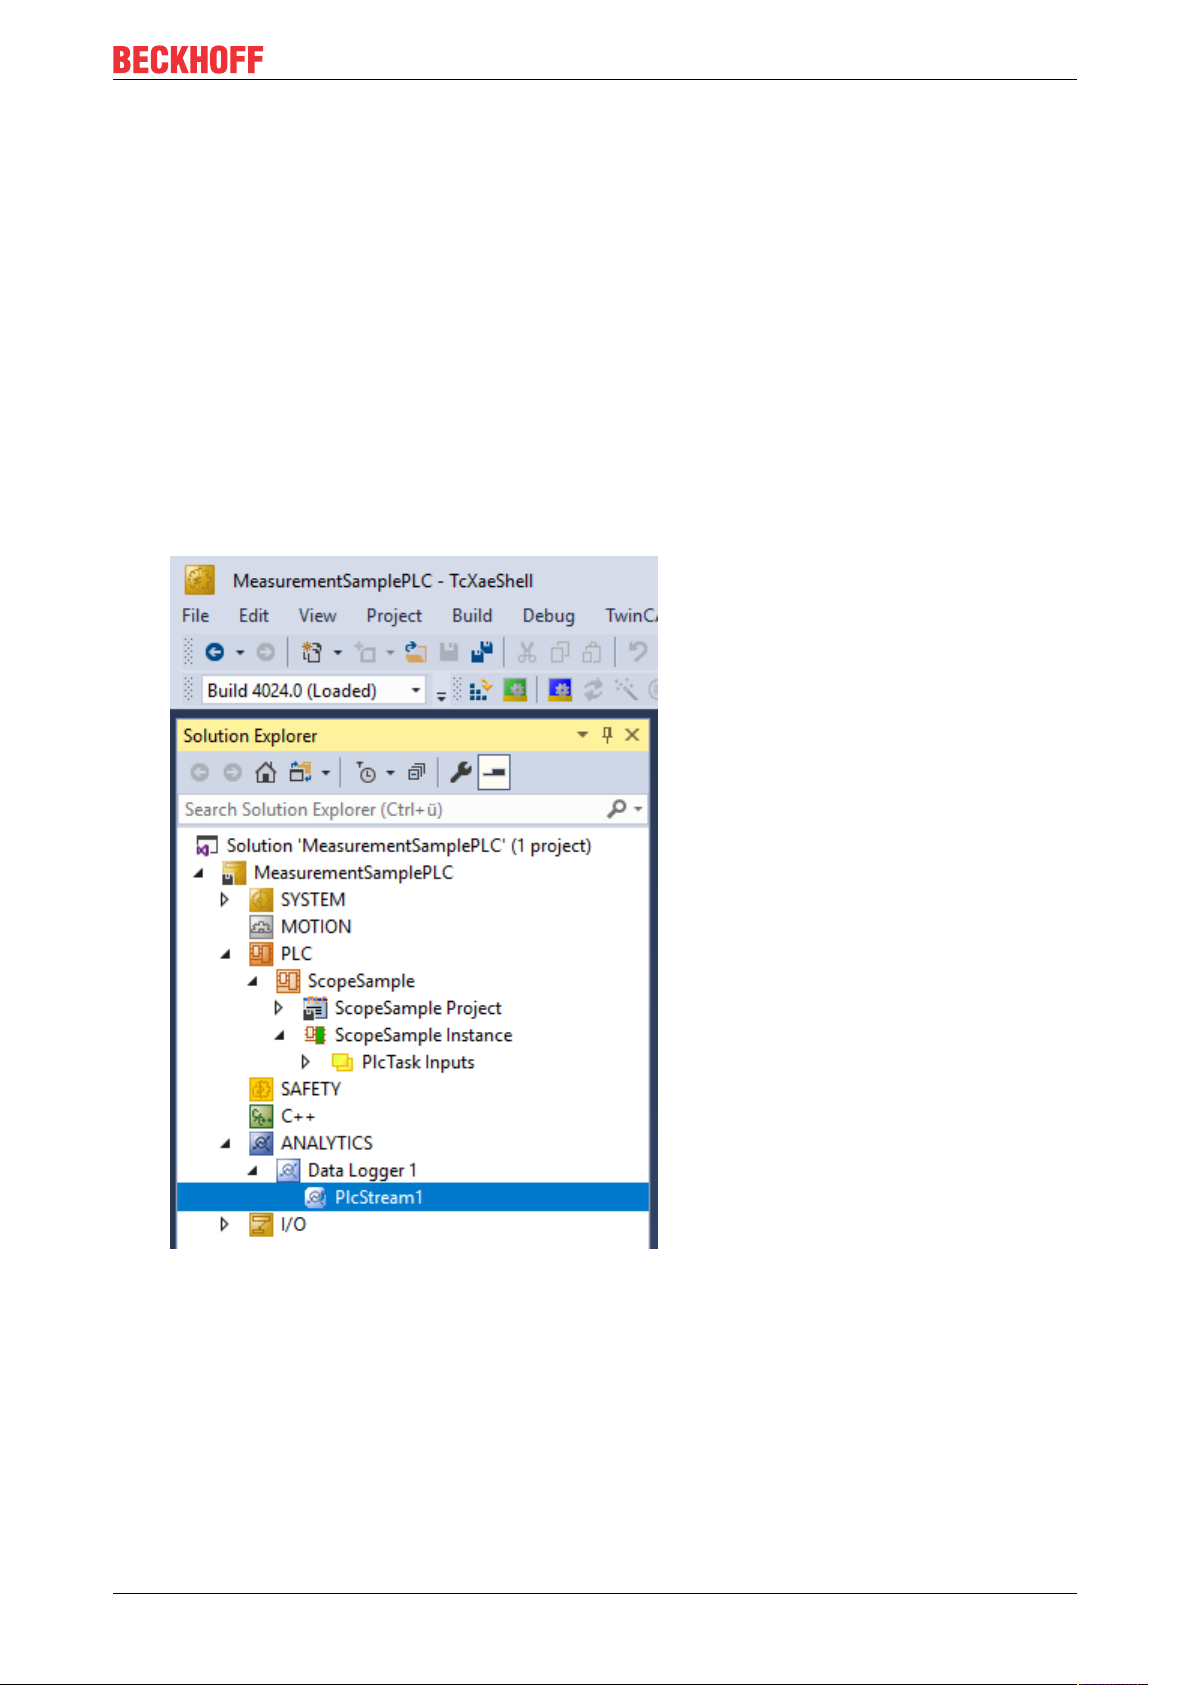
• If variables in your PLC application are marked in the declaration with the attribute {attribute
'TcAnalytics'} they will be shown automatically as a stream below the Data Logger tree node.
An additional device stream will be shown if your configuration provides an EtherCAT Process Image.
TF3500 13Version: 1.0
Page 14
Analytics Workflow - First Steps
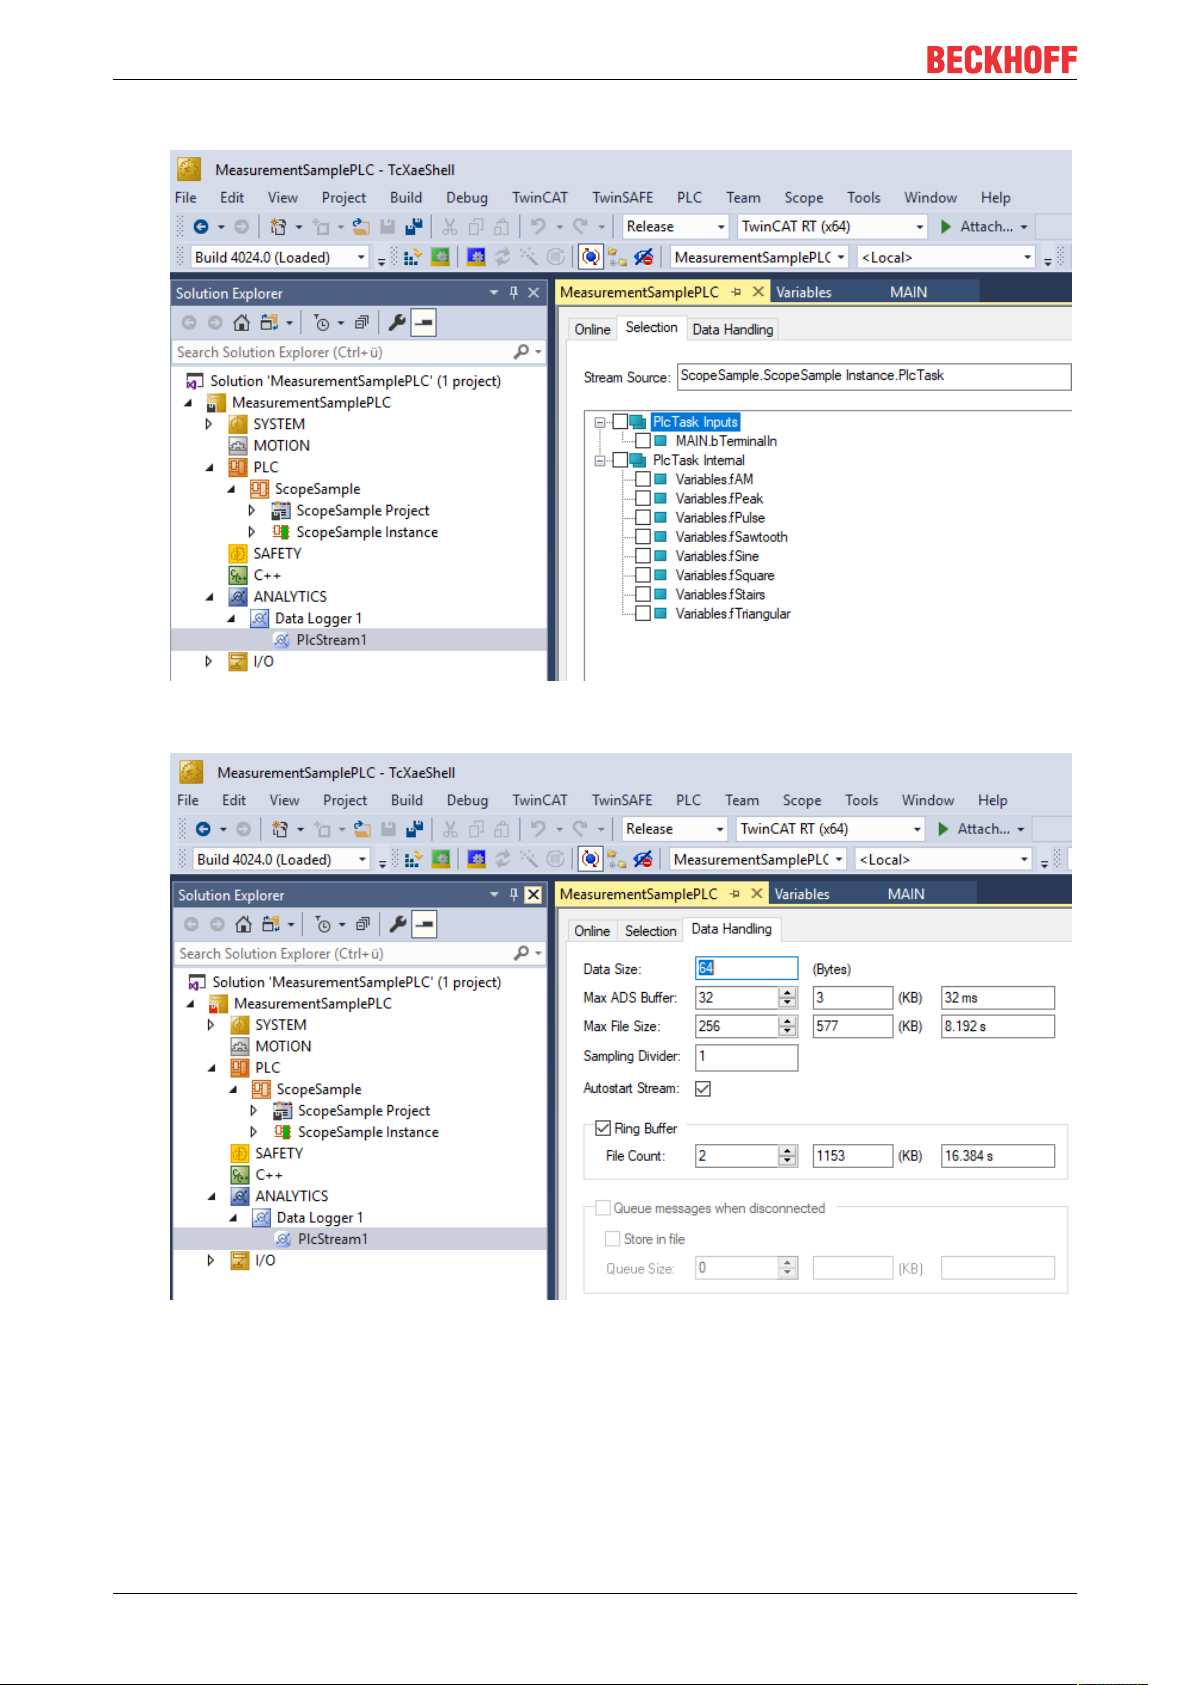
• In the stream a Selection tab is available to choose the variables that should be recorded
• Finally it is possible to change the package size for the frames or to configure the ring buffer for
disconnects and file in the Data Handling tab.
4.2 Communication
Currently, the Analytics workflow is fully mappable via MQTT. The engineering tools can also access the
data of the machines via ADS and carry out analyzes.
TF350014 Version: 1.0
Page 15
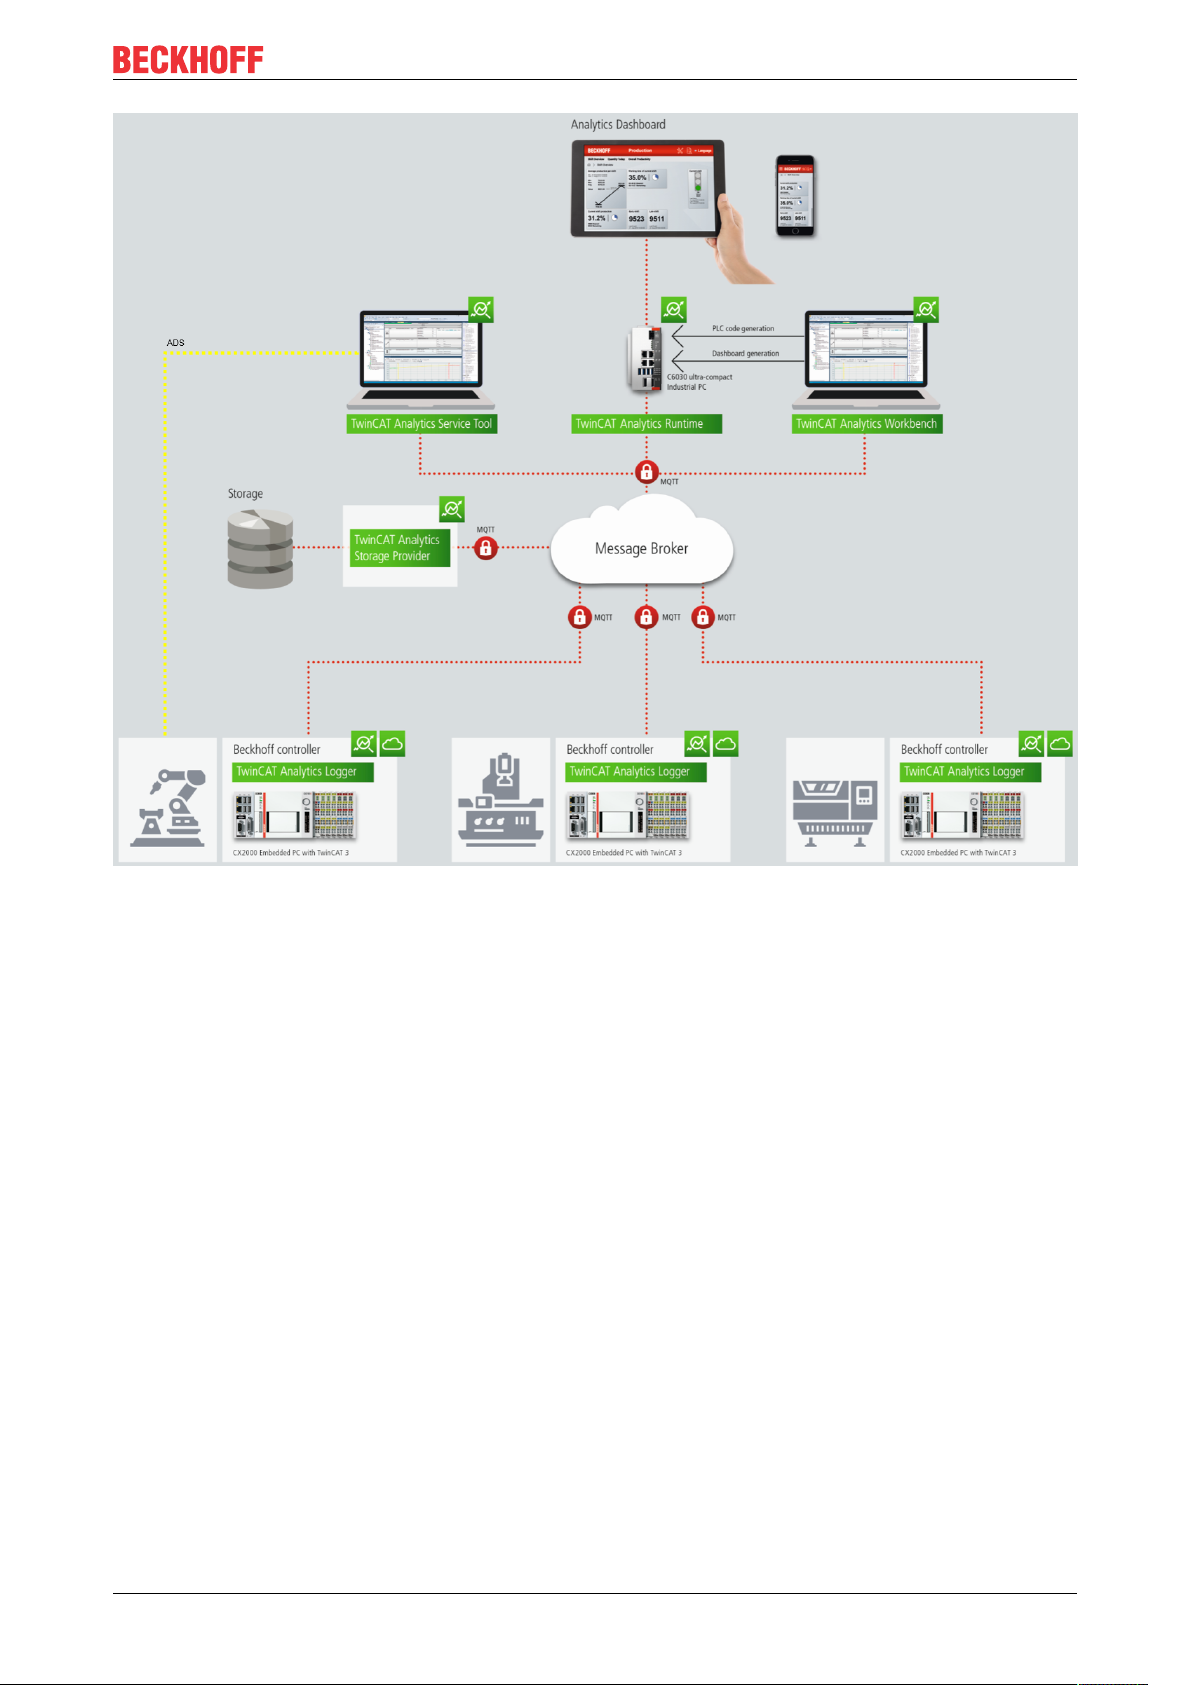
Analytics Workflow - First Steps
If you choose for the IoT communication protocol MQTT you have to setup a native MQTT Message Broker
somewhere in the network (VM in a cloud system is also possible). This Message Broker provides a
decoupling of the different applications in the Analytics Workflow.
4.3 Historicize data
After installation of the TwinCAT Analytics Storage Provider you are able to configure the service running in
the background. You will find therefore the TcAnalyticsStorageProvider_Config application in the folder C:
\TwinCAT\Functions\TF3520-Analytics-StorageProvider\WinService.
TF3500 15Version: 1.0
Page 16
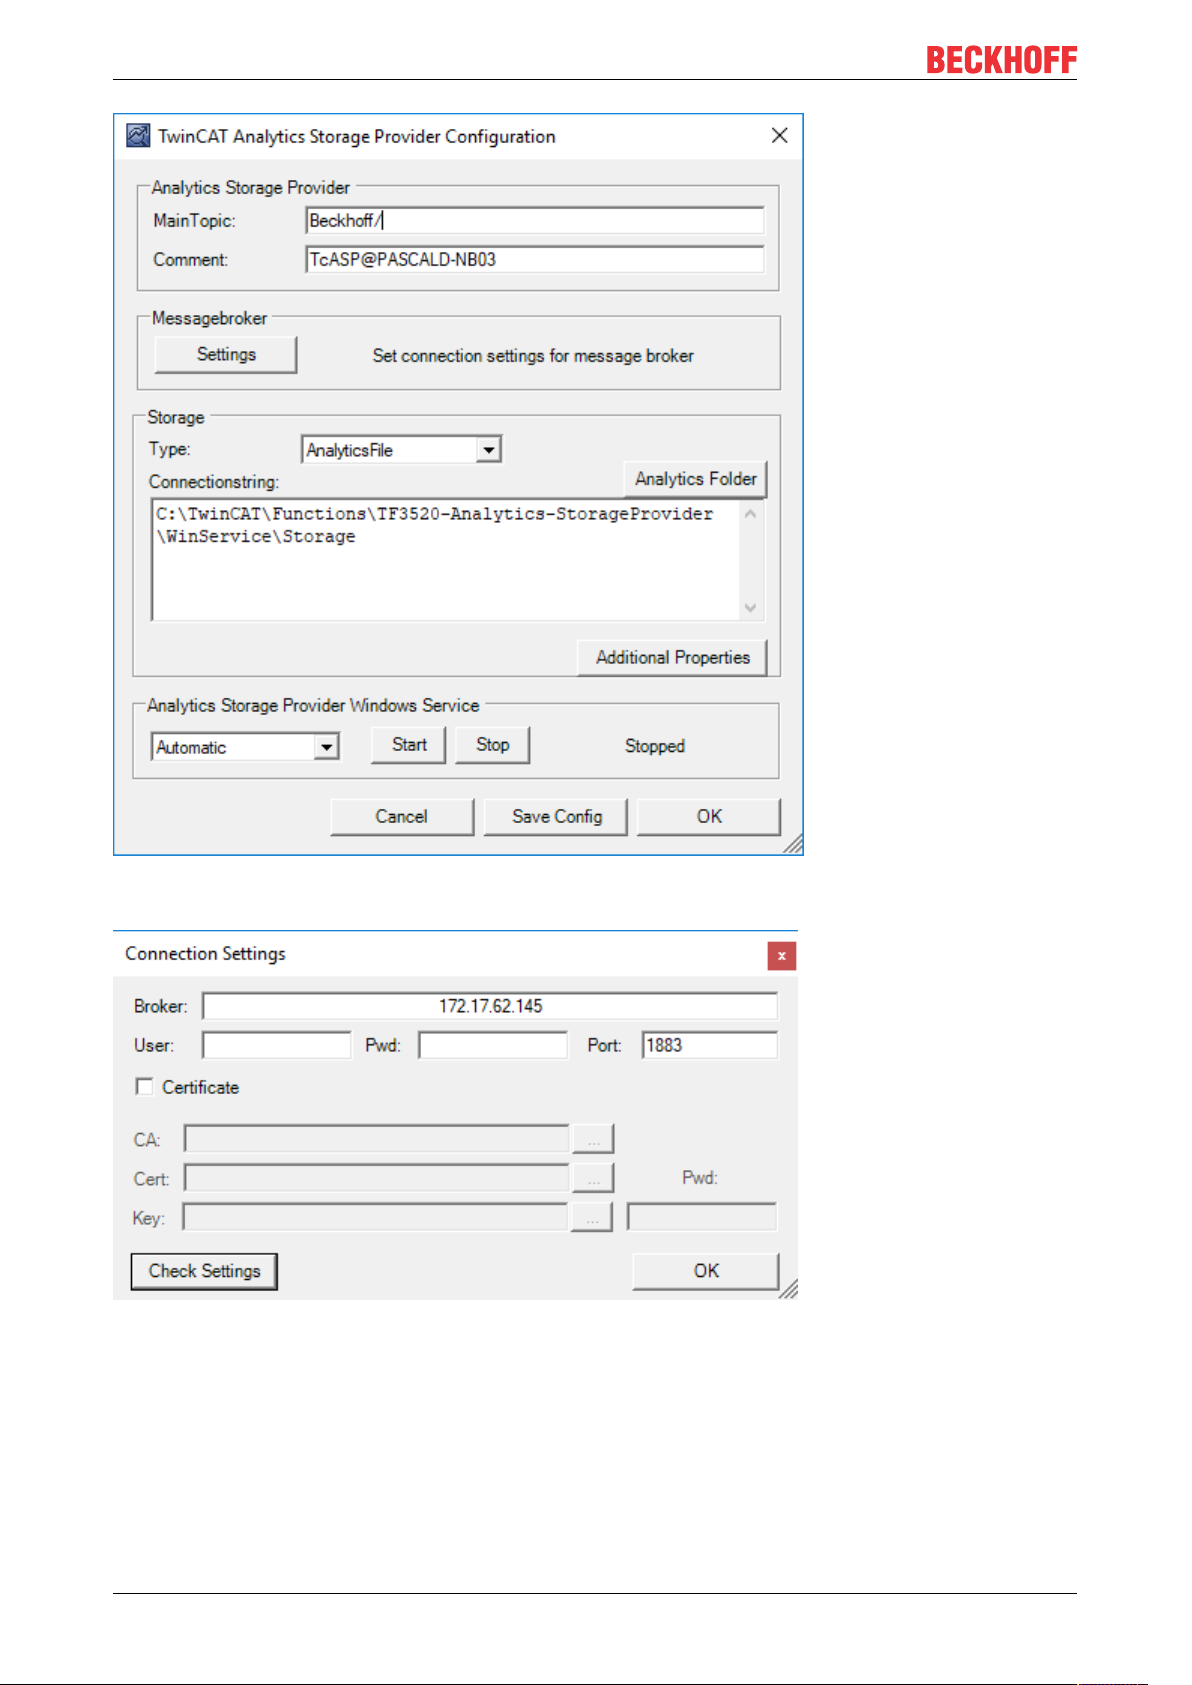
Analytics Workflow - First Steps
The main part of the topic can be set in the configuration as well as the comment which will be used for
identification if more than one Storage Provider is registered at the Message Broker.
You are able to provide the Message Broker settings and to decide for storage type:
• Analytics File (binary file)
• Microsoft SQL
• Microsoft Azure Blob (Azure Cloud necessary)
Finally, you can save the config and start the service. The next step is the configuration of the specific
record. Therefore you should choose in your development environment the Storage Provider Recorder.
TF350016 Version: 1.0
Page 17
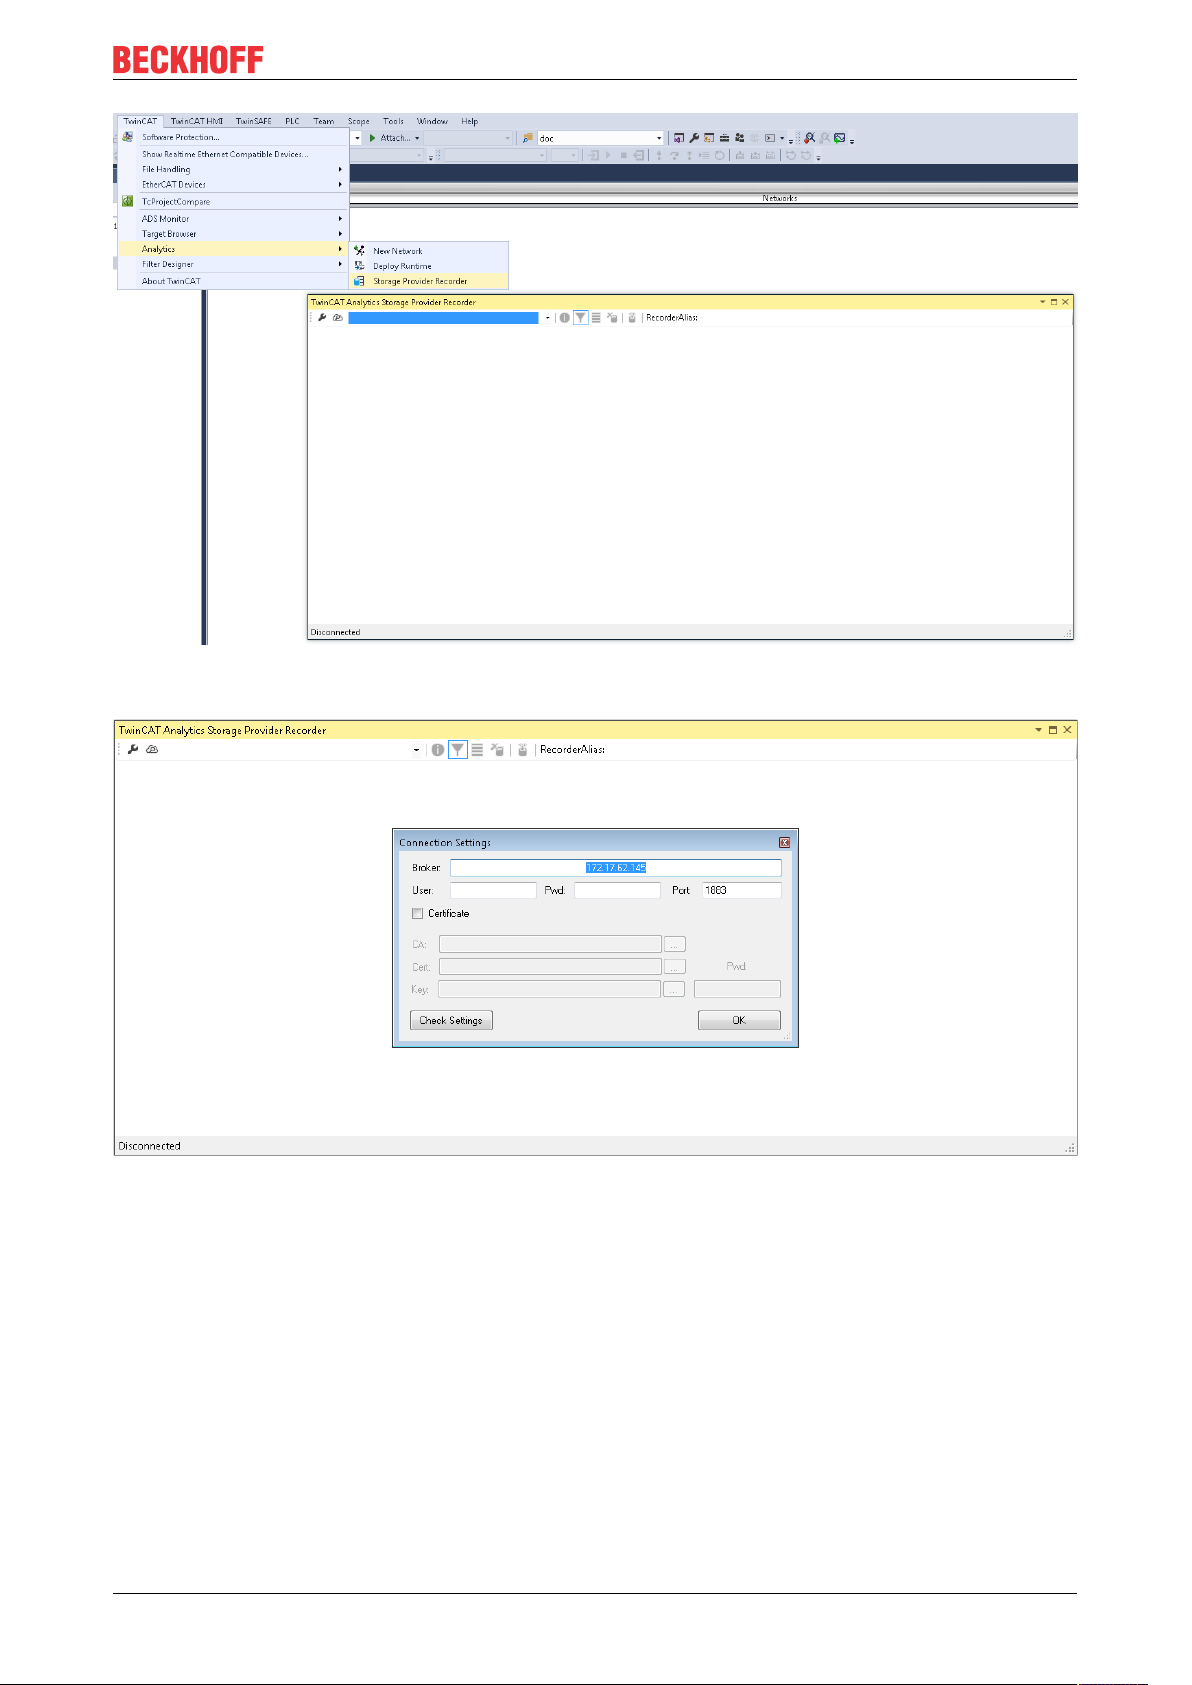
Analytics Workflow - First Steps
The recorder has also to connect to the Message Broker. So you have to provide the same settings as for
the background service.
After this you can click to icon with the small cloud to search Storage Providers at the configured Message
Broker. Here you will find also the comment you gave already by the service configuration to identify your
Storage Provider.
TF3500 17Version: 1.0
Page 18

Analytics Workflow - First Steps
The configuration of the record is very easy. You have just to choose your target in the Target Browser. Click
on Live data and choose one or more variables by multiselect and put them by drag and drop to the recorder
window.
The recorder will ask you if you like to add just the chose variables or the complete source process image of
the variables.
TF350018 Version: 1.0
Page 19

Analytics Workflow - First Steps
You can also configure record names and a duration (otherwise endless until manual stop). A ringbuffer can
be set by memory or time.
Click the Start button to start the record. After this you can also disconnect the recorder, because the
background service do the work. It is also possible that someone else connect to this Storage Provider
service and control the running record.
TF3500 19Version: 1.0
Page 20

Analytics Workflow - First Steps
After and also during the record you can choose the historical data as input for your analysis in the Target
Browser. In the Target Browser you will find for historical data a new control on the right hand site. There you
can choose the time span for your data.
4.4 Analyse data
Open your TwinCAT engineering environment to start the analysis of the data.
Open Visual Studio® >> File >> New >> Project…
Choose from TwinCAT Measurement the Analytics project template.
TF350020 Version: 1.0
Page 21

Analytics Workflow - First Steps
The new project will be shown in the Solution Explorer. After a click on the Analytics Project tree node item a
start window opens where you can select your first action. From here, you can add a Network, open the
Toolbox, open the Target Browser or open the Analytics Storage Provider Recorder. You will do all these
actions in the following steps.
It makes sense to open in a first step the Toolbox of Visual Studio®. There you will find all the supported
algorithm of TwinCAT Analytics. Algorithm must be organized and grouped into networks. Right click on the
Analytics Project to add a new Network or add a Network using the start page. The first Network is always
generated by default.
If you click on the Network an editor will be open. Now you can take the algorithm you like by drag and drop
into the editor surface. After choosing the algorithm you need to connect input variables to the modules
(algorithm). Therefor open the Target Browser.
TwinCAT >> Target Browser >> Target Browser
TF3500 21Version: 1.0
Page 22

Analytics Workflow - First Steps
Choose now the TcAnalytics or TcAnalyticsFile tab in the Target Browser. We go ahead with the TcAnalytics
tab (MQTT). Click on the green marked icon in the toolbar of this Analytics extension. A window will be open
where you can provide your Message Broker connectivity data.
Choose your MQTT Analytics client (TwinCAT Analytics Logger, TwinCAT IoT Data Agent or Beckhoff
EK9160). For each controller you have a unique ID. This ID is shown in the Target Browser. Not very legible,
of course. Therefore, click on the icon with the gear to get to the machine administration page. Here you can
provide a System Alias name which is shown in the Target Browser instead of the GUID.
In the next step you can choose between Live Data and Historical Data for each MQTT Analytics client.
Historical Data are only provided by the TwinCAT Analytics Storage Provider.
TF350022 Version: 1.0
Page 23

Analytics Workflow - First Steps
You can take the variables by drag and drop into the inputs of the specific algorithm. For the most algorithm
it is possible to set conditions like thresholds, time intervals, logic operators and so on. You can do these
settings in the middle of each module.
Finally, your first Analytics Project is finished. To start the analysis, click on “Start Analytics”. To stop the
analysis, click on “Stop Analytics”.
TF3500 23Version: 1.0
Page 24

Analytics Workflow - First Steps
Before starting Analytics or also during the runtime you can click on the button “Add Reference Scope”. A
Scope configuration is automatically built to fit your Analytics project.
Results of the analysis can be show in the Scope View charts by drag and drop. For example, an average
value can be shown as new channel in the view. Timestamps as Marker at the x-axes to show significant
values.
4.5 24h Analytics application
The last big step in the TwinCAT Analytics workflow is the continuous 24h machine analysis. It runs parallel
to the machine applications in the field. To do this in a very easy way the TwinCAT Analytics Workbench is
able to generate automatically a PLC code and a HTML5-based Dashboard of your Analytics configuration.
Both can be downloaded to a TwinCAT Analytics Runtime (TC3 PLC and HMI Server) and provide the same
analysis results as the configurator tool in engineering environment.
At first save your configuration and open the Analytics Deploy Runtime wizard. You can do this via the
context menu at the Analytics Project tree item or by the Start Page.
TF350024 Version: 1.0
Page 25

Analytics Workflow - First Steps
When the wizard is open, there are some tabs available for you to click through. First one is called Solution.
Here it is possible to decide how you like to use your Analytics project in PLC code: As…
• completely new solution
• part of an existing solution
• update of an existing Analytics solution
In the TwinCAT PLC Target tab you can choose the ADS target system which runs the TwinCAT Analytics
Runtime (TF3550). The generated project is immediately executable. Therefore, you can set the option
Activate PLC Runtime. Also, that directly a boot project is created.
TF3500 25Version: 1.0
Page 26

Analytics Workflow - First Steps
Specially for Virtual Machines it is important to run the project on isolated cores. Also, an option in this tab.
The next tab Results is only necessary if you have chosen the Stream Results option in the algorithm
properties. If you like to send results you can decide here in which way (local in a file/ by MQTT) and format
(binary/JSON). Also, this is generated automatically and starts running after activation.
TF350026 Version: 1.0
Page 27

Analytics Workflow - First Steps
A down sampling of the results is possible by setting a cycle time. The next tab is reserved for the HMI
Dashboard. The prerequisite for the automatic Dashboard generation is the selection of HMI controls for the
corresponding algorithms whose results are to be displayed in the dashboard.
TF3500 27Version: 1.0
Page 28

Analytics Workflow - First Steps
You can choose for your Analytics Dashboard different options like start page with a map, layouts, sorting
algorithm, own colors and logos. If you choose more languages for the Analytics controls a language switch
menu will be generated as well.
TF350028 Version: 1.0
Page 29

Analytics Workflow - First Steps
Choose one of the installed Visual Studio versions. And whether the generation should start the instance
visibly or whether it should only be set up and activated in the background.
TF3500 29Version: 1.0
Page 30

Analytics Workflow - First Steps
Finally you find a summery.
TF350030 Version: 1.0
Page 31

Analytics Workflow - First Steps
Now you can click the Deploy button to start the generation process. The PLC project and the HMI
Dashboard will be generated now.
TF3500 31Version: 1.0
Page 32

Analytics Workflow - First Steps
After the message Deploy Runtime succeeded you can find a new Visual Studio®/XAE Shell instance on
your desktop. The new Solution and both Projects are generated.
TF350032 Version: 1.0
Page 33

Analytics Workflow - First Steps
TF3500 33Version: 1.0
Page 34

Technical introduction
5 Technical introduction
5.1 Basic Concepts
Variables and Datatypes
There are several types of variables that can be logged. Variables that are part of:
• PLC or NC process images
• PLC programs
• process images of devices e.g. an EtherCAT master and
• data areas of generic TcCom objects.
Moreover, they may be of any datatype defined in IEC 61131 or the C++ standard in case of generic TcComobjects.
Structured datatypes may recursively contain other structured datatypes and may be logged as a whole or
partially. For more information on this topic, refer to the Configuration section.
Modes of Operation
This documentation makes use of the terminology and concepts described in the MQTT-section. Please
refer to that section for general information about the protocol.
A key concept of TwinCAT Analytics are streams, which form the basic unit of transaction between a data
source and destination. One data logger can control several streams.
A stream may comprise four components:
• stream description
• stream Tx-description
• symbol info
• and stream data.
In MQTT-mode, Analytics participants coordinate by means of the first three components using an MQTT
broker and a specific MQTT topic for each component. The topics are generally structured as illustrated in
the following table, whereat <>-brackets indicate variables as opposed to the other parts that are fixed.
Component Topic Structure Format Purpose
Description <MainTopic>/<StreamTopic>/Desc JSON Informs if there is a stream source online
or offline. Includes timestamp of info.
TxDescription
Symbol Info <MainTopic>/<StreamTopic>/Bin/Tx/
Data <MainTopic>/<StreamTopic>/Bin/Tx/Data Binary Contains the plain variable values.
<MainTopic>/<StreamTopic>/Bin/Tx/
Desc
Symbols
JSON Informs about the transmission
parameters when a stream source is
active transmitting data.
Binary Contains meta information about the
variables i.e. excluding the actual value.
The main topic is the only subtopic that can freely be set by the user.
A stream can be started and stopped. The system manager configuration allows a stream to be started by
default as soon as TwinCAT starts in run-mode. Additionally, streams can be started and stopped from PLC
code.
When connected to a broker, the logger first sends the stream description followed by the Tx-description and
symbol info as soon as the stream starts. This enables recipients to take all measures that are needed
before data arrives. Finally, data is sent cyclically.
TF350034 Version: 1.0
Page 35

Technical introduction
For the file-mode, the TwinCAT Boot directory on the target device is used as a base for a dedicated
Analytics directory, which in turn contains one subdirectory per stream as soon as the respective TwinCAT
project has been activated. Inside the stream’s directory, a dedicated .tas-file holds the symbol info
whereas .tay-files, which are created cyclically, contain the stream data.
Relation of Logger and Streams
One data logger can control several streams. As will be described more detailed in the Configuration section
a user can add one or more data loggers to the Analytics configuration. Streams then are added
automatically, depending on what variables are available to be logged. To understand how streams are
assigned to a logger it is useful to understand that every stream has specific characteristics. One
characteristic, the cycle time, comes from the fact that every variable that is acted upon cyclically is subject
to a cyclic task; therefore, cycle times that underlie different variables can vary. Since a stream has a fixed
cycle time by definition and to decouple tasks with the same cycle time, one stream is created for every task
that drives relevant variables. Additionally, it is purposeful to further divide streams depending on the stream
source, meaning the origin PLC instance or TcCom object. This enables users to send variables of different
sources to different MQTT topics and start/stop the transmission independently. Eventually it all comes down
to the following scheme:
For every stream source and every task that drives variables of that source, a stream is created.
When configuring the data logger, there are configuration parameters that all streams have in common and
those that are stream specific. The logger specifies the destination, the compression method, MQTT
credentials etc. whereas e.g. the data size and start/stop-functionality are stream specific.
In most cases it might not be necessary to send or write data every task cycle, so the data of a stream
recorded in a cycle, a so-called sample, can be buffered before sending it to the broker or writing it to file.
The number of samples in a buffer and thus the cycle time of a buffer being sent/written can be configured.
Moreover, the number of buffers in a file and thus the file size can be configured.
5.2 MQTT
MQTT(Message Queueing Telemetry Transport) is a publisher/subscriber-based communication protocol,
which enables message-based transfer between applications. A central component of this transfer type is
the so-called message broker, which distributes messages between the individual applications or the sender
and receiver of a message. The message broker decouples the sender and receiver, so that it is not
necessary for the sender and receiver to know their respective address information. During sending and
receiving all communication devices contact the message broker, which handles the distribution of the
messages.
TF3500 35Version: 1.0
Page 36

Technical introduction
Payload
The content of an MQTT message is referred to as payload. Data of any type can be transferred, e.g. text,
individual numerical values or a whole information structure.
Message payload formatting
Note that the data type and the formatting of the content must be known to the sender and receiver
side, particularly when binary information (alignment) or strings (with or without zero termination)
are sent.
Topics
If a message broker is used that is based on the MQTT protocol, sending (publish mode) and subscribing
(subscribe mode) of messages is organized with the aid of so-called topics. The message broker filters
incoming messages based on these topics for each connected client. A topic may consist of several levels;
the individual levels are separated by “/”.
Example: Campus / Building1 / Floor2 / Room3 / Temperature
When a publisher sends a message, it always specifies for which topic it is intended. A subscriber indicates
which topic it is interested in. The message broker forwards the message accordingly.
TF350036 Version: 1.0
Page 37

Technical introduction
Communication example 1 from the diagram above:
• An application subscribes to “topic1”.
• A controller publishes a message to “topic1”.
• The message broker forwards the message to the application accordingly.
Communication example 2 from the diagram above:
• A controller subscribes to “topic2”.
• An application publishes a message to “topic2”.
• The message broker forwards the message to the controller accordingly.
Wildcards
It is possible to use wildcards in conjunction with topics. A wildcard is used to represent part of the topic. In
this case a subscriber may receive messages from several topics. A distinction is made between two types
of wildcards:
• Single-level wildcards
• Multi-level wildcards
Example for single-level wildcard:
The + symbol describes a single-level wildcard. If it is used by the subscriber as described below, for
example, corresponding messages to the topics are either received by the subscriber or not.
• The receiver subscribes to Campus/Building1/Floor2/+/Temperature
• The publisher sends to Campus/Building1/Floor2/Room1/Temperature - OK
• The publisher sends to Campus/Building1/Floor2/Room2/Temperature - OK
• The publisher sends to Campus/Building42/Floor1/Room1/Temperature - NOK
• The publisher sends to Campus/Building1/Floor2/Room1/Fridge/Temperature - NOK
Example for multi-level wildcard:
TF3500 37Version: 1.0
Page 38

Technical introduction
The # symbol describes a multi-level wildcard. If it is used by the subscriber as described below, for
example, corresponding messages to the topics are either received by the subscriber or not. The # symbol
must always be the last symbol in a topic string.
• The receiver subscribes to Campus/Building1/Floor2/#
• The publisher sends to Campus/Building1/Floor2/Room1/Temperature - OK
• The publisher sends to Campus/Building1/Floor2/Room2/Temperature - OK
• The publisher sends to Campus/Building42/Floor1/Room1/Temperature - NOK
• The publisher sends to Campus/Building1/Floor2/Room1/Fridge/Temperature - OK
• The publisher sends to Campus/Building1/Floor2/Room1/Humidity - OK
QoS (Quality of Service)
QoS is an arrangement between the sender and receiver of a message with regard to guaranteeing of the
message transfer. MQTT features three different levels:
• 0 – not more than once
• 1 – at least once
• 2 – exactly once
Both types of communication (publish/subscribe) with the message broker must be taken into account and
considered separately. The QoS level that a client uses for publishing a message is set by the respective
client. When the broker forwards the message to client that has subscribed to the topic, the subscriber uses
the QoS level that was specified when the subscription was established. This means that a QoS level that
may have been specified as 2 by the publisher can be “overwritten” with 0 by the subscriber.
QoS-Level 0
At this QoS level the receiver does not acknowledge receipt. The message is not sent a second time.
QoS-Level 1
At this QoS level the system guarantees that the message arrives at the receiver at least once, although the
message may arrive more than once. The sender stores the message internally until it has received an
acknowledgement from the receiver in the form of a PUBACK message. If the PUBACK message fails to
arrive within a certain time, the message is resent.
TF350038 Version: 1.0
Page 39

Technical introduction
QoS-Level 2
At this QoS level the system guarantees that the message arrives at the receiver no more than once. On the
MQTT side this is realized through a handshake mechanism. QoS level 2 is the safest level (from a message
transfer perspective), but also the slowest. When a receiver receives a message with QoS level 2, it
acknowledges the message with a PUBREC. The sender of the message remembers it internally until it has
received a PUBCOMP. This additional handshake (compared with QoS 1) is important for avoiding duplicate
transfer of the message. Once the sender of the message receives a PUBREC, it can discard the initial
publish information, since it knows that the message was received once by the receiver. In other words, it
remembers the PUBREC internally and sends a PUBREL. Once the receiver has received a PUBREL, it can
discard the previously remembered states and respond with a PUBCOMP, and vice versa. Whenever a
package is lost, the respective communication device is responsible for resending the last message after a
certain time.
Security
When a connection to the message broker is established, it is possible to use security mechanisms such as
TLS, in order to encrypt the communication link or to realize authentication between client and message
broker.
Sources
For further and more detailed information about MQTT we recommend the following blog series:
HiveMq blog: http://www.hivemq.com/blog/mqtt-essentials/ (the main basis for this article)
5.3 Data Compression
In order to reduce the amount of data to be sent without reducing the amount of information and thus
enhance the performance, a compression method derived from the Run Length Encoding method can be
used. It utilizes the fact, that data of two consecutive samples in a buffer may not vary in parts. Thus knowing
what parts of a previously sent buffer are equal in conjunction with the varying data, a recipient can
reconstruct the next buffer without the need to receive the whole buffer. After sending the first buffer
uncompressed, the logger constructs the compressed buffer by comparing user-specified units of data (e.g.
TF3500 39Version: 1.0
Page 40

Technical introduction
every byte, every 8 byte etc.) one after another. The logger counts the amount of data units (called
Compression Compare Width) that are equal and places this information in the buffer instead of the data.
Dependent on the kind of data this can lead to a data saving or overhead. To decide whether a compression
is purposeful or not the user is provided with a data compression saving value, which can be found on the
Online-tab of every stream dialog window. A positive value indicates saving and a negative value indicates
overhead.
TF350040 Version: 1.0
Page 41

Configuration
6 Configuration
6.1 Basic settings
To configure the TwinCAT Analytics Logger the user is provided with a dedicated Analytics configuration
inside of a XAE project.
TF3500 41Version: 1.0
Page 42

Configuration
To add a data logger choose the respective item in the context menu of this configuration node.
This may either result in the additional Data Logger node alone or subordinate stream nodes in case there
already are variables that can be logged.
TF350042 Version: 1.0
Page 43

Configuration
By double clicking the new Data Logger node the editor window will be open. In the Parameter tab you can
make your specific Analytics Logger settings.
• MQTT Host Name: Provide here the host name or IP address of your native MQTT Message Broker
• MQTT Tcp Port: Here set the Tcp port for the communication. Default MQTT port: 1883
• MQTT Main Topic: It is possible to provide an own and individual main topic. Sample: Beckhoff/Verl/
Production/Drives/Machine5 – the Analytics Logger will add automatically his own specific subtopics:
Beckhoff/Verl/Production/Drives/Machine5/Bin/Tx/Data
• MQTT Client ID: The client identifier is an identifier of each MQTT client connecting to a native MQTT
Message Broker. It should be unique per Broker.
• MQTT User Name: MQTT allows to send a username for authenticating the client.
• MQTT Password: MQTT also allows to send a password for authenticating the client and
authorization.
• Data Format: Here the user can choose between IOT_FORMAT_FILE and IOT_FORMAT_BINARY.
By using the FILE format the Analytics Logger store the data in local binary files and all settings above
are not necessary anymore. The files will be stored in C:\TwinCAT\3.1\Boot\Analytics. By using
BINARY the data will send to the configured MQTT Message Broker.
It is possible to have multiple Logger in one TwinCAT project to communicate data to different MQTT
Message Broker or to have partly a storage in a local binary file.
6.1.1 TLS
TLS(Transport Layer Security) provide a secure communication channel between a client and a server. At
its core, TLS is cryptographic protocols which use a handshake mechanism to negotiate various parameters
to create a secure connection between the client and the server. The TwinCAT Analytics Logger is
supporting TLS version 1.2.
MQTT communication with TLS
By the usage of certificates the TCP port 8883 is exclusively reserved for MQTT over TLS!
On the TLS tab of the Data Logger your first choice is the TLS Mode in a drop down box. Depending on the
Message Broker it is possible to use different TLS mechanism/modes. The Analytics Logger is supporting
the modes CA Certificates, CA Certificates & Client Certificate and the Preshared Key (PSK) mode.
TF3500 43Version: 1.0
Page 44

Configuration
CA Certificate
Encryption and authentication via TLS can also be accomplished through a certificate authority (CA). The CA
provides a signature via the public key for all communication clients. In this case an MQTT client connect to
a Message Broker without a dedicated client certificate.
TF350044 Version: 1.0
Page 45

Configuration
CA Certificate & Client Certificate
Encryption and authentication via TLS can also be accomplished through a certificate authority (CA). The CA
provides a signature via the public key for the message broker (the so-called server key) and usually also for
all connecting clients. All communication devices can then trust each other, because the issuing certificate
authority is trusted.
Preshared Key (PSK)
The TLS PreSharedKey (PSK) method offers a simple option for realizing encryption between client and
message broker. Client and broker recognize a common password, which is used to encrypt and decrypt the
packages.
TF3500 45Version: 1.0
Page 46

Configuration
6.2 Data Streams
If variables are available for recording they will be shown automatically as a so called Stream. At the moment
it is possible to record data directly from the EtherCAT process image or from the PLC application.
TF350046 Version: 1.0
Page 47

Configuration
PLC Application:
If variables from PLC should recorded by the Analytics Logger, the user must set an attribute in front of each
variable in the variable declaration.
The attribute syntax is: {attribute 'TcAnalytics'}
As already described a new stream is automatically add to the Analytics Logger configuration after rebuild
of the PLC project. In the stream a Selection tab is available to choose finally the variables by checkboxes
who should be recorded.
TF3500 47Version: 1.0
Page 48

Configuration
Process Image:
If an EtherCAT process image is available in the given configuration, an additional stream will be shown
under the Data Logger tree node.
On the Selection tab the user can choose again the values who should be recorded by the Analytics Logger.
TF350048 Version: 1.0
Page 49

Configuration
Start Record
With the activation of the TwinCAT configuration the Analytics Logger starts logging. Depending on the basic
settings to a MQTT Message Broker or into a local binary file. By the given format there are different settings
possibilities on the Data Handling tab of each Stream. See therefore the following chapter.
6.2.1 Data Handling
In the Data Handling tab you can make general settings for the package size of the recorded data.
Depending on the given data format it gives additional settings.
TF3500 49Version: 1.0
Page 50

Configuration
Data Size: This is a read-only value and provide the size of the given variable selection for this stream.
Max ADS Buffer: Here you can set the number of buffered cycles before write to file or send to Message
Broker. By 1ms cycle time and 32 buffers the Analytics Logger buffered 32ms before operated. It is an
individual setting depending on the system resources.
Max File Size: Only available by IOT_FORMAT_FILE. You can give the maximum file size before starting
with a new file. The files will be stored under C:\TwinCAT\3.1\Boot\Analytics.
Data format: MQTT
If the data format is IOT_FORMAT_BINARY it is possible to activate an additional checkbox for queuing
messages by disconnect.
File Store: If this option is activated the queued messages will stored in a temporary file at the hard disk.
Otherwise the data will be stored in the RAM when connection to the Message Broker is disconnected.
Queue Size: Is the number of configured ADS Buffer which should be stored in the case of a lost
connection.
TF350050 Version: 1.0
Page 51

Configuration
Data format: File
If the data format is IOT_FORMAT_FILE it is possible to activate an additional checkbox for a ring buffer.
File Count: You can set up a ring buffer system for the binary files. With the File Count parameter you can
give a number of files who should be part of the ring buffer. The ring buffer time depends on the given Max
File Size.
6.3 Using the Programming Interface
As described in the Technical Introduction a stream can be started and stopped from PLC code using
Structured Text. For that, the streams of a data logger, themselves being TcCom-objects provide an
interface called ITcAnalyticsStream comprising two methods, StartAnalyticsStream() and
StopAnalyticsStream(). Follow the following steps to use the interface, the code samples may be useful, too:
Declare a variable of the type ITcAnalyticsStream and another one of the type OTCID for the object ID of the
correspondent stream. For diagnostic purposes, an HRESULT variable is advisable.
HR:HRESULT:=S_OK;
{attribute'tcinitsymbol'}
oidPlcStream1:OTCID;
ipPlcStream1:ITcAnalyticsStream;
Next, add the attribute ‘tcinitsymbol’ above the OTCID variable. This way, it doesn’t need to be initialized
statically in the source code, instead it be initialized at configuration time by double clicking the PLC instance
node in the project tree and selecting the relevant stream in the combo box as illustrated in the following
picture.
Fig.1:
After that, get an interface pointer using following the TcCom-object server method and the interface’s IID.
IFipPlcStream1=0ANDoidPlcStream1<>0THEN
HR:=FW_ObjMgr_GetObjectInstance(oidPlcStream1,IID_ITcAnalyticsStream,ADR(ipPlcStream1));
END_IF
Now you can use the interface pointer to call interface’s methods. As shown in the following example:
TF3500 51Version: 1.0
Page 52

Configuration
IFipPlcStream1<>0THEN
IFbStartPlcStream1THEN
ipPlcStream1.StartAnalyticsStream();
bStartPlcStream1:=FALSE;
END_IF
IFbStopPlcStream1THEN
ipPlcStream1.StopAnalyticsStream();
bStopPlcStream1:=FALSE;
END_IF
END_IF
The stream is started in the same cycle StartAnalyticsStream() is called and will include the logged variable
values. The stream is stopped in the same cycle StopAnalyticsStream() is called but will not include the
variable values of this cycle.
In the Samples section of this documentation you can find a sample program that includes the here
presented code snippets.
TF350052 Version: 1.0
Page 53

Samples
7 Samples
Data Logger Start/Stop stream from PLC code sample:
https://infosys.beckhoff.com/content/1033/tf3500_tc3_analytics_logger/Resources/zip/6904617099.zip
TF3500 53Version: 1.0
Page 54

Appendix
8 Appendix
8.1 FAQ - frequently asked questions and answers
In this section frequently asked questions are answered in order to make your work with TwinCAT Analytics
Logger easier. If you have further questions, please contact our support team support@beckhoff.com.
Should I always use TLS with MQTT? [}54]
Is it possible to have multiple connections? [}54]
Is it possible to control the Analytics Logger by a PLC function block? [}54]
?Should I always use TLS with MQTT?
!Yes, you should if you can. If you can afford the overhead in CPU and bandwidth, then a secure
communication channel is invaluable. Depending on the general CPU performance it could be possible to
have a noticeable reduction of communication performance.
?Is it possible to have multiple connections?
!Yes, you can connect the Analytics Logger at the same time to different Message Broker just by adding a
new instance of the Logger. Also it is possible to have one instance of the Logger for an MQTT
communication to a Message Broker and at the same time one instance for writing data into Analytics File to
the local system.
?Is it possible to control the Analytics Logger by a PLC function block?
!There is no special function block to control the Analytics Logger. But you can use an interface of the
Analytics Logger to control him with easy commands like start and stop from the PLC. How to do see this
[}51] cheapter.
TF350054 Version: 1.0
Page 55

Page 56

More Information:
www.beckhoff.com/tf3500/
Beckhoff Automation GmbH & Co. KG
Hülshorstweg 20
33415 Verl
Germany
Phone: +49 5246 9630
info@beckhoff.com
www.beckhoff.com
 Loading...