

Page 1
Manual | EN
TE3520
TwinCAT 3 Analytics Service Tool
8/12/2020 | Version: 1.0
Page 2

Page 3

Table of contents
Table of contents
1 Foreword ....................................................................................................................................................5
1.1 Notes on the documentation..............................................................................................................5
1.2 Safety instructions .............................................................................................................................6
2 Overview.....................................................................................................................................................7
3 Installation..................................................................................................................................................8
3.1 System requirements.........................................................................................................................8
3.2 Installation and licensing ...................................................................................................................8
3.3 Licensing .........................................................................................................................................11
4 Analytics Workflow - First Steps............................................................................................................14
4.1 Recording data from the machine ...................................................................................................14
4.2 Communication................................................................................................................................17
4.3 Historicize data ................................................................................................................................18
4.4 Analyse data....................................................................................................................................23
5 Technical introduction ............................................................................................................................28
5.1 Basic concept ..................................................................................................................................28
6 Configuration ...........................................................................................................................................30
6.1 Networks..........................................................................................................................................30
6.2 Algorithms........................................................................................................................................31
6.2.1 Analytics - Base ............................................................................................................... 33
6.2.2 Analytics - Classification .................................................................................................. 62
6.2.3 Analytics - Compare ........................................................................................................ 83
6.2.4 Analytics - Math ............................................................................................................... 95
6.2.5 Analytics - Training Base ............................................................................................... 100
6.2.6 Analytics - XTS .............................................................................................................. 102
6.2.7 Analytics - WT................................................................................................................ 106
6.2.8 Analytics - XY Path Analysis.......................................................................................... 108
6.3 Interaction with Scope ...................................................................................................................117
6.4 Working with Historical Data..........................................................................................................121
7 Appendix ................................................................................................................................................124
7.1 FAQ - frequently asked questions and answers............................................................................124
TE3520 3Version: 1.0
Page 4

Table of contents
TE35204 Version: 1.0
Page 5

Foreword
1 Foreword
1.1 Notes on the documentation
This description is only intended for the use of trained specialists in control and automation engineering who
are familiar with applicable national standards.
It is essential that the documentation and the following notes and explanations are followed when installing
and commissioning the components.
It is the duty of the technical personnel to use the documentation published at the respective time of each
installation and commissioning.
The responsible staff must ensure that the application or use of the products described satisfy all the
requirements for safety, including all the relevant laws, regulations, guidelines and standards.
Disclaimer
The documentation has been prepared with care. The products described are, however, constantly under
development.
We reserve the right to revise and change the documentation at any time and without prior announcement.
No claims for the modification of products that have already been supplied may be made on the basis of the
data, diagrams and descriptions in this documentation.
Trademarks
Beckhoff®, TwinCAT®, EtherCAT®, EtherCAT G®, EtherCAT G10®, EtherCAT P®, Safety over EtherCAT®,
TwinSAFE®, XFC®, XTS® and XPlanar® are registered trademarks of and licensed by Beckhoff Automation
GmbH.
Other designations used in this publication may be trademarks whose use by third parties for their own
purposes could violate the rights of the owners.
Patent Pending
The EtherCAT Technology is covered, including but not limited to the following patent applications and
patents:
EP1590927, EP1789857, EP1456722, EP2137893, DE102015105702
with corresponding applications or registrations in various other countries.
EtherCAT® is a registered trademark and patented technology, licensed by Beckhoff Automation GmbH,
Germany
Copyright
© Beckhoff Automation GmbH & Co. KG, Germany.
The reproduction, distribution and utilization of this document as well as the communication of its contents to
others without express authorization are prohibited.
Offenders will be held liable for the payment of damages. All rights reserved in the event of the grant of a
patent, utility model or design.
TE3520 5Version: 1.0
Page 6
Foreword
1.2 Safety instructions
Safety regulations
Please note the following safety instructions and explanations!
Product-specific safety instructions can be found on following pages or in the areas mounting, wiring,
commissioning etc.
Exclusion of liability
All the components are supplied in particular hardware and software configurations appropriate for the
application. Modifications to hardware or software configurations other than those described in the
documentation are not permitted, and nullify the liability of Beckhoff Automation GmbH & Co. KG.
Personnel qualification
This description is only intended for trained specialists in control, automation and drive engineering who are
familiar with the applicable national standards.
Description of symbols
In this documentation the following symbols are used with an accompanying safety instruction or note. The
safety instructions must be read carefully and followed without fail!
DANGER
Serious risk of injury!
Failure to follow the safety instructions associated with this symbol directly endangers the life and health of
persons.
WARNING
Risk of injury!
Failure to follow the safety instructions associated with this symbol endangers the life and health of persons.
CAUTION
Personal injuries!
Failure to follow the safety instructions associated with this symbol can lead to injuries to persons.
NOTE
Damage to the environment or devices
Failure to follow the instructions associated with this symbol can lead to damage to the environment or
equipment.
Tip or pointer
This symbol indicates information that contributes to better understanding.
TE35206 Version: 1.0
Page 7
2 Overview
Overview
The TwinCAT3 Analytics Service Tool is used for commissioning the machine and for service engineers.
Live and historical data can be retrieved for an analysis via the IoT connection or offline via file copy. The
analysis is configured in Microsoft Visual Studio where the user has access to a toolbox of algorithms for
implementing the relevant life time, cycle time, envelope or component counter analysis. The outputs of the
algorithms can be used as inputs for other algorithms or can be output as a result directly in the graphical
editor. Signal paths can be visualised with ease by means of parallel recording with the TwinCAT Scope.
Analysis results can be dragged by the user from the analytics configurator and dropped in the charting tool
so as to mark the significant positions in the data stream. The interaction between the product components
offers advantages in particular for diagnosing machine behavior and can highlight optimisation potential. The
user’s location is immaterial owing to the IoT technologies used, which means that service technicians can
perform system and machine diagnostics from practically any location.
Components
• Analytics configurator
• Base Analytics algorithm
• Analytics Storage Provider Recorder
• TwinCAT Scope (TE1300 and TF3300)
• IoT Connectivity
TE3520 7Version: 1.0
Page 8

Installation
3 Installation
3.1 System requirements
The following system requirements must be fulfilled for proper function of TwinCAT Analytics.
Supported operating systems
Windows 7, Windows 8.1 and Windows 10
TwinCAT
Minimum is TwinCAT 3.1 Build 4022.29 for engineering with TwinCAT Analytics Service Tool and
Workbench.
.NET Framework
For the engineering a .NET Framework 4.6.2 is required.
Visual Studio development environment
• Microsoft Visual Studio ® 2013 Update 5
• Visual Studio® 2015
• Visual Studio® 2017
• TwinCAT XAE Shell
In general, it is enough to use the Visual Studio® Shell. If you choose the “Full” setup it will install
automatically the TwinCAT XAE Shell. The “Update” setup provides just an update of the Analytics sources
and no Visual Studio® Shell.
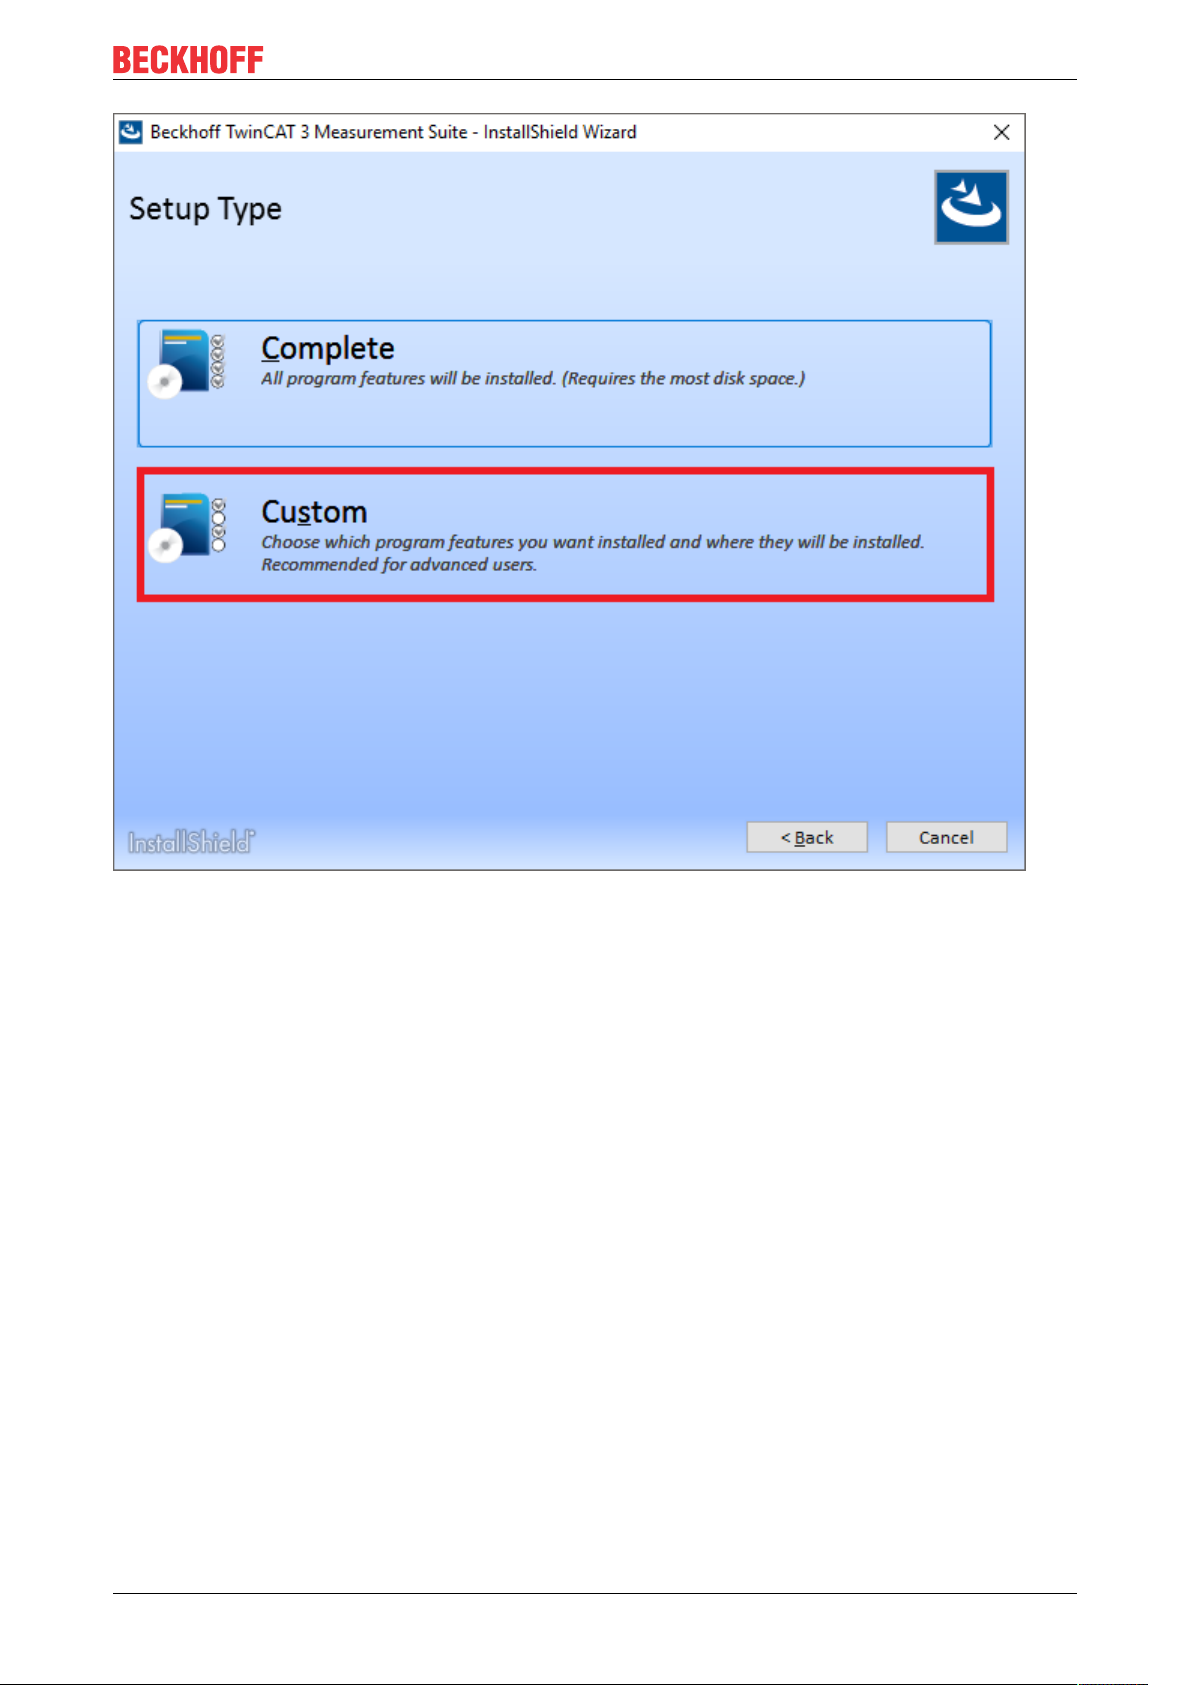
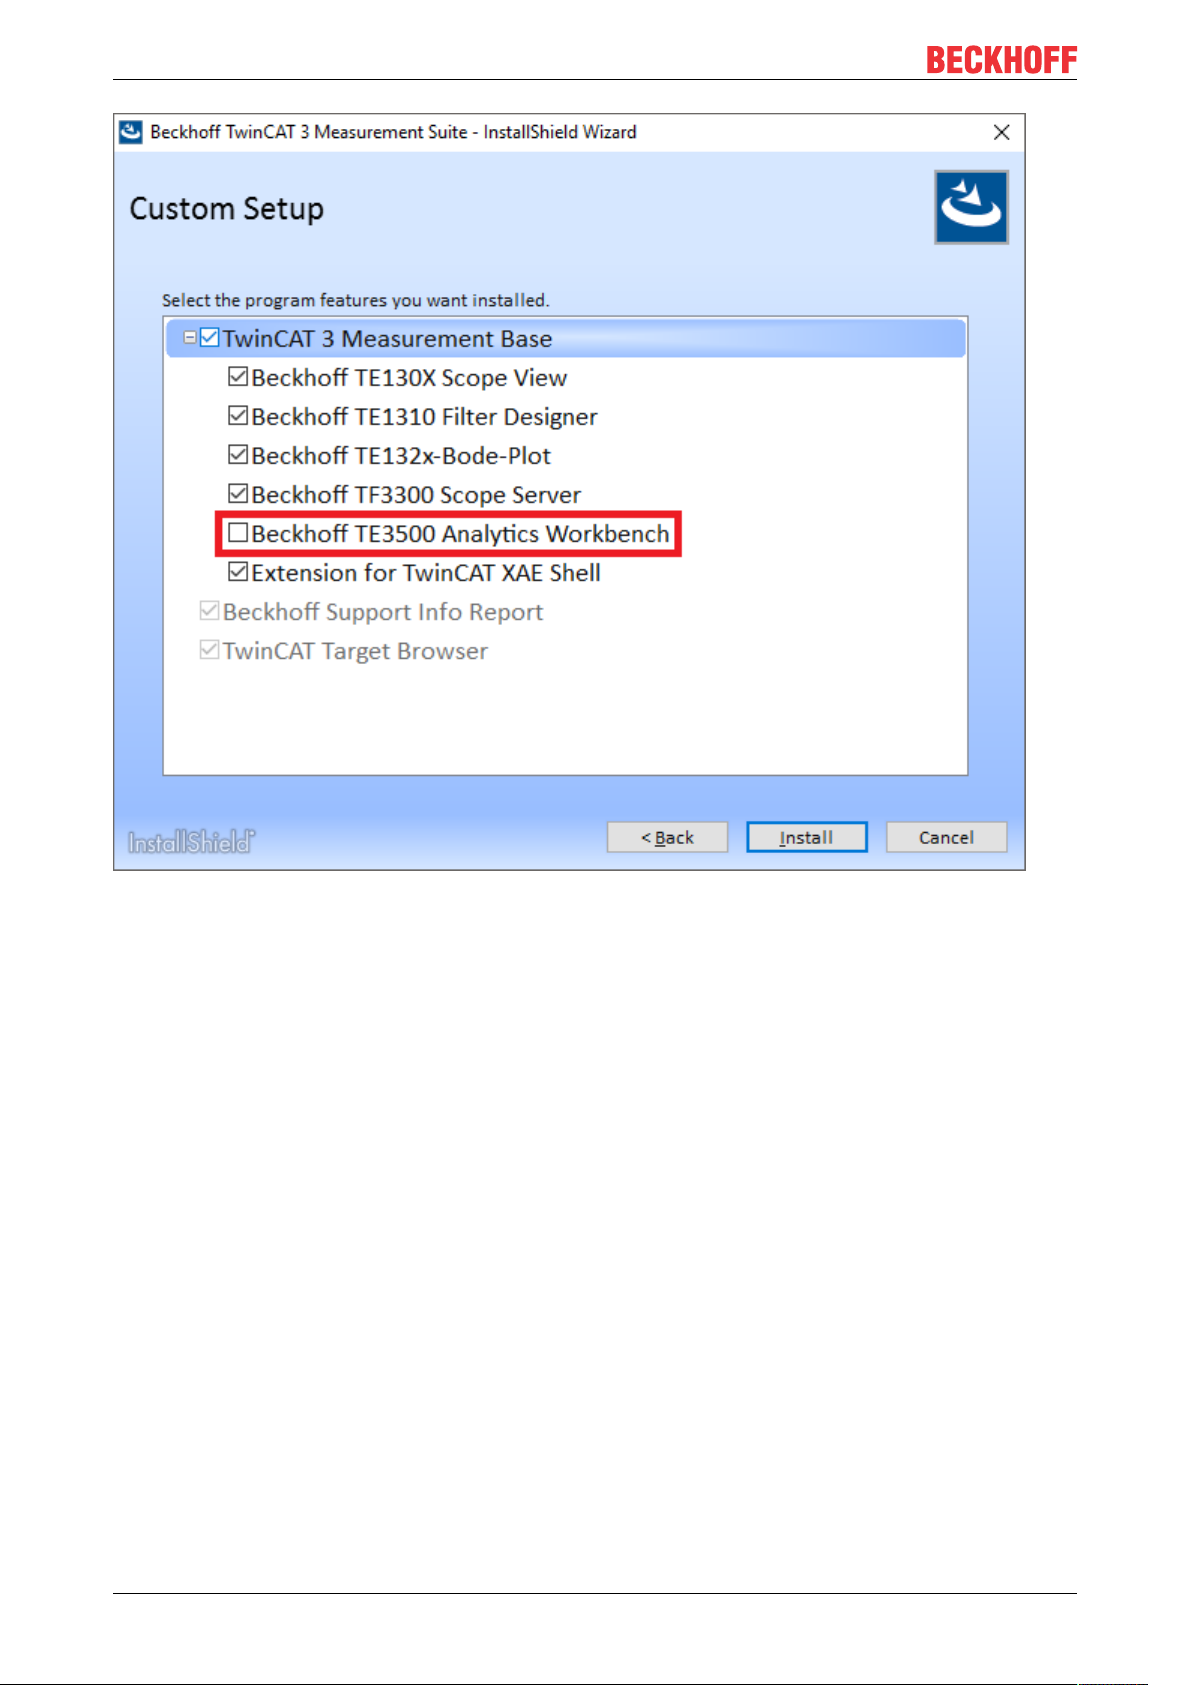
3.2 Installation and licensing
The TwinCAT Analytics setup is part of the TwinCAT Measurement Suite setup. You will be able to choose
the Analytics option only by a click on Custom setup.
TE35208 Version: 1.0
Page 9
Installation
You can enable the option “Beckhoff TE35xx Analytics Engineering”. Depending on the license it provides
later the function of the Analytics Workbench or Service Tool.
TE3520 9Version: 1.0
Page 10
Installation
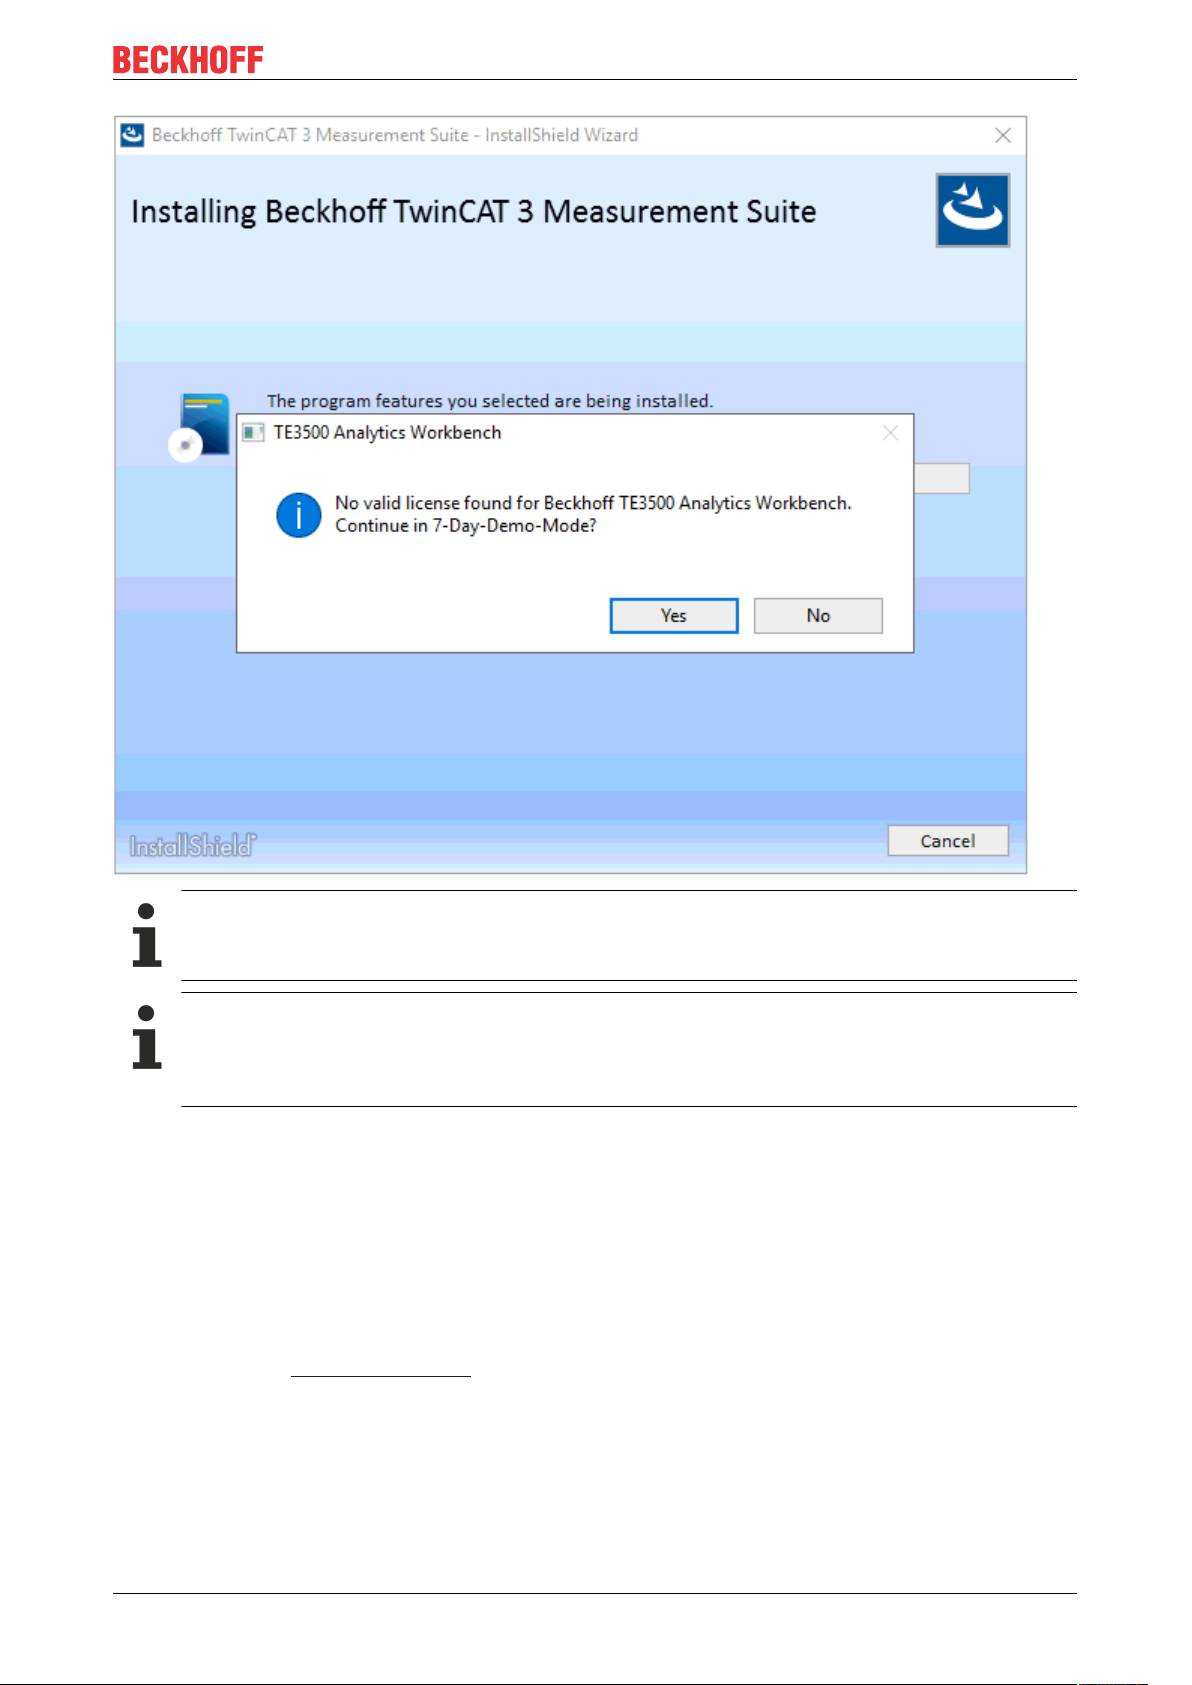
The Analytics setup will check during the process if your system provides the necessary licenses. If not, then
a demo can be activated. This demo can be extended as often as desired, however, no update of the
software/setup on this system is possible. For this purpose, a license must be acquired.
TE352010 Version: 1.0
Page 11
Installation
Setup needs license
Updates of TwinCAT Analytics engineering tools are only possible with a valid maintenance license!
TwinCAT 3 licenses for non-Beckhoff devices
If you use an IPC from a manufacturer other than Beckhoff (TwinCAT 3 plattform level >= 90),
aTwinCAT 3 licencse dongle is highly recommended, if not a prerequisite for successful licensing of
TwinCAT Analytics!
3.3 Licensing
The TwinCAT3function can be activated as a full version or as a 7-day test version. Both license types can
be activated via the TwinCAT 3 development environment (XAE).
Licensing the full version of a TwinCAT3Function
A description of the procedure to license a full version can be found in the Beckhoff Information System in
the documentation "TwinCAT3Licensing".
Licensing the 7-day test version of a TwinCAT3Function
Note: A 7-day test version cannot be enabled for a TwinCAT 3 license dongle.
1. Start the TwinCAT 3 development environment (XAE).
2. Open an existing TwinCAT 3 project or create a new project.
TE3520 11Version: 1.0
Page 12
Installation
3. If you want to activate the license for a remote device, set the desired target system. To do this, select
the target system from the Choose Target System drop-down list in the toolbar.
ð The licensing settings always refer to the selected target system. When the project is activated on
the target system, the corresponding TwinCAT 3 licenses are automatically copied to this system.
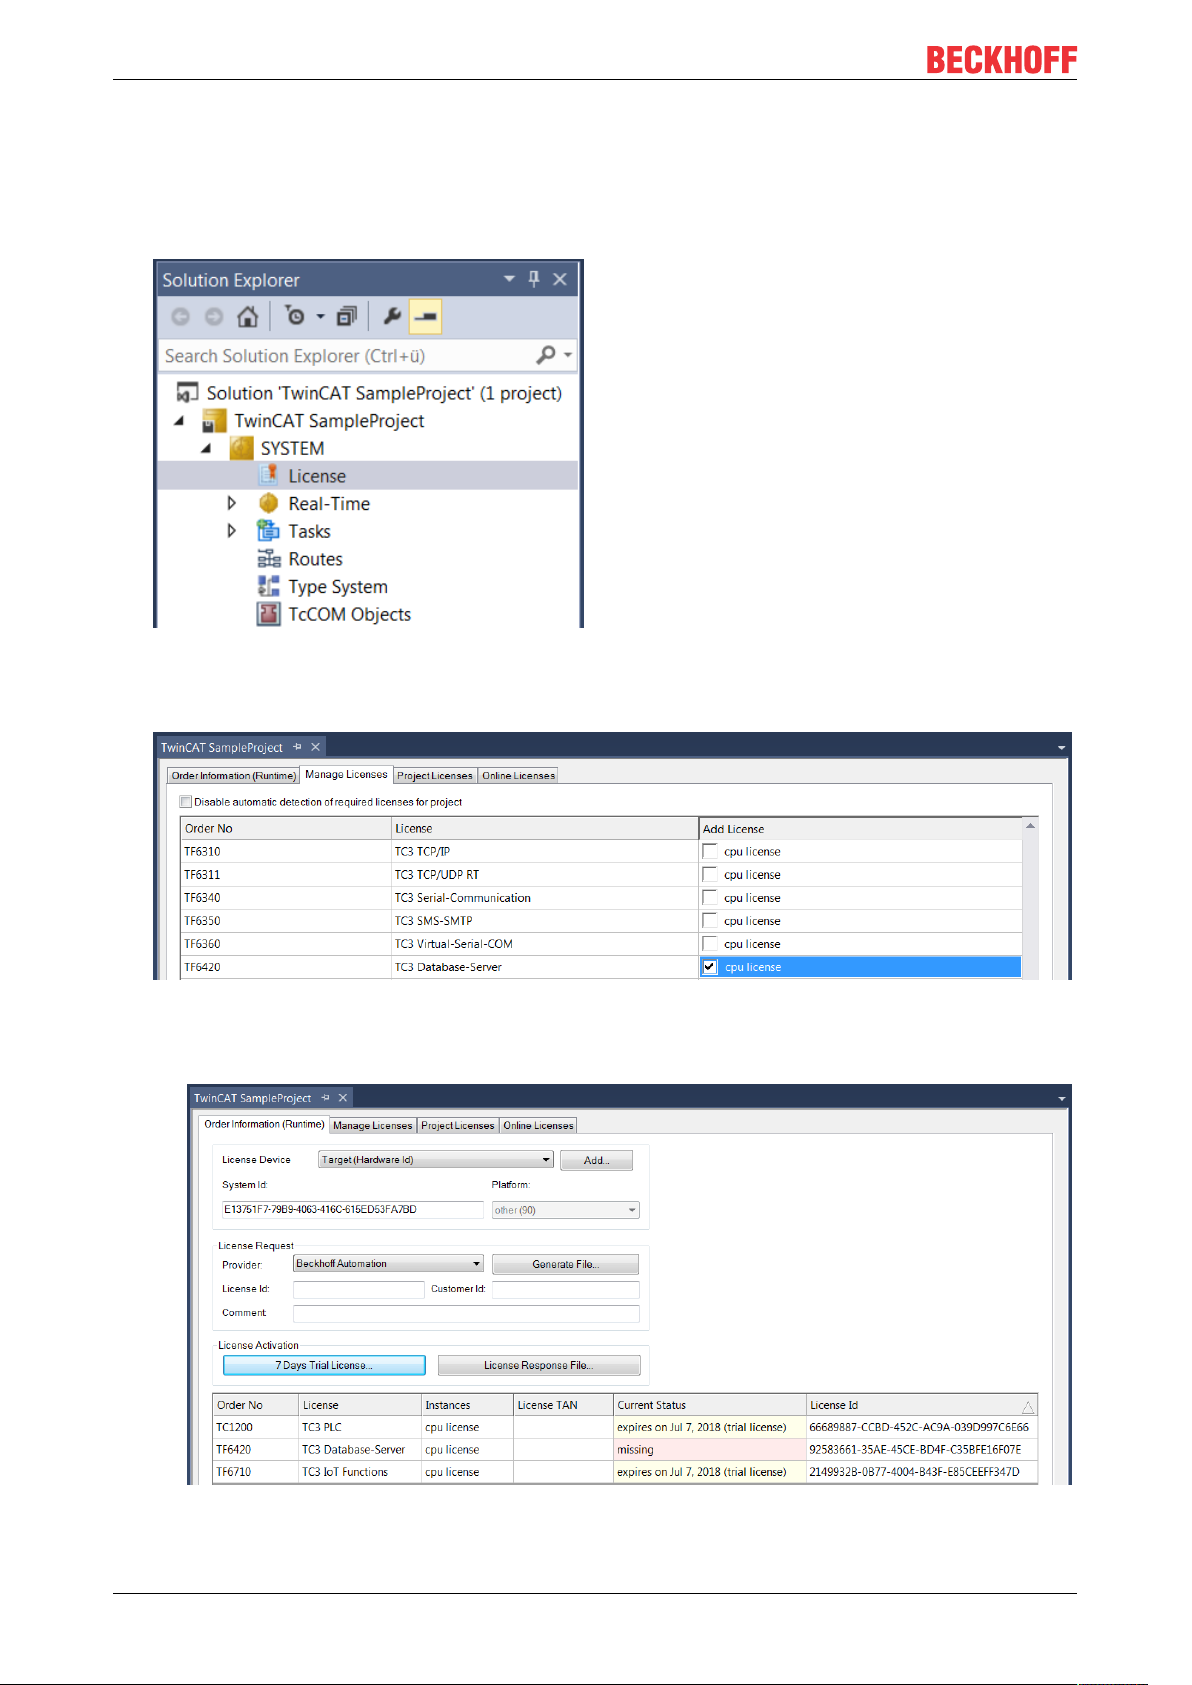
4. In the Solution Explorer, double-click License in the SYSTEM subtree.
ð The TwinCAT 3 license manager opens.
5. Open the Manage Licenses tab. In the AddLicense column, check the check box for the license you
want to add to your project (e.g."TF6420:TC3DatabaseServer").
6. Open the Order Information (Runtime) tab.
ð In the tabular overview of licenses, the previously selected license is displayed with the status
“missing”.
TE352012 Version: 1.0
Page 13
Installation
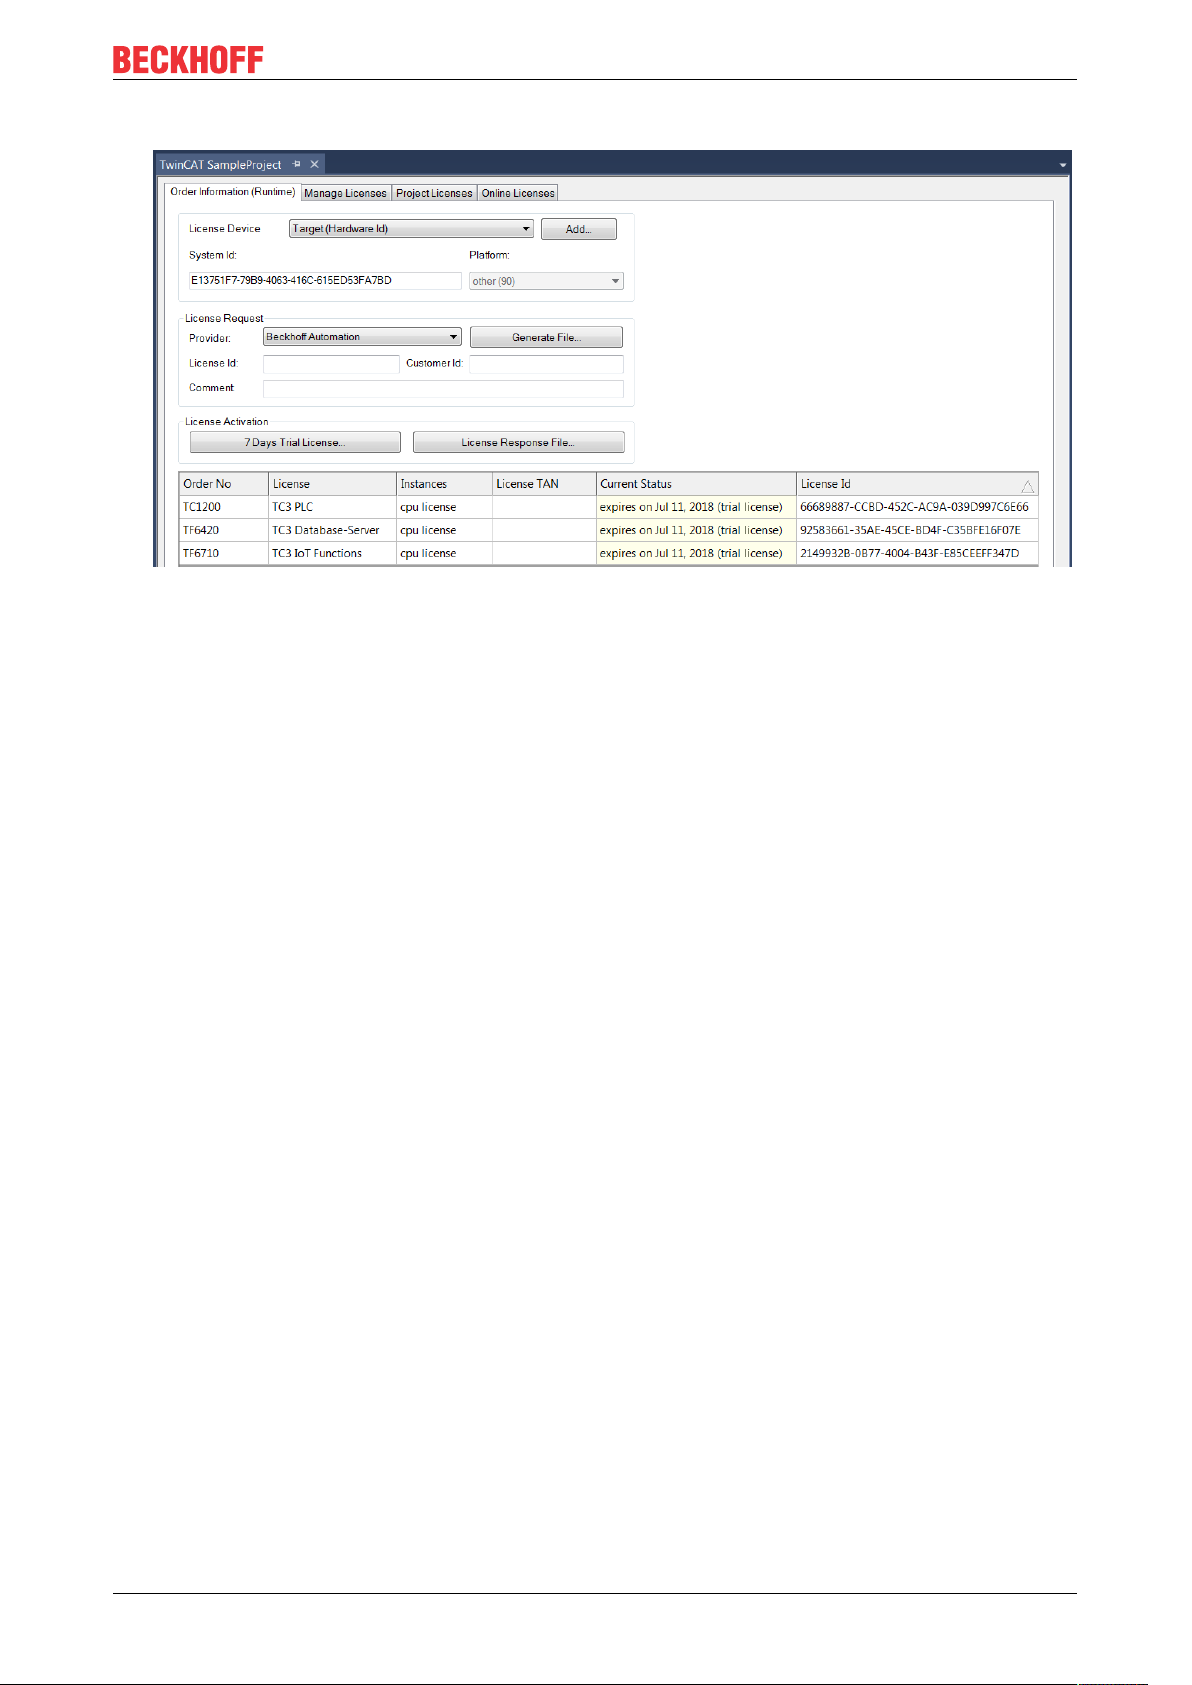
7. Click7-DayTrialLicense... to activate the 7-day trial license.
ð A dialog box opens, prompting you to enter the security code displayed in the dialog.
8. Enter the code exactly as it appears, confirm it and acknowledge the subsequent dialog indicating
successful activation.
ð In the tabular overview of licenses, the license status now indicates the expiry date of the license.
9. Restart the TwinCAT system.
ð The 7-day trial version is enabled.
TE3520 13Version: 1.0
Page 14
Analytics Workflow - First Steps
4 Analytics Workflow - First Steps
This step by step documentation presents the complete TwinCAT Analytics workflow. From the data
acquisition over the communication and historizing up to the evaluation and analysis of the data and to the
presentation of the data in web-based dashboard.
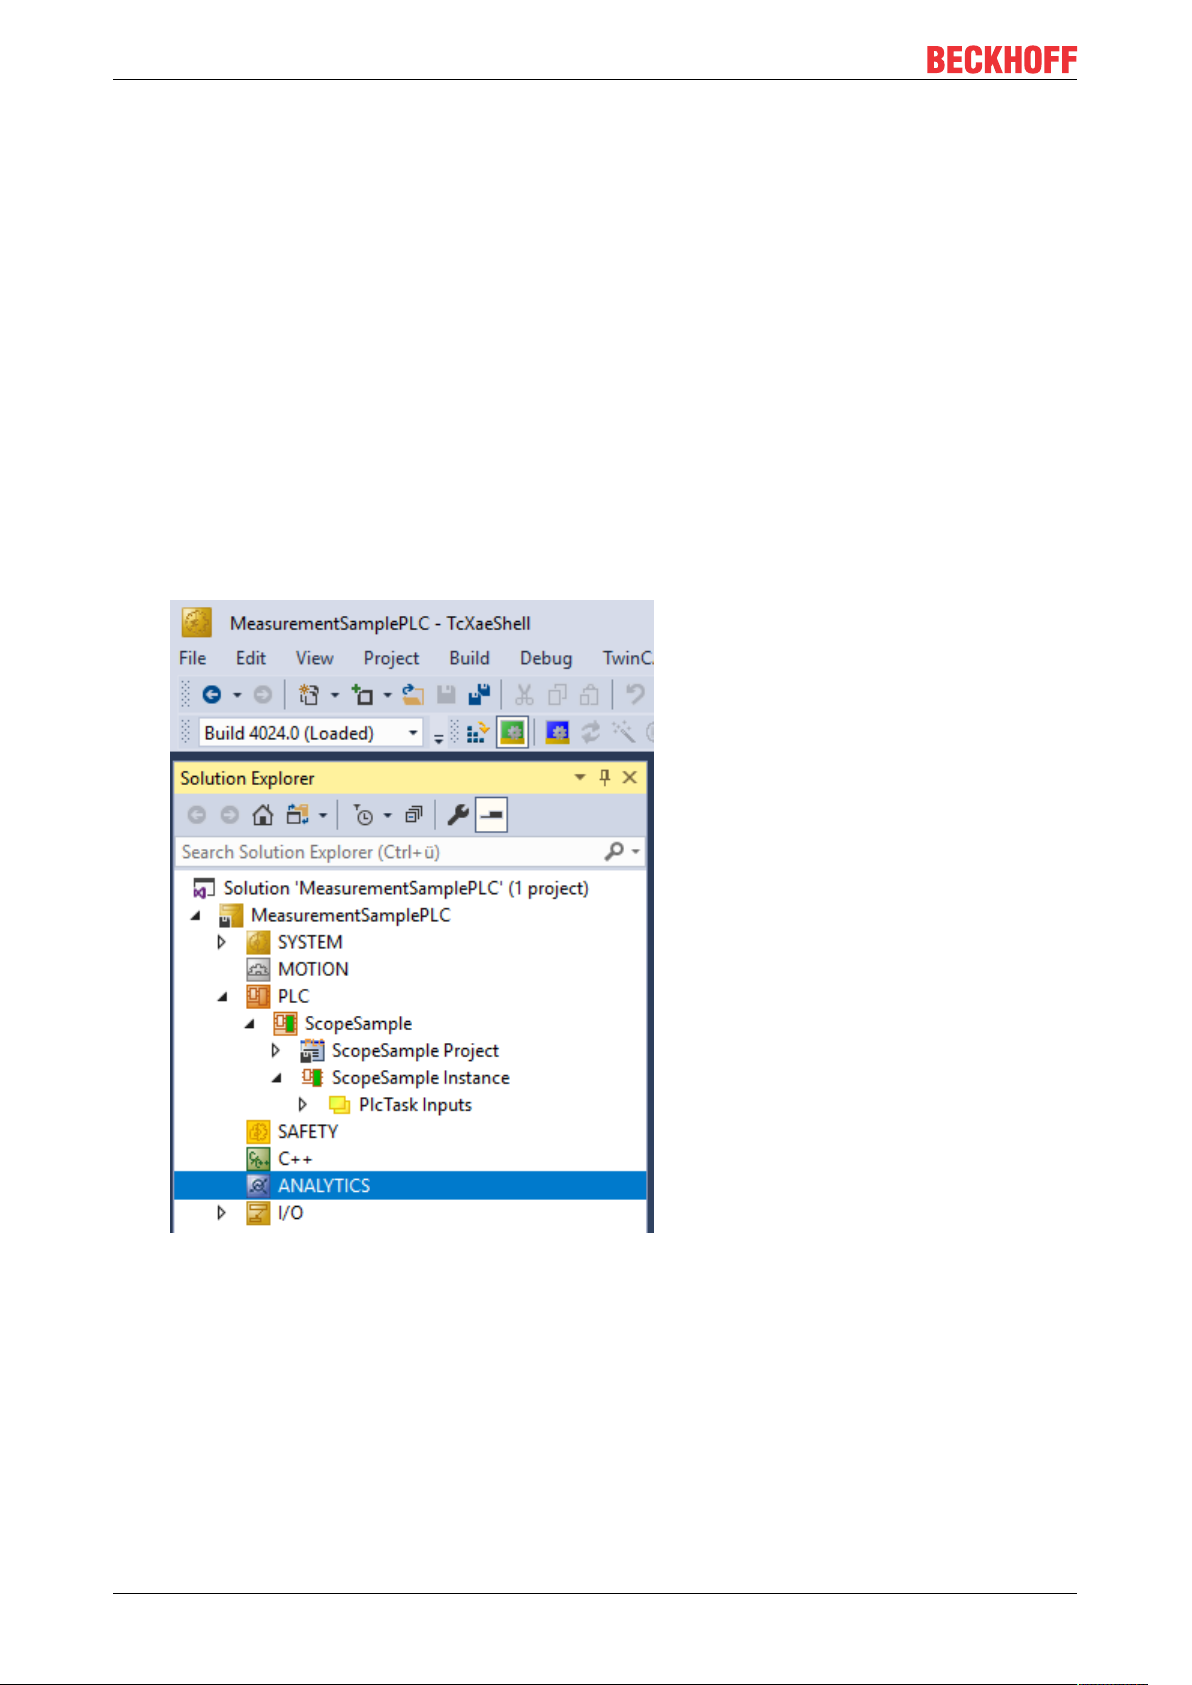
4.1 Recording data from the machine
On the machine side is the Analytics Logger the recorder of process data from the machine image, PLC, NC
and so on. The Logger is working in the real-time context of TwinCAT.
The TwinCAT Analytics Logger is installed with TwinCAT XAE and XAR. The Logger can act as MQTT Client
to communicate the recorded data to a native MQTT Message Broker or store the data in the same data
format in a local binary file. By the usage as MQTT Client the Logger is able to bypass short disconnects to
the Message Broker with a ring buffer functionality. You can configure a ring buffer as well for the local
binary file storage.
• To configure the Analytics Logger you have to navigate in your existing TwinCAT Project to the
Analytics tree node
TE352014 Version: 1.0
Page 15
Analytics Workflow - First Steps
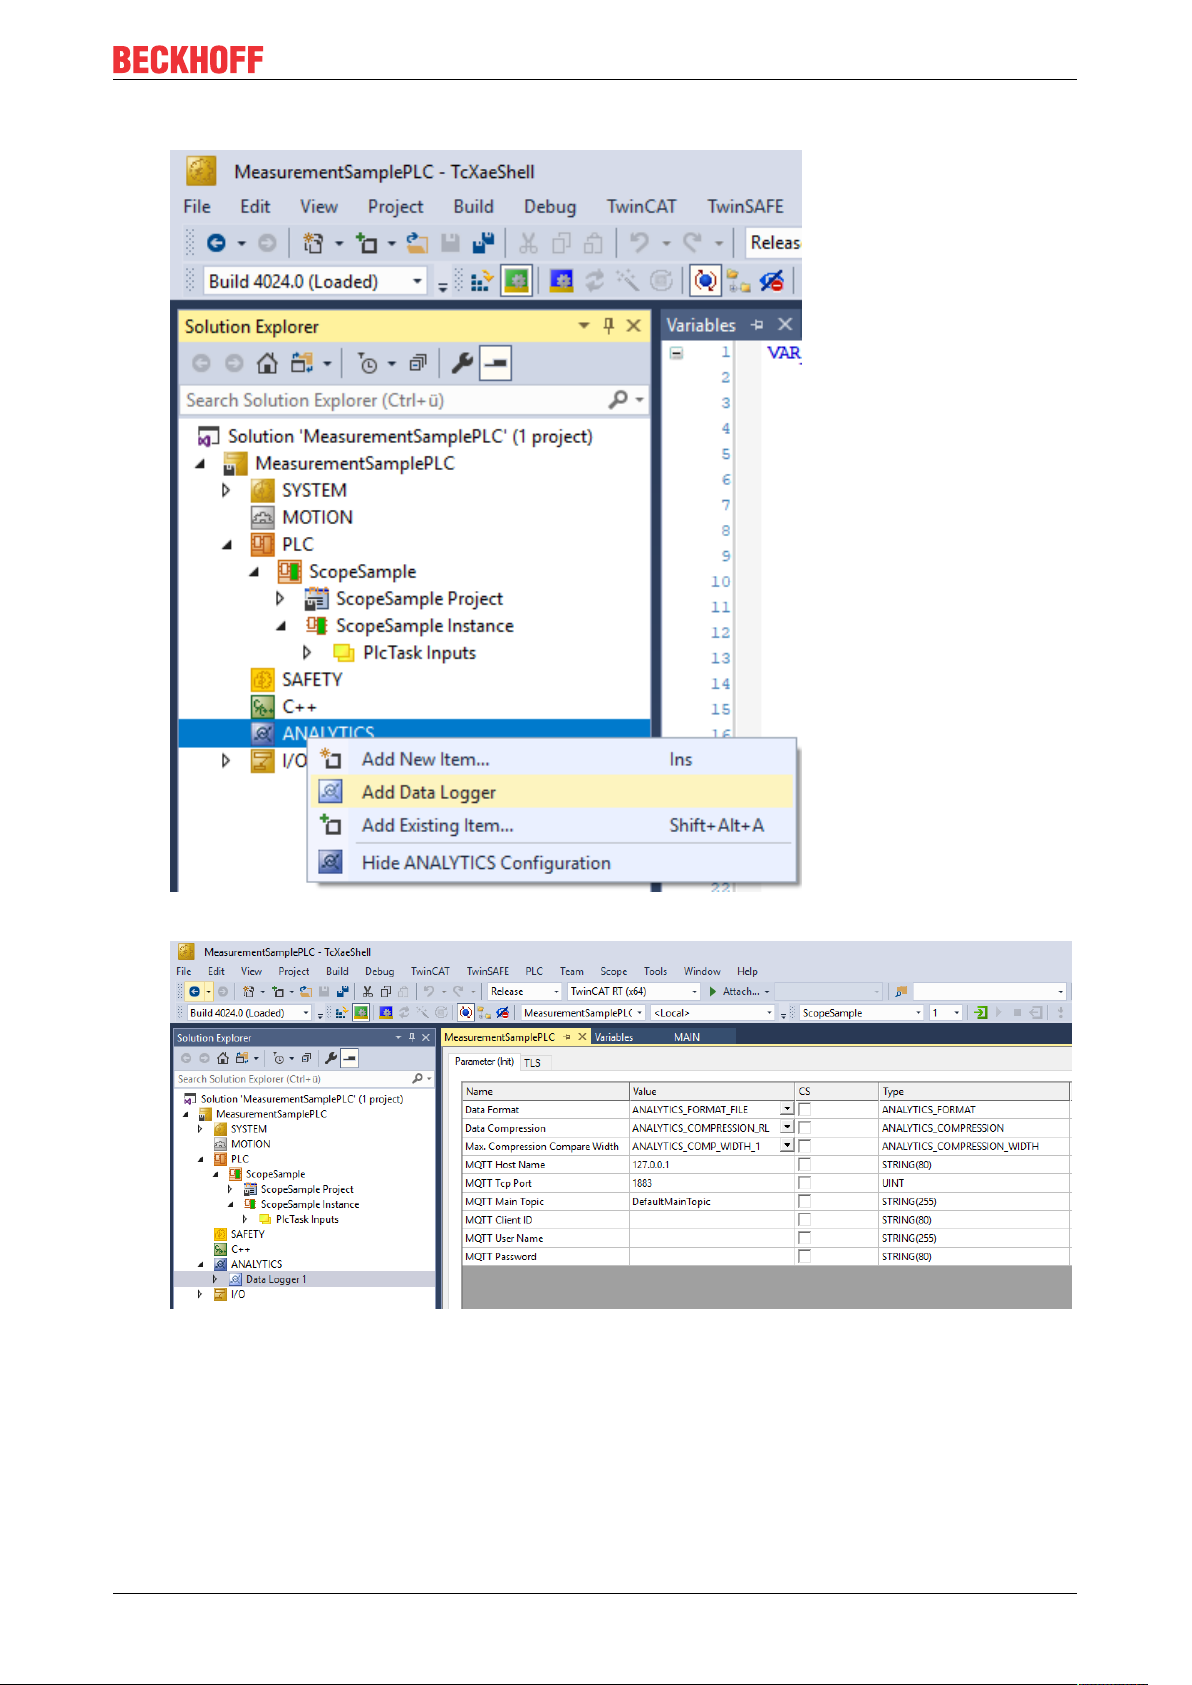
• Right click on this node and click on “Add Data Logger” to add one new instance to your configuration
• For configuring the base settings, please double click on the new tree item
You can make your specific Analytics Logger settings
-Data Format: Binary file or MQTT stream
-FILE format: Analytics Logger stores the data in local binary files and all other settings are not
necessary anymore. The files will be stored in C:\TwinCAT\3.1\Boot\Analytics.
-BINARY: Data will be sent to the configured MQTT Message Broker. You can have multiple Logger in
one TwinCAT project to communicate data to different MQTT Message Broker.
-Data Compression: on (default) or off
TE3520 15Version: 1.0
Page 16
Analytics Workflow - First Steps
-Max Compression: mode of the compression
-MQTT host name
-MQTT Tcp port
-MQTT main topic for own hierarchical levels to keep the identification easy
-MQTT Client ID should be unique in the network
-MQTT username
-MQTT password to make authentication at the message broker
-At the TLS (Transport Layer Security) tab, security settings can be configured. TLS is a secure
communication channel between client and server. By the usage of certificates, the TCP port 8883 is
exclusively reserved for MQTT over TLS. Analytics Logger is supporting the modes CA Certificates, CA
Certificates & Client Certificate and Preshared Key (PSK) mode.
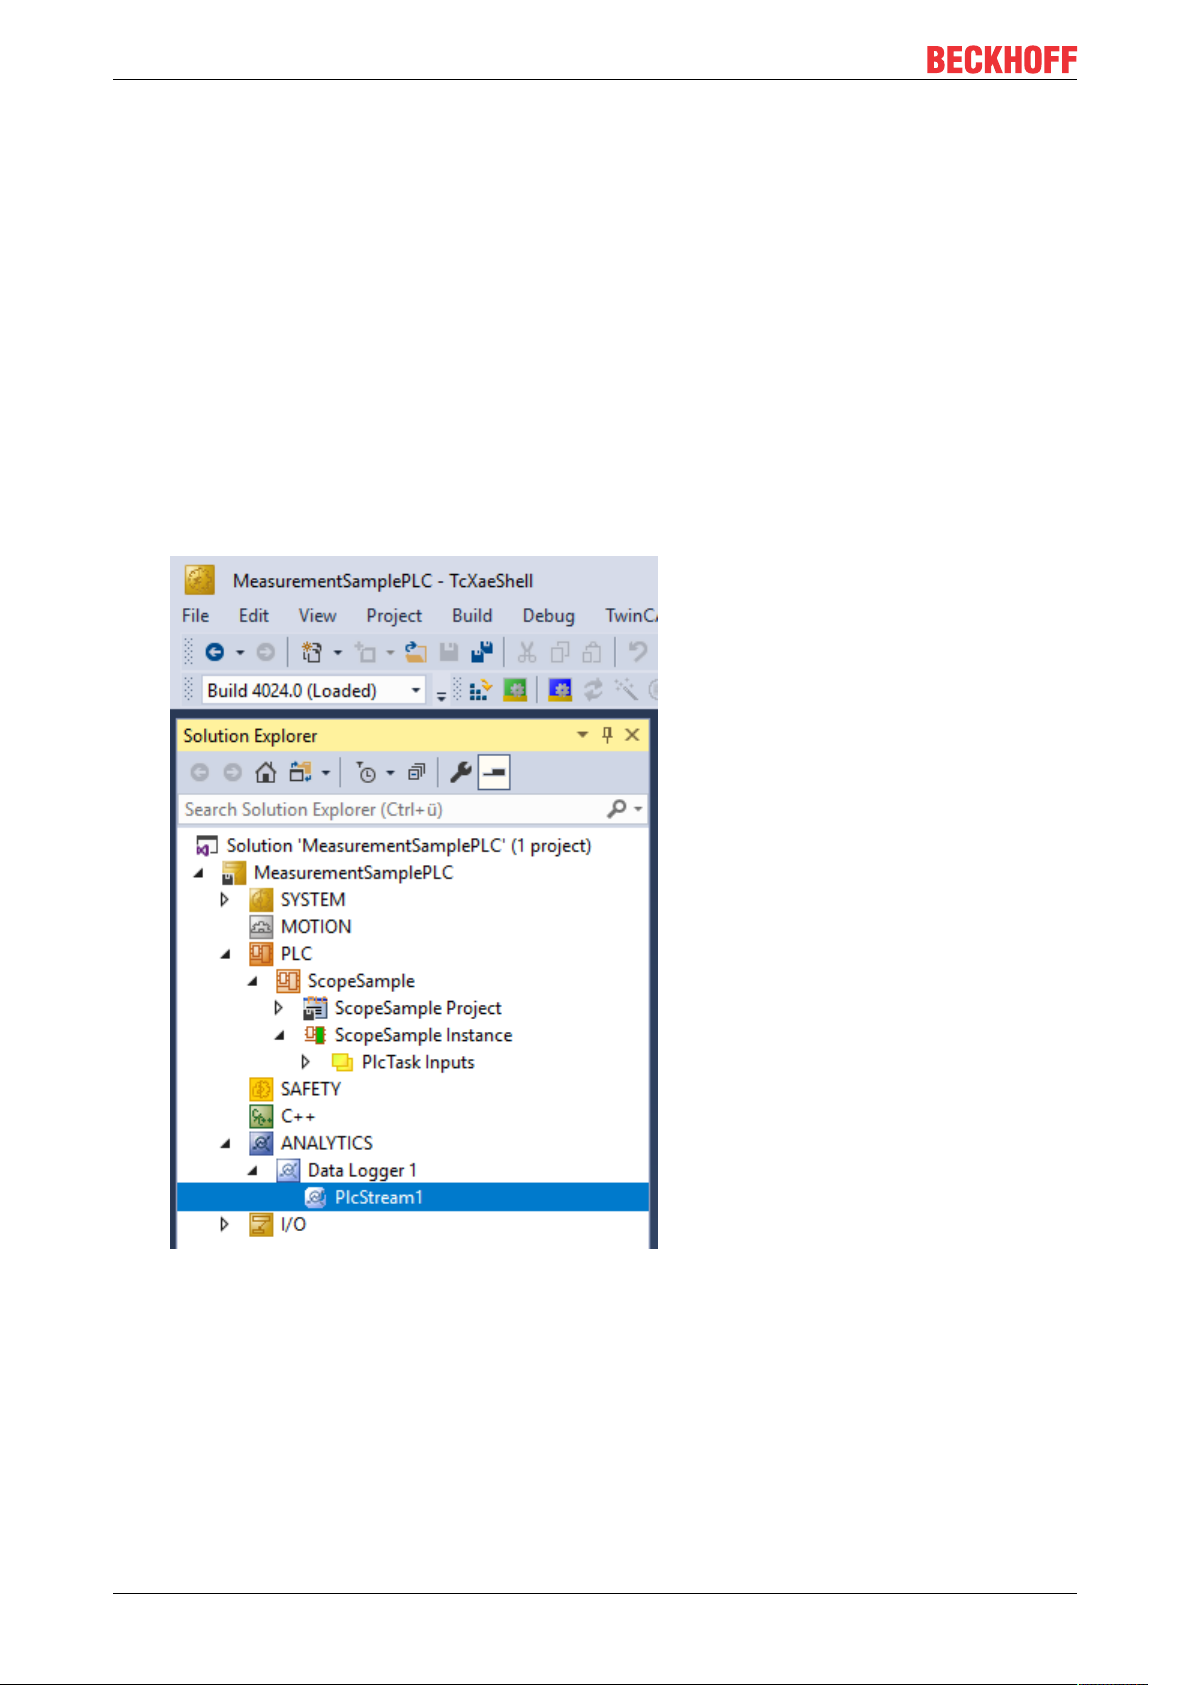
• If variables in your PLC application are marked in the declaration with the attribute {attribute
'TcAnalytics'} they will be shown automatically as a stream below the Data Logger tree node.
An additional device stream will be shown if your configuration provides an EtherCAT Process Image.
TE352016 Version: 1.0
Page 17
Analytics Workflow - First Steps
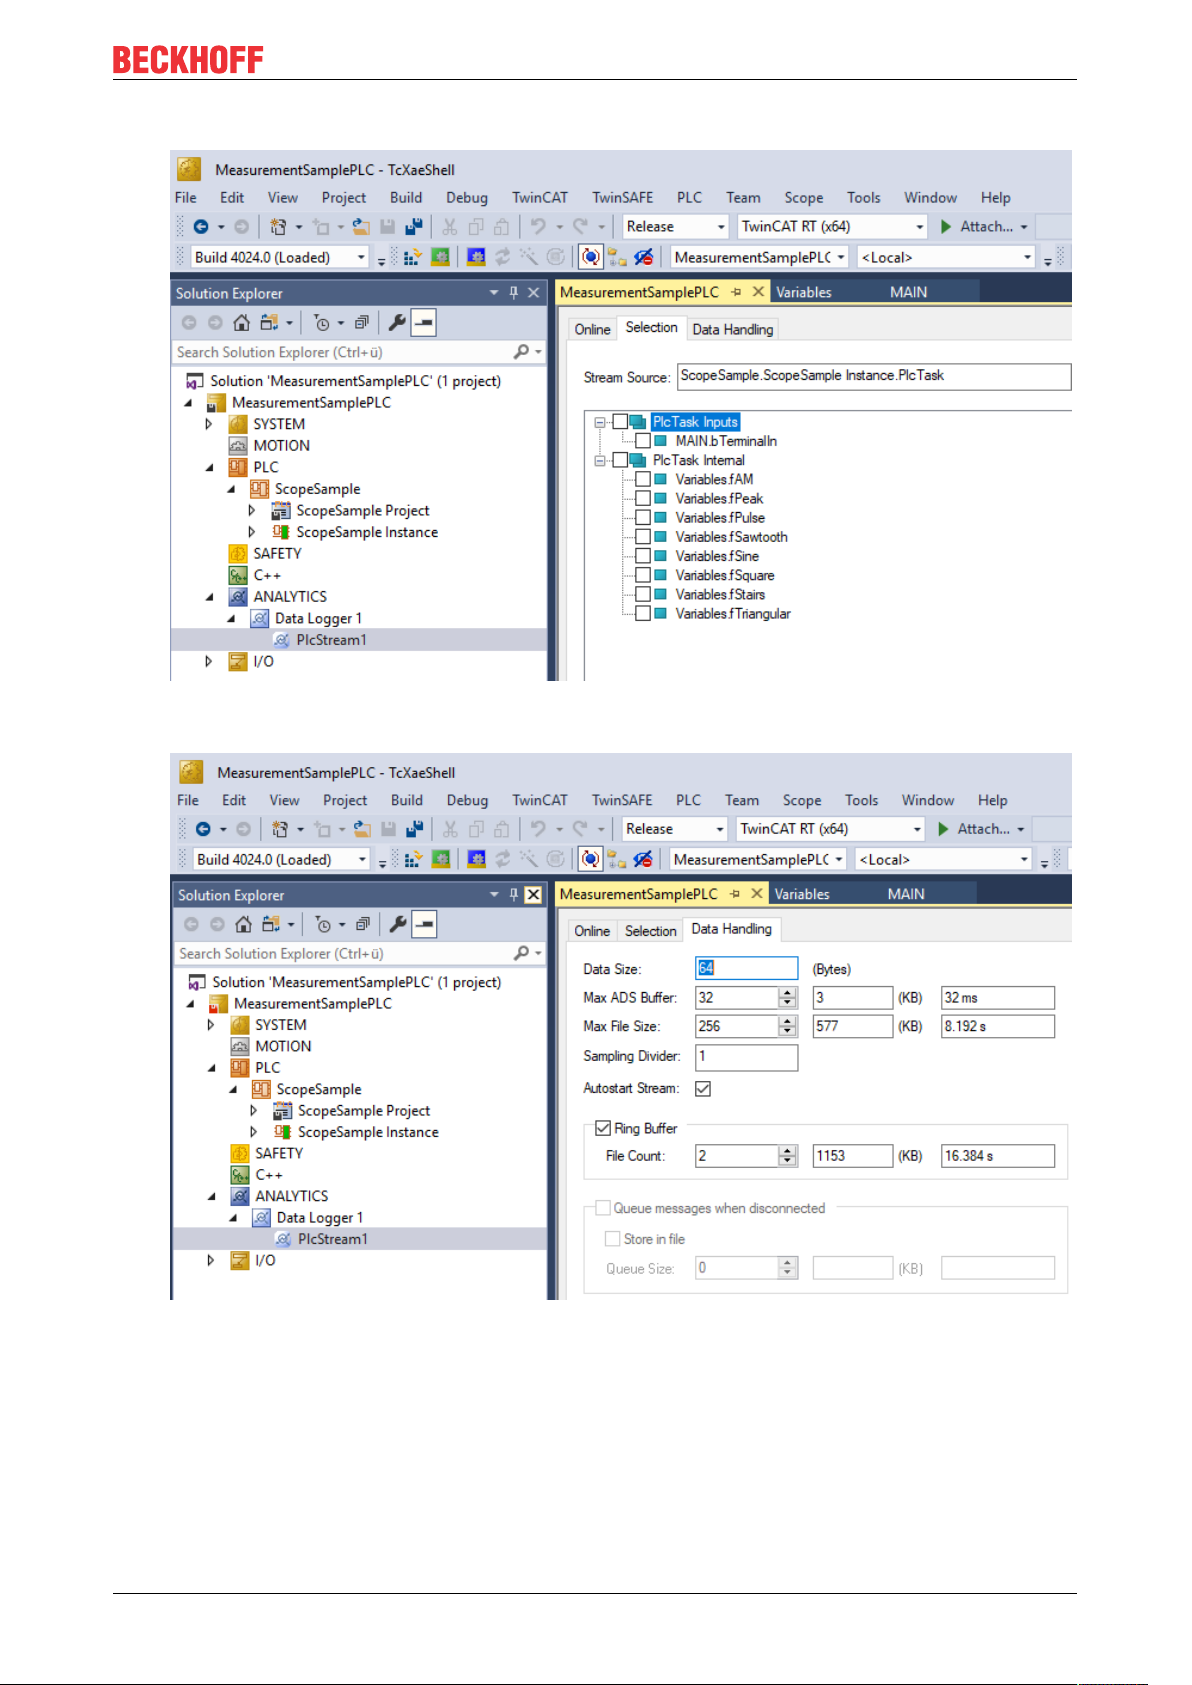
• In the stream a Selection tab is available to choose the variables that should be recorded
• Finally it is possible to change the package size for the frames or to configure the ring buffer for
disconnects and file in the Data Handling tab.
4.2 Communication
Currently, the Analytics workflow is fully mappable via MQTT. The engineering tools can also access the
data of the machines via ADS and carry out analyzes.
TE3520 17Version: 1.0
Page 18
Analytics Workflow - First Steps
If you choose for the IoT communication protocol MQTT you have to setup a native MQTT Message Broker
somewhere in the network (VM in a cloud system is also possible). This Message Broker provides a
decoupling of the different applications in the Analytics Workflow.
4.3 Historicize data
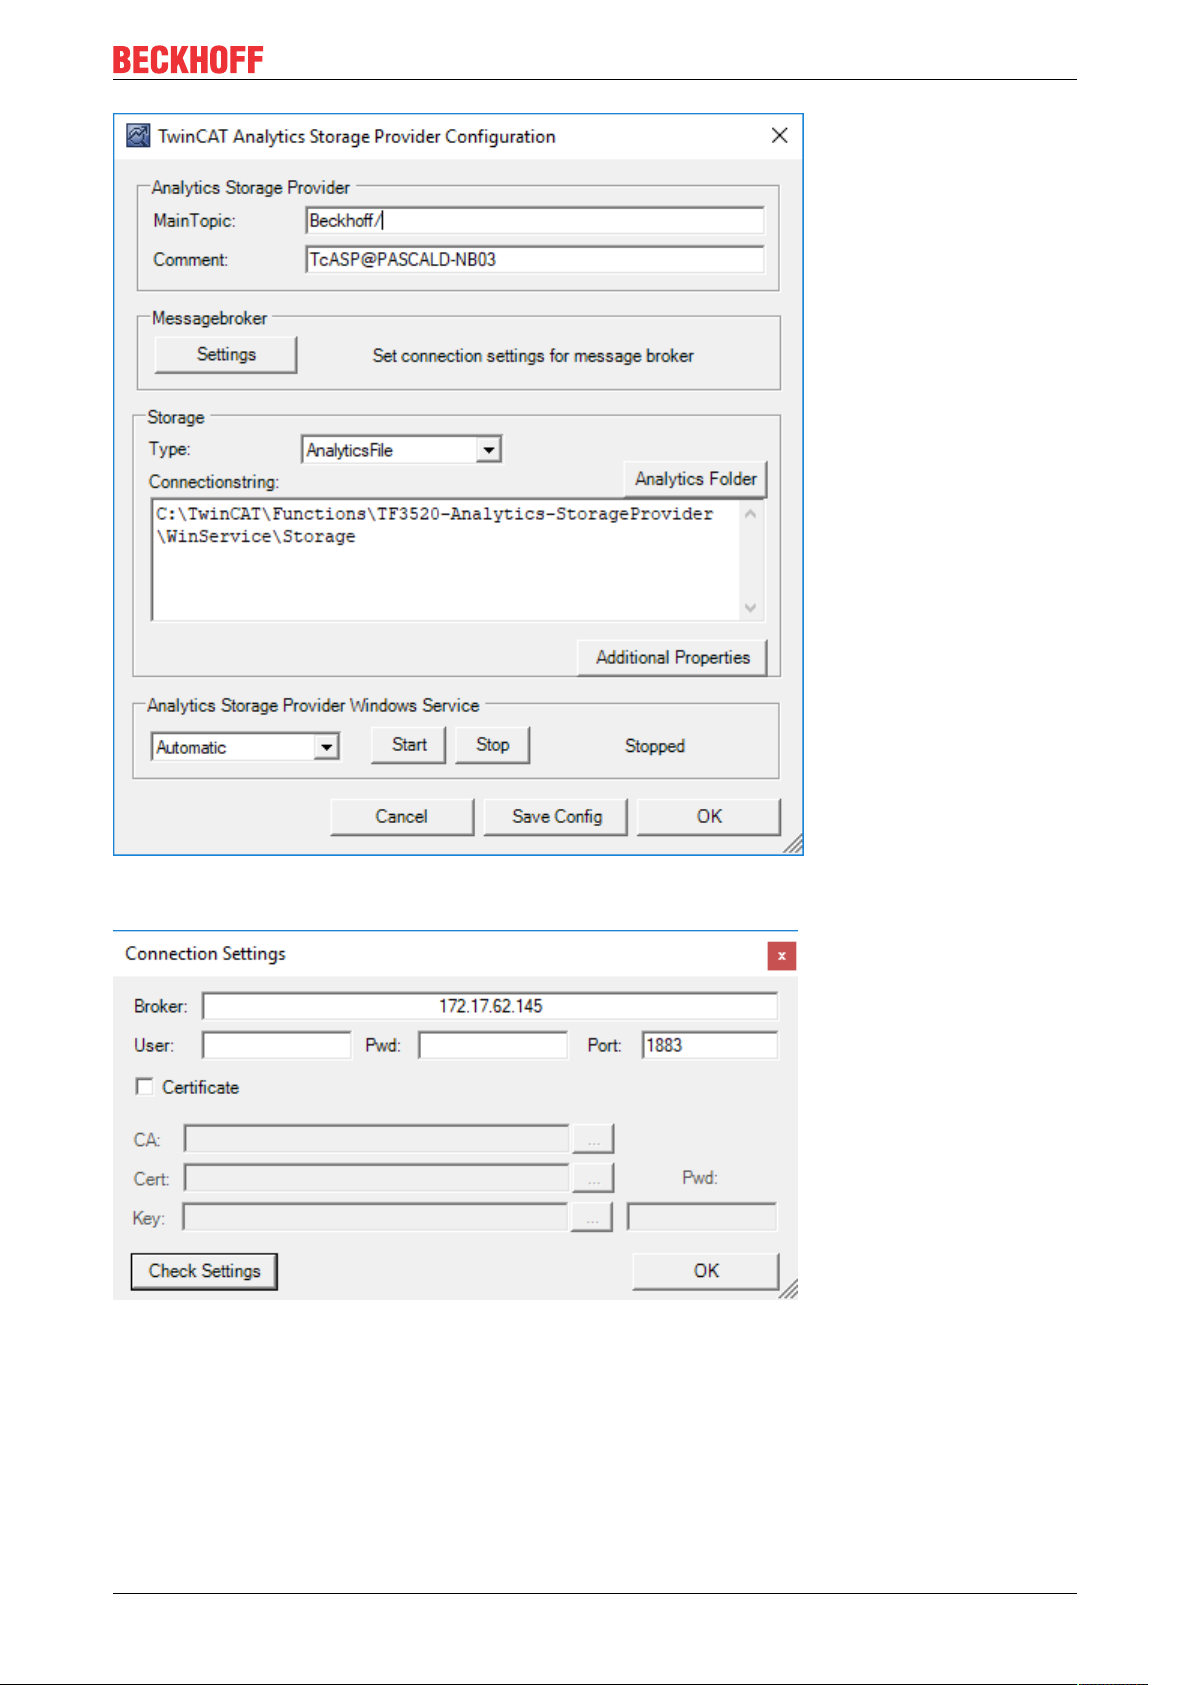
After installation of the TwinCAT Analytics Storage Provider you are able to configure the service running in
the background. You will find therefore the TcAnalyticsStorageProvider_Config application in the folder C:
\TwinCAT\Functions\TF3520-Analytics-StorageProvider\WinService.
TE352018 Version: 1.0
Page 19
Analytics Workflow - First Steps
The main part of the topic can be set in the configuration as well as the comment which will be used for
identification if more than one Storage Provider is registered at the Message Broker.
You are able to provide the Message Broker settings and to decide for storage type:
• Analytics File (binary file)
• Microsoft SQL
• Microsoft Azure Blob (Azure Cloud necessary)
Finally, you can save the config and start the service. The next step is the configuration of the specific
record. Therefore you should choose in your development environment the Storage Provider Recorder.
TE3520 19Version: 1.0
Page 20
Analytics Workflow - First Steps
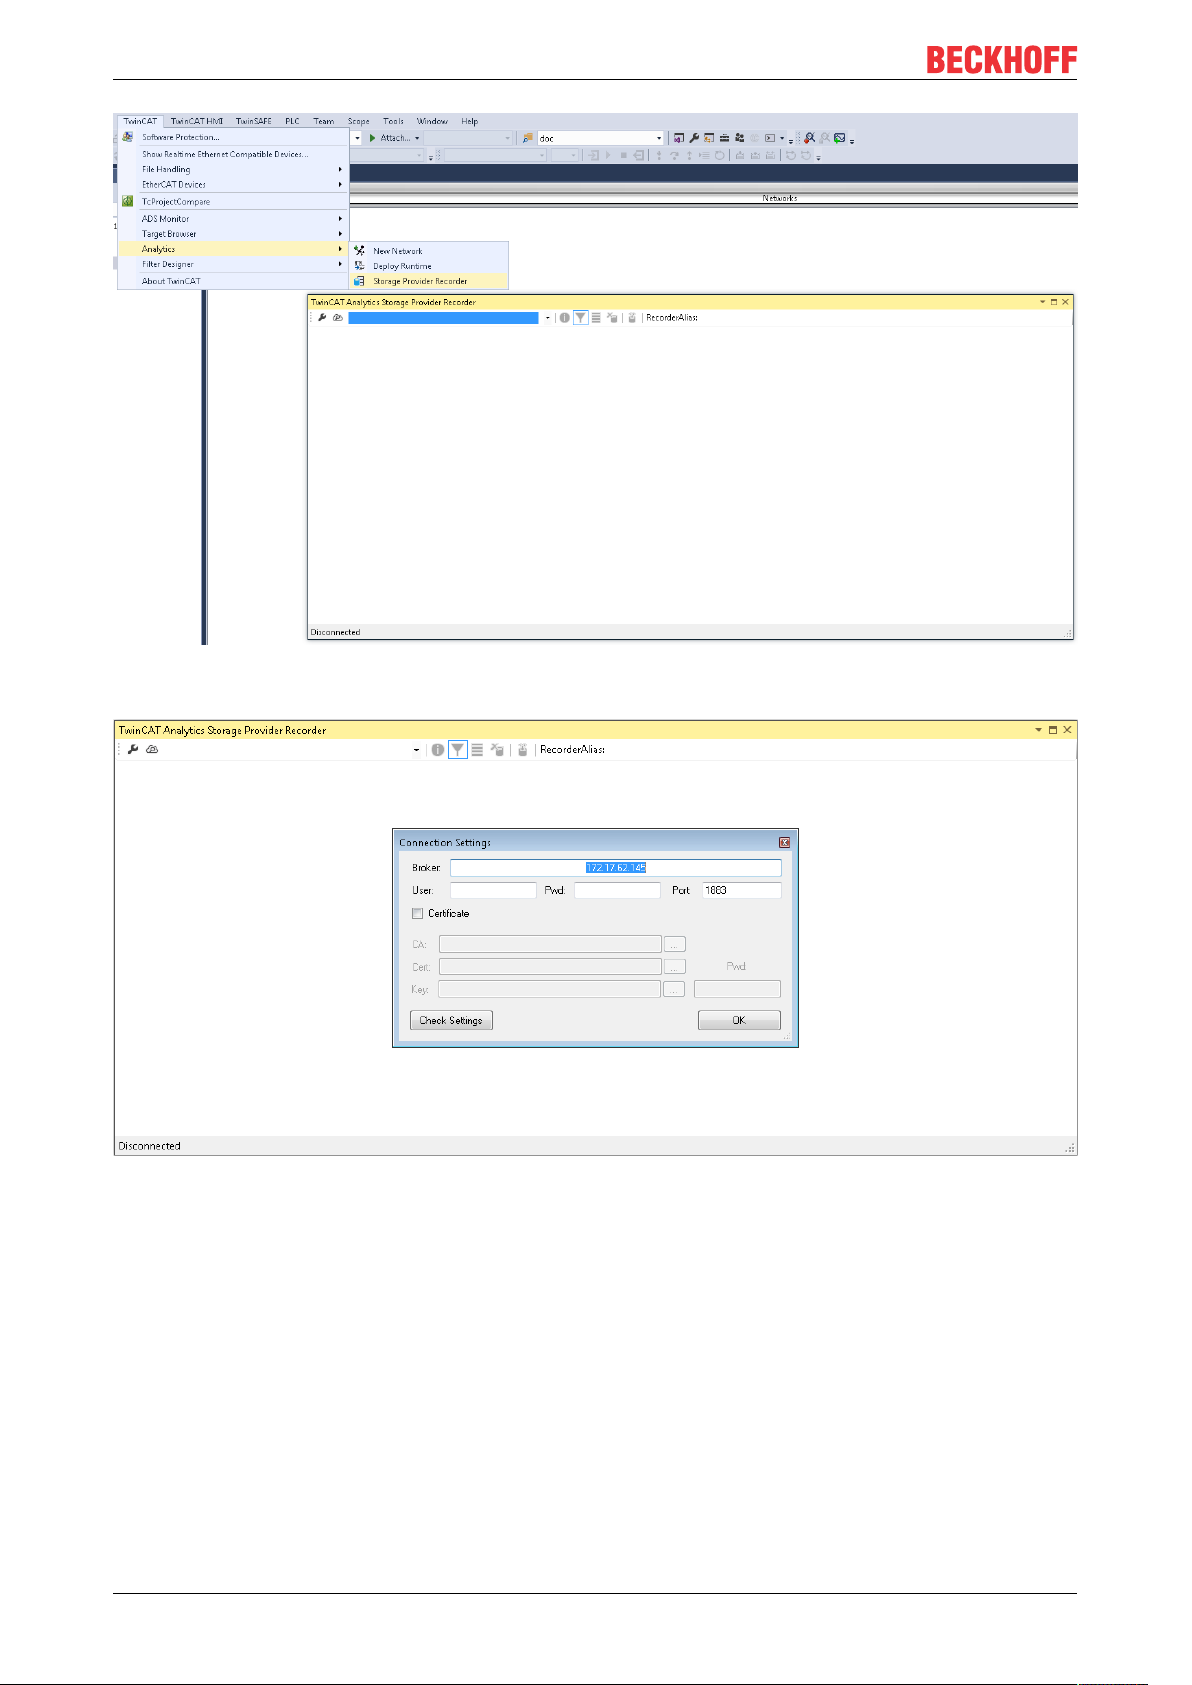
The recorder has also to connect to the Message Broker. So you have to provide the same settings as for
the background service.
After this you can click to icon with the small cloud to search Storage Providers at the configured Message
Broker. Here you will find also the comment you gave already by the service configuration to identify your
Storage Provider.
TE352020 Version: 1.0
Page 21
Analytics Workflow - First Steps
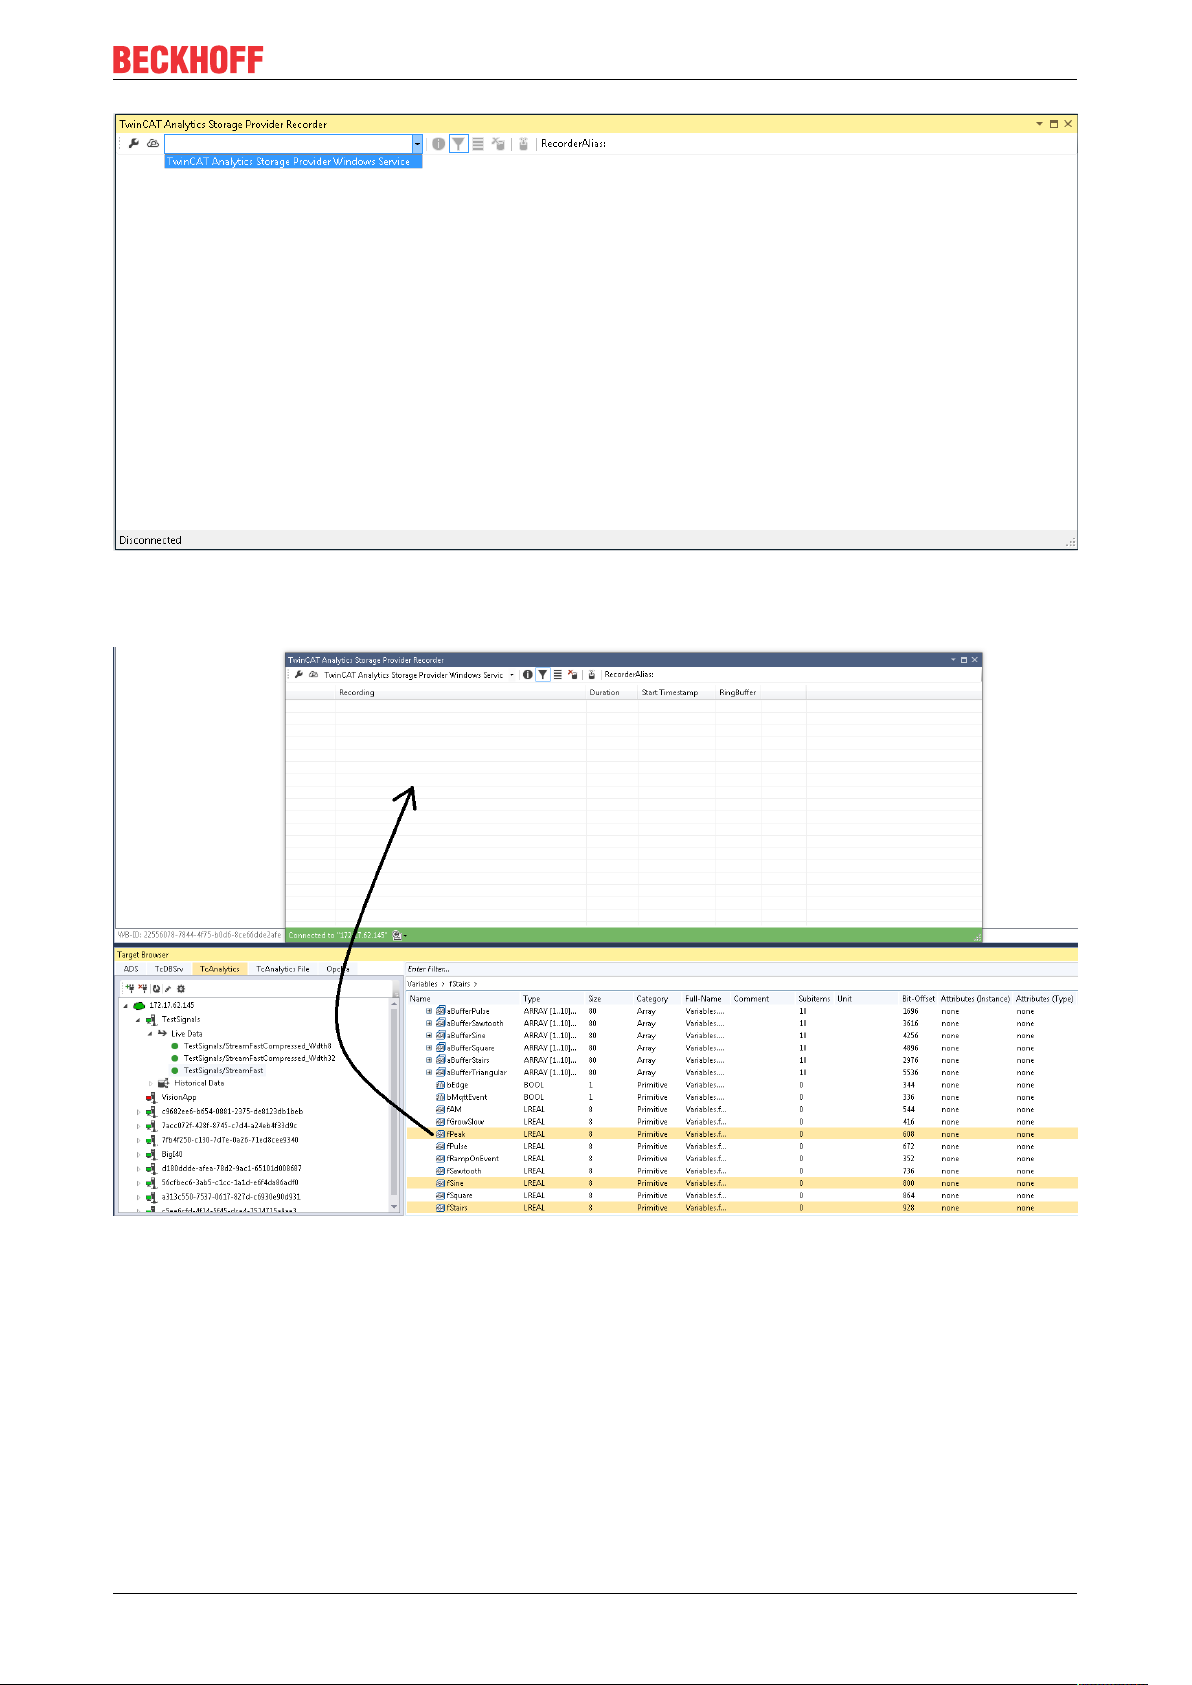
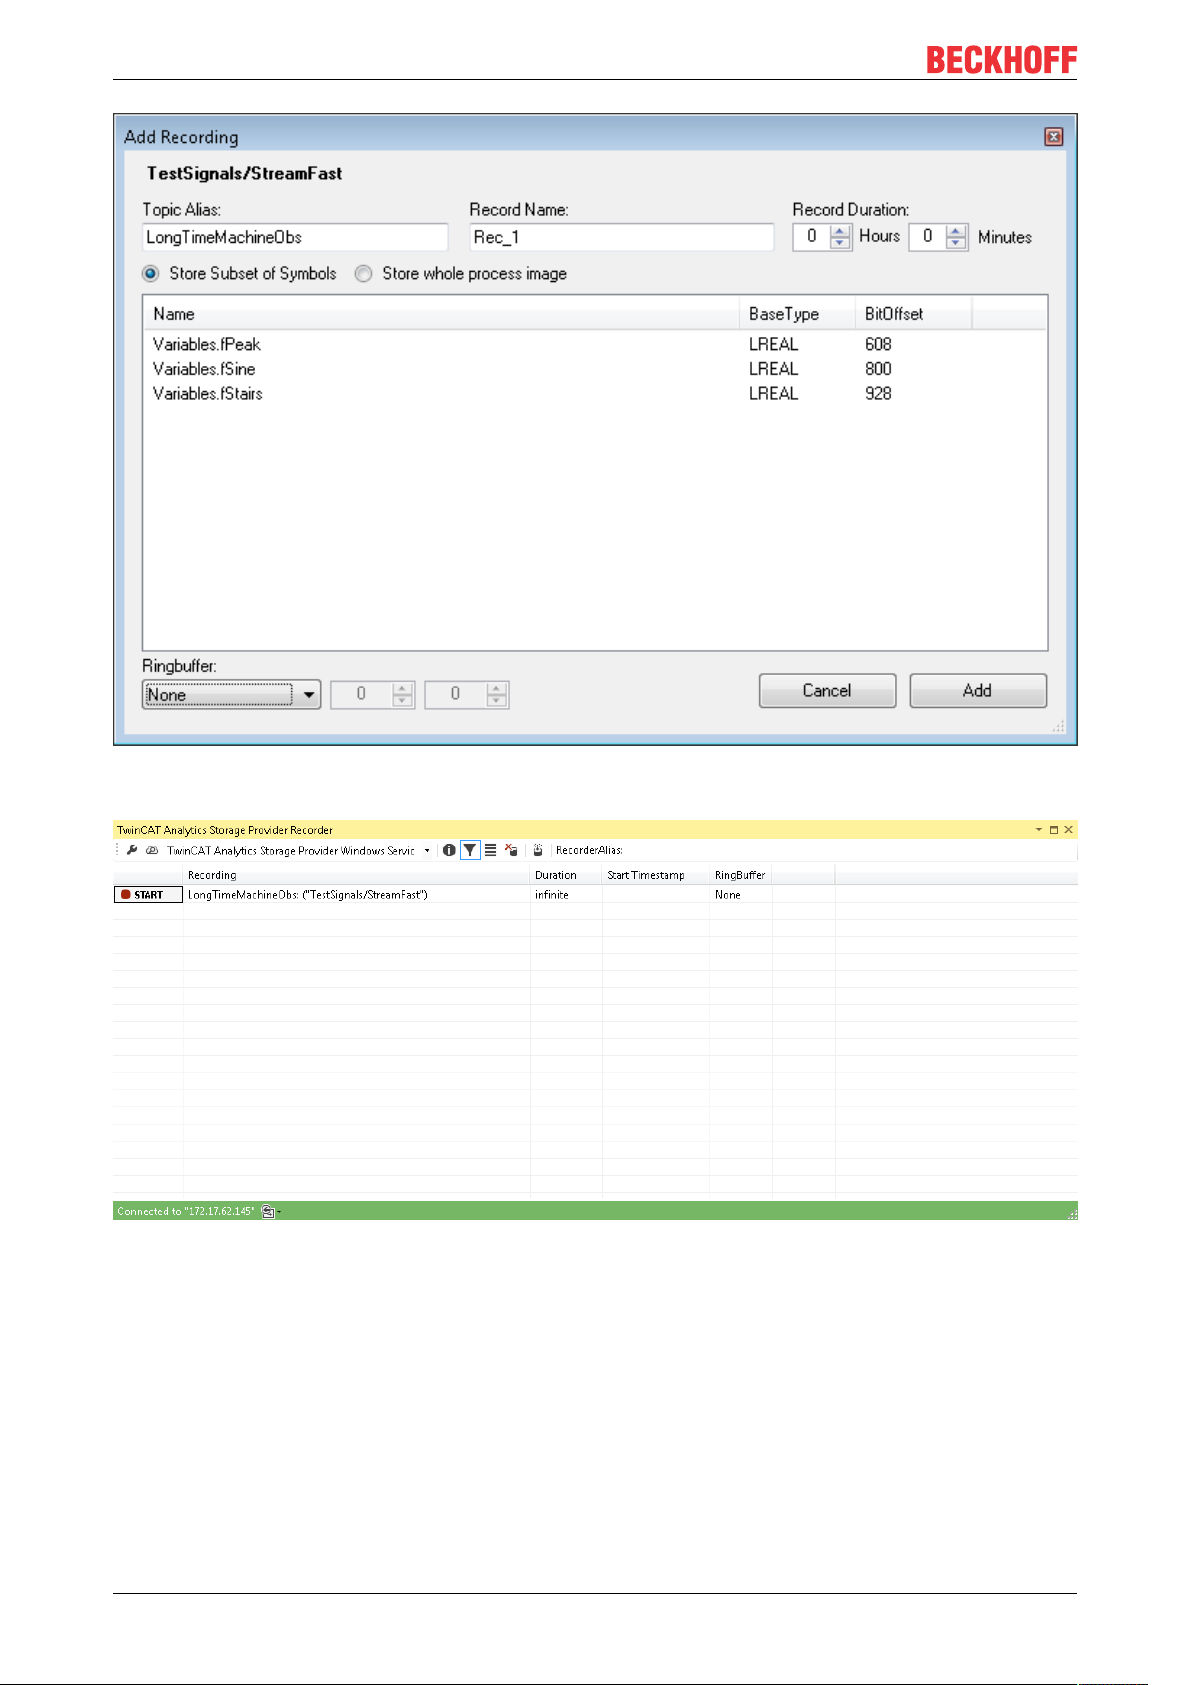
The configuration of the record is very easy. You have just to choose your target in the Target Browser. Click
on Live data and choose one or more variables by multiselect and put them by drag and drop to the recorder
window.
The recorder will ask you if you like to add just the chose variables or the complete source process image of
the variables.
TE3520 21Version: 1.0
Page 22
Analytics Workflow - First Steps
You can also configure record names and a duration (otherwise endless until manual stop). A ringbuffer can
be set by memory or time.
Click the Start button to start the record. After this you can also disconnect the recorder, because the
background service do the work. It is also possible that someone else connect to this Storage Provider
service and control the running record.
TE352022 Version: 1.0
Page 23
Analytics Workflow - First Steps
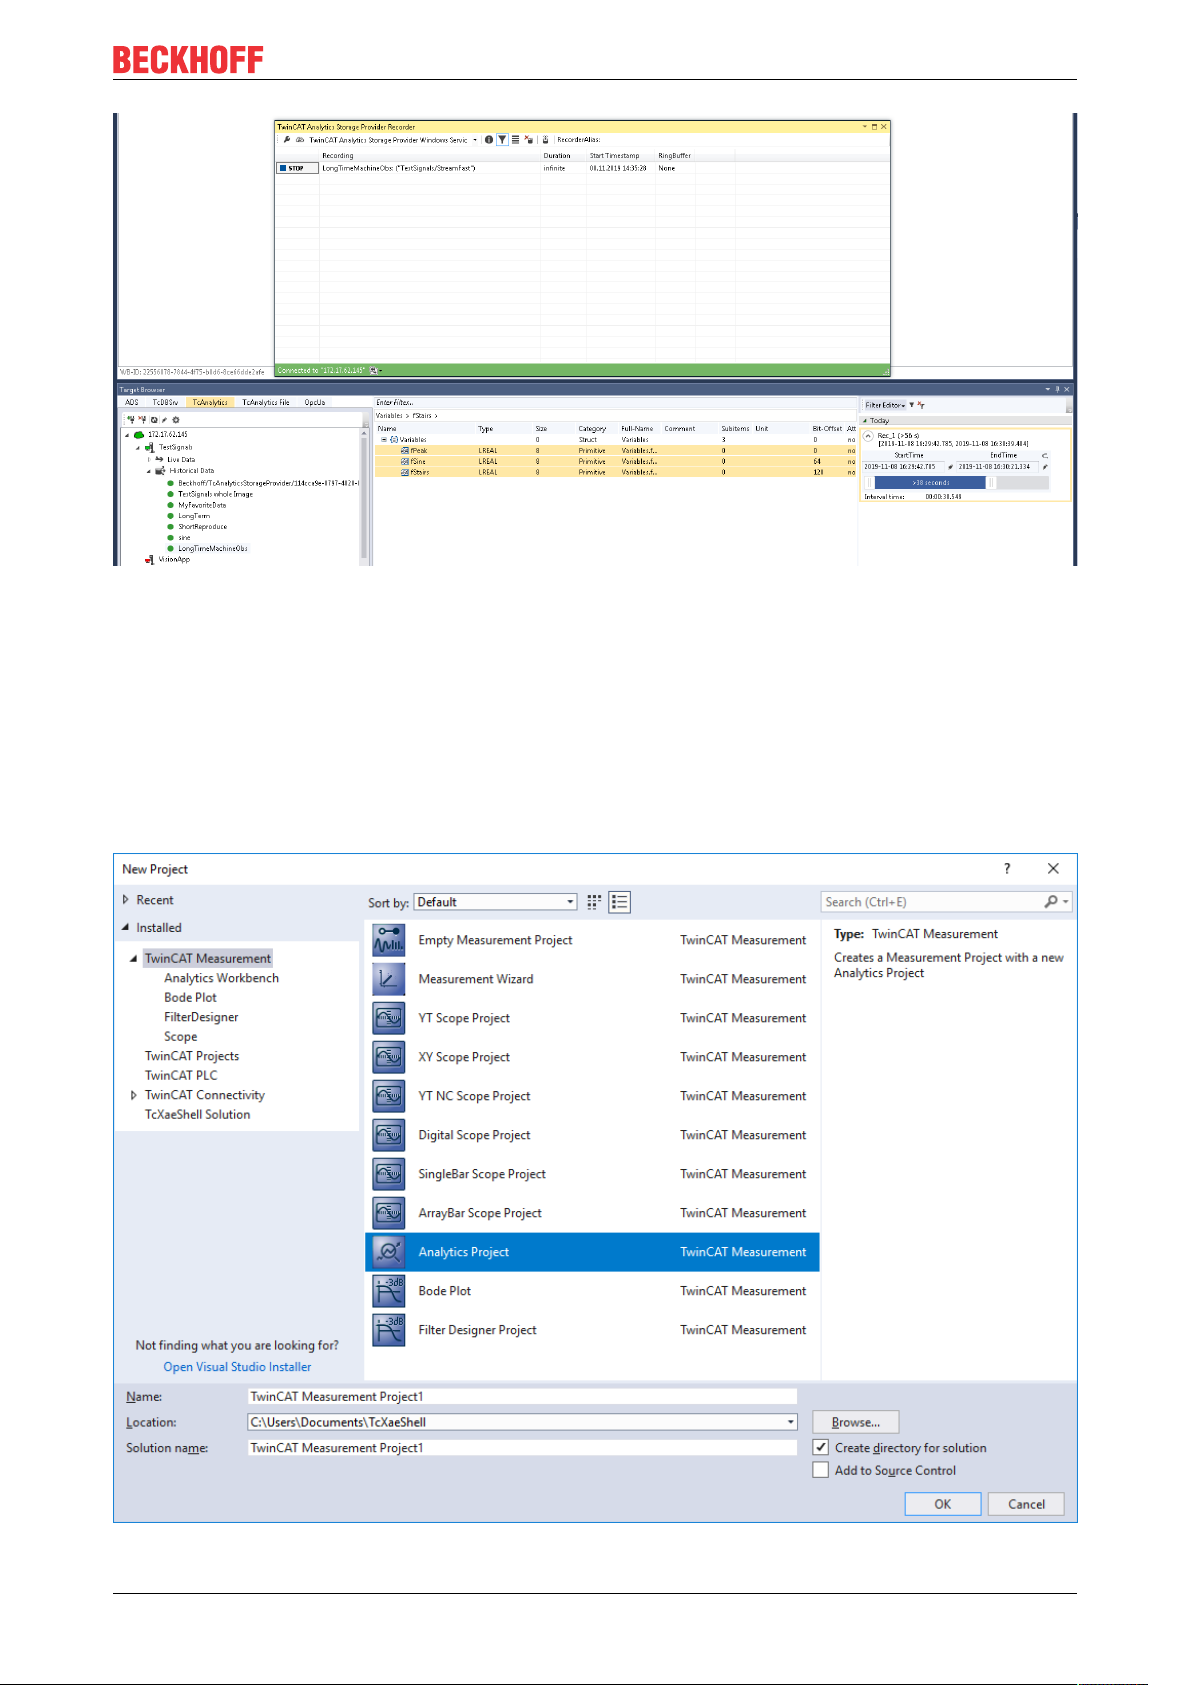
After and also during the record you can choose the historical data as input for your analysis in the Target
Browser. In the Target Browser you will find for historical data a new control on the right hand site. There you
can choose the time span for your data.
4.4 Analyse data
Open your TwinCAT engineering environment to start the analysis of the data.
Open Visual Studio® >> File >> New >> Project…
Choose from TwinCAT Measurement the Analytics project template.
TE3520 23Version: 1.0
Page 24
Analytics Workflow - First Steps
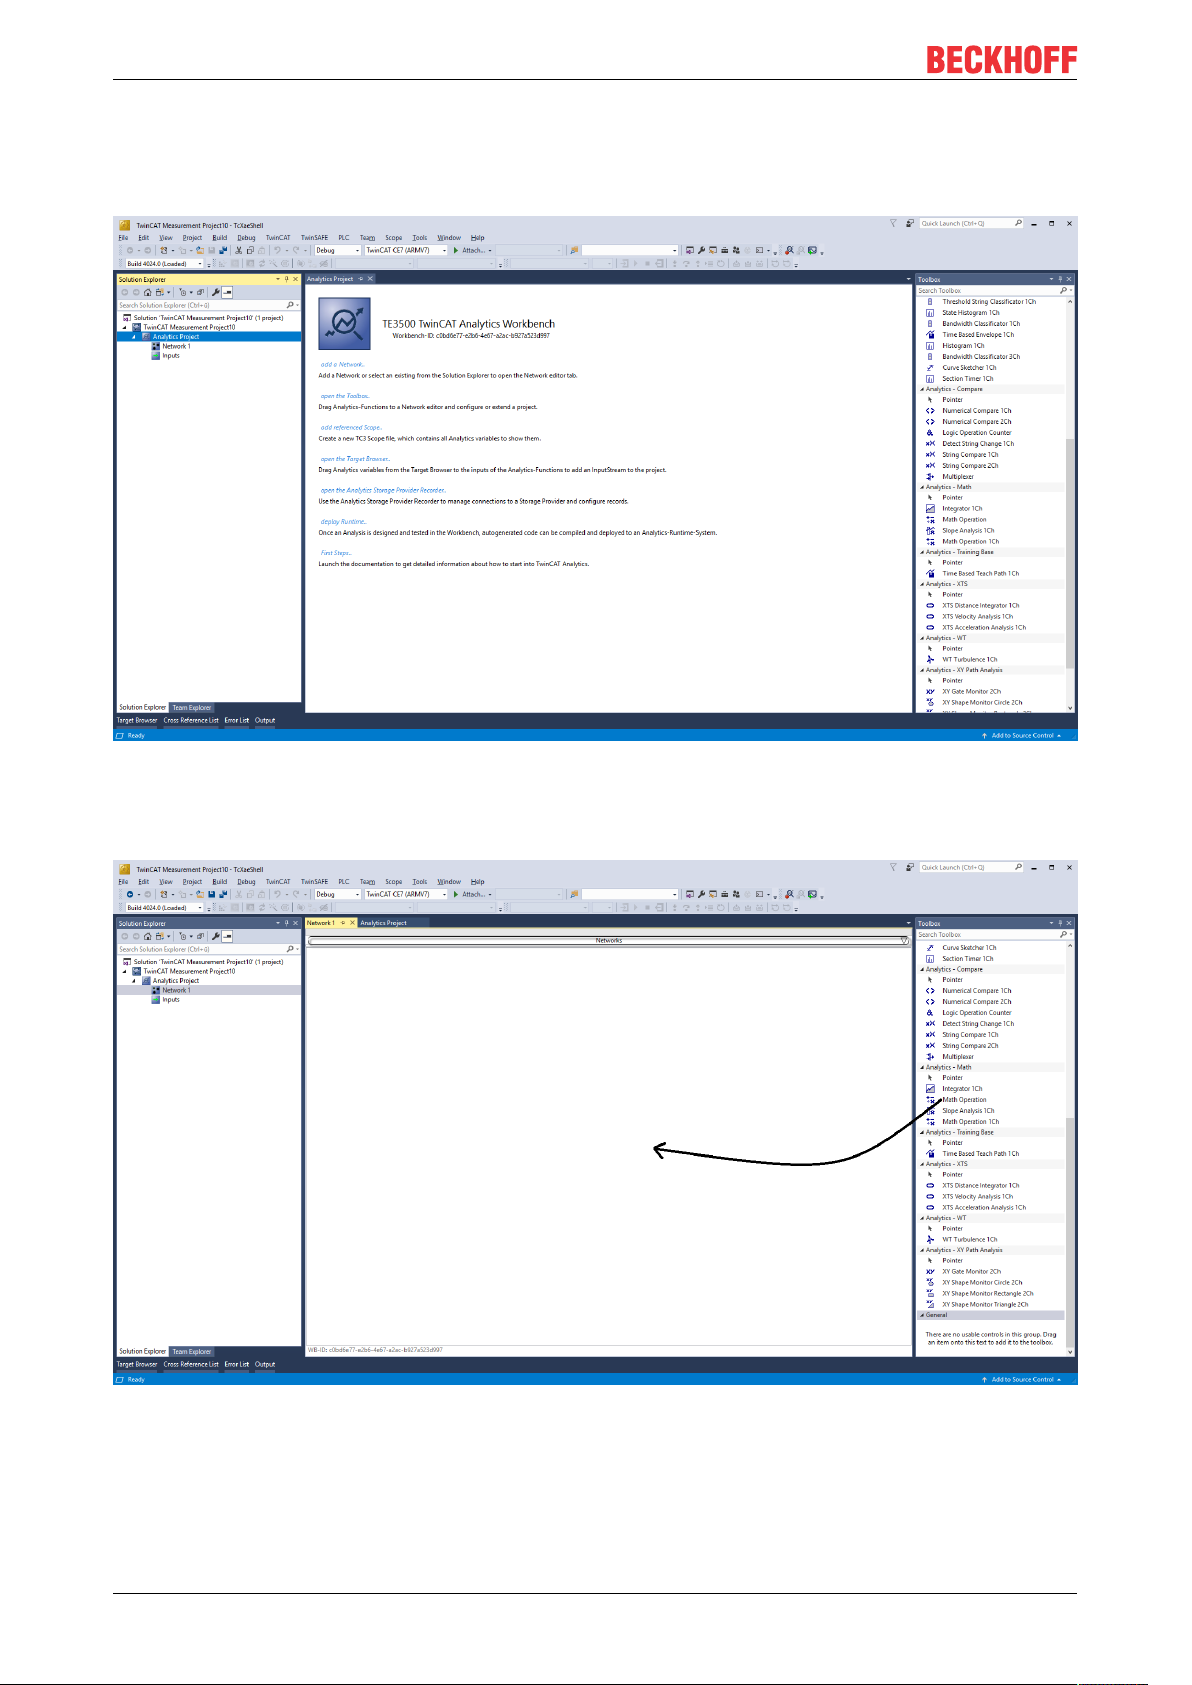
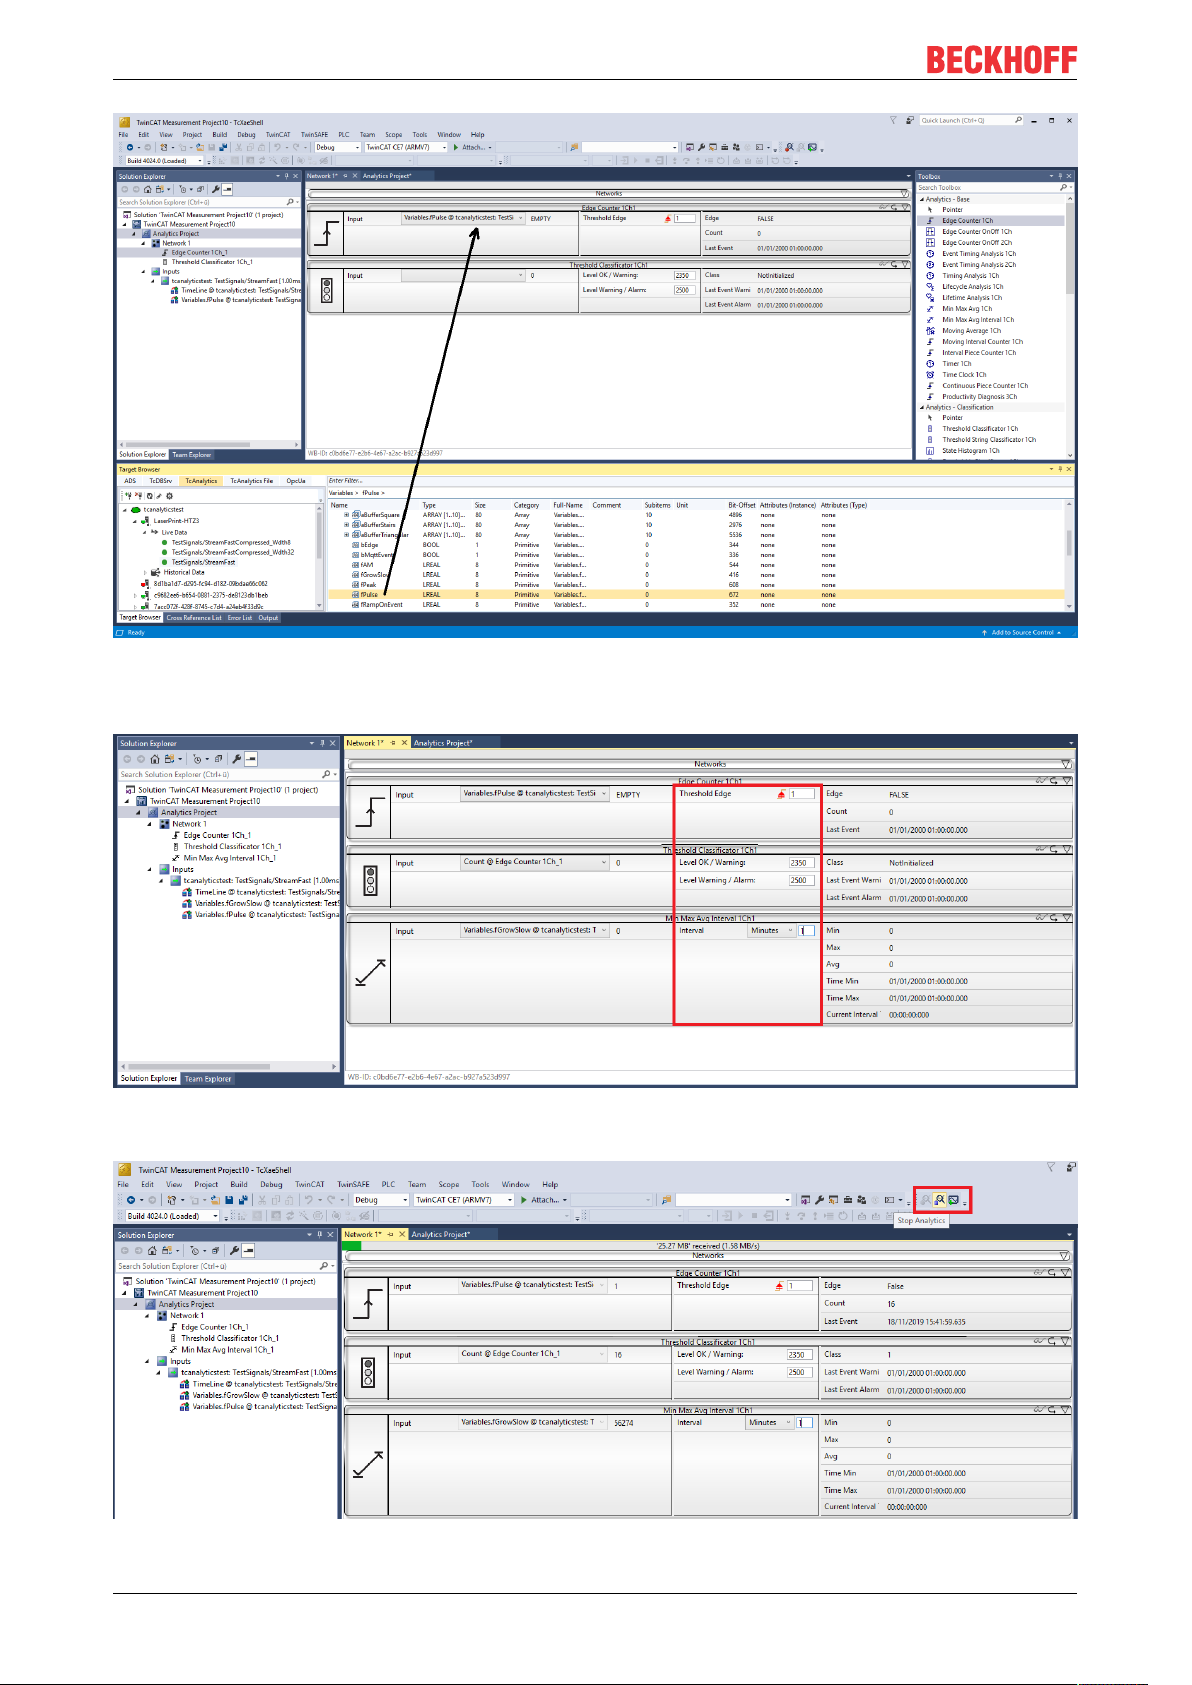
The new project will be shown in the Solution Explorer. After a click on the Analytics Project tree node item a
start window opens where you can select your first action. From here, you can add a Network, open the
Toolbox, open the Target Browser or open the Analytics Storage Provider Recorder. You will do all these
actions in the following steps.
It makes sense to open in a first step the Toolbox of Visual Studio®. There you will find all the supported
algorithm of TwinCAT Analytics. Algorithm must be organized and grouped into networks. Right click on the
Analytics Project to add a new Network or add a Network using the start page. The first Network is always
generated by default.
If you click on the Network an editor will be open. Now you can take the algorithm you like by drag and drop
into the editor surface. After choosing the algorithm you need to connect input variables to the modules
(algorithm). Therefor open the Target Browser.
TwinCAT >> Target Browser >> Target Browser
TE352024 Version: 1.0
Page 25
Analytics Workflow - First Steps
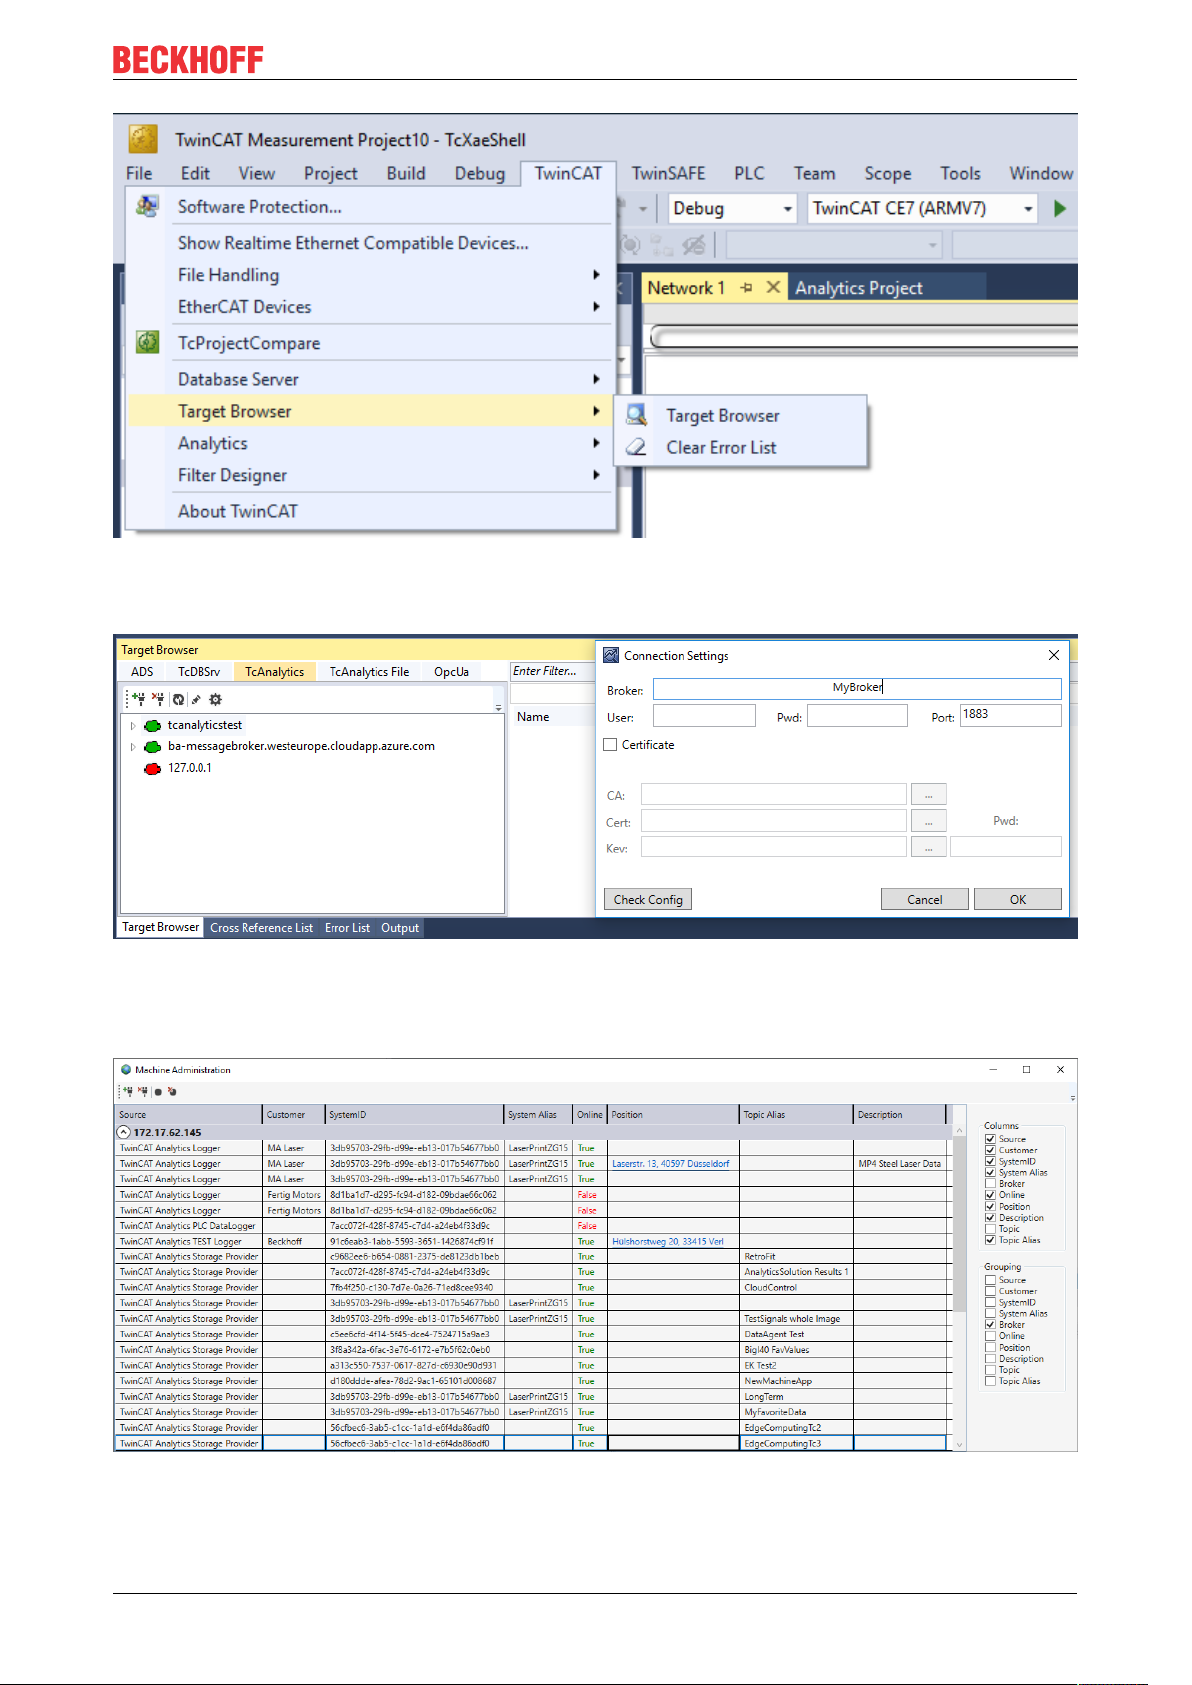
Choose now the TcAnalytics or TcAnalyticsFile tab in the Target Browser. We go ahead with the TcAnalytics
tab (MQTT). Click on the green marked icon in the toolbar of this Analytics extension. A window will be open
where you can provide your Message Broker connectivity data.
Choose your MQTT Analytics client (TwinCAT Analytics Logger, TwinCAT IoT Data Agent or Beckhoff
EK9160). For each controller you have a unique ID. This ID is shown in the Target Browser. Not very legible,
of course. Therefore, click on the icon with the gear to get to the machine administration page. Here you can
provide a System Alias name which is shown in the Target Browser instead of the GUID.
In the next step you can choose between Live Data and Historical Data for each MQTT Analytics client.
Historical Data are only provided by the TwinCAT Analytics Storage Provider.
TE3520 25Version: 1.0
Page 26
Analytics Workflow - First Steps
You can take the variables by drag and drop into the inputs of the specific algorithm. For the most algorithm
it is possible to set conditions like thresholds, time intervals, logic operators and so on. You can do these
settings in the middle of each module.
Finally, your first Analytics Project is finished. To start the analysis, click on “Start Analytics”. To stop the
analysis, click on “Stop Analytics”.
TE352026 Version: 1.0
Page 27
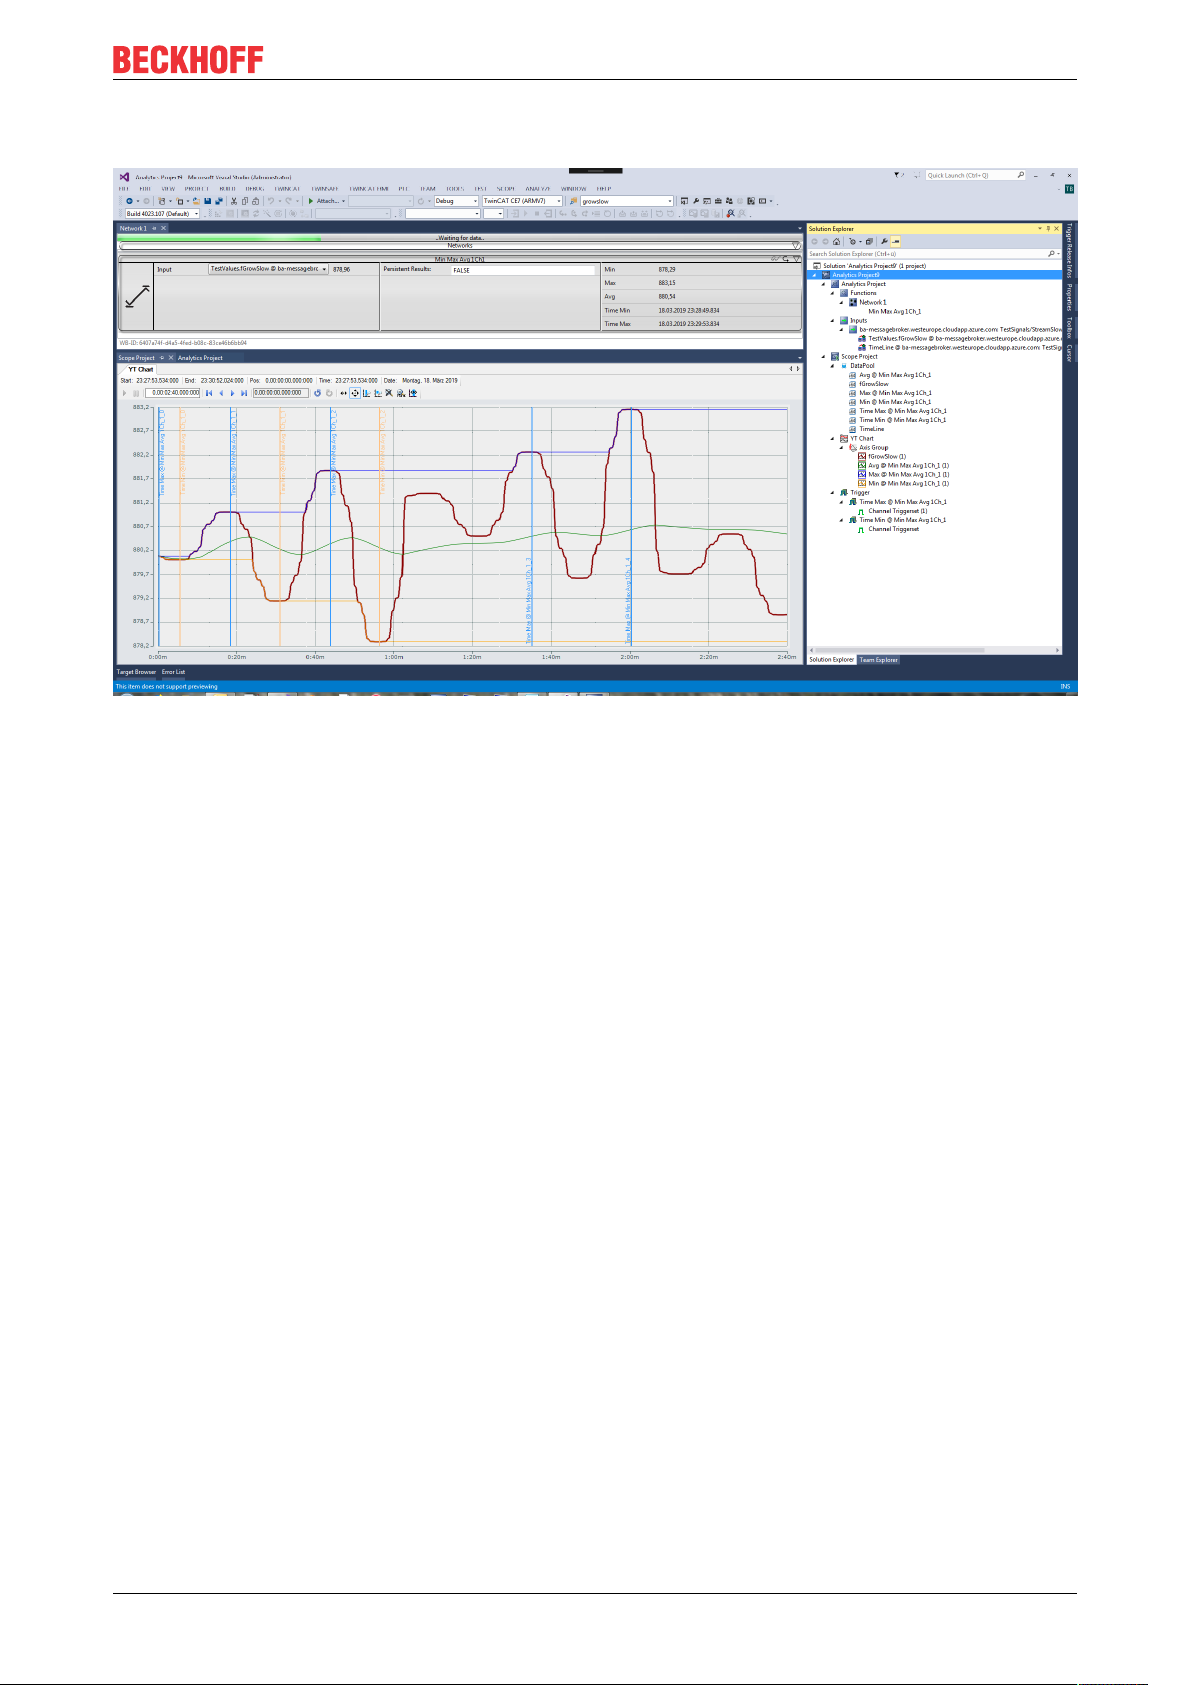
Analytics Workflow - First Steps
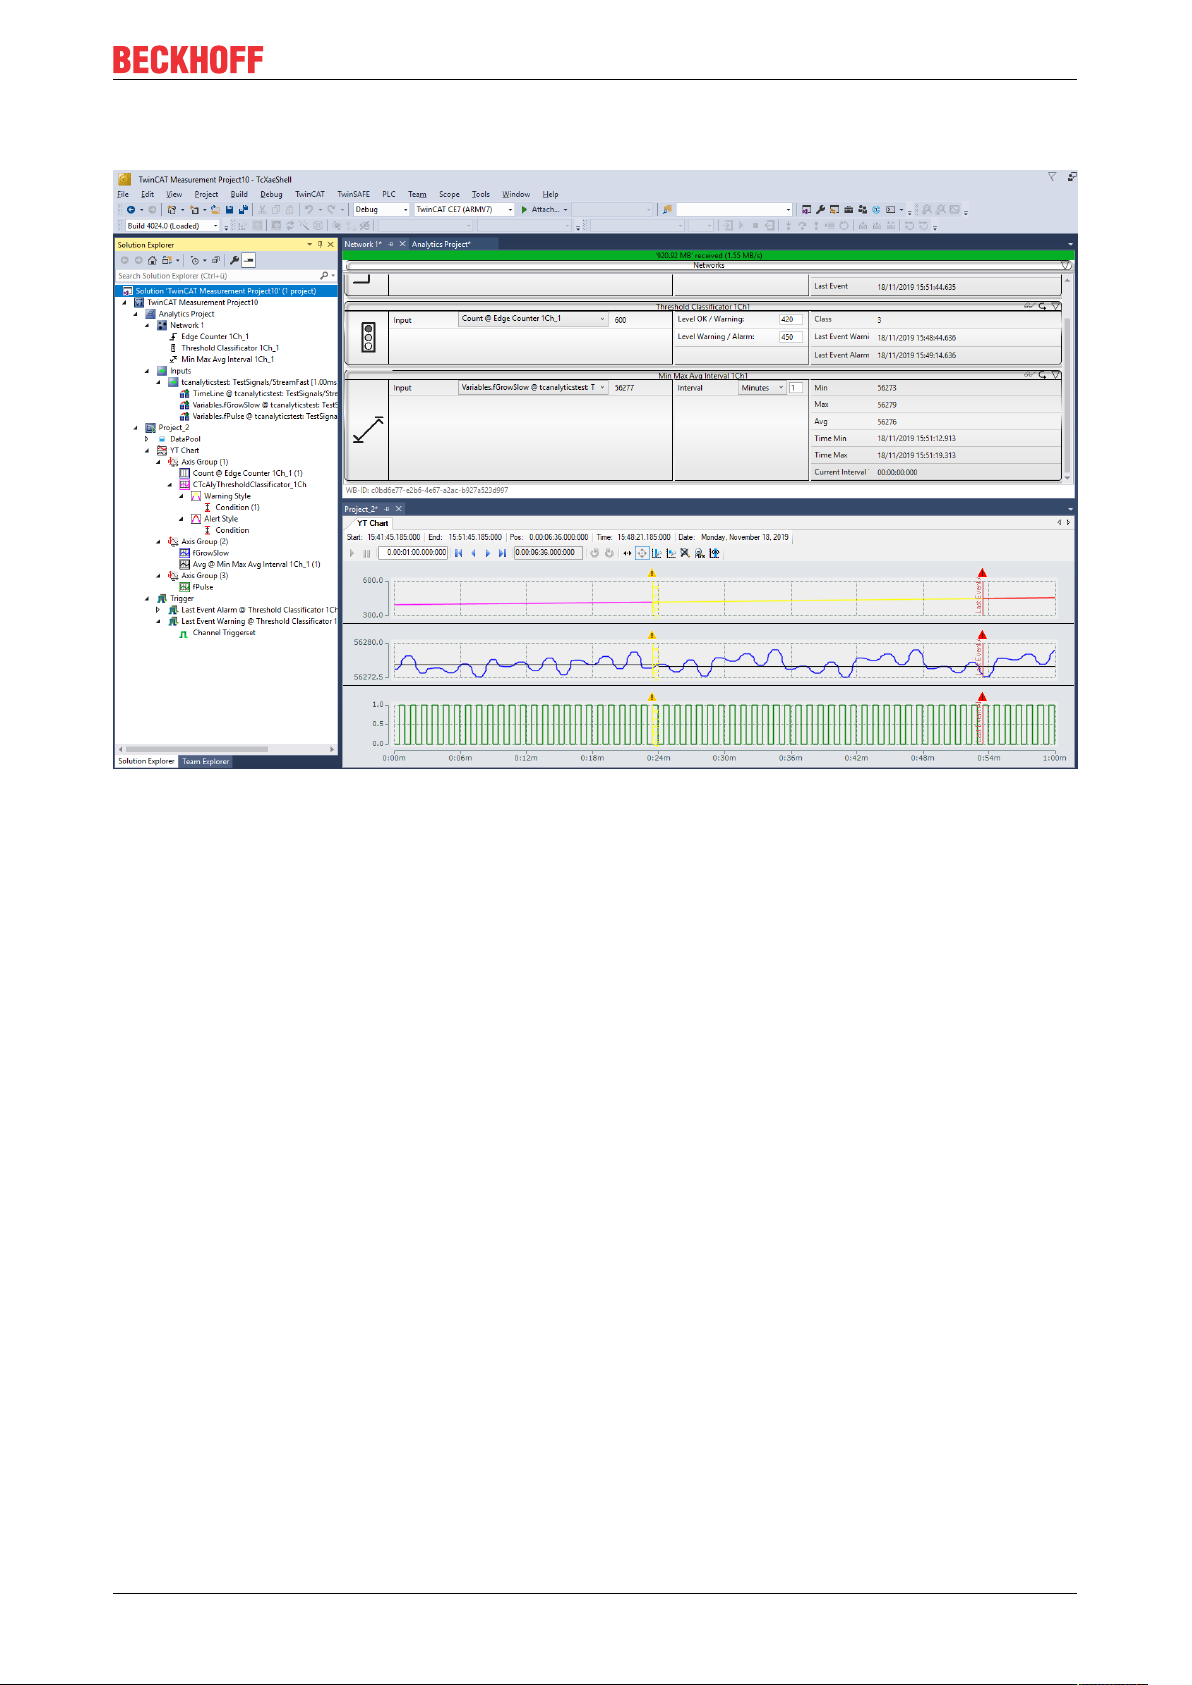
Before starting Analytics or also during the runtime you can click on the button “Add Reference Scope”. A
Scope configuration is automatically built to fit your Analytics project.
Results of the analysis can be show in the Scope View charts by drag and drop. For example, an average
value can be shown as new channel in the view. Timestamps as Marker at the x-axes to show significant
values.
TE3520 27Version: 1.0
Page 28
Technical introduction
5 Technical introduction
5.1 Basic concept
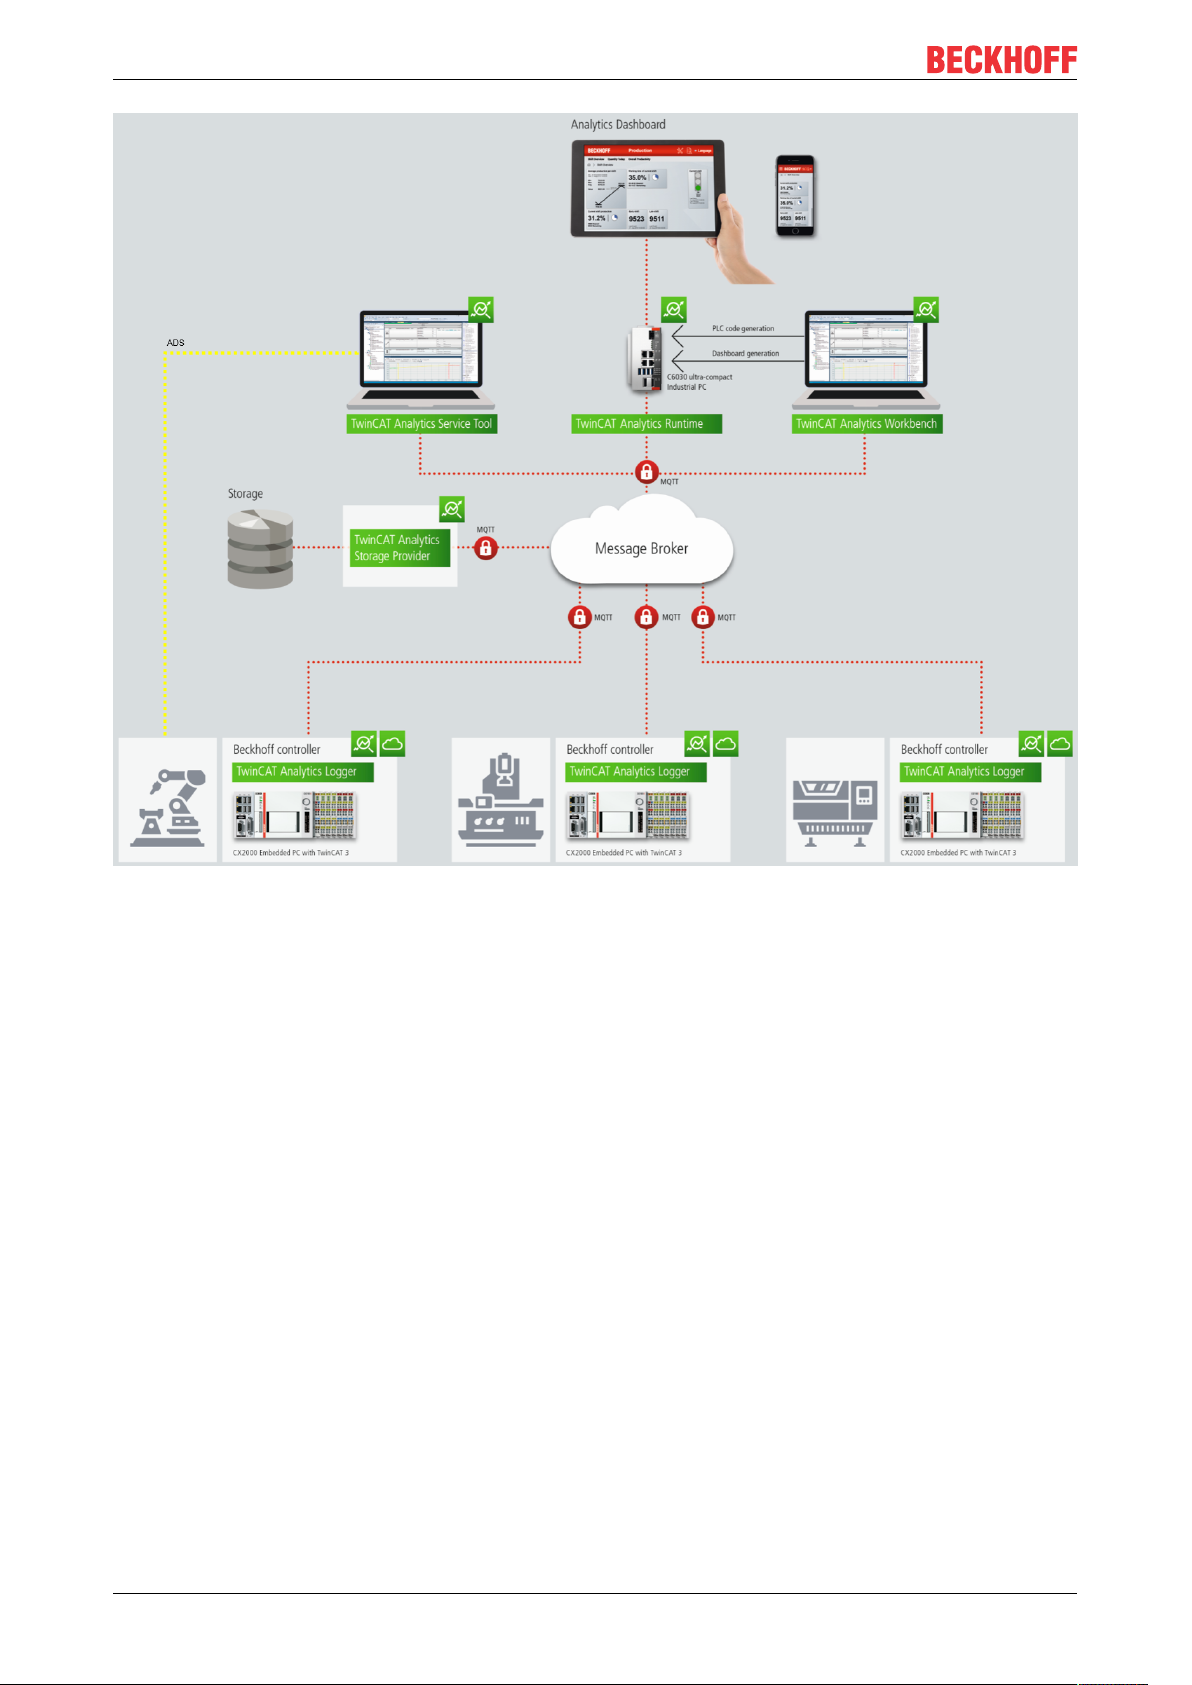
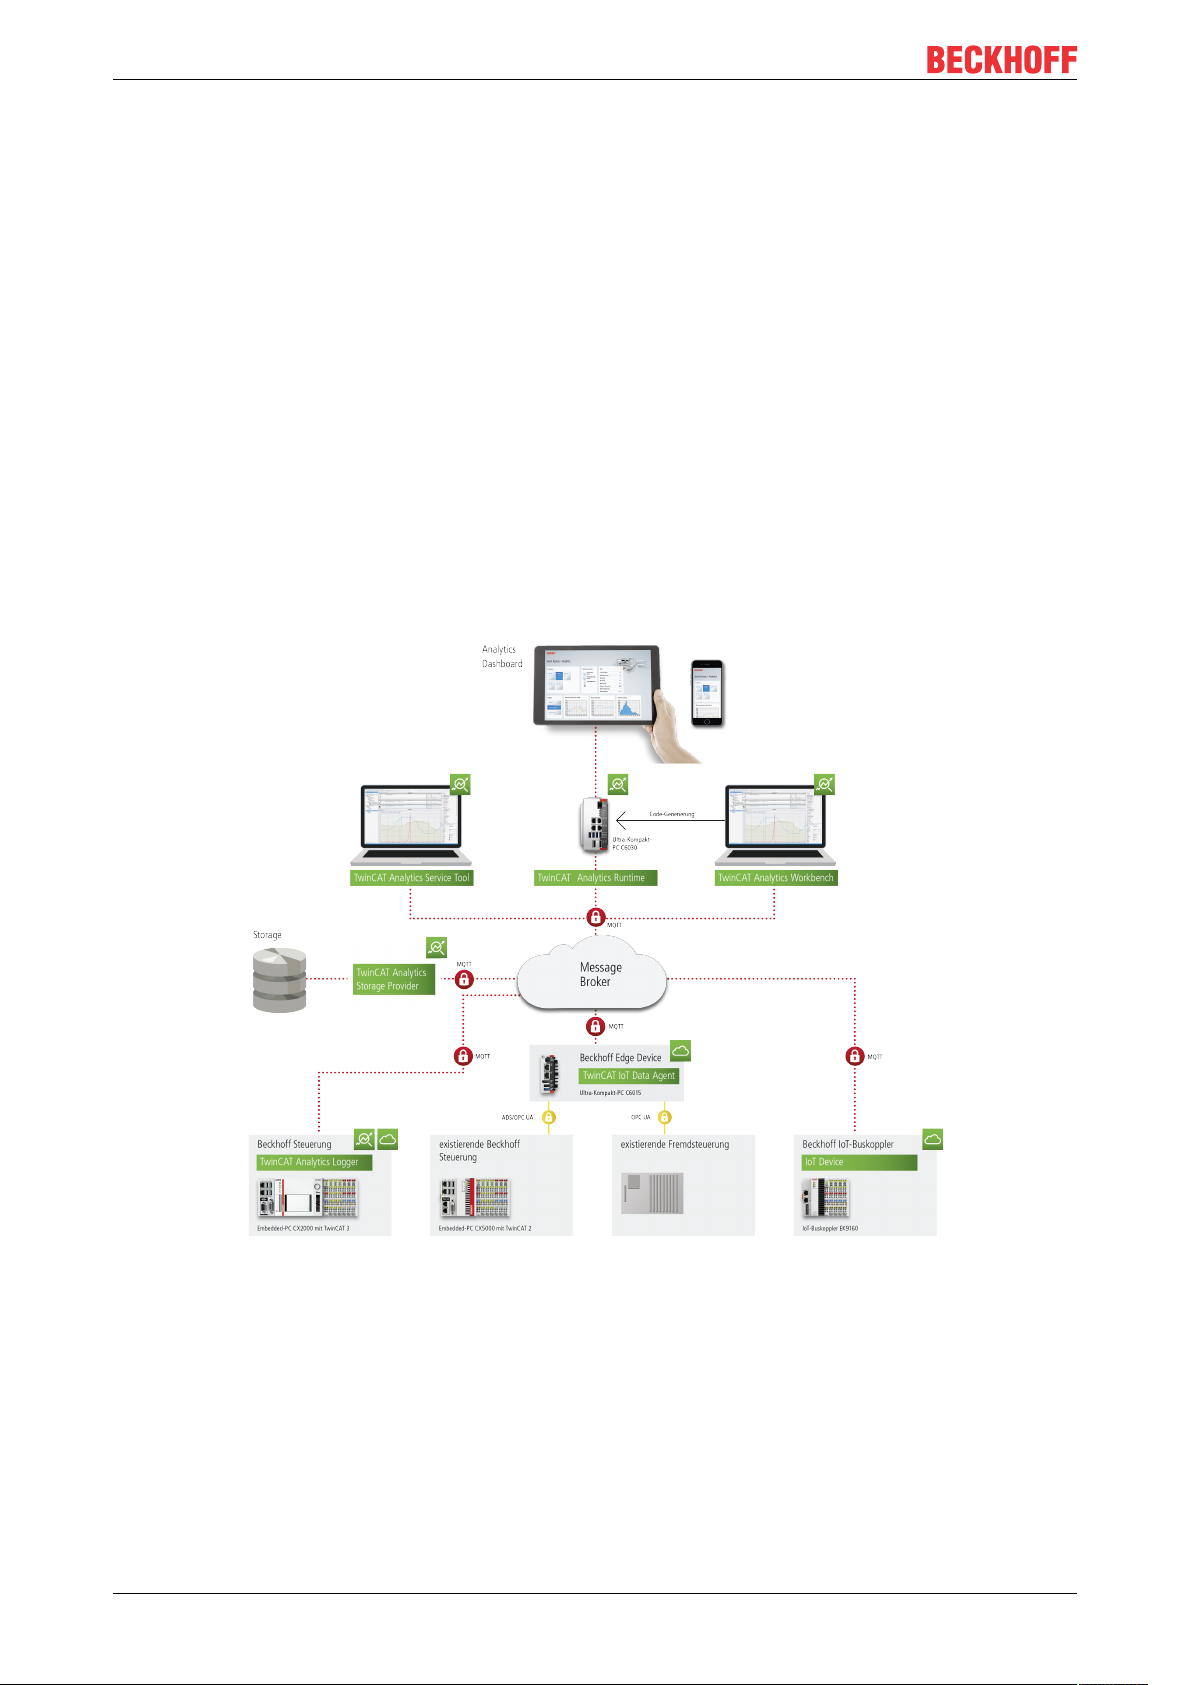
The following picture shows the basic concept of TwinCAT Analytics from the data source up to the Analytics
dashboard based on TwinCAT 3 HMI. The communication in an Analytics scenario is realized by the IoT
communication protocol MQTT.
Data sources:
Currently there are three different data sources for TwinCAT Analytics. All these sources are able to
communicate with TwinCAT Analytics specific binary data format. This format is necessary to reach this high
performance.
• TwinCAT 3 controller with TF3500 TwinCAT Analytics Logger
• TwinCAT 2, TwinCAT 3 and third party controller together with a gateway of TF6720 TwinCAT IoT
Data Agent
• All EK9160 IoT Coupler devices
Storage:
With TwinCAT Analytics it is possible to analyze live and historical data. The TwinCAT Analytics Storage
Provider is the interface between native MQTT Message Broker to different stores. As storage TwinCAT
Analytics is supporting an Azure Blob store and a Microsoft SQL database. The configuration of the stores is
done automatically by the Storage Provider. Thus, it is not necessary to use classic SQL commandos to
realize the communication. The user also does not need to setup a special table structure.
Analysis:
For service technicians and machine commissioning
TE352028 Version: 1.0
Page 29

Technical introduction
The TE3520 TwinCAT Analytics Service Tool is the perfect tool for experts who like to analyze TwinCAT
Analytics data sources. It is integrated into the Microsoft Visual Studio®. The user is able to make his
analytics configuration in a graphical configurator choosing from a wide pool of different algorithms. A
parallel interaction with the Scope View is also possible. The user is able to find significant values easily by
drag and drop from the configurator into the data stream of our Scope View.
For continues 24/7 machine analysis
The TE3500 TwinCAT Analytics Workbench has the same functionality as the Service Tool. In addition, it is
possible to make an automatic PLC code generation based on the realized analytics configuration in the
configurator. The PLC code is ready to use. So you can start the data analysis immediately like in the
configurator. But now for 24 hours 7 days per week if necessary. The auto generated code can be
downloaded into the TF3550 TwinCAT Analytics Runtime. This runtime can be on a classic IPC or
Embedded-PC, but also in a virtual machine. In the generated PLC project, the user is also able to realize
his Analytics Dashboard by the TwinCAT 3 HMI.
Products:
We have different single products in the TwinCAT Analytics Workflow. See therefore the following list with all
products
Product Number Product Name
TE3500 Analytics Workbench
TE3520 Analytics Service Tool
TF3500 Analytics Logger
TF3510 Analytics Library
TF3520 Analytics Storage Provider
TF3550 Analytics Runtime
TF3560 Analytics Controller Pack 4
TF3561 Analytics Controller Pack 8
TF3562 Analytics Controller Pack 16
TF3563 Analytics Controller Pack 32
TF3564 Analytics Controller Pack 64
TF3565 Analytics Controller Pack 128
TF6720 IoT Data Agent
EK9160 IoT Coupler
The minimal meaningful configuration is the usage of TF3500/TF6720/EK9160 together with TE3520
Analytics Service Tool. Also possible is just to use the TF3510 Analytics Library in a TwinCAT system.
TE3520 29Version: 1.0
Page 30
Configuration
6 Configuration
6.1 Networks
The networks serve as containers of the analytics algorithms. Thereby an analytics configuration can be
structured easily into different areas to allow greater clarity.
You can add a network directly from the analytics project start page or via the context menu.
Each network is represented in a single tab page. This allows you to view the networks separately, stacked
horizontally or stacked vertically.
Furthermore, you have the possibility to rename the networks (F2 on selected network element in solution
explorer). For example because you want to create networks for different machines, machine parts or other
content-based connections.
TE352030 Version: 1.0
Page 31

Configuration
6.2 Algorithms
The TwinCAT Analytics Workbench Configurator includes different Analytics algorithms, which you can find
in the toolbox. If the toolbox is empty, you have to select the Analytics project to see the algorithms.
TE3520 31Version: 1.0
Page 32

Configuration
Currently there are eight different groups of algorithms: Analytics-Base, Analytics-Classification, AnalyticsCompare, Analytics-Math, Analytics–Training Base, Analytics-XTS, Analytics-XY Path Analysis and
Analytics-WT. In the following all of them are described.
Each algorithm has the same three icons on the upper right corner:
TE352032 Version: 1.0
Page 33

Configuration
• Glasses: If you click on the glasses icon you can see the optional parameter Enable Execution. You
can select a boolean signal for this parameter, so that the algorithm is just active, if the value of the
selected signal is TRUE.
• Reset Arrow: If you click on the arrow the output values of the specific algorithm will be reseted.
• Minimize Arrow: if you click on the minimize arrow on the right, the algorithm will be folded.
6.2.1 Analytics - Base
The algorithms of the category Analytics-Base provide base functionalities for analyzing process and
application data. For example threshold detection, timing analysis or calculation of minimum, maximum and
average values.
6.2.1.1 Edge Counter 1Ch
The Edge Counter 1Ch counts the amount of raised events. An event is raised when the signal of the input
channel passes the configured edge at a specific threshold.
Optional a boolean signal for Enable Execution can be selected, so that the algorithm is just active, if the
value of the selected signal is TRUE.
Configuration Options
• Type of the edge: Indicates whether the edge counter should react to a rising or a falling edge.
• Threshold: Threshold of the signal at the respective edge. If the signal passes this threshold, the
event is raised.
Output Values
• Edge: Shows TRUE in the moment the event is raised, otherwise FALSE.
• Count: Counts the amount of raised events.
• Last Event: Indicates the point of time of the last raised event → the event can be pulled into the
scope chart by Drag & Drop to show it as a trigger-event.
Standard HMI Controls
The following HMI controls are available for the Edge Counter 1Ch algorithm to generate an Analytics
Dashboard:
1.The SingleValue control visualizes the Count and Last Event output values.
2.The Table control visualizes all output values: Edge, Count, Last Event.
TE3520 33Version: 1.0
Page 34

Configuration
Alternatively, custom HMI controls can be mapped to the Edge Counter 1Ch algorithm using the Mapping
Wizard.
6.2.1.2 Edge Counter On Off 1Ch
The Edge Counter On Off 1Ch counts the amount of raised on- and off-events. An on-event is raised when
the signal of the input channel passes the configured edge at a specific on-threshold and an off-event is
raised when the off-threshold is passed by the same signal.
Optional a boolean signal for Enable Execution can be selected, so that the algorithm is just active, if the
value of the selected signal is TRUE.
Configuration Options
• Type of the edge: Indicates whether the edge counter should react to a rising or a falling edge.
• Threshold On: Threshold of the signal at the respective edge. If the signal passes this threshold, the
on-event is raised.
• Threshold Off: Threshold of the signal at the respective edge. If the signal passes this threshold, the
off-event is raised.
Output Values
• Is On: Shows TRUE within the time range between on-event and off-event, otherwise FALSE.
• Edge On: Shows TRUE if there is a raising edge.
• Edge Off: Shows TRUE if there is a falling edge.
• Count On: Counts the amount of raised on-events.
• Count Off: Counts the amount of raised off-events.
• Last Event: Indicates the point of time of the last raised event → the event can be pulled into the
scope chart by Drag & Drop to show it as a trigger-event.
TE352034 Version: 1.0
Page 35

Configuration
Standard HMI Controls
The following HMI controls are available for the Edge Counter On Off 1Ch algorithm to generate an Analytics
Dashboard:
1.The EdgeCounterOnOff control visualizes the Is On, Count On, Count Off and Last Event output values.
2. The SingleValue control visualizes the Count On and Last Event output values.
3.The BinaryStare controls visualizes the Is On output value.
4. The Table control visualizes all output values: Edges (Is On, Edge On, Edge Off), Count On, Count Off,
Last Event.
TE3520 35Version: 1.0
Page 36

Configuration
Alternatively, custom HMI controls can be mapped to the Edge Counter On Off 1Ch algorithm using the
Mapping Wizard.
6.2.1.3 Edge Counter On Off 2Ch
The Edge Counter On Off 2Ch counts the amount of raised on- and off-events. An on-event is raised when
the signal of the first input channel passes the configured edge at a specific on-threshold and an off-event is
raised when the off-threshold is passed by the signal of the second channel.
Optional a boolean signal for Enable Execution can be selected, so that the algorithm is just active, if the
value of the selected signal is TRUE.
Configuration Options
• Type of the edge: Indicates whether the edge counter should react to a rising or a falling edge.
• Threshold On: Threshold of the signal at the respective edge. If the signal passes this threshold, the
on-event is raised.
• Reset On Multiple On: If the checkbox is ticked off, the "Count On"-counter is increased on every onevent. Otherwise the on-events are just counted after a reset of the counter (off-event).
• Threshold Off: Threshold of the signal at the respective edge. If the signal passes this threshold, the
off-event is raised.
TE352036 Version: 1.0
Page 37

Configuration
Output Values
• Is On: Shows TRUE within the time range between on-event and off-event, otherwise FALSE.
• Edge On: Shows TRUE if there is a raising edge.
• Edge Off: Shows TRUE if there is a falling edge.
• Count On: Counts the amount of raised on-events.
• Count Off: Counts the amount of raised off-events.
• Last Event: Indicates the point of time of the last raised event → the event can be pulled into the
scope chart by Drag & Drop to show it as a trigger-event.
Standard HMI Controls
The following HMI controls are available for the Edge Counter On Off 2Ch algorithm to generate an Analytics
Dashboard:
1.The EdgeCounterOnOff control visualizes the Is On, Count On, Count Off and Last Event output values.
2. The SingleValue control visualizes the Count On and Last Event output values.
3.The BinaryStare controls visualizes the Is On output value.
4. The Table control visualizes all output values: Edges (Is On, Edge On, Edge Off), Count On, Count Off,
Last Event.
TE3520 37Version: 1.0
Page 38

Configuration
Alternatively, custom HMI controls can be mapped to the Edge Counter On Off 2Ch algorithm using the
Mapping Wizard.
6.2.1.4 Event Timing Analysis 1Ch
The Event Timing Analysis 1Ch measures time differences between on- and off-event and counts the
amount of raised events. An on-event is raised when the signal of the input channel passes the configured
edge at a specific on-threshold and an off-event is raised when the off-threshold is passed by the same
signal.
Optional a boolean signal for Enable Execution can be selected, so that the algorithm is just active, if the
value of the selected signal is TRUE.
Configuration Options
• Type of the edge: Indicates whether the edge counter should react to a rising or a falling edge.
TE352038 Version: 1.0
Page 39

Configuration
• Threshold On: Threshold of the signal at the respective edge. If the signal passes this threshold, the
on-event is raised.
• Threshold Off: Threshold of the signal at the respective edge. If the signal passes this threshold, the
off-event is raised.
Output Values
• Is On: Shows TRUE within the time range between on-event and off-event, otherwise FALSE.
• Current Interval: Shows the time of the current interval.
• On Min: Shows the minimal time the "Is On"-value is TRUE.
• On Max: Shows the maximal time the "Is On"-value is TRUE.
• On Avg: Shows the average time the "Is On"-value is TRUE.
• On Total: Shows the total time the "Is On"-value is TRUE.
• Off Min: Shows the minimal time the "Is On"-value is FALSE.
• Off Max: Shows the maximal time the "Is On"-value is FALSE.
• Off Avg: Shows the average time the "Is On"-value is FALSE.
• Off Total: Shows the total time the "Is On"-value is FALSE.
• Count On: Counts the amount of raised on-events.
Standard HMI Controls
The following HMI controls are available for the Event Timing Analysis 1Ch algorithm to generate an
Analytics Dashboard:
1. The EventTiming control visualizes the Is On, Count On, Current Interval, On Min, On Max, On Avg, On
Total, Off Min, Off Max, Off Avg, Off Total output values.
2. The SingleValue control visualizes the Count On output value.
TE3520 39Version: 1.0
Page 40

Configuration
3. The Table control visualizes all output values: Is On, Count On, Current Interval, On Min, On Max, On
Avg, On Total, Off Min, Off Max, Off Avg, Off Total.
Alternatively, custom HMI controls can be mapped to the Event Timing Analysis 1Ch algorithm using the
Mapping Wizard.
TE352040 Version: 1.0
Page 41

Configuration
6.2.1.5 Event Timing Analysis 2Ch
The Event Timing Analysis 2Ch measures time differences between on- and off-event and counts the
amount of raised events. An on-event is raised when the signal of the first input channel passes the
configured edge at a specific on-threshold and an off-event is raised when the off-threshold is passed by the
signal of the second channel.
Optional a boolean signal for Enable Execution can be selected, so that the algorithm is just active, if the
value of the selected signal is TRUE.
Configuration Options
• Type of the edge: Indicates whether the edge counter should react to a rising or a falling edge.
• Threshold On: Threshold of the signal at the respective edge. If the signal passes this threshold, the
on-event is raised.
• Reset On Multiple On: If the checkbox is ticked off, the "Count On"-counter is increased on every onevent. Otherwise the on-events are just counted after a reset of the counter (off-event).
• Threshold Off: Threshold of the signal at the respective edge. If the signal passes this threshold, the
off-event is raised.
Output Values
• Is On: Shows TRUE within the time range between on-event and off-event, otherwise FALSE.
• Current Interval: Shows the time of the current interval.
• On Min: Shows the minimal time the "Is On"-value is TRUE.
• On Max: Shows the maximal time the "Is On"-value is TRUE.
• On Avg: Shows the average time the "Is On"-value is TRUE.
• On Total: Shows the total time the "Is On"-value is TRUE.
• Off Min: Shows the minimal time the "Is On"-value is FALSE.
• Off Max: Shows the maximal time the "Is On"-value is FALSE.
• Off Avg: Shows the average time the "Is On"-value is FALSE.
• Off Total: Shows the total time the "Is On"-value is FALSE.
• Count On: Counts the amount of raised on-events.
Standard HMI Controls
The following HMI controls are available for the Event Timing Analysis 2Ch algorithm to generate an
Analytics Dashboard:
1. The EventTiming control visualizes the Is On, Count On, Current Interval, On Min, On Max, On Avg, On
Total, Off Min, Off Max, Off Avg, Off Total output values.
TE3520 41Version: 1.0
Page 42

Configuration
2. The SingleValue control visualizes the Count On output value.
3. The Table control visualizes all output values: Is On, Count On, Current Interval, On Min, On Max, On
Avg, On Total, Off Min, Off Max, Off Avg, Off Total.
TE352042 Version: 1.0
Page 43

Configuration
Alternatively, custom HMI controls can be mapped to the Event Timing Analysis 2Ch algorithm using the
Mapping Wizard.
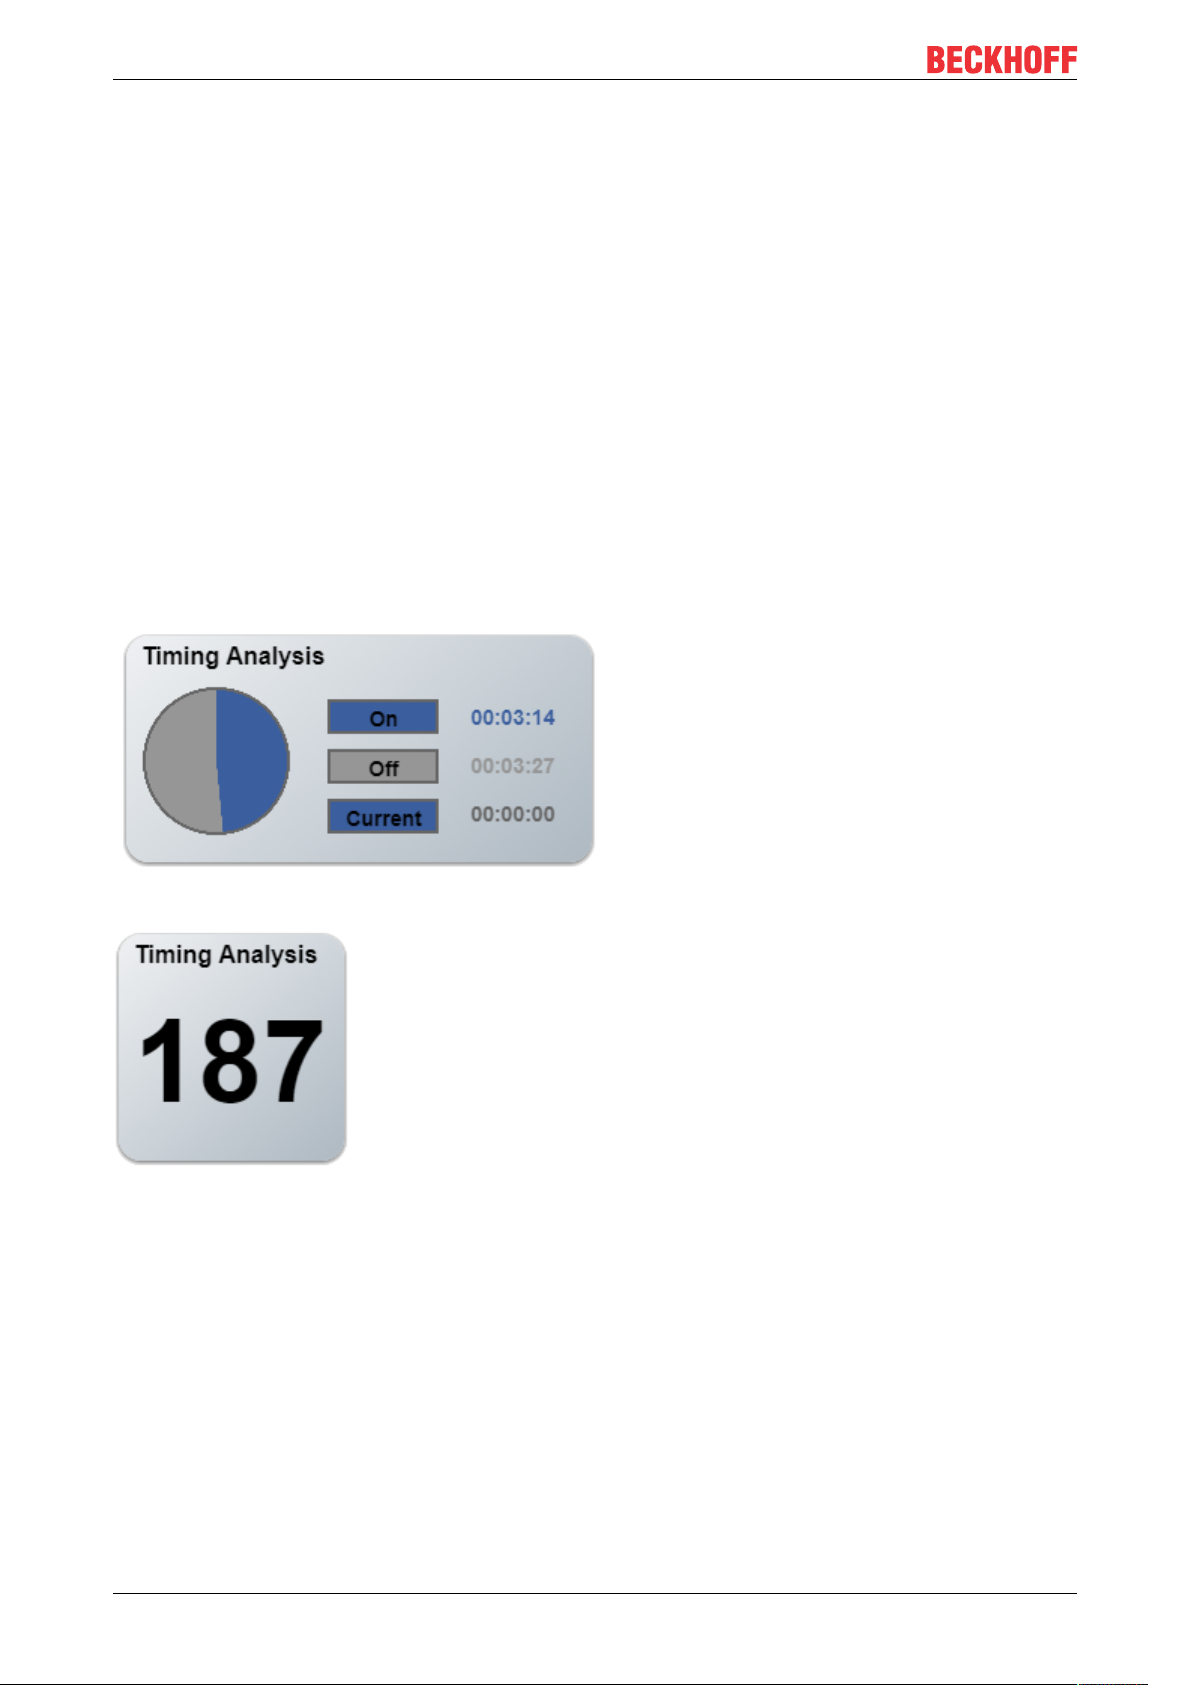
6.2.1.6 Timing Analysis 1Ch
The Timing Analysis 1Ch measures time differences between on- and off-periods and counts the amount of
on-periods. The on-period starts when the condition of operator and threshold is met.
Optional a boolean signal for Enable Execution can be selected, so that the algorithm is just active, if the
value of the selected signal is TRUE.
TE3520 43Version: 1.0
Page 44
Configuration
Configuration Options
• Operator: Indicates whether the input value should be greater, greater or equal, equal, less or equal,
less or not equal than the Threshold.
• Threshold: Threshold of the signal.
Output Values
• Is On: Shows TRUE within the time range of the on-period, otherwise FALSE.
• Current Interval: Shows the time of the current interval.
• On Total: Shows the total time the "Is On"-value is TRUE.
• Off Total: Shows the total time the "Is On"-value is FALSE.
• Count On: Counts the amount of raised on-events.
Standard HMI Controls
The following HMI controls are available for the Timing Analysis 1Ch algorithm to generate an Analytics
Dashboard:
1.The TimingAnalysis controls visualizes the Is On, On Total, Off Total and Current Interval output values.
2. The SingleValue control visualizes the Count On output value.
3.The Table control visualizes all output values: Is On, Count On, Current Interval, On Total, Off Total.
TE352044 Version: 1.0
Page 45

Configuration
Alternatively, custom HMI controls can be mapped to the Timing Analysis 1Ch algorithm using the Mapping
Wizard.
6.2.1.7 Lifecycle Analysis 1Ch
The Lifecycle Analysis 1Ch calculates the elapsed and the estimated remaining cycles of a device. When the
signal of the input channel passes the configured edge at a specific threshold, the elapsed cycles are
increased and the remaining cycles are decreased.
Optional a boolean signal for Enable Execution can be selected, so that the algorithm is just active, if the
value of the selected signal is TRUE.
Configuration Options
• Type of the edge: Indicates whether the edge counter should react to a rising or a falling edge.
• Threshold: Threshold of the signal at the respective edge. If the signal passes this threshold, an event
is raised.
• Estimated Cycles: Estimated cycles in the lifetime of the respective device.
Output Values
• Elapsed Cycles: Counts the amount of cycles which are already elapsed.
• Remaining Cycles: Shows the remaining cycles of the device as the difference of estimated and
elapsed cycles.
Standard HMI Controls
The following HMI controls are available for the Lifecycle Analysis 1Ch algorithm to generate an Analytics
Dashboard:
1.The Process controls visualizes the Elapsed Cycles and Remaining Cycles output values.
TE3520 45Version: 1.0
Page 46

Configuration
2. The Table control visualizes all output values: Elapsed Cycles, Remaining Cycles.
Alternatively, custom HMI controls can be mapped to the Lifecycle Analysis 1Ch algorithm using the
Mapping Wizard.
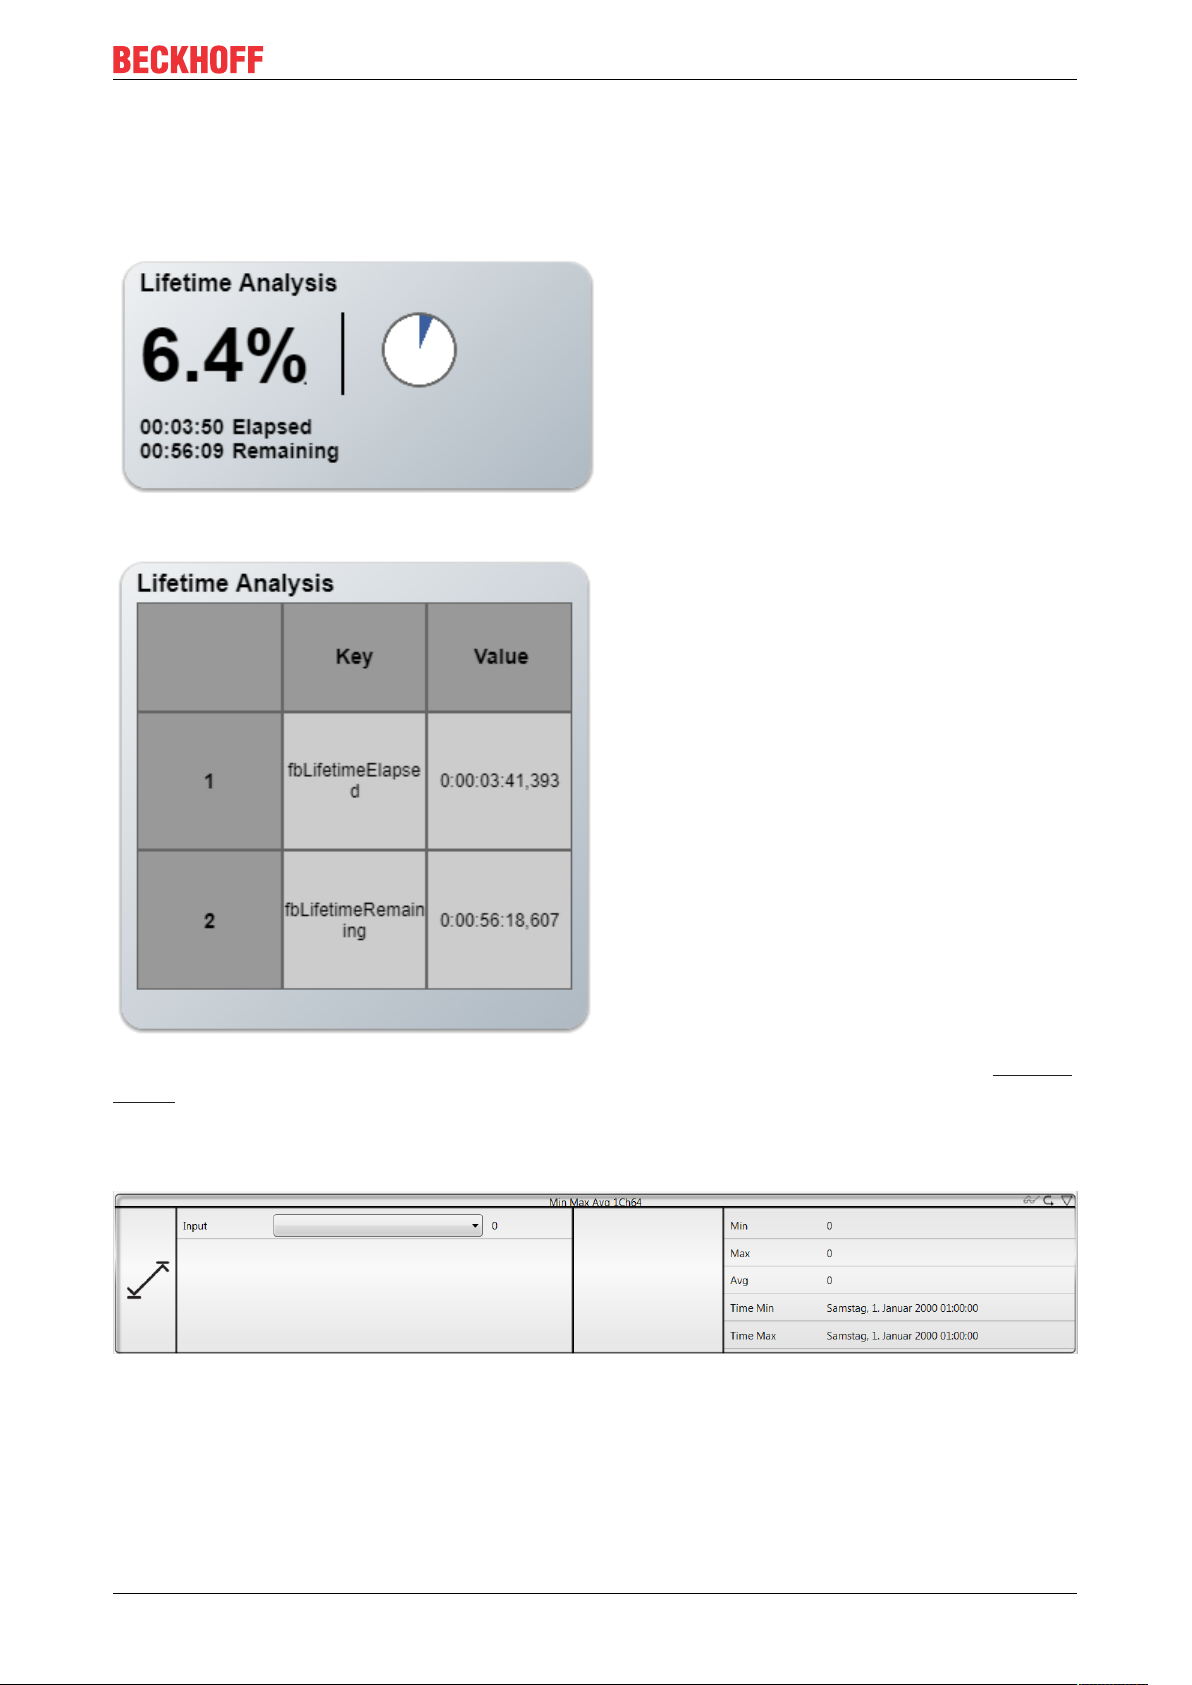
6.2.1.8 Lifetime Analysis 1Ch
The Lifetime Analysis 1Ch calculates the elapsed and the estimated remaining lifetime of a device. If the
input value met the configured condition the lifetime will be reduced.
Optional a boolean signal for Enable Execution can be selected, so that the algorithm is just active, if the
value of the selected signal is TRUE.
Configuration Options
• Operator: Indicates whether the input value should be greater, greater or equal, equal, less or equal,
less or not equal than the Threshold.
• Threshold: Threshold of the signal.
• Estimated Lifetime: Estimated lifetime of the respective device.
Output Values
• Elapsed Lifetime: Shows the lifetime which is already elapsed.
• Remaining Lifetime: Shows the remaining lifetime of the device as the difference of estimated and
elapsed lifetime.
TE352046 Version: 1.0
Page 47
Configuration
Standard HMI Controls
The following HMI controls are available for the Lifetime Analysis 1Ch algorithm to generate an Analytics
Dashboard:
1. The Process controls visualizes the Elapsed Lifetime and Remaining Lifetime output values.
2. The Table control visualizes all output values: Elapsed Lifetime, Remaining Lifetime.
Alternatively, custom HMI controls can be mapped to the Lifetime Analysis 1Ch algorithm using the Mapping
Wizard.
6.2.1.9 Min Max Avg 1Ch
The Min Max Avg 1Ch calculates the minimum, maximum and the average of the input values from the
beginning of the analysis up to the current moment. Furthermore, the time values of minimum and maximum
are shown.
Optional a boolean signal for Enable Execution can be selected, so that the algorithm is just active, if the
value of the selected signal is TRUE.
TE3520 47Version: 1.0
Page 48

Configuration
Output Values
• Min: Shows the minimum of the input values.
• Max: Shows the maximum of the input values.
• Avg: Shows the average of the input values.
• Time Min: Shows the time value of the minimum → this event can be pulled into the scope chart by
Drag & Drop to show it as a trigger-event.
• Time Max: Shows the time value of the maximum → this event can be pulled into the scope chart by
Drag & Drop to show it as a trigger-event.
Standard HMI Controls
The following HMI controls are available for the Min Max Avg 1Ch algorithm to generate an Analytics
Dashboard:
1.The MinMaxAvg control visualizes the Min, Max, Avg, Time Min and Time Max output values and the data
input value.
2. The Table control visualizes all output values: Min, Max, Avg, Time Min, Time Max.
TE352048 Version: 1.0
Page 49

Configuration
Alternatively, custom HMI controls can be mapped to the Min Max Avg 1Ch algorithm using the Mapping
Wizard.
6.2.1.10 Min Max Avg Interval 1Ch
The Min Max Avg Interval 1Ch calculates the minimum, maximum and the average of the input values for the
time period of the configured Interval. Furthermore the time values of minimum and maximum are shown.
Note that all values are from the relative last interval and that they will only be updated when the interval is
over. The calculation restarts when the time of the interval has elapsed.
Optional a boolean signal for Enable Execution can be selected, so that the algorithm is just active, if the
value of the selected signal is TRUE.
Configuration Options
• Interval: Time Interval in which the values should be calculated.
Output Values
• Min: Shows the minimum of the input values in the last time interval.
• Max: Shows the maximum of the input values in the last time interval.
• Avg: Shows the average of the input values in the last time interval.
• Time Min: Shows the time value of the minimum in the last time interval → this event can be pulled
into the scope chart by Drag & Drop to show it as a trigger-event.
• Time Max: Shows the time value of the maximum in the last time interval → this event can be pulled
into the scope chart by Drag & Drop to show it as a trigger-event.
• Current Interval Time: Shows the timespan, that already proceeded from the current interval.
Standard HMI Controls
The following HMI controls are available for the Min Max Avg Interval 1Ch algorithm to generate an Analytics
Dashboard:
1. The MinMaxAvg control visualizes the Min, Max, Avg, Time Min and Time Max output values and the data
input value.
TE3520 49Version: 1.0
Page 50

Configuration
2. The Table control visualizes all output values: Min, Max, Avg, Time Min, Time Max, Current Interval Time.
Alternatively, custom HMI controls can be mapped to the Min Max Avg Interval 1Ch algorithm using the
Mapping Wizard.
TE352050 Version: 1.0
Page 51

Configuration
6.2.1.11 Moving Average 1Ch
The Moving Average 1Ch calculates the moving average, the minimum and the maximum of the most recent
input values in an interval of specified length. Furthermore the time values of minimum and maximum are
shown. The calculation of the moving average depends on the configuration parameters Num Values and
Startup Behaviour.
Optional a boolean signal for Enable Execution can be selected, so that the algorithm is just active, if the
value of the selected signal is TRUE.
Configuration Options
• Num Values: Amount of values which will be included in the calculation of the moving average, the
minimum and the maximum.
• Startup Behaviour: Calculation behaviour at the beginning of the analysis before at least Num Values
input values exist.
ZeroPadding: The missing values are filled with zeros.
UseFirstValue: The first value is used until the amount of values is equivalent to Num Values.
WaitUntilFilled: The first result is calculated when the amount of values is equivalent to Num
Values.
AvgOverExisting: The average will be calculated with the already existing values until the amount
of values is equivalent to Num Values.
Output Values
• Moving Avg: Shows the current average value.
• Moving Min: Shows the minimum of the last n input values.
• Moving Max: Shows the maximum of the last n input values.
Standard HMI Controls
The following HMI controls are available for the Moving Average 1Ch algorithm to generate an Analytics
Dashboard:
1. The MinMaxAvg control visualizes the Moving Min, Moving Max and Moving Avg output values and the
data input value.
TE3520 51Version: 1.0
Page 52

Configuration
2. The Table control visualizes all output values: Moving Min, Moving Max, Moving Avg.
Alternatively, custom HMI controls can be mapped to the Moving Average 1Ch algorithm using the Mapping
Wizard.
6.2.1.12 Moving Interval Counter 1Ch
The Moving Interval Counter 1Ch counts the amount of raised events within a configured interval. An event
is raised when the signal of the input channel passes the configured edge at a specific threshold. The
calculation restarts when the time of the interval has elapsed.
Optional a boolean signal for Enable Execution can be selected, so that the algorithm is just active, if the
value of the selected signal is TRUE.
TE352052 Version: 1.0
Page 53

Configuration
Configuration Options
• Type of the edge: Indicates whether the edge counter should react to a rising or a falling edge.
• Threshold: Threshold of the signal at the respective edge. If the signal passes this threshold, the
event is raised.
• Interval: Time Interval in which the values should be calculated.
• Count Limit: Limits the number of edges that can be counted in an interval.
Output Values
• Edge: Shows TRUE in the moment the event is raised, otherwise FALSE.
• Limited: Shows TRUE if the number of edges in the current interval exceeds the set Count Limit.
• Counts in Interval: Shows the amount of raised events in the current interval.
• Time First Count: Indicates the point of time of the first raised event → the event can be pulled into
the scope chart by Drag & Drop to show it as a trigger-event.
• Time Last Count: Indicates the point of time of the last raised event → the event can be pulled into the
scope chart by Drag & Drop to show it as a trigger-event.
Standard HMI Controls
The following HMI controls are available for the Moving Interval Counter 1Ch algorithm to generate an
Analytics Dashboard:
1. The MovingIntervalCounter control visualizes the Counts in Interval, Time First Count and Time Last
Count output values.
2. The Table control visualizes all output values: Edge, Counts in Interval, Time First Count, Time Last
Count, Limited.
TE3520 53Version: 1.0
Page 54

Configuration
Alternatively, custom HMI controls can be mapped to the Moving Interval Counter 1Ch algorithm using the
Mapping Wizard.
6.2.1.13 Interval Piece Counter 1Ch
The Interval Piece Counter 1Ch counts the amount of raised events within a configured interval, which starts
when the value of the start interval flag is TRUE. An event is raised when the signal of the input channel
passes the configured edge at a specific threshold. The calculation restarts when the time of the interval has
elapsed and the value of the start interval flag is True again.
Optional a boolean signal for Enable Execution can be selected, so that the algorithm is just active, if the
value of the selected signal is TRUE.
Configuration Options
• Type of the edge: Indicates whether the edge counter should react to a rising or a falling edge.
• Threshold: Threshold of the signal at the respective edge. If the signal passes this threshold, the
event is raised.
• Reset On Multiple Start: If the checkbox is ticked off, the interval restarts when the start interval flag
gets TRUE again. Otherwise the interval restarts automatically when the time has elapsed.
• Interval: Time interval in which the values should be calculated.
Output Values
• Executing Interval: Shows True, if the calculation is active and the interval is running, otherwise
False.
• Num Intervals: Shows the number of Intervals.
• Count Last Interval: Shows the amount of raised events in the last interval.
• Count Current Interval: Shows the amount of raised events in the current interval or if the calculation
is currently inactive, the amount of raised events in the last interval.
• Count Min: Shows the minimum of raised events in an interval.
• Count Max: Shows the maximum of raised events in an interval.
• Time Count Min: Shows the time value of the minimum → this event can be pulled into the scope
chart by Drag & Drop to show it as a trigger-event.
• Time Count Max: Shows the time value of the maximum → this event can be pulled into the scope
chart by Drag & Drop to show it as a trigger-event.
• Current Interval Time: Shows the time of the current interval → this event can be pulled into the
scope chart by Drag & Drop to show it as a trigger-event.
Standard HMI Controls
The following HMI controls are available for the Interval Piece Counter 1Ch algorithm to generate an
Analytics Dashboard:
1.The PieceCounter control visualizes the Num Intervals, Count Last Interval, Count Current Interval, Count
Min, Count Max, Time Count Min, Time Count Max and Time Current Interval output values.
TE352054 Version: 1.0
Page 55

Configuration
2. The Table control visualizes all output values: Num Intervals, Count Last Interval, Count Current Interval,
Count Min, Count Max, Time Count Min, Time Count Max, Time Current Interval.
Alternatively, custom HMI controls can be mapped to the Interval Piece Counter 1Ch algorithm using the
Mapping Wizard.
TE3520 55Version: 1.0
Page 56

Configuration
6.2.1.14 Timer 1Ch
The Timer 1Ch starts a timer which can be configured by timer mode and interval. According to the specific
timer mode the timer is started, if the configured condition becomes TRUE (TON, TP) or the condition
becomes FALSE (TOF).
Optional a boolean signal for Enable Execution can be selected, so that the algorithm is just active, if the
value of the selected signal is TRUE.
Configuration Options
• Operator: Indicates whether the input value should be greater, greater or equal, equal, less or equal or
less than the Threshold.
• Threshold: Threshold of the signal.
• Timer Mode: Mode of the timer:
TON: The TON timer is a turn on delay timer that enables the output after the threshold condition
becomes TRUE and the timespan specified in the interval has elapsed.
TOF: The TOF timer is a turn off delay timer that disables the output after the threshold condition
becomes FALSE and the timespan specified in the interval has elapsed.
TP: The TP timer is a pulse generator that enables the output for the amount of time specified in
the interval after the threshold condition becomes TRUE.
• Interval: Time interval of the configured timer.
Output Values
• Output: Shows the output value which is affected by the configured timer.
• Elapsed Time: Shows the elapsed time of the timer.
Standard HMI Controls
The following HMI controls are available for the Timer 1Ch algorithm to generate an Analytics Dashboard:
1. The Timer control visualizes the Elapsed Time output value.
2. The Table control visualizes all output values: Output, Elapsed Time.
TE352056 Version: 1.0
Page 57

Configuration
Alternatively, custom HMI controls can be mapped to the Timer 1Ch algorithm using the Mapping Wizard.
6.2.1.15 Time Clock 1Ch
The Time Clock 1Ch executes a time switch which can be configured with switch-on time, switch-off time and
the days of the week on which the time switch should be active. As reference value a timestamp is required,
because the algorithm needs a time context, in which it should work. This reference timestamp is set
automatically, if there is another algorithm in the configuration. Therefore it is not possible to use the Time
Clock 1Ch stand alone.
Optional a boolean signal for Enable Execution can be selected, so that the algorithm is just active, if the
value of the selected signal is TRUE.
Configuration Options
• Time On: Switch-on time.
• Time Off: Switch-off time.
• Day of Week Mask: The days of the week on which the time switch should be active.
Output Values
• Is On: Shows TRUE, if the time switch is on, otherwise FALSE.
• Next Switch: Shows the remaining time up to the next switch.
Standard HMI Controls
The following HMI controls are available for the Time Clock 1Ch algorithm to generate an Analytics
Dashboard:
1. The Timer control visualizes the Next Switch output value.
TE3520 57Version: 1.0
Page 58

Configuration
2. The Table control visualizes all output values: Output, Next Switch.
Alternatively, custom HMI controls can be mapped to the Time Clock 1Ch algorithm using the Mapping
Wizard.
6.2.1.16 Continuous Piece Counter 1Ch
The Continuous Piece Counter 1Ch counts the number of pieces within the configured interval. The counter
is increased when the signal of the input channel passes the configured edge at a specific threshold. The
calculation restarts when the time of the interval has elapsed. The algorithm provides the amount of pieces,
the minimal and the maximal number of pieces as well as the time values of minimum and maximum.
Optional a boolean signal for Enable Execution can be selected, so that the algorithm is just active, if the
value of the selected signal is TRUE.
Configuration Options
• Type of the edge: Indicates whether the edge counter should react to a rising or a falling edge.
• Threshold: Threshold of the signal at the respective edge. If the signal passes this threshold, the
counter is increased.
• Interval: Time interval in which the values should be calculated.
TE352058 Version: 1.0
Page 59

Configuration
Output Values
• Num Interval: Shows the number of intervals.
• Count Last Interval: Shows the amount of pieces in the last interval.
• Count Current Interval: Shows the amount of pieces in the current interval.
• Count Min: Shows the minimal number of pieces in an interval.
• Count Max: Shows the maximal number of pieces in an interval.
• Time Count Min: Shows the time value of the minimum.
• Time Count Max: Shows the time value of the maximum.
• Current Interval Time: Shows the time of the current interval.
Standard HMI Controls
The following HMI controls are available for the Continuous Piece Counter 1Ch algorithm to generate an
Analytics Dashboard:
1. The PieceCounter control visualizes the Num Intervals, Count Last Interval, Count Current Interval, Count
Min, Count Max, Time Count Min, Time Count Max and Time Current Interval output values.
2. The Table control visualizes all output values: Num Intervals, Count Last Interval, Count Current Interval,
Count Min, Count Max, Time Count Min, Time Count Max, Time Current Interval.
TE3520 59Version: 1.0
Page 60

Configuration
Alternatively, custom HMI controls can be mapped to the Continuous Piece Counter 1Ch algorithm using the
Mapping Wizard.
6.2.1.17 Productivity Diagnosis 3Ch
The Productivity Diagnosis 3Ch calculates the productivity of the process during a configured interval. The
interval can be started and stopped by the input level Producing. Executing the production interval the
production cycles are considered. Each production cycle is started with an edge at Input Start Cycle and
stopped with an Edge at Input Stop Cycle. The productivity over the whole production internal (Productivity)
and the productivity of the last production cycle (ProductivityLastCycle) are provided as output values. The
algorithm can be configured with the setpoint of produced pieces within a configured interval e.g. 1 piece per
30 seconds or 50 pieces per hour.
Optional a boolean signal for Enable Execution can be selected, so that the algorithm is just active, if the
value of the selected signal is TRUE.
Configuration Options
• Type of the Edge: Indicates whether the algorithm should react to a rising or a falling edge. It can be
configured for every Threshold individually.
• Threshold Level Producing: Threshold of the Input Producing at the respective edge. If the signal
passes this threshold, the Production Time Interval is started.
TE352060 Version: 1.0
Page 61

Configuration
• Threshold Edge Start Cycle: Threshold of the Input Start Cycle at the respective edge. If the signal
passes this threshold, the production cycle is started.
• Threshold Edge Stop Cycle: Threshold of the Input Stop Cycle at the respective edge. If the signal
passes this threshold, the production cycle is stopped.
• Produced Pieces: Setpoint of produced pieces during the configured time interval (Production Time).
• Production Time: Time interval of the production time. It can be configured in days, hours, minutes or
seconds.
Output Values
• Producing: Indicates if the Production Time Interval is currently running.
• Productivity: Shows the productivity over the whole production as a percentage.
• Productivity Last Cycle: Shows the productivity of the last production cycle as a percentage.
Standard HMI Controls
The following HMI controls are available for the Productivity Diagnosis 3Ch algorithm to generate an
Analytics Dashboard:
1. The ProductivityDiagnosis control visualizes the Productivity and Productivity Last Cycle output values.
2. The Table control visualizes all output values: New Result, Producing, Cycle Finished, Productivity,
Productivity Last Cycle.
Alternatively, custom HMI controls can be mapped to the Productivity Diagnosis 3Ch algorithm using the
Mapping Wizard.
TE3520 61Version: 1.0
Page 62

Configuration
6.2.1.18 Downsampling Buffer 1Ch
The Downsampling Buffer 1Ch buffers values of the input channel with a configurable down sampling factor.
The size of the buffer, which corresponds to the number of output channels, is configurable as well.
Optional a boolean signal for Enable Execution can be selected, so that the algorithm is just active, if the
value of the selected signal is TRUE.
Configuration Options
• Buffer Size: Indicates the number of values that are stored and returned as output. The number of
output channels equals the buffer size.
• Downsampling Factor: The number of cycles that pass between two values being saved to the buffer.
If the Downsampling Factor is set to one, all values are buffered.
• Sample Mode: The values from the buffer can be passed to the output channels in two different
modes:
◦ Flow: The buffer is filled like a ring buffer. At the start of the analysis all output values are set to
zero. Each change to the ring buffer is transferred to the output channels immediately. The New
Result flag is set to TRUE, once all output channels got assigned a value and is always true, when
a new value is saved in the buffer (each down sampling factor cycles).
◦ Wait: At the start of the analysis or after reset all output channels are set to zero. Only after the
internal buffer is full. These values are transferred to the output channels and the New Result flag
is set to true. These values stay as output values until all the values in the internal buffer are
renewed. Only then they are transferred to the output channels.
Output Values
• Output Value 00..n: Results of the down sampling buffer, according to the sample mode.
6.2.2 Analytics - Classification
The algorithms of the category Analytics-Classification provide functionalities for classification and state
detection.
6.2.2.1 Threshold Classificator 1Ch
The Threshold Classificator 1Ch classifies the input values into three different classes. OK, Warning and
Alarm according to the configured thresholds.
Optional a boolean signal for Enable Execution can be selected, so that the algorithm is just active, if the
value of the selected signal is TRUE.
Configuration Options
• Level Ok / Warning: The input values which are smaller than the configured threshold are classified
into into the OK class and the input values which are equal to or greater than the configured threshold
are classified into the Warning class.
• Level Warning / Alarm: The input values which are smaller than the configured threshold are
classified into into the Warning class and the input values which are equal to or greater than the
configured threshold are classified into the Alarm class.
TE352062 Version: 1.0
Page 63

Configuration
Output Values
• Class: Shows the class to which the input values belong to.
• Last Event Warning: Indicates the point of time of the last raised warning event → the event can be
pulled into the scope chart by Drag & Drop to show it as a trigger-event.
• Last Event Alarm: Indicates the point of time of the last raised alarm event → the event can be pulled
into the scope chart by Drag & Drop to show it as a trigger-event.
Standard HMI Controls
The following HMI controls are available for the Threshold Classificator 1Ch algorithm to generate an
Analytics Dashboard:
1.The TrafficLight control visualizes the Class, Last Event Warning and Last Event Alarm output values and
the data input value.
2.The MultiState control visualizes the Class output value.
3.The Table control visualizes all output values: Class, Last Event Warning Last Event Alarm.
TE3520 63Version: 1.0
Page 64

Configuration
Alternatively, custom HMI controls can be mapped to the Threshold Classificator 1Ch algorithm using the
Mapping Wizard.
6.2.2.2 Threshold String Classificator 1Ch
The Threshold String Classificator 1Ch classifies the input values into three different classes according to the
configured thresholds. The class names (output string) can be configured individually as String 1, String 2
and String 3.
Optional a boolean signal for Enable Execution can be selected, so that the algorithm is just active, if the
value of the selected signal is TRUE.
Configuration Options
• Level 1 / 2: The input values which are smaller than the configured threshold are classified into into the
first class and the input values which are equal to or greater than the configured threshold are
classified into the second class.
• Level 2 / 3: The input values which are smaller than the configured threshold are classified into into the
second class and the input values which are equal to or greater than the configured threshold are
classified into the third class.
• String 1: Name of the first class.
• String 2: Name of the second class.
• String 3: Name of the third class.
Output Values
• Output String: Shows the class to which the input values belong to.
• Last Event: Indicates the point of time of the last raised event → the event can be pulled into the
scope chart by Drag & Drop to show it as a trigger-event.
TE352064 Version: 1.0
Page 65
Configuration
Standard HMI Controls
The following HMI controls are available for the Threshold String Classificator 1Ch algorithm to generate an
Analytics Dashboard:
1.The TrafficLight control visualizes the Output String and Last Event output values and the data input value.
2.The SingleValue controls visualizes the Output string output value.
3.The Table control visualizes all output values: Output String, Last Event.
TE3520 65Version: 1.0
Page 66

Configuration
Alternatively, custom HMI controls can be mapped to the Threshold String Classificator 1Ch algorithm using
the Mapping Wizard.
6.2.2.3 State Histogram 1Ch
The State Histogram 1Ch counts how often the input signal (INT) has a specific value between the
configured minimum and maximum and shows the distribution in a histogram. The first bar represents the
boundary values which are smaller than the minimum and the last bar represents the boundary values which
are greater than the maximum. The State Histogram 1Ch is suitable for state-machines to show how often
the different states are executed.
Optional a boolean signal for Enable Execution can be selected, so that the algorithm is just active, if the
value of the selected signal is TRUE.
Configuration Options
• Hist Mode The operating mode of the histogram. You can select between "eAbs" for absolute Values
and "eRel" for relative values to show the percentage distribution.
• Min: Minimal value which should be analyzed.
• Max: Maximal value which should be analyzed.
Output Values
• Num Values: Shows the whole amount of executed states between the configured boarders.
• Histogram: Below the Num Values the Histogram is shown. On each bar the respective value is
displayed.
Standard HMI Controls
The following HMI controls are available for the State Histogram 1Ch algorithm to generate an Analytics
Dashboard:
1.The PieChart control visualizes the Histogram output value.
TE352066 Version: 1.0
Page 67

2. The StateHistogram control visualizes the Histogram output value.
Configuration
3. The Table control visualizes all output values: Num Values, Histogram.
Alternatively, custom HMI controls can be mapped to the State Histogram 1Ch algorithm using the Mapping
Wizard.
TE3520 67Version: 1.0
Page 68

Configuration
6.2.2.4 Bandwidth Classificator 1Ch
The Bandwidth Classificator 1Ch determines whether the input signal is within the configured bounds,
smaller or bigger than the bounds.
Optional a boolean signal for Enable Execution can be selected, so that the algorithm is just active, if the
value of the selected signal is TRUE.
Configuration Options
• Lower Bound: Lower Bound for the comparison.
• Upper Bound: Upper Bound for the comparison.
Output Values
• Class: Shows the class to which the input values belong to (WithinBounds / Smaller / Bigger).
• Last Event: Indicates the point of time of the last raised event → the event can be pulled into the
scope chart by Drag & Drop to show it as a trigger-event.
Standard HMI Controls
The following HMI controls are available for the Bandwidth Classificator 1Ch algorithm to generate an
Analytics Dashboard:
1.The BandwidthClassificator control visualizes the Class and Last Event output values and the Lower
Bound and Upper Bound Configuration options.
2.The MultiStates control visualizes the Class output value.
3.The Table control visualizes all output values: Class, Last Event.
TE352068 Version: 1.0
Page 69

Configuration
Alternatively, custom HMI controls can be mapped to the Bandwidth Classificator 1Ch algorithm using the
Mapping Wizard.
6.2.2.5 Time Based Envelope 1Ch
The Time Based Envelope 1Ch compares, if the periodic input data are within a configured bandwidth of
values, which are read from a file. The comparison starts if the signal of the start period flag is TRUE. It is
recommended not to use the Time Based Envelope 1Ch simultaneously with the Time Based Teach Path 1Ch
[}100] due to concurrent file access.
Optional a boolean signal for Enable Execution can be selected, so that the algorithm is just active, if the
value of the selected signal is TRUE.
Configuration Options
• File Path: Path to the previously teached data file.
• Band Mode: Mode of the band operation (use absolute or relative values).
• Band: Bandwidth of the band operation.
Output Values
• Executing Comparison: Shows TRUE when the algorithm processes the envelope, otherwise FALSE.
The envelope process starts if the start period flag is TRUE.
• Lower Band: Shows the value of the lower band depending on band mode.
• Upper Band: Shows the value of the upper band depending on band mode.
• Within Band: Shows TRUE, if the current values are within the band, otherwise FALSE.
• Compare Result: Result of the current comparison. Shows if the current values are within the band,
smaller or greater than the band.
TE3520 69Version: 1.0
Page 70

Configuration
• Current Compared Cycles: Number of cycles that have been compared.
• Count Within Band: Counts the amount of times, the values were within the band.
• Count Smaller: Counts the amount of times, the values were smaller than the band.
• Count Bigger: Counts the amount of times, the values were greater than the band.
• Value Number: Shows the value number of the data point in the file, that is currently compared.
Standard HMI Controls
The following HMI controls are available for the Time Based Envelope 1Ch algorithm to generate an
Analytics Dashboard:
1.The TimeBasedEnvelope control visualizes the Executing Comparison, Lower Band, Upper Band, Within
Band, Compare Result, Count Within Band, Count Smaller, Count Bigger, Current Compared Cycles, State
and Value Number output values.
2. The Table control visualizes all output values: Executing Comparison, State, Lower Band, Upper Band,
Within Band, Compare Result, Current Compared Cycles, Count Within Band, Count Smaller, Count Bigger,
Value Number.
TE352070 Version: 1.0
Page 71

Configuration
Alternatively, custom HMI controls can be mapped to the Time Based Envelope algorithm using the Mapping
Wizard.
6.2.2.6 Histogram 1Ch
The Histogram 1Ch calculates the distribution of a single channel input value cyclically. It can be configured
with minimal bin, maximal bin and the total amount of bins. The dimension of the output array is the number
of bins + 2. Because values that are less than the minimal bin are stored in the first array element and values
greater than the maximal bin are stored in the last array element.
Optional a boolean signal for Enable Execution can be selected, so that the algorithm is just active, if the
value of the selected signal is TRUE.
TE3520 71Version: 1.0
Page 72

Configuration
Configuration Options
• Min Binned: Minimal value which should be analyzed.
• Max Binned: Maximal value which should be analyzed.
• Bins: Total amount of bins for the histogram that should be calculated.
Output Values
• Num Values: Shows the total amount of analyzed values for the distribution.
• Histogram: Below the Num Values the Histogram is shown. If you move the cursor over the bars, you
can see a tooltip with the value interval and the related amount of values that lies in the interval.
Standard HMI Controls
The following HMI controls are available for the Histogram 1Ch algorithm to generate an Analytics
Dashboard:
1.The Histogram control visualizes the Num Values output value.
2.The Pie Chart control visualizes the Num Values output value.
TE352072 Version: 1.0
Page 73

3.The Table control visualizes all output values: Num Values, Histogram.
Configuration
Alternatively, custom HMI controls can be mapped to the Histogram 1Ch algorithm using the Mapping
Wizard.
6.2.2.7 Bandwidth Classificator 3 Ch
The Bandwidth Classificator 3Ch determines whether the input signal is within the bounds, smaller or bigger
than the bounds. The Bounds can be configured with input signals so that it is possible to use curve
progressions as lower and upper band.
Optional a boolean signal for Enable Execution can be selected, so that the algorithm is just active, if the
value of the selected signal is TRUE.
Output Values
• Class: Shows the class to which the input values belong to (WithinBounds / Smaller / Bigger).
• Last Event: Indicates the point of time of the last raised event → the event can be pulled into the
scope chart by Drag & Drop to show it as a trigger-event.
Standard HMI Controls
The following HMI controls are available for the Bandwidth Classificator 3Ch algorithm to generate an
Analytics Dashboard:
1.The BandwidthClassificator control visualizes the Class and Last Event output values and the Input Lower
Bound and Input Upper Bound.
TE3520 73Version: 1.0
Page 74

Configuration
2.The MultiStates control visualizes the Class output value.
3.The Table control visualizes all output values: Class, Last Event.
Alternatively, custom HMI controls can be mapped to the Bandwidth Classificator 3Ch algorithm using the
Mapping Wizard.
TE352074 Version: 1.0
Page 75

Configuration
6.2.2.8 Curve Sketcher 1Ch
The Curve Sketcher 1Ch identifies reversals (peaks and valleys) in an input data stream. Furthermore, it is
possible to identify local maxima of the absolute difference between two successive values (denoted as
Delta). In analogy to a continuous curve, the identified peaks and valleys correspond to local maxima and
minima. The delta corresponds to the slope such that a maximum of the absolute values of the delta can be
associated with an inflection point.
Optional a boolean signal for Enable Execution can be selected, so that the algorithm is just active, if the
value of the selected signal is TRUE.
Configuration Options
• Threshold Reversal: Threshold value for reversal identification. Reversals will only be detected if their
difference to the next reversal exceeds the value of the Threshold Reversal.
Below you can see some examples of peak identification with the respective threshold reversal. In plot
(a) value y3 is identified as a peak right after processing value y4 because the difference between y
and y4 is larger than threshold reversal. In plot (b) y3 is not identified as a peak because the difference
between y3 and y4 is smaller than threshold reversal and after y4 the curve is increasing again. In plot
(c) value y2 is identified as a peak after processing of value y5 because the difference between y2 and
y5 exceeds threshold reversal. Value y2 cannot be identified as peak before because the difference
between y2 and y3 (y4) is smaller than / equal to threshold reversal and it is not known if the values
keep decreasing.
3
• Calculate Inflection: Boolean Flag. Maxima of the change rate will only be identified if this flag is True.
Otherwise, the values for Max Change Value, Max Change (Rate), Max Change (Timestamp), Count
Max Change will not be calculated.
• Threshold Delta: Threshold value for identification of the delta maxima. Maxima of the absolute
difference of two successive values (delta) will only be detected if the difference between consecutive
deltas exceeds the threshold delta.
Below you can see some examples of maxima identification of delta with the respective threshold delta.
The upper plots show the original input signals and in the lower graphs you can see the related delta.
In plot (a) y4 is identified as a maximum after processing the value y5 because the difference of the two
deltas exceeds the threshold delta. In plot (b) no maximum is detected, because the difference
between the deltas is smaller than the threshold delta. In plot (c) a maximum (y3) is only detected after
TE3520 75Version: 1.0
Page 76
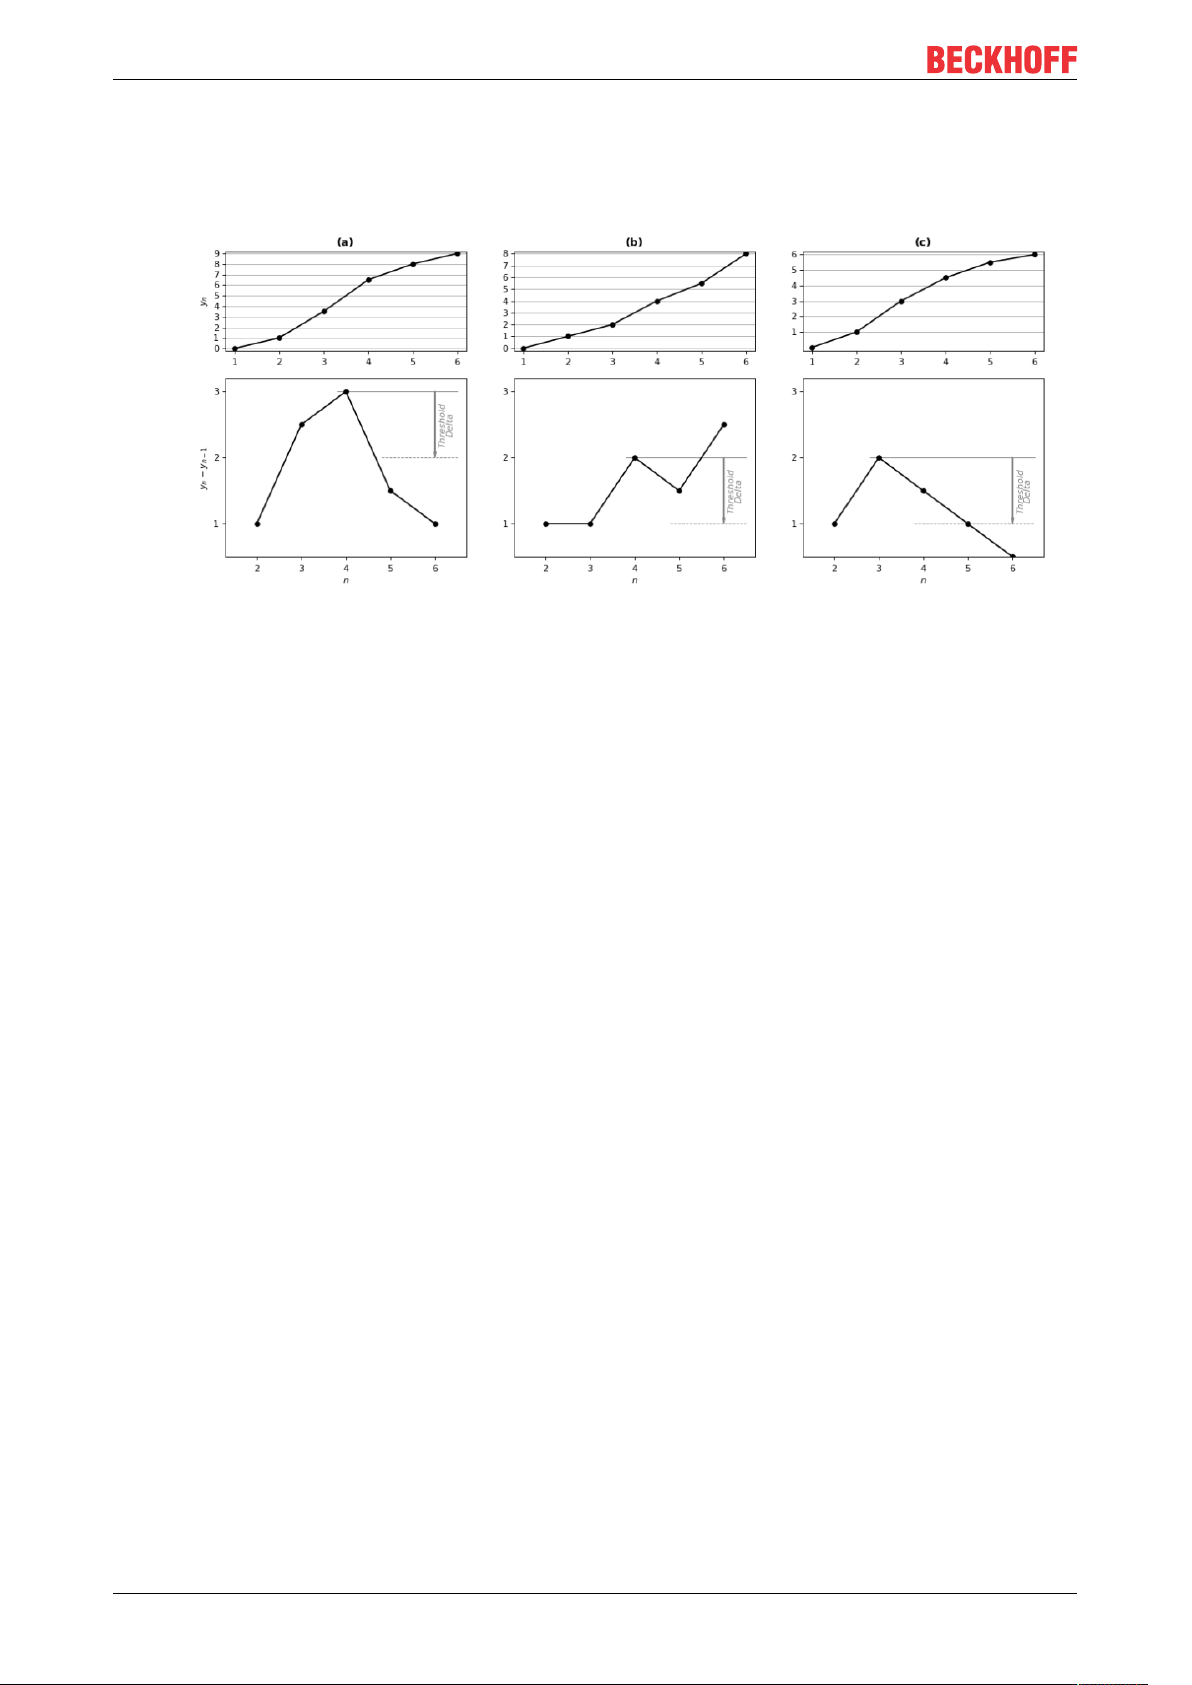
Configuration
the processing of the value y6.
Note: Regardless of the threshold delta at least one maximum of the delta is detected between two
reversals.
•
Output Values
• Last Peak: Indicates the y-value of the last identified peak.
• Time Last Peak: Indicates the timestamp of the last identified peak.
• Count Peaks: Indicates the total number of counted peaks.
• Last Valley: Indicates the y-value of the last identified valley.
• Time Last Valley: Indicates the timestamp of the last identified valley.
• Count Valleys: Indicates the total number of counted valleys.
• Value at Max Delta: Indicates the y-value of the analyzed stream (input variable) that is led by the last
detected maximum of delta. The value delta is the difference between Value at Max Delta and the
value that reached one cycle before.
• Max Delta: Indicates the last identified local maximum of the absolute difference between two
successive values in the input stream.
• Time Max Delta: This is the timestamp of Value at Max Delta.
• Count Max Delta: Indicates the total number of counted local maxima of delta.
Standard HMI Controls
The following HMI controls are available for the Curve Sketcher 1Ch algorithm to generate an Analytics
Dashboard:
1.The CurveSketcher control visualizes the Last Peak, Time Last Peak, Count Peaks, Last Valley, Time Last
Valley, Count Valley, Last Delta, Time Last Delta, Count Delta output values and the data input value.
TE352076 Version: 1.0
Page 77

Configuration
2.The Table control visualizes all output values: Last Peak, Time Last Peak, Count Peaks, Last Valley, Time
Last Valley, Count Valley, Value at Max Delta, Last Delta, Time Last Delta, Count Delta
TE3520 77Version: 1.0
Page 78

Configuration
Alternatively, custom HMI controls can be mapped to the Curve Sketcher 1Ch algorithm using the Mapping
Wizard.
6.2.2.9 Section Timer 1 Ch
The Section Timer 1Ch calculates the timespan the input is in range of each configured section. It can be
configured with the amount of sections and the borders of each section. Each section is defined with lower
border (greater than or equal to) and upper border (less than). The following sections lower border is set by
the previous upper border. Values that are less than the minimal border are stored in the first array element.
Values that are greater than or equal to the maximal border are stored in the last array element.
Optional a boolean signal for Enable Execution can be selected, so that the algorithm is just active, if the
value of the selected signal is TRUE.
TE352078 Version: 1.0
Page 79

Configuration
Configuration Options
• Num Sections: This is the amount of sections.
• First Lower Border: This is the lower border of the first section.
• Upper Border 00, Upper Border 01, …, Upper Border n0: These are the upper borders of all
sections.
Output Values
• Section: Indicates the section of the last input value. If the input value is less than the First Lower
Border, the return value is zero. If the input value is in the interval [First Lower Border, Upper Border
00), the return value is one, for the Interval [Upper Border 00, UpperBorder 01) it is two and so on. If
the input value is greater than the last specified border Upper Border 0n, the return value is
NumSections+1.
• Array of Timespans: The accumulated time the input value was sorted into each section in
nanoseconds.
Standard HMI Controls
The following HMI controls are available for the Section Timer 1Ch algorithm to generate an Analytics
Dashboard:
1. The SectionTimer control visualizes the Array of Timespans input value and the First Lower Border and
Upper Border configuration options.
2. The PieChart control visualizes the Array of Timespans input value and the First Lower Border and Upper
Border configuration options.
TE3520 79Version: 1.0
Page 80

Configuration
3. The Table control visualizes all output values: Section, Array of Timespans.
Alternatively, custom HMI controls can be mapped to the Section Timer 1Ch algorithm using the Mapping
Wizard.
6.2.2.10 DenStream
TE352080 Version: 1.0
Page 81

Configuration
DenStream is an implementation of the unsupervised, density-based clustering algorithm of the same name
[1]. It is suitable for evolving data streams and based on the well-known clustering algorithm DBSCAN [2, 3].
The number of input channels (in the following denoted as n) for this algorithm can be chosen by the user.
These inputs form the n-dimensional feature space in which clusters are to be found. In each analysis-cycle
the stream provides a new feature vector to the algorithm, which can be interpreted as a data point in this
feature space. Clusters are separable areas with a high density of data points in the feature space.
In the first phase of the algorithm the incoming data points are assigned to so-called micro clusters (MCs).
These micro clusters have properties (like centre, weight and variance) that depend on the included data
points. Only micro clusters with a weight exceeding a set threshold are passed to the second phase and are
clustered by the DBSCAN algorithm. Thus, it is not required to keep the information about each single data
point. This reduces the memory requirements since over time there are much less micro clusters than data
point. Furthermore the execution time of the DBSCAN algorithm is much faster when run over the reduced
set of micro clusters compared to all data points. Additionally, it is possible to use a fading function on the
weights of the micro clusters. This way old data points lose their importance for the clustering process over
time. As a consequence, changes (like the shift of clusters or their (dis)appearance over time) can be
captured by the algorithm.
There are more advantages of the DenStream algorithm over other clustering algorithms. The user is not
required to know the number of micro clusters beforehand because DenStream determines this number
automatically. The algorithm is further able to detect outliers in the data that do not belong to any cluster.
Because it is a density-based algorithm, it is even possible to detect separate clusters of arbitrary shape
(even when they are intertwined).
Parameter setting
Here we will give a brief introduction to the functioning of the algorithm, mainly to allow the reader a jump
start into parameter setting. For an in-depth understanding of the algorithm and its parameters the reader is
referred to the aforementioned publications. Most of the terms and parameter names here are adopted
directly from those publications.
The parameters of the DenStream algorithm mainly influences the following properties of the algorithm:
• The coarseness of micro clusters,
• The maximal distance between data points/micro clusters to be assigned to the same cluster,
• The minimal density of data points to be detected as cluster and not as outliers,
• The forgetting rate with which older data points lose importance.
The parameters Epsilon, Lambda and Mu x Beta belong to the first phase of the algorithm, the formation of
micro clusters.
To find the right micro cluster to merge a data point into, the Euclidian distances between the data point and
the centres of all micro clusters is compared. The data point can be merged into a micro cluster only if the
radius of the micro cluster after merging (which corresponds to the variance of all data points forming this
micro cluster) does not exceed the threshold Epsilon. If the data point cannot be merged into its nearest
micro cluster a new micro cluster is created by this data point. The weight of the respective micro cluster is
increased by one with the merge or creation.
If a fading function is applied, the weight of the micro clusters decreases over time. This forgetting rate is set
by the parameter Lambda. If the value is set to zero, no fading function is applied, otherwise the weights
decrease by factor of 2^(-Lambda) with each second. In the original paper [1] micro clusters are separated in
potential and outlier micro cluster, depending on their weight. Only potential micro clusters are subsequently
clustered by the DBSCAN algorithm. Data points in the outlier micro clusters are labelled as outliers. But also
outlier micro clusters are stored and updated by new data points, since they can still grow into potential
micro clusters. The weight of a micro cluster has to exceed the threshold Beta x Mu to be labelled as
potential micro cluster. If the weight of an outlier micro cluster drops under an internal threshold (dependent
on Mu x Beta and Lambda) they are deleted from memory.
The parameters Epsilon (DBSCAN) and Min Weight (DBSCAN) regard the second phase. These are the
parameters adopted from the DBSCAN algorithm [3].
The DBSCAN algorithm runs over the set of potential micro clusters and assigns cluster labels to them. This
can be either the index of the cluster they belong to or the label outlier. The currently processed data point is
then assigned the label of the micro cluster it belongs to.
TE3520 81Version: 1.0
Page 82

Configuration
How does DBSCAN cluster the micro cluster? The algorithm uses the concept of density reachability.
Objects (in this case micro clusters) belong to the same cluster if they are density connected. This means
that there has to be a chain of micro clusters with a maximum distance of Epsilon (DBSCAN). The micro
clusters that form this chain need to fulfil a second condition. This is, the sum of weights of all micro clusters
within a distance of Epsilon (DBSCAN) of each connecting micro cluster in this chain has to exceed the
threshold of Min Weight (DBSCAN). Micro cluster that are not density connected to at least one micro cluster
that fulfils this second condition are labelled as outlier.
The parameters outMCs Buffer Size and potMCs Buffer Size are specific to this implementation of the
algorithm and are required because the memory for outlier and potential micro clusters has to be allocated
before execution. Thus, outMCs Buffer Size and potMCs Buffer Size limit the possible number of outlier and
potential micro cluster during runtime. The user is required to find values for these parameters such that this
limit is not exceeded.
The maximum number of outlier and potential micro cluster during the execution of the algorithm depends on
the distribution of the input data but also on the setting of the other parameters. There are less micro clusters
for higher values of Epsilon since this leads to coarser micro clusters that can include data points from a
bigger area. In general the number of outlier micro cluster increases in the beginning of the analysis, but
decreases again, when outlier micro clusters pass to potential micro clusters. If the data steam is not
evolving over time, the amount of micro cluster levels off after an initial phase.
The more micro clusters there are, the higher are the computational requirements. Outlier and potential
micro clusters have to be scanned for the closest micro cluster to a data point and subsequently all potential
micro clusters have to be passed for the DBSCAN algorithm. Thus, it is a trade of between computational
speed and the coarseness of the micro cluster.
What happens if the values of outMCs Buffer Size and potMCs Buffer Size are set too low and at some point
during the analysis there are actually more micro cluster required to capture the input data points? The
algorithm then continues to assign the data points to the existing micro clusters and labels the data points
accordingly, but the existing micro clusters are not updated anymore in order to prevent an overflow of the
buffer. This means, that the clustering of the data points continues, but with a stagnated summary of the
feature space (older set of micro clusters). Changes in the pattern of the data stream could not be detected
anymore.
[1] F. Cao, M. Ester, W. Qian, A. Zhou. Density-Based Clustering over an Evolving Data Stream with Noise.
In Proceedings of the 2006 SIAM International Conference on Data Mining, pp 326-337. SIAM.
[2] M. Ester, H.-P. Kriegel, J. Sander, and X. Xu. A density-based algorithm for discovering clusters in large
spatial databases with noise. In Proc. of KDD, 1996.
[3] J. Sander, M. Ester, H.-P. Kriegel, X. Xu. Density-Based Clustering in Spatial Databases: The Algorithm
GDBSCAN and ist Applications. Data Mining and Knowlage Discovery 2, 169-194 (1998)
Optional a boolean signal for Enable Execution can be selected, so that the algorithm is just active, if the
value of the selected signal is TRUE.
Input Values
• Update Micro Cluster: If TRUE, micro clusters are updated by the incoming data. If FALSE, the
existing micro clusters are unchanged and are only used to determine the cluster index of the incoming
data points.
• Input 01, …, Input 0n: These inputs build the feature space for which the clustering is executed.
Configuration Options
• Add or Remove Channel: The number of input channels can be changed here.
• Epsilon: Threshold for the maximum radius of micro clusters.
• Mu x Beta: Threshold for the weight of a micro cluster between outlier and potential micro cluster.
• Lambda: Indicates the forgetting rate of the algorithm. The weight of each data point decreases each
second by a factor of 2^(-Lambda).
• Epsilon (DBSCAN): Indicates the parameter epsilon of the DBSCAN algorithm.
• Min Weight (DBSCAN): Threshold for the sum of weights in the epsilon neighbourhood of a micro
cluster for the DBSCAN algorithm.
TE352082 Version: 1.0
Page 83

Configuration
• potMCs Buffer Size: The maximum number of potential micro cluster. Memory is allocated for potMCs
Buffer Size micro clusters.
• outMCs Buffer Size: The maximum number of outlier micro cluster. Memory is allocated for outMCs
Buffer Size micro clusters.
Output Values
• New Result: Is TRUE if the new cluster index is different to the cluster index of the last cycle.
• MC Buffer Overflow: Is TRUE if the updating of micro clusters is stopped in order to prevent an
overflow of potMCs or outMCs Buffer Size.
• Last Event: This is the timestamp of the last cycle with a change of the cluster index
• Last Switch: This is the timestamp of the last cycle with a switch between updating and not updating
micro clusters (either by setting the input Update Micro Cluster to TRUE or by internally preventing an
overflow the potMCs/outMCs Buffer Size).
• Number of potMCs: Indicates the number of currently existing potential micro cluster.
• Number of outMCs: Indicates the number of currently existing outlier micro cluster.
• Cluster Index: Indicates the cluster index the DBSCAN algorithm outputs for the data point of the
current cycle.
• Number of Clusters: Indicates the total number of detected clusters by the DBSCAN algorithm.
6.2.3 Analytics - Compare
The algorithms of the category Analytics-Compare provide functionalities for comparative analysis and logic
operations.
6.2.3.1 Numerical Compare 1Ch
The Numerical Compare 1Ch compares the input values with a reference value and provides the result of
this comparison operation. The operator, the reference value and the count mode can be configured
individually.
Optional a boolean signal for Enable Execution can be selected, so that the algorithm is just active, if the
value of the selected signal is TRUE.
Configuration Options
• Operator: Indicates whether the input value should be greater, greater or equal, equal, less or equal,
less or not equal than the Reference value.
• Reference: Reference value for the comparison operation.
• Count Mode: Mode of the result counter. "OnChange": The counter counts every time every time the
result changes. "Cyclic": The counter is increased every cycle, if the condition is TRUE.
• Use Absolute Values: The absolute value of the input signal is used, if the checkbox is ticked off.
Output Values
• Operation Out: Result of the comparison operation.
• Count: Is Increased every time the operation out is TRUE.
• Last Event: Indicates the point of time of the last raised event → the event can be pulled into the
scope chart by Drag & Drop to show it as a trigger-event
TE3520 83Version: 1.0
Page 84

Configuration
Standard HMI Controls
The following HMI controls are available for the Numerical Compare 1Ch algorithm to generate an Analytics
Dashboard:
1.The Comparison control visualizes the Operation Out and Count output values and Operator configuration
options.
2.The SingleValue control visualizes the Count and Last Event output values.
3.The BinaryState control visualizes the Operation Out output value.
4.The Table control visualizes all output values: Operation Out, Count, Last Event.
TE352084 Version: 1.0
Page 85

Configuration
Alternatively, custom HMI controls can be mapped to the Numerical Compare 1Ch algorithm using the
Mapping Wizard.
6.2.3.2 Numerical Compare 2Ch
The Numerical Compare 2Ch compares the input values of the first channel with the input values of the
second channel and provides the result of this comparison operation. The operator and the count mode can
be configured individually.
Optional a boolean signal for Enable Execution can be selected, so that the algorithm is just active, if the
value of the selected signal is TRUE.
Configuration Options
• Operator: Indicates whether the input value should be greater, greater or equal, equal, less or equal,
less or not equal than the Reference value.
• Count Mode: Mode of the result counter. "OnChange": The counter counts every time the result
changes. "Cyclic": The counter is increased every cycle, if the condition is TRUE.
• Use absolute values: The absolute values of the input signals are used, if the checkbox is ticked off.
Output Values
• Operation Out: Result of the comparison operation.
• Count: Is Increased every time the operation out is TRUE.
• Last Event: Indicates the point of time of the last raised event → the event can be pulled into the
scope chart by Drag & Drop to show it as a trigger-event
Standard HMI Controls
The following HMI controls are available for the Numerical Compare 1Ch algorithm to generate an Analytics
Dashboard:
1.The Comparison control visualizes the Operation Out and Count output values and Operator configuration
options.
TE3520 85Version: 1.0
Page 86

Configuration
2.The SingleValue control visualizes the Count and Last Event output values.
3.The BinaryState control visualizes the Operation Out output value.
4.The Table control visualizes all output values: Operation Out, Count, Last Event.
Alternatively, custom HMI controls can be mapped to the Numerical Compare 1Ch algorithm using the
Mapping Wizard.
TE352086 Version: 1.0
Page 87

Configuration
6.2.3.3 Logic Operation Counter
The Logic Operation Counter executes a logical operation on the values of two or more channels and
provides the result of this logical operation. Therefore, each input value can be combined with a threshold
and an operator. Furthermore, the logic operator and the count mode can be configured individually.
Optional a boolean signal for Enable Execution can be selected, so that the algorithm is just active, if the
value of the selected signal is TRUE.
Configuration Options
• Add or Remove Channel: Adds or Removes an input channel.
• Threshold 00: Threshold for the signal of the first channel.
• Threshold 01 ..n: Threshold for the signal of the second to n- th channel.
• Logic Operator: Logic operator for the operation:
Logical OR
Logical XOR (EXCLUSIVE OR)
Logical AND
Logical NAND (NOT AND)
Logical NOR (NOT OR)
• Count Mode: Mode of the result counter. "OnChange": The counter counts every time every time the
result changes. "Cyclic": The counter is increased every cycle, if the condition is TRUE.
• Use Absolute Values: The absolute values of the input signals are used, if the checkbox is ticked off.
Output Values
• Operation Out: Result of the logical operation.
• Count: Is Increased every time the operation out is TRUE.
• Last Event: Indicates the point of time of the last raised event → the event can be pulled into the
scope chart by Drag & Drop to show it as a trigger-event
Standard HMI Controls
The following HMI controls are available for the Logic Operation Counter 2Ch algorithm to generate an
Analytics Dashboard:
1.The Comparison control visualizes the Operation Out and Count output values and Logic Operator
configuration options.
TE3520 87Version: 1.0
Page 88

Configuration
2.The SingleValue control visualizes the Count and Last Event output values.
3.The BinaryState control visualizes the Operation Out output value.
4.The Table control visualizes all output values: Operation Out, Count, Last Event.
Alternatively, custom HMI controls can be mapped to the Numerical Compare 1Ch algorithm using the
Mapping Wizard.
TE352088 Version: 1.0
Page 89
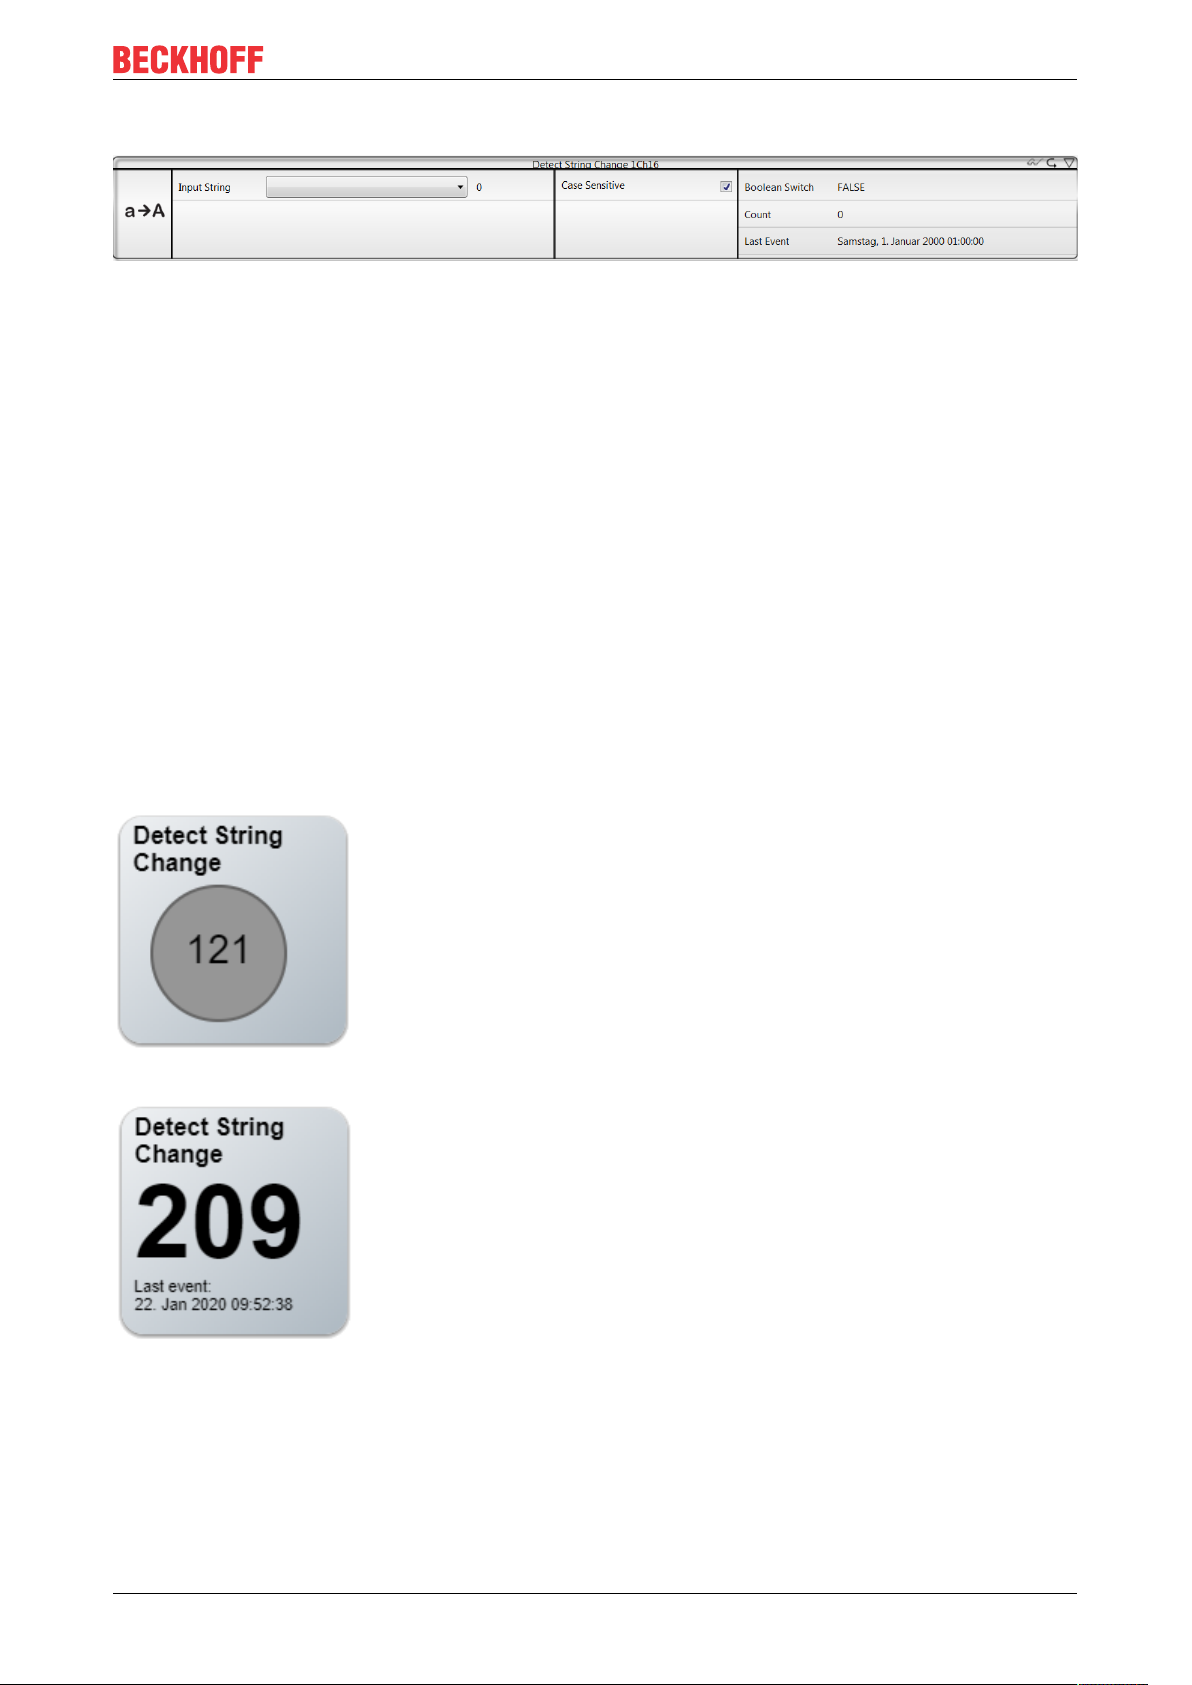
Configuration
6.2.3.4 Detect String Change 1Ch
The Detect String Change 1Ch detects and counts changes of string values. Therefore, case sensitivity can
be taken into account or not.
Optional a boolean signal for Enable Execution can be selected, so that the algorithm is just active, if the
value of the selected signal is TRUE.
Configuration Options
• Case Sensitivity: If the checkbox is ticked off, case sensitivity is taken into account, otherwise not.
Output Values
• Boolean Switch: TRUE, if a string change was detected, otherwise FALSE.
• Count: Is Increased every time the Boolean switch is TRUE.
• Last Event: Indicates the point of time of the last raised event → the event can be pulled into the
scope chart by Drag & Drop to show it as a trigger-event
Standard HMI Controls
The following HMI controls are available for the Detect String Change 1Ch algorithm to generate an
Analytics Dashboard:
1.The Comparison control visualizes the Boolean Switch and Count output values.
2.The SingleValue control visualizes the Count and Last Event output values.
3.The BinaryState control visualizes the Boolean Switch output value.
TE3520 89Version: 1.0
Page 90

Configuration
4.The Table control visualizes all output values: Operation Out, Count, Last Event.
Alternatively, custom HMI controls can be mapped to the Detect String Change 1Ch algorithm using the
Mapping Wizard.
6.2.3.5 String Compare 1Ch
The String Compare 1Ch compares the input string with a reference string and counts the string matches.
Therefore, case sensitivity can be taken into account or not and the count mode can be changed.
Optional a boolean signal for Enable Execution can be selected, so that the algorithm is just active, if the
value of the selected signal is TRUE.
Configuration Options
• Reference String: Reference string for the comparison operation.
• String Compare Mode: Enumeration for different string comparison modes.
• Equals: Input string equals reference string.
• BeginsWith: Input string begins with reference string.
• Contains: Input string contains reference string.
• Case Sensitivity: If the checkbox is ticked off, case sensitivity is taken into account, otherwise not.
TE352090 Version: 1.0
Page 91

Configuration
• Count Mode: Mode of the result counter. "OnChange": The counter is increased every time the input
string matches the reference string. "Cyclic": The counter is increased every cycle, if the comparison
operation is TRUE.
Output Values
• String Match: TRUE, if the input string matches the reference string, otherwise FALSE.
• Count: Is increased every time the string match is TRUE.
• Last Event: Indicates the point of time of the last raised event → the event can be pulled into the
scope chart by Drag & Drop to show it as a trigger-event
Standard HMI Controls
The following HMI controls are available for the String Compare 1Ch algorithm to generate an Analytics
Dashboard:
1.The Comparison control visualizes the String Match and Count output values and String Compare Mode
configuration options.
2.The SingleValue control visualizes the Count and Last Event output values.
3.The BinaryState control visualizes the String Match output value.
4.The Table control visualizes all output values: String Match, Count, Last Event.
TE3520 91Version: 1.0
Page 92

Configuration
Alternatively, custom HMI controls can be mapped to the String Compare 1Ch algorithm using the Mapping
Wizard.
6.2.3.6 String Compare 2Ch
The String Compare 2Ch compares the values of the first input string with the values of the second string
and counts the string matches. Therefore case sensitivity can be taken into account or not and the count
mode can be changed.
Optional a boolean signal for Enable Execution can be selected, so that the algorithm is just active, if the
value of the selected signal is TRUE.
Configuration Options
• String Compare Mode: Enumeration for different string comparison modes.
• Equals: Input string equals reference string.
• BeginsWith: Input string begins with reference string.
• Contains: Input string contains reference string.
• Case Sensitivity: If the checkbox is ticked off, case sensitivity is taken into account, otherwise not.
• Count Mode: Mode of the result counter. "OnChange": The counter is increased every time the input
string matches the reference string. "Cyclic": The counter is increased every cycle, if the comparison
operation is TRUE.
Output Values
• String Match: TRUE, if the value of the first input string matches the value of the second input string,
otherwise FALSE.
• Count: Is increased every time the string match is TRUE.
• Last Event: Indicates the point of time of the last raised event → the event can be pulled into the
scope chart by Drag & Drop to show it as a trigger-event
TE352092 Version: 1.0
Page 93

Configuration
Standard HMI Controls
The following HMI controls are available for the String Compare 2Ch algorithm to generate an Analytics
Dashboard:
1.The Comparison control visualizes the String Match and Count output values and String Compare Mode
configuration options.
2.The SingleValue control visualizes the Count and Last Event output values.
3.The BinaryState control visualizes the String Match output value.
4.The Table control visualizes all output values: String Match, Count, Last Event.
TE3520 93Version: 1.0
Page 94

Configuration
Alternatively, custom HMI controls can be mapped to the String Compare 2Ch algorithm using the Mapping
Wizard.
6.2.3.7 Multiplexer
The Multiplexer selects one channel out of one or more input channels. For each input channel a boolean
input has to be provided additionally. The output corresponds to the first input channel, where the conditional
input is TRUE. The priority of the configured channels is the order of configuration. If the condition is not met
for any of the channels, the provided default channel is returned.
Optional a boolean signal for Enable Execution can be selected, so that the algorithm is just active, if the
value of the selected signal is TRUE.
Configuration Options
• NumChannels: The number of channels. For each channel there are two input variables, one is a
Condition of type Boolean (Condition0n) and an input value of any datatype (Input0n), that can be
passed to the Result if the condition is met.
Output Values
• Result: Provides the signal Input0n of the selected input channel.
• Current Channel: Indicates the number of the selected channel. The value is zero, if the default result
is selected. The input channels are numbered in the order of their configuration.
• Count: Starts with one for the channel that is selected at the start of the analysis and is increased each
time a different channel is selected.
• Last Event: Timestamp of last switch of channels.
TE352094 Version: 1.0
Page 95

Configuration
6.2.4 Analytics - Math
The algorithms of the category Analytics-Math provide functionalities for mathematical operations such as
basic arithmetic operation, integration or slope analysis.
6.2.4.1 Integrator 1Ch
The Integrator 1Ch integrates the input value over time with a base unit of one second and provides the
result of this integration operation. For the approximation of this integral the trapezoidal rule is used. The
trapezoidal between two subsequent timestamps and with the values and
is calculates as
.
If the integration mode "absolute" ("|x|") is chosen in the configuration, and are substituted by
their absolute values in the above equation.
In each cycle the trapezoidal between the current and the last timestamp is calculated and added to the sum
of trapezoids starting from the beginning of the analysis. Additionally, this sum can be scaled by a factor that
can be configured individually.
Optional a boolean signal for Enable Execution can be selected, so that the algorithm is just active, if the
value of the selected signal is TRUE.
Configuration Options
• Integration Mode: You can select an integration mode. "→": the input value is will be integrated
directly. "|x|": The absolute values of the input signal will be integrated.
• Factor: With this factor the integral is multiplied.
Output Values
• Result: Shows the result of the integration operation.
Standard HMI controls
The following HMI controls are available for the Integrator 1Ch algorithm to generate an Analytics
Dashboard:
1.The Integrator control visualizes the last x Result output values.
TE3520 95Version: 1.0
Page 96
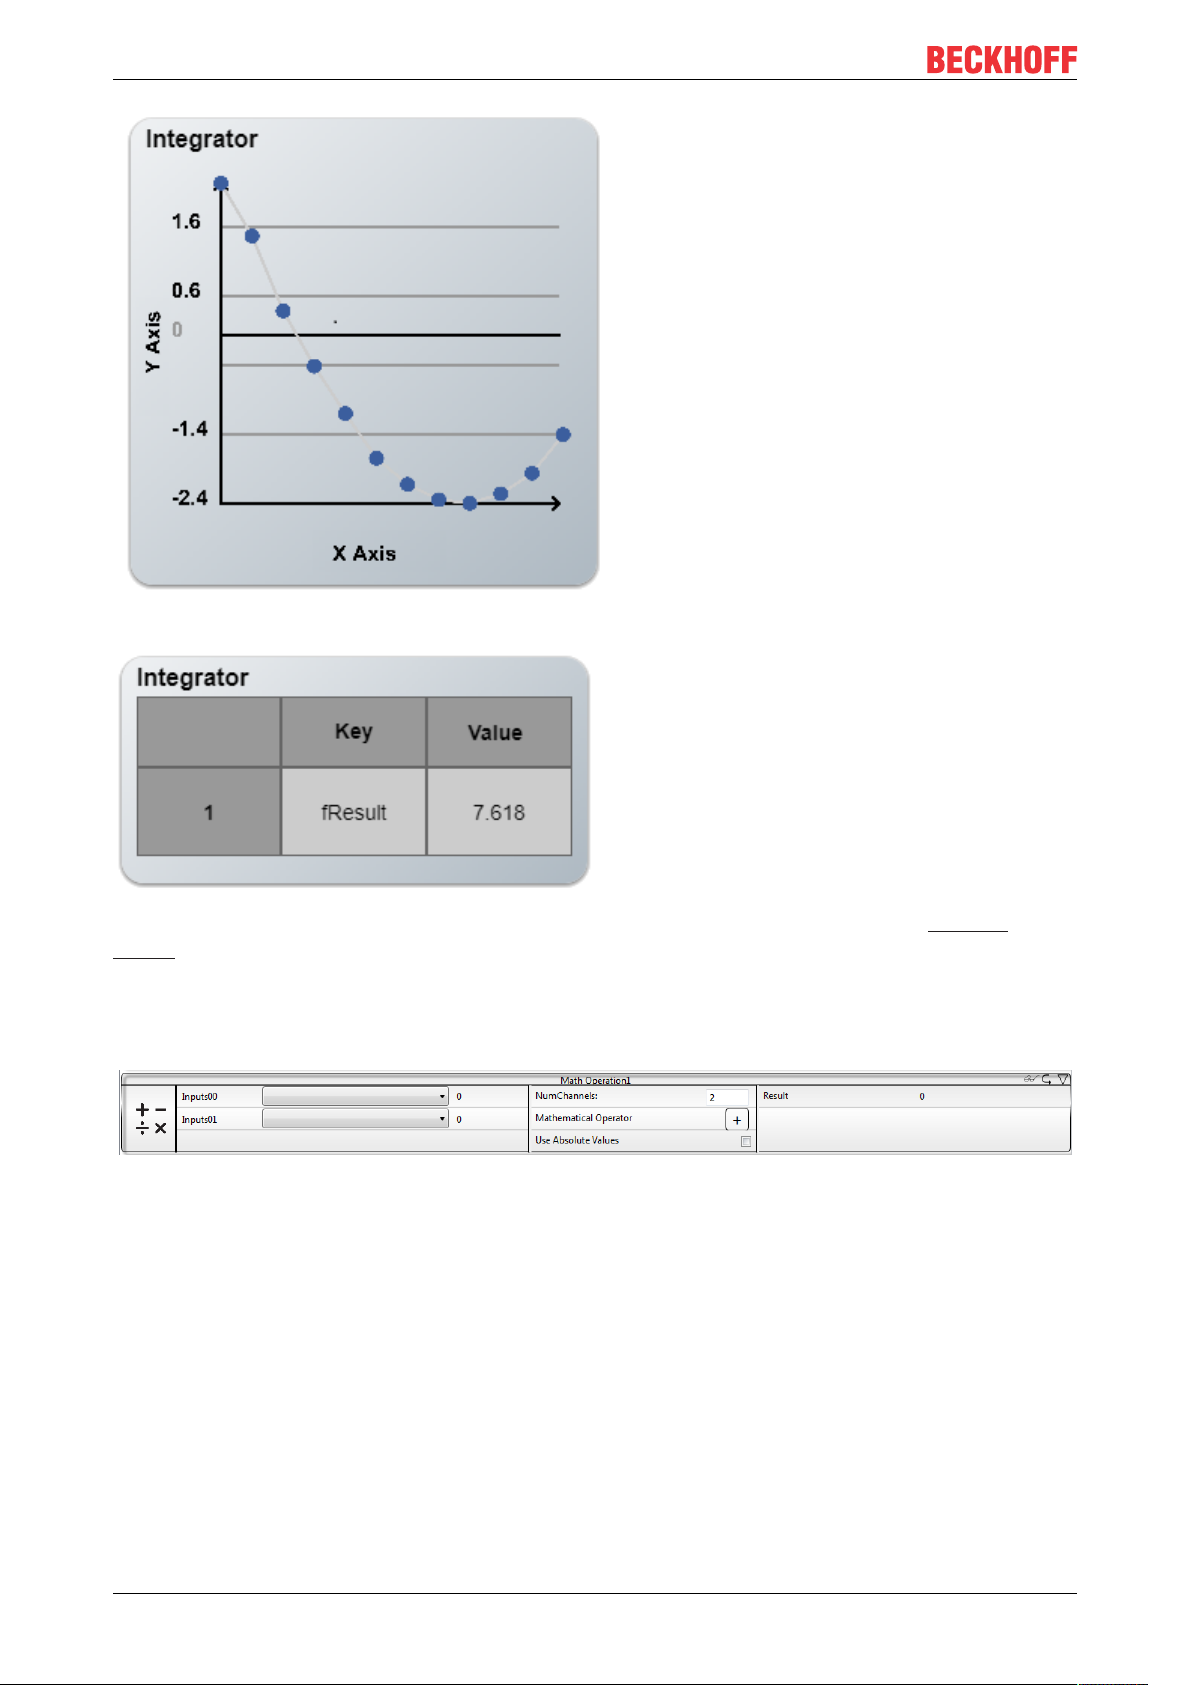
Configuration
2. The Table control visualizes all output values: Result.
Alternatively, custom HMI controls can be mapped to the Integrator 1Ch algorithm using the Mapping
Wizard.
6.2.4.2 Math Operation
The Math Operation executes a mathematical operation on two or more different input channels and
provides the result of the mathematical operation. The operator is the same for all operands and can be
configured individually.
Optional a boolean signal for Enable Execution can be selected, so that the algorithm is just active, if the
value of the selected signal is TRUE.
Configuration Options
• NumChannels: The number of operands, which are the inputs to the function.
• Mathematical Operator: Mathematical operator of the operation ("+", "-", "x", "/").
• Use Absolute Values: The absolute values of the input signals are used, if the checkbox is ticked off.
Output Values
• Result: Result of the mathematical operation.
TE352096 Version: 1.0
Page 97

Configuration
Standard HMI Controls
The following HMI controls are available for the Math Operation algorithm to generate an Analytics
Dashboard:
1. The SingleValue control visualizes the Result output value.
2. The Table control visualizes all output values: Result.
Alternatively, custom HMI controls can be mapped to the Math Operation algorithm using the Mapping
Wizard.
6.2.4.3 Slope Analysis 1Ch
The Slope Analysis 1Ch calculates the slope between two values of the input stream. One of those two
values is the current input value and the second value is the input value that occurred a defined number
(configured by the parameter Num Values) of cycles before in the input stream. The difference between
these two values is returned as Delta Value.
The corresponding distance on the time-coordinate is calculated as the difference of the timestamps of these
two values and is provided as the output value Delta Time. Note that the value Delta Time is displayed in
nanoseconds, but for the calculation of the slope it is scaled to a second as base unit.
The Slope is then calculated as the fraction of Delta Value and Delta Time (scaled to seconds) and
estimates the gradient for the timestamp in the center of the two timestamps used in the calculation of Delta
Time. This is the value returned as Time Slope if it corresponds to a timestamp of the input stream. For
configurations, where Num Values is an uneven number there is no input value matching the exact centre
timestamp. In this case the timestamp of the value that directly succeeded the calculated centre timestamp is
returned as Time Slope.
Further, the algorithm provides the minimal slope, the maximal slope and the time values of minimum and
maximum.
Optional a boolean signal for Enable Execution can be selected, so that the algorithm is just active, if the
value of the selected signal is TRUE.
Configuration Options
Num Values: Number of cycles that are in between the values used for the calculation of the slope.
TE3520 97Version: 1.0
Page 98

Configuration
Output Values
• Slope: Shows the current slope value.
• Slope Min: Shows the minimum of the slope values.
• Slope Max: Shows the maximum of the slope values.
• Delta Value: Shows the difference between the two values, which are used to calculate the newest
slope.
• Delta Time: Shows the time period that was used to calculate the newest slope.
• Time Slope: Shows the time value of the newest slope value.
• Time Slope Min: Shows the time value of the slope minimum → this event can be pulled into the
scope chart by Drag & Drop to show it as a trigger-event.
• Time Slope Max: Shows the time value of the slope maximum → this event can be pulled into the
scope chart by Drag & Drop to show it as a trigger-event.
Standard HMI Controls
The following HMI controls are available for the Edge Counter 1Ch algorithm to generate an Analytics
Dashboard:
1.The SlopeAnalysis control visualizes the Slope, Slope Min, Slope Max, Time Slope Min and Time Slope
Max output values.
2.The Table control visualizes all output values: Slope, Slope Min, Slope Max, Delta Value, Delta Time, Time
Slope, Time Slope Min, Time Slope Max.
TE352098 Version: 1.0
Page 99

Configuration
Alternatively, custom HMI controls can be mapped to the Edge Counter 1Ch algorithm using the Mapping
Wizard.
6.2.4.4 Math Operation 1Ch
The Math Operation 1Ch executes a mathematical operation on the signal of the input channel and a
reference value. The algorithm provides the result of the mathematical operation and the operator can be
configured individually.
Optional a boolean signal for Enable Execution can be selected, so that the algorithm is just active, if the
value of the selected signal is TRUE.
Configuration Options
• Mathematical Operator: Mathematical operator of the operation ("+", "-", "x", "/").
• Mathematical Operand: Mathematical operand for the operation.
• Use Absolute Values: The absolute value of the input signal is used, if the checkbox is ticked off.
Output Values
• Result: Result of the mathematical operation.
TE3520 99Version: 1.0
Page 100
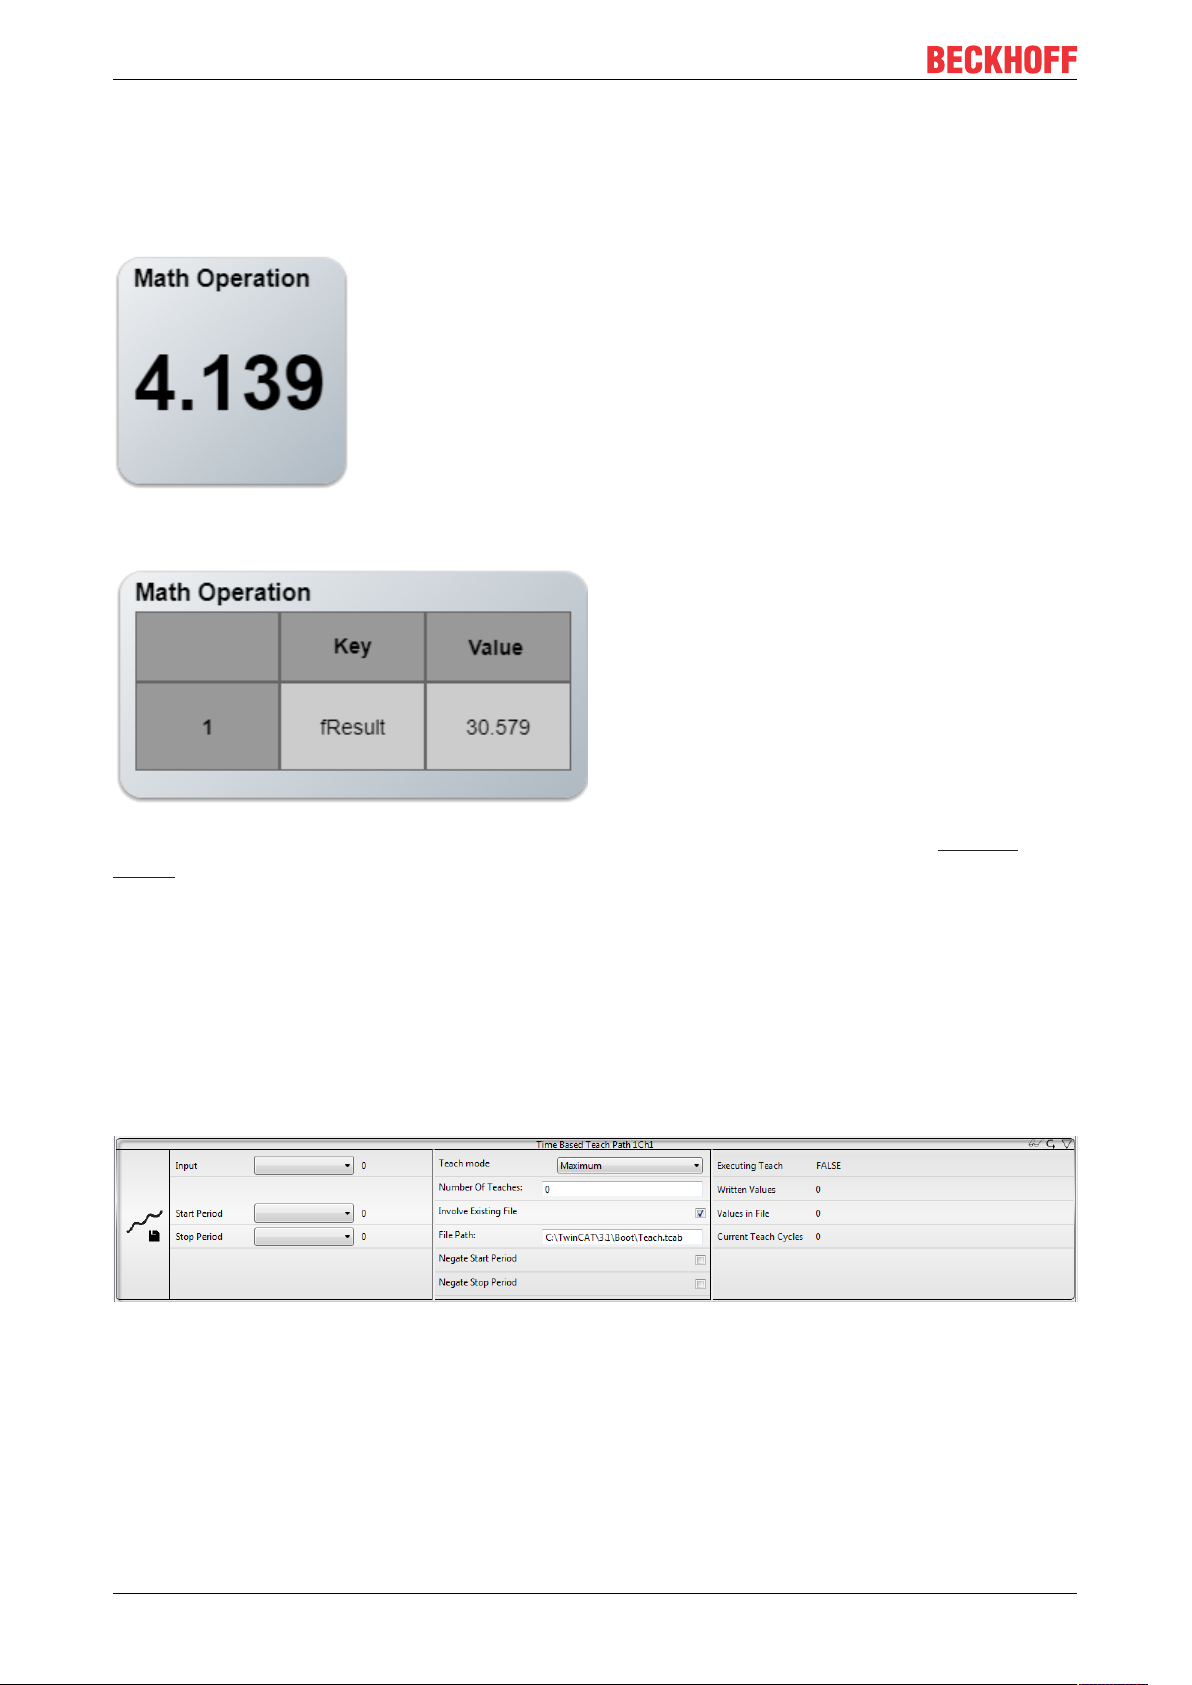
Configuration
Standard HMI Controls
The following HMI controls are available for the Math Operation algorithm to generate an Analytics
Dashboard:
1.The SingleValue control visualizes the Result output value.
2.The Table control visualizes all output values: Result.
Alternatively, custom HMI controls can be mapped to the Math Operation algorithm using the Mapping
Wizard.
6.2.5 Analytics - Training Base
The algorithms of the category Analytics – Training Base provide functionalities for teaching periodic signals
and write this data to a file. So that it is possible to compare it later on to another input signal, to analyze
differences from the optimal behavior.
6.2.5.1 Time Based Teach Path 1Ch
The Time Based Teach Path 1Ch writes the input data periodical, according to the configured number of
teaches, into a file. Thereby the values are not written in a row for each period but the values of a new period
are compared to the existing values. The period can be defined through the input values Start Period and
Stop Period (Boolean signals are required). According to the teach mode each value will be overwritten or
retained, so that the result is one teaches input signal, which can later be used for example as a reference
signal.
Optional a boolean signal for Enable Execution can be selected, so that the algorithm is just active, if the
value of the selected signal is TRUE.
TE3520100 Version: 1.0
 Loading...