

Page 1
A-GAGE® EZ-ARRAY™ Instruction Manual
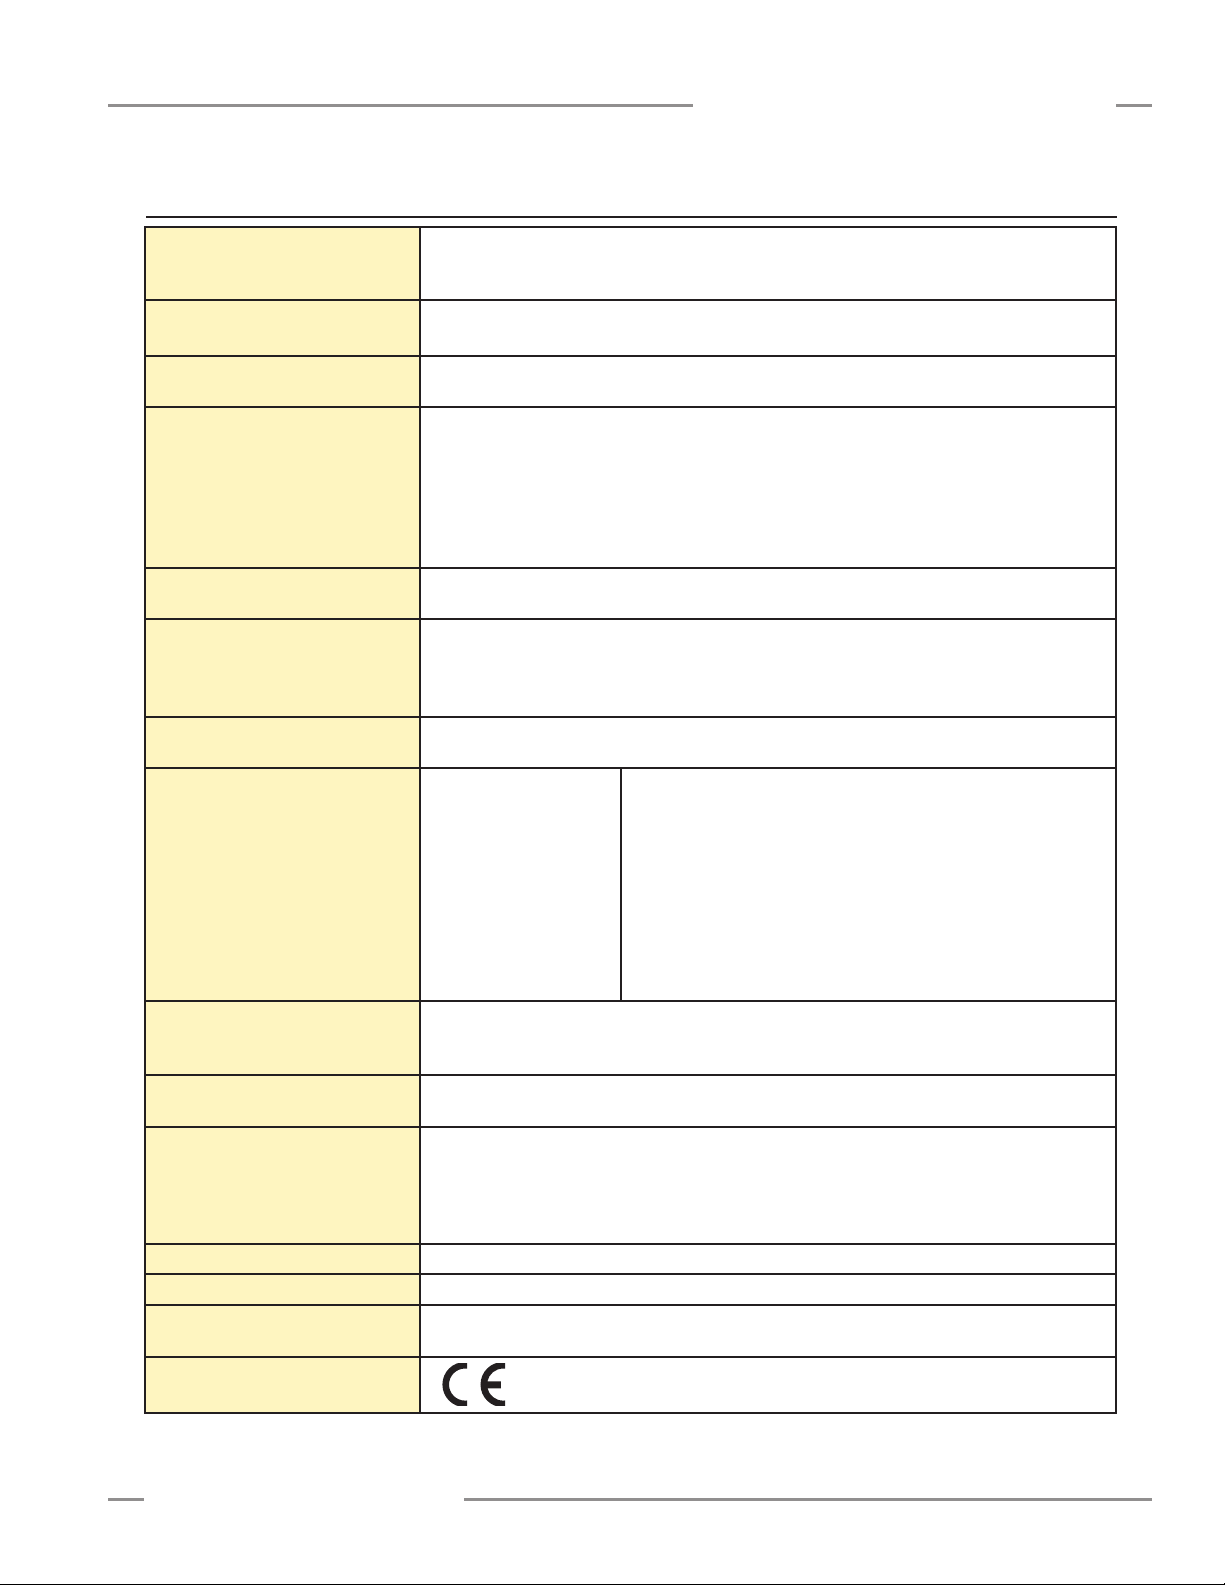
Two-piece sensing array with 2 analog and 2 discrete outputs, plus serial output
Features
A cost-effective, two-piece measuring light curtain designed for •
quick and simple installations with the sophistication to handle
the toughest sensing applications
Excels at high-speed, precise process monitoring and inspection, •
profiling, and web-guiding applications
A comprehensive combination of scanning options: •
– 14 measurement (“scan analysis”) modes
– 3 scanning methods
– Selectable beam blanking
– Selectable continuous or gated scan initiation
– Selectable threshold setting for semi-transparent applications
– 2 analog outputs, 2 discrete outputs, plus Modbus 485-RTU
serial output
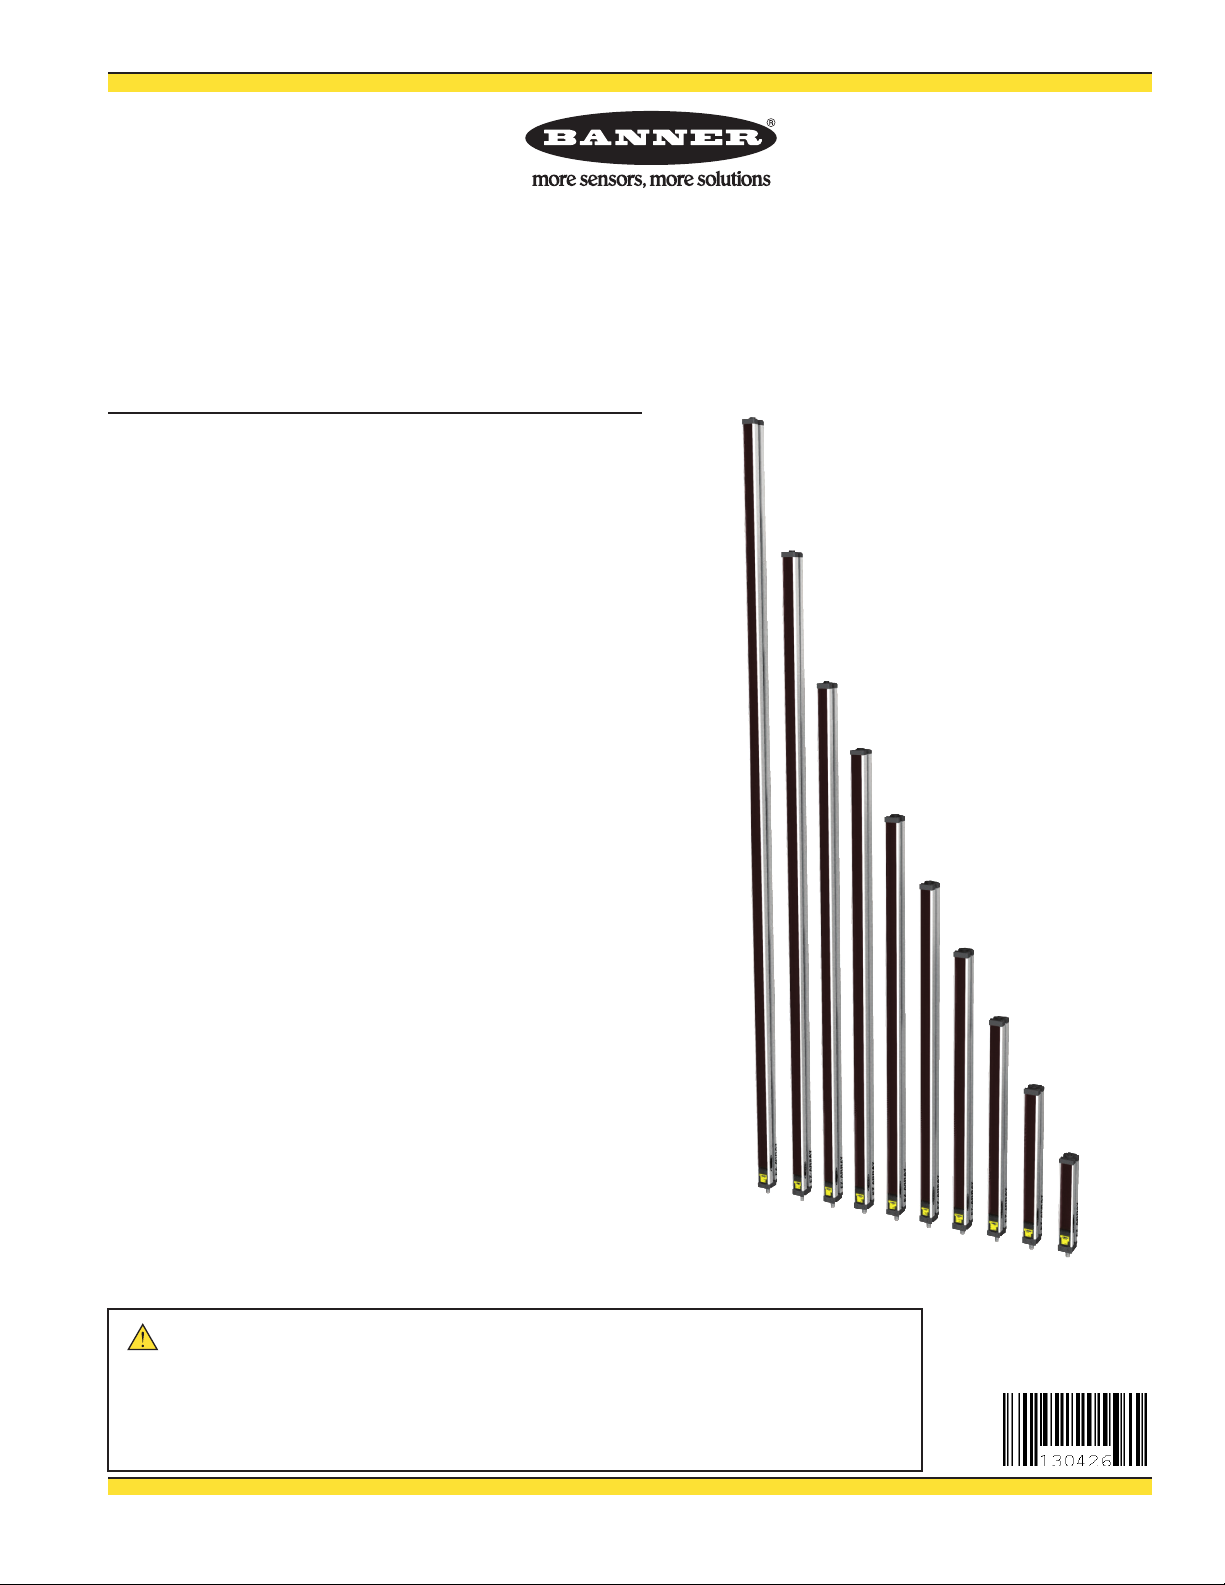
Outstanding 4 meter range with 5 mm beam spacing•
Available in 12 lengths from 150 mm to 2400 mm•
Excellent 5 mm minimum object detection or 2.5 mm edge •
resolution, depending on scanning method
Receiver user interface for quick, intuitive setup of many common •
applications:
– 6-position DIP switch for setting scan mode, measurement
mode, analog slope, discrete output 2 option (complementary
measurement or alarm operation)
– 2 push buttons for gain method selection and alignment/
blanking
– 7 Zone LEDs for instant alignment and beam blockage
information
– 3-digit display for sensing information and diagnostics
Software PC interface available for advanced configuration setup•
Remote teach wire option for alignment, gain settings, inverted •
display, and DIP switch disable
WARNING . . .
Never use these products as sensing devices for personnel protection. Doing so could lead to serious injury or death.
These sensors do NOT include the self-checking redundant circuitry necessary to allow their use in personnel safety applications. A
sensor failure or malfunction can cause either an energized or de-energized sensor output condition. Consult your current Banner
Safety Products catalog for safety products which meet OSHA, ANSI and IEC standards for personnel protection.
Not To Be Used for Personnel Protection
Printed in USA 09/12 P/N 130426 Rev. C
Page 2

Table of Contents
1. Overview ........................................ 1
1.1 System Components ..............................1
1.2 Features ........................................2
1.3 Configuration via DIP Switch or PC Interface ...........2
1.4 Status Indicators..................................3
1.5 Receiver Gray (Remote Teach) Wire.................. 4
1.6 Scanning Method ................................. 5
1.7 Gain Configuration ................................ 7
1.8 Electronic Alignment Routine ........................8
1.9 Blanking ........................................8
1.10 Measurement Mode Selection . . . . . . . . . . . . . . . . . . . . . . 8
1.11 Analog Output Configuration .......................9
1.12 Discrete Output Configuration ......................9
1.13 Serial Communication ............................9
2. Components and Specifications .................... 10
2.1 Sensor Models .................................. 10
2.2 Cordsets and Connections......................... 11
2.3 Alignment Aids .................................. 11
2.4 Accessory Mounting Brackets and Stands............. 12
2.5 Replacement Parts ............................... 12
2.6 Specifications ...................................12
2.6 Specifications, continued ..........................13
2.7 Emitter and Receiver Dimensions ...................14
2.8 Standard Bracket Dimensions ......................15
3. Installation and Alignment ......................... 16
3.1 Mounting the Emitter and Receiver ..................16
3.2 Mechanical Alignment ............................17
3.3 Hookups .......................................18
3.4 Optical Alignment ...............................19
4. Using the Receiver User Interface................... 20
4.1 Configuration DIP Switch ..........................20
4.2 Alignment / Blanking Button (Electronic Alignment)....... 21
4.3 Gain (Sensitivity Adjust) Button ..................... 21
4.4 Inverting the 3-Digit Display ........................22
4.5 Troubleshooting and Error Codes ................... 22
5. Using the PC Interface (Banner Sensors GUI) ......... 23
5.1 Supplied Software ...............................23
5.2 Communications Connections ......................23
5.3 Accessing the GUI ...............................23
5.4 Factory Defaults .................................25
5.5 Alignment and Blanking ...........................25
5.6 Configuration Setup
5.7 System Config View ..............................27
5.8 Analog Output Config View ........................28
5.9 Discrete Output Config View ....................... 28
5.10 Comm Config View..............................29
5.11 Part Number and Version Info View .................29
5.12 System Diagnostics View.........................29
5.13 Communications Troubleshooting .................. 30
Appendix A. Modbus Reference ....................... 34
Glossary ....................................... 45
...............................26
A-GAGE EZ-ARRAY
Instruction Manual
Banner Engineering Corp. •Minneapolis, U.S.A.
www.bannerengineering.com•Tel:763.544.3164
Page 3
A-GAGE EZ-ARRAY
Instruction Manual
1. Overview
Overview
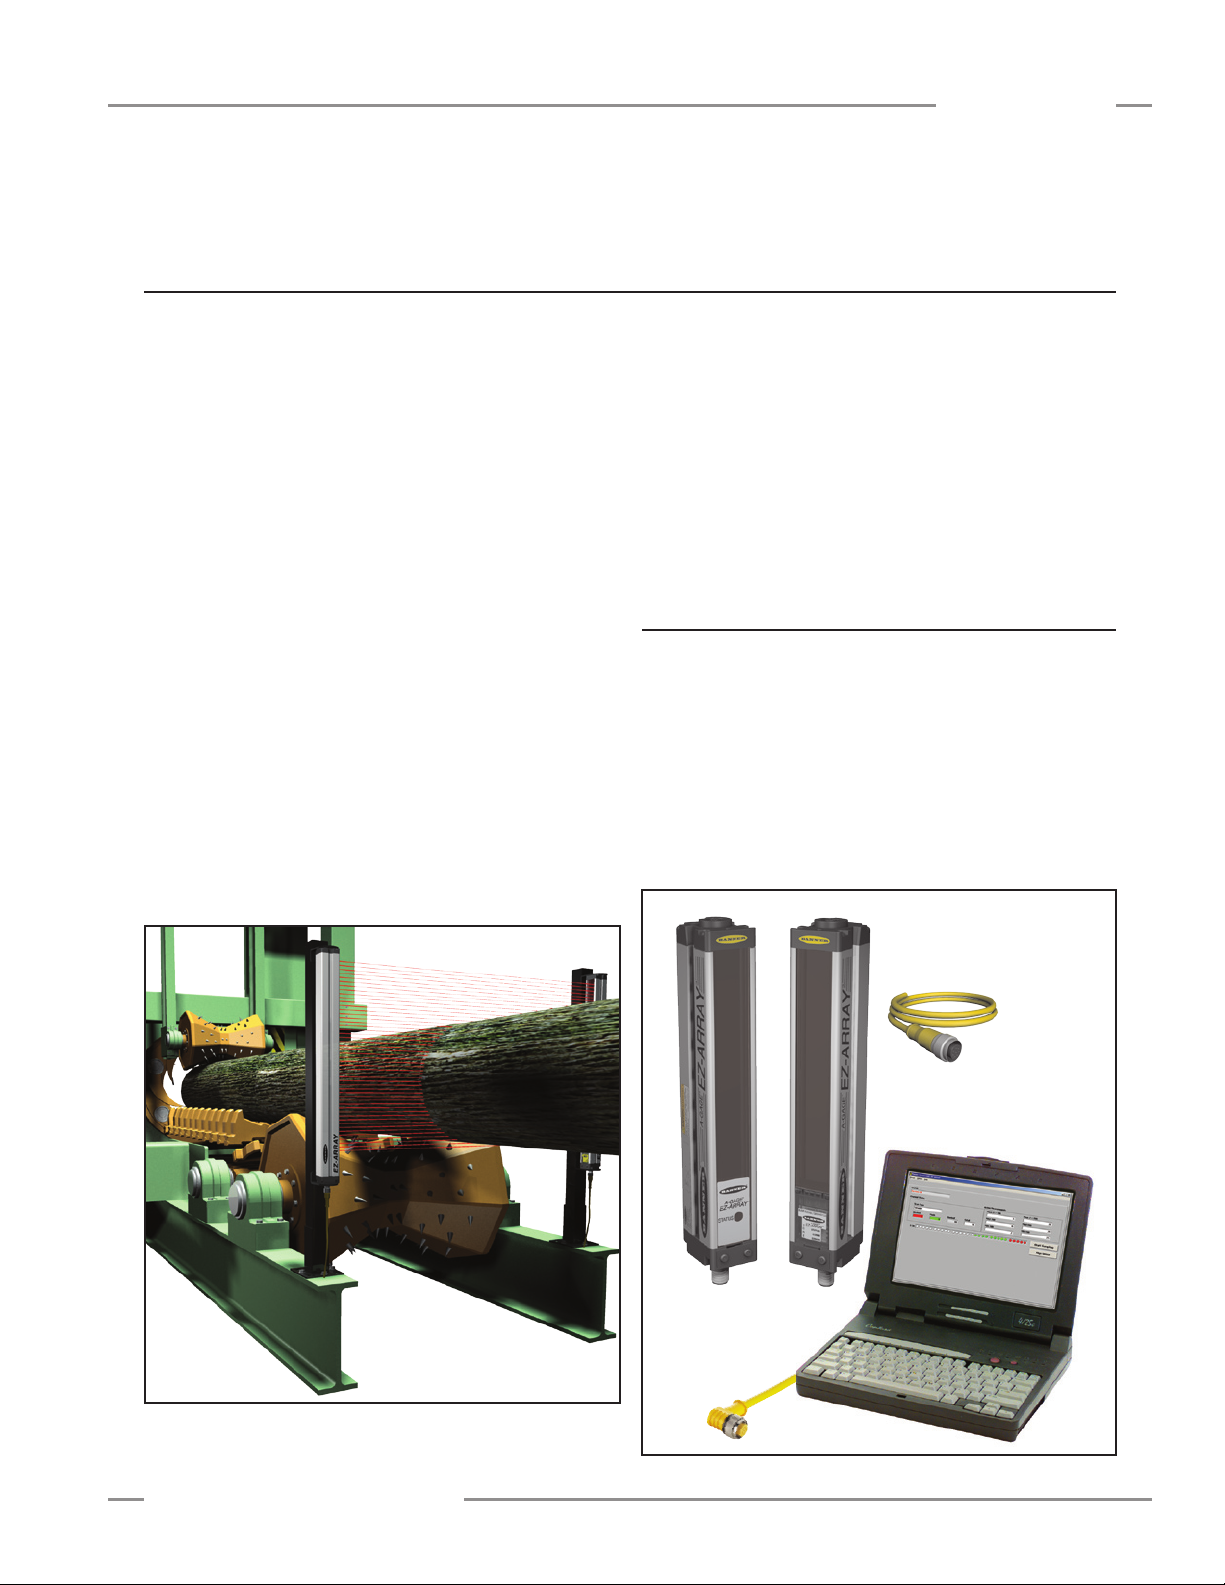
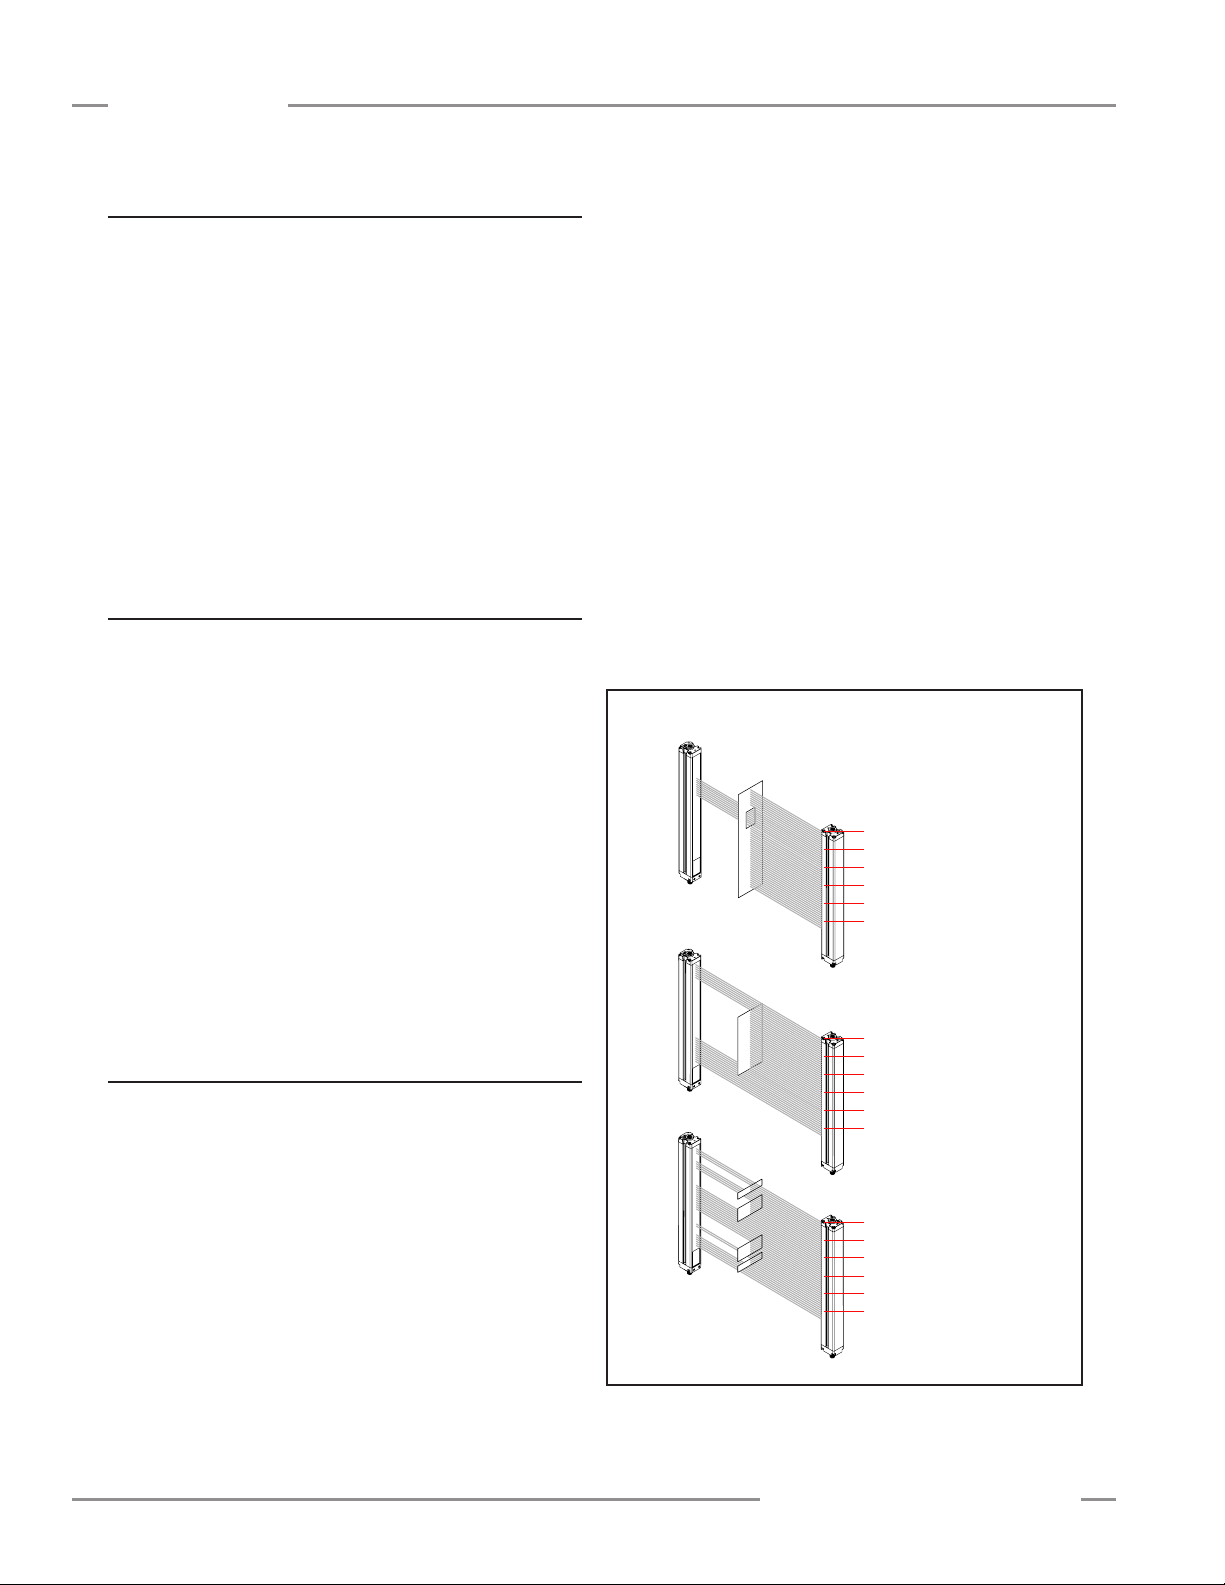
The A-GAGE™ EZ-ARRAY™ measuring light screen is ideal
for such applications as on-the-fly product sizing and profiling,
edge-guiding and center-guiding, loop tensioning control, hole
detection, parts counting, and similar uses (see Figure 1-1).
Emitters and receivers are available with arrays from 150 to
2400 mm (5.9" to 94.5") long. The emitter has a column of
infrared light emitting diodes (LEDs) spaced 5 mm apart; their
light is collimated and directed toward the receiver, positioned
opposite the emitter, which has photodiodes on the same
5 mm pitch. The light from each emitter LED is detected by the
corresponding receiver photodiode.
This sophisticated light curtain is capable of detecting opaque
cylindrical objects as small as 5 mm in diameter or measuring
part edges within 2.5 mm, depending on the scanning method
selected (see Section 1.6). The sensing range is 400 mm to 4 m
(16" to 13').
The EZ-ARRAY’s two-piece design makes it economical and
easy to use. Controller functionality is built into the receiver
housing. It can be configured for many straightforward
applications simply by configuring the six-position DIP switch on
the front of the receiver (the receiver user interface). For more
advanced control, easy-to-use PC interface software is available
on the included CD to configure the sensors using a PC.
Installation is easy, too. The emitter and receiver housings can
be side-mounted or end-cap-mounted using the included endcap brackets; longer models also include a center bracket (see
Section 3.1).
Beam synchronization is achieved via the 8-conductor sensor
cables. Individual LEDs and a 3-digit diagnostic display on the
receiver provide ongoing visual sensing status and diagnostic
information. Comprehensive data is available to a process
controller via a combination of five outputs: two analog, two
discrete, and one Modbus 485-RTU serial.
1.1 System Components
A typical A-GAGE EZ-ARRAY has four components: an emitter
and a receiver, each with an integral quick-disconnect (QD)
fitting, plus an 8-pin QD cordset for the emitter and for the
receiver (see Figure 1-2). For applications that use the Modbus
RTU-485 interface, an additional 5-wire cable is used to connect
the receiver with a PC or process controller, via the Modbus
485-RTU connection. (A PC used with software version 1.1
for configuration must run on Windows
version 1.2, when available, will be compatible with Vista
Emitter Receiver
®
XP or 2000; software
™
.)
Figure 1-1. A typical A-GAGE EZ-ARRAY application
Banner Engineering Corp. •Minneapolis, U.S.A.
www.bannerengineering.com•Tel:763.544.3164
8-Pin Euro
Sensor Cordset
Optional PC for PC interface
software configuration
5-Pin Euro Communications
Cable for use with PC;
USB adapter not shown
Figure 1-2. A-GAGE EZ-ARRAY system components
P/N 130426 Rev. C 1
Page 4
Overview
A-GAGE EZ-ARRAY
Instruction Manual
1.2 Features
Built-in features in the EZ-ARRAY contribute to its ease of
use. Many features are available using either the user-friendly
receiver interface or the more advanced PC interface.
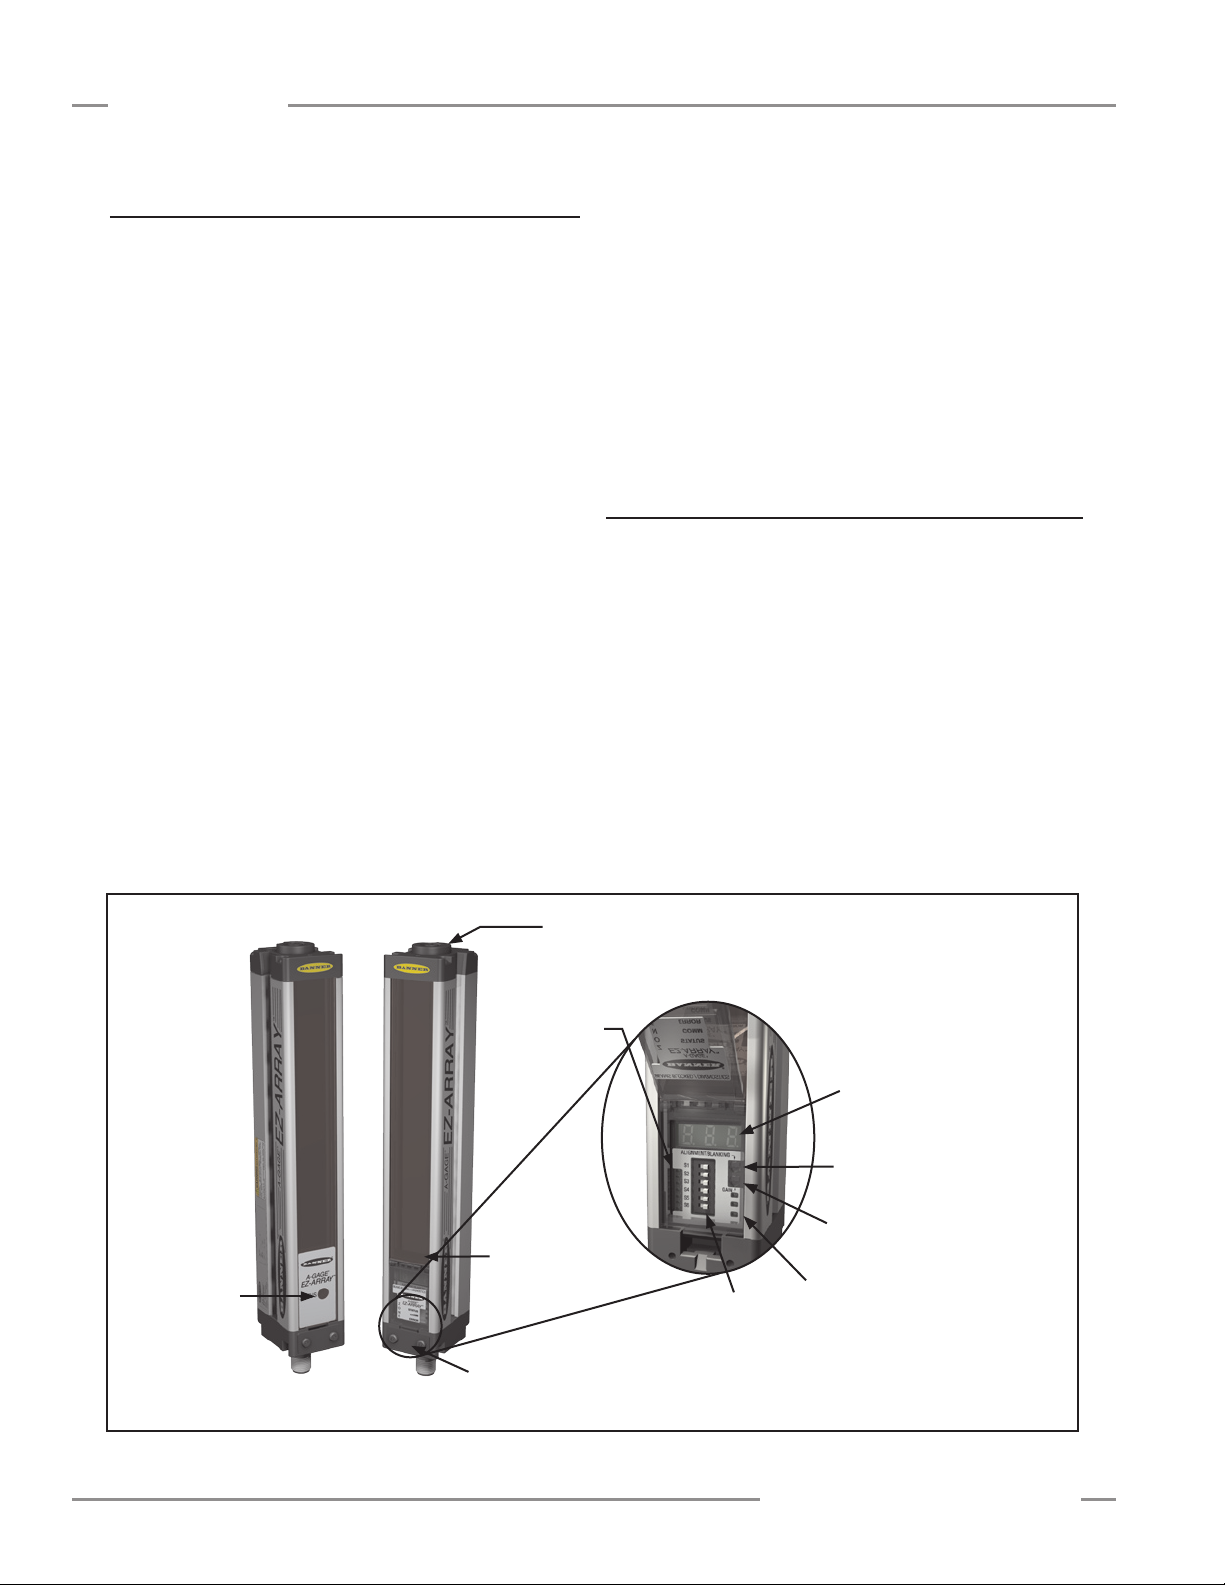
Built-in diagnostic programming and easy-to-see indicators on
the receiver simplify physical alignment and troubleshooting
(Figure 1-3); more advanced diagnostics are available via the
PC interface.
The receiver has a bright LED that indicates overall sensing
status (OK, marginal alignment, and hardware error). Two
other LEDs indicate serial communication status. Seven Zone
indicators each communicate the blocked / aligned status of oneseventh of the total array. A 3-digit diagnostic display provides
further diagnostic information, including number of beams
blocked, whether blanking is configured, and troubleshooting
codes.
The emitter has a red LED that signals proper operation (ON
when power is applied). See Section 1.4 for more information
about indicators and Section 4.5 for display codes and
troubleshooting.
The Alignment routine (Section 4.2 or Section 5.6) automatically
equalizes the excess gain of each beam for reliable object
detection throughout the array. This routine need not be
performed again unless the sensing application changes, or if
the emitter and/or receiver is moved.
Configurable beam blanking accommodates machine
components and fixtures that must remain in or move through the
light screen. Blanking may be set using the receiver interface,
the teach wire, or the PC interface.
The EZ-ARRAY light screen provides a wide selection of sensing
and output options, including measurement (“scan analysis”)
modes and scanning methods that can determine a target
object’s location, overall size, total height, or total width, or the
number of objects. Scanning may be continuous or controlled by
a gate sensor. Up to 15 systems may be networked, via Modbus;
see Section 5 and Appendix A.
1.3 Configuration via DIP Switch or PC Interface
Commonly used configuration options can be set up easily via
a six-position DIP switch located behind a hinged clear access
panel on the front of the receiver.
Access to the DIP switch can be prevented by using the screwon security plate to hold the clear access panel closed or by
disabling them via the PC interface.
For more advanced, individualized applications, use the supplied
PC interface software program (the “Banner Sensors GUI”;
Section 5) to configure the receiver. The menu-driven program
easily accesses the many scanning and output options. After
the desired options are selected, the combination of selections
can be saved in an .xml file, stored in the system configuration
computer, and recalled as needed. Communication between the
Emitter Receiver
Power ON
LED
Figure 1-3. A-GAGE EZ-ARRAY features
2 P/N 130426 Rev. C
Connection to 5-pin
Communication Cable
Under Hinged Access Panel:
Zone Indicators
Beam #1
(Closest to
Display)
Screw-on Security Plate
limits access to DIP switch
and push buttons
6-Position
Configuration
DIP Switch
3-Digit Diagnostic
Display
Alignment/Blanking
Push Button
Gain (Sensitivity Adjust)
Push Button
Status, Communication Active, and
Communication Error LEDs
Banner Engineering Corp. •Minneapolis, U.S.A.
www.bannerengineering.com•Tel:763.544.3164
Page 5
A-GAGE EZ-ARRAY
Instruction Manual
Overview
sensors and a PC is accomplished via the serial output and
Modbus RTU-485 interface.
The software also provides alignment and diagnostics routines.
An Alignment screen displays the individual status of each beam
in the light screen, as well as the total number of beams, and
totals of beams blocked, made, and blanked. Built-in diagnostics
can be used to assess emitter and receiver status.
Outputs
In addition to the serial output (see above), all models have two
analog outputs and two discrete outputs.
The analog outputs are either 4–20 mA current or 0–10V
voltage, depending on model (see Section 2-1). They may be
configured (via DIP switch or PC interface) for either a positive
or negative slope.
Discrete output 1 is always used for measurement; discrete
output 2 may be used either for alarm or measurement
operation (selectable via DIP switch or PC interface). When
the receiver interface is used, discrete output 1 follows the
operation of analog output 1 (it conducts when the analog output
senses a target is present). When the PC interface is used for
configuration, both discrete outputs have full configurability,
including measurement mode, NPN or PNP polarity, and
normally open or normally closed operation.
Display Invert
For applications where the sensors must be mounted with the
display end at the top (so that the display is not right-reading),
the receiver’s diagnostic display can be inverted for easy
reading, either by use of the receiver’s remote wire (Section 1.5)
or the PC interface.
1.4 Status Indicators
Both the emitter and receiver provide ongoing visual indication
of operating and configuration status.
The emitter has a red LED that signals proper operation (ON
when power is applied).
into seven equal segments, each of which is represented by
one of the seven LEDs. The LED closest to DIP switch S6 (see
Figure 4-1) represents the group of optical channels closest to
the receiver display (the “bottom” group). The LED closest to DIP
switch 1 represents the far segment of channels.
These LEDs illuminate either green or red. When an LED is
green, no unblanked beams are obstructed in that segment.
When the LED is red, one or more beams in that segment is
obstructed.
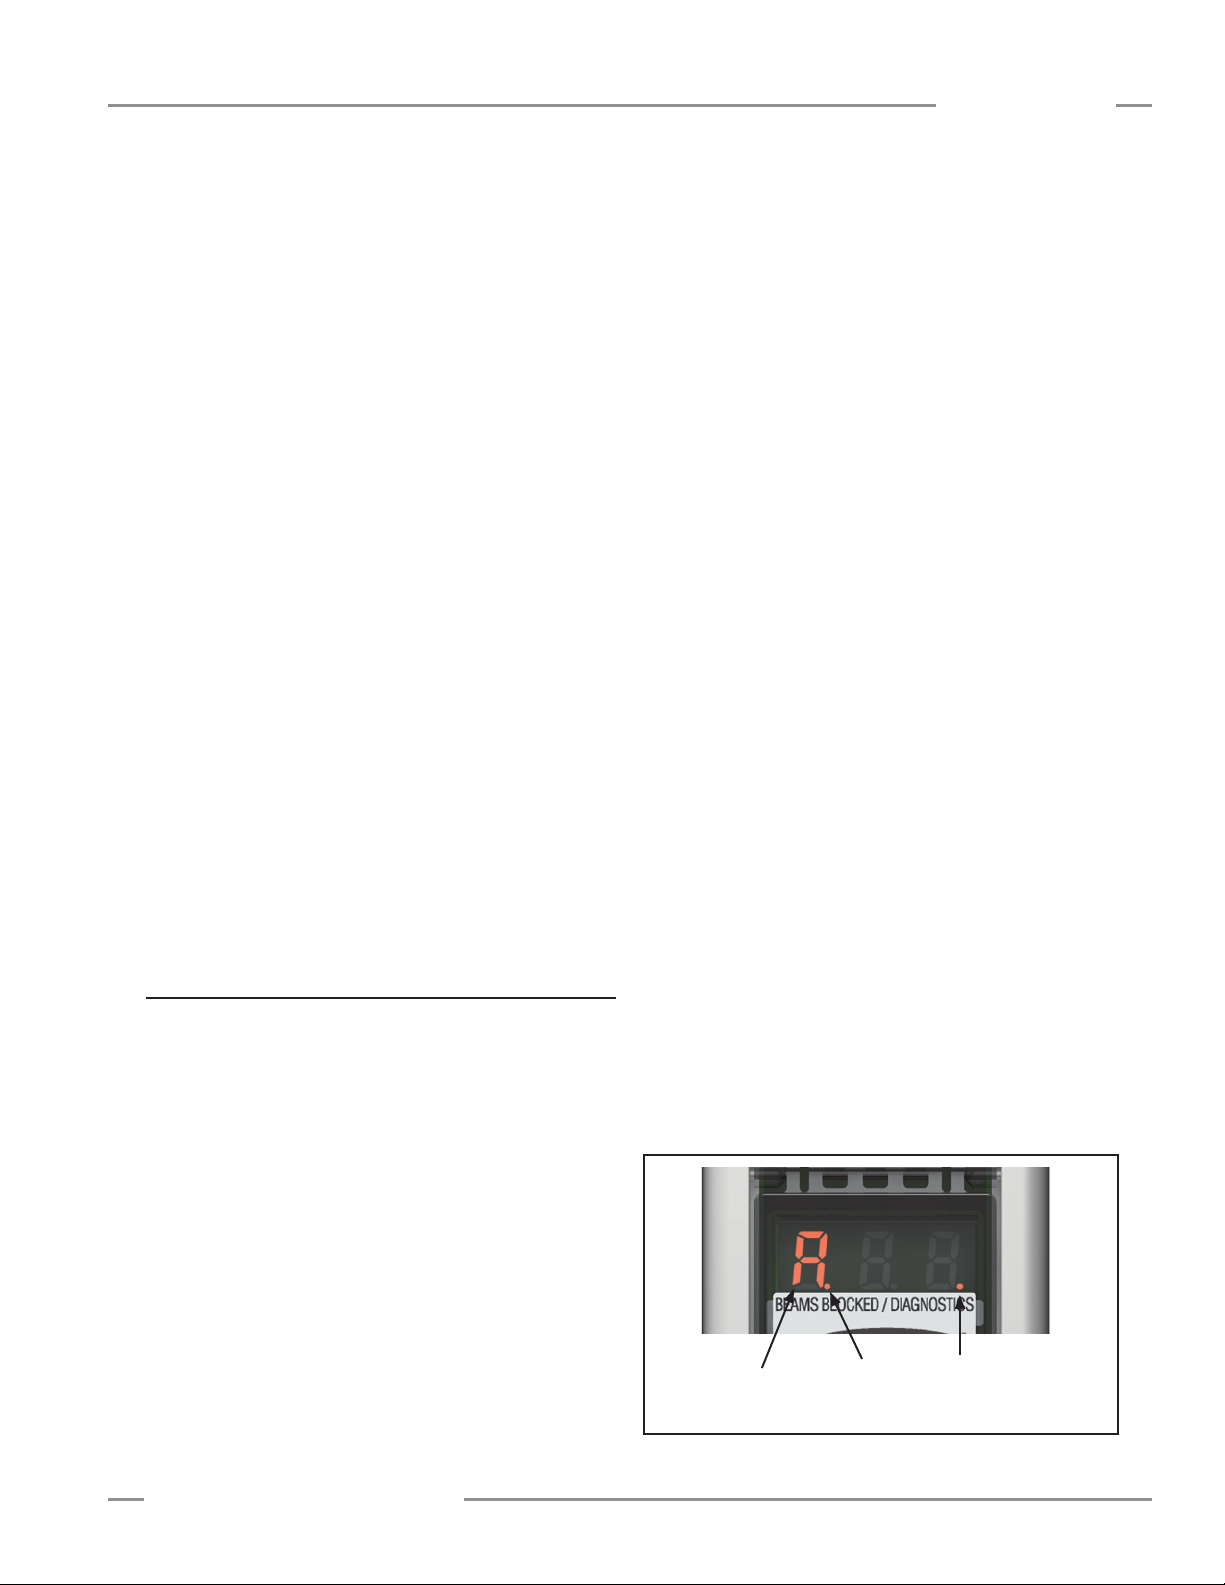
Three-Digit Display
The 3-digit display has slightly different functions during normal
operation, alignment, and gain adjust modes. In normal operation
the display indicates current numerical value of the measurement
mode for analog output 1. The display also identifies the
following activated sensor functions: blanking and locked-out
user interface/electronic configuration, as shown in Figure 1-4.
(For directions for inverting the display, see Section 1.5 or 5.8.)
During blanking mode, the display reads “n”, followed by the
number of blocked beams in the array. During alignment mode, it
reads “A”, followed by the number of blocked, unblanked beams;
a period follows the A (“A.”) if blanking is configured.
During gain adjust mode, the display reads “
l” followed by “1” or
“2” to indicate the gain level. (A “1” represents high excess gain,
and a “2” represents low contrast.)
If a sensing error occurs, the display reads “c” followed by a
number that corresponds to the recommended corrective action
(see Section 4.5).
Blanking Indicator
The Blanking indicator will be visible (ON) when the blanking
feature is enabled. It appears as a period following the first digit
of the display.
Electronic Configuration Indicator
The Electronic Configuration indicator is ON when the sensor
configuration is defined by the PC interface, and not the DIP
switch and push buttons. When electronic configuration is
enabled, the DIP switch and push button settings are ignored.
The receiver has a bright Status LED that indicates overall
sensing status (OK, marginal alignment, and hardware error).
Two other LEDs indicate whether serial communication is active
or if there is a communication error. Seven Zone indicators
each communicate the blocked/aligned status of one-seventh
of the total array. A 3-digit diagnostic display provides further
diagnostic information: number of beams blocked, whether
blanking is configured, and troubleshooting codes. See Section
4.5 for display codes and troubleshooting.
Zone Indicators (Beams Blocked Segment)
Seven LEDs represent emitter/receiver alignment status. They
provide a visual aid for sensor alignment and monitoring objects
within the sensor’s field of view. The sensor array is partitioned
Banner Engineering Corp. •Minneapolis, U.S.A.
www.bannerengineering.com•Tel:763.544.3164
‘A’ in this
position indicates
Alignment mode
Figure 1-4. Indications provided by the receiver’s 3-digit display
Period ON
indicates
Blanking
Configured
Period ON indicates
Electronic Configuration
Enabled
P/N 130426 Rev. C 3
Page 6
Overview
TT T
1x
2x
3x
4x
T
T
T
T
T
T
T
T
T
T
T
T
T T
T
TT T
1x
TT T
1x
TT T
1x
TT T
1x
TT T
1x
2x
T
T
T
TT T
1x
2x
T
T
T
TT T
1x
2x
T
T
T
TT T
1x
2x
3x
T
T
T
T
T
T
T T
A-GAGE EZ-ARRAY
Instruction Manual
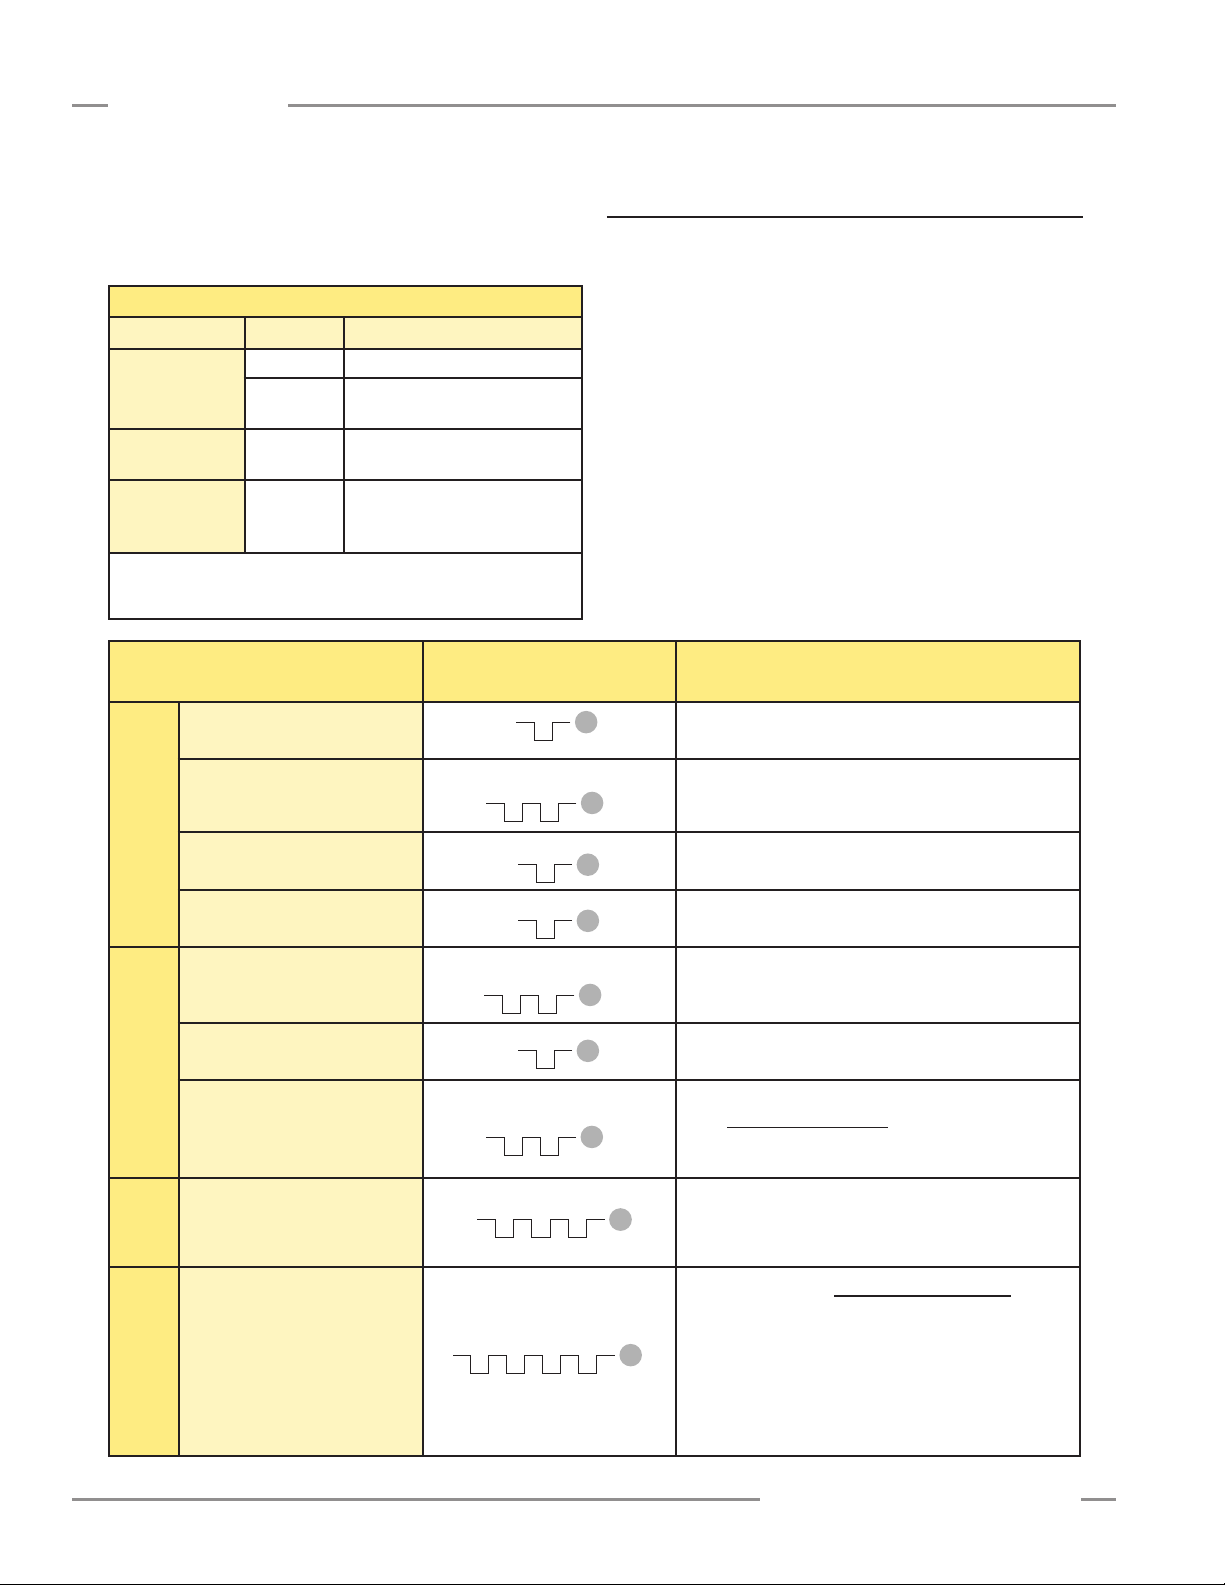
Receiver Interface Status Indicators
The receiver has three status indicators: green/red System
Status, yellow Modbus Activity, and red Modbus Error. The
following table lists the indicator states.
Receiver Interface Status Indicators
LED Indicator Color Explanation
System Status Green System is OK
Red Marginal Alignment or Hardware
Error; check 3-digit display*
Modbus
Activity
Modbus Error Red Communication Error: Check
* Display shows “c”: See Section 4.5.
Display shows only numbers: Low Gain/Marginal Alignment condition.
See Section 4.5.
Access Alignment Mode “A” appears on 3-digit display
Yellow ON
or Flashing
Process
Activity detected on the Modbus
communication channel
cabling or Modbus master
controller
Remote Wire Procedure
0.05 sec. ≤ T ≤ 0.8 sec.
1.5 Receiver Gray (Remote Teach) Wire
The receiver gray (remote teach) wire is used to electronically
emulate the receiver push button functions (see Section 4.5) via
a process controller, to disable the DIP switches for security, or
to provide a gate input to initiate sensor scanning. Connect a
normally open switch between the receiver’s gray wire and dc
common, or connect the gray wire to a digital input (PLC) and
pulse the wire as indicated in Figure 1-5.
NOTE: A low level is 0 to 2 volts and a high level is 10 to 30
volts or circuit open. Input impedance is 22kΩ.
Remote TEACH/Gate in the System Config view of the PC
interface Setup screen (Section 5.8) determines the functionality
of the receiver gray wire, as follows.
• Disabled: (selected via the PC interface only) the remote
wire has no function (regardless of whether it is low or high).
Result
Figure 1-5. Remote wire Teach procedures
4 P/N 130426 Rev. C
Access Blanking Mode
Exit Blanking Mode
Alignment/Blanking
Exit Alignment Mode Sensor returns to run mode
Access Gain Mode
Toggle Between Gain Settings Number changes from number “1” to “2”, back to “1”, etc.
Gain Method
Save Gain Level and Exit
Invert Display
Invert
Display
Receiver Interface
Enable/Disable
Enable/Disable
Receiver Interface
From Alignment Mode:
From Run Mode:
When correct level is displayed:
“n” appears on 3-digit display, along with number of
blocked beams
“A.” appears on 3-digit display (sensor returns to
alignment mode with blanking enabled)
“L” appears on 3-digit display, along with number “1” or
“2”, to designate gain level
Gain level is configured:
“1” = High-excess-gain setting
“2” = Low-contrast setting
Sensor returns to run mode
Display inverts from previous state; sensor continues in
run mode
The factory default is Receiver Interface enabled.
Four-pulsing the remote line saves the current settings
and disables the interface (the sensor continues to
operate using the saved settings; changes made to the
DIP switch will have no effect).
Repeating the process enables the Receiver Interface so
that settings can be changed.
Banner Engineering Corp. •Minneapolis, U.S.A.
www.bannerengineering.com•Tel:763.544.3164
Page 7
A-GAGE EZ-ARRAY
Instruction Manual
Overview
When the gray wire is disabled, the receiver is in continuous
scan mode; it begins a new scan immediately after updating
the outputs from the previous scan. (Continuous scan is used
in most analog output applications and whenever continuous
updating of the outputs is acceptable.) The gray wire is always
enabled when in DIP switch mode.
• Remote Teach — The gray wire provides the full Remote
Teach functionality shown in Figure 1.5.
• Alignment/Sensitivity — This mode is an abbreviated version
of Remote Teach. It can perform the alignment and sensitivity
adjustment functions, but not the display inversion or DIP
switch enable/disable functions.
Gate Mode options can be selected via the PC interface only.
The gray wire provides a gate input pulse, typically from a dc
device such as an NPN-output photoelectric sensor or a PLC
discrete output. Refer to Section 5 for more information.
• Gate – Active High — The receiver scans whenever the gate
is pulled high.
• Gate – Active Low — The receiver scans whenever the gate
is pulled low.
• Gate – Rising Edge — The receiver scans once for each lowto-high gate transition. (Multiple transitions cannot be faster
than the sensor’s response for them to be reliably detected.)
• Gate – Falling Edge — The receiver scans once for each
high-to-low gate transition. (Multiple transitions cannot be faster
than the sensor’s response for them to be reliably detected.)
1.6 Scanning Method
One of three scanning methods may be configured:
• Straightscan
• Single-edgescan
• Double-edgescan(1,2,4,8,16,or32steps)
Straight Scan is the default mode, in which all beams are
scanned in sequence, from the display end to the far end
of the array. This scanning method provides the smallest
object detection size. Straight scan is used when low-contrast
sensitivity is selected or when single-edge and double-edge
scan cannot be used. The edge resolution is 5 mm (0.2"). When
low-contrast sensing is selected (used when measuring semitransparent objects), the minimum object detection size is 5 mm
(0.2") diameter. When high-excess-gain sensing is selected, the
minimum object detection size is 10 mm (0.4"). See Figure 1-5.
Single-Edge Scan is used to measure the height of a single
object. This scanning method is commonly used for box height
measurement. For single-edge scan, the receiver always
activates the first beam channel (or “bottom” beam, nearest the
display). When the first beam is blocked, the sensor performs a
binary search to hunt for the last beam blocked, as follows:
1. The receiver scans only the first beam until it is blocked (see
Figure 1-7).
2. When the first beam is blocked, the sensor looks to see
whether the middle beam is blocked or made (unblocked).
3. If the middle beam is made (unblocked), the sensor checks
the bottom quarter beam; if the middle beam is blocked, the
sensor checks the top quarter beam.
4. The routine continues to divide the number of beams in half
until the edge is found.
Single-edge scan can be used only for single, solid objects
that block the first beam (closest to the display). Because the
receiver checks only the first beam until it is blocked, single-edge
scan will not function when the item to be measured does not
block the first beam. Single-edge scan is also ineffective if the
object does not present a continuous blocked pattern.
Single-edge scan works only when the high-excess-gain setting
is enabled. When single-edge scan is selected, the sensor object
detection size is 10 mm and edge resolution is 2.5 mm.
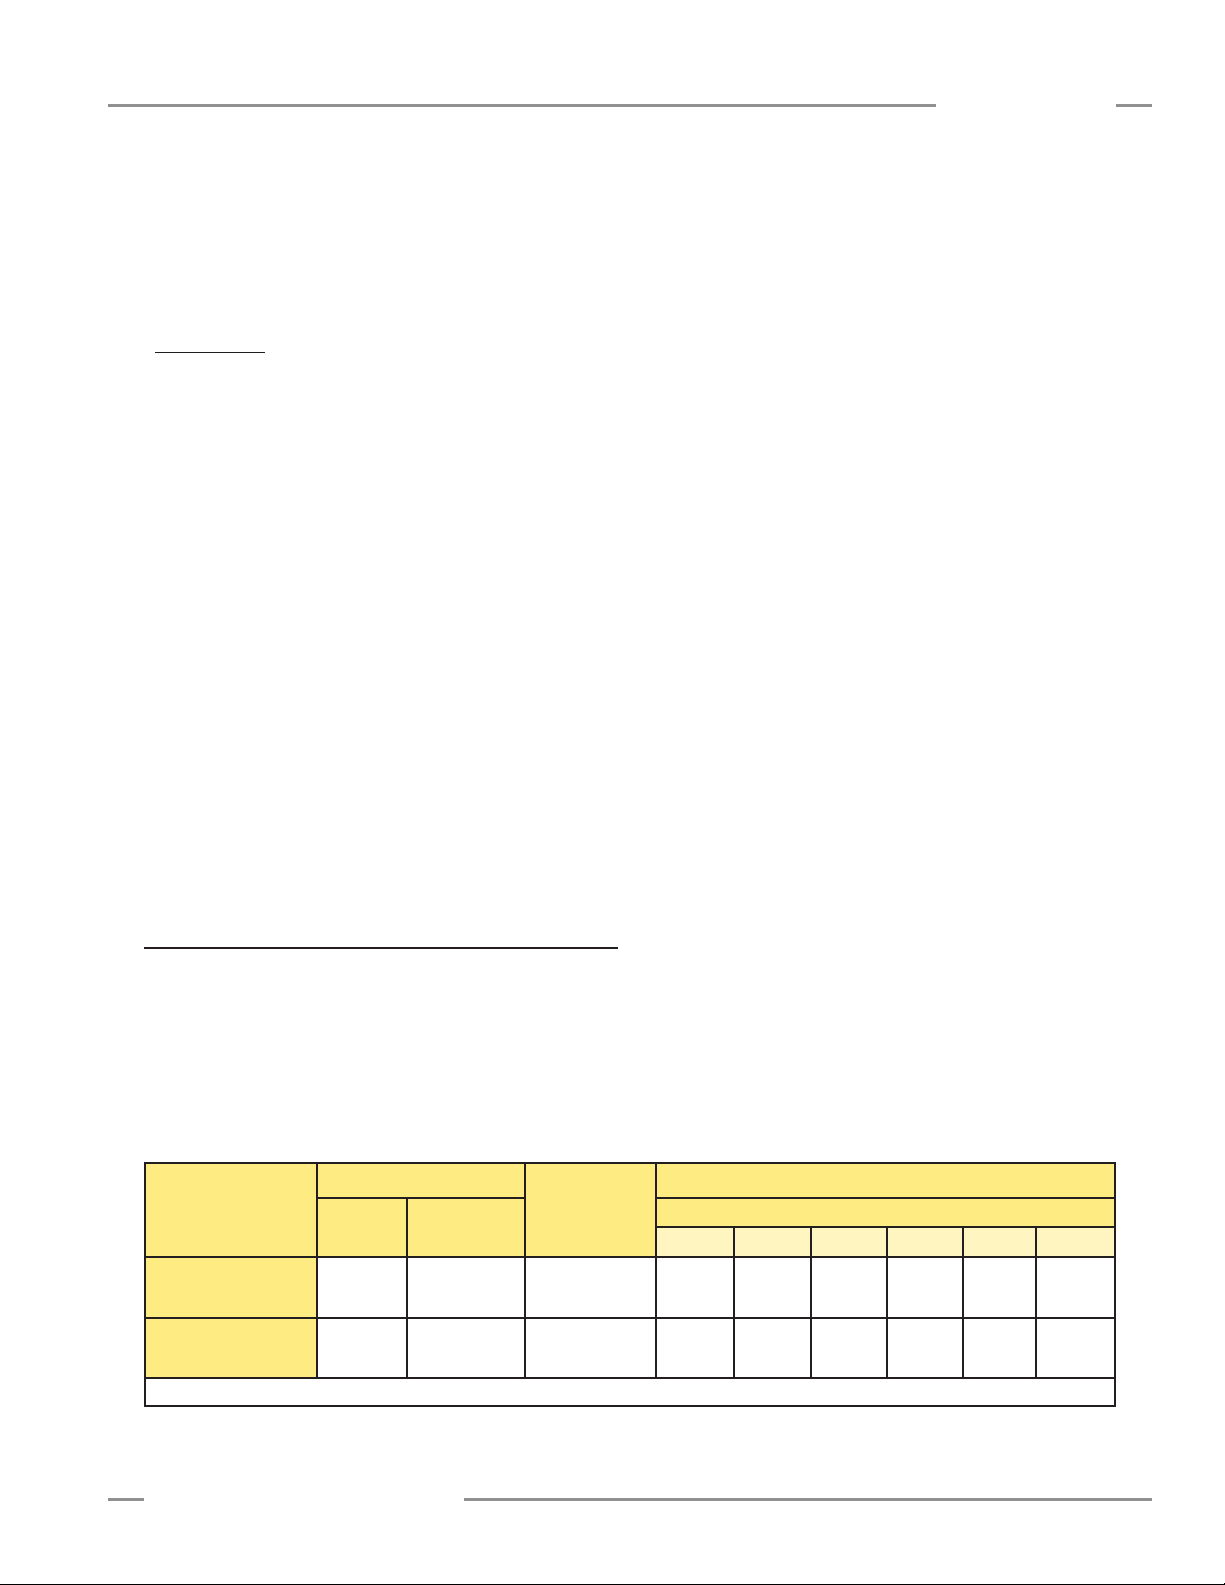
Sensor response time is a function of sensor length and
scanning method. Maximum scan times are shown in Figure 1-6.
Straight Scan
Scanning Method
Minimum Object
Detection Size*
Edge Resolution
*MODS determined using a rod target object
Figure 1-6. The effect of scan mode and step size on minimum object detection size and edge resolution
Banner Engineering Corp. •Minneapolis, U.S.A.
www.bannerengineering.com•Tel:763.544.3164
Low-
Contrast
5 mm
(0.2")
5 mm
(0.2")
High-Excess-
Gain
10 mm
(0.4")
5 mm
(0.2")
Single-Edge
Scan
10 mm
(0.4")
2.5 mm
(0.1")
1 2 4 8 16 32
10 mm
(0.4")
2.5 mm
(0.1")
Double-Edge Scan (per Edge)
Step Size (Number of Beams)
20 mm
(0.8")
2.5 mm
(0.1")
30 mm
(1.2")
2.5 mm
(0.1")
50 mm
(2")
2.5 mm
(0.1")
90 mm
(3.6")
2.5 mm
(0.1")
P/N 130426 Rev. C 5
170 mm
(6.8")
2.5 mm
(0.1")
Page 8
Overview
A-GAGE EZ-ARRAY
Instruction Manual
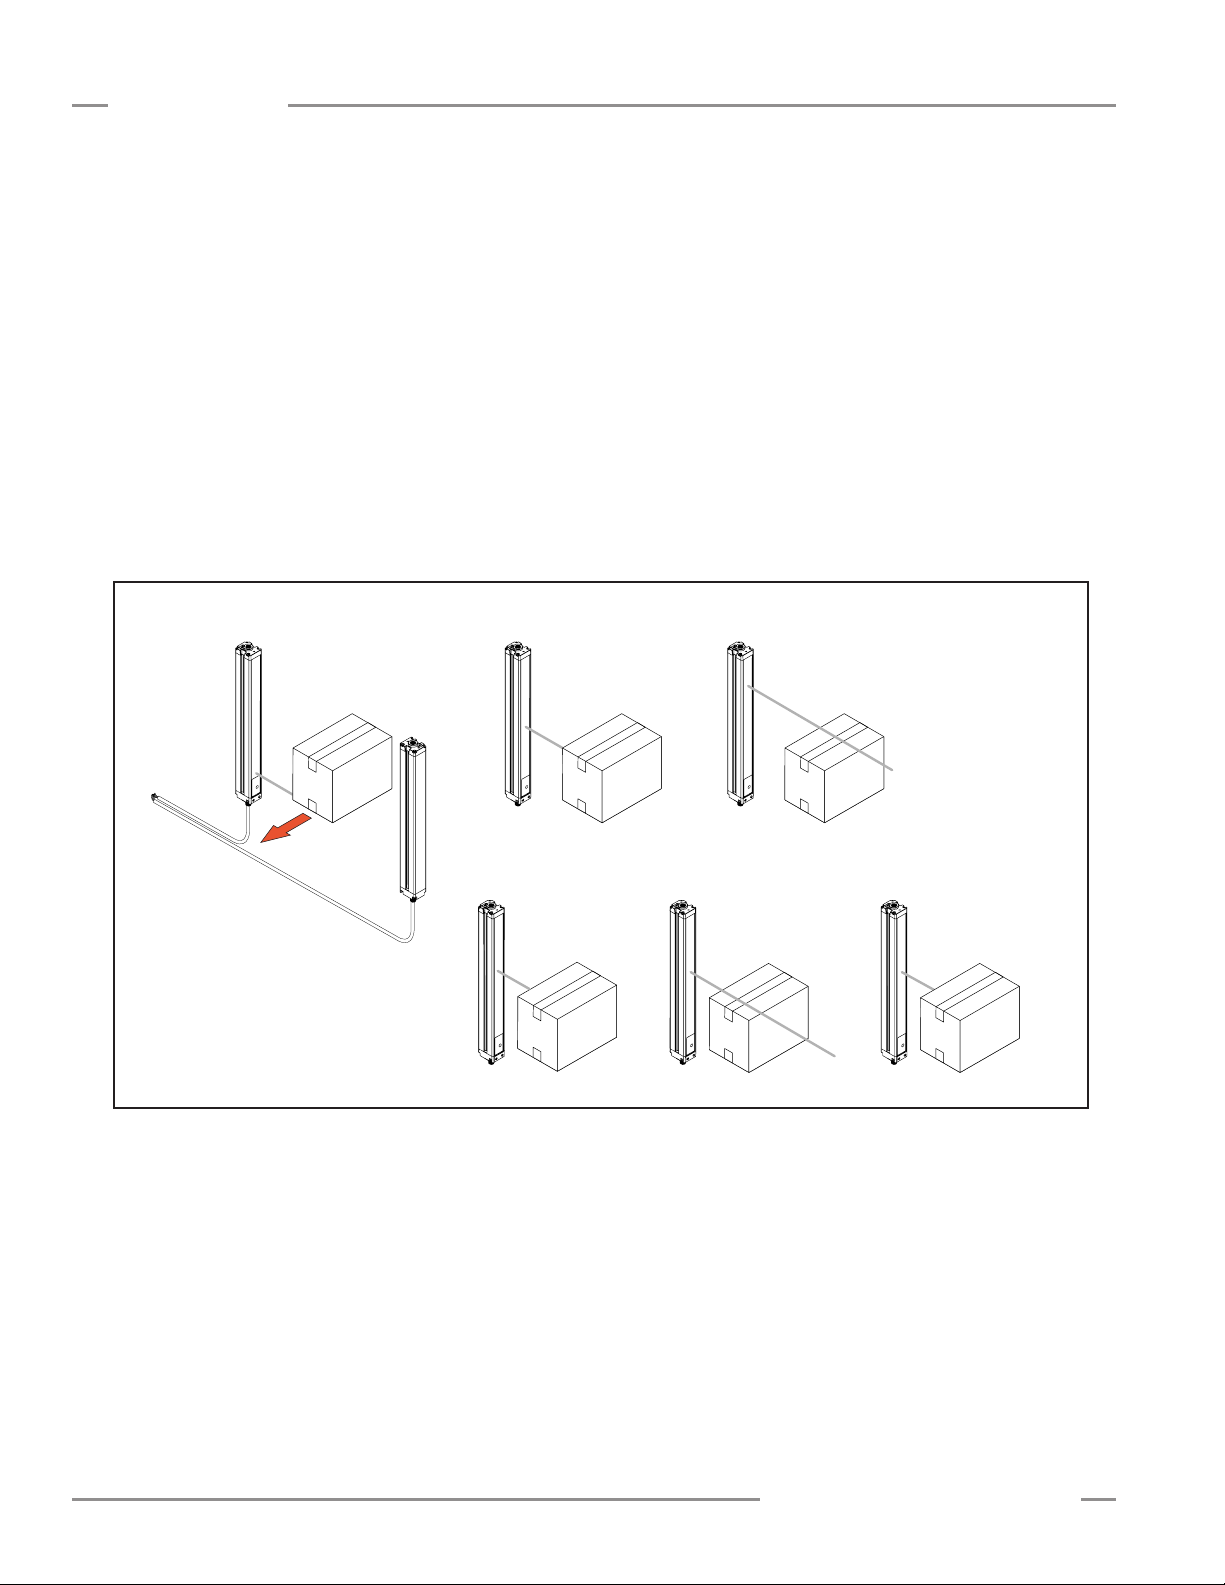
Double-Edge Scan is used to detect two edges of a single
object, for example, to determine box width measurements.
Double-edge scan requires the selection of a step size: 1, 2,
4, 8, 16 or 32 beams. The sensor uses the steps to “skip” over
beams, as follows:
1. The sensor activates beam 1 (closest to the sensor display end).
2. The sensor activates the next beam, determined by the step
size. (For example, if the step size is 2, beam 3 is next; if the
step size is 8, beam 9 is next.)
3. As long as the activated beam is made (unblocked), the sensor
continues the stepping routine until a blocked beam is found.
4. When a blocked beam is found, a binary search is conducted
to find the object’s “bottom” edge.
Step #1 Step #2 Step #3
Beam #1 of 30
blocked
Beam #15
blocked
5. When the bottom edge is found, the sensor continues to step
through the array until it finds the next unblocked beam.
6. Another binary search is performed to find the second edge.
Similar to single-edge scan, double-edge scan has some
restrictions: the object should provide a solid obstruction; the size
of the object determines the maximum step size (Figure
1-6). Double-edge scan can be used to detect up to three
objects. Like single-edge scan, double-edge scan works only
when the high-excess-gain setting is selected. When doubleedge scan is selected, the sensor object detection size varies,
depending on the step size, but edge resolution is 2.5 mm.
Beam #23 clear
Emitter
Receiver
Step #4 Step #5
blocked
Figure 1-7. Finding an edge using a binary search (single-edge scan)
Step #6
Beam #19 clearBeam #17
Beam #18
blocked
6 P/N 130426 Rev. C
Banner Engineering Corp. •Minneapolis, U.S.A.
www.bannerengineering.com•Tel:763.544.3164
Page 9
A-GAGE EZ-ARRAY
Instruction Manual
Overview
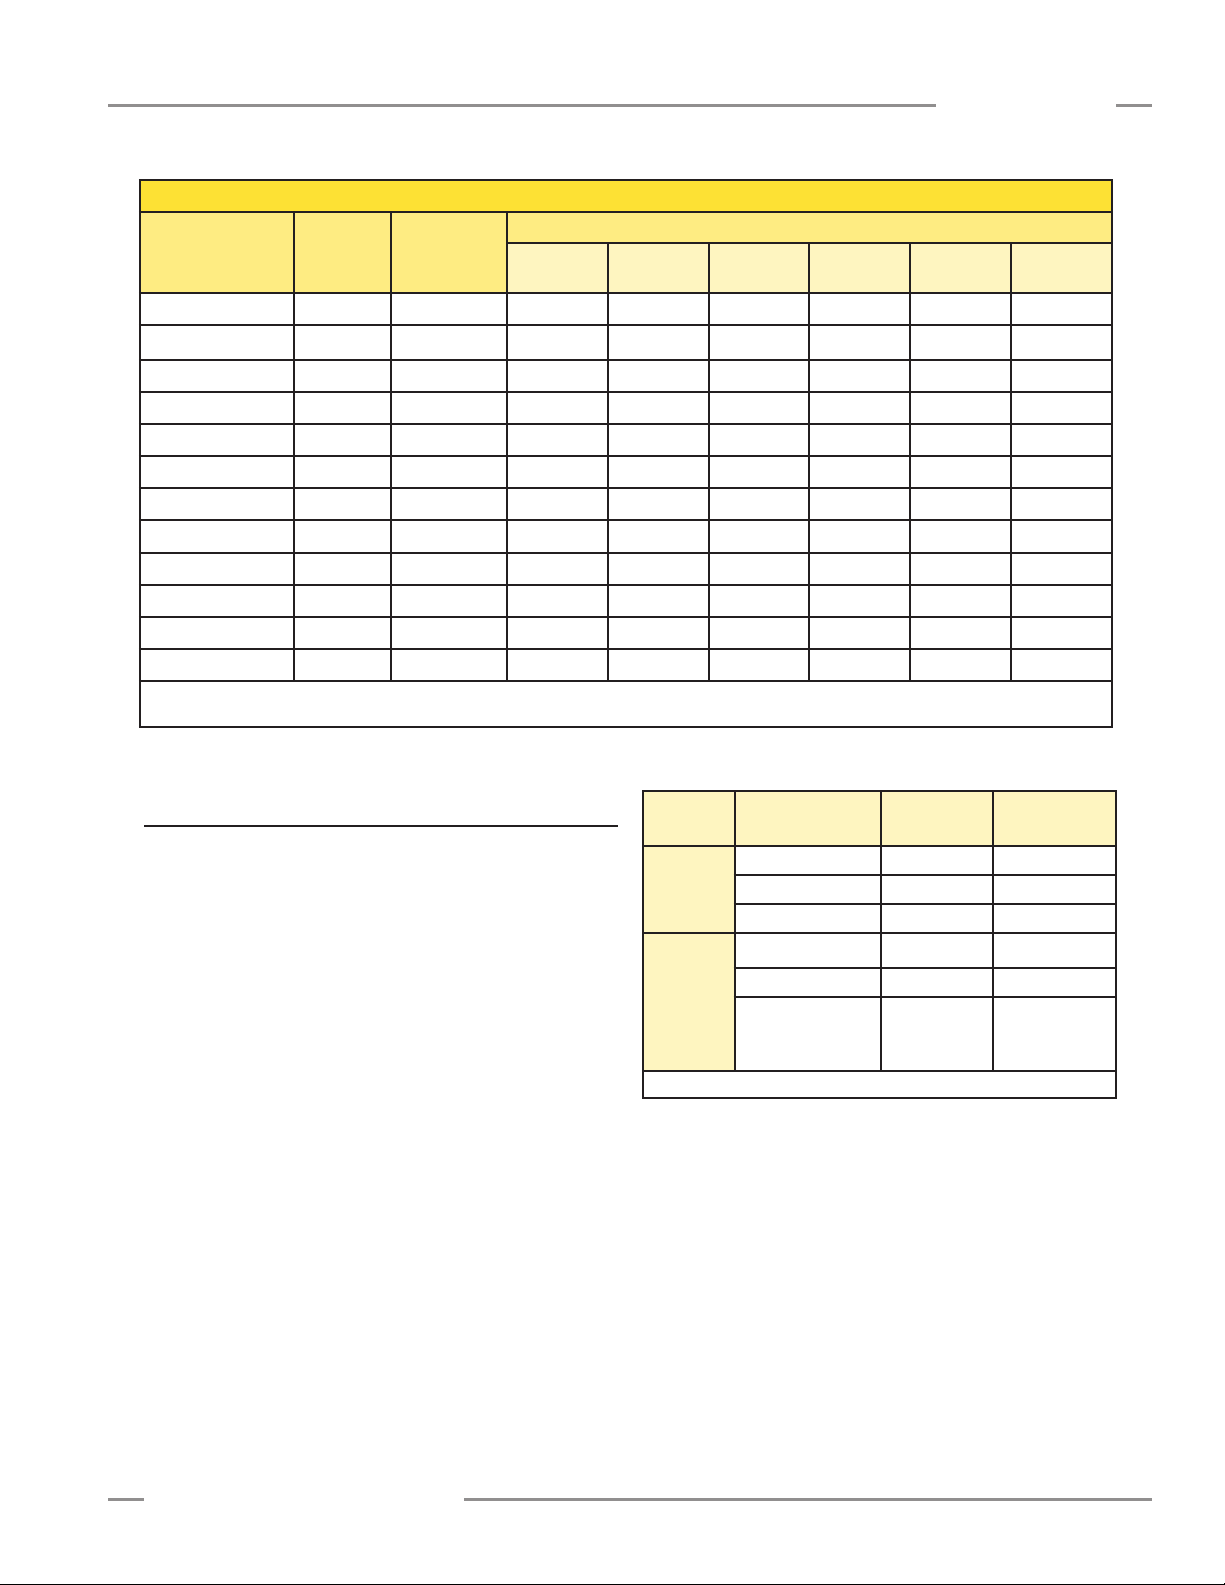
Maximum Scan Times (in milliseconds)
Array Length
150 mm (5.9") 2.8 1.5 3.4 2.8 2.5 2.4 1.9 N/A
300 mm (11.8") 5.0 1.5 5.9 4.1 3.2 2.8 2.3 2.1
450 mm (17.7") 7.1 1.6 8.5 5.5 4.2 4.0 3.2 2.5
600 mm (23.6") 9.3 1.6 11.0 6.8 4.9 4.2 4.0 2.8
750 mm (29.5") 11.4 1.7 13.5 8.1 5.7 4.6 4.5 4.5
900 mm (35.4") 13.6 1.7 16.0 9.5 6.1 4.7 4.6 4.6
1050 mm (41.3") 15.7 1.8 18.6 10.8 6.8 5.2 4.8 4.8
1200 mm (47.2") 17.9 1.8 21.1 12.2 7.4 5.5 4.9 4.9
1500 mm (59.1") 22.2 1.9 26.1 14.8 9.0 6.4 5.3 4.9
1800 mm (70.9") 26.5 2.0 31.2 17.5 10.5 7.3 6.0 5.6
2100 mm (82.7") 30.8 2.8 36.3 20.2 12.0 8.2 6.7 5.6
2400 mm (94.5") 35.1 2.8 41.4 22.9 13.5 9.1 7.4 5.9
NOTES: Scan times are exclusive of serial communication transmission times.
Scan times are also dependent on analog filter speed; see Section 5.8.
Figure 1-8. Maximum scan times for straight, single-edge and double-edge scanning
Straight
Scan
Single-Edge
Scan
Step
1 Beam
Step
2 Beams
Double-Edge Scan
Step
4 Beams
Step
8 Beams
Step
16 Beams
32 Beams
Step
1.7 Gain Configuration
The EZ-ARRAY provides two gain options for straight scan
applications: high excess gain and low contrast. The gain
method can be selected using the receiver push button, the
receiver remote teach wire, or the PC interface.
High (maximized) excess gain is suited for detecting opaque
objects and for reliable sensing in dirtier environments where
objects to be detected are 10 mm or larger. The high excess
gain method is always used in single- and double-edge scan.
The high excess gain option has a minimum blocked threshold
level, which provides reliable sensing at higher excess gain
levels.
The low-contrast setting is used for sensing semi-transparent
materials and for detecting objects as small as 5 mm (straight
scan only). In low-contrast operation, only a portion of a beam
must be blocked for detection to occur. In low-contrast operation,
the sensor sets an individual threshold for each optical channel
during the alignment process; this process equalizes the signal
strength to allow semi-transparent object detection.
When using the PC interface, low-contrast sensing provides
a fine-tune sensitivity setting of 15% to 50%. When using the
receiver interface, low-contrast sensitivity is always 30%.
Gain
Setting
Low
Contrast
High
Excess
Gain
* MODS: Minimum Object Detection Size
Figure 1-9. Effects of Gain selection on minimum object detection
Scan Method
Straight scan 5 mm 5 mm
Single-edge scan — —
Double-edge scan — —
Straight scan 10 mm 5 mm
Single-edge scan 10 mm 2.5 mm
Double-edge scan
size and sensing resolution
EZ-ARRAY
MODS*
Depends on
step size
EZ-ARRAY
Resolution
2.5 mm / edge
5 mm total
(both edges)
Banner Engineering Corp. •Minneapolis, U.S.A.
www.bannerengineering.com•Tel:763.544.3164
P/N 130426 Rev. C 7
Page 10
Overview
Last Beam Made (LBM)
First Beam Made (FBM)
Receiver
Emitter
Last Beam Blocked (LBB)
First Beam Blocked (FBB)
Receiver
Emitter
Total Beams Made (TBM)
Total Beams Blocked (TBB)
Receiver
Emitter
10
20
30
40
50
60
In Last Beam Blocked mode,
last beam is #55 of 60
In First Beam Blocked mode,
first beam is #20 of 60
In Last Beam Made mode,
last beam is #50 of 60
In First Beam Made mode,
first beam is #40 of 60
In Total Beams Made mode,
38 of 60 possible beams are
made
In Total Beams Blocked mode,
22 of 60 possible beams are
blocked
10
20
30
40
50
60
10
20
30
40
50
60
A-GAGE EZ-ARRAY
Instruction Manual
1.8 Electronic Alignment Routine
The objective of the optical alignment process is to adjust the
emitter light level to maximize sensor performance. Perform
the alignment procedure at installation and again whenever the
emitter and/or receiver is moved.
During the alignment procedure, the receiver polls each beam
channel to measure excess gain and performs a gain adjustment
for each beam. When the system exits the alignment procedure,
each channel’s signal strength is stored in non-volatile memory.
The procedure can be performed using the receiver remote wire,
the receiver interface or the PC interface (see Section 1.5, 4.2,
or 5.6). The receiver’s Alignment push button may be disabled,
using the PC interface.
1.9 Blanking
If a machine fixture or other equipment blocks one or more
sensing beams, the affected beam channels may be blanked.
The blanking option causes the receiver to ignore the status
of blanked beams for measurement mode calculations. For
example, if a machine fixture blocks one or more beams during
sensing, the output data will be incorrect; if the beams blocked
by the fixture are blanked, the output data will be correct.
Blanking may be configured using the receiver’s Alignment push
button, the receiver remote wire, or the PC interface.
“Beam Location” Modes
• First Beam Blocked (FBB): The location of the first blocked
beam.
• First Beam Made (FBM): The location of the first made
(unblocked) beam.
• Last Beam Blocked (LBB): The location of the last blocked
beam.
• Last Beam Made (LBM): The location of the last made beam.
• Middle Beam Blocked (MBB): The location of the beam midway
between the first and last blocked beams.
“Beam Total” Modes
• Total Beams Blocked (TBB): The total number of blocked
beams.
• Total Beams Made (TBM): The number of beams made.
Contiguous Beams Blocked (CBB): The largest number of
•
consecutively blocked beams.
Contiguous Beams Made (CBM): The largest number of
•
consecutively made beams.
For total beam values (TBB and TBM analysis modes), selection
of blanked beams affects the proportional analog outputs.
Blanked beams are ignored both in the number of blocked or
made beams and in the total number of beams. For example, if a
30-beam array has 10 blanked beams and 10 of the remaining 20
beams are blocked, the analog output values will be at mid-range.
1.10 Measurement Mode Selection
The outputs may be configured for any of fourteen measurement
(scan analysis) modes, which refer to specific beam locations,
quantities of beams, or edge transitions. Note that not all
measurement mode options are available when the receiver
interface is used for configuration. Selected modes are individually
assigned to each output (see Section 4.1 or 5.9 and 5.10).
When using the PC interface for configuration, the discrete
outputs can have NPN or PNP polarity (regardless of model), be
normally open or normally closed, and be assigned to any of the
measurement modes. When using the receiver interface, limited
output configuration combinations may be selected (Section 4.1).
NOTE: Array beams are numbered in sequence (beam 1 located
8 P/N 130426 Rev. C
nearest the sensor display; see Figure 1-3). The “first
beam” referenced in the following descriptions is the beam
nearest the sensor display.
Figure 1-10. Measurement mode examples
Banner Engineering Corp. •Minneapolis, U.S.A.
www.bannerengineering.com•Tel:763.544.3164
Page 11

A-GAGE EZ-ARRAY
Instruction Manual
Overview
• Transitions (TRN): The number of changes from blocked to
clear status and from clear to blocked status. (If beams 6-34
are blocked, then there is a clear-to-blocked transition from
beam 5 to beam 6, and a blocked-to-clear transition from
beam 34 to beam 35.) Transition mode can be used to count
objects within the array.
• Outside Dimension (OD): The inclusive distance (measured
in beams) from the first blocked beam to the last blocked
beam.
• Inside Dimension (ID): The number of made beams, between
the first and last blocked beams.
• Contiguous First Beam Blocked (CFBB): The location of
the first blocked beam in the largest group of adjacent blocked
beams.
• Contiguous Last Beam Blocked (CLBB): The location of
the last blocked beam in the largest group of adjacent blocked
beams.
• Carpet Nap and Carpet Edge: These measurement modes
are used to measure the location of carpet backing and tuft,
and are selectable only via the PC interface, and only when
the Scan Type “Carpet Nap” is selected. The modes can be
measured from either end of the sensor, but at least 10 beams
(2") must be blocked from one edge.
• Special: This mode is reserved for specialized applications;
contact the factory for information.
1.12 Discrete Output Configuration
Discrete Output 1; Receiver Interface
When the receiver interface is used for configuration, the
measurement mode assigned to discrete output 1 is the same
as that assigned to analog output 1. When the analog output
detects a target present, discrete output 1 conducts (normally
open).
Discrete Output 2; Receiver Interface
Discrete output 2 (only) has two options: alarm and
complementary (measurement) operation.
Alarm: Output 2 energizes when the receiver detects a sensor
error (such as a disconnected cable) or whenever the excess
gain of one or more beams becomes marginal.
Complementary (Measurement): Discrete output 2 operation
is complementary to discrete output 1 (when output 1 is ON,
output 2 is OFF, and vice versa).
Discrete Output 1 and 2 Configuration; PC Interface
When the PC interface is used for configuration, the discrete
outputs have more options: either discrete output can be
assigned to any of the measurement modes, high and low set
points can be added, the outputs can be inverted, and hysteresis
values can be set, as well as a scan number to smooth output
performance. Discrete output 2 can be assigned to alarm mode
via the PC interface also. See Section 5.9 for more information.
1.11 Analog Output Configuration
Analog output configuration assigns analog outputs 1 and 2 to
one of the measurement modes described in Section 1.10. When
the selected measurement mode involves first or last beam
blocked or made (unblocked), the assigned output will vary in
proportion to the beam number identified during a scan. When the
measurement mode involves total beams blocked or made, that
assigned output will vary in proportion to the total beams counted
during a scan.
Analog outputs may have Null and Span values set in the PC
interface, in addition to a filter setting (to smooth the output) and
Zero Value (to specify the output value when the measurement
mode value is zero). See Section 5.8 for more information.
1.13 Serial Communication
When the PC interface is used, the receiver communicates
with a process controller via a Modbus RTU-485 interface. The
PC interface software has a Communications Settings menu
that includes the selected sensor communications port, options
(either leave this field set at DPB1, or change it to No Echo
Suppression), and a read-only window that provides current
communications status. Advanced settings are also accessible,
including baud rate, timeout (in milliseconds), message delay (in
milliseconds), sensor address, parity, retry and byte delay. See
Section 5.10 and the Appendix for more information.
Banner Engineering Corp. •Minneapolis, U.S.A.
www.bannerengineering.com•Tel:763.544.3164
P/N 130426 Rev. C 9
Page 12
Components and Specifications
2. Components and Specifications
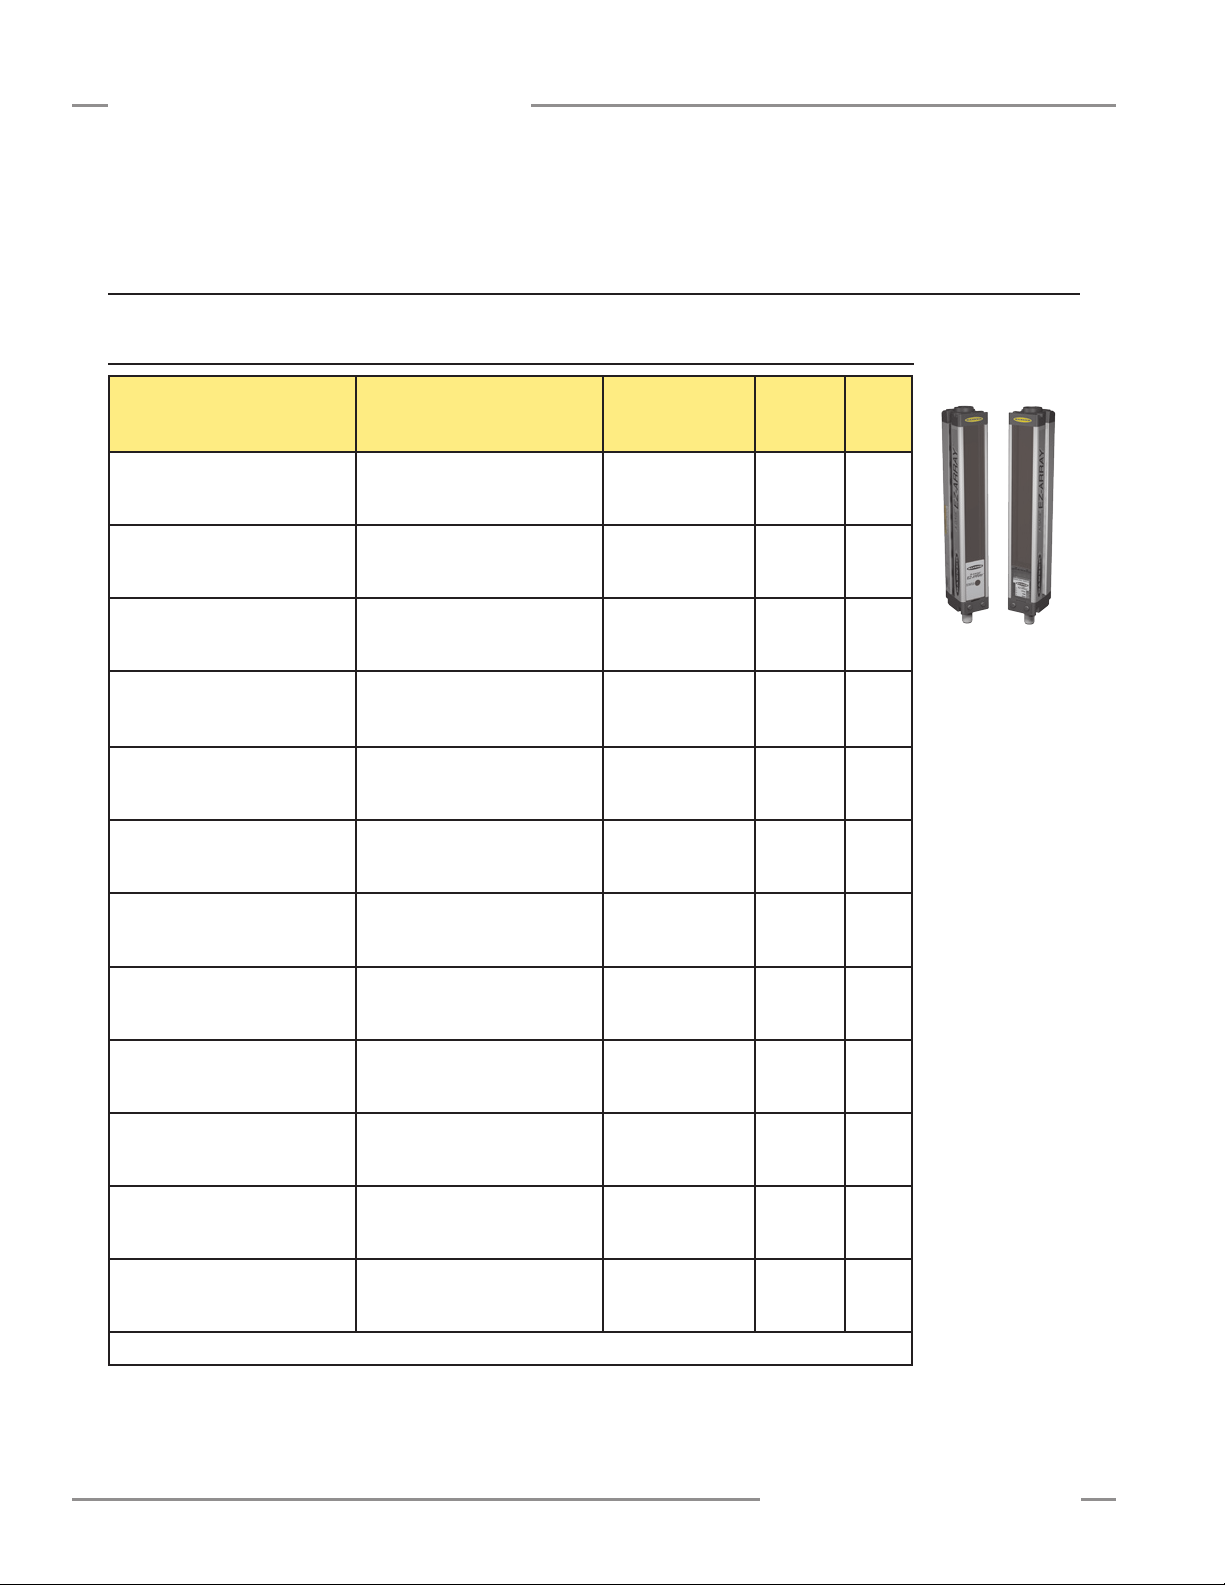
2.1 Sensor Models
A-GAGE EZ-ARRAY
Instruction Manual
Emitter/Receiver Model
NPN Outputs
EA5E150Q Emitter
EA5R150NIXMODQ Receiver
EA5R150NUXMODQ Receiver
EA5E300Q Emitter
EA5R300NIXMODQ Receiver
EA5R300NUXMODQ Receiver
EA5E450Q Emitter
EA5R450NIXMODQ Receiver
EA5R450NUXMODQ Receiver
EA5E600Q Emitter
EA5R600NIXMODQ Receiver
EA5R600NUXMODQ Receiver
EA5E750Q Emitter
EA5R750NIXMODQ Receiver
EA5R750NUXMODQ Receiver
EA5E900Q Emitter
EA5R900NIXMODQ Receiver
EA5R900NUXMODQ Receiver
EA5E1050Q Emitter
EA5R1050NIXMODQ Receiver
EA5R1050NUXMODQ Receiver
EA5E1200Q Emitter
EA5R1200NIXMODQ Receiver
EA5R1200NUXMODQ Receiver
EA5E1500Q Emitter
EA5R1500NIXMODQ Receiver
EA5R1500NUXMODQ Receiver
EA5E1800Q Emitter
EA5R1800NIXMODQ Receiver
EA5R1800NUXMODQ Receiver
EA5E2100Q Emitter
EA5R2100NIXMODQ Receiver
EA5R2100NUXMODQ Receiver
EA5E2400Q Emitter
EA5R2400NIXMODQ Receiver
EA5R2400NUXMODQ Receiver
* Models with array lengths 1050 mm and longer ship with a center bracket as well as two end-cap brackets.
Emitter/Receiver Model
PNP Outputs
EA5E150Q Emitter
EA5R150PIXMODQ Receiver
EA5R150PUXMODQ Receiver
EA5E300Q Emitter
EA5R300PIXMODQ Receiver
EA5R300PUXMODQ Receiver
EA5E450Q Emitter
EA5R450PIXMODQ Receiver
EA5R450PUXMODQ Receiver
EA5E600Q Emitter
EA5R600PIXMODQ Receiver
EA5R600PUXMODQ Receiver
EA5E750Q Emitter
EA5R750PIXMODQ Receiver
EA5R750PUXMODQ Receiver
EA5E900Q Emitter
EA5R900PIXMODQ Receiver
EA5R900PUXMODQ Receiver
EA5E1050Q Emitter
EA5R1050PIXMODQ Receiver
EA5R1050PUXMODQ Receiver
EA5E1200Q Emitter
EA5R1200PIXMODQ Receiver
EA5R1200PUXMODQ Receiver
EA5E1500Q Emitter
EA5R1500PIXMODQ Receiver
EA5R1500PUXMODQ Receiver
EA5E1800Q Emitter
EA5R1800PIXMODQ Receiver
EA5R1800PUXMODQ Receiver
EA5E2100Q Emitter
EA5R2100PIXMODQ Receiver
EA5R2100PUXMODQ Receiver
EA5E2400Q Emitter
EA5R2400PIXMODQ Receiver
EA5R2400PUXMODQ Receiver
Analog Output
–
Current (4–20 mA)
Voltage (0–10V)
–
Current (4–20 mA)
Voltage (0–10V)
–
Current (4–20 mA)
Voltage (0–10V)
–
Current (4–20 mA)
Voltage (0–10V)
–
Current (4–20 mA)
Voltage (0–10V)
–
Current (4–20 mA)
Voltage (0–10V)
–
Current (4–20 mA)
Voltage (0–10V)
–
Current (4–20 mA)
Voltage (0–10V)
–
Current (4–20 mA)
Voltage (0–10V)
–
Current (4–20 mA)
Voltage (0–10V)
–
Current (4–20 mA)
Voltage (0–10V)
–
Current (4–20 mA)
Voltage (0–10V)
Array
Length
Y*
150 mm
(5.9")
300 mm
(11.8")
450 mm
(17.7")
600 mm
(23.6")
750 mm
(29.5")
900 mm
(35.4")
1050 mm
(41.3")*
1200 mm
(47.2")*
1500 mm
(59.1")*
1800 mm
(70.9")*
2100 mm
(82.7")*
2400 mm
(94.5")*
Total
Beams
30
60
90
120
150
180
210
240
300
360
420
480
Emitter
Receiver
10 P/N 130426 Rev. C
Banner Engineering Corp. •Minneapolis, U.S.A.
www.bannerengineering.com•Tel:763.544.3164
Page 13
A-GAGE EZ-ARRAY
22.5 mm
(0.88")
72.5 mm
(2.85 ")
70.0 mm
(2.75")
82.0 mm
(3.23")
77.5 mm
(3.05")
White
Brown
Blue
Gray
Black
Green
Yellow
Gray
Red
Brown
White
Blue
Pink
Ø15.0 mm
(0.59")
M12X1
48.5 mm
(1.91")
M12X1
Ø14.5 mm
(0.57")
40.0 mm
(1.57")
31.8 mm
(1.25")
31 mm
(1.22")
M12X1
Ø13.5 mm
(0.53")
Instruction Manual
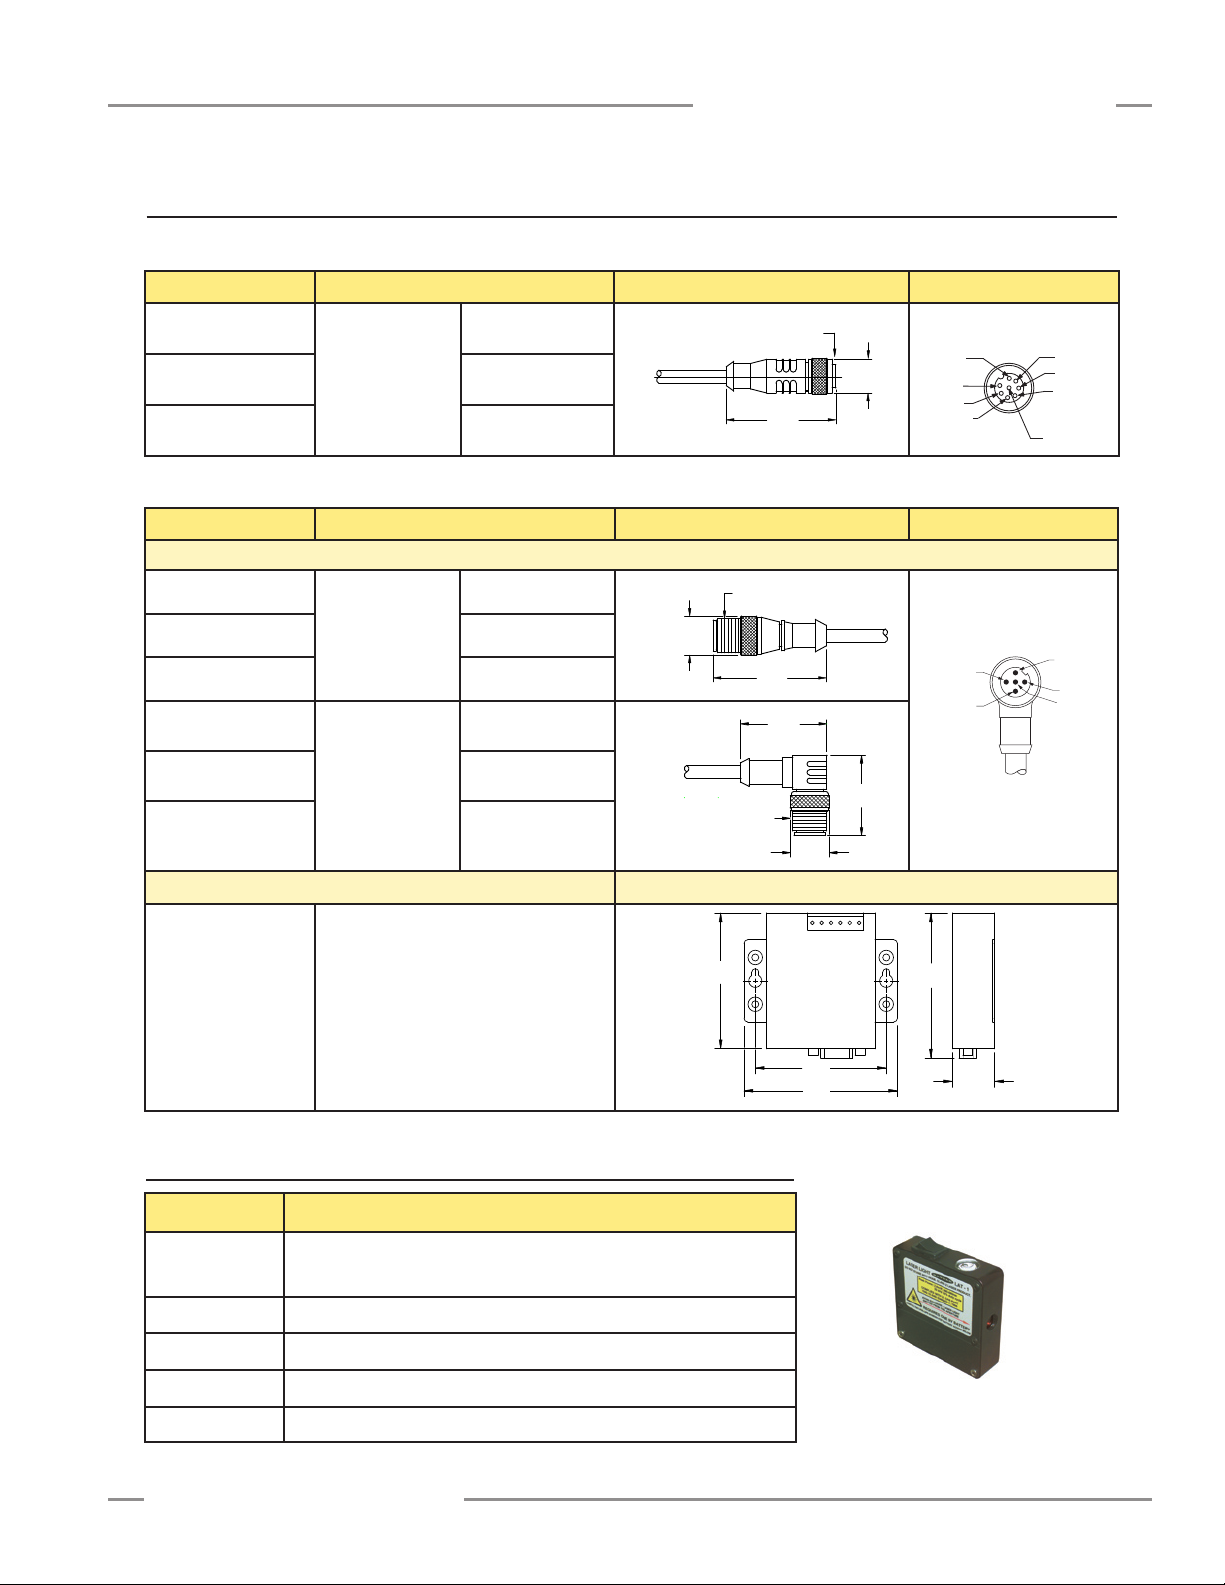
2.2 Cordsets and Connections
Quick-Disconnect Sensor Cordsets
Model Description Pinout
MAQDC-815
Straight female
MAQDC-830
MAQDC-850
Communication Connections
Model Description Pinout
Communications Cables
MQDMC-506
MQDMC-515
MQDMC-530
connector,
8-pin Euro-style
Straight male
connector, 5-pin
Euro-style
5 m (15') long
9 m (30') long
15 m (50') long
2 m (6.5') long
5 m (15') long
9 m (30') long
Components and Specifications
Female Connector Shown
Male Connector Shown
MQDMC-506RA
MQDMC-515RA
Right-angle male
connector, 5-pin
2 m (6.5') long
5 m (15') long
Euro-style
MQDMC-530RA
9 m (30') long
USB Serial Adapter Dimensions
INTUSB485-1
For connection of 5-pin communications
cable to computer USB port
2.3 Alignment Aids
Model Description
LAT-1-SS
Self-contained visible-beam laser tool for aligning any EZ-ARRAY emitter/
receiver pair. Includes retroreflective target material and mounting clip.
EZA-LAT-SS Replacement adaptor (clip) hardware for EZ-ARRAY models
EZA-LAT-2 Clip-on retroreflective LAT target
BRT-THG-2-100 2" retroreflective tape, 100'
BT-1 Beam Tracker
Banner Engineering Corp. •Minneapolis, U.S.A.
www.bannerengineering.com•Tel:763.544.3164
LAT-1-SS
P/N 130426 Rev. C 11
Page 14
Components and Specifications
50.0 mm
(1.97")
58.2 mm
(2.29")
39.2 mm
(1.54")
4.2 mm
(0.17")
44.4 mm
(1.75")
20 mm
(0.79")
40 mm
(1.57")
C
L
(4) M10 Bolt
Pole
40 mm
(1.58") Square
Usable
Stand
Height
Base
6.4 mm (0.25")
120.6 mm (4.75")
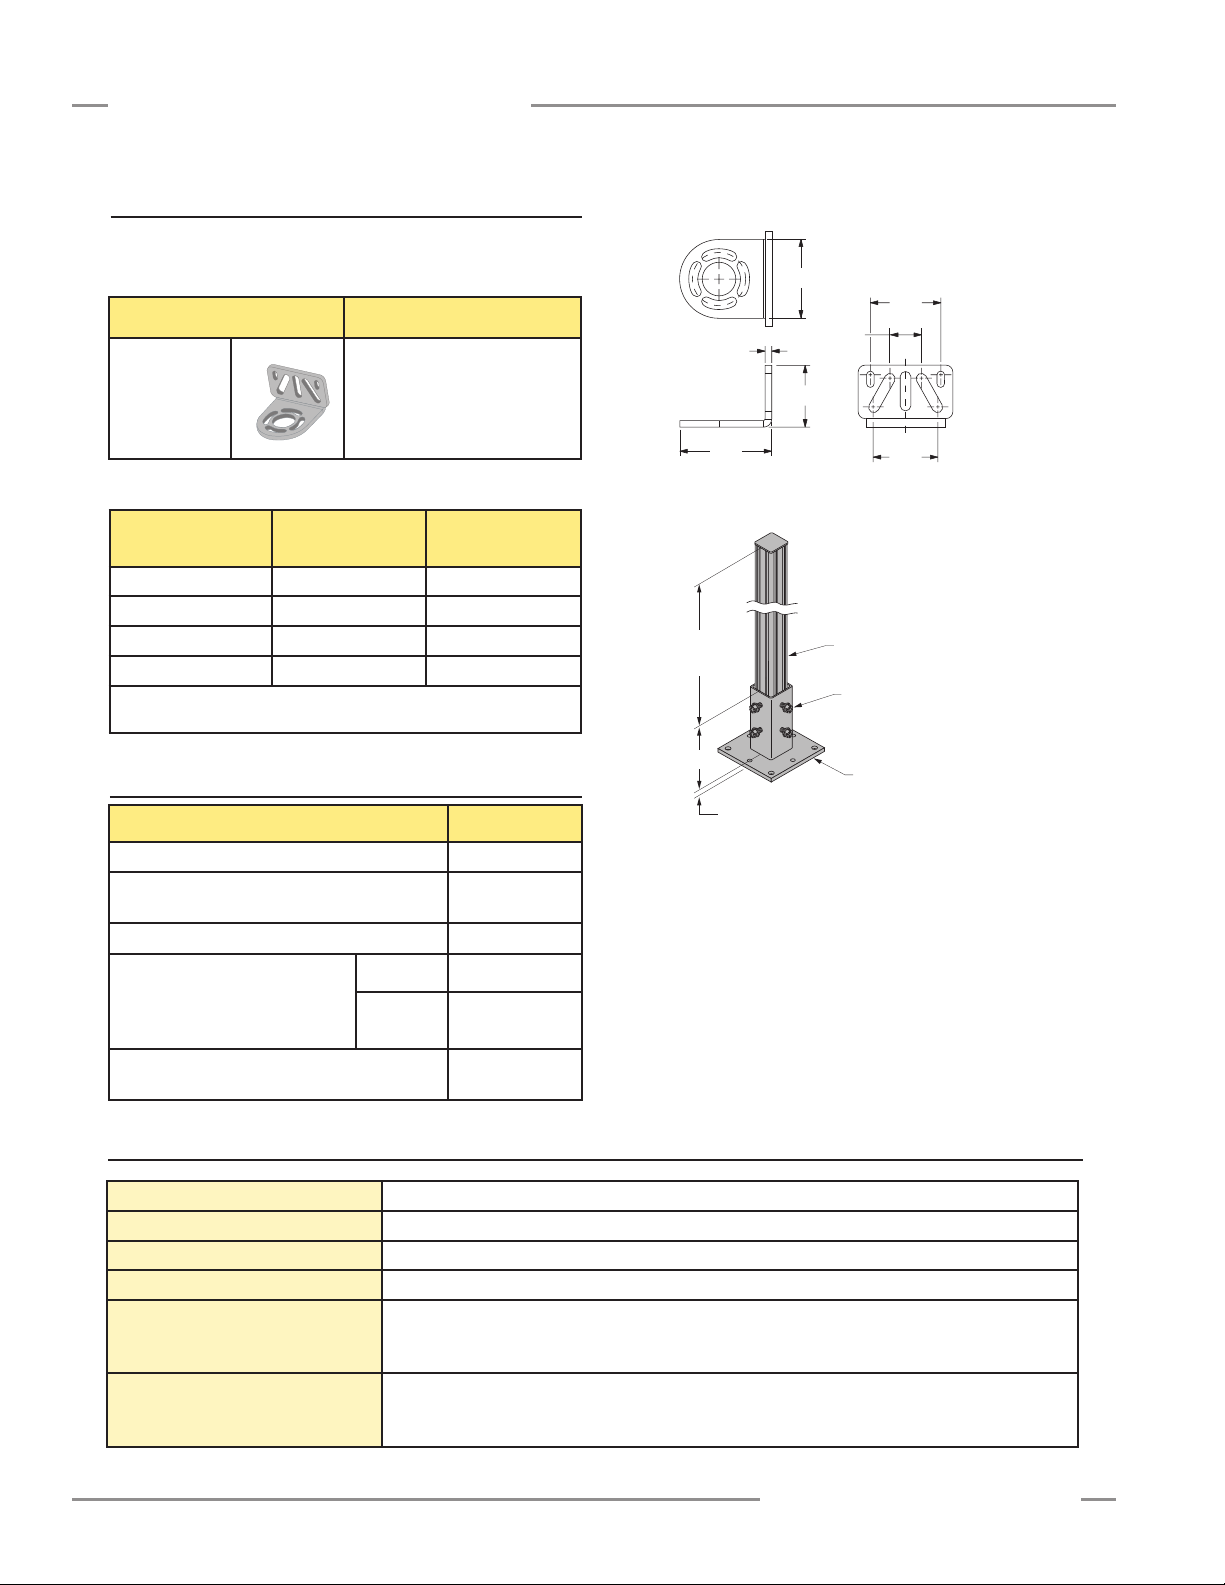
2.4 Accessory Mounting Brackets and Stands
See Section 2.5 for standard brackets. Order one EZA-MBK-20
bracket per sensor, two per pair.
Model Description
Universal adaptor bracket pair
EZA-MBK-20
for mounting to engineered /
slotted aluminum framing
™
(e.g., 80/20
, Unistrut™).
A-GAGE EZ-ARRAY
Instruction Manual
EZA-MBK-20
MSA Series Stands (Base Included)*
Stand
Model
MSA-S24-1
MSA-S42-1
MSA-S66-1
MSA-S84-1
* Available without a base by adding suffix “NB” to the model number, e.g.,
MSA-S24-1NB.
Useable Stand
Height
Overall Stand
Height
483 mm (19") 610 mm (24")
940 mm (37") 1067 mm (42")
1549 mm (61") 1676 mm (66")
2007 mm (79") 2134 mm (84")
2.5 Replacement Parts
Description Model
Access cover with label – receiver EA5-ADR-1
Access cover security plate (includes 2 screws,
wrench)
Wrench, security EZA-HK-1
Standard bracket kit with
Black EZA-MBK-11
hardware (includes 2 end
brackets and hardware to mount
to MSA Series stands)
Stainless
Steel
Center bracket kit (includes 1 bracket and
hardware to mount to MSA Series stands)
EZA-TP-1
EZA-MBK-11N
EZA-MBK-12
NOTE: Standard brackets shipped with sensors connect directly to
MSA series stands, using hardware included with the stands.
2.6 Specifications
Emitter/Receiver Range
Field of View
Beam Spacing
Light Source
Minimum Object Detection Size
Sensor Positional Resolution
12 P/N 130426 Rev. C
400 mm to 4 m (16" to 13')
Nominally ± 3°
5 mm (0.2")
Infrared LED
Straight Scan, Low-Contrast: 5 mm (0.2")
Straight Scan, High-Excess-Gain: 10 mm (0.4")
See Figure 1-5 for other scan mode values; size is tested using a rod.
Straight Scan: 5 mm (0.2")
Double-Edge Scan: 2.5 mm (0.1")
Single-Edge Scan: 2.5 mm (0.1")
Banner Engineering Corp. •Minneapolis, U.S.A.
www.bannerengineering.com•Tel:763.544.3164
Page 15
A-GAGE EZ-ARRAY
Instruction Manual
2.6 Specifications, continued
Components and Specifications
Supply Voltage (Limit Values)
Supply Power Requirements
Teach Input (Receiver Gray Wire)
Two Discrete Outputs
Two Analog Outputs
Serial Communication Interface
(also see Appendix A)
Scan Time
Status Indicators
(also see Section 1.4)
Emitter: 12 to 30V dc
Receiver Analog Current Models: 12 to 30V dc
Receiver Analog Voltage Models: 15 to 30V dc
Emitter/Receiver Pair (Exclusive of Discrete Load): Less than 9 watts
Power-up delay: 2 seconds
Low: 0 to 2 volts
High: 6 to 30 volts or open (input impedance 22 K ohms)
Solid-State NPN or PNP (current sinking or sourcing)
Rating: 100 mA maximum each output
OFF-State Leakage Current:
ON-State Saturation Voltage:
Protected against false pulse on power-up and continuous overload or short circuit.
Voltage Sourcing: 0 to 10V (maximum current load of 5 mA)
Current Sourcing: 4 to 20 mA (maximum resistance load = (V
EIA-485 Modbus RTU (up to 15 nodes per communication ring)
RTU binary format
Baud Rate: 9600, 19.2K or 38.4K
8 Data Bits, 1 Stop Bit, and Even, Odd, or 2 Stop Bits and No Parity
Scan times depend on scan mode and sensor length. Straight scan times range from 2.8 to 26.5 ms.
See Figure 1-8 for all combinations.
Emitter:
R ed Status LED
ON Red — Status OK
Flashing at 1 hz — Error
NPN: less than 200 uA @ 30V dc
PNP: less than 10 uA @ 30V dc
NPN: less than 1.6V @ 100 mA
PNP: less than 2.0V @ 100 mA
−3) / 0.020)
supply
Receiver:
7 Zone Indicators
Red — Blocked channels within zone
Green — All channels clear within zone
3- digit 7-segment measurement mode / diagnostic indicator
Se nsor Status Bi-Color Indicator LED
Red — Hardware Error or Marginal Alignment
Green — OK
Modbus Activity Indicator LED: Yellow
Modbus Error Indicator LED: Red
System Configuration
(Receiver Interface)
System Configuration
(PC interface)
Connections
Construction
Environmental Rating
Operating Conditions
Certifications
Banner Engineering Corp. •Minneapolis, U.S.A.
www.bannerengineering.com•Tel:763.544.3164
6-position DIP switch: Used to set scanning type, measurement modes, analog slope, and discrete
output 2 function (see Section 4.1).
Push Buttons: Two momentary push buttons for alignment and gain level selection.
Supplied software provides all configuration options of receiver interface, plus additional functionality;
see Sections 1 and 5.
Serial communication: The receiver uses a PVC-jacketed, 5-conductor 22-gauge quick-disconnect
cable, 5.4 mm diameter; see Sections 2.2 and 5.2.
Other Sensor connections: 8-conductor quick-disconnect cables (one each for emitter and receiver),
ordered separately; see Section 2.2 for available lengths (may not exceed 75 meters long), PVCjacketed cables measure 5.8 mm diameter, have shield wire; 22-gauge conductors.
Aluminum housing with clear-anodized finish; acrylic lens cover
IEC IP65
Temperature: −40° to +70° C (−40° to 158° F)
Maximum relative humidity: 95% at 50° C (non-condensing)
P/N 130426 Rev. C 13
Page 16

Components and Specifications
Y
L1
L2
L3
65 mm
(2.6")
R13 mm (0.5")
minimum bend
45.2 mm
(1.78")
56.0 mm
(2.20")
4.2 mm
(0.17")
36.0 mm
(1.42")
12 mm
(0.47")
2.7 Emitter and Receiver Dimensions
A-GAGE EZ-ARRAY
Instruction Manual
With mounting bracket flanges “in”With mounting bracket flanges “out”
Emitter or Receiver
EA5..150..
EA5..300..
EA5..450..
EA5..600..
EA5..750..
EA5..900..
EA5..1050..
EA5..1200..
EA5..1500..
EA5..1800..
EA5..2100..
EA5..2400..
†
Nominal measurement
14 P/N 130426 Rev. C
Model
Housing Length
L1
227 mm (8.9") 260 mm (10.2") 199 mm (7.8") 150 mm (5.9")
379 mm (14.9") 412 mm (16.2") 351 mm (13.8") 300 mm (11.8")
529 mm (20.8") 562 mm (22.1") 501 mm (19.7") 450 mm (17.7")
678 mm (26.7") 704 mm (27.7") 650 mm (25.6") 600 mm (23.6")
828 mm (32.6") 861 mm (33.9") 800 mm (31.5") 750 mm (29.5")
978 mm (38.5") 1011 mm (39.8") 950 mm (37.4") 900 mm (35.4")
1128 mm (44.4") 1161 mm (45.7") 1100 mm (43.3") 1050 mm (41.3")
1278 mm (50.3") 1311 mm (51.6") 1250 mm (49.2") 1200 mm (47.2")
1578 mm (62.1") 1611 mm (63.4") 1550 mm (61.0") 1500 mm (59.1")
1878 mm (73.9") 1911 mm (75.2") 1850 mm (72.8") 1800 mm (70.9")
2178 mm (85.7") 2211 mm (87.0") 2150 mm (84.6") 2100 mm (82.7")
2478 mm (97.6") 2511 mm (98.9") 2450 mm (96.4") 2400 mm (94.5")
Distance Between Bracket Holes
L2 L3
Defined Area
Y
Banner Engineering Corp. •Minneapolis, U.S.A.
www.bannerengineering.com•Tel:763.544.3164
†
Page 17

A-GAGE EZ-ARRAY
50 mm
(1.96")
25 mm
(0.98")
4.2 mm
(0.17")
63.2 mm
(2.49")
Ø 21.5 mm
(0.85")
4 x 5.8 mm (0.23")
wide slots
4 x R 19.4 mm
(0.76")
38.2 mm
(1.50")
Ø 33 mm
(1.30")
4 x 45
20 mm
(0.79")
2 x R 5 mm
(0.20")
2 x 5 mm
(0.20")
2 x 15 mm
(0.59")
2 x 7 mm
(0.28")
20 mm
(0.79")
20 mm
(0.79")
Ø 60 mm
20 mm
(0.79")
17.5 mm
(0.69")
55 mm
(2.17")
50 mm
(1.97")
4.2 mm
(0.17")
55.6 mm
(2.19")
15 mm
(0.59")
20.0 mm
(0.79")
10 mm
(0.39")
9.5 mm
(0.37")
36 mm
(1.42")
Ø 8.3 mm
(0.33")
Ø 7 mm
(0.28")
Instruction Manual
2.8 Standard Bracket Dimensions
Components and Specifications
End Cap Brackets
(model EZA-MBK-11*)
* Dimensions are identical for model EZA-MBK-11N
stainless steel brackets.
Center Bracket
(model EZA-MBK-12**)
** Supplied with emitters
and receivers over 1050 mm.
Banner Engineering Corp. •Minneapolis, U.S.A.
www.bannerengineering.com•Tel:763.544.3164
P/N 130426 Rev. C 15
Page 18

Installation
3. Installation and Alignment
A-GAGE EZ-ARRAY
Instruction Manual
3.1 Mounting the Emitter and Receiver
Compact EZ-ARRAY emitters and receivers are easy to handle
during mounting. When mounted to the sensor end caps, the
supplied mounting brackets allow ±30° rotation. An emitter may
be separated from 400 mm to 4 m (16" to 13') from its receiver.
From a common point of reference, make measurements to
locate the emitter and receiver in the same plane, with their
midpoints and display ends directly opposite each other. (If
sensors are mounted with their display ends at the top, see
Section 1.5 or 5.8 for directions on inverting the 3-digit display.)
Mount the brackets to the emitter and receiver housings using
the supplied M6 bolts and Keps nuts, or user-supplied hardware;
see Figure 3-1.
EZ-ARRAY End-Cap Brackets
(supplied with each emitter and receiver)
End-Mounted
Side-Mounted
(two center brackets may
be substituted)
Center mounting brackets must be used with longer sensors,
if they are subject to shock or vibration. In such situations,
the sensors are designed to be mounted with up to 900 mm
unsupported distance (between brackets). Sensors 1050 mm and
longer are supplied with a center bracket to be used as needed
with the standard end-cap brackets.
1. Attach the center bracket to the mounting surface when
mounting the end-cap brackets.
2 Attach the clamp to both slots of the housing, using the
included M5 screws and T-nuts.
3. After the sensor is mounted to the end-cap brackets, attach
the clamp to the center bracket using the supplied M5 screw.
Swivel Center Bracket
(supplied with emitters and receivers 1050 mm and longer)
Sensors are designed to be
mounted with up to 900 mm
unsupported distance between
brackets.
Bracket
Clamp
NOTE: Sensor brackets are designed to mount directly to accessory MSA series stands (Section 2.3), using hardware supplied with
the stands.
Figure 3-1. A-GAGE EZ-ARRAY emitter and receiver mounting hardware
Banner Engineering Corp. •Minneapolis, U.S.A.
16 P/N 130426 Rev. C
www.bannerengineering.com•Tel:763.544.3164
Page 19

A-GAGE EZ-ARRAY
Level Surface
Level Surface
XX
AB
Emitter Receiver
level level
level
level
Y Y
Z
Z
XX
Instruction Manual
3.2 Mechanical Alignment
Mount the emitter and receiver in their brackets and position the
windows of the two units directly facing each other. Measure
from one or more reference planes (e.g., the building floor) to
the same point(s) on the emitter and receiver to verify their
mechanical alignment. Use a carpenter’s level, a plumb bob,
or the optional LAT-1-SS Laser Alignment Tool, or check the
diagonal distances between the sensors, to achieve mechanical
alignment.
When alignment is difficult, a LAT-1-SS tool is useful to assist
or confirm alignment by providing a visible red dot along the
sensor’s optical axis (see Figure 3-3). Snap the LAT-1 clip onto
the sensor housing, turn on its laser emitter, and use a strip of
retroreflective tape at the opposite sensor to see the dot.
Installation
Also check “by eye” for line-of-sight alignment. Make any
necessary final mechanical adjustments, and hand-tighten the
bracket hardware. See Sections 3.4 and 4.2 for further alignment
information.
Verify that:
•Theemitterandreceiveraredirectlyoppositeeachother,and
nothing is interrupting the beams.
•Thesensingareaisthesamedistancefromacommon
reference plane for each sensor.
•Theemitterandreceiverareinthesameplaneandare
level/plumb and square to each other (vertical, horizontal,
or inclined at the same angle, and not tilted front-to-back or
side-to-side).
Figure 3-3. Optical alignment using the LAT-1-SS
Angled or Horizontal Installations – verify that:
•DistanceXattheemitterandreceiverareequal.
•DistanceYattheemitterandreceiverareequal.
•DistanceZattheemitterandreceiverareequalfromparallel
surfaces.
•Verticalface(i.e.,thelens)islevel/plumb.
•Sensingareaissquare.Checkdiagonalmeasurementsifpossible;
see Vertical Installations, at right.
Figure 3-2. Sensor mounting, mechanical alignment
Banner Engineering Corp. •Minneapolis, U.S.A.
www.bannerengineering.com•Tel:763.544.3164
Vertical Installations – verify that:
•DistanceXattheemitterandreceiverareequal.
•Bothsensorsarelevel/plumb(checkboththe
side and face).
•Sensingareaissquare.Verifydiagonalmeasurementsif
possible (Diagonal A = Diagonal B).
P/N 130426 Rev. C 17
Page 20

Installation
wh wh
ye
ye
gn
gn
rd
rd
gy
0-2V dc
gy
bare bare
pk
bu
bn
pk
bu
bn
Sync
Power Supply V+
10-30V dc
Power
Power Supply V-
Sync
Power Supply V+
Power Supply V-
V Out 1
V Out 2
Out 1
Out 2
Teach
Shield Shield
Receiver Emitter
Load
Load
+–
+
–
+
–
Receiver Emitter
wh wh
ye
ye
gn
gn
rd
rd
gy
0-2V dc
gy
bare bare
pk
bu
bn
pk
bu
bn
Sync
Power Supply V+
Power Supply V-
Sync
Power Supply V+
Power Supply V-
V Out 1
V Out 2
Out 1
Out 2
Teach
Shield Shield
Load
Load
+
–
+
–
10-30V dc
Power
+–
Modbus
white
black
blue
D1/B/+
D0/A/–
common
brown
gray
White
Brown
Blue
Gray
Black
3.3 Hookups
Refer to Figures 3-4, 3-5, and 3-6 for the appropriate hookup
information.
Serial Connection
This connection is used only when the PC interface is also used.
The receiver has a Modbus RTU-485 serial interface. A separate
5-pin Euro-style connection is provided at the end opposite from
the power cable connection to electrically connect the serial
communication cable to an external PC or PLC. Refer to Figure
3-4; the white wire is connected to the Modbus D1/B/ + terminal
and the black wire is connected to the D0/A/ − terminal.
A-GAGE EZ-ARRAY
Instruction Manual
Male Connector Pinout
White: D1 / B / +
Black: D0 / A / –
Blue: Common
Inputs
Refer to Figures 3-5 and 3-6 for standard hookup information.
Receiver gray wire: The receiver has an input that can be used
as a gate input or for remote teach. To initiate remote teach,
alignment, and gating functions, tie the wire through a switch to
sensor common. See Sections 1.7 and 5.7 for more information.
Outputs
Refer to Figures 3-5 and 3-6 for standard hookup information
and Section 2.6 Sensor Specifications for further electrical
requirements.
Analog white and yellow wires: The receiver has two analog
outputs. Depending on receiver model, both outputs are either
voltage or current. The white wire is referenced as analog output
1; the yellow wire is referenced as analog output 2. Both analog
current and voltage will source current through an external load
to sensor common.
Discrete Outputs: The receiver has two discrete outputs;
the green wire is referenced as discrete #1, and the red wire,
discrete #2. Depending on model, both outputs are either NPN
or PNP, unless the polarity is altered via the PC interface. Refer
to Section 2.6 Specifications for further electrical requirements.
Sync (Pink) Wire
The emitter and receiver are electrically synchronized via the
pink wire. The emitter and receiver pink wires must only be
electrically connected together.
Figure 3-4. Serial communication hookup
Figure 3-5. NPN hookup
18 P/N 130426 Rev. C
Figure 3-6. PNP hookup
Banner Engineering Corp. •Minneapolis, U.S.A.
www.bannerengineering.com•Tel:763.544.3164
Page 21
A-GAGE EZ-ARRAY
Straightedge
Straightedge
a)
b)
c)
d)
Instruction Manual
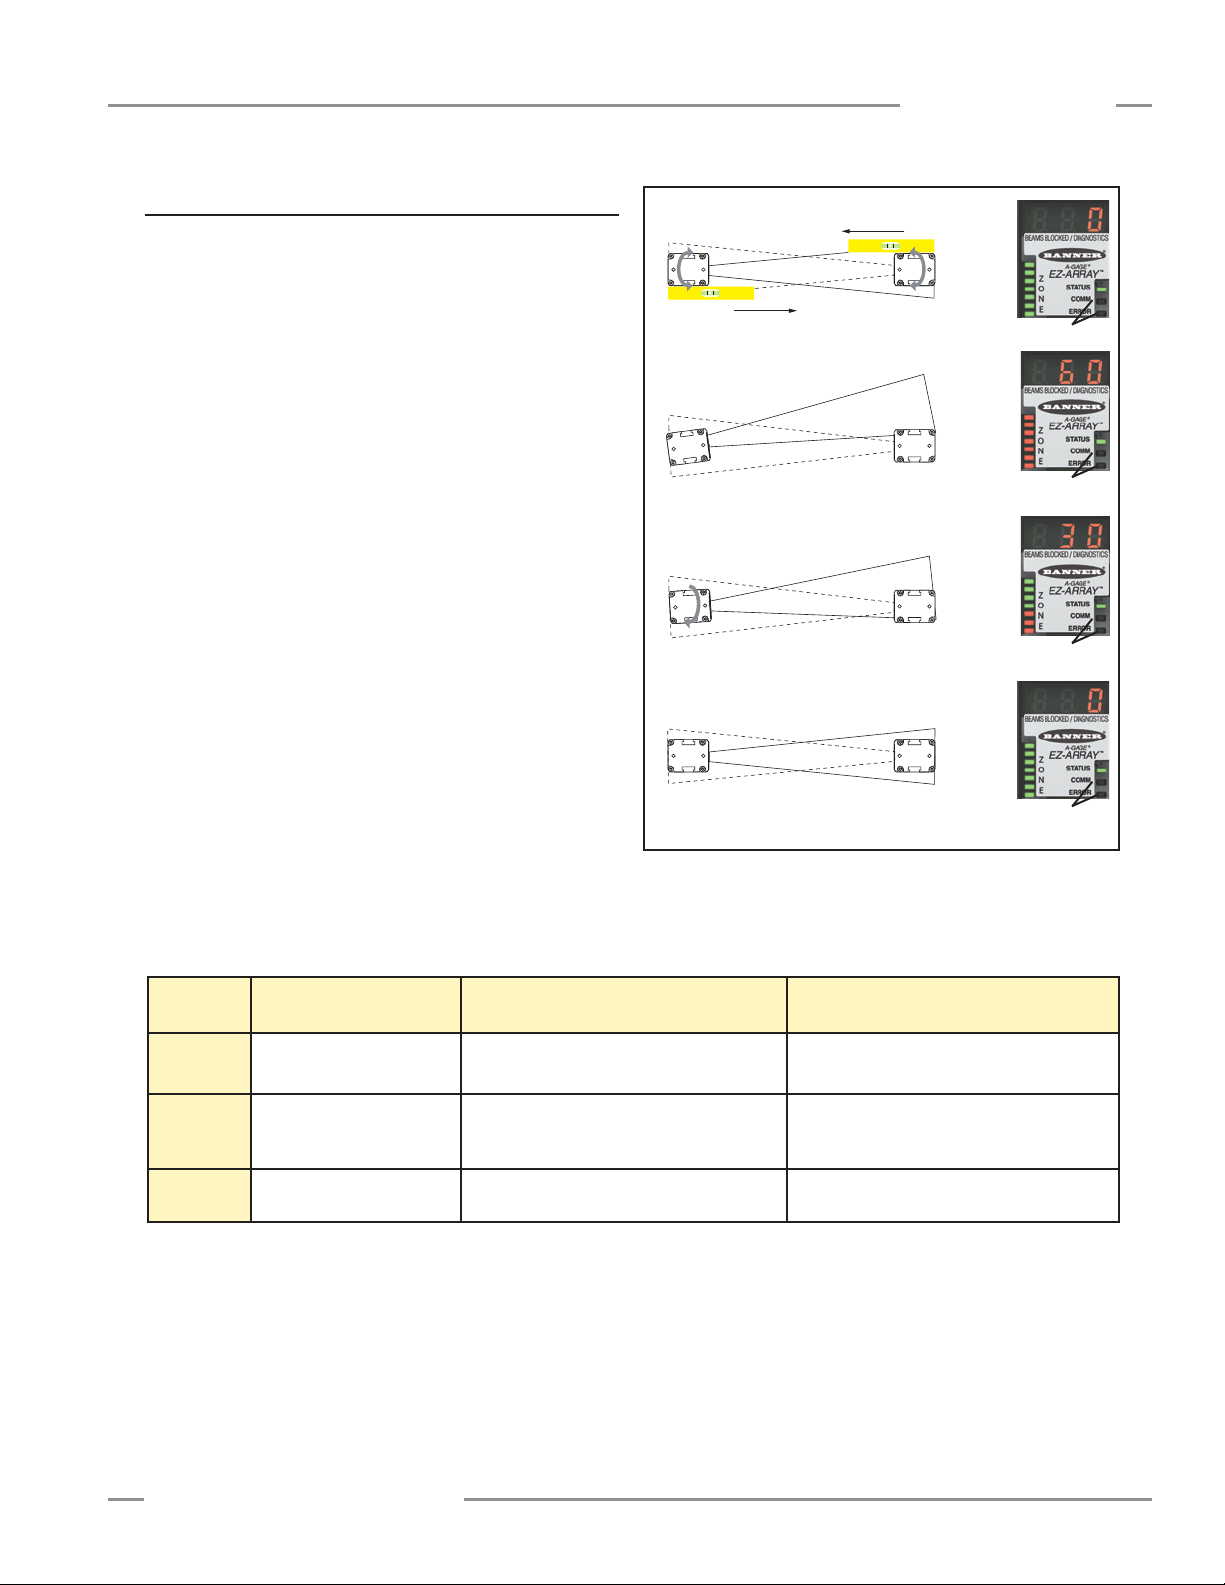
3.4 Optical Alignment
After the electrical connections are made, power up the emitter
and receiver. Verify that input power is present to both emitter
and receiver; the emitter Status indicator and the receiver Status
LED should be ON green. If the receiver Status LED is on red
(and a “c” appears on the 3-digit display), refer to Section 4.5.
NOTE: At power-up, all Zone indicators are tested (flash
red), then the number of blocked beams is displayed.
Observe the receiver indicators (see table below).
0 beams blocked; all Zone indicators ON Green
Installation
OFF
Optimize Alignment and Maximize Excess Gain
Verify that the emitter and receiver are pointed squarely at
60 beams blocked; all Zone indicators ON Red
OFF
each other. A straightedge (e.g., a level) can help determine the
direction the sensor is facing (see Figure 3-7).
Slightly loosen the sensor mounting screws and rotate one
sensor to the left and right, noting the positions where the
receiver Zone indicators turn from green to red; repeat with the
other sensor. Center each sensor between the noted positions
30 beams blocked; 4 Zone indicators ON Green, 3 ON Red
OFF
and tighten the end cap mounting screws, making sure to
maintain the positioning. The sensor windows should directly
face each other.
Once optimum optical alignment is verified, proceed to
configuration, via the remote teach wire, the receiver interface,
or the PC interface (Section 1.5, 4.2, or 5.3) and complete the
0 beams blocked; all Zone indicators ON Green
OFF
electronic alignment. This further alignment step adjusts the
emitted light level of each beam for the application, to maximize
Figure 3-7. Optimizing optical alignment; 300 mm model shown
sensing performance.
Possible Indicator Combinations
Zone
Indicators
Either Clear or Blanked
All ON Green Some ON Red (zones with blocked beams)
Some ON Green (zones with all clear beams)
All Beams
Some Beams
Blocked or Mis-Aligned
Out of Alignment
All ON Red
(Some beams blocked in each zone)
Receiver
ON Green ON Green ON Green
Status
Indicator
3-Digit
Display
Banner Engineering Corp. •Minneapolis, U.S.A.
www.bannerengineering.com•Tel:763.544.3164
0
(Number of blocked beams)
Number of blocked beams Total number of beams in the array
P/N 130426 Rev. C 19
Page 22

Receiver Interface
4. Using the Receiver User Interface
A-GAGE EZ-ARRAY
Instruction Manual
The receiver user interface comprises the six-position DIP
switch, two push buttons, 3-digit display, and other indicators
present on the receiver (see Section 1.4 for more complete
status indicator information). The receiver interface enables
configuration of standardized combinations of the EZ-ARRAY
sensing options (output configuration, scanning methods and
modes); for more advanced setup, refer to Section 5 for PC
interface configuration instructions.
4.1 Configuration DIP Switch
The DIP switch can be used to configure the sensor. Access the
switch by removing the screw-on security plate and lifting the
clear hinged access cover. The access cover may be removed
entirely (pull straight out to remove, press back in to replace) for
easier access during configuration.
Some of the switches are assigned their own functions, others
work together in combination (see table). Switches S1 and S2
in combination select one of four scanning modes. Switches S3
and S4 in combination select one of four measurement mode
pairs (one for each analog output). Switch S5 defines the analog
slope setting for both analog outputs and S6 defines whether
discrete output 2 is complementary to discrete 1, or functions as
an alarm (when configuration is accomplished via DIP switch,
discrete output 1 conducts when analog output 1 senses the
presence of a target).
EZ-ARRAY Receiver User Interface DIP Switch Settings
Switch Settings* Result
S1 S2 Scan Mode
ON ON Straight Scan
ON OFF Double-Edge, Step 1
OFF ON Double-Edge, Step 4
OFF OFF Single-Edge
S3 S4
ON ON TBB FBB
ON OFF LBB MBB
OFF ON OD ID
OFF OFF CBB CFBB
S5 ON
S5 OFF
S6 ON
S6 OFF
*Underlined settings are factory defaults
Analog 1
(Value reads on 3-digit display)
Positive Analog Slope
Negative Analog Slope
Discrete 2 Complementary
Discrete 2 Alarm
Analog 2
Scanning Modes (S1 and S2)
Straight Scan (S1 ON, S2 ON) is the most versatile scanning
mode and can be used without the exceptions noted in the
other scanning modes. Use this scanning mode when using
the low-contrast sensitivity setting to measure semi-transparent
materials.
To open access
cover, insert a
small flat-blade
screwdriver, press
up, and pull
Figure 4-1. Receiver user interface. NOTE: All DIP switch positions
are shown in the ON condition.
20 P/N 130426 Rev. C
Double-Edge Step 1 (S1 ON, S2 OFF) can be used when
three or fewer opaque objects are presented to the light curtain
at one time. The advantage of this mode is improved sensor
edge resolution (2.5 mm). The minimum object detection size is
10 mm.
Double-Edge Step 4 (S1 OFF, S2 ON) can be used when three
or fewer opaque objects are presented to the light curtain and
the minimum size object to be detected is 30 mm. This scanning
mode ignores objects smaller than 30 mm. Like Double-Edge
Step 1, the sensor edge resolution is 2.5 mm. See Figure 1-8 for
sensor scan times.
Single-Edge Scan (S1 OFF, S2 OFF) can be used when a
single opaque object is presented to the light curtain at one time.
The object must block the “bottom” channel (the channel closest
to the receiver display). Like the double-edge scans, the sensor
edge resolution is 2.5 mm. The minimum object detection size is
10 mm. See Figure 1-8 for sensor scan times.
Banner Engineering Corp. •Minneapolis, U.S.A.
www.bannerengineering.com•Tel:763.544.3164
Page 23

A-GAGE EZ-ARRAY
Instruction Manual
Receiver Interface
Because single-edge scan is capable only of measuring the
height of an opaque object that blocks the bottom channel
and all channels up to the height of the object, the pertinent
measurement modes are LBB (last beam blocked) or TBB
(total beams blocked). When single-edge scan is selected, the
selected measurement mode will be applied to both analog
outputs. Selection of OD/ID with single-edge scan will result in
an error code.
Measurement Modes (S3 and S4)
The measurement modes, determined by switches S3 and S4
in combination, define what information is calculated by the
sensor and sent via the analog outputs. See Section 1.10 for
measurement mode definitions. Discrete output 1 will conduct
when analog output 1 detects a target. (If single-edge scan is
selected, select measurement mode LBB or TBB.)
During normal operation, the 3-digit diagnostic display reads out
the numerical value of the specified measuring mode for analog
output 1.
Analog Slope (S5)
Switch S5 defines the analog output slope. As the measurement
mode values increase, the analog output voltage can either
increase (positive slope, S5 ON) or decrease (negative slope, S5
OFF). Switch S5 applies the same slope to both analog outputs.
Complementary / Alarm (S6)
Switch S6 defines the operation of discrete output 2. When the
receiver user interface is used, discrete output 1 is active when
an object is detected by the sensor (normally open operation).
In complementary mode (S6 ON), output 2 will always be in the
opposite state of output 1. In alarm mode (S6 OFF), discrete
output 2 will be active when the sensor detects a system fault.
System faults include a failed emitter, mis-wiring of the emitter/
receiver communication wire (the pink wire), and low excess gain
(if the sensor is configured for high-contrast sensitivity).
4.2 Alignment / Blanking Button (Electronic Alignment)
The Alignment/Blanking push button is used both to maximize
the alignment and to access the blanking feature. The electronic
alignment routine adjusts the emitted light level to maximize
sensor performance. Perform the procedure at installation
and again when the emitter and/or receiver is moved. For PC
interface software alignment instructions, see Section 5.5.
Blanking is used to maintain sensing accuracy in applications
where a fixed object (for instance a permanently mounted
bracket) will block one or more beams. The sensor will ignore
the blanked channels when calculating outputs from the selected
measurement modes.
Electronic Alignment and Blanking — Receiver Interface
To initiate the electronic alignment procedure, use a small
screwdriver to press the Alignment/Blanking button for two or
more seconds. The left-hand digit of the 3-digit display will read
“A” (representing alignment); the right two digits will show the
number of beams blocked. The receiver is learning the clear
condition. Rotate the sensors as required (but do not change
the distance between them). When the receiver’s 3-digit display
shows 0 beams blocked, the sensors are adequately aligned.
Tighten the sensor mounts, then press the Alignment/Blanking
button again for two seconds to exit alignment mode. If all
sensor light channels are clear, the EZ-ARRAY stores each
channel’s signal strength in non-volatile memory and reads
“ - - - ” on the 3-digit display. Re-alignment is not required again,
unless the emitter or receiver is moved.
If any beams are blocked by objects other than the sensing
target to be measured during run mode, those beams can be
blanked in alignment mode for more accurate measurement.
The blocked beams must be either blanked or cleared during
alignment mode for alignment to proceed (see below). While
the “A” is visible on the receiver display, momentarily (about 0.5
seconds max.) press the Alignment/Blanking button again. The
“A” will change to “n” to indicate the sensor is ready to “learn”
the blanking pattern; momentarily press the button again to exit
the blanking routine. The sensor blanks the blocked beams and
the display changes to “A.”; the period following the lefthand digit
signifies blanking is active. Press the Alignment/Blanking button
for two seconds to exit alignment mode. The EZ-ARRAY stores
each channel’s signal strength in non-volatile memory and reads
“
-. - - ” on the 3-digit display to denote blanking is in use.
Flashing “000” on the 3-Digit Display
When returning to run mode, the receiver determines whether
any unblanked beam channels are obstructed. If any channels
are obstructed, the new alignment settings are not saved; the
receiver flashes zeroes on the display three times and sensing
will continue, using the previously set alignment settings. If this
occurs, either clear the blocked beams and repeat the alignment
routine or repeat the alignment routine and blank the blocked
beams.
4.3 Gain (Sensitivity Adjust) Button
To change the sensitivity (Gain setting), press and hold the
button for two seconds. The left-hand digit of the 3-digit display
will read “
or “2” (low-contrast. The sensitivity level can then be toggled
between the values 1 and 2. When the desired sensitivity level
is displayed, hold the Gain push button for 2 seconds and the
sensor will return to run mode.
l”; the right-hand digit will read “1” (high excess-gain)
Banner Engineering Corp. •Minneapolis, U.S.A.
www.bannerengineering.com•Tel:763.544.3164
P/N 130426 Rev. C 21
Page 24

Receiver Interface
A-GAGE EZ-ARRAY
Instruction Manual
4.4 Inverting the 3-Digit Display
For instances where the sensors must be mounted in an
inverted position, the 3-digit display can be can be inverted
for readability. See the remote teach procedure (Section 1.5).
The 3-digit display can then be switched back to “normal” by
repeating the procedure.
NOTE: The periods on the three seven-segment indicators do
not move when the display is inverted.
Error
Code
1 Receiver EEPROM Hard Failure
Receiver Alignment/Blanking
2
Configuration Error
Problem Corrective Action
This problem is caused by a receiver failure that cannot be corrected by the user.
Replace the receiver.
Remove and re-apply sensor supply voltage. If the error code 2 is removed, electrically
re-align the sensor (Section 4.2). If the error code persists, contact Banner for further
problem-solving techniques.
4.5 Troubleshooting and Error Codes
If the receiver Status LED is red and the 3-digit display reads “c”
followed by a number from 1 to 10, a corrective action is needed
(see table below).
“Dirty” Channel Indicator
If the Status LED is red, but no “c” is visible on the 3-digit
display (the scan measurement mode result is displayed), the
sensor alignment is marginal. Clean the sensor windows and
perform the alignment procedure as necessary.
For all corrective actions, first verify proper supply voltages and
wiring connectivity. Disconnect and re-connect the sensor cable
connectors to verify proper connector installation.
3 Reserved for Factory Replace the receiver.
1. Verify that emitter and receiver wiring is correct (see Figures 3-5 and 3-6).
2. Check the status of the emitter Status LED.
• Emitter LED OFF: Check the voltage across the emitter brown and blue wires. If the
voltage across the emitter brown and blue wire is OK, then replace the emitter.
4 Emitter or Wiring Problem
5 Emitter Channel Error
6 Reserved for Factory Replace the receiver.
7 Reserved for Factory Replace the emitter.
8 Reserved for Factory Replace the receiver.
9 Reserved for Factory Replace the receiver.
Incompatible Scan and Measurement
10
Mode
•Emitter Status LED flashing (approx. every 2 seconds): Verify that the emitter/
receiver synch (pink) wires are correctly installed.
3. Verify that the Synch wires are correctly installed. Check the synch wire dc voltage.
If the voltage is below 1 volt or above 3 volts, then again check the synch wire for
possible mis-wiring. Unplug first the receiver and then the emitter to determine the
problem source.
The emitter has identified a nonfunctional optical channel.
Temporary fix: Blank the channel (Section 4.2) to ignore the problem.
Permanent fix: Replace the emitter.
Some measurement modes are incompatible with some scanning modes.
Single-Edge Scan; do not use the following measurement modes:
OD, ID, FBM, LBM, TBM, CBM, Nap Detection
Double-Edge Scan; do not use the following measurement modes:
FBM, LBM, TBM, CBM, Nap Detection
22 P/N 130426 Rev. C
Banner Engineering Corp. •Minneapolis, U.S.A.
www.bannerengineering.com•Tel:763.544.3164
Page 25

A-GAGE EZ-ARRAY
Instruction Manual
5. Using the PC Interface (Banner Sensors GUI)
PC Interface
The full functionality of the EZ-ARRAY is available by making
use of the PC interface (the graphic user interface, or “Banner
Sensors GUI”). Refer to Section 1 for a full description of the
available sensing modes and other features.
The sensor is easily configured using a Windows
®
menustyle program via the Banner Sensors GUI software and a
PC-compatible computer (running Windows XP or 2000; GUI
software version 1.2 will also be compatible with Vista
®
).
5.1 Supplied Software
The PC interface software for configuring the EZ-ARRAY is
included on the CD packed with the receiver, entitled Banner
Sensors GUI (p/n 76978).
For the most recent software version, visit www.
BannerEngineering.com and enter “Banner Sensors GUI” in the
search field. Install the software (version 1.1 at this writing) onto
your hard drive; the installer will automatically load the software
into a folder titled “Banner Engineering\Banner Sensors GUI”
onto your computer. If the CD is used, inserting it into your CD
drive will auto-launch the GUI installation and place the icon
onto your desktop.
Double-click on the Banner Sensors GUI icon
the program. The main menu screen appears. Verify that
A-GAGE
®
EZ-ARRAY is displayed in the Select a Sensor field
of the screen.
to launch
5.2 Communications Connections
Connect the serial cable from your receiver to your PC, using an
RS485-to-RS232 adapter, such as the model INTUSB485-1 USB
serial adapter listed in Section 2.2. (Instructions for configuring
the adapter are included with the packaging for the adapter.)
An operating EZ-ARRAY system must be connected before the
software displays will open.
5.3 Accessing the GUI
With the sensor pair powered up and connected to your PC (as
described in Section 5.2), go to Sensor > Connect (Ctrl + N).
The Alignment/Status screen appears, providing a snapshot of
the current sensing alignment status, including the status of each
array beam, total numbers of blanked, made and blocked beams,
the selected measurements and their values (see Figure 5-2).
The Alignment/Status screen has three pull-down menus:
Sensor, Options, and Help.
Sensor Menu (Alignment/Status screen)
When the Alignment/Status screen is active, the Sensor menu
provides the options Setup (Ctrl + S), which is used to modify
or view a sensor configuration, Connect/Disconnect (Ctrl + N),
which connects (or disconnects) the PC to the sensor, and Exit
(Ctrl + Q). When a setup screen view is active, the Sensor menu
has other options (see Figures 5-3 and 5-5).
Click here to
exit program
Verify that A-GAGE® EZ-ARRAY
is displayed in the
Select a Sensor field
Figure 5-1. Banner Sensors GUI (PC Interface) main menu screen
Banner Engineering Corp. •Minneapolis, U.S.A.
www.bannerengineering.com•Tel:763.544.3164
NOTE:
Most GUI Setup options are not available until the
Connect function has linked the PC to a sensor pair.
Gray circles
denote blanked
beams in the array
Figure 5-2. EZ-ARRAY Alignment/Status screen
Green circles
denote “made”
(clear) beams
Red circles
denote blocked
beams
P/N 130426 Rev. C 23
Page 26

PC Interface
Setup
Select Sensor > Setup (Ctrl + S) to modify or view the
configuration of the connected sensor pair. Refer to Figure 5-12
for an overview of available configuration options and Sections
5.6–5.13 for more information.
Figure 5-3. Sensor menu, Alignment/Status screen
Connect / Disconnect
To disconnect from a pair of sensors, select Disconnect
(Ctrl + N) from the Sensor menu.
Exit
To quit the program, select Exit (Ctrl + Q) from the Sensor menu
or click on the in the upper right-hand corner of the screen
(see Figure 5-1).
Sensor Menu (Setup Screen)
When a setup screen view is active, the sensor menu includes
the read, write and save configuration options, plus Close (see
Figure 5-5).
Reading, Writing, and Saving Configurations
When a configuration is complete, it can be written to the
sensors and it can also be saved in an .xml file on your
computer. The following commands can be accessed in several
ways, including buttons on individual Setup screen views and in
the Sensor menu while a Setup screen is active.
If changes will be made via the GUI, it is recommended to
first save a copy of the sensor’s original configuration.
Read button reads configuration
information for the Current View
from the sensor
Current View field provides
quick access to other Setup
screen views
Write button writes
Current View configuration
information to the sensor
A-GAGE EZ-ARRAY
Instruction Manual
Figure 5-5. Sensor menu, System Config view
Use the Read button to read the current configuration for the
displayed Setup view from the sensor. If a change is made to
any configuration field, it remains highlighted in yellow on the PC
screen until it is written to the sensor via the Write button. The
Write button writes configuration changes for the selected Setup
view only.
The Read ALL and Write ALL menu items read or write
configuration parameters between the GUI and sensor for ALL
setup view fields, regardless of the view selected—including
the factory-calibrated Null and Span settings. Alignment and
Blanking configuration information can be accessed only via the
Alignment/Status screen
.
The Save Config menu item is used to save a configuration file
to your PC for later retrieval. Use the Open Config menu item
to retrieve a file from the PC in order to write it to a sensor. The
Recent Configs menu item provides a shortcut to recently used
configuration files.
Close
To return to the Alignment/Status screen from any Setup screen
view, click Close
(Ctrl + Q) or click on the .
Options Menu
The Options menu (Figure 5-6) provides the pull-down menu
options Communication Settings (Ctrl + M), where the COM
port may be selected, and Debug
helpful during troubleshooting. Power Cycle and 10 Click are
not used for the EZ-ARRAY.
The first time the system is used, or when changes need to be
made to the communications configuration, select Options >
Communication Settings (Ctrl + M) from the menu screen (see
Figure 5-6) to configure the PC serial communications port.
(Ctrl + D), which may be
Configuration fields can not be
accessed unless Advanced is
selected; window will remain
yellow until configuration is
written (via the Write button)
Figure 5-4. Setup screen, System Config view
24 P/N 130426 Rev. C
Status and Message Windows
provide system communication
status
The resulting Communication Settings window has an Advanced
or Basic option; when Basic is selected, only the fields Select a
Product, COM Port, and Echo Suppression Options are listed.
To access the Advanced menu, select Options > Advanced
Settings (Ctrl + U) from the Communication Settings menu.
• COM Port selects the computer port used for serial
communication with the sensor (COM1, COM2, . . . COM20).
• Baud Rate is the data communication rate between the sensor
and the computer used for configuration. Choose from three
options: 9600, 19200, and 38400.
Banner Engineering Corp. •Minneapolis, U.S.A.
www.bannerengineering.com•Tel:763.544.3164
Page 27

A-GAGE EZ-ARRAY
Instruction Manual
PC Interface
5.4 Factory Defaults
Select Basic for an
abbreviated list; select
Advanced to access all
communications fields
File menu includes
Open and Save
commands to save
a communication
settings file on your PC
Figure 5-6. Options menu, Alignment/Status screen and resulting
Communication Settings screen
• Address determines the sensor address (from 1 to 247; factory
default is 65) on the Modbus network.
• Timeout determines how long (in ms) the PC will wait for a
response from the sensor. Default is 1000 ms.
• Msg Delay — Injects a delay (pause) between messages
between the GUI and a sensor (in ms).
• Protocol (Modbus). Do not select Bannerbus.
• Parity: Select Odd, Even, or None.
• Retry — Number of times the GUI will attempt communication
with the sensor.
•Options (DPB1, No Echo Suppression, or Echo
Suppression). EZ-ARRAY requires either DPB1 or No Echo
Suppression for communication.
Help Menu
Help (Ctrl + A) provides system version information for reference
in the event of a Factory applications help call; see Figure 5-7.
Factory default selections in this section are designated with an
underline. To reconfigure a sensor to the factory default optons,
access the .xml default file from the folder Banner Engineering
> Banner Sensors GUI > Configs > Defaults (see Section 5.1).
This changes all the setup fields in the GUI to the default values,
which can then be reviewed and/or written to the sensor.
NOTE: If reverting a configuration to the default values, first
record the sensor’s factory-calibrated Null and Span
values, so they can later be written to the sensor.
5.5 Alignment and Blanking
When the Alignment/Status screen is first displayed (see Section
5.3 and Figure 5-2), two functions can be performed: Start
Sampling and Align Sensor.
The System Alignment screen Channel States display can be
used to see an ongoing, realtime display of sensing status. Click
on Start Sampling; the Status window will read Sampling in
Progress until Stop Sampling is selected. When sampling is
not active, the Channel States displays are not updated.
The Channel States status fields in the screen provide a
color-coded, visual status of the number of blocked (red), made
(green), and blanked (gray) channels. The selected sensor scan
type is displayed in the Scan Type text field. The “blanked”
value is a count of the beam channels that are ignored when the
sensor applies the current blanking configuration to the selected
measurement mode (see Section 1.10). The “blocked” value is
a count of blocked beams, excluding any blanked beams. The
“made” value is a count of unblocked and unblanked beams. The
total number of beams blocked, made, and blanked will always
equal the total number of sensor beam channels. Below this
row of text boxes is a graphic display that depicts the status of
each individual beam, color-coded to the totals boxes above it.
This graphic display may be used both to view which beams are
blocked or blanked and also to blank individual beams.
The Active Measurements status fields depict the active
(selected) measurement modes (up to two), with
value for each, plus a history of the minimum and maximum
values recorded during the sampling of a target, held until a new
target is presented. This sampling tool is useful for setting the
sensor discrete output levels, for verifying sensor operation, and
for proving out an application.
the present
Figure 5-7. Help menu results in About Banner Sensors GUI screen
Banner Engineering Corp. •Minneapolis, U.S.A.
www.bannerengineering.com•Tel:763.544.3164
Perform electronic alignment when the sensor is first installed,
and repeat whenever the emitter or receiver (or both) is moved.
Electronic alignment also can be initiated using the remote
TEACH line or the Alignment switch on the receiver’s front panel
(see Sections 1.5 and 4.2).
P/N 130426 Rev. C 25
Page 28
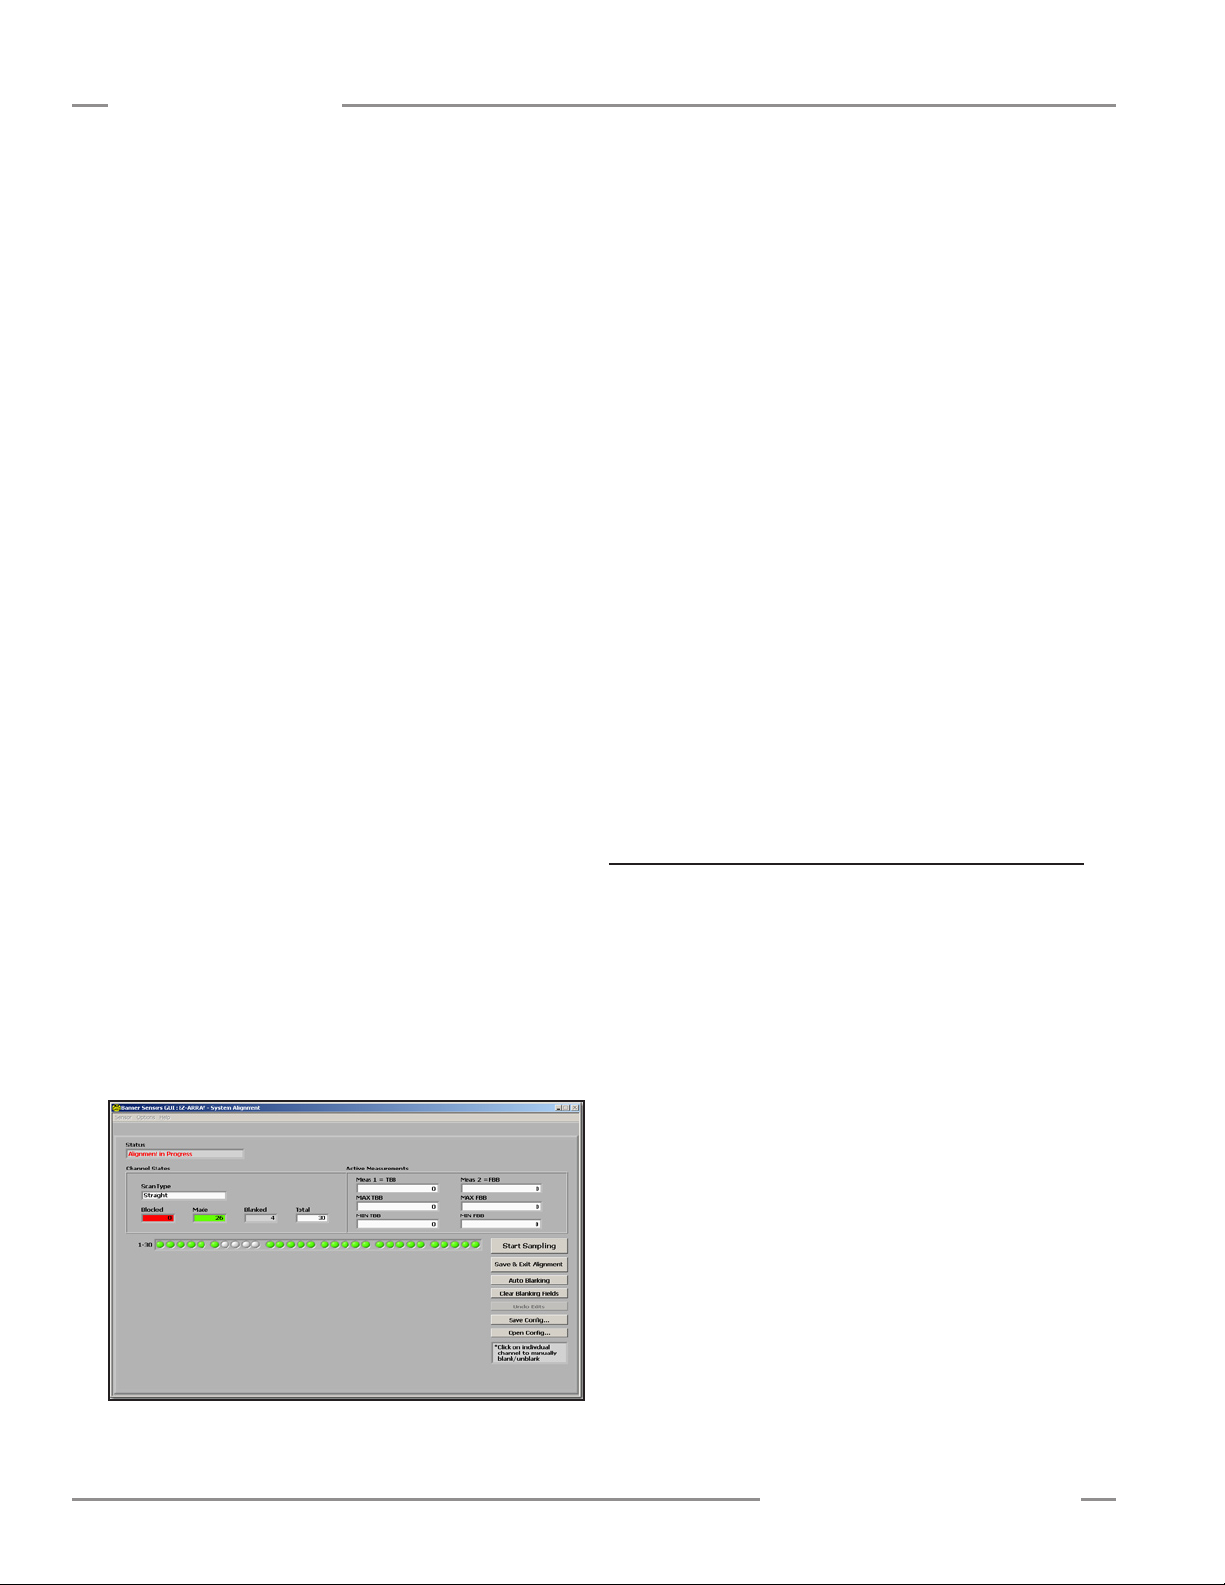
PC Interface
A-GAGE EZ-ARRAY
Instruction Manual
The electronic alignment routine adjusts the emitted light
level to maximize sensor perfomance. When the system exits
alignment, the sensor records and stores channel signal
strength
electronic alignment is performed again. Perform the procedure
at installation and again whenever the emitter and/or receiver is
moved. (For Receiver interface software alignment instructions,
see Section 4.2.)
and blanking information in non-volatile memory until
Electronic Alignment Procedure
Note that electronic alignment, once initiated, can not be exited
without completing the entire routine (there is no “exit without
save” option)
Sensor button on the System Alignment screen.
While the sampling is taking place, the Status field of the System
Alignment screen will read Alignment Sampling in Progress.
When the sensor is aligned and all unobstructed beams are
detected as made beams, press Stop Sampling. The Status
window will read Alignment in Progress.
sampling stops, additional options become enabled on the
Alignment screen: Save and Exit Alignment, Auto Blanking,
Clear Blanking Fields, Undo Edits (if any blanking changes were
made), Save Config, and Open Config.
If necessary, physically adjust the emitter and/or receiver until
the diagnostic display of the Alignment screen indicates that all
unblocked beams are made (no red circles).
. To align the sensor from the PC, press the Align
When the alignment
If the alignment failed, check for objects that may be blocking
one or more beams, or physically adjust the sensors until all
beams on the Alignment screen’s diagnostic display are green,
then repeat the electronic alignment.
To blank individual channels, position the cursor on any of the
depicted channels (either red or green circles) and click on it. To
unblank any channel, click on a gray circle.
Click on Auto Blanking to automatically blank all blocked
channels and remove blanking from unblocked channels.
Click on Clear Blanking Fields to unblank all blanked channels.
Click on Undo Edits to remove unsaved channel blanking edits.
Save Config
Click on Save Config to save the current set of configuration
and blanking settings in an .xml file on your computer that can
then be later retrieved and written to the sensor. In the pop-up
box, select a storage destination and name the configuration file
as desired.
Open Config
Click on Open Config to retrieve a previously saved
configuration file. A screen will pop up, allowing you to browse in
your computer for the file. When you select a new configuration,
the blanking configuration automatically populates the Channel
States status fields in the PC interface screens. This applies to
blanking configuration information only, not to any other settings.
If any beams are blocked, they must either be cleared or blanked
to save the alignment settings (see Figure 5-2).
Click Save & Exit Alignment to save the gain adjustment
settings. The sensor will verify that all non-blanked optical
channels are clear. If some channels are not clear (fail), the
sensor will not perform the electronic alignment process and
will retain the previously saved alignment parameters. If all the
non-blanked optical channels are clear (succeed), the sensor will
save the new electronic alignment parameters. A message will
appear that alignment either succeeded or failed.
Figure 5-8. Alignment/Status screen, alignment in progress
5.6 Configuration Setup
Configuration selections other than blanking and alignment
adjustment are made to the sensor via the Setup screen.
The Setup option becomes accessible after a connection is
established between the PC and the sensor, using the Connect
option. Refer to Figure 5-12 for an overview of Setup options.
Setup Screen
Selecting Setup (Ctrl + S) from the Sensor menu launches
the Setup screen, which has six views: System Config, Analog
Output Config, Discrete Output Config, Comm Config, Part
Number and Version Info, and System Diagnostics. The Current
View field displays the name of the currently selected view and
allows quick switching between views; simply click on the arrow
at the right side of the field to display a drop-down menu of
alternate views (see Figure 5-9).
When any Setup view is displayed, the options in the Sensor
menu become:
READ All (Ctrl + R)
WRITE All (Ctrl + W)
Open Config (Ctrl + O)
Recent Configs (if any exist)
Save Config (Ctrl + S)
Close (Ctrl + Q)
26 P/N 130426 Rev. C
Banner Engineering Corp. •Minneapolis, U.S.A.
www.bannerengineering.com•Tel:763.544.3164
Page 29

A-GAGE EZ-ARRAY
Instruction Manual
Figure 5-9. Setup screen view selection
Status and Message Windows
On the lower righthand corner of each of the Setup views (Figure
5-10) are two windows, labeled Status and Message. These two
windows provide ongoing indication of system status, e.g., Okay,
Busy, or Error. In the event of a communication error, a message
will appear in the second window, providing further detail about
the error.
Verify that the sensor is ON, that cables are connected, and
perform a thorough check of the Comm Config and Options >
Communications settings. (The most common communication
errors are COM port selection or Timeout.) If this does not
correct the problem, refer to Section 5.13 Communications
Troubleshooting.
5.7 System Config View
PC Interface
Configuration Type determines whether the Receiver interface
or the PC interface will control the sensing parameters.
•DIP Switch: Receiver interface is in control.
•Advanced: PC interface is in control. Select Advanced
to override the receiver DIP switch settings and access
configuration settings. (Settings can not be changed unless
Advanced is selected.)
Scan Configuration
•Scan Type. Choose between Straight, Single Edge, or
Double Edge Step 1, 2, 4, 8, 16, or 32, or Carpet Nap; see
Section 1.6 for descriptions and scan rates for these scan
types. Carpet Nap can be selected only via the advanced
configuration and has its own set of parameter options that will
appear if it is selected.
•Remote Teach/Gate. This field defines the functionality of the
receiver’s gray wire (see Section 1.5).
•Measurement 1 and Measurement 2. These pull-down
boxes each select a measurement mode. The measurement
mode values will be mapped individually to the analog and/or
discrete outputs. The sensor will apply the blocked and clear
optical channel status data from each scan to the selected
measurement mode(s) to calculate the measurement mode
value(s). See Section 1.10.
Gain Configuration
This section is used to define the sensing sensitivity parameters
(see Section 1.7).
Setup screen, System Config view selections are grouped into
four categories: System Configuration, Scan Configuration, Gain
Configuration, and User Interface Options. Each category has
one or more pull-down boxes of options. Underlined options are
the Factory default options. Settings can be changed only when
the configuration type is set to Advanced.
Status and Message
windows provide
indication of
Configuration fields are not available
until Advanced is selected in
Configuration Type field
overall status or
communication errors
• Gain Method: Low-Contrast or High-Excess-Gain operation.
•Low-Contrast Sensitivity is selectable (via the PC interface
only), from 15 percent to 50 percent, when Low-Contrast
operation is selected. A 15 percent threshold is used for target
objects that attenuate the sensing beam light only slightly. The
default low-contrast setting is 30%.
Field was changed to Advanced; window
will remain yellow until configuration is
saved (via the Write button)
Figure 5-11. Setup view — Advanced selected, but not savedFigure 5-10. Setup view — DIP Switch selected
Configuration fields
can now be changed
Banner Engineering Corp. •Minneapolis, U.S.A.
www.bannerengineering.com•Tel:763.544.3164
P/N 130426 Rev. C 27
Page 30

PC Interface
A-GAGE EZ-ARRAY
Instruction Manual
User Interface Options
The user interface options control the Receiver user interface
display and push buttons.
•Display Orientation (Normal or Inverted) is used to invert
the display to right-reading when sensors are mounted “upside
down.” Note that the periods on the three seven-segment
indicators do not move when the display is inverted.
•Sensitivity Button field (Enabled or Disabled) is used to
enable or disable the Sensitivity button for security.
•Align-Blank Button field (Enabled or Disabled) is used to
enable or disable the Alignment-Blanking button for security.
5.8 Analog Output Config View
This view is used to individually set the parameters for each
of the analog outputs. Settings can be changed only when
the configuration type (in the System Config view) is set to
Advanced.
• Status determines whether that output is enabled or disabled.
When the analog output is disabled, the analog output will
source either 0 milliamps or 0 volts.
• Peak Detect Reset (auto or external communication)
specifies the method by which the analog output peak-detect is
re-triggered.
Auto: the analog output remains latched until the sensor array
goes clear and then detects another object.
External communication: By serially reading the analog latch
values (see Appendix A, Example A-8 for an example of peak
detect reset using external communication).
Null and Span values can be adjusted to vary the analog signal
levels.
These values are factory-calibrated to represent 0 volts
(4 mA) and 10 volts (20 mA). The values represent a 12 bit
number that ranges from 0 to 4095.
NOTE: If reverting a configuration to the default values, first
record these factory-calibrated values, so they can later
be written to the sensor.
• NULL Output determines the minimum analog output value
(must be less than the Span value).
• SPAN Output determines the maximum analog output value
(must be higher than the Null value).
5.9 Discrete Output Config View
• Slope selects between positive and negative analog output
slope. The slope option allows the analog output to increase
as the measurement value increases, or to decrease as the
measurement value increases.
• Measurement assigns the desired measurement mode (Meas1
and Meas2, as configured in the System Config view) to each
output. (Select a negative slope to invert an output.)
• Zero Value is used to specify the analog output value when the
array goes clear. The options for Zero Value are hold (output
holds the last value before the light screen became clear),
minimum (provides the null or minimum value), or maximum
(provides the span or maximum value).
• Analog Filter Speed (fast, medium, or slow) allows averaging
of the analog output response to slow, and therefore smooth,
the response. The analog filter speed is defined as the number
of scans necessary for a step response to reach 95% of the final
value. These values are as follows:
Response
Speed
Fast 1 scan
• Peak Detect (disabled, minimum or maximum) configures the
sensor to capture a minimum or maximum value and latch this
analog value until a reset has occurred (see Peak Detect Reset).
Medium 6 scans
Slow 24 scans
95% Step Response
(sensor scans)
This view is used to individually set the parameters for each
of the discrete outputs. Settings can be changed only when
the configuration type (in the System Config view) is set to
Advanced.
• Status is used to enable or disable that discrete output.
•Polarity: The discrete outputs are independent and can be
set to either NPN (sinking current) or PNP (sourcing current),
regardless of the sensor model.
• Mode selects between normally closed and normally open for
each output, in effect, “inverting” the output. When Normally
Closed is selected, the output conducts when the sensor scan
value is outside of the selected limits. When Normally Open
is selected, the output conducts when the sensor scan value is
within the selected limits.
NOTE: If discrete output 2 Type is selected for Alarm/Health
Status, the options in the Mode field become Health or
Alarm; see “Type” below.
• Measurement ties the discrete output to one of the two
selected measurement modes (Meas1 or Meas2, as configured
in the System Config view).
• Type (discrete output 2 only) selects between measurement
or alarm functions. (Output 1 always is tied to a measurement
mode.) If Alarm/Health Status is selected, Output 2 will
change state whenever the System detects a sensor error
(such as a disconnected cable) or whenever the excess gain of
one or more beams becomes marginal, as follows:
28 P/N 130426 Rev. C
Banner Engineering Corp. •Minneapolis, U.S.A.
www.bannerengineering.com•Tel:763.544.3164
Page 31

A-GAGE EZ-ARRAY
Instruction Manual
PC Interface
Health: Output is normally active, becomes inactive when an
error occurs.
Alarm: Output is normally inactive, becomes active when an
error occurs.
• Demodulation is used to smooth the discrete output response.
Each discrete output can respond after each sensor scan,
or the response time can be increased by increasing the
demodulation. Increasing the demodulation increases the
required number of consecutive qualifying scans (that have a
measurement mode value within the prescribed window and
hysteresis values) to change the discrete output state. The
maximum demodulation value is 250 scans and is selected
independently for each output.
• Threshold Low and Threshold High Values are used to
“window” the measurement values that control a discrete
output. The values each identify a beam in the array (beam 1
being closest to the sensor display). At each scan, the sensor
processes the status of the optical channels and determines
values for the selected measurement modes. For the Discrete
Output analysis, the measurement values are compared to the
low and high threshold. If the selected measurement value is
between the low and high threshold values (including the low
and high limit), then the sensor will register a valid condition.
After the specified number of consecutive scan response
values (see “Demodulation”), the sensor will recognize that
the conditions specifying the discrete output are met and the
output will change state.
Hysteresis prevents unstable output conditions when the scan
analysis value exactly matches the threshold.
• Hysteresis Low value determines the amount of change that
must occur beyond the low threshold to cause that output to
change state. The default Hysteresis Low setting is one beam
less than the Threshold Low setting.
• Hysteresis High value determines the amount of change that
must occur beyond the high threshold to cause that output
to change state. The default Hysteresis High setting is one
beam more than the Threshold High setting.
5.10 Comm Config View
This view is used to define the serial communication parameters
that the sensor uses for communication with the GUI or the
process controller. If any changes are made to fields in this view,
update the fields accordingly in Options > Communications
Settings (Ctrl + M) to enable further communication.
use the up/down arrows to the left of the field. If a new sensor
address is selected, update the GUI address via Options
> Communications Settings (Ctrl + M) to enable further
communication.
• Parity: Select Odd, Even, or None.
• Baud Rate is the data communication rate between the
sensor and the computer used for configuration or the process
controller. Choose from three values: 9600, 19200, and 38400.
• Modbus Timeout can be used to relax communication timing.
The Modbus standard (Compliant setting) defines spacing
between words within a message to be no longer than the time
required to transmit 1.5 bytes of information. However, the
time between successive bytes within a serial message can
be extended (Extended setting) to allow communication with a
slower device.
5.11 Part Number and Version Info View
This view provides basic read-only reference information about
the connected emitter and receiver. Information includes the
receiver part number, firmware version numbers, and hardware
date codes.
5.12 System Diagnostics View
This view provides read-only information about the connected
emitter and receiver, for diagnostic purposes. This information
may be useful if factory-assisted troubleshooting is required.
Refer to Section 4.6 for possible error codes and corrective
action.
• Channel Status fields display the number of emitter and
receiver channels (which should be identical), the location of
the first bad emitter channel, if any, and the level of optical
power being delivered by the emitter.
• Operational Status fields display the overall Error Code (or
System Status), plus the status of each receiver DIP switch
position, regardless of whether they are enabled.
• Output Status fields display the status of each output
individually.
• Service Status displays the sensor time of service, updated
every two hours.
• Address determines the sensor location (from 1 to 247;
default is 65) on the process controller network. Adjust by
highlighting the existing number and overtype a new value, or
Banner Engineering Corp. •Minneapolis, U.S.A.
www.bannerengineering.com•Tel:763.544.3164
P/N 130426 Rev. C 29
Page 32
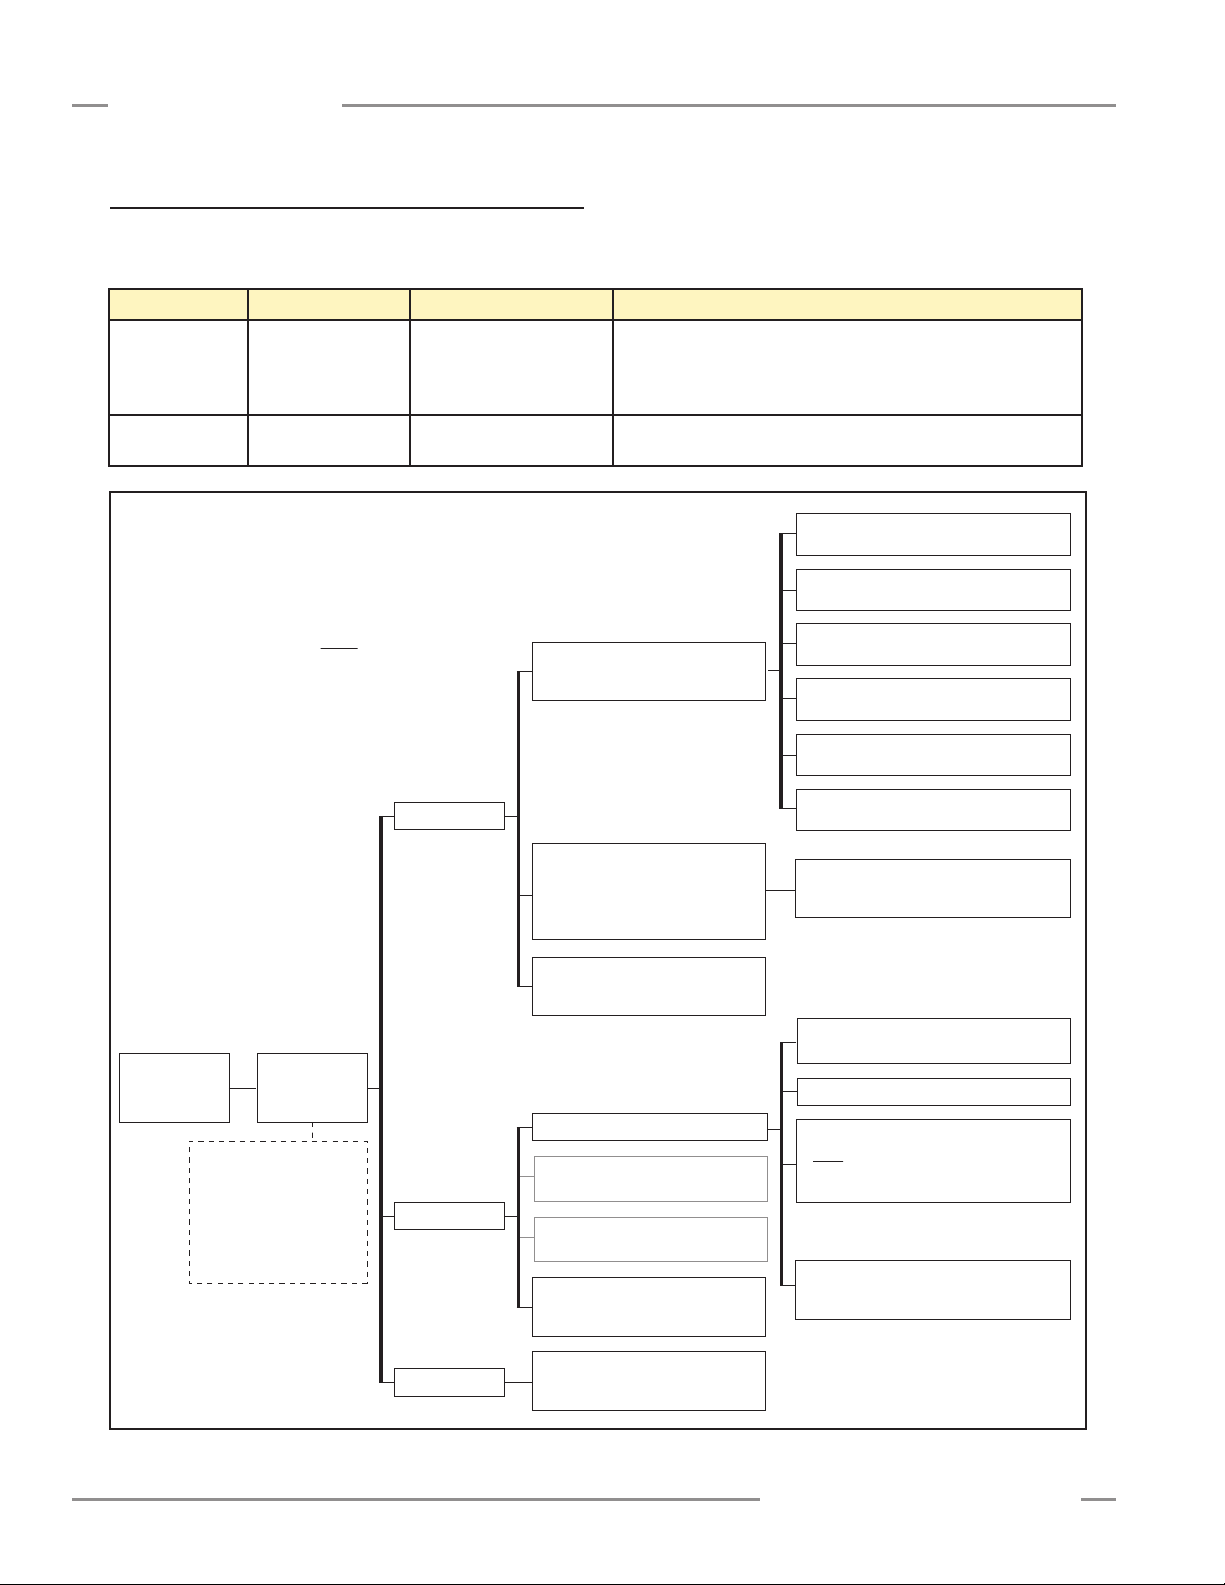
PC Interface
Do not select:
Color Mark Sensors
D10 Series Sensors
L-GAGE® Light Gauging Sensors
T-GAGE® Temperature Sensors
U-GAGE® Ultrasonic Sensors
WORLD-BEAM® QS30 Sensors
WORLD-BEAM® QS30RX
Setup (Ctrl + S)
(not active until Connect is performed)
Creates or alters sensor configuration
Connect (Ctrl + N)
Connects to a specific sensor pair
(If sensors will not connect, verify that
Communications Options are correct; e.g.
COM port agrees with computer COM port
System Config View Go to A
Analog Output Config View Go to B
Discrete Output Config View Go to C
Comm Config View Go to D
Part Number and Version Info View Go to E
System Diagnostics View Go to F
Select a Sensor
Verify that EZ-ARRAY is selected
COM Port Selection (COM 1 – 20)
Sensor > Disconnect (Ctrl + N)
Disconnects from current sensor pair so that other
sensors on the network can be connected
Options
DPB1
No Echo Suppression*
Echo Suppression
Status
Read-only indication of current sensor
communication status
* If DPB1 is de-selected, it can not be reselected.
Verify that this option box is set to either DPB1 or
No Echo Suppression.
Exit (Ctrl + Q)
Ends connection and configuration between
software and sensors
Communication Settings (Ctrl + M)
NOTE: Underlined options designate default settings.
Options
Sensor
Help
EZ-ARRAY
®
Select a Sensor
10 Click
(not used for EZ-ARRAY)
About Banner Sensors GUI (Ctrl + A)
Part number and software version
information
Debug (Ctrl + D)
Read-only debug messages for
troubleshooting use
Power Cycle
(not used for EZ-ARRAY)
5.13 Communications Troubleshooting
The two most common communication errors are listed in the
table below. For other errors, contact the factory.
Error Code Error Message Description Corrective Action
6101 Modbus Timeout Timeout reached while
communicating with sensor
-1073807343 VISA: Insufficient
location . . .
Selected COM port does
not exist on PC
1. Check sensor power.
2. Check communication cable connections.
3. Check Communication Settings in GUI.
4. Use Advanced Communication Settings to ping/discover sensor.
1. Verify COM port number on PC.
2. Choose correct COM port in Communication Settings screen.
A-GAGE EZ-ARRAY
Instruction Manual
Figure 5-12. PC Interface configuration overview, part 1 of 7
30 P/N 130426 Rev. C
Banner Engineering Corp. •Minneapolis, U.S.A.
www.bannerengineering.com•Tel:763.544.3164
Page 33

A-GAGE EZ-ARRAY
System Configuration –
Configuration Type
Sensor > Setup (Ctrl + S) > System Config View*
(Not available until Connect is performed)
* Use drop-down arrow at right-hand side of the Current View field to quickly move to another view.
A
DIP Switch
Advanced
Verify that Advanced is selected in order
to access other configuration fields
Gain Configuration
User Interface Options
Scan Type
Gain Method
High Excess Gain
Low Contrast
Remote Teach / Gate
Determines the function of the Teach wire
Low Contrast Sensitivity
Available only when Low Contrast
is selected
Straight
Single Edge
Double Edge – Step 1
Double Edge – Step 2
Double Edge – Step 4
Double Edge – Step 8
Double Edge – Step 16
Double Edge – Step 32
Carpet Nap
Remote Teach
Teach functions can be input
via Teach wire; see Section 1.5
Carpet Nap scan type selected:
Disabled
Carpet Nap
Carpet Edge
Disabled
FBB
Meas 1 default
LBB
TBB
Meas 2 default
TRN
CBB
FBM
LBM
TBM
TBM
CBM
MBB
OD
ID
CFBB
CLBB
Special
(Reserved;
contact Factory)
Alignment/Sensitivity
Gate – Active High
Gate – Active Low
Gate – Rising Edge
Gate – Falling Edge
Disabled
Teach wire has no function;
continuous scan is automatically selected
35%
40%
45%
50%
Display Orientation
Normal
Inverted
15%
20%
25%
30%
Sensitivity Button
Enabled
Disabled
Align / Blanking Button
Enabled
Disabled
System
Configuration
A
Scan Configuration
Measurement 1
The measurement mode mapped
to discrete output 1;
can be any of those at right
Measurement 2
The measurement mode mapped
to discrete output 2;
can be any of those at right
NOTE: Underlined options
designate default settings.
Instruction Manual
PC Interface
Figure 5-12. PC Interface configuration overview, part 2 of 7
Banner Engineering Corp. •Minneapolis, U.S.A.
www.bannerengineering.com•Tel:763.544.3164
P/N 130426 Rev. C 31
Page 34

PC Interface
(Settings are nearly
identical for output 2,
with only minor variation)
Sensor > Setup (Ctrl + S) > Analog Output Config View*
(Not available until Connect is performed)
* Use drop-down arrow at right-hand side of the Current View field to quickly move to another view.
B
A01 Status
Enabled
Disabled
A01 Null Output
If restoring back to factory
defaults, record this value first
A01 Span Output
If restoring back to factory
defaults, record this value first
A01 Slope
Positive
Negative
A01 Measurement
Meas 1 selection (Default for output 1)
Meas 2 selection (Default for output 2)
A01 Peak Reset
A01 Zero Value
Hold
Minimum
Maximum
Fast
Medium
Slow
A01 Filter Speed
A01 Peak Detect
Disabled
Minimum
Maximum
Factory-calibrated numeric
value from 0 to 4095
Auto
External Comm
Factory-calibrated numeric
value from 0 to 4095
Analog Output 1
Analog Output 2
B
NOTE: Underlined options
designate default settings.
Sensor > Setup (Ctrl + S) > Discrete Output Config View*
(Not available until Connect is performed)
* Use drop-down arrow at right-hand side of the Current View field to quickly move to another view.
C
D01 Status
D01 Measurement
D01 Demodulation Numeric value from 1 to 250
D01 Hysteresis Low Numeric value from 0 to 479
D01 Threshold Low Numeric value from 1 to 480
D01 Threshold High Numeric value from 1 to 480
D01 Hysteresis High Numeric value from 2 to 481
D01 Polarity
(Default polarity depends on model,
but can be switched; reverting to
factory default will result in a PNP
setting, regardless of model)
D01 Mode
(Default setting is for
complementary outputs)
Measurement Model Selected
(Either discrete output)
Normally Open (Default for output 1)
Normally Closed (Default for output 2)
Alarm/Health Status Mode Selected
(Discrete output 2 only)
D02 Type
Available for output 2 only
(Settings are nearly
identical for output 2,
with only minor variation)
Discrete Output 1
Discrete Output 2
C
NOTE: Underlined options
designate default settings.
Enabled
Disabled
NPN
PNP
Meas 1 selection
Meas 2 selection
Measurement
Alarm/Health Status
Health
Alarm
Sensor > Setup (Ctrl + S) > Comm Config View*
(Not available until Connect is performed)
* Use drop-down arrow at right-hand side of the Current View field to quickly move to another view.
D
Address (1-247)
Parity
Numeric value from 1 to 247
(Factory default 65)
Compliant
Extended
Modbus Timeouts
(Relaxes timing requirement to permit
communication with slower devices)
None
Even
Odd
9600
19200
38400
Baud Rate
D
Comm
Configuration
NOTE: Underlined options
designate default settings.
Sensor > Setup (Ctrl + S) > Part Number and Version Info View*
(Not available until Connect is performed)
* Use drop-down arrow at right-hand side of the Current View field to quickly move to another view.
E
Receiver Info
Receiver Part Number
Read-only indication
Receiver Firmware Part Number
Read-only indication
Receiver Firmware Version
Read-only indication
Comm Info
Comm Firmware Part Number
Read-only indication
Comm Firmware Version
Read-only indication
Receiver Datecode
Read-only indication
Emitter Info
Emitter Firmware Part Number
Read-only indication
Emitter Firmware Version
Read-only indication
Emitter Datecode
Read-only indication
E
System
Info
NOTE: Underlined options
designate default settings.
A-GAGE EZ-ARRAY
Instruction Manual
Figure 5-12. PC Interface configuration overview, part 5 of 7
Figure 5-12. PC Interface configuration overview, part 3 of 7
Figure 5-12. PC Interface configuration overview, part 4 of 7
32 P/N 130426 Rev. C
Figure 5-12. PC Interface configuration overview, part 6 of 7
Banner Engineering Corp. •Minneapolis, U.S.A.
www.bannerengineering.com•Tel:763.544.3164
Page 35

A-GAGE EZ-ARRAY
Sensor > Setup (Ctrl + S) > System Diagnostics View*
(Not available until Connect is performed)
* Use drop-down arrow at right-hand side of the Current View field to quickly move to another view.
F
Channel Status
Number of Receiver Channels
Read-only indication
Number of Emitter Channels
Read-only indication
First Bad Emitter Channel
Read-only indication
Emitter Power
Read-only indication
Error Code
Read-only indication
DIP Switch S1
Read-only indication
DIP Switch S2
Read-only indication
DIP Switch S3
Read-only indication
DIP Switch S4
Read-only indication
DIP Switch S5
Read-only indication
DIP Switch S6
Read-only indication
Output Status
Service Status
Discrete Output 1
Read-only indication
Discrete Output 2
Read-only indication
Analog Output 1 DAC
Read-only indication
Analog Output 2 DAC
Read-only indication
Time of Service (Hours)
Read-only indication
Operational Status
F
Diagnostics
NOTE: Underlined options
designate default settings.
Instruction Manual
PC Interface
Figure 5-12. PC Interface configuration overview, part 7 of 7
Banner Engineering Corp. •Minneapolis, U.S.A.
www.bannerengineering.com•Tel:763.544.3164
P/N 130426 Rev. C 33
Page 36

Appendix
Appendix A. Modbus Reference
A-GAGE EZ-ARRAY
Instruction Manual
A.1 Modbus Specifications and Message Formats
For the latest Modbus protocol and specifications, please visit
http://www.modbus.org
The EZ-ARRAY is compliant with Modbus v1.1a. EZ-ARRAY
utilizes the RTU transmission Mode. The RTU message frame is
depicted below.
Table A–1. RTU Message Frame
Slave
Address
1 byte 1 byte
Function
Code
Data
0 up to 252
bytes(s) (High
Byte, Low Byte)
The slave address can be assigned a value in the range 1-247.
Three function codes are supported:
(0x03) Read Holding Registers
(0x04) Read Input Registers
(0x10) Write Multiple Holding Registers
The data in the registers is transmitted in big endian order
(HIGH byte, LOW byte).
A.1.1 Read Holding Registers (0x03)
This function code is used to read the contents of a contiguous
block of EZ-ARRAY holding registers. The command specifies
the starting address and the number of registers. The EZARRAY employs a direct addressing scheme. For example,
the holding register at address 40001 is accessed by reading
address 40001 (0x9C41) directly (i.e. the starting address is
not an offset). The register data in the response message are
packed as two bytes per register. For each register, the data is
returned in a big endian order (HIGH byte, LOW byte).
Request
Function Code
Starting Address
Quantity of
Holding Registers
1 byte 0x03
2 bytes 0x0000 to 0xFFFF
2 bytes 0x0001 to 0x007D
Response
Function Code
Byte Count
Holding Registers
* “N” is the number of holding registers
1 byte 0x03
1 byte 2 X N*
N X 2 Bytes
Cyclic
Redundancy
Check (CRC)
2 bytes (CRC
Low, CRC Hi)
Error
Error Code
Exception Code
1 byte 0x83
1 byte 1 to 4
Example A–1. Reading Holding Registers
Request Response
Field Name (Hex) Field Name (Hex)
Slave Address 41 Slave Address 41
Function 03 Function 03
Starting Address
(HIGH Byte)
Starting Address
(LOW Byte)
Quantity of Registers
(HIGH Byte)
Quantity of Registers
(LOW Byte)
CRC (LOW Byte) 75 Register 40002
CRC (HIGH Byte) 4F Register 40003
9C Byte Count 06
41 Register 40001
(HIGH Byte)
00 Register 40001
(LOW Byte)
03 Register 40002
(HIGH Byte)
(LOW Byte)
(HIGH Byte)
Register 40003
(LOW Byte)
CRC (LOW Byte) 34
CRC (HIGH Byte) B9
02
2B
00
00
00
64
The contents of addresses 40001, 40002, and 40003 are the
two-byte values 0x022B (555 decimal), 0x0000 (0 decimal), and
0x0064 (100 decimal), respectively.
A.1.2 Read Input Registers (0x04)
This function code is used to read from 1 to 125 contiguous
EZ-ARRAY input registers. The command specifies the starting
address and the number of registers. The EZ-ARRAY employs
a direct addressing scheme. For example, the input register at
address 30001 is accessed by reading address 30001 (0x7531)
directly (i.e. the starting address is not an offset). The register
data in the response message are packed as two bytes per
register. For each register, the data is returned in big endian
order (HIGH byte, LOW byte).
34 P/N 130426 Rev. C
Banner Engineering Corp. •Minneapolis, U.S.A.
www.bannerengineering.com•Tel:763.544.3164
Page 37

A-GAGE EZ-ARRAY
Instruction Manual
Appendix
Request
Function Code
Starting Address
Quantity of Input
Registers
1 byte 0x04
2 bytes 0x0000 to 0xFFFF
2 bytes 0x0001 to 0x007D
Response
Function Code
Byte Count
Input Registers
* “N” is the number of holding registers
1 byte 0x04
1 byte 2 X N*
N X 2 Bytes
Error
Error Code
Exception Code
1 byte 0x84
1 byte 1 to 4
Example A–2. Reading Input Registers
Request Response
Field Name (Hex) Field Name (Hex)
Slave Address 41 Slave Address 41
Function 04 Function 04
Starting Address (HIGH
Byte)
Starting Address (LOW
Byte)
Quantity of Registers
(HIGH Byte)
Quantity of Registers
(LOW Byte)
CRC (LOW Byte) 74 CRC (HIGH Byte) F8
CRC (HIGH Byte) C9
75 Byte Count 02
31 Register8
(HIGH Byte)
00 Register8
(LOW Byte)
01 CRC (LOW Byte) 38
00
2B
The contents of address 30001 are shown as the two-byte
values of 0x000A (10 decimal).
A.1.3 Write Multiple Holding Registers (0x10)
This function code is used to write a block of contiguous
registers into the EZ-ARRAY. The requested written values are
specified in the request data field. The EZ-ARRAY employs a
direct addressing scheme. For example, the holding register at
address 40001 is accessed by writing address 40001 (0x9C41)
directly (i.e. the starting address is not an offset). Data is packed
as two bytes per register. For each register, the data is sent in
big endian order (HIGH byte, LOW byte). The normal response
returns the function code, starting address, and quantity of
registers written.
Request
Function Code
Starting Address
Quantity of
Holding Registers
Byte Count
Register Value
* “N” is the number of holding registers
1 byte 0x10
2 bytes 0x0000 to 0xFFFF
2 bytes 0x0001 to 0x007B
1 byte 2 X N*
Response
Function Code
Starting Address
Holding Registers
1 byte 0x03
2 bytes 0x0000 to 0xFFFF
N X 2 Bytes 1 to 0x7B
Error
Error Code
Exception Code
1 byte 0x90
1 byte 1 to 4
Example A–3. Writing Holding Registers
Request Response
Field Name (Hex) Field Name (Hex)
Slave Address 41 Slave Address 41
Function 10 Function 10
Starting Address
(HIGH Byte)
Starting Address
(LOW Byte)
Quantity of Registers
(HIGH Byte)
Quantity of Registers
(LOW Byte)
Byte Count 04 CRC (LOW Byte) 31
Register 1 (HIGH Byte) 00 CRC (HIGH Byte) 4C
Register 1 (LOW Byte) 01
Register 2 (HIGH Byte) 0A
Register 2 (LOW Byte) 02
CRC (LOW Byte) 3A
CRC (HIGH Byte) C7
The holding registers at addresses 40001 and 40002, were
written to the two-byte values of 0x000A (10 decimal) and
0x0102 (258 decimal), respectively.
9C Starting Address
(HIGH Byte)
41 Starting Address
(LOW Byte)
00 Quantity of Registers
(HIGH Byte)
02 Quantity of Registers
(LOW Byte)
9C
41
00
02
Banner Engineering Corp. •Minneapolis, U.S.A.
www.bannerengineering.com•Tel:763.544.3164
P/N 130426 Rev. C 35
Page 38

Appendix
A-GAGE EZ-ARRAY
Instruction Manual
A.2 Modbus Tables
EZ-ARRAY uses the Holding Registers table for providing readwrite access to configuration data. The Holding Registers are
defined in the 40000-49999 address range. The Input Registers
table is used for providing read-only access to system status
and measurement data. The Input Registers are defined in
the 30000-39999 address range. EZ-ARRAY employs a direct
addressing scheme. For example, the input register at address
30000 is accessed by reading address 30000 (0x7530) directly
(i.e., the starting address is not an offset).
A.2.1 Holding Registers
Scan Configuration
The Scan Configuration contains the settings for the scan type
and receiver’s remote teach wire (gray wire) function.
Table A–1. Scan Conguration
Holding Register
Address
40000 LOW BYTE Scan Type
40000 HIGH BYTE Remote Teach/Gate
Value Type Description
0 Disabled Scanning is Disabled
1 Straight Straight Scanning
2 Single Edge Scanning for Single Edge
3 Double Edge
– Step 1
4 Double Edge
– Step 2
5 Double Edge
– Step 4
6 Double Edge
– Step 8
7 Double Edge
– Step 16
8 Double Edge
– Step 32
10 Carpet Nap Scanning for Carpet Nap Detection
MASK Member Name
Table A–2. Scan Type
Scanning for Edges of up to 3
objects (fires every channel)
Scanning for Edges of up to 3
objects (fires channels 1,3,5,…)
Scanning for Edges of up to 3
objects (fires channels 1,5,9,…)
Scanning for Edges of up to 3
objects (fires channels 1,9,17,…)
Scanning for Edges of up to 3
objects (fires channels 1,17,33,…)
Scanning for Edges of up to 3
objects (fires channels 1,33,65,…)
Applications
Table A–3. Remote Teach/Gate
Value Function Description
0 Disabled Disabled
1 Remote Teach Enabled with All Functionality
2 Alignment/
Sensitivity
3 Gate – Active
High
4 Gate – Active
Low
5 Gate – Rising
Edge
6 Gate – Falling
Edge
Only Alignment, Blanking, &
Sensitivity Adjustments can be
performed
Setting the gray wire in the high state
enables scanning
Setting the gray wire in the low state
enables scanning
A single scan will occur after the gray
wire goes from a low-to-high state
A single scan will occur after the gray
wire goes from a high-to-low state
Blanking Configuration
The blanking configuration contains the blanking bit-mask for the
EZ-ARRAY channels. Each register represents 16 channels.
Table A–4. Blanking Conguration
Holding
Register
Model
Address
40003 LOW BYTE Blanking 1–8
40003 HIGH BYTE Blanking 9–16
… … …
40025 LOW BYTE Blanking 353–360
150–1800 mm
40025 HIGH BYTE (Pad byte)
40250 LOW BYTE Blanking 1–8
40250 HIGH BYTE Blanking 9–16
… … …
40279 LOW BYTE Blanking 349–464
2100–2400 mm
40279 HIGH BYTE Blanking 465–480
Table A–5. Blanking Bit-Mask
Value Status Description
0 Non-Blanked The channel will be used during scanning
1 Blanked The channel will be skipped during
MASK Member Name
scanning
36 P/N 130426 Rev. C
Banner Engineering Corp. •Minneapolis, U.S.A.
www.bannerengineering.com•Tel:763.544.3164
Page 39
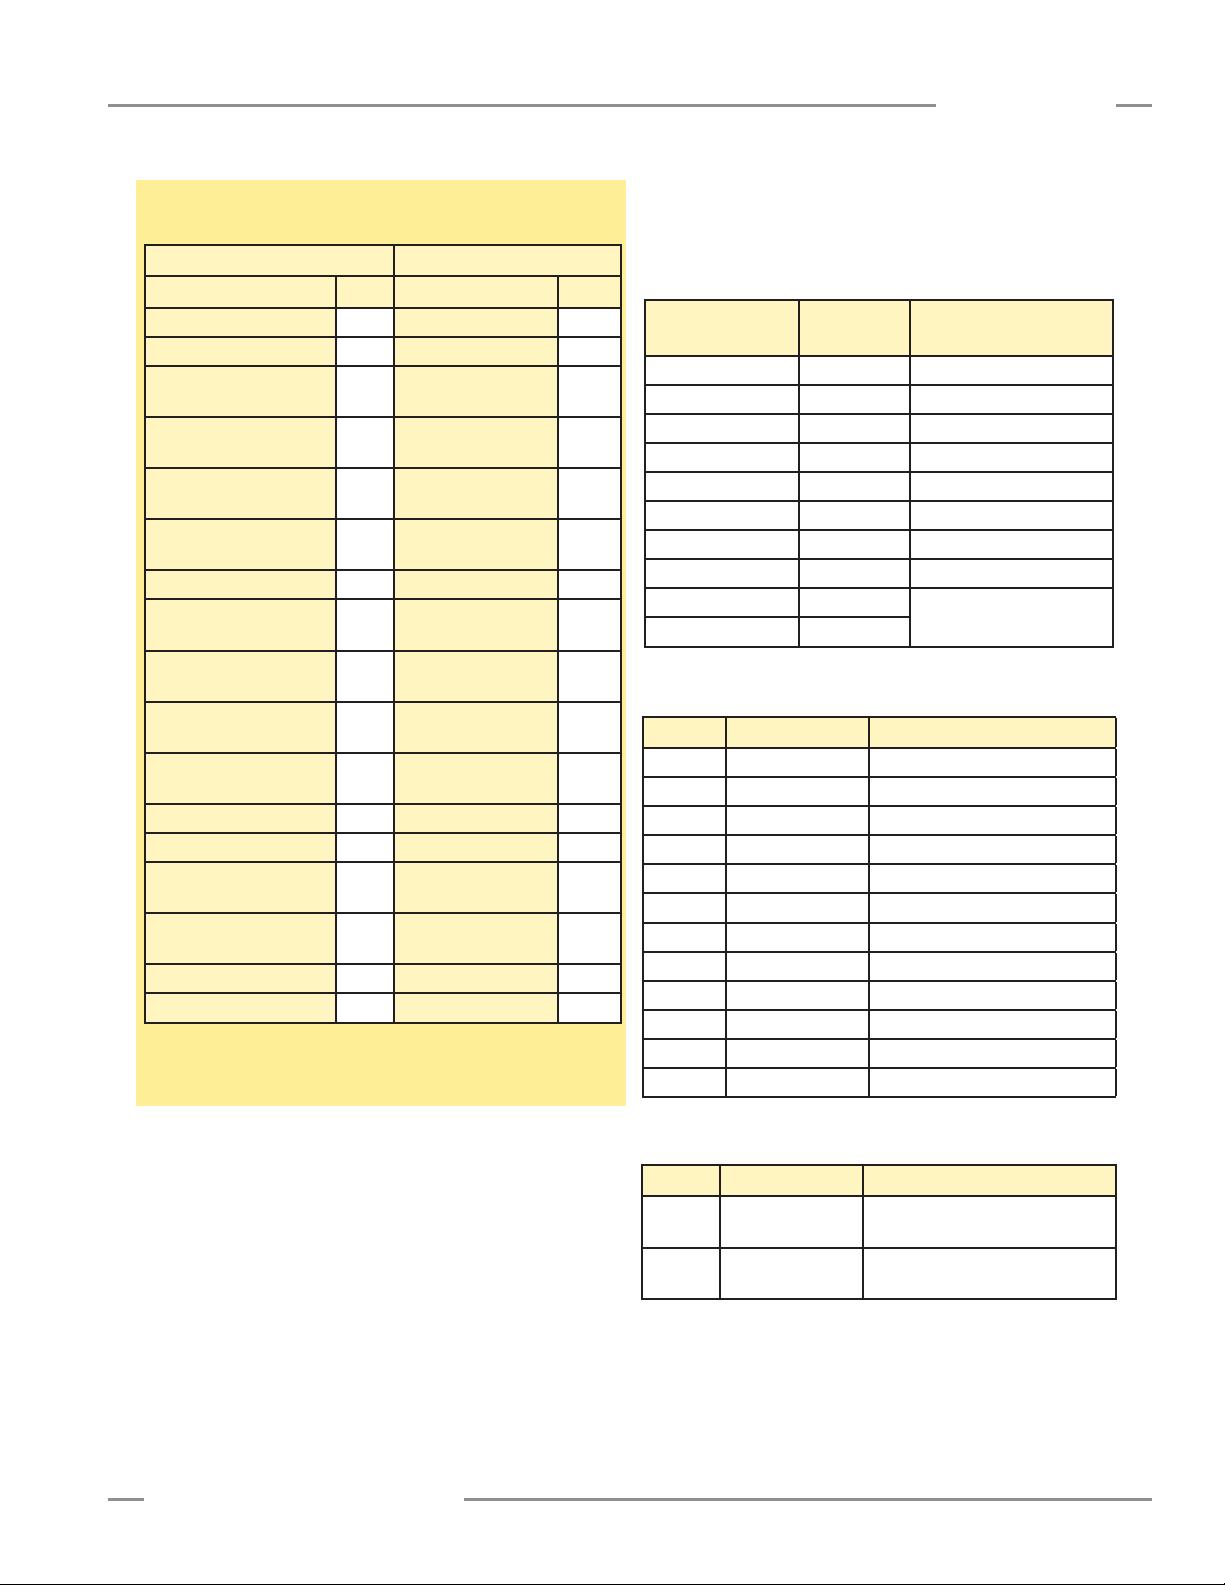
A-GAGE EZ-ARRAY
Instruction Manual
Appendix
Example A–4. Writing Blanking Conguration to Blank the First
2 Channels
Request Response
Field Name (Hex) Field Name (Hex)
Slave Address 41 Slave Address 41
Function 10 Function 10
Starting Address (HIGH
Byte)
Starting Address (LOW
Byte)
Quantity of Registers
(HIGH Byte)
Quantity of Registers
(LOW Byte)
Quantity of Bytes 2E CRC (LOW Byte) 51
Register 40003 (HIGH
Byte)
Register 40003 (LOW
Byte)
Register 40004 (HIGH
Byte)
Register 40004 (LOW
Byte)
… …
… …
Register 40025 (HIGH
Byte)
Register 40025(LOW
Byte)
CRC (LOW Byte) 3A
CRC (HIGH Byte) 96
To Blank the first 2 channels, the Blanking 1-16 register (address
40003) is set to the two-byte value of 0x0003 (3 decimal).
9C Starting Address
(HIGH Byte)
43 Starting Address
(LOW Byte)
00 Quantity of Registers
(HIGH Byte)
17 Quantity of Registers
(LOW Byte)
00 CRC (HIGH Byte) 43
03
00
00
00
00
9C
43
00
17
General Configuration
The General Configuration contains the general settings for the
EZ-ARRAY.
Table A–6. General Conguration
Holding Register
Address
40046 LOW BYTE Emitter Power
40046 HIGH BYTE Gain Method
40047 LOW BYTE Low Contrast Sensitivity
40047 HIGH BYTE HW Interface Flags
40048 LOW BYTE Measurement 1
40048 HIGH BYTE Measurement 2
40049 RESERVED
40050 Number of Dirty Channels
40051 Time of Service
40052
Value Function Description
0 Disabled Disabled
1 Level 1 Power Setting 1 (Lowest)
2 Level 2 Power Setting 2
3 Level 3 Power Setting 3
4 Level 4 Power Setting 4
5 Level 5 Power Setting 5
6 Level 6 Power Setting 6
7 Level 7 Power Setting 7
8 Level 8 Power Setting 8
9 Level 9 Power Setting 9
10 Level 10 Power Setting 10
11 Level 11 Power Setting 11 (Highest)
MASK Member Name
Table A–7. Emitter Power
Banner Engineering Corp. •Minneapolis, U.S.A.
www.bannerengineering.com•Tel:763.544.3164
Table A–8. Gain Method
Value Status Description
1 High-Excess Gain Fixed thresholds for maximum
excess gain
2 Low Contrast Adjustable percentage-based
thresholds (Straight Scan only)
P/N 130426 Rev. C 37
Page 40

Appendix
A-GAGE EZ-ARRAY
Instruction Manual
Table A–9. Low-Contrast Sensitivity
Value Function Blocked Threshold Set
0 10% 10% below aligned signal
1 15% 15% below aligned signal
2 20% 20% below aligned signal
3 25% 25% below aligned signal
4 30% 30% below aligned signal
5 25% 35% below aligned signal
6 40% 40% below aligned signal
7 45% 45% below aligned signal
8 50% 50% below aligned signal
Table A–10. HW Interface Flags
Bit Flag Description
0 Display Orientation 0 = Normal, 1 = Inverted
1 DIP Switch Interface 0 = Enabled, 1 = Disabled
2 Sensitivity Button 0 = Enabled, 1 = Disabled
3 Align/Blank Button 0 = Enabled, 1 = Disabled
Table A–11. Measurement 1 and Measurement 2
Value Function Description
0 Disabled Disabled
1 FBB First Beam Blocked
2 LBB Last Beam Blocked
3 TBB Total Beams Blocked
4 TRN Transitions
5 CBB Contiguous Beams Blocked
6 FBM First Beam Made
7 LBM Last Beam Made
8 TBM Total Beams Made
9 CBM Contiguous Beams Made
10 MBB Middle Beam Blocked
11 OD Outer Diameter
12 ID Inner Diameter
13 CFBB Contiguous First Beam Blocked
14 CLBB Contiguous Last Beam Blocked
15 O1 FBB Object 1 First Beam Blocked
16 O1 LBB Object 1 Last Beam Blocked
17 O2 FBB Object 2 First Beam Blocked
18 O2 LBB Object 2 Last Beam Blocked
19 O3 FBB Object 3 First Beam Blocked
20 O3 LBB Object 3 Last Beam Blocked
21 CARPET NAP Carpet Nap
24 CARPET EDGE Carpet Edge
25 SPECIAL Reserved for Specials
38 P/N 130426 Rev. C
Table A–12. Number of Dirty Channels
Range Description
1-480 Number of channels that need to be dirty before
indicator is lit
Table A–13. Time of Service
Range Description
2^32-1 Number of hours EZ-ARRAY has been in
operation
Communications Configuration
The Communications Configuration contains the settings for the
Modbus/RS-485 communications.
Table A–14. Communications Conguration
Holding Register
Address
41000 LOW BYTE Address
41000 HIGH BYTE Parity
41001 LOW BYTE Baud Rate
41001 HIGH BYTE Modbus Timeouts
41002 Cache Mode
Table A–15. Modbus Address
Range Description
1-247
Value
0 Even Even parity bit is used
1 Odd Odd parity bit is used
2 None No parity is used (stop bits MUST be set to 2)
Value
0 19200 EZ-ARRAY communicates at 19.2 Kb/s
1 9600 EZ-ARRAY communicates at 9.6 Kb/s
2 38400
Modbus address for EZ-ARRAY
Type
Baud
Rate
Table A–18. Modbus Timeouts
Value Type Description
0 Compliant EZ-ARRAY adheres to strict Modbus timing
1 Extended EZ-ARRAY relaxes PC timing to 2x the
MASK Member Name
Table A–16. Parity
Description
Table A–17. Baud Rate
Description
EZ-ARRAY communicates at 38.4 Kb/s)
Modbus timing specifications
Banner Engineering Corp. •Minneapolis, U.S.A.
www.bannerengineering.com•Tel:763.544.3164
Page 41

A-GAGE EZ-ARRAY
Instruction Manual
Appendix
Table A–19. Cache Mode
Value Type Description
0 Standard Active measurements are cached
1 Extended Active measurements and channel states
are cached (decreases MAX scan rate)
Analog Output 1 Configuration
The Analog Output 1 Configuration contains the settings for the
first analog output.
Table A–20. Analog Output 1 Conguration
Holding Register
Address
40026 LOW BYTE Config Flags
40026 HIGH BYTE RESERVED
40027 LOW BYTE Filter Speed
40027 HIGH BYTE RESERVED
40028 NULL Output
40028 SPAN Output
Table A–21. Cong Flags (Analog Outputs 1 and 2)
Bit Flag Description
0 Slope 0 = Negative, 1 = Positive
1 Measurement 0 = Measurement 2, 1 = Measurement 1
2 ZERO Value 00 = Hold, 01 = Minimum, 10 = Maximum
3
4 Peak Detect 0 = Disabled, 1 = Enabled
5 Peak Detect
Direction
6 Status 0 = Disabled, 1 = Enabled
7 Peak Detect
Reset
MASK Member Name
0 = Maximum, 1 = Minimum
0 = Auto, 1 = External Communications
Table A–24. SPAN Output (Analog Outputs 1 and 2)
Range Description
0-4095
Maximum DAC value of Analog Output
(MUST be > NULL Output)
Analog Output 2 Configuration
The Analog Output 2 Configuration contains the settings for the
second analog output.
Table A–25. Analog Output 2 Conguration
Holding Register
Address
40030 LOW BYTE Config Flags
40030 HIGH BYTE RESERVED
40031 LOW BYTE Filter Speed
40031 HIGH BYTE RESERVED
40032
40033
MASK Member Name
NULL Output
SPAN Output
Discrete Output 1 Configuration
The Discrete Output 1 Configuration contains the settings for the
first discrete output.
Table A–26. Discrete Output 1 Conguration
Holding Register
Address
40034 LOW BYTE Config Flags
40034 HIGH BYTE RESERVED
40035
40036
40037
40038
40039
Table A–27. Cong Flags (Discrete Outputs 1 and 2)
MASK Member Name
Scan Response
Hysteresis LOW
Hysteresis HIGH
Threshold LOW
Threshold HIGH
Table A–22. Filter Speed (Analog Outputs 1 and 2)
Value Filter Speed Description
0 Fast No filtering
1 Medium
3 Slow
Filter step response is 6 scans for
98% of signal
Filter step response is 24 scans for
98% of signal
Table A–23. NULL Output (Analog Outputs 1 and 2)
Range Description
0-4095
Banner Engineering Corp. •Minneapolis, U.S.A.
www.bannerengineering.com•Tel:763.544.3164
Minimum DAC value of Analog Output
(MUST be < SPAN Output)
Bit Flag Description
0 Status 0 = Disabled, 1 = Enabled
0 = Measurement, 1 = Alarm/Health
1 Type
2 Polarity 0 = PNP, 1 = NPN
3 Mode*
4 Measurement
*For Alarm/Health Type, Mode setting corresponds to 0=Health, 1=Alarm
(Discrete Output 1 can ONLY be of
type Measurement)
0 = Normally Closed (Health)
1 = Normally Open (Alarm)
0 = Measurement 2
1 = Measurement 1
P/N 130426 Rev. C 39
Page 42

Appendix
A-GAGE EZ-ARRAY
Instruction Manual
Table A–28. Scan Response (Discrete Outputs 1 and 2)
Range Description
1-250
Number of consecutive measurements before
changing state
Table A–29. Hysteresis LOW (Discrete Outputs 1 and 2)
Range Description
0-479
Lower hysteresis threshold for discrete output
(MUST be < Threshold LOW)
Table A–30. Hysteresis HIGH (Discrete Outputs 1 and 2)
Range Description
2-481
Upper hysteresis threshold for discrete output
(MUST be > Threshold HIGH)
Table A–31. Threshold LOW (Discrete Outputs 1 and 2)
Range Description
1-480
Lower threshold for discrete output
(MUST be <= Threshold HIGH)
Table A–32. Threshold HIGH (Discrete Outputs 1 and 2)
Range Description
1-480
Upper threshold for discrete output
(MUST be >= Threshold LOW)
Discrete Output 2 Configuration
The Discrete Output 2 Configuration contains the settings for the
second discrete output.
Table A–33. Discrete Output 2 Conguration
Holding Register
Address
40040 LOW BYTE Config
40040 HIGH BYTE RESERVED
40041
40042
40043
40044
40045
MASK Member Name
Demodulation Count
Hysteresis LOW
Hysteresis HIGH
Threshold LOW
Threshold HIGH
A.3 Input Registers
A.3.1 Active Measurements
The Active Measurements section contains the current values
of the two measurements that were configured in the General
Configuration. The Active Measurements data can be read after
each scan.
Table A–34. Active Measurements
Input Register
Address
30001 Measurement 1
30002
Table A–35. Measurement 1 and Measurement 2
Range Description
0-1920
Measurements are represented in 4x channel
resolution
Example A–5. Reading Active Measurements
Request Response
Field Name (Hex) Field Name (Hex)
Slave Address 41 Slave Address 41
Function 04 Function 04
Starting Address
(HIGH Byte)
Starting Address
(LOW Byte)
Quantity of Registers
(HIGH Byte)
Quantity of Registers
(LOW Byte)
CRC (LOW Byte) 34
CRC (HIGH Byte) C8 CRC (LOW Byte) BB
To read the Active Measurements, a read input registers request
is sent starting at address 30001, requesting 2 registers.
MASK Member Name
Measurement 2
75 Byte Count 04
31
00
02
Register 30001
(HIGH Byte)
Register 30001
(LOW Byte)
Register 30002
(HIGH Byte)
Register 30002
(LOW Byte)
CRC (HIGH Byte) E6
00
20
00
90
40 P/N 130426 Rev. C
Banner Engineering Corp. •Minneapolis, U.S.A.
www.bannerengineering.com•Tel:763.544.3164
Page 43

A-GAGE EZ-ARRAY
Instruction Manual
Appendix
A.3.2 ALL Measurements
The ALL Measurements section contains the current values of
all the available measurements. The ALL Measurements data
can be read after every third scan.
Table A–36. ALL Measurements
Input Registers Member Name
30500 FBB
30501 LBB
30502 TBB
30503 TRN
30504 CBB
30505 FBM
30506 LBM
30507 TBM
30508 CBM
30509 MBB
30510 OD
30511 ID
30512 CFBB
30513 CLBB
30514 O1 FBB
30515 O1 LBB
30516 O2 FBB
30517 O2 LBB
30518 O3 FBB
30519 O3 LBB
30520 CARPET NAP
30521 AO1 PEAK
30522 AO2 PEAK
30523 CARPET EDGE
30524 SPECIAL
Table A–37. Measurements (ALL)
Range Description
0-1920
Measurements are represented in 4x channel
resolution
Example A–6. Reading ALL Measurements
Request Response
Field Name (Hex) Field Name (Hex)
Slave Address 41 Slave Address 41
Function 04 Function 04
Starting Address
(HIGH Byte)
Starting Address
(LOW Byte)
Quantity of Registers
(HIGH Byte)
Quantity of Registers
(LOW Byte)
CRC (LOW Byte) 64
CRC (HIGH Byte) BF … …
77 Byte Count 32
24
00
19
Register 30500
(HIGH Byte)
Register 30500
(LOW Byte)
Register 30501
(HIGH Byte)
Register 30501
(LOW Byte)
… …
Register 30524
(HIGH Byte)
Register 30524
(LOW Byte)
CRC (LOW Byte) 28
CRC (HIGH Byte) C0
00
00
00
00
00
00
To read ALL Measurements, a read input registers request is
sent starting at address 30500, and requesting 25 registers.
AO1 PEAK and AO2 PEAK Measurements
The AO1 PEAK and AO2 PEAK measurements store the
minimum/maximum values of Analog Output 1 and Analog
Output 2 respectively. When the EZ-ARRAY’s Analog Outputs
are configured to have Peak Detect = Enabled and Peak
Detect Reset = External Communications, then reading these
measurements will reset the Analog Output Peak Detect value.
To enable this mode of operation, the Analog Output’s Config
Flags register (address 40026 – AO1, address 40030 – AO2)
must be configured as shown in Example A–7.
Banner Engineering Corp. •Minneapolis, U.S.A.
www.bannerengineering.com•Tel:763.544.3164
P/N 130426 Rev. C 41
Page 44
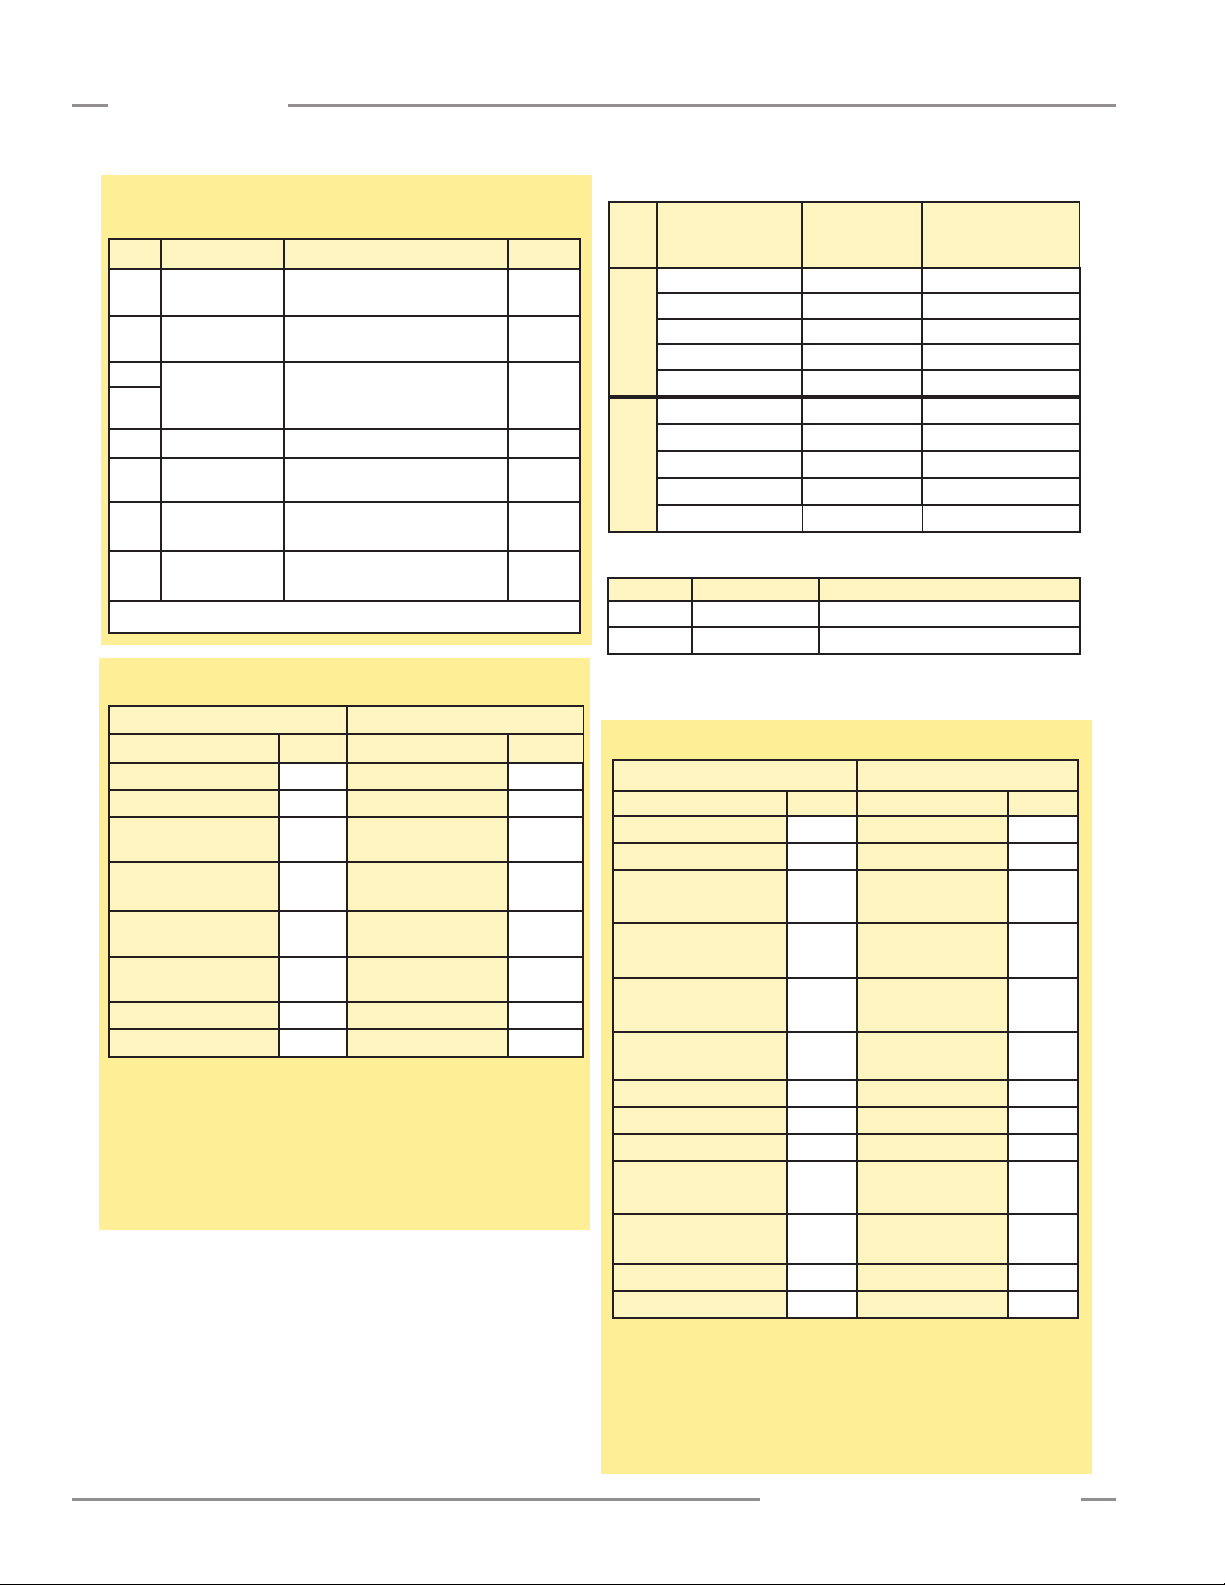
Appendix
A-GAGE EZ-ARRAY
Instruction Manual
Example A–7. Analog Output Cong Flags for Peak Detection
with External Comm Reset
Bit Flag Description Value
0 Slope
1 Measurement
2
ZERO Value
3
4 Peak Detect 0 = Disabled, 1 = Enabled 1
Peak Detect
5
Direction
6 Status
Peak Detect
7
Reset
* “X” denotes a “don’t care” value.
0 = Negative
1 = Positive
0 = Measurement 2
1 = Measurement 1
00 = Hold
01 = Minimum
10 = Maximum
0 = Maximum
1 = Minimum
0 = Disabled
1 = Enabled
0 = Auto
1 = External Communications
X*
X
XX
X
1
1
Example A–8. Reading A01 PEAK Measurement
Request Response
Field Name (Hex) Field Name (Hex)
Slave Address 41 Slave Address 41
Function 04 Function 04
Starting Address
(HIGH Byte)
Starting Address
(LOW Byte)
Quantity of Registers
(HIGH Byte)
Quantity of Registers
(LOW Byte)
CRC (LOW Byte) F4 CRC (HIGH Byte) 87
CRC (HIGH Byte) B3
77 Byte Count 02
39
00
01 CRC (LOW Byte) B8
Register 30521
(HIGH Byte)
Register 30521
(LOW Byte)
00
A0
This input register request will read the current Peak value of
Analog Output 1, and will reset the value all in one action.
A.3.3 Channel States
The Channel States section contains the state of all the channels
in the EZ-ARRAY. Each register represents 16 channels.
Table A–38. Channel States
Input Register
Address
Model
30003 LOW BYTE Channel 1-8
30003 HIGH BYTE Channel 9-16
… … …
30025 LOW BYTE Channel 353-360
150–1800 mm
30025 HIGH BYTE (pad byte)
30003 LOW BYTE Channel 1-8
30003 HIGH BYTE Channel 9-16
… … …
30025 LOW BYTE Channel 349-364
2100–2400 mm
30025 HIGH BYTE Channel 365-380
MASK Member Name
Table A–39. Channel States Bit-Mask
Value State Description
0 Made The channel is made (clear)
1 Blocked The channel is blocked
For example, if the first and third beams of the EZ-ARRAY are
blocked, input register 30003 would contain the value 0x0005.
Example A–9. Reading ALL Channel States
Request Response
Field Name (Hex) Field Name (Hex)
Slave Address 41 Slave Address 41
Function 04 Function 04
Starting Address
(HIGH Byte)
Starting Address
(LOW Byte)
Quantity of Registers
(HIGH Byte)
Quantity of Registers
(LOW Byte)
CRC (LOW Byte) 54 00
CRC (HIGH Byte) C7 … …
To read ALL Channel States, a read input registers request is
sent starting at address 30003, and requesting 23 registers.
75 Byte Count 32
33
00
17
Register 30003
(HIGH Byte)
Register 30003
(LOW Byte)
Register 30004
(HIGH Byte)
… …
Register 30025
(HIGH Byte)
Register 30025
(LOW Byte)
CRC (LOW Byte) 43
CRC (HIGH Byte) B6
00
00
00
00
00
42 P/N 130426 Rev. C
The channel states can be accessed after each scan, if Cache
Mode is set to Extended in the Communications Configuration.
Example continued on next page
Banner Engineering Corp. •Minneapolis, U.S.A.
www.bannerengineering.com•Tel:763.544.3164
Page 45
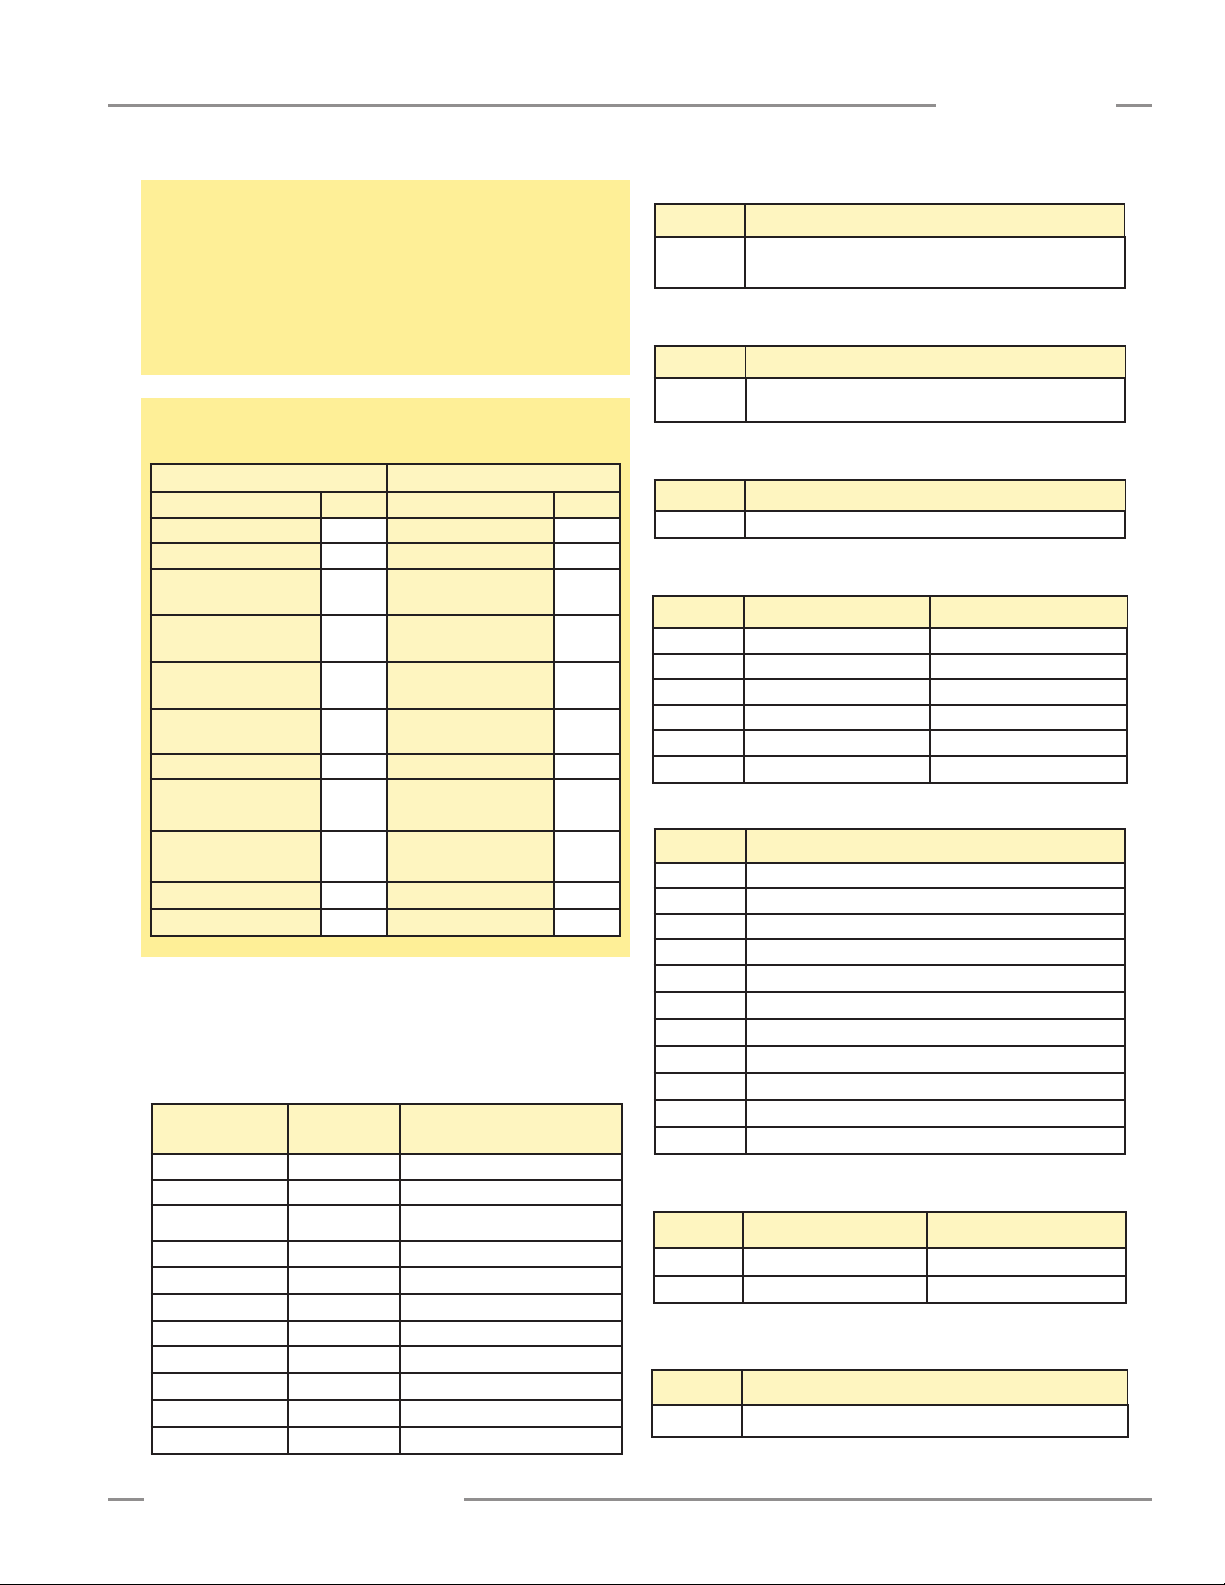
A-GAGE EZ-ARRAY
Instruction Manual
Appendix
Example continued from previous page
Otherwise, the Channel States data can be accessed after every
third scan (default). To set the EZ-ARRAY in Extended Cache
Mode, the register at address 41002 must be set to a value of 1.
This is a configuration register (Communications Configuration),
so this register only needs to be set once. To exit Extended
Cache Mode, the register must be set to a value of 0.
Example A–10. Writing Communications Conguration to
Enable Extended Cache Mode
Request Response
Field Name (Hex) Field Name (Hex)
Slave Address 41 Slave Address 41
Function 10 Function 10
Starting Address
(HIGH Byte)
Starting Address
(LOW Byte)
Quantity of Registers
(HIGH Byte)
Quantity of Registers
(LOW Byte)
Quantity of Bytes 02 CRC (LOW Byte) 32
Register 41002
(HIGH Byte)
Register 41002
(LOW Byte)
CRC (LOW Byte) F1
CRC (HIGH Byte) 93
A0
2A
00
01
00 CRC (HIGH Byte) 65
01
Starting Address
(HIGH Byte)
Starting Address
(LOW Byte)
Quantity of Registers
(HIGH Byte)
Quantity of Registers
(LOW Byte)
A0
2A
00
01
A.3.4 System Info and Status
The System Info and Status section contains the current status
of the EZ-ARRAY.
Table A–40. System Info and Status
Input Register
Address
30026 Number of Emitter Channels
30027
30028
30029
30030 LOW BYTE DIP Switch
30030 HIGH BYTE ERROR Code
30031 LOW BYTE RESERVED
30031 HIGH BYTE Discrete Outputs
30032
30033
30034
MASK Member Name
Emitter First Bad Channel
Number of Receiver Channels
RESERVED
Analog Output 1 DAC
Analog Output 2 DAC
RESERVED
Table A–41. Number of Emitter Channels
Range Description
30-480
Number of channels the emitter has
(multiples of 30)
Table A–42. Emitter First Bad Channel
Range Description
0-480
First channel that emitter is unable to fire
(0 = no bad channels)
Table A–43. Number of Receiver Channels
Range Description
30-480 Number of Receiver channels (multiples of 30)
Table A–44. DIP Switch
Bit Function Description
0 DIP Switch 6 0 = ON, 1 = OFF
1 DIP Switch 5 0 = ON, 1 = OFF
2 DIP Switch 4 0 = ON, 1 = OFF
3 DIP Switch 3 0 = ON, 1 = OFF
4 DIP Switch 2 0 = ON, 1 = OFF
5 DIP Switch 1 0 = ON, 1 = OFF
Table A–45. ERROR Code
Value Status
0 System OK
1 Receiver EEPROM Hard Failure
2 Receiver Alignment/Blanking Configuration Error
3 Reserved for Factory 3
4 Emitter or Wiring Problem
5 Emitter Channel Error
6 Reserved For Factory 6
7 Reserved For Factory 7
8 Reserved For Factory 8
9 Reserved For Factory 9
10 Incompatible Scan and Measurement Mode
Table A–46. Discrete Outputs
Bit Function Description
0 Discrete Output 1 0 = OFF, 1 = ON
1 Discrete Output 2 0 = OFF, 1 = ON
Table A–47. Analog Output 1 DAC and
Analog Output 2 DAC
Range Description
0-4095 Current DAC value of analog output
Banner Engineering Corp. •Minneapolis, U.S.A.
www.bannerengineering.com•Tel:763.544.3164
P/N 130426 Rev. C 43
Page 46
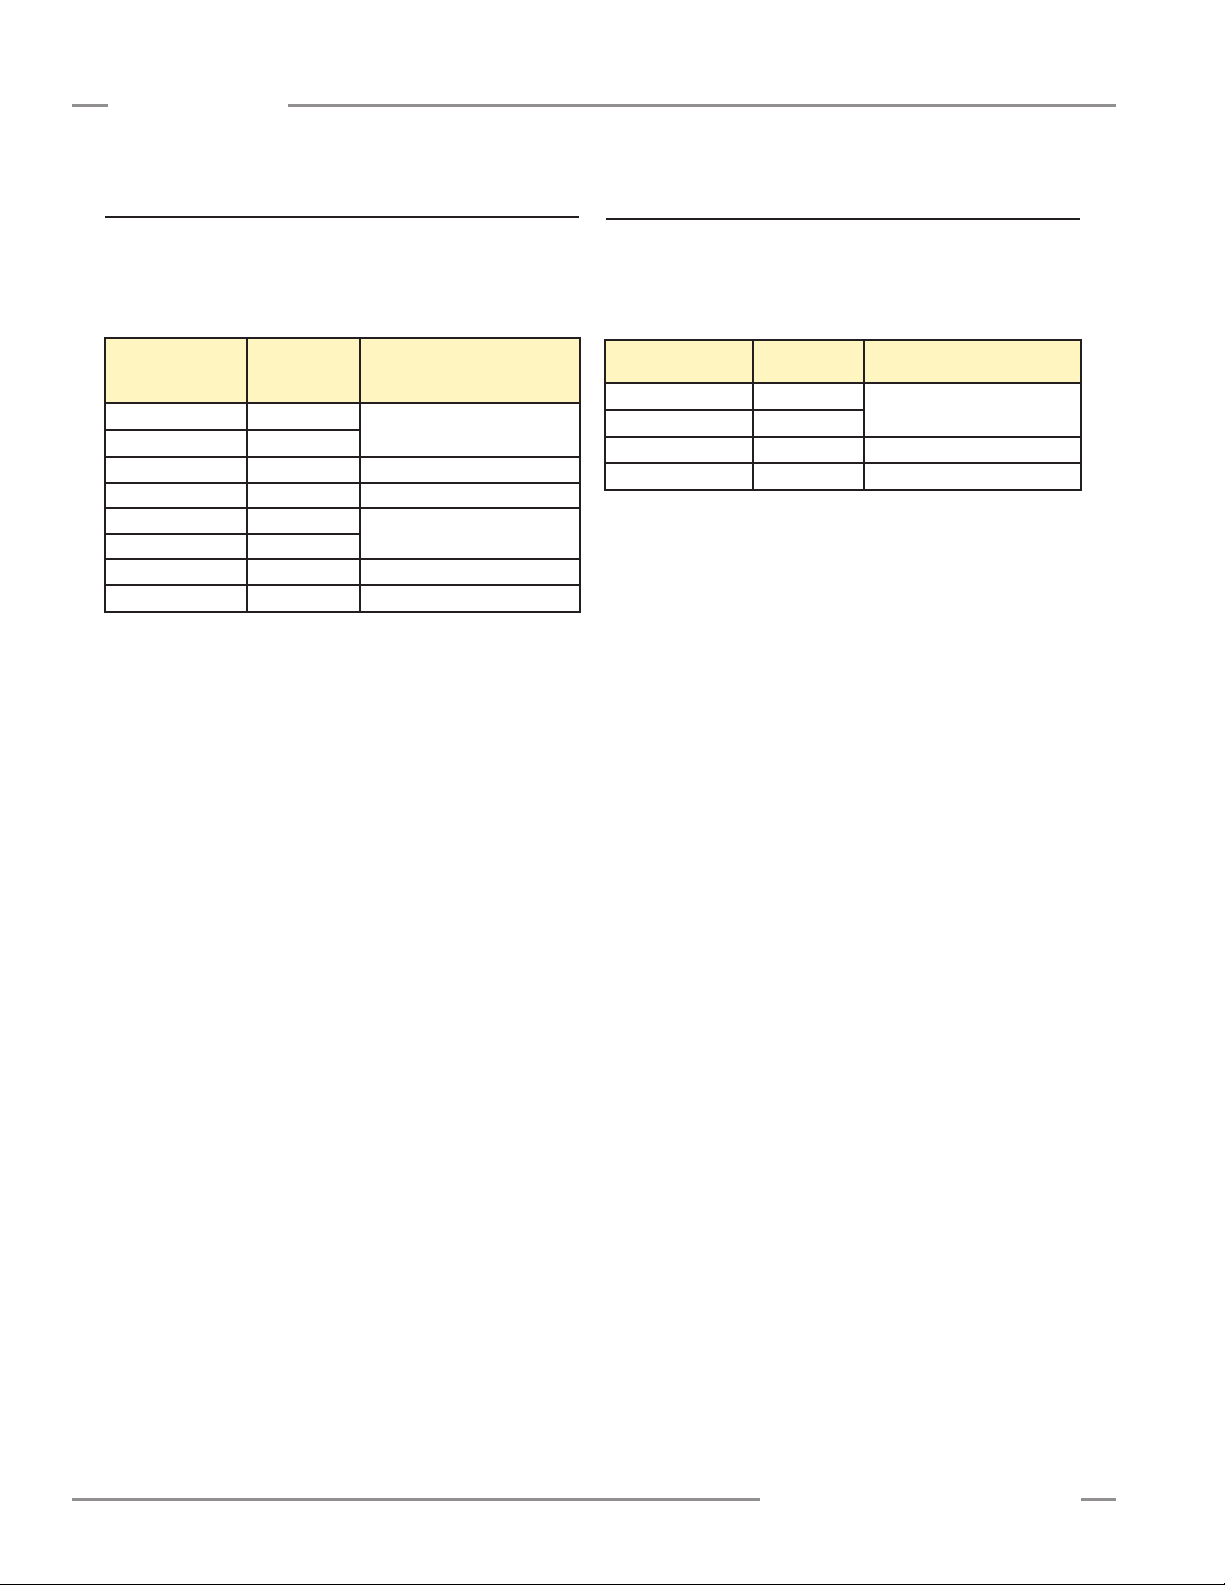
Appendix
A-GAGE EZ-ARRAY
Instruction Manual
A.5 Receiver and Emitter Version Info
The Receiver and Emitter Version Info section contains the part
numbers and versions of the receiver and emitter firmware.
Table A–48. Receiver and Emitter Version Info
Input Register
Address
31000
31001
31002 LOW BYTE Receiver Version
31002 HIGH BYTE RESERVED
31003
31004
31005 LOW BYTE Emitter Version
31005 HIGH BYTE RESERVED
MASK Member Name
Receiver Part Number
Emitter Part Number
A.6 Communications Version Info
The Communications Version Info section contains the part
number and version of the communications firmware.
Table A–49. Communications Version Info
Input Registers MASK Member Name
32000
32001
32002 LOW BYTE Version
32002 HIGH BYTE RESERVED
Part Number
44 P/N 130426 Rev. C
Banner Engineering Corp. •Minneapolis, U.S.A.
www.bannerengineering.com•Tel:763.544.3164
Page 47

A-GAGE EZ-ARRAY
Instruction Manual
Glossary
Blanked Beam: A beam that is “ignored” by the receiver, as
a result of a blanking program being applied to it. Beams (or
groups of beams) are blanked when a component or fixture will
remain in or move through the light screen array; blanking the
affected beams prevents the component or fixture from causing
false outputs.
Blocked Beam: A beam that is obstructed between the emitter
and the receiver, and is not blanked.
Appendix
Clear Beam:
the receiver (same as a made or unblocked beam).
Excess Gain:
on the receiver from the emitter over and above the minimum
amount required for operation. A-GAGE EZ-ARRAY emitters
and receivers can perform an electronic Alignment procedure to
equalize the amount of excess gain at each element along the
array.
Host:
receives input from the High-Resolution MINI-ARRAY System,
and/or other equipment and systems within a factory.
Made Beam:
the receiver (same as an unblocked or clear beam).
Unblocked Beam: A beam that runs unobstructed from the
emitter to the receiver (same as a made or clear beam).
A beam that runs unobstructed from the emitter to
A measurement of the amount of light falling
A computer or process controller that controls and
A beam that runs unobstructed from the emitter to
Banner Engineering Corp. •Minneapolis, U.S.A.
www.bannerengineering.com•Tel:763.544.3164
P/N 130426 Rev. C 45
Page 48

Banner Engineering Corp Limited Warranty
BannerEngineeringCorp.,9714TenthAve.No.,Mpls.,MN55441•Ph:763.544.3164•www.bannerengineering.com•Email:sensors@bannerengineering.com
Banner Engineering Corp. warrants its products to be free from defects in material and workmanship for one year
following the date of shipment. Banner Engineering Corp. will repair or replace, free of charge, any product of its
manufacture which, at the time it is returned to the factory, is found to have been defective during the warranty
period.This warranty does not cover damage or liability for misuse, abuse, or the improper application or installation of
the Banner product.
THIS LIMITED WARRANTY IS EXCLUSIVE AND IN LIEU OF ALL OTHER WARRANTIES WHETHER EXPRESS OR
IMPLIED (INCLUDING, WITHOUT LIMITATION, ANY WARRANTY OF MERCHANTABILITY OR FITNESS FOR A
PARTICULAR PURPOSE), AND WHETHER ARISING UNDER COURSE OF PERFORMANCE, COURSE OF DEALING OR TRADE USAGE.
This Warranty is exclusive and limited to repair or, at the discretion of Banner Engineering Corp., replacement. IN NO
EVENT SHALL BANNER ENGINEERING CORP. BE LIABLE TO BUYER OR ANY OTHER PERSON OR ENTITY FOR
ANY EXTRA COSTS, EXPENSES, LOSSES, LOSS OF PROFITS, OR ANY INCIDENTAL, CONSEQUENTIAL OR
SPECIAL DAMAGES RESULTING FROM ANY PRODUCT DEFECT OR FROM THE USE OR INABILITY TO USE
THE PRODUCT, WHETHER ARISING IN CONTRACT OR WARRANTY, STATUTE, TORT, STRICT LIABILITY,
NEGLIGENCE, OR OTHERWISE.
Banner Engineering Corp. reserves the right to change, modify or improve the design of the product without assuming
any obligations or liabilities relating to any product previously manufactured by Banner Engineering Corp.
P/N 130426 Rev. C
 Loading...