

Page 1
· DC to 102.4 kHz bandwidth
· 90 dB dynamic range
· Low-distortion synthesized source
· 145 dB dynamic range in
swept-sine mode
· Order tracking
· 20-pole/20-zero curve fitting
· Real-time octave analysis
· Up to 32 Mbyte memory
· GPIB and RS-232 interfaces
· SR785 ... $11,950
(U.S. list)
Stanford Research Systems phone: (408)744-9040
www.thinkSRS.com
The SR785 Two-Channel Dynamic Signal Analyzer is a
precision, full-featured signal analyzer that offers state-of-the-art
performance at a price that's less than half that of competitive
analyzers. Building on its predecessor, the SR780, the SR785
incorporates new firmware and hardware that make it the ideal
instrument for analyzing both mechanical and electrical
systems. For measurements involving servo systems, control
systems, acoustics, vibration testing, modal analysis, or
machinery diagnostics, the SR785 has the features and
specifications to get the job done.
Standard measurement groups include FFT, order tracking,
octave, swept-sine, correlation, time capture, and
time/histogram. The SR785 brings the power of several
instruments to your application: a spectrum analyzer, network
analyzer, vibration analyzer, octave analyzer and oscilloscope.
A unique measurement architecture allows the SR785 to
function as a typical dual-channel analyzer with
measurements like cross spectrum, frequency response,
coherence, etc. Alternatively, the instrument can be configured
so that each input channel functions as a single-channel
analyzer with its own span, center frequency, resolution and
averaging. This allows you to view a wide-band spectrum and
simultaneously zoom in on spectral details. The same
advanced architecture provides storage of all measurement
building blocks and averaging modes. Vector averaged, rms
averaged, unaveraged, and peak hold versions of all
SR785 Dynamic Signal Analyzer
FFT Spectrum Analyzers
SR785 100 kHz 2-channel dynamic signal analyzer
www.thinkSRS.com
Page 2
measurements are simultaneously acquired and can be
displayed without re-taking data.
Averaging
The SR785 comes equipped with a wide selection of
averaging techniques to improve signal-to-noise ratio. RMS
averaging reduces signal fluctuations, while vector averaging
minimizes noise from synchronous signals. Peak hold
averaging is also available. Both linear and exponential
averaging are provided for each mode.
Because the SR785 is so fast, there's no need for a separate
“fast averaging” mode. For instance, in a full-span FFT
measurement with a 4 ms time record, 1000 averages take
exactly 4 seconds, during which the SR785 still operates at its
maximum display rate.
For impact testing, the average preview feature allows each
time record or spectrum to be accepted or rejected before
adding it to the measurement.
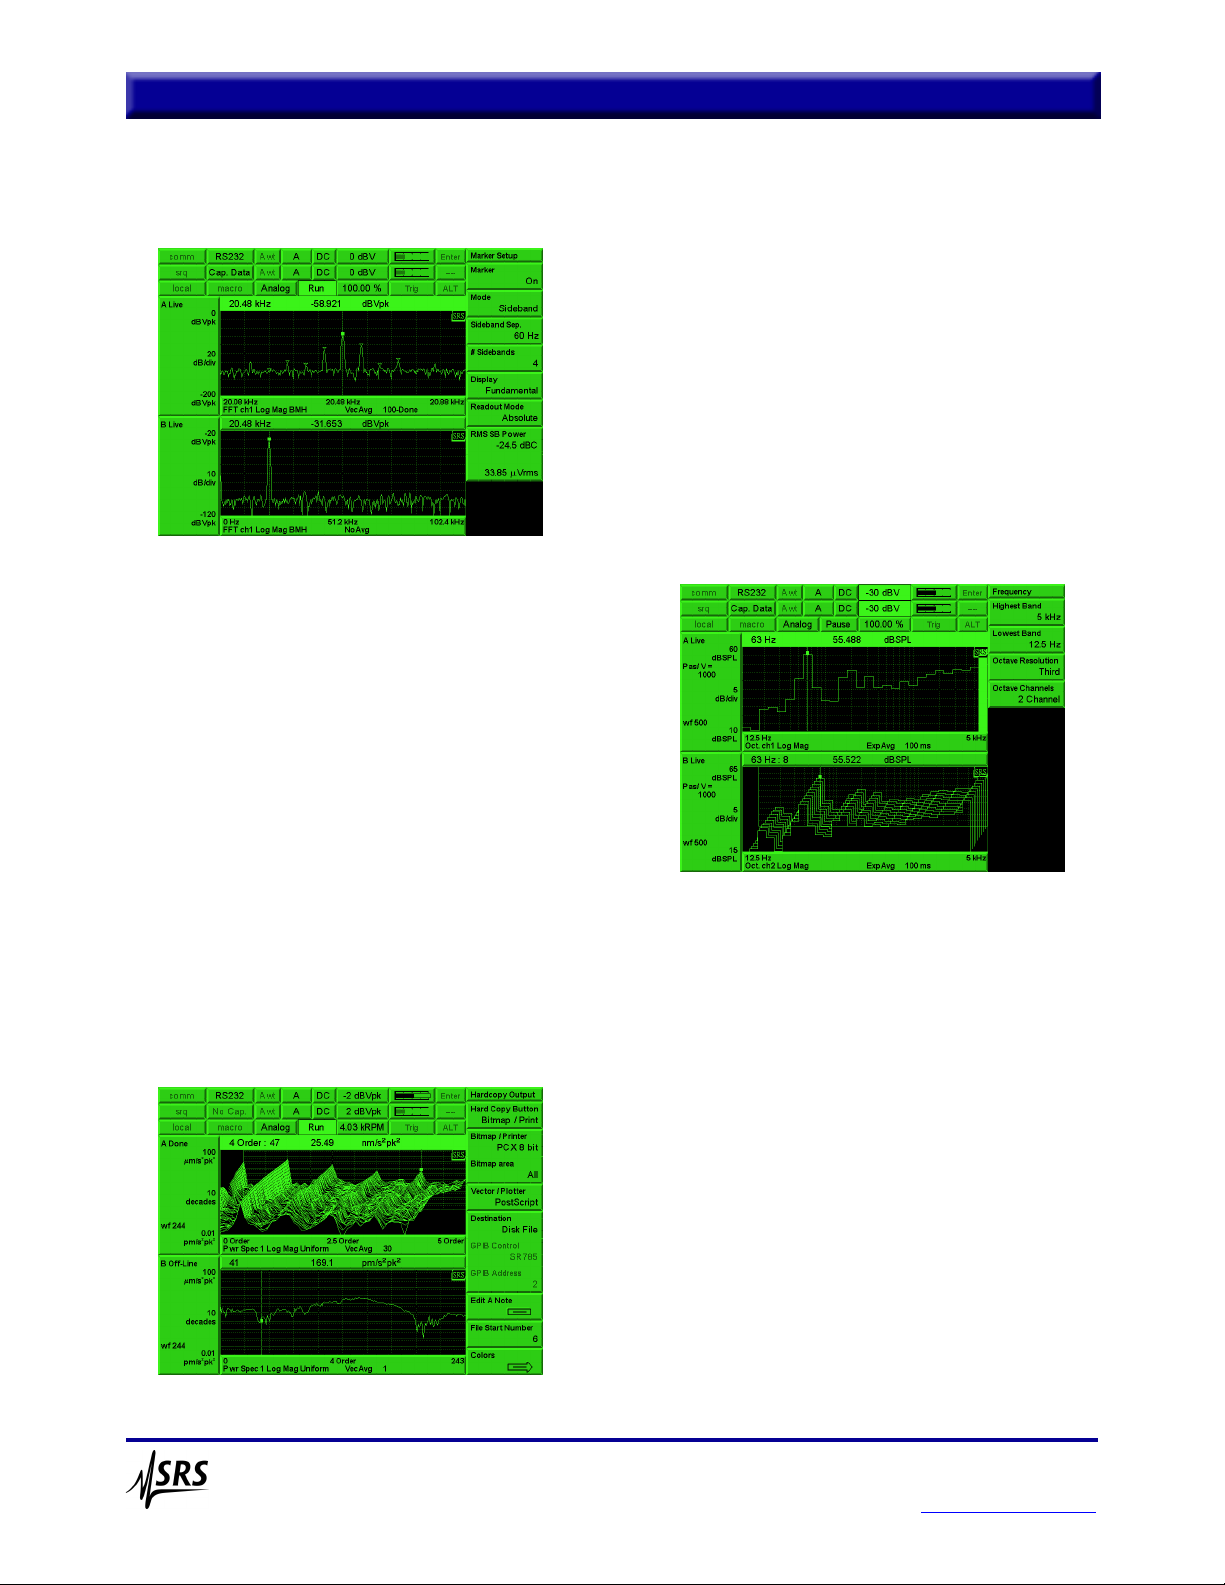
Order Tracking
Order tracking is used to evaluate the behavior of rotating
machinery. Measurement data is displayed as a function of
multiples of the shaft frequency (orders), rather than absolute
frequency. Combined with a waterfall plot, the SR785
provides a complete history or "order map" of your data as a
function of time or rpm. Using the slice feature, the amplitude
profile of specific orders in the map can be analyzed.
In tracked order mode, the intensity of individual orders vs. rpm
is measured. Unlike other analyzers, there's no need to track a
limited number of orders to ensure full speed measurements.
The SR785's speed allows simultaneous tracking of up to
400 orders.
Run-up and run-down measurements are available in both
polar and magnitude/phase formats. RPM profiling is
provided to monitor variations of rpm as a function of time.
A complete selection of time and rpm triggering modes is
included, allowing you to make virtually any rotating
machinery measurement.
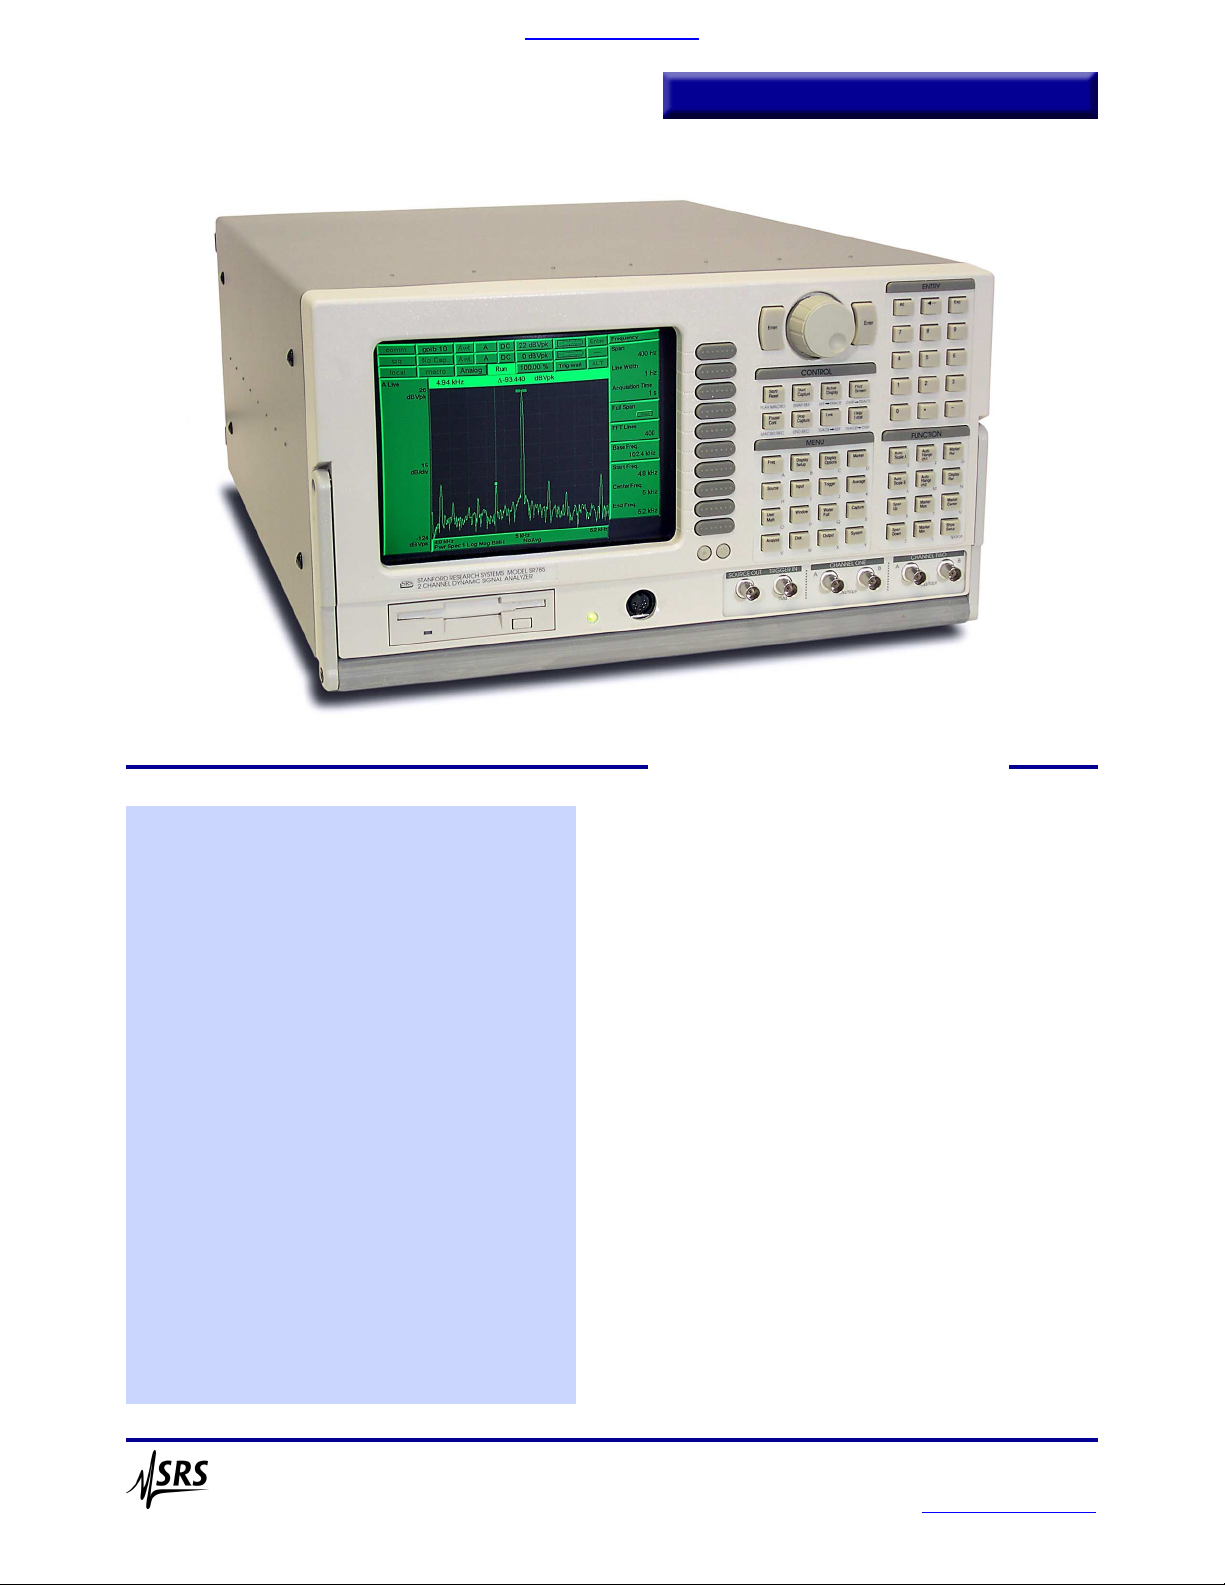
Octave Analysis
Real-time 1/1, 1/3 and 1/12 octave analysis, at frequencies up
to 40 kHz (single channel) or 20 kHz (dual channel), is a
standard feature of the SR785. Octave analysis is fully
compliant with ANSI S1.11-1986 (Order 3, type 1-D) and
IEC 225-1966. Switchable analog A-weighting filters, as well
as A, B and C weighting math functions, are included.
Averaging choices include exponential time averaging, linear
time averaging, peak hold, and equal confidence averaging.
Broadband sound level is measured and displayed as the last
band in the octave graph. Total power, impulse, peak hold and
L
eq
are all available. Exponentially averaged sound power
(L
eq
) is calculated according to ANSI S1.4-1983, Type 0.
Octave displays can be plotted as waterfalls with a fast 4 ms
storage interval. Once data is stored in the waterfall buffer, the
SR785 can display centile exceedance statistics for each
1/1, 1/3 or 1/12 octave band, as well as for L
eq
.
Swept-Sine Measurements
Swept-sine mode is ideal for signal analysis that involves high
dynamic range or wide frequency spans. Gain is optimized at
SR785 Dynamic Signal Analyzer
Stanford Research Systems phone: (408)744-9040
www.thinkSRS.com
Order map (top), tracked order (bottom)
Octave analysis
Narrow band FFT (top), wide band FFT (bottom)
Page 3
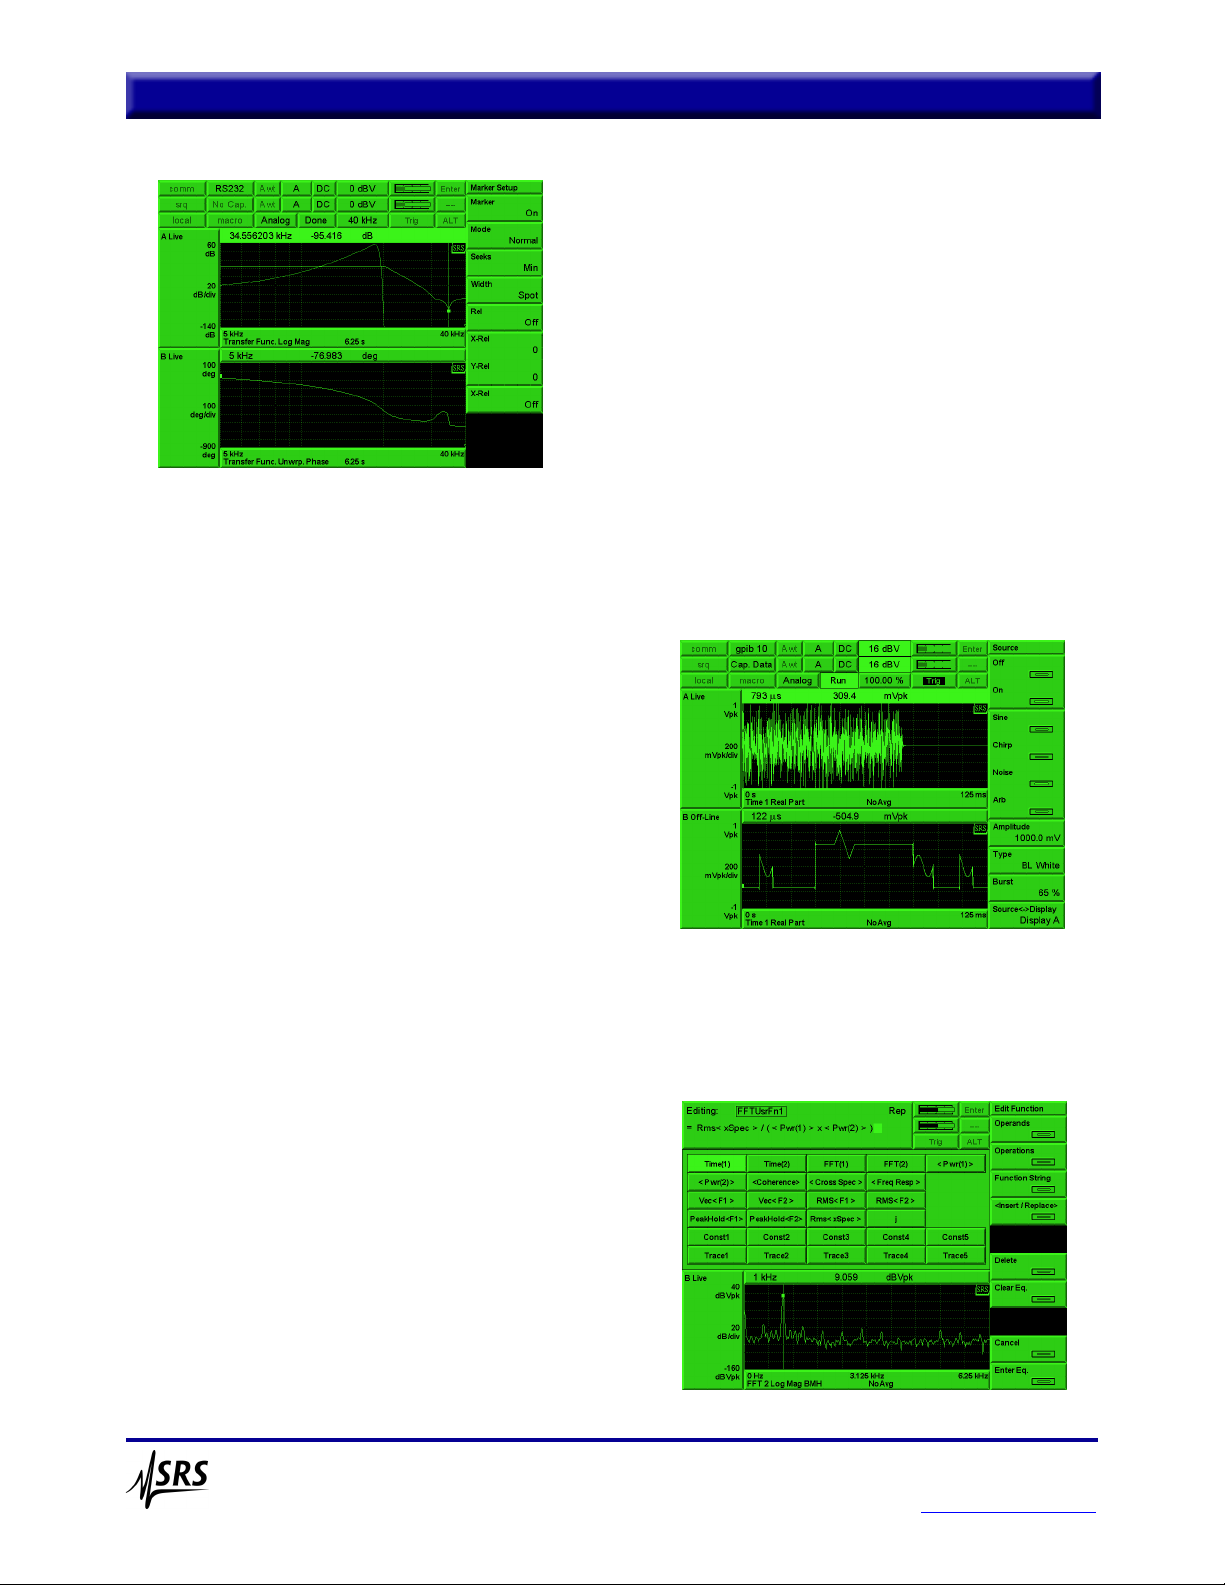
each point in the measurement, producing up to 145 dB of
dynamic range. A frequency resolution of up to 2000 points is
also provided. Auto-ranging can be used with source autoleveling to maintain a constant input or output level at the device
under test (to test response at a specific amplitude, for instance).
Auto-resolution ensures the fastest possible sweeps, and
adjusts the frequency steps in the scan based on the DUT's
response. Phase and amplitude changes that exceed userdefined thresholds are measured with high frequency
resolution, while small changes are measured using wider
frequency steps between points. A choice of linear sweeps
with high resolution, or logarithmic sweeps with up to eight
decades of frequency range, is provided.
Time/Histogram
The time/histogram measurement group is used to analyze
time-domain data. A histogram of the time data vs. signal
amplitude is provided for accurate time domain signal
characterization. Statistical analysis capabilities include both
probability density function (PDF) and cumulative density
function (CDF). The sample rate, number of samples, and
number of bins can all be adjusted.
Time Capture
The SR785 comes with 8 Mbytes of memory (32 Mbytes
optional). Analog waveforms can be captured at sampling
rates of 262 kHz or any binary sub-multiple, allowing you to
optimize sampling rate and storage for any application. For
example, 8 Msamples of memory will capture 32 seconds of
time domain data at the maximum 262 kHz sample rate, or
about 9 hours of data at a 256 Hz sample rate. Once captured,
any portion of the signal can be played back in any of the
SR785's measurement groups except swept-sine. The
convenient Auto-Pan feature lets you display measurement
results synchronously with the corresponding portion of the
capture buffer to identify important features.
Transducer Units
Automatic unit conversion makes translating transducer data
easy. Enter your transducer conversion directly in V/EU,
EU/V or dB (1V/EU). The SR785 will display the result in
units of meters, inches, m/sec2, in/sec2, m/s, in/s, mil, g, kg,
lbs., N, dynes, pascals or bars. Built-in ICP power is provided
for accelerometers. Acoustic measurement results can be
displayed in dBSPL, while electrical units include V, V
2
, dBV
and dBm.
Source
The SR785 comes with six precision source types: lowdistortion (−80 dBc) single or two-tone sine waves, white
noise, pink noise, chirp, and arbitrary waveforms. The chirp
and noise sources can be bursted to provide activity over a
selected portion of the time record for FFT measurements, or
to provide impulse noise for acoustic measurements. The
digitally synthesized source produces output levels from
0.1 mV to 5 V, DC offset from 0 to ±5 V, and delivers up to
100 mA of current.
Arbitrary waveform capability is standard with the SR785.
Use the arbitrary source to playback a section of a captured
waveform, play a selected FFT time record, or upload your
own custom waveform from your computer.
User Math
Custom measurements can be created in each of the SR785's
measurement groups using the math menu. Enter any equation
involving rms averaged, vector averaged or unaveraged time
SR785 Dynamic Signal Analyzer
Stanford Research Systems phone: (408)744-9040
www.thinkSRS.com
Swept-sine Bode plot of low pass filter response
User Math
Burst noise source (top), arbitrary waveform source (bottom)
Page 4

or frequency data, stored files, constants, or a rich array of
supplied operations including arithmetic functions, FFT,
inverse FFT, jω, d/dω, exp, ln x and many others. All of the
averaging modes are available as user math operands. Unlike
many other analyzers, the SR785's measurement rate is
virtually unaffected when user math is selected. For instance,
the function exp(ln(conj(FFT2/FFT1))) can be calculated with
a 100 kHz real-time bandwidth.
Waterfall
Waterfall plots are a convenient way of viewing a time history
of your data. Each successive measurement record is plotted
along the z-axis making it easy to see trends in the data. All
FFT, octave and order tracking measurements can be stored in
the SR785's waterfall buffer memory. You can choose to save
all measurements and averaging modes, or just the current
measurement to conserve memory. Waterfall traces can be
stored every n time records for FFT and order tracking
measurements. For order tracking measurements, new records
can be acquired at a specific time interval or change in rpm. In
octave measurements, the storage interval is in seconds (as
fast as every 4 ms). While displaying waterfall plots, you can
adjust the skew angle to reveal important features, or change
the baseline threshold to eliminate low-level clutter. Any
z-axis slice or x-axis record can be saved to disk or displayed
separately for analysis.
Analysis
The SR785 includes a wide variety of analysis features.
Marker analysis lets you measure the power contained in
harmonics, sidebands or within a given band of frequencies.
Important information such as THD, THD+ N, sideband power
relative to a carrier, or total integrated power are calculated in
real time and displayed on the screen. The front/back display
feature allows you to view live data from both signal inputs on
one graph. You can also simultaneously display saved traces
and live data. The peak-find marker allows you to quickly
locate frequency peaks with the click of a button. The marker
statistics feature calculates the maximum, minimum, mean
and standard deviation of data in any section of the display.
For modal analysis, the cursor can be configured to display the
resonant frequency and damping of a single selected mode.
Data tables are used to display up to 100 selected data points
in tabular format. Limit tables let you to define up to 100 upper
and lower limit segments in each display for GO/NO-GO testing.
Curve Fit and Synthesis
The SR785 has a 20-pole/20-zero curve fitter that can fit
frequency-domain data from both the FFT and swept-sine
measurement groups. Curve models can be displayed in
pole/zero, pole/residue and polynomial formats. Synthesis
reverses the process; enter a model in any of the above formats
and the SR785 synthesizes the required curve. The curvefit/synthesis menu allows you to change gain, delay and
frequency scale, set pole and zero locations, and instantly see
the response of the modeled system.
Output
The SR785's 3.5" disk drive, computer interfaces (GPIB and
RS-232), and printer port provide flexibility when saving,
printing and exporting data. Data can be saved in binary or
ASCII formats, and displays can be printed/plotted to any of
the ports or the disk drive. Supported formats include PCL
(LaserJet/DeskJet), dot-matrix, postscript, HP-GL, PCX or
GIF. An annotation editor lets you add text, time, date and file
names to any part of the plot.
Data Conversion Utilities
The SR785 comes with a complete suite of data conversion
utilities for both Windows and DOS operating systems.
SR785 files can be converted to ASCII for use with
spreadsheets, or Universal File Format (UFF) and HP SDF for
use with modal analysis programs. SR785 files can also be
converted to MAT file format for use with MATLAB.
Conversion from external file types is also supported. Both
HP SDF and SR780 files can be converted to SR785 format.
SR785 Dynamic Signal Analyzer
Stanford Research Systems phone: (408)744-9040
www.thinkSRS.com
Total harmonic distortion (THD)
Waterfall plot
Page 5

SR785 Features
Stanford Research Systems phone: (408)744-9040
www.thinkSRS.com
Instrument Modes
FFT, Time/Histogram, Correlation, Octave, Swept-Sine,
Order Tracking
Frequency Domain Measurements
Frequency Response, Linear Spectrum, Cross Spectrum,
Power Spectrum, Coherence, Power Spectral Density
Time Domain Measurements
Time Record, Cross-Correlation, Auto-Correlation, Orbit
Amplitude Domain Measurements
Histogram, PDF, CDF
FFT Resolution
100, 200, 400, 800 lines
Views
Linear Magnitude, Log Magnitude, dB Magnitude, Magnitude
Squared, Real Part, Imaginary Part, Phase, Unwrapped Phase,
Nichols, Nyquist, Polar
Units
V, V
2
, V2/Hz, V/√Hz, meters, meters/s, meters/s2, inches,
inches/s, inches/s
2
, mils, g, kg, lbs., N, dynes, pascals, bars,
SPL, user-defined engineering units (EUs)
Displays
Single, Dual, Front/Back Overlay, Waterfall with Skew, Zoom
and Pan, Grid On/Off
Marker Functions
Trace Marker, Dual-Trace Linked Marker, Absolute and
Relative Marker, Peak Find, Harmonic Marker, Band and
Sideband Marker, Waterfall Marker, Frequency-Damping Marker
Windows
Hanning, Blackman-Harris, Flat-Top, Kaiser, Force/Exponential,
User-Defined, ±T/2, ±T/4, T/2, Uniform
Source Outputs
Sine, Two-Tone, Swept-Sine, White/Pink Noise, Burst Noise,
Chirp, Burst Chirp, and Arbitrary
Averaging
RMS, Vector, Peak Hold, Linear, Exponential, Equal
Confidence (Octave), Preview Time Record, Percent Overlap
Averaging, Overload Reject
DataViewer
Windows graphics program for viewing SR785 files. Graphs
can be pasted to the clipboard or saved in PCX, BMP or GIF
format. You can perform simple editing, add pointers and text,
change scaling, perform simple math operations, and copy
measurement data into other applications.
Data Conversion Utility
Data, waterfall and capture files can be converted to ASCII.
Data files can also be converted to Universal File Format,
SDF format or MATLAB MAT-File Format. SDF and SR780
files can be converted to SR785 format.
Time Capture
Captures time data for later analysis (FFT or Octave). Up to
2 Msamples (8 Msamples optional) of data can be saved.
User Math
+, −, ×, ÷, Conjugate, Magnitude/Phase, Real/Imaginary, Sqrt,
FFT, Inverse FFT, jω, Log, Exp, d/dx, Group Delay,
A- Weighting, B-Weighting, C-Weighting, x/x−1, Trace 1 to 4,
Vector Average, RMS Average, Peak Hold
Analysis
Harmonic, Band, Sideband, THD, THD + N, Limit Test,
Data Table, Exceedance, Statistics, Curve Fit/Synthesis
Triggering
Continuous, Internal, External (Analog or TTL), Source,
Auto/Manual Arming, GPIB, RPM Step, Time Step,
Pre/Post Trigger Delay
Ordering Information
SR785 Dynamic signal analyzer $11,950
O780M1 8 Msample (32 Mbyte) memory $800
O780RM Rack mount kit $85
CT100 SRS instrument cart $850
DataViewer software
SR785 rear panel
Page 6

SR785 Specifications
Specifications apply after 30 minutes warm-up and within
two hours of last auto-offset. Measured with 400-line
resolution and anti-alias filters enabled unless stated otherwise.
Measurement Groups
Groups FFT, Correlation, Time Histogram,
Swept-Sine, Order Tracking
Frequency
Range 102.4 kHz or 100 kHz (both
displays have the same range)
FFT spans 195.3 mHz to 102.4 kHz or
191 mHz to 100 kHz. The two
displays can have different spans
and start frequencies.
FFT resolution 100, 200, 400 or 800 lines
Real-time bandwidth 102.4 kHz (highest FFT span with
continuous data acquisition
and averaging)
Accuracy 25 ppm from 20 °C to 40 °C
Dynamic Range
Dynamic range 90 dB typical, 80 dB guaranteed
(FFT and Octave).
145 dB typical (Swept-Sine).
Includes spurs, harmonics,
intermodulation distortion, and alias
products. Excludes alias responses
at extremes of span.
Harmonic distortion < −80 dB (single tone in band)
Intermod. distortion < −80 dB (two tones in band, each
less than −6.02 dBfs)
Spurious < −80 dBfs
Alias responses < −80 dBfs (single tone outside of
span, <0 dBfs, less than 1 MHz)
Full-span FFT −100 dBfs typical (input grounded,
noise floor > −30 dBV, Hanning window,
64 rms averages)
Residual DC response < −30 dBfs (FFT with Auto-Cal on)
Amplitude Accuracy
Single channel ±0.2 dB (excluding window effects)
Cross channel ±0.05 dB, DC to 102.4 kHz
(frequency response measurement,
both inputs on the same range,
rms averaged)
Phase Accuracy
Single channel ±3.0 deg. relative to external TTL
trigger (−50 dBfs to 0 dBfs, freq.
<10.24 kHz, center of frequency
bin, DC coupled). For Blackman-
Harris, Hanning, Flat-Top and
Kaiser windows, phase is relative to
a cosine wave at center of time
record. For Uniform, Force and
Exponential windows, phase is
relative to a cosine wave at
beginning of the time record.
Cross channel ±0.5 deg. (DC to 51.2 kHz)
±1.0 deg. (DC to 102.4 kHz)
(frequency response meas., both
inputs on same range, vector avg.)
Signal Inputs
Number of inputs 2
Full-scale input range −50 dBV (3.16 mVp) to
+34 dBV (50 Vp) in 2 dB steps
Maximum input level 57 Vp
Input configuration Single-ended (A), differential (A−B)
Input impedance 1 MΩ + 50 pF
Shield to chassis Floating mode: 1 MΩ + 0.01 µF
Grounded mode: 50 Ω
Shields grounded in (A−B) mode
Max. shield voltage 4 Vp
AC coupling 0.16 Hz cutoff frequency
CMRR 90 dB at 1 kHz (input range <0 dBV)
80 dB at 1 kHz (input range <10 dBV)
50 dB at 1 kHz (input range ≥10 dBV)
ICP signal conditioning Current source: 4.8 mA
Open circuit voltage: +26 V
A-weight filter Type 0 tolerance, ANSI standard
S1.4-1983 (10 Hz to 25.6 kHz)
Crosstalk < −145 dB below signal (input to
input and source to inputs, 50 Ω
receiving input source impedance)
Input noise <10 nVrms/√Hz above 200 Hz
(< −160 dBVrms/√Hz)
Trigger Input
Modes Free Run, Internal, External, or
External TTL
Internal Level adjustable to ±100 % of input
scale. (Positive or negative slope)
Min. trigger level: 5 % of input range
External Level adjustable to ±5 V in 40 mV
steps. (Positive or negative slope)
Input impedance: 1 MΩ
Max. input: ±5 V
Min. trigger level: 100 mV
External TTL Requires TTL level to trigger
(low <0.7 V, high >3.0 V)
Post-trigger Measurement record is delayed up
to 100,000 samples after the trigger.
Pre-trigger Measurement record starts up to
8000 samples prior to the trigger.
Tachometer Input
Pulses per revolution 1 to 2048
RPM accuracy ±50 ppm (typ.)
Tach level range ±25 V, ±5 V, TTL
Tach level resolution 20 mV @ ±25 V, 4 mV @ ±5 V
Max. tach input level ±40 Vp
Stanford Research Systems phone: (408)744-9040
www.thinkSRS.com
Page 7

Min. tach pulse width 100 ns
Max. tach pulse rate 750 kHz
Transient Capture
Mode Continuous data recording
Maximum rate 262,144 samples/s for both inputs
Maximum capture 2 Msamples (single input)
length 8 Msamples with optional memory
Octave Analysis
Standards Conforms to ANSI std. S1.11-1986
Order 3 Type 1-D and IEC 225-1966
Frequency range (Band centers)
Single channel
1/1 Octave 0.125 Hz to 32 kHz
1/3 Octave 0.100 Hz to 40 kHz
1/12 Octave 0.091 Hz to 12.3 kHz
Two channels
1/1 Octave 0.125 Hz to 16 kHz
1/3 Octave 0.100 Hz to 20 kHz
1/12 Octave 0.091 Hz to 6.17 kHz
Accuracy <0.2 dB (1 second stable average,
single tone at band center)
Dynamic range 80 dB (1/3 Octave, 2 second stable
average) per ANSI S1.11-1986
Sound level Impulse, Peak, Fast, Slow and L
eq
per ANSI S1.4-1983 Type 0 and
IEC 651-1979 Type 0
Order Tracking
Delta order 0.0075 to 1
Resolution up to 400 lines
Amplitude accuracy ±1 dB (typ.)
Displays Order map (mag. and phase), order
track (mag. and phase), orbit
Curve Fit and Synthesis
Type 20-pole/20-zero curve fit
(non-iterative rational fraction)
Order selection Auto or manual
Output format Pole-zero, polynomial, pole-residue
Source Output
Amplitude range 0.1 mVp to 5 Vp
Amplitude resolution 0.1 mVp
DC offset <10.0 mV (typ.)
Offset adjust ±5 VDC (sine, swept-sine, two-tone)
Output impedance <5 Ω, ±100 mA peak output current
Sine Source
Amplitude accuracy ±1 % of setting, 0 Hz to 102.4 kHz
0.1 Vp to 5 Vp into Hi-Z load
Harmonics, sub-harm. 0.1 Vp to 5 Vp
& spurious signals < −80 dBc (fundamental <30 kHz)
< −75 dBc (fundamental <102 kHz)
Two-Tone Source
Amplitude accuracy ±1 % of setting, 0 Hz to 102.4 kHz,
0.1 Vp to 5 Vp into Hi-Z load
Harmonics, sub-harm. < −80 dBc, 0.1 Vp to 2.5 Vp
White Noise Source
Time Record Continuous or burst
Bandwidth DC to 102.4 kHz or limited to span
Flatness <0.25 dBpp (typ.), 5000 rms
averages (<1.0 dBpp (max.))
Pink Noise Source
Bandwidth DC to 102.4 kHz
Flatness <2.0 dBpp, 20 Hz to 20 kHz (meas-
ured using averaged 1/3 oct. analysis)
Chirp Source
Time record Continuous or Burst
Output Sine sweep across the FFT span
Flatness ±0.25 dB (1.0 Vp)
Swept-Sine Source
Auto functions Source level, input range and
frequency resolution
Dynamic range 145 dB
Arbitrary Source
Amplitude range ±5 V
Record length 2 Msamples (playback from arbitrary
waveform memory or capture buffer),
variable output sample rate
General
CRT monitor Monochrome, 800H by 600V res.
Interfaces IEEE-488.2, RS-232 and printer
interfaces (standard). All instrument
functions can be controlled through
computer interfaces. A PC (XT)
keyboard input is provided for
additional flexibility.
Hardcopy Print to dot matrix and PCL
compatible printers. Plot to HP-GL
or postscript plotters. Print/plot to
RS-232 or IEEE-488.2 interfaces or
disk file. Additional file formats
include GIF, PCX and EPS.
Disk 3.5" DOS format, 1.44 Mbytes
Preamp power Power connector for SRS preamps
Power 70 W, 100/120/220/240 VAC,
50/60 Hz
Dimensions 17" × 8.25" × 24" (WHD)
Weight 56 lbs.
Warranty One year parts and labor on defects
in materials and workmanship
SR785 Specifications
Stanford Research Systems phone: (408)744-9040
www.thinkSRS.com
 Loading...