

Page 1

Agilent
PNA Series Microwave
Network Analyzers
Data Sheet
This document describes the performance and features of the
Agilent Technologies PNA Series microwave vector network analyzers:
E8362A 45 MHz to 20 GHz
E8363A 45 MHz to 40 GHz
E8364A 45 MHz to 50 GHz
Page 2

2
Some definitions
All specifications and characteristics apply over a
25°C ±5°C range (unless otherwise stated) and 90
minutes after the instrument has been turned on.
Calibration: The process of measuring known
standards to characterize a network analyzer’s
systematic (repeatable) errors.
Characteristic (char.): A performance parameter
that the product is expected to meet before it
leaves the factory, but that is not verified in the
field and is not covered by the product warranty.
A characteristic includes the same guardbands
as a specification.
Corrected (residual): Indicates performance after
error correction (calibration). It is determined
by the quality of calibration standards and how
well “known” they are, plus system repeatability,
stability, and noise.
Nominal (nom.): A general, descriptive term that
does not imply a level of performance. It is not
covered by the product warranty.
Specification (spec.): Warranted performance.
Specifications include guardbands to account for
the expected statistical performance distribution,
measurement uncertainties, and changes in performance due to environmental conditions.
Standard: When referring to the analyzer, this
includes no options unless noted otherwise.
Typical (typ.): Expected performance of an average
unit, which does not include guardbands. It is not
covered by the product warranty.
Uncorrected (raw): Indicates instrument performance without error correction. The uncorrected
performance affects the stability of a calibration.
Page 3

3
Table of contents
Corrected system performance . . . . . . . . . . . . . . .4
System dynamic range . . . . . . . . . . . . . . . . . . .4
Receiver dynamic range . . . . . . . . . . . . . . . . . .5
Corrected system performance
with 2.4 mm connectors . . . . . . . . . . . . . . . .6
Corrected system performance
with 3.5 mm connectors . . . . . . . . . . . . . . .10
Uncorrected system performance . . . . . . . . . . . .14
Test port output . . . . . . . . . . . . . . . . . . . . . . . . . .16
Test port input . . . . . . . . . . . . . . . . . . . . . . . . . . .17
General information . . . . . . . . . . . . . . . . . . . . . . .21
Measurement throughput summary . . . . . . . . . .23
Cycle time vs. IF bandwidth . . . . . . . . . . . . .23
Cycle time vs. number of points . . . . . . . . . .23
Cycle time . . . . . . . . . . . . . . . . . . . . . . . . . . . .23
Data transfer time . . . . . . . . . . . . . . . . . . . . .24
PNA Series simplified test set block diagram . . .25
Measurement capabilities . . . . . . . . . . . . . . . . . . .27
Source control . . . . . . . . . . . . . . . . . . . . . . . . . . . .27
Trace functions . . . . . . . . . . . . . . . . . . . . . . . . . . .28
Data accuracy enhancement . . . . . . . . . . . . . . . . .28
Storage . . . . . . . . . . . . . . . . . . . . . . . . . . . . . . . . . .29
System capabilities . . . . . . . . . . . . . . . . . . . . . . . .29
Automation . . . . . . . . . . . . . . . . . . . . . . . . . . . . . .31
Information resources . . . . . . . . . . . . . . . . . . . . .32
Page 4

Corrected system performance
The specifications in this section
apply for measurements made
with the Agilent E836xA PNA
Series microwave network
analyzer with the following
conditions:
• 10-Hz IF bandwidth
• no averaging applied to data
• environmental temperature of
25°C ±5°C, with less than 1°C
deviation from the calibration
temperature
• isolation calibration with an
averaging factor of 8
1. The system dynamic range is calculated as the
difference between the noise floor and the source
maximum output power. The effective dynamic
range must take measurement uncertainties and
interfering signals into account.
2. The test port system dynamic range is calculated
as the difference between the test port noise
floor and the source maximum output power. The
effective dynamic range must take measurement
uncertainties and interfering signals into account.
3. The direct receiver access input system dynamic
range is calculated as the difference between the
direct receiver access input noise floor and the
source maximum output power. The effective
dynamic range must take measurement uncertainties
and interfering signals into account. This set-up
should only be used when the receiver input will
never exceed its damage level. When the analyzer
is in segment sweep mode, the analyzer can have
pre-defined frequency segments which will output
a higher power level when the extended dynamic
range is required (i.e. devices with high insertion
loss), and reduced power when receiver damage
may occur (i.e. devices with low insertion loss).
The extended range is only available in one-path
transmission measurements.
4. May be limited to 100 dB at particular frequencies
below 500 MHz due to spurious receiver residuals.
Methods are available to regain the full dynamic
range.
System dynamic range
1
Description Specification (dB) Typical (dB) at direct
at test port
2
receiver access input
3
Dynamic range
Standard configuration and standard power range (E836xA)
45 to 500 MHz
4
94 N/A
500 MHz to 2 GHz 119 N/A
2 to 10 GHz 122 N/A
10 to 20 GHz 123 N/A
20 to 30 GHz 114 N/A
30 to 40 GHz 110 N/A
40 to 45 GHz 109 N/A
45 to 50 GHz 104 N/A
Extended configuration and standard power range (E836xA-Option 014)
45 to 500 MHz
4
94 132
500 MHz to 2 GHz 119 138
2 to 10 GHz 122 137
10 to 20 GHz 121 136
20 to 30 GHz 111 123
30 to 40 GHz 107 119
40 to 45 GHz 105 116
45 to 50 GHz 100 111
Standard configuration and extended power range and bias-tees (E836xA-Option UNL)
45 to 500 MHz
4
92 N/A
500 MHz to 2 GHz 117 N/A
2 to 10 GHz 120 N/A
10 to 20 GHz 121 N/A
20 to 30 GHz 112 N/A
30 to 40 GHz 108 N/A
40 to 45 GHz 105 N/A
45 to 50 GHz 99 N/A
Extended configuration and extended power range and bias-tees
(E836xA-Option UNL and Option 014)
45 to 500 MHz
4
92 130
500 MHz to 2 GHz 117 136
2 to 10 GHz 120 135
10 to 20 GHz 119 134
20 to 30 GHz 109 121
30 to 40 GHz 105 117
40 to 45 GHz 101 112
45 to 50 GHz 95 108
4
Page 5

5
Receiver dynamic range
1
Description Specification (dB) Typical (dB) at direct
at test port
2
receiver access input
3
Dynamic range
Standard configuration and standard power range (E836xA) or standard configuration
and extended power range and bias-tees (E836xA-Option UNL)
45 to 500 MHz
4
94 N/A
500 MHz to 2 GHz 119 N/A
2 to 10 GHz 122 N/A
10 to 20 GHz 125 N/A
20 to 30 GHz 114 N/A
30 to 40 GHz 111 N/A
40 to 50 GHz 111 N/A
Extended configuration and standard power range (E836xA) or extended configuration
and extended power range and bias-tees (E836xA-Option 014 and Option UNL)
45 to 500 MHz
4
94 132
500 MHz to 2 GHz 119 138
2 to 10 GHz 122 137
10 to 20 GHz 124 139
20 to 40 GHz 113 125
40 to 45 GHz 110 122
45 to 50 GHz 109 120
1. The receiver dynamic range is calculated as the
difference between the noise floor and the receiver
maximum input level. The effective dynamic range
must take measurement uncertainties and interfering
signals into account.
2. The test port receiver dynamic range is calculated as
the difference between the test port noise floor and the
receiver maximum input level. The effective dynamic
range must take measurement uncertainties and
interfering signals into account.
3. The direct receiver access input receiver dynamic
range is calculated as the difference between the
direct receiver access input noise floor and the receiver
maximum input level. The effective dynamic range
must take measurement uncertainties and interfering
signals into account. This set-up should only be used
when the receiver input will never exceed its damage
level. When the analyzer is in segment sweep mode,
the analyzer can have pre-defined frequency segments
which will output a higher power level when the
extended dynamic range is required (i.e. devices with
high insertion loss), and reduced power when receiver
damage may occur (i.e. devices with low insertion
loss). The extended range is only available in one-path
transmission measurements.
4. May be limited to 100 dB at particular frequencies
below 500 MHz due to spurious receiver residuals.
Methods are available to regain the full dynamic range.
Page 6

6
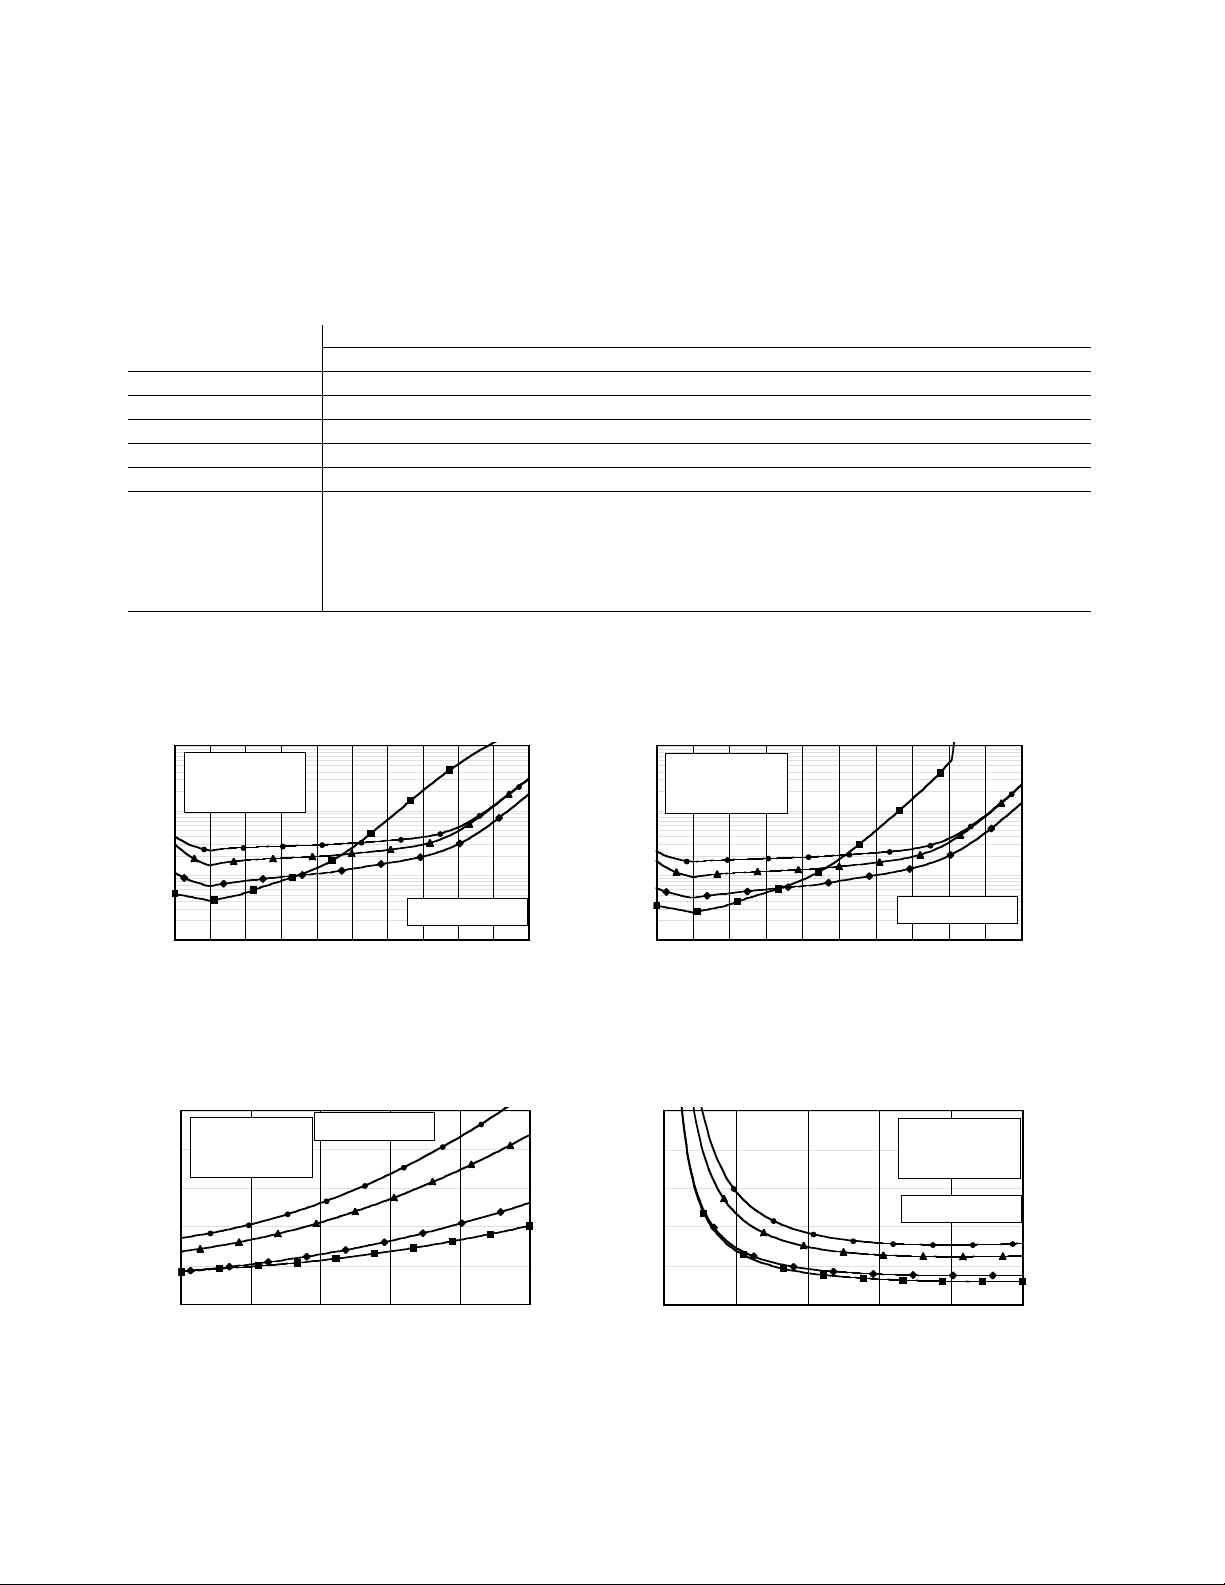
Corrected system performance with 2.4 mm connectors
Standard configuration and standard power range (E8363/4A)
Applies to E8363/4A PNA Series analyzer, 85056A (2.4 mm) calibration kit, 85133F flexible test port
cable set, and a full two-port calibration. (Specifications apply over environmental temperature of 23°
±3°C, with less than 1°C deviation from calibration temperature.)
Description Specification (dB)
0.045 kHz to 2 GHz 2 to 10 GHz 10 to 20 GHz 20 to 40 GHz 40 to 50 GHz
Directivity 42 42 42 38 36
Source match 41 38 38 33 31
Load match 42 42 42 37 35
Reflection tracking ±(0.001 + 0.2/°C) ±(0.008 + 0.2/°C) ±(0.008 + 0.2/°C) ±(0.020 + 0.3/°C) ±(0.027 + 0.4/°C)
Transmission tracking ±(0.014 + 0.2/°C) ±(0.033 + 0.2/°C) ±(0.039 + 0.2/°C) ±(0.105 + 0.3/°C) ±(0.200 + 0.4/°C)
Crosstalk (reflection port to < -85 (to 500 MHz)
transmission port: short < -100 (from 500 MHz) < -110 < -110 < -110 < -110
circuits at both ports;
isolation calibration
applied)
Transmission uncertainty (specifications)
Reflection uncertainty (specifications)
Magnitude
0.01
0.1
1
10
-90-80-70-60-50-40-30-20-10010
Transmission coefficient (dB)
Uncertainty (dB)
E8363/4A full 2-port cal using 85056A
S11 = S22 = 0
Source power = -12 dBm
■
45 MHz to 2 GHz
◆ 2 GHz to 20 GHz
▲ 20 GHz to 40 GHz
● 40 GHz to 50 GHz
Phase
0.1
1
10
100
-90-80-70-60-50-40-30-20-10010
Transmission coefficient (dB)
Uncertainty (degrees)
E8363/4A full 2-port cal using 85056A
S11 = S22 = 0
Source power = -12 dBm
■
45 MHz to 2 GHz
◆ 2 GHz to 20 GHz
▲ 20 GHz to 40 GHz
● 40 GHz to 50 GHz
Magnitude
0
0.01
0.02
0.03
0.04
0.05
0 0.2 0.4 0.6 0.8 1
Reflection coefficient (linear)
Uncertainty (linear)
E8363/4A with 85056A
S21 = S12 = 0
Source power = -12 dBm
■
45 MHz to 2 GHz
◆ 2 GHz to 20 GHz
▲ 20 GHz to 40 GHz
● 40 GHz to 50 GHz
Phase
0
2
4
6
8
10
0 0.2 0.4 0.6 0.8 1
Reflection coefficient (linear)
Uncertainty (deg)
E8363/4A with 85056A
S21 = S12 = 0
Source power = -12 dBm
■
45 MHz to 2 GHz
◆ 2 GHz to 20 GHz
▲ 20 GHz to 40 GHz
● 40 GHz to 50 GHz
Page 7

7
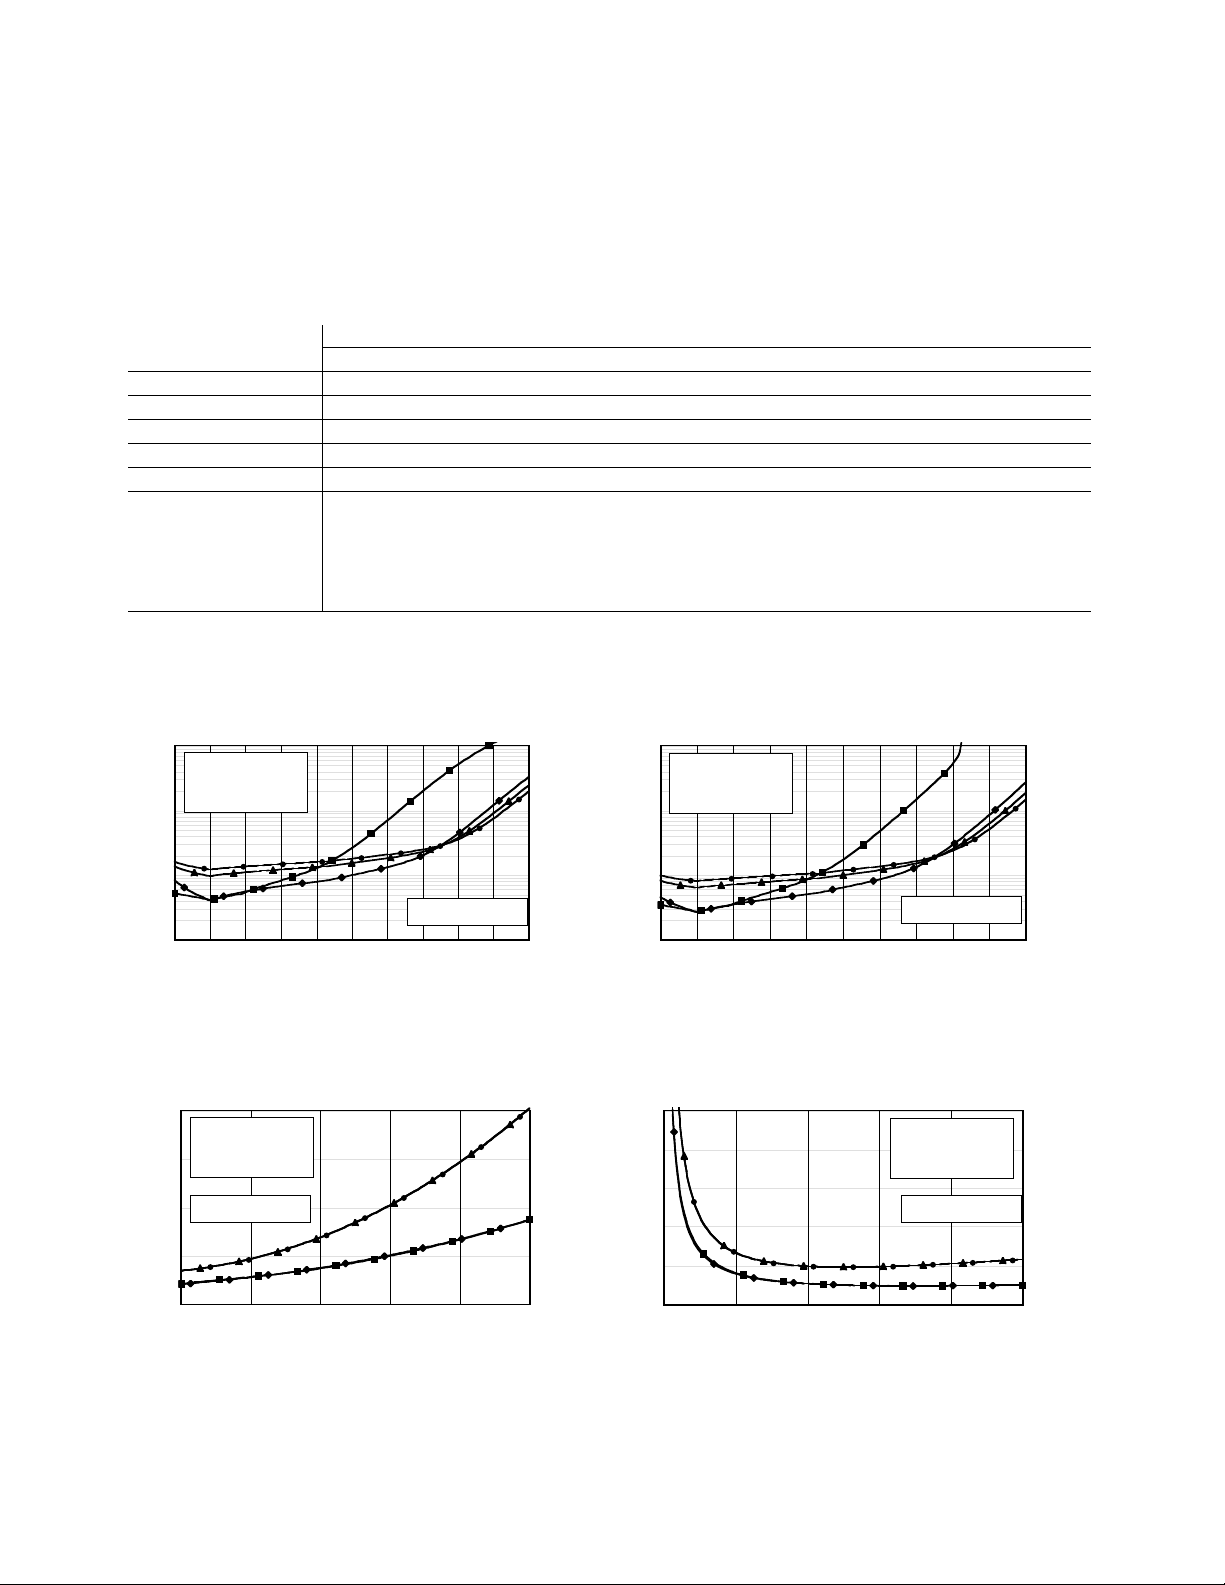
Extended configuration and standard power range (E8363/4A-Option 014)
Applies to E8363/4A PNA Series analyzer, 85056A (2.4 mm) calibration kit, 85133F flexible test port
cable set, and a full two-port calibration. (Specifications apply over environmental temperature of 23°
±3°C, with less than 1°C deviation from calibration temperature.)
Description Specification (dB)
0.045 kHz to 2 GHz 2 to 10 GHz 10 to 20 GHz 20 to 40 GHz 40 to 50 GHz
Directivity 42 42 42 38 36
Source match 41 38 38 33 31
Load match 42 42 42 37 35
Reflection tracking ±(0.001 + 0.2/°C) ±(0.008 + 0.2/°C) ±(0.008 + 0.2/°C) ±(0.020 + 0.3/°C) ±(0.027 + 0.4/°C)
Transmission tracking ±(0.019 + 0.2/°C) ±(0.039 + 0.2/°C) ±(0.053 + 0.2/°C) ±(0.114 + 0.3/°C) ±(0.215 + 0.4/°C)
Crosstalk (reflection port to < -85 (to 500 MHz)
transmission port: short < -100 (from 500 MHz) < -110 < -110 < -110 < -110
circuits at both ports;
isolation calibration
applied)
Transmission uncertainty (specifications)
Reflection uncertainty (specifications)
Magnitude
0.01
0.1
1
10
-90-80-70-60-50-40-30-20-10010
Transmission coefficient (dB)
Uncertainty (dB)
E8363/4A 014 full 2-port cal using 85056A
S11 = S22 = 0
Source power = -17 dBm
■
45 MHz to 2 GHz
◆ 2 GHz to 20 GHz
▲ 20 GHz to 40 GHz
● 40 GHz to 50 GHz
Phase
0.1
1
10
100
-90-80-70-60-50-40-30-20-10010
Transmission coefficient (dB)
Uncertainty (degrees)
E8363/4A 014 full 2-port cal using 85056A
S11 = S22 = 0
Source power = -17 dBm
■
45 MHz to 2 GHz
◆ 2 GHz to 20 GHz
▲ 20 GHz to 40 GHz
● 40 GHz to 50 GHz
Magnitude
0
0.01
0.02
0.03
0.04
0.05
0 0.2 0.4 0.6 0.8 1
Reflection coefficient (linear)
Uncertainty (linear)
E8363/4A 014 with 85056A
S21 = S12 = 0
Source power = -17 dBm
■
45 MHz to 2 GHz
◆ 2 GHz to 20 GHz
▲ 20 GHz to 40 GHz
● 40 GHz to 50 GHz
Phase
0
2
4
6
8
10
0 0.2 0.4 0.6 0.8 1
Reflection coefficient (linear)
Uncertainty (deg)
E8363/4A 014 with 85056A
S21 = S12 = 0
Source power = -17 dBm
■
45 MHz to 2 GHz
◆ 2 GHz to 20 GHz
▲ 20 GHz to 40 GHz
● 40 GHz to 50 GHz
Page 8
8
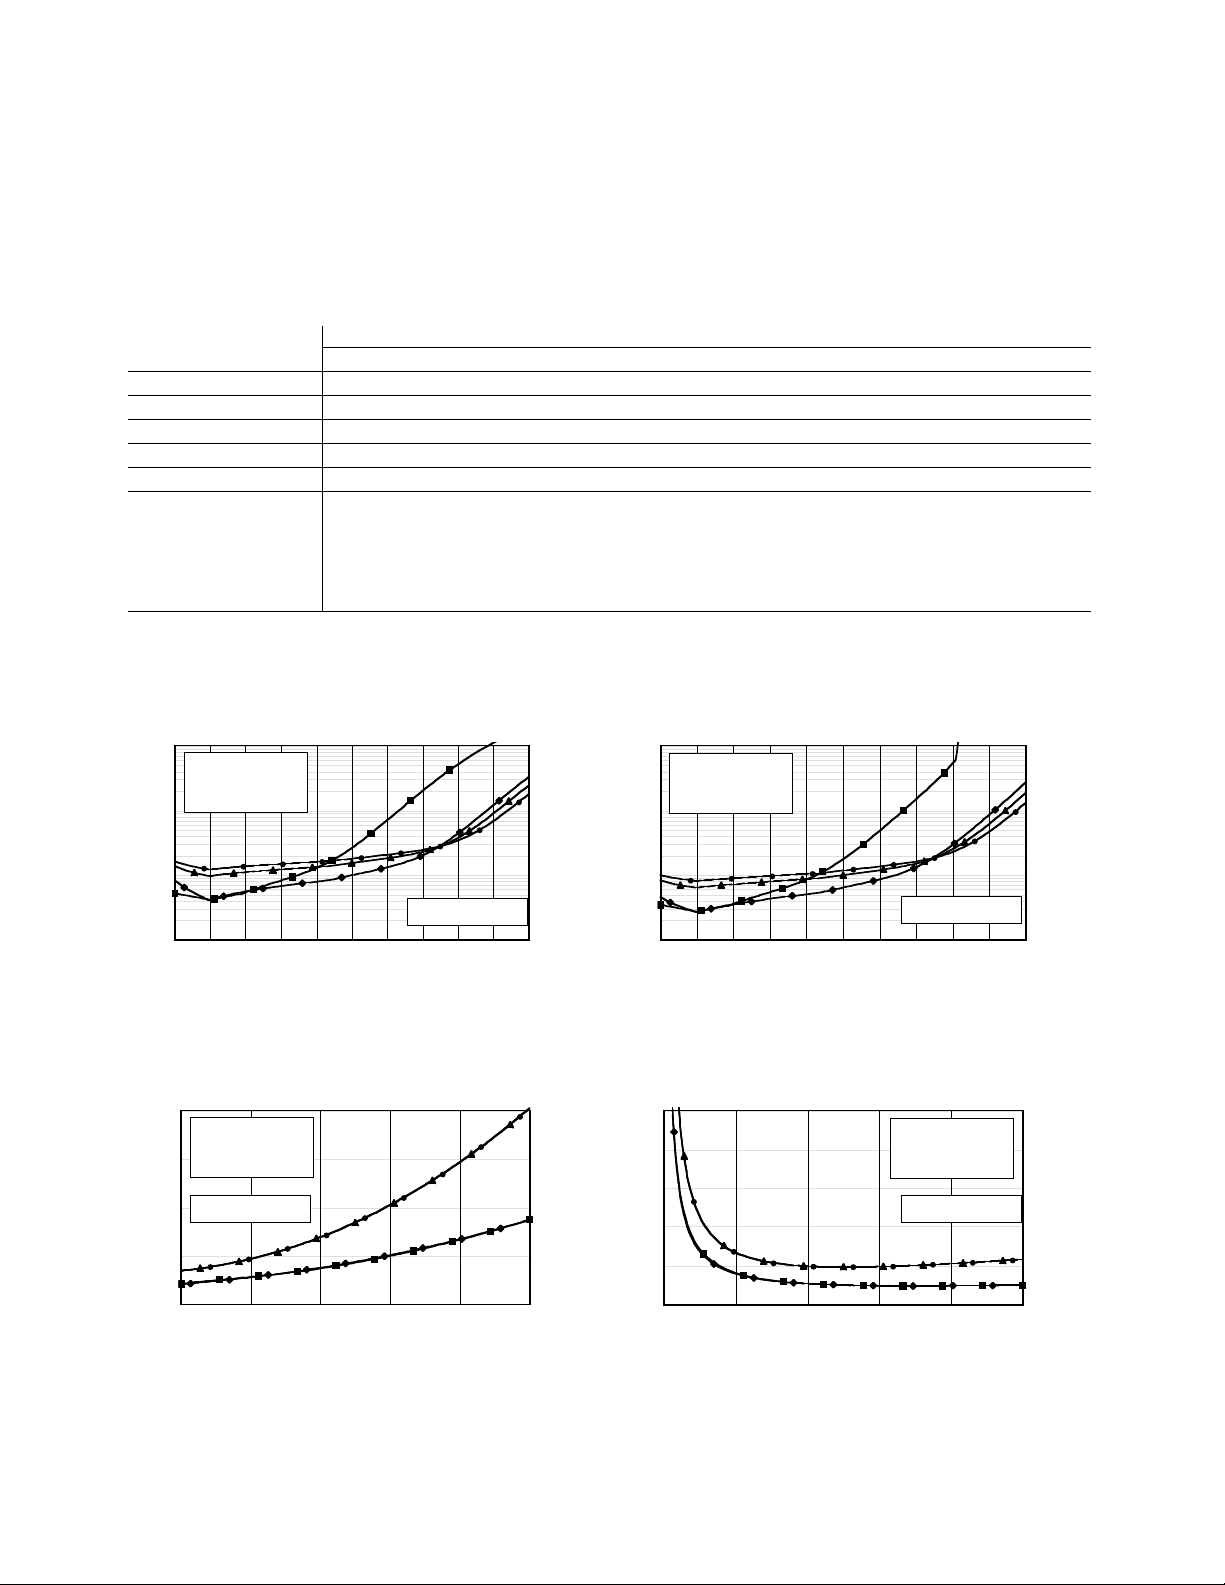
Corrected system performance with 2.4 mm connectors continued
Standard configuration and extended power range and bias-tees (E8363/4A-Option UNL)
Applies to E8363/4A PNA Series analyzer, 85056A (2.4 mm) calibration kit, 85133F flexible test port
cable set, and a full two-port calibration. (Specifications apply over environmental temperature of 23°
±3°C, with less than 1°C deviation from calibration temperature.)
Description Specification (dB)
0.045 kHz to 2 GHz 2 to 10 GHz 10 to 20 GHz 20 to 40 GHz 40 to 50 GHz
Directivity 42 42 42 38 36
Source match 41 38 38 33 31
Load match 42 42 42 37 35
Reflection tracking ±(0.001 + 0.2/°C) ±(0.008 + 0.2/°C) ±(0.008 + 0.2/°C) ±(0.020 + 0.3/°C) ±(0.027 + 0.4/°C)
Transmission tracking ±(0.019 + 0.2/°C) ±(0.039 + 0.2/°C) ±(0.053 + 0.2/°C) ±(0.114 + 0.3/°C) ±(0.215 + 0.4/°C)
Crosstalk (reflection port to < -85 (to 500 MHz)
transmission port: short < -100 (from 500 MHz) < -110 < -110 < -110 < -110
circuits at both ports;
isolation calibration
applied)
Transmission uncertainty (specifications)
Reflection uncertainty (specifications)
Magnitude
0.01
0.1
1
10
-90-80-70-60-50-40-30-20-10010
Transmission coefficient (dB)
Uncertainty (dB)
E8363/4A UNL full 2-port cal using 85056A
S11 = S22 = 0
Source power = -17 dBm
■
45 MHz to 2 GHz
◆ 2 GHz to 20 GHz
▲ 20 GHz to 40 GHz
● 40 GHz to 50 GHz
Phase
0.1
1
10
100
-90-80-70-60-50-40-30-20-10010
Transmission coefficient (dB)
Uncertainty (degrees)
E8363/4A UNL full 2-port cal using 85056A
S11 = S22 = 0
Source power = -17 dBm
■
45 MHz to 2 GHz
◆ 2 GHz to 20 GHz
▲ 20 GHz to 40 GHz
● 40 GHz to 50 GHz
Magnitude
0
0.01
0.02
0.03
0.04
0.05
0 0.2 0.4 0.6 0.8 1
Reflection coefficient (linear)
Uncertainty (linear)
E8363/4A UNL with 85056A
S21 = S12 = 0
Source power = -17 dBm
■
45 MHz to 2 GHz
◆ 2 GHz to 20 GHz
▲ 20 GHz to 40 GHz
● 40 GHz to 50 GHz
Phase
0
2
4
6
8
10
0 0.2 0.4 0.6 0.8 1
Reflection coefficient (linear)
Uncertainty (deg)
E8363/4A UNL with 85056A
S21 = S12 = 0
Source power = -17 dBm
■
45 MHz to 2 GHz
◆ 2 GHz to 20 GHz
▲ 20 GHz to 40 GHz
● 40 GHz to 50 GHz
Page 9

9
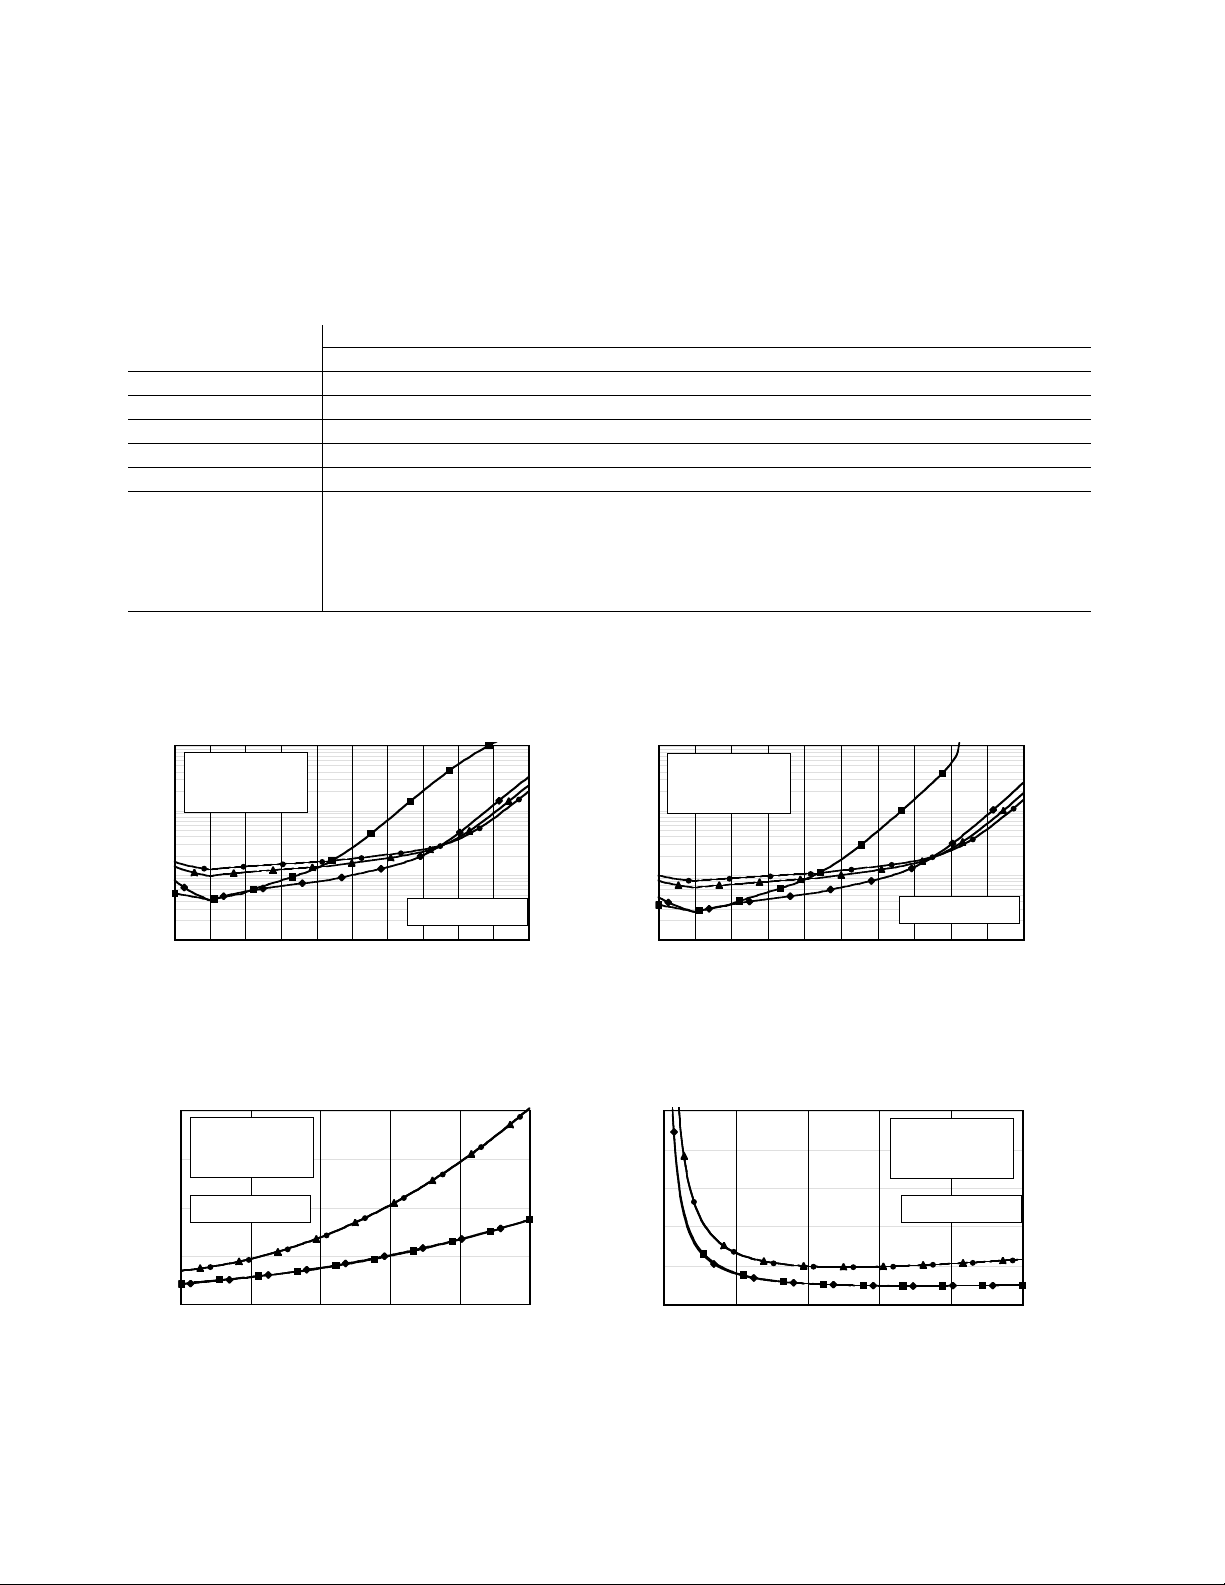
Extended configuration and extended power range and bias-tees (E8363/4A-Options UNL and 014)
Applies to E8363/4A PNA Series analyzer, 85056A (2.4 mm) calibration kit, 85133F flexible test port
cable set, and a full two-port calibration. (Specifications apply over environmental temperature of 23°
±3°C, with less than 1°C deviation from calibration temperature.)
Description Specification (dB)
0.045 kHz to 2 GHz 2 to 10 GHz 10 to 20 GHz 20 to 40 GHz 40 to 50 GHz
Directivity 42 42 42 38 36
Source match 41 38 38 33 31
Load match 42 42 42 37 35
Reflection tracking ±(0.001 + 0.2/°C) ±(0.008 + 0.2/°C) ±(0.008 + 0.2/°C) ±(0.020 + 0.3/°C) ±(0.027 + 0.4/°C)
Transmission tracking ±(0.019 + 0.2/°C) ±(0.039 + 0.2/°C) ±(0.053 + 0.2/°C) ±(0.114 + 0.3/°C) ±(0.215 + 0.4/°C)
Crosstalk (reflection port to < -85 (to 500 MHz)
transmission port: short < -100 (from 500 MHz) < -110 < -110 < -110 < -110
circuits at both ports;
isolation calibration
applied)
Transmission uncertainty (specifications)
Reflection uncertainty (specifications)
Magnitude
0.01
0.1
1
10
-90-80-70-60-50-40-30-20-10010
Transmission coefficient (dB)
Uncertainty (dB)
E8363/4A 014 & UNL full 2-port cal using 85056A
S11 = S22 = 0
Source power = -17 dBm
■
45 MHz to 2 GHz
◆ 2 GHz to 20 GHz
▲ 20 GHz to 40 GHz
● 40 GHz to 50 GHz
Phase
0.1
1
10
100
-90-80-70-60-50-40-30-20-10010
Transmission coefficient (dB)
Uncertainty (degrees)
E8363/4A 014 & UNL full 2-port cal using 85056A
S11 = S22 = 0
Source power = -17 dBm
■
45 MHz to 2 GHz
◆ 2 GHz to 20 GHz
▲ 20 GHz to 40 GHz
● 40 GHz to 50 GHz
Magnitude
0
0.01
0.02
0.03
0.04
0.05
0 0.2 0.4 0.6 0.8 1
Reflection coefficient (linear)
Uncertainty (linear)
E8363/4A 014 & UNL with 85056A
S21 = S12 = 0
Source power = -17 dBm
■
45 MHz to 2 GHz
◆ 2 GHz to 20 GHz
▲ 20 GHz to 40 GHz
● 40 GHz to 50 GHz
Phase
0
2
4
6
8
10
0 0.2 0.4 0.6 0.8 1
Reflection coefficient (linear)
Uncertainty (deg)
E8363/4A 014 & UNL with 85056A
S21 = S12 = 0
Source power = -17 dBm
■
45 MHz to 2 GHz
◆ 2 GHz to 20 GHz
▲ 20 GHz to 40 GHz
● 40 GHz to 50 GHz
Page 10

10
Corrected system performance with 3.5 mm connectors
Standard configuration and standard power range (E8362A)
Applies to E8362A PNA Series analyzer, 85052B (3.5 mm) calibration kit, 85131F flexible test port cable
set, and a full two-port calibration. (Specifications apply over environmental temperature of 23° ±3°C,
with less than 1°C deviation from calibration temperature.)
Description Specification (dB)
45 MHz to 500 MHz 500 MHz to 2 GHz 2 to 10 GHz 10 to 20 GHz
Directivity 48 48 44 44
Source match 40 40 31 31
Load match 48 48 44 44
Reflection tracking ±(0.003 + 0.2/°C) ±(0.003 + 0.2/°C) ±(0.006 + 0.2/°C) ±(0.006 + 0.2/°C)
Transmission tracking ±(0.014 + 0.2/°C) ±(0.014 + 0.2/°C) ±(0.057 + 0.2/°C) ±(0.065 + 0.2/°C)
Crosstalk (reflection port to < -85 < -100 < -110 < -100
transmission port: short
circuits at both ports;
isolation calibration
applied)
Transmission uncertainty (specifications)
Reflection uncertainty (specifications)
Magnitude
0.01
0.1
1
10
-90-80-70-60-50-40-30-20-10010
Transmission coefficient (dB)
Uncertainty (dB)
E8362A full 2-port cal using 85052B
S11 = S22 = 0
Source power = -12 dBm
■
45 MHz to 500 MHz
◆ 500 MHz to 2 GHz
▲ 2 GHz to 10 GHz
● 10 GHz to 20 GHz
Phase
0.1
1
10
100
-90-80-70-60-50-40-30-20-10010
Transmission coefficient (dB)
Uncertainty (degrees)
E8362A full 2-port cal using 85052B
S11 = S22 = 0
Source power = -12 dBm
■
45 MHz to 500 MHz
◆ 500 MHz to 2 GHz
▲ 2 GHz to 10 GHz
● 10 GHz to 20 GHz
Magnitude
0
0.01
0.02
0.03
0.04
0 0.2 0.4 0.6 0.8 1
Reflection coefficient (linear)
Uncertainty (linear)
E8362A with 85052B
S21 = S12 = 0
Source power = -12 dBm
■
45 MHz to 500 MHz
◆ 500 MHz to 2 GHz
▲ 2 GHz to 10 GHz
● 10 GHz to 20 GHz
Phase
0
2
4
6
8
10
0 0.2 0.4 0.6 0.8 1
Reflection coefficient (linear)
Uncertainty (deg)
E8362A with 85052B
S21 = S12 = 0
Source power = -12 dBm
■
45 MHz to 500 MHz
◆ 500 MHz to 2 GHz
▲ 2 GHz to 10 GHz
● 10 GHz to 20 GHz
Page 11
11
Extended configuration and standard power range (E8362A-Option 014)
Applies to E8362A PNA Series analyzer, 85052B (3.5 mm) calibration kit, 85131F flexible test port cable
set, and a full two-port calibration. (Specifications apply over environmental temperature of 23° ±3°C,
with less than 1°C deviation from calibration temperature.)
Description Specification (dB)
45 MHz to 500 MHz 500 MHz to 2 GHz 2 to 10 GHz 10 to 20 GHz
Directivity 48 48 44 44
Source match 40 40 31 31
Load match 48 48 44 44
Reflection tracking ±(0.003 + 0.2/°C) ±(0.003 + 0.2/°C) ±(0.006 + 0.2/°C) ±(0.006 + 0.2/°C)
Transmission tracking ±(0.017 + 0.2/°C) ±(0.017 + 0.2/°C) ±(0.065 + 0.2/°C) ±(0.091+ 0.2/°C)
Crosstalk (reflection port to < -85 < -100 < -110 < -100
transmission port: short
circuits at both ports;
isolation calibration
applied)
Transmission uncertainty (specifications)
Reflection uncertainty (specifications)
Magnitude
0.01
0.1
1
10
-90-80-70-60-50-40-30-20-10010
Transmission coefficient (dB)
Uncertainty (dB)
E8362A 014 full 2-port cal using 85052B
S11 = S22 = 0
Source power = -17 dBm
■
45 MHz to 500 MHz
◆ 500 MHz to 2 GHz
▲ 2 GHz to 10 GHz
● 10 GHz to 20 GHz
Phase
0.1
1
10
100
-90-80-70-60-50-40-30-20-10010
Transmission coefficient (dB)
Uncertainty (degrees)
E8362A 014 full 2-port cal using 85052B
S11 = S22 = 0
Source power = -17 dBm
■
45 MHz to 500 MHz
◆ 500 MHz to 2 GHz
▲ 2 GHz to 10 GHz
● 10 GHz to 20 GHz
Magnitude
0
0.01
0.02
0.03
0.04
0 0.2 0.4 0.6 0.8 1
Reflection coefficient (linear)
Uncertainty (linear)
E8362A 014 with 85052B
S21 = S12 = 0
Source power = -17 dBm
■
45 MHz to 500 MHz
◆ 500 MHz to 2 GHz
▲ 2 GHz to 10 GHz
● 10 GHz to 20 GHz
Phase
0
2
4
6
8
10
0 0.2 0.4 0.6 0.8 1
Reflection coefficient (linear)
Uncertainty (deg)
E8362A 014 with 85052B
S21 = S12 = 0
Source power = -17 dBm
■
45 MHz to 2 GHz
◆ 2 GHz to 20 GHz
▲ 20 GHz to 40 GHz
● 40 GHz to 50 GHz
Page 12
12
Corrected system performance with 3.5 mm connectors continued
Standard configuration and extended power range and bias-tees (E8362A-Option UNL)
Applies to E8362A PNA Series analyzer, 85052B (3.5 mm) calibration kit, 85131F flexible test port cable
set, and a full two-port calibration. (Specifications apply over environmental temperature of 23° ±3°C,
with less than 1°C deviation from calibration temperature.)
Description Specification (dB)
45 MHz to 500 MHz 500 MHz to 2 GHz 2 to 10 GHz 10 to 20 GHz
Directivity 48 48 44 44
Source match 40 40 31 31
Load match 48 48 44 44
Reflection tracking ±(0.003 + 0.2/°C) ±(0.003 + 0.2/°C) ±(0.006 + 0.2/°C) ±(0.006 + 0.2/°C)
Transmission tracking ±(0.017 + 0.2/°C) ±(0.017 + 0.2/°C) ±(0.065 + 0.2/°C) ±(0.091+ 0.2/°C)
Crosstalk (reflection port to < -85 < -100 < -110 < -100
transmission port: short
circuits at both ports;
isolation calibration
applied)
Transmission uncertainty (specifications)
Reflection uncertainty (specifications)
Magnitude
0.01
0.1
1
10
-90-80-70-60-50-40-30-20-10010
Transmission coefficient (dB)
Uncertainty (dB)
E8362A UNL full 2-port cal using 85052B
S11 = S22 = 0
Source power = -17 dBm
■
45 MHz to 500 MHz
◆ 500 MHz to 2 GHz
▲ 2 GHz to 10 GHz
● 10 GHz to 20 GHz
Phase
0.1
1
10
100
-90-80-70-60-50-40-30-20-10010
Transmission coefficient (dB)
Uncertainty (degrees)
E8362A UNL full 2-port cal using 85052B
S11 = S22 = 0
Source power = -17 dBm
■
45 MHz to 500 MHz
◆ 500 MHz to 2 GHz
▲ 2 GHz to 10 GHz
● 10 GHz to 20 GHz
Magnitude
0
0.01
0.02
0.03
0.04
0 0.2 0.4 0.6 0.8 1
Reflection coefficient (linear)
Uncertainty (linear)
E8362A UNL with 85052B
S21 = S12 = 0
Source power = -17 dBm
■
45 MHz to 500 MHz
◆ 500 MHz to 2 GHz
▲ 2 GHz to 10 GHz
● 10 GHz to 20 GHz
Phase
0
2
4
6
8
10
0 0.2 0.4 0.6 0.8 1
Reflection coefficient (linear)
Uncertainty (deg)
E8362A UNL with 85052B
S21 = S12 = 0
Source power = -17 dBm
■
45 MHz to 500 MHz
◆ 500 MHz to 2 GHz
▲ 2 GHz to 10 GHz
● 10 GHz to 20 GHz
Page 13
Extended configuration and extended power range and bias-tees (E8362A-Options UNL and 014)
Applies to E8362A PNA Series analyzer, 85052B (3.5 mm) calibration kit, 85131F flexible test port cable
set, and a full two-port calibration. (Specifications apply over environmental temperature of 23° ±3°C,
with less than 1°C deviation from calibration temperature.)
Description Specification (dB)
45 MHz to 500 MHz 500 MHz to 2 GHz 2 to 10 GHz 10 to 20 GHz
Directivity 48 48 44 44
Source match 40 40 31 31
Load match 48 48 44 44
Reflection tracking ±(0.003 + 0.2/°C) ±(0.003 + 0.2/°C) ±(0.006 + 0.2/°C) ±(0.006 + 0.2/°C)
Transmission tracking ±(0.017 + 0.2/°C) ±(0.017 + 0.2/°C) ±(0.065 + 0.2/°C) ±(0.091+ 0.2/°C)
Crosstalk (reflection port to < -85 < -100 < -110 < -100
transmission port: short
circuits at both ports;
isolation calibration
applied)
Transmission uncertainty (specifications)
Reflection uncertainty (specifications)
Magnitude
0.01
0.1
1
10
-90-80-70-60-50-40-30-20-10010
Transmission coefficient (dB)
Uncertainty (dB)
E8362A 014 & UNL full 2-port cal using 85052B
S11 = S22 = 0
Source power = -17 dBm
■
45 MHz to 500 MHz
◆ 500 MHz to 2 GHz
▲ 2 GHz to 10 GHz
● 10 GHz to 20 GHz
Phase
0.1
1
10
100
-90-80-70-60-50-40-30-20-10010
Transmission coefficient (dB)
Uncertainty (degrees)
E8362A 014 & UNL full 2-port cal using 85052B
S11 = S22 = 0
Source power = -17 dBm
■
45 MHz to 500 MHz
◆ 500 MHz to 2 GHz
▲ 2 GHz to 10 GHz
● 10 GHz to 20 GHz
Magnitude
0
0.01
0.02
0.03
0.04
0 0.2 0.4 0.6 0.8 1
Reflection coefficient (linear)
Uncertainty (linear)
E8362A 014 & UNL with 85052B
S21 = S12 = 0
Source power = -17 dBm
■
45 MHz to 500 MHz
◆ 500 MHz to 2 GHz
▲ 2 GHz to 10 GHz
● 10 GHz to 20 GHz
Phase
0
2
4
6
8
10
0 0.2 0.4 0.6 0.8 1
Reflection coefficient (linear)
Uncertainty (deg)
E8362A 014 & UNL with 85052B
S21 = S12 = 0
Source power = -17 dBm
■
45 MHz to 500 MHz
◆ 500 MHz to 2 GHz
▲ 2 GHz to 10 GHz
● 10 GHz to 20 GHz
13
Page 14

14
Uncorrected system performance
1
Description Specification Supplemental information
Directivity Typical:
45 MHz to 2 GHz 24 dB 29 dB
2 to 10 GHz 22 dB 25 dB
10 to 20 GHz 16 dB 20 dB
20 to 40 GHz 16 dB 20 dB
40 to 45 GHz 15 dB 18 dB
45 to 50 GHz 13 dB 18 dB
Source match - standard Typical:
45 MHz to 2 GHz 23 dB 27 dB
2 to 10 GHz 16 dB 19 dB
10 to 20 GHz 14 dB 19 dB
20 to 40 GHz 10 dB 14 dB
40 to 45 GHz 9 dB 13.5 dB
45 to 50 GHz 5.5 dB 9 dB
Source match - Option UNL, 014, or UNL and 014 Typical:
45 MHz to 2 GHz 18 dB 22.5 dB
2 to 10 GHz 14 dB 18 dB
10 to 20 GHz 12 dB 15 dB
20 to 40 GHz 8 dB 10 dB
40 to 45 GHz 7 dB 10 dB
45 to 50 GHz 4 dB 6.5 dB
Load match - standard Typical:
45 MHz to 2 GHz 23 dB 29 dB
2 to 10 GHz 14 dB 16 dB
10 to 20 GHz 10 dB 12 dB
20 GHz to 40 GHz 9 dB 12 dB
40 to 45 GHz 9 dB 13 dB
45 to 50 GHz 7 dB 10 dB
Load match - Option UNL, 014, or UNL and 014 Typical:
45 MHz to 2 GHz 17 dB 21.5 dB
2 to 10 GHz 13 dB 16.5 dB
10 to 20 GHz 10 dB 13 dB
20 to 40 GHz 9 dB 11 dB
40 to 45 GHz 8 dB 11 dB
45 to 50 GHz 6 dB 8 dB
Reflection tracking Typical:
45 MHz to 20 GHz ±1.5 dB
20 to 40 GHz ±1.5 dB
40 to 50 GHz ±2.0 dB
Transmission tracking
2
Typical:
45 MHz to 2 GHz ±1.5 dB
2 to 10 GHz ±2.0 dB
10 to 20 GHz ±2.5 dB
20 to 40 GHz ±3.5 dB
40 to 45 GHz ±4.0 dB
45 to 50 GHz ±4.5 dB
1. Specifications apply over environment temperature of
23°C, with less than 1°C deviation from the calibration
temperature.
2. Transmission tracking performance is strongly
dependent on cable used; These typical specifications
are set based on the use of Agilent thru cable part
number 85133-60016.
Page 15

15
Description Specification Supplemental information
Crosstalk
1
- standard
45 MHz to 1 GHz 85 dB
1 to 2 GHz 100 dB
2 to 20 GHz 110 dB
20 to 40 GHz 108 dB
40 to 45 GHz 105 dB
45 to 50 GHz 100 dB
Crosstalk
1
- Option UNL or 014
45 MHz to 1 GHz 85 dB
1 to 2 GHz 100 dB
2 to 20 GHz 109 dB
20 to 40 GHz 106 dB
40 to 45 GHz 103 dB
45 to 50 GHz 98 dB
Crosstalk
1
- Option UNL and 014
45 MHz to 1 GHz 85 dB
1 to 2 GHz 98 dB
2 to 10 GHz 108 dB
10 to 20 GHz 107 dB
20 to 40 GHz 104 dB
40 to 45 GHz 100 dB
45 to 50 GHz 95 dB
1. Measurement conditions: Normalized to a thru,
measured with two shorts, 10-Hz IF bandwidth,
averaging factor of 8, alternate mode, source power
set to the lesser of the maximum power out or the
maximum receiver power.
Page 16

16
Test port output
1
Description Specification Supplemental information
Standard 014 UNL UNL and 014
Frequency range
E8362A 45 MHz to 20 GHz
E8363A 45 MHz to 40 GHz
E8364A 45 MHz to 50 GHz
Nominal power -12 dBm -17 dBm -17 dBm -17 dBm
Frequency resolution 1 Hz 1 Hz 1 Hz 1 Hz
CW accuracy ± 1ppm ± 1ppm ± 1ppm ± 1ppm
Frequency stability ±1 ppm 0 to 40°C, typical
±0.2 ppm/yr, typical
Power level accuracy
45 MHz to 10 GHz ±1.5 dB ±1.5 dB ±1.5 dB ±1.5 dB Variation from nominal
10 to 20 GHz ±2.0 dB ±2.0 dB ±2.0 dB ±2.0 dB power in range 0
20 to 40 GHz ±3.0 dB ±3.0 dB ±3.0 dB ±3.0 dB (step attenuator at 0 dB).
40 to 45 GHz ±3.0 dB ±3.5 dB ±3.0 dB ±3.5 dB
45 to 50 GHz ±3.0 dB ±4.0 dB ±3.0 dB ±4.0 dB
Power level linearity
45 MHz to 20 GHz ±1.0 dB ±1.0 dB ±1.0 dB
2
±1.0 dB
2
Test reference is at the
20 to 40 GHz ±1.0 dB ±1.0 dB ±1.0 dB
2
±1.0 dB
2
nominal power level
40 to 50 GHz ±1.0 dB ±1.0 dB ±1.0 dB ±1.0 dB (step attenuator at 0 dB).
Power range
3
45 MHz to 10 GHz -25 to +5 dB -25 to +5 dBm -87 to +3 dBm -87 to +3 dBm
10 to 20 GHz -24 to +3 dB -25 to +2 dBm -86 to +1 dBm -87 to 0 dBm
20 to 30 GHz -23 to 0 dBm -25 to -2 dBm -85 to -2 dBm -87 to -4 dBm
30 to 40 GHz -23 to -4 dBm -25 to - 6 dBm -85 to -6 dBm -87 to -8 dBm
40 to 45 GHz -25 to -5 dBm -27 to -7 dBm -87 to -9 dBm -87 to -11 dBm
45 to 50 GHz -25 to -10 dBm -27 to -12 dBm -87 to -15 dBm -87 to -17 dBm
Power sweep range (ALC)
45 MHz to 10 GHz 30 dB 30 dB 30 dB 30 dB ALC range starts at
10 to 20 GHz 27 dB 27 dB 27 dB 27 dB maximum leveled output
20 to 30 GHz 23 dB 23 dB 23 dB 23 dB power and goes down to
30 to 40 GHz 19 dB 19 dB 19 dB 19 dB power level indicated by
40 to 45 GHz 20 dB 20 dB 18 dB 16 dB dB amount specified.
45 to 50 GHz 15 dB 15 dB 12 dB 10 dB
Power resolution 0.01 dB 0.01 dB 0.01 dB 0.01 dB
Phase noise (10-kHz offset from center frequency, nominal power at test port)
45 MHz to 10 GHz -70 dBc typical
10 to 20 GHz -65 dBc typical
20 to 40 GHz -55 dBc typical
40 to 50 GHz -55 dBc typical
Harmonics (2nd or 3rd) -23 dBc typical, in power
Non-harmonic spurious (at nominal output power)
45 MHz to 20 GHz -50 dBc typical, for offset
frequency > 1 kHz
20 to 40 GHz -30 dBc typical, for offset
frequency > 1 kHz
40 to 50 GHz -30 dBc typical, for offset
frequency > 1 kHz
1. Source output performance on port 1 only.
Port 2 output performance is a characteristic.
2. ±1.5 dB for power ≤ -23 dBm.
3. Power to which the source can be set and phase
lock is assured.
Page 17

17
Test port input
Description Specification Supplemental information
Standard 014 UNL UNL and 014
Test port noise floor
1
10-Hz IF bandwidth
45 to 500 MHz
2
< -89 dBm < -89 dBm < -89 dBm < -89 dBm
500 MHz to 2 GHz < -114 dBm < -114 dBm < -114 dBm < -114 dBm
2 to 10 GHz < -117 dBm < -117 dBm < -117 dBm < -117 dBm
10 to 20 GHz < -120 dBm < -119 dBm < -120 dBm < -119 dBm
20 to 40 GHz < -114 dBm < -113 dBm < -114 dBm < -113 dBm
40 to 50 GHz < -114 dBm < -112 dBm < -114 dBm < -112 dBm
1-Hz IF bandwidth
45 to 500 MHz
2
< -69 dBm < -69 dBm < -69 dBm < -69 dBm
500 MHz to 2 GHz < -94 dBm < -94 dBm < -94 dBm < -94 dBm
2 to 10 GHz < -97 dBm < -97 dBm < -97 dBm < -97 dBm
10 to 20 GHz < -100 dBm < -99 dBm < -100 dBm < -99 dBm
20 to 40 GHz < -94 dBm < -93 dBm < -94 dBm < -93 dBm
40 to 50 GHz < -94 dBm < -92 dBm < -94 dBm < -92 dBm
Direct receiver access input noise floor
1
10-Hz IF bandwidth
45 to 500 MHz
2
< -127 dBm < -127 dBm
500 MHz to 2 GHz < -133 dBm < -133 dBm
2 to 10 GHz < -132 dBm < -132 dBm
10 to 20 GHz < -134 dBm < -134 dBm
20 to 40 GHz < -125 dBm < -125 dBm
40 to 50 GHz < -123 dBm < -123 dBm
1-Hz IF bandwidth
45 to 500 MHz < -107 dBm < -107 dBm
500 MHz to 2 GHz < -113 dBm < -113 dBm
2 to 10 GHz < -112 dBm < -112 dBm
10 to 20 GHz < -114 dBm < -114 dBm
20 to 40 GHz < -105 dBm < -105 dBm
40 to 50 GHz < -103 dBm < -103 dBm
Receiver compression level
45 MHz to 20 GHz < 0.6 dB compression at +5 dBm
20 to 30 GHz < 0.6 dB compression at 0 dBm
30 to 40 GHz < 0.6 dB compression at -3 dBm
40 to 50 GHz < 0.6 dB compression at -3 dBm
System compression level max output power See dynamic accuracy chart
Trace noise magnitude
45 to 500 MHz < 0.010 dB rms 1-kHz IF bandwidth
500 MHz to 20 GHz < 0.006 dB rms Ratio measurement, nominal
20 to 40 GHz < 0.006 dB rms power at test port
40 to 50 GHz < 0.006 dB rms
Trace noise phase
45 to 500 MHz
3
< 0.100° rms 1-kHz IF bandwidth
500 MHz to 20 GHz < 0.060° rms Ratio measurement, nominal
20 to 40 GHz < 0.100° rms power at test port
40 to 50 GHz < 0.100° rms
1. Total average (rms) noise power calculated as
mean value of a linear magnitude trace expressed
in dBm.
2. Noise floor may be degraded by 10 dB at particular
frequencies (multiples of 5 MHz) due to spurious
receiver residuals.
3. Trace noise magnitude may be degraded to
20 mdB rms at harmonic frequencies of the first IF
(8.33 MHz) below 80 MHz.
Page 18

Test port input continued
Description Specification Supplemental information
Standard 014 UNL UNL and 014
Reference level magnitude
Range ±200 dB ±200 dB ±200 dB ±200 dB
Resolution 0.001 dB 0.001 dB 0.001 dB 0.001 dB
Reference level phase
Range ±500° ±500° ±500° ±500°
Resolution 0.01° 0.01° 0.01° 0.01°
Stability magnitude
1
Typical ratio measurement:
Measured at the test port
45 MHz to 20 GHz ±0.02 dB/°C
20 to 40 GHz ±0.03 dB/°C
40 to 50 GHz ±0.04 dB/°C
Stability phase
1
Typical ratio measurement:
Measured at the test port
45 MHz to 20 GHz ±0.2°/°C
20 to 40 GHz ±0.5°/°C
40 to 50 GHz ±0.8°/°C
Damage input level
Test port 1 and 2 20 dBm or ±40 VDC, typical
R1, R2 in 15 dBm or ±15 VDC, typical
A, B in 15 dBm or ±15 VDC, typical
Coupler thru (option 014 or UNL and 014) 30 dBm or ±40 VDC, typical
Coupler arm (option 014 or UNL and 014) 30 dBm or ±7 VDC, typical
18
1. Stability is defined as a ratio measurement
measured at the test port.
Page 19

19
Group delay
1
Description Specification Supplemental information
Aperture (selectable) (frequency span)/(number of points – 1)
Maximum aperture 20% of frequency span
Range 0.5 x (1/minimum aperture)
Maximum delay Limited to measuring no more than 180° of
phase change within the minimum aperture.
The following graph shows characteristic group delay accuracy with type-N full 2-port calibration and a
10-Hz IF bandwidth. Insertion loss is assumed to be less than 2 dB and electrical length to be 10 m.
In general, the following formula can be used to determine the accuracy, in seconds, of a specific group
delay measurement:
±Phase accuracy (deg)/[360 x Aperture (Hz)]
Depending on the aperture and device length, the phase accuracy used is either incremental phase
accuracy or worse case phase accuracy.
1. Group delay is computed by measuring the phase
change within a specified frequency step (determined
by the frequency span and the number of points per
sweep).
Group delay (typical)
100
10
1
0.1
Frequency = 1 GHz
Accuracy (nsec)
0.01
0.001
S11 = 0; S21 = 1; S12 = 0; S22 = 0
IF bandwidth = 10 Hz; Average factor = 1
Cal power = -12 dBm; Meas power = -12 dBm; Electrical length = 10 m
0.01 0.1 1 10 100
E8362/3/4A
Aperture (MHz)
Page 20

Test port input continued
Dynamic accuracy
Applies to input ports 1 and 2, accuracy of the test
port input power reading relative to the reference
input power level. Also applies to the following
conditions:
• IF bandwidth = 10 Hz
• test port powers = > –50 dBm and < 0 dBm
• magnitude dynamic accuracy = 0.02 dB +
0.001 dB/dB from reference power
• phase dynamic accuracy = 0.132° =
0.0066°/dB from reference power
20
Magnitude
0.01
0.1
1
10
-120-110-100-90-80-70-60-50-40-30-20-10010
Testport power (dBm)
Accuracy (dB)
E8362/3/4A
■
-10 dBm at 1 GHz
◆ -20 dBm at 1 GHz
▲ -30 dBm at 1 GHz
● -40 dBm at 1 GHz
Phase
0.1
1
10
100
-120-110-100-90-80-70-60-50-40-30-20-10010
Testport power (dBm)
Accuracy (degrees)
E8362/3/4A
■
-10 dBm at 1 GHz
◆ -20 dBm at 1 GHz
▲ -30 dBm at 1 GHz
● -40 dBm at 1 GHz
Page 21

General information
Description Supplemental information
System IF bandwidth range 1 Hz to 40 kHz, nominal
RF connectors
E8362A 3.5 mm (male), 50 Ω, (nominal), center pin recession flush to .002 in. (characteristic)
E8363/4A 2.4 mm (male), 50 Ω, (nominal), center pin recession flush to .002 in. (characteristic)
Display 8.4 in diagonal color active matrix LCD; 640 (horizontal) x 480 (vertical) resolution;
59.83 Hz vertical refresh rate; 31.41 Hz horizontal refresh rate
Display range
Magnitude ±200 dB (at 20 dB/div), max
Phase ±180°, max
Polar 10 pico units, min; 1000 units, max
Display resolution
Magnitude 0.001 dB/div, min
Phase 0.01°/div, min
Marker resolution
Magnitude 0.001 dB, min
Phase 0.01°, min
Polar 0.01 mUnit, min; 0.01°, min
CPU Intel®500 MHz Pentium®III
Rear panel
10-MHz reference in
Input frequency 10 MHz ±10 ppm, typ.
Input power –15 dBm to +20 dBm, typ.
Input impedance 200 Ω, nom.
10-MHz reference out
Output frequency 10 MHz ±10 ppm, typ.
Signal type Sine wave, typ.
Output power 10 dB ± 4 dB into 50 Ω, typ.
Output impedance 50 Ω, nom.
Harmonics < -40 dBc, typ.
VGA video output 15-pin mini D-Sub; Drives VGA compatible monitors
GPIB Type D-24, 24-pin; female compatible with IEEE-488
Parallel port (LPT1) 25-pin D-sub miniature connector; provides connection to printers or any other
parallel port peripheral
Serial port (COM1) 9-pin D-Sub; male compatible with RS-232
USB port Type-A configuration (4 contacts inline, contact 1 on left); female
Contact 1 Vcc: 4.75 to 5.25 VDC, 500 mA max
Contact 2 -Data
Contact 3 +Data
Contact 4 Ground
LAN 10/100 BaseT Ethernet; 8-pin configuration
Test set I/O 25-pin D-sub; available for external test set control
Handler I/O 36-pin, parallel I/O port; all input/output signals are default set to negative logic;
can be rest to positive logic via GPIB command
Auxiliary I/O 25-pin connector; analog and digital I/O
21
Page 22

22
General information continued
Description Supplemental information
Line power
1
Frequency 48 Hz to 66 Hz
Voltage at 115-V setting 90 to 132 VAC; 120 VAC, nom.
Voltage at 220-V setting 198 to 264 VAC; 240 VAC, nom.
VA max 600 VA max
General environmental
RFI/EMI susceptibility Defined by CISPR Pub. 11, Group 1, Class A, and IEC 50082-1
ESD Minimize using static-safe work procedures and an antistatic bench mat
Dust Minimize for optimum reliability
Operating environment
Temperature 0°C to +40°C; Instrument powers up, phase locks, and displays no error messages
within this temperature range. (Except for ‘source unleveled’ error message that may
occur at temperature extremes when power approaches limits of ALC range.)
Error-corrected temperature range System specifications valid from 25°C ±5°C, with less than 1°C deviation from the
calibration temperature
Humidity 5 to 95% at +40°C
Altitude 0 to 4500 m (14,760 ft)
Non-operating storage environment
Temperature -40°C to +70°C
Humidity 0 to 90% at +65°C (non-condensing)
Altitude 0 to 15,240 m (50,000 ft)
Cabinet dimensions Exclude front and rear protrusions
Height x width x depth 267 x 425 x 426 mm, nom. (10.5 x 16.75 x 16.8 in, nom.)
Weight
Net 29 kg (64 lb), nom.
Shipping 36 kg (80 lb), nom.
1. A third-wire ground is required.
Page 23

Measurement throughput summary
Cycle time vs. IF bandwidth
1
Cycle time vs. number of points
1
Instrument state: preset condition, 201 points, Instrument state: preset condition, 35 kHz IF
CF = 1 GHz, Span = 100 MHz, correction off. Add bandwidth, CF = 1 GHz, Span = 100 MHz, correction
21 ms for display on. Cycle time includes sweep and off. Add 21 ms for display on. Cycle time includes
re-trace time. sweep and re-trace time.
Cycle time
1,2
(ms)
Number of points
51 201 401 1601
Start (fundamental band), IFBW = 35 kHz
Uncorrected and one-port cal 21 23 28 65
Two-port cal 52 57 70 152
Start 45 MHz kHz, stop 10 GHz, IFBW = 35 kHz
Uncorrected and one-port cal 71 79 84 110
Two-port cal 153 171 182 243
Start 45 MHz, stop 20 GHz, IFBW = 35 kHz
Uncorrected and one-port cal 103 116 121 139
Two-port cal 216 245 256 303
Start 45 MHz, stop 40 GHz, IFBW = 35 kHz
Uncorrected and one-port cal 145 181 190 232
Two-port cal 293 367 382 428
Start 45 MHz, stop 50 GHz, IFBW = 35 kHz
Uncorrected and one-port cal 163 210 218 256
Two-port cal 332 425 442 487
Time Domain
3
(increase over uncorrected sweep time)
Conversions <1 <1 4 13
Gating <1 <1 4 17
23
IF bandwidth (Hz) Cycle time (ms)
40,000 8
35,000 9
30,000 11
20,000 13
10,000 28
7,000 36
5,000 48
3,000 72
1,000 196
300 620
100 3853
30 8041
10 19855
Number of points Cycle time (ms)
34
11 4
51 5
101 6
201 9
401 16
801 29
1601 55
1. Typical performance.
2. Includes sweep time, retrace time and band-crossing
time. Analyzer display turned off with
DISPLAY:ENABLE OFF. Add 21 ms for display on.
Data for one trace (S11) measurement.
3. Option 010 only. Analyzer display turned off with
DISPLAY:ENABLE OFF. Add 21 ms for display on.
Page 24

24
Data transfer time (ms)
1
Number of points
51 201 401 1601
SCPI over GPIB
(program executed on external PC)
32-bit floating point 3 7 12 43
64-bit floating point 4 12 22 84
ASCII 18 64 124 489
SCPI over 100 Mbit/s LAN
(program executed on external PC)
32-bit floating point 1111
64-bit floating point 1112
ASCII 5 15 26 96
SCPI (program executed in the analyzer)
32-bit floating point 1123
64-bit floating point 1224
ASCII 8 29 56 222
COM (program executed in the analyzer)
32-bit floating point 1111
Variant type 1126
DCOM over LAN
(program executed on external PC)
32-bit floating point 1112
Variant type 13619
1. Typical performance.
Page 25

PNA Series simplified test set block diagram
Standard power range
Extended configuration, source access, receiver (Option 014)
25
Source
Switch
Reference
receiver
Reference
receiver
Measurement
receivers
Port 1 Port 2
A
B
R1 R2
Source
Switch
Reference
receiver
Reference
receiver
Measurement
receivers
Port 1 Port 2
A
B
R1 R2
Page 26

26
Extended power range and bias-tees (Option UNL)
Extended configuration with extended power range and bias-tees
(Option UNL and 014)
Source
Switch
Reference
receiver
Reference
receiver
Measurement
receivers
Port 1 Port 2
A
B
R1 R2
60 dB60 dB
Bias-teeBias-tee
Source
Switch
Reference
receiver
Reference
receiver
Measurement
receivers
Port 1 Port 2
Bias-tee
60 dB
A
Bias-tee
60 dB
B
R1 R2
Page 27

Measurement capabilities
Number of measurement channels
Sixteen independent measurement channels. A
measurement channel is coupled to stimulus settings
including frequency, IF bandwidth, power level,
and number of points.
Number of display windows
Up to four display windows. Each window can be
sized and re-arranged. Up to four measurement
channels can be displayed per window.
Number of traces
Up to four active traces and four memory traces
per window. Sixteen total active traces and 16
memory traces can be displayed. Measurement
traces include S-parameters, as well as relative
and absolute power measurements.
Measurement choices
S11, S21, S12, S22, A/R1, A/R2, A/B, B/R1, B/R2,
B/A, R1/A, R1/B, R1/R2, R2/A, R2/B, R2/R1, A, B,
R1, R2
Formats
Log or linear magnitude, SWR, phase, group delay,
real and imaginary, Smith chart, polar.
Data markers
Ten independent markers per trace. Reference
marker available for delta marker operation.
Marker formats include log or linear magnitude,
phase, real, imaginary, SWR, delay, R + jX, and
G + jB.
Marker functions
Marker search
Maximum value, minimum value, target, next peak,
peak right, peak left, target, and bandwidth with
user-defined target values
Marker-to functions
Set start, stop, and center to active marker stimulus
value; set reference to active marker response
value; set electrical delay to active marker phase
response value.
Trace statistics
Calculates and displays mean, standard deviation
and peak-to-peak deviation of the data trace.
Tracking
Performs new search continuously or on demand.
Source control
Measured number of points per sweep
User definable from 2 to 1601.
Sweep type
Linear, CW (single frequency), power or segment
sweep.
Segment sweep
Define up to 101 different, sub-sweep frequency
ranges in any combination of start-stop sweep
modes. Set number of points, test port power levels,
IF bandwidth, and dwell time independently for
each segment.
Sweep trigger
Set to continuous, hold, single, or group sweep
with internal or external trigger.
Power
Power slope can be set in dBm/GHz. Control the
test port signal by setting the internal attenuator of
the test set over a 60-dB range.
27
Page 28

28
Trace functions
Display data
Display current measurement data, memory data,
or current measurement with measurement and
memory data simultaneously.
Trace math
Vector addition, subtraction, multiplication or
division of current linear measurement values and
memory data.
Display annotations
Start/stop, center/span, or CW frequency,
scale/div, reference level, marker data, warning
and caution messages, trace status, and pass/fail
indication.
Title
Add custom titles (50 characters maximum) to
the display. Titles will be printed when making
hardcopies of displayed measurements.
Autoscale
Automatically selects scale resolution and reference
value to center the trace.
Electrical delay
Offset measured phase or group delay by a defined
amount of electrical delay, in seconds.
Phase offset
Offset measured phase or group delay by a defined
amount in degrees.
Data accuracy enhancement
Measurement calibration
Measurement calibration significantly reduces
measurement uncertainty due to errors caused by
system directivity, source and load match, tracking
and crosstalk. Full two-port calibration removes
all the systematic errors to obtain the most
accurate measurements.
Calibration types available
Frequency response
Simultaneous magnitude and phase correction of
frequency response errors for either reflection
or transmission measurements.
Response and isolation
Compensates for frequency response and directivity
(reflection) or frequency response and crosstalk
errors.
One-port calibration
Uses test set port 1 or port 2 to correct for directivity,
frequency response and source match errors.
Two-port calibration
Compensates for directivity, source match, reflection
frequency response, load match, transmission
frequency response and crosstalk. Crosstalk calibration can be omitted.
TRL/TRM calibration
Compensates for directivity, reflection and transmission frequency response and crosstalk in both
forward and reverse directions. Provides the highest
accuracy for both coaxial and non-coaxial environments, such as on-wafer probing, in-fixture or
waveguide measurements.
Interpolated error correction
With any type of accuracy enhancement applied,
interpolated mode recalculates the error coefficients when the test frequencies are changed. The
number of points can be increased or decreased
and the start/stop frequencies can be changed, but
the resulting frequency range must be within the
original calibration frequency. System performance
is not specified for measurements with interpolated
error correction applied.
Velocity factor
Enters the velocity factor to calculate the equivalent
electrical length.
Reference plane extension
Redefine the plane-of-measurement reference to
other than port 1 or port 2.
Page 29

Storage
Internal hard disk drive
Store and recall binary instrument states and
calibration data on 10-GB, minimum, internal hard
drive. Instrument data can also be saved in ASCII
(including S2P) format. All files are MS-DOS®compatible. Instrument states include all control
settings, active limit lines, active list frequency
tables, memory trace data.
Disk drive
Instrument data, instrument states, and calibration
data can be stored on internal 3.5-in, 1.4-MB floppy
disk in MS-DOS-compatible format.
Data hardcopy
Printouts of instrument data are directly produced
on any printer with the appropriate Windows®
2000 printer driver. The analyzer provides USB,
Centronics (parallel), serial and LAN interfaces.
System capabilities
Familiar graphical user interface
The PNA employs a graphical user interface based
on Windows 2000. There are two fundamental ways
to operate the instrument manually: you can use a
hardkey interface, or use drop-down menus driven
from a mouse (or another standard USB pointing
device). Hardkey navigation brings up active toolbars that perform most of the operations required
to configure and view measurements. Front-panel
navigation keys allow for use of the instrument
without a mouse. In addition, mouse-driven pulldown menus provide easy access to both standard
and advanced features. Both methods employ dialog
boxes to display all the choices needed to make
measurement set-ups.
Built-in information system
Embedded documentation provides measurement
assistance in five different languages (English,
French, German, Japanese, and Spanish). A
thorough index of help topics and context-sensitive
help available from dialog boxes.
Limit lines
Define test limit lines that appear on the display
for go/no go testing. Lines may be any combination
of horizontal, sloping lines, or discrete data points.
29
Page 30

30
Time-domain (Option 010)
With the time-domain option, data from transmission or reflection measurements in the frequency
domain are converted to the time domain using
a Fourier transformation technique (chirp Z)
and presented on the display. The time-domain
response shows the measured parameter value
versus time. Markers may also be displayed in
electrical length (or physical length if the relative
propagation velocity is entered).
Time stimulus modes
Two types of time excitation stimulus waveforms
can be simulated during the transformations, a
step and an impulse.
Low-pass step
This stimulus, similar to a traditional time-domain
reflectometer (TDR) stimulus waveform, is used to
measure low-pass devices. The frequency-domain
data should extend from DC (extrapolated value)
to a higher value. The step response is typically
used for reflection measurements only.
Low-pass impulse
This stimulus is also used to measure low-pass
devices. The impulse response can be used for
reflection or transmission measurements.
Bandpass impulse
The bandpass impulse stimulates a pulsed RF signal
(with an impulse envelope) and is used to measure
the time-domain response of band-limited devices.
The start and stop frequencies are selectable by the
user to any values within the limits of the test set
used. Bandpass time-domain responses are useful
for both reflection and transmission measurements.
Time-domain range
The "alias-free" range over which the display is free
of response repetition depends on the frequency span
and the number of points. Range, in nanoseconds,
is determined by: Time-domain range =
(number of points - 1)/frequency span [in GHz]
Range resolution
The time resolution of a time-domain response is
related to range as follows: Range resolution =
time span/(number of points - 1)
Windows
The windowing function can be used to modify
(filter) the frequency-domain data and thereby
reduce over-shoot and ringing in the time-domain
response. Kaiser Beta windows are available.
Gating
The gating function can be used to selectively
remove reflection or transmission time-domain
responses. In converting back to the frequencydomain the effects of the responses outside the
gate are removed.
Configurable test set (Option 014)
With the configurable test set option, front panel
access loops are provided to the signal path
between the source output and coupler input.
Extended dynamic range configuration
Reverse the signal path in the coupler and bypass
the loss typically associated with the coupled arm.
Change the port 2 switch and coupler jumper configurations to increase the forward measurement
dynamic range. When making full two-port error
corrected measurements, the reverse dynamic
range is degraded by 12 to 15 dB.
High power measurement configuration
Add external power amplifier(s) between the
source output and coupler input to provide up to
+30 dBm of power at the test port(s). Full two-port
error correction measurements possible. When the
DUT output is expected to be greater than +30 dBm,
measure directly at the B input and use an external
fixed or step attenuator to prevent damage to the
receiver. For measurements greater than +30 dBm,
add external components such as couplers,
attenuators, and isolators.
Supplemental performance
Minimum reference channel input level: -35 dBm
Page 31

Automation
Methods
Controlling via internal analyzer execution
Write applications that can be executed from within
the analyzer via COM (component object model) or
SCPI standard-interface commands. These applications can be developed in a variety of languages,
including Visual Basic, Visual C++, Agilent VEE,
or LabView™ programming languages.
Controlling via GPIB
The GPIB interface operates to IEEE 488.2 and
SCPI standard-interface commands. The analyzer
can either be the system controller, or talker/listener.
Controlling via LAN
The built-in LAN interface and firmware support
data transfer and control via direct connection to a
10 Base-T network.
SICL/LAN Interface
The analyzer's support for SICL (standard instrument
control library) over the LAN provides control of
the network analyzer using a variety of computing
platforms, I/O interfaces, and operating systems.
With SICL/LAN, the analyzer is controlled remotely
over the LAN with the same methods used for a
local analyzer connected directly to the computer
via a GPIB interface.
DCOM Interface
The analyzer's support for DCOM (distributed
component object model) over the LAN provides
control of the network analyzer using a variety
of platforms. DCOM acts as an interface to the
analyzer for external applications. With DCOM,
applications can be developed or executed from
an external computer. During development, the
application can interface to the analyzer over
the LAN through the DCOM interface. Once
development is completed, the application can
be distributed to the analyzer and interfaced
using COM.
31
GPIB LAN Internal
SCPI XX X
COM/DCOM XX
Page 32

Microsoft ®, Windows ® and MS-DOS ® are U.S. registered trademarks
of Microsoft Corporation.
National Instrument
TM
and LabViewTMare trademarks of National Instruments Corporation.
Intel ® and Pentium ® are US registered trademarks of Intel Corporation.
Information resources
Literature
PNA Series RF and Microwave Network
Analyzers Brochure,
literature number 5968-8472E
PNA Series Microwave Network Analyzer
Configuration Guide,
literature number 5988-3993EN
Web
PNA Series: www.agilent.com/find/pna
Application and product resources:
www.agilent.com/find/test
www.agilent.com/find/emailupdates
Get the latest information on the products and applications
you select.
Agilent Technologies’ Test and Measurement Support,
Services, and Assistance
Agilent Technologies aims to maximize the value you
receive, while minimizing your risk and problems. We
strive to ensure that you get the test and measurement
capabilities you paid for and obtain the support you
need. Our extensive support resources and services
can help you choose the right Agilent products for your
applications and apply them successfully. Every instrument and system we sell has a global warranty. Support
is available for at least five years beyond the production
life of the product. Two concepts underlie Agilent’s overall support policy: “Our Promise” and “Your Advantage.”
Our Promise
Our Promise means your Agilent test and measurement
equipment will meet its advertised performance and
functionality. When you are choosing new equipment,
we will help you with product information, including
realistic performance specifications and practical
recommendations from experienced test engineers.
When you use Agilent equipment, we can verify that
it works properly, help with product operation, and
provide basic measurement assistance for the use of
specified capabilities, at no extra cost upon request.
Many self-help tools are available.
Your Advantage
Your Advantage means that Agilent offers a wide range
of additional expert test and measurement services,
which you can purchase according to your unique technical and business needs. Solve problems efficiently
and gain a competitive edge by contracting with us for
calibration, extra-cost upgrades, out-of-warranty repairs,
and on-site education and training, as well as design,
system integration, project management, and other
professional engineering services. Experienced Agilent
engineers and technicians worldwide can help you
maximize your productivity, optimize the return on
investment of your Agilent instruments and systems,
and obtain dependable measurement accuracy for the
life of those products.
Get the latest information on the products and
applications you select.
By internet, phone, or fax, get assistance with all your
test & measurement needs
Online assistance:
www.agilent.com/find/assist
Phone or Fax
United States:
(tel) 800 452 4844
Canada:
(tel) 877 894 4414
(fax) 905 282 6495
China:
(tel) 800 810 0189
(fax) 800 820 2816
Europe:
(tel) (31 20) 547 2323
(fax) (31 20) 547 2390
Japan:
(tel) (81) 426 56 7832
(fax) (81) 426 56 7840
Product specifications and descriptions in this document
subject to change without notice.
© Agilent Technologies, Inc. 2002
5988-3992EN
Korea:
(tel) (82 2) 2004 5004
(fax) (82 2) 2004 5115
Latin America:
(tel) (305) 269 7500
(fax) (305) 269 7599
Taiwan:
(tel) 0800 047 866
(fax) 0800 286 331
Other Asia Pacific Countries:
(tel) (65) 6375 8100
(fax) (65) 6836 0252
Email: tm_asia@agilent.com
Printed in USA, September 26, 2002
 Loading...