

Page 1
Operation
Symmetra® MW
With External Bypass Static Switch
~~
Page 2

Page 3

Content
Overview .......................................................................... 1
Navigation Tree . . . . . . . . . . . . . . . . . . . . . . . . . . . . . . . . . . . . . . . . . . .1
Display Symbols and Buttons . . . . . . . . . . . . . . . . . . . . . . . . . . . . . . . 2
Navigation symbols . . . . . . . . . . . . . . . . . . . . . . . . . . . . . . 2
Screen symbols . . . . . . . . . . . . . . . . . . . . . . . . . . . . . . . . 2
Buttons . . . . . . . . . . . . . . . . . . . . . . . . . . . . . . . . . . . . . . 3
Breakers . . . . . . . . . . . . . . . . . . . . . . . . . . . . . . . . . . . . . 3
How to Access Summary Screens from the UPS . . . . . . . . . . . . . . . 4
How to Access Summary Screens from the External Bypass
Static Switch . . . . . . . . . . . . . . . . . . . . . . . . . . . . . . . . . . . . . . . . . . . . . 5
How to Access the APC Symmetra MW Remote Display . . . . . . . . .6
How to start a web-based remote session . . . . . . . . . . . . . . . 6
Operation ......................................................................... 7
Operation Modes. . . . . . . . . . . . . . . . . . . . . . . . . . . . . . . . . . . . . . . . . . 7
Normal operation . . . . . . . . . . . . . . . . . . . . . . . . . . . . . . . . 7
Battery operation . . . . . . . . . . . . . . . . . . . . . . . . . . . . . . . . 7
Static bypass operation . . . . . . . . . . . . . . . . . . . . . . . . . . . 8
Manual bypass operation . . . . . . . . . . . . . . . . . . . . . . . . . . 8
Operation Procedures . . . . . . . . . . . . . . . . . . . . . . . . . . . . . . . . . . . . .9
How to access screens protected by the user-password . . . . . . 9
How to start up the system from manual bypass operation . . . . 9
How to shut down the system from normal to manual bypass
operation
How to transfer from normal to static bypass operation . . . . . 11
How to transfer from static bypass to normal operation . . . . . 12
. . . . . . . . . . . . . . . . . . . . . . . . . . . . . . . . . . . . 10
Symmetra MW with External Bypass Static Switch Operation Manual - 990-
Page 4

Content
Configuration .................................................................13
How to Configure the System . . . . . . . . . . . . . . . . . . . . . . . . . . . . . . 13
How to change the password . . . . . . . . . . . . . . . . . . . . . . .14
How to configure the Touch-Screen settings screen . . . . . . . .14
How to configure the Modbus Settings screen . . . . . . . . . . . .15
How to configure the Regional Settings screen . . . . . . . . . . . .16
How to configure the Network Configuration screens . . . . . . . .16
How to configure the Display Settings . . . . . . . . . . . . . . . . . .19
How to configure the Battery Test Settings screen . . . . . . . . .20
Maintenance...................................................................21
Predictive Maintenance Screens. . . . . . . . . . . . . . . . . . . . . . . . . . . . 21
How to access Predictive Maintenance screens . . . . . . . . . . .21
Inverter DC Capacitors screen . . . . . . . . . . . . . . . . . . . . . . .21
Inverter AC Capacitors screen . . . . . . . . . . . . . . . . . . . . . . .22
Top Fans screen . . . . . . . . . . . . . . . . . . . . . . . . . . . . . . . .22
Inverter Fans screen . . . . . . . . . . . . . . . . . . . . . . . . . . . . .23
Main Static Switch Fans screen . . . . . . . . . . . . . . . . . . . . . .23
How to Change the Air Filters . . . . . . . . . . . . . . . . . . . . . . . . . . . . . . 24
Troubleshooting ............................................................25
Alarm Types . . . . . . . . . . . . . . . . . . . . . . . . . . . . . . . . . . . . . . . . . . . . 25
Alarm button . . . . . . . . . . . . . . . . . . . . . . . . . . . . . . . . . .25
Alarm levels . . . . . . . . . . . . . . . . . . . . . . . . . . . . . . . . . . .25
How to silence the alarm . . . . . . . . . . . . . . . . . . . . . . . . . .25
How to view active alarms . . . . . . . . . . . . . . . . . . . . . . . . . .26
How to view the event log . . . . . . . . . . . . . . . . . . . . . . . . . .26
ii Symmetra MW with External Bypass Static Switch Operation Manual - 990-1377D-001
Page 5
Overview
g
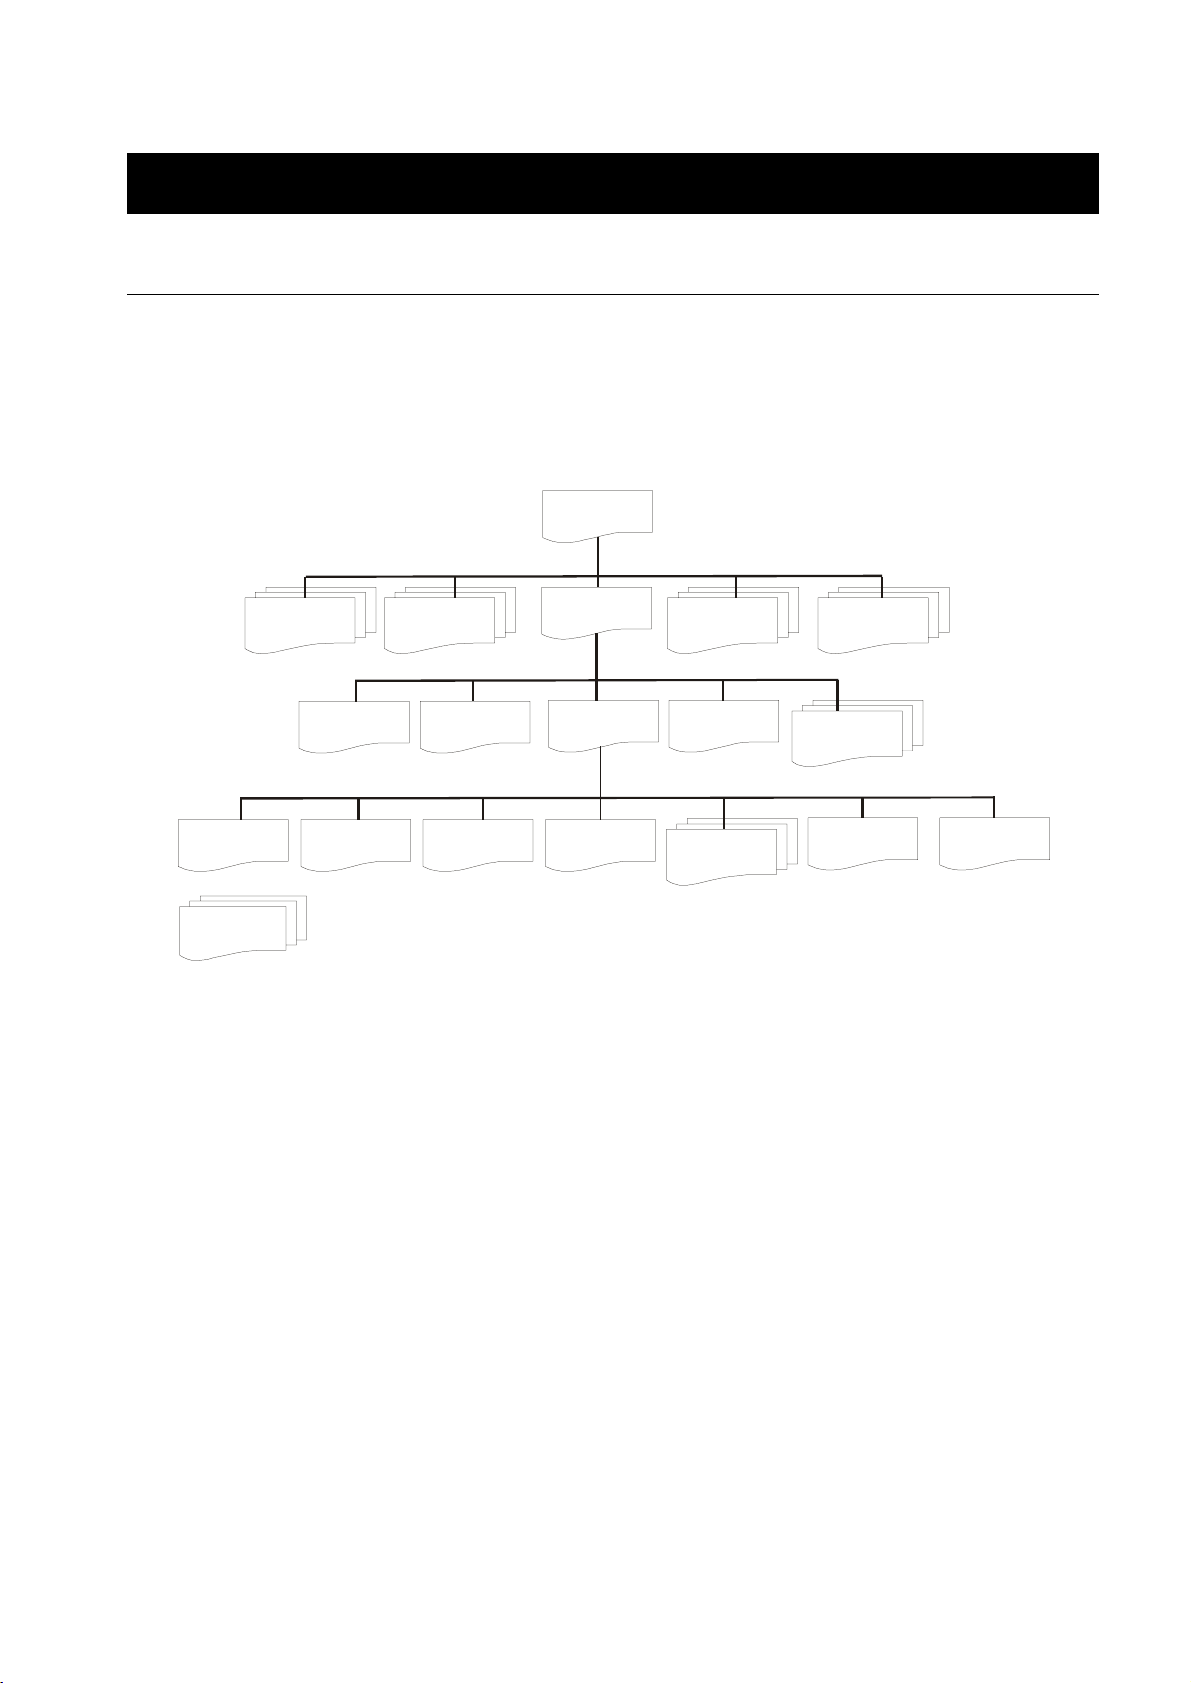
Navigation Tree
The UPS display is the user interface to the UPS system, and is located in the control section. This LCD
touch-screen display is used to configure the system, monitor the system, and change the settings. The
display also provides the user with audible and visual alarms.
The screens in the display are organized hierarchically with the UPS Summary screen at the top of the
hierarchy.
UPS Summary
Input Summary
Password Settings
Network
uration
Confi
MW0741a.cdr
UPS Start-Up
Tou ch -Sc ree n
Settings
Bypass Summary
UPS Shutdown
Modbus Settings
Operation
User Configuration
Regional Settings
Battery Summar y
View Event Log
Network
Configuration
Symbolizes multiple Network Configuration screens
Output Summary
Predictive
Maintenance
Display Settings
Battery Test
MW0820a.cdr
Symmetra MW with External Bypass Static Switch Operation Manual - 990-1377D-001 1
Page 6
Display Symbols and Buttons
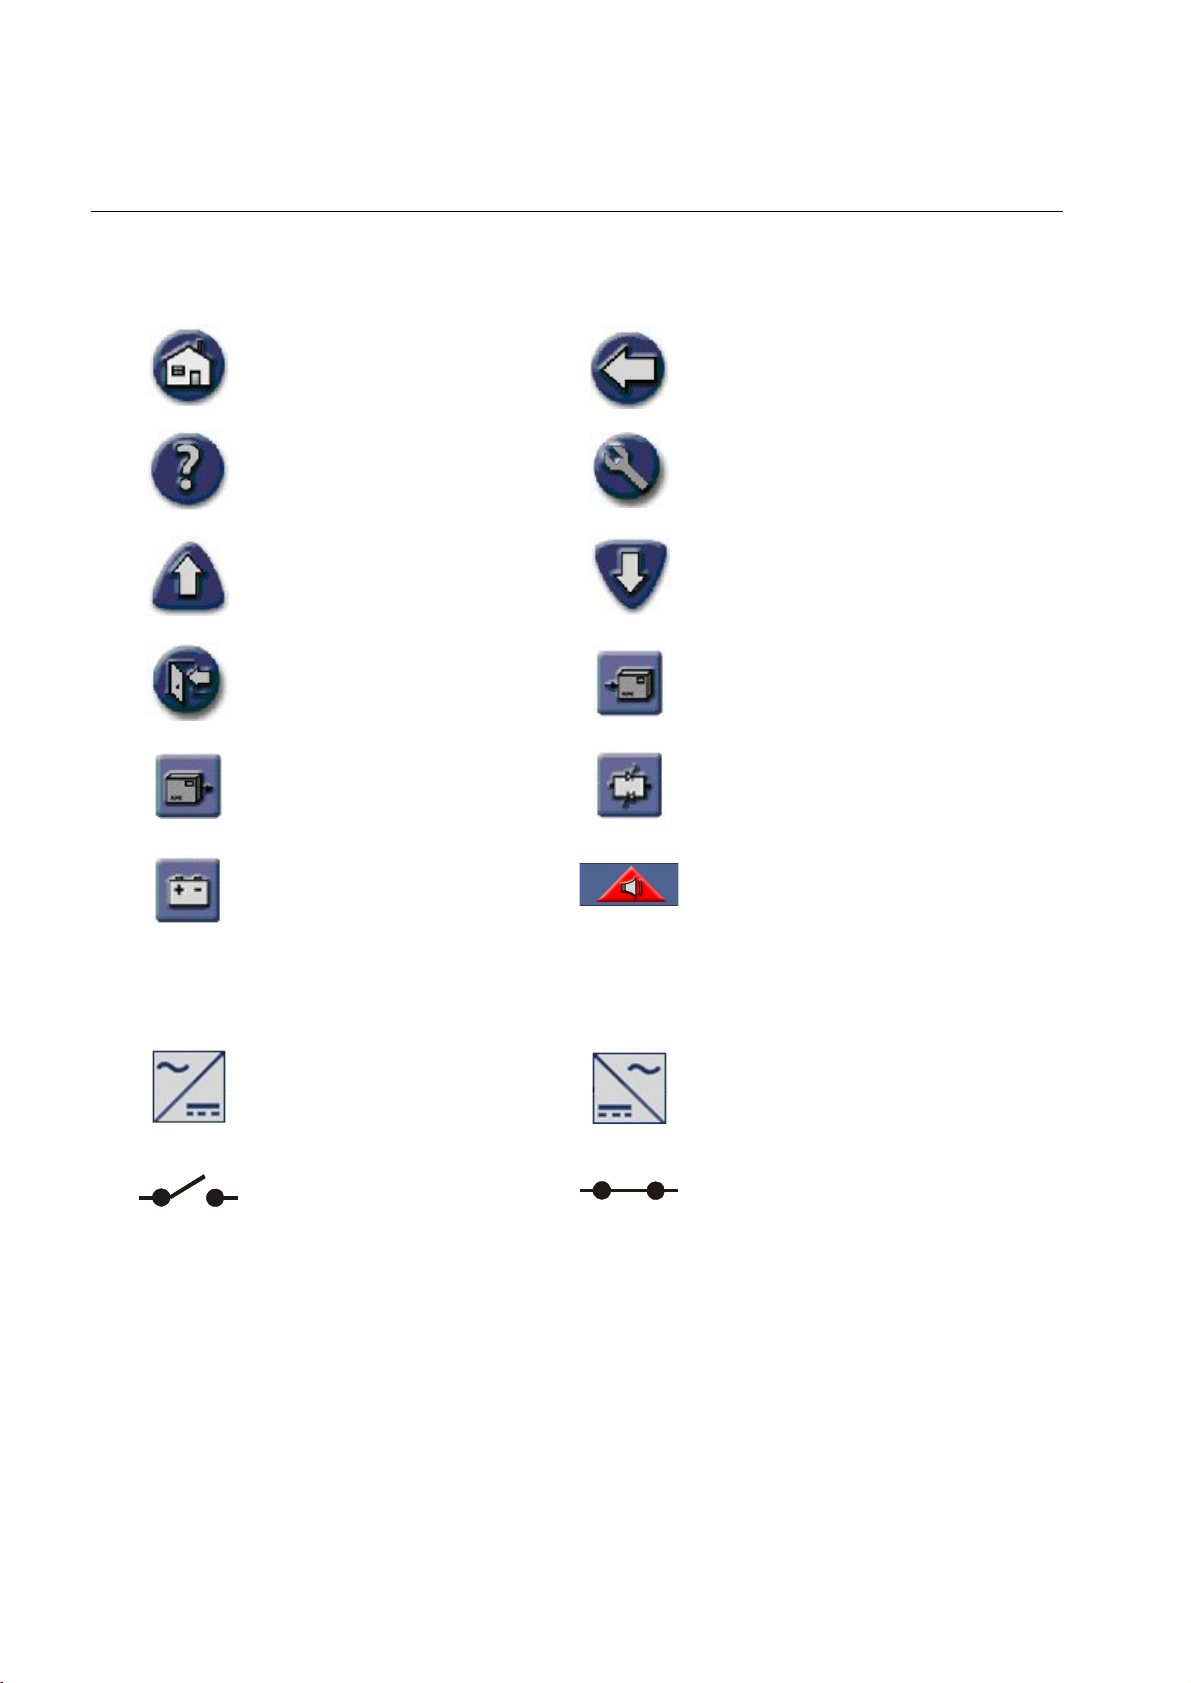
Navigation symbols
Home: Go to the top of the hierarchy. Back: Go to the previous screen.
Help: Access further details on the
current screen.
Page Up: Go to the previous screen
on the same subject (only visible
when there are more screens on the
same subject).
Password Logout: Log out of the
password-protected screens.
System Output: Access the Output
Summary screens.
Battery: Access the Battery
Summary screens.
Screen symbols
Operation: Go to the Operation
screen.
Page Down: Go to the next screen on
the same subject (only visible when
there are more screens on the same
subject).
System Input: Access the Input
Summary screens.
Static Switch: Access the Bypass
Summary screens.
Alarm button: Access the Active
Alarms screen
Delta inverter Main inverter
Open breaker or switch Closed breaker or switch
2 Symmetra MW with External Bypass Static Switch Operation Manual - 990-1377D-001
Page 7
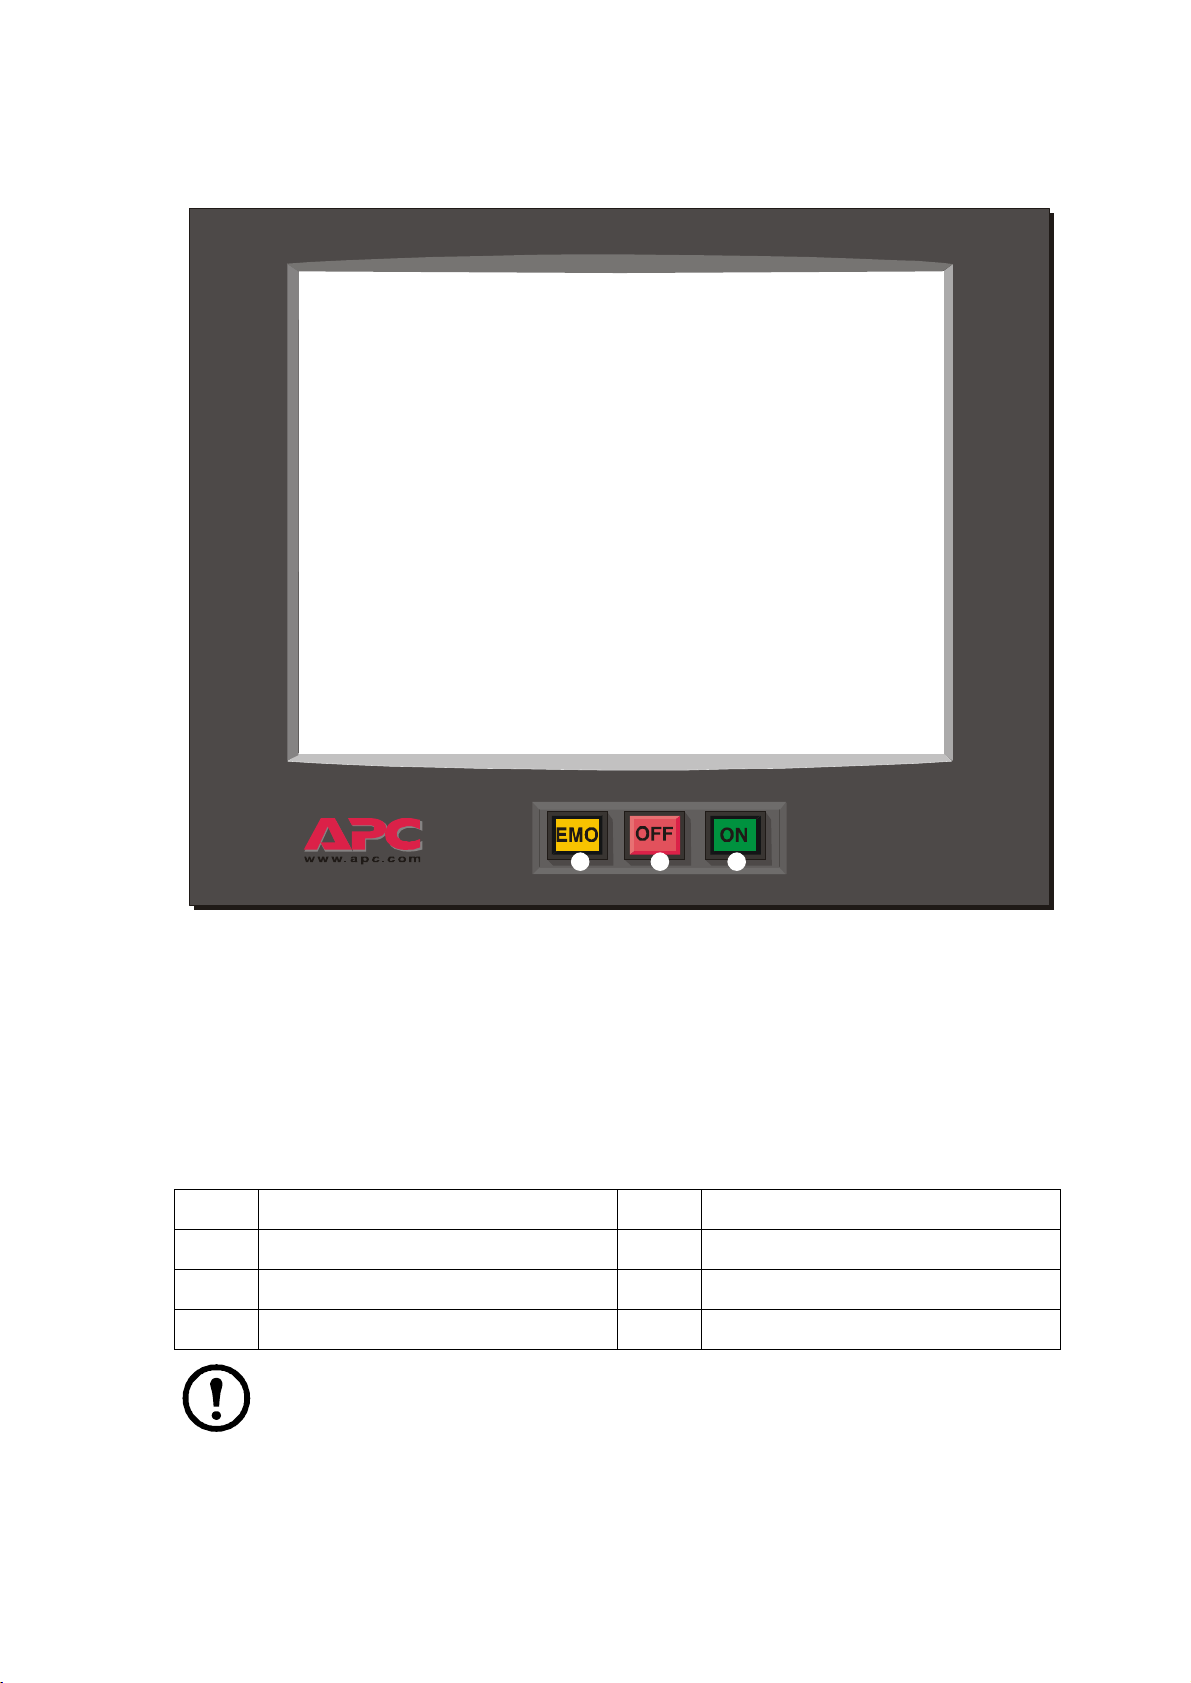
Buttons
Overview: Display Symbols and Buttons
Breakers
Q1 UPS input breaker Q5 Static bypass input breaker
Q2 UPS output breaker Q6 Static bypass output breaker (optional)
Q3 Manual bypass breaker Q7 Battery breaker 1
Q4 System output breaker (optional) Q8 Battery breaker 2
ON button: Press this button to switch ON the UPS or the External Bypass Static Switch.
OFF button: Press this button to switch OFF the UPS or the External Bypass Static Switch.
EMO (Emergency Module OFF) button: To be used in emergency situations only.
Pressing this button switches OFF all breakers, disabling AC/DC input and output in this section.
Be aware that this action may cut the supply to the load from the affected section.
Note: Only operate a breaker when the associated breaker lamp is on.
Symmetra MW with External Bypass Static Switch Operation Manual - 990-1377D-001 3
Page 8
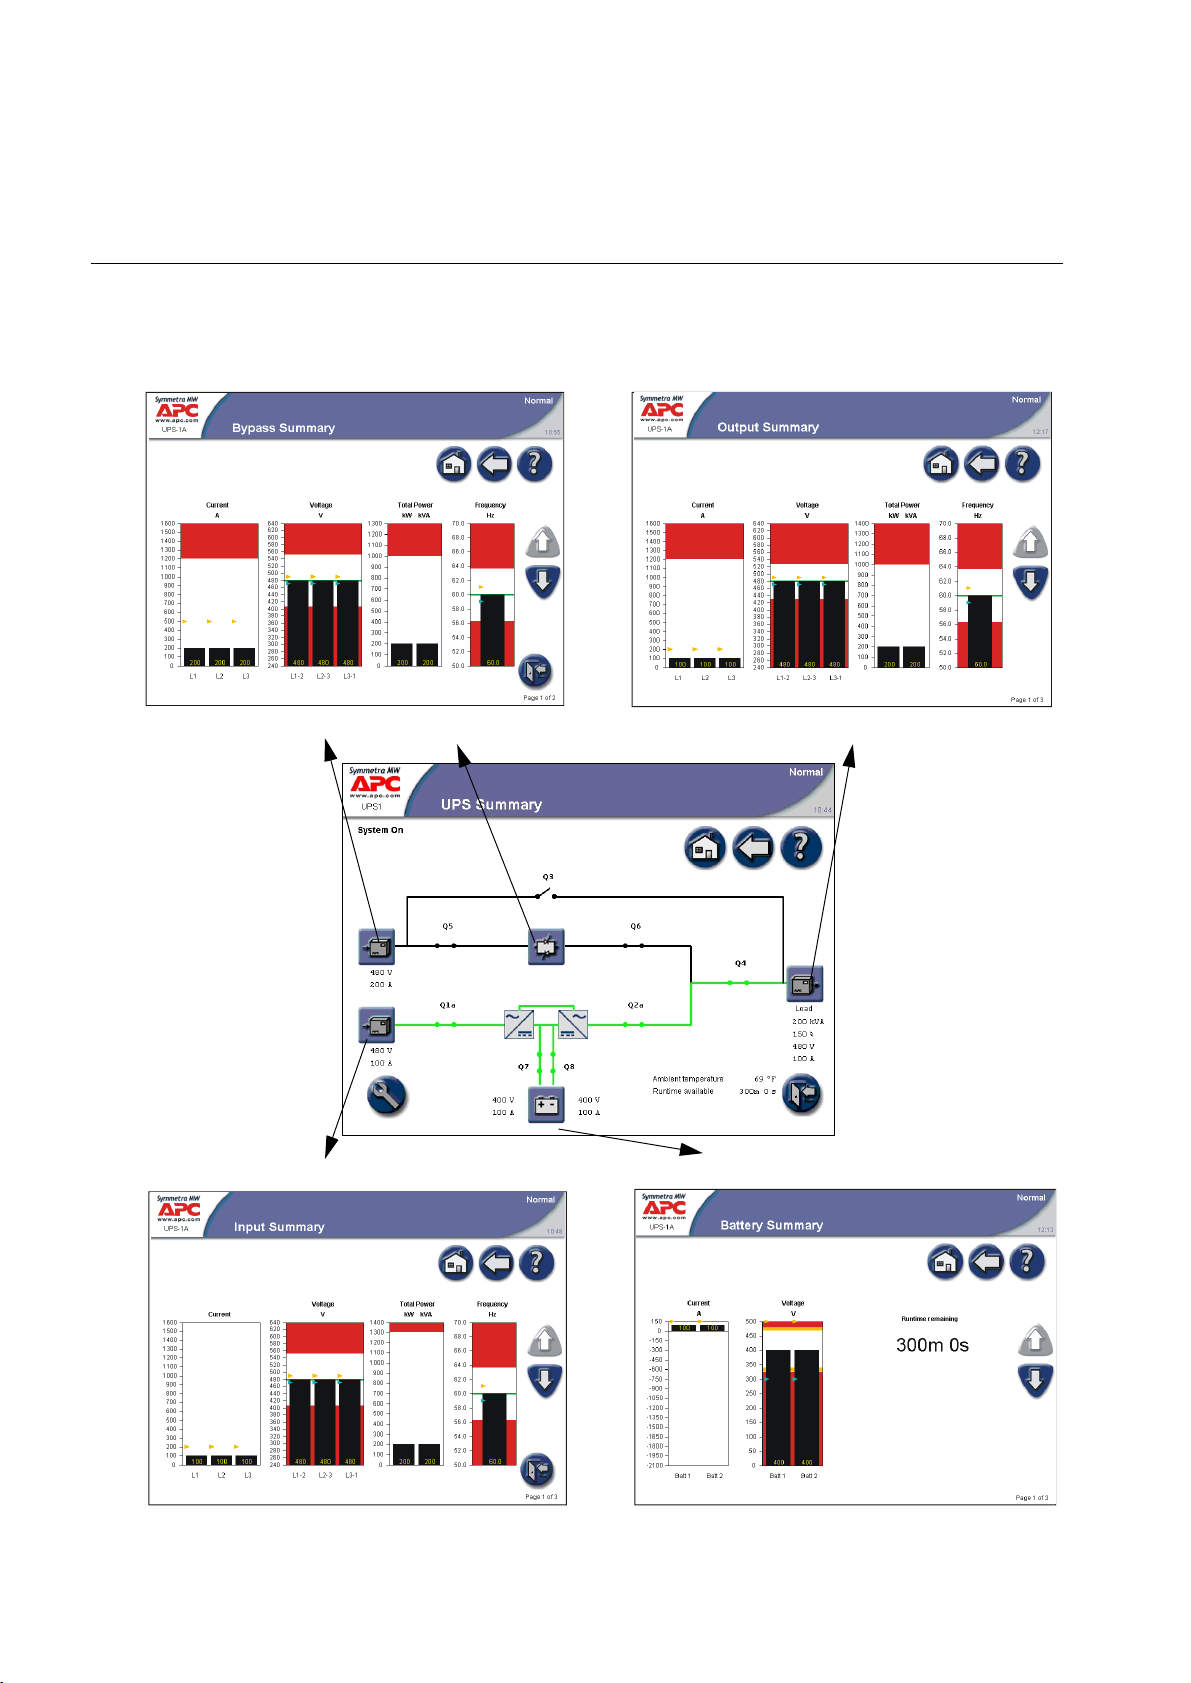
How to Access Summary Screens from the UPS
The UPS Summary screen provides you with an overview of the UPS system and circuit breakers. It
shows the system status and the power flow through the system and gives access to the system’s summary
screens and the Operation screen.
Access Bypass Summary screens Access Output Summary screens
Access Input Summary screens Access Battery Summary screens
4 Symmetra MW with External Bypass Static Switch Operation Manual - 990-1377D-001
Page 9
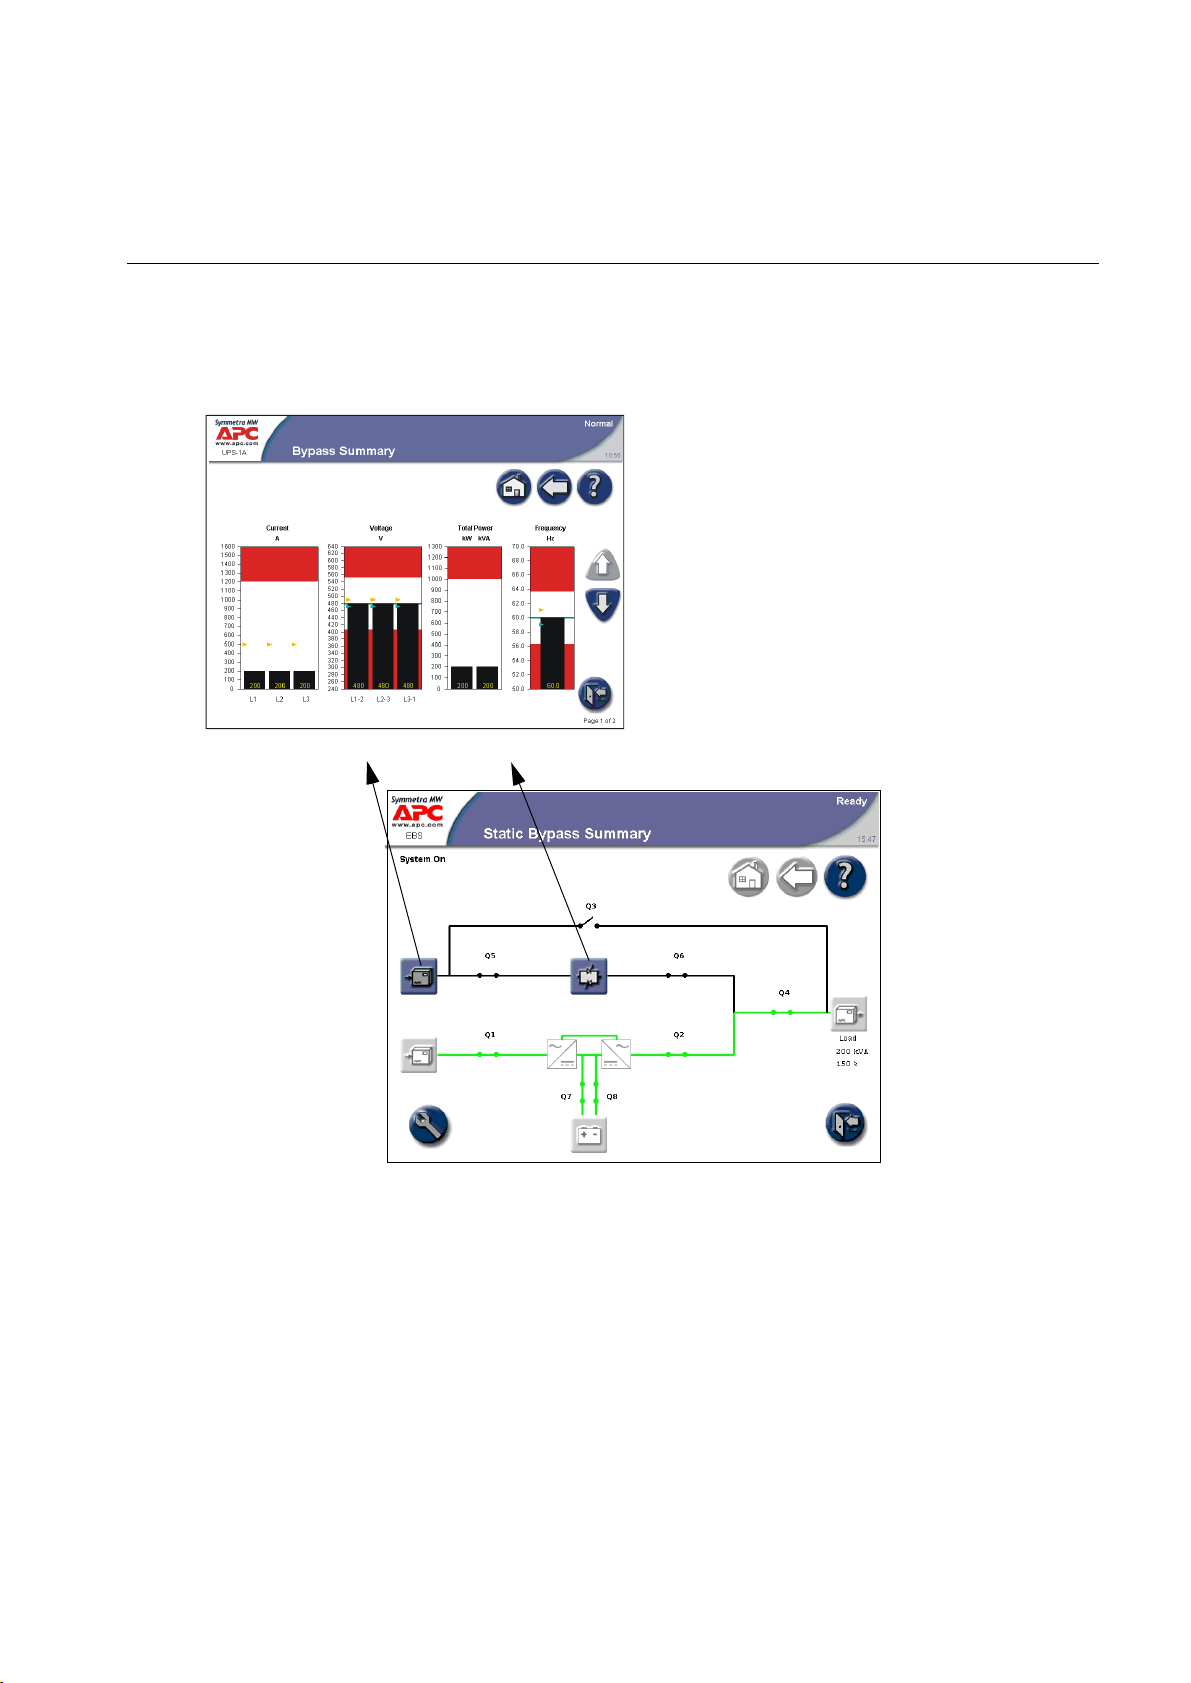
How to Access Summary Screens from the External Bypass Static Switch
The Static Bypass Summary screen provides you with an overview of the UPS system and circuit
breakers. It shows the system status and the power flow through the system and gives access to the
system’s Bypass Summary screens and the Operation screen. The Operation screen on the External
Bypass Static Switch has limited functionality compared to the Operation screen on the UPS.
Access Bypass Summary screens
Symmetra MW with External Bypass Static Switch Operation Manual - 990-1377D-001 5
Page 10
How to Access the APC Symmetra MW Remote Display
The read-only display screens can be accessed via an Internet Browser by typing the IP address of the
Symmetra MW display into the browser’s address field. Configuration of the Symmetra MW or the
display through the remote display is not supported.
The remote display feature requires Microsoft Internet Explorer 6 SP1 or greater. For best results we
recommend that the Sun JVM version 1.4.2_05 or greater is installed, which is available from the Sun’s
website.
The Netscape browser is not supported.
Note: Operation/configuration must be done at the UPS.
Note: The event log screen can be accessed through the Operation screen. Only the 50 most
recent events in the Event Log screen can be downloaded.
Note: Network settings must be configured before the remote display feature can be used.
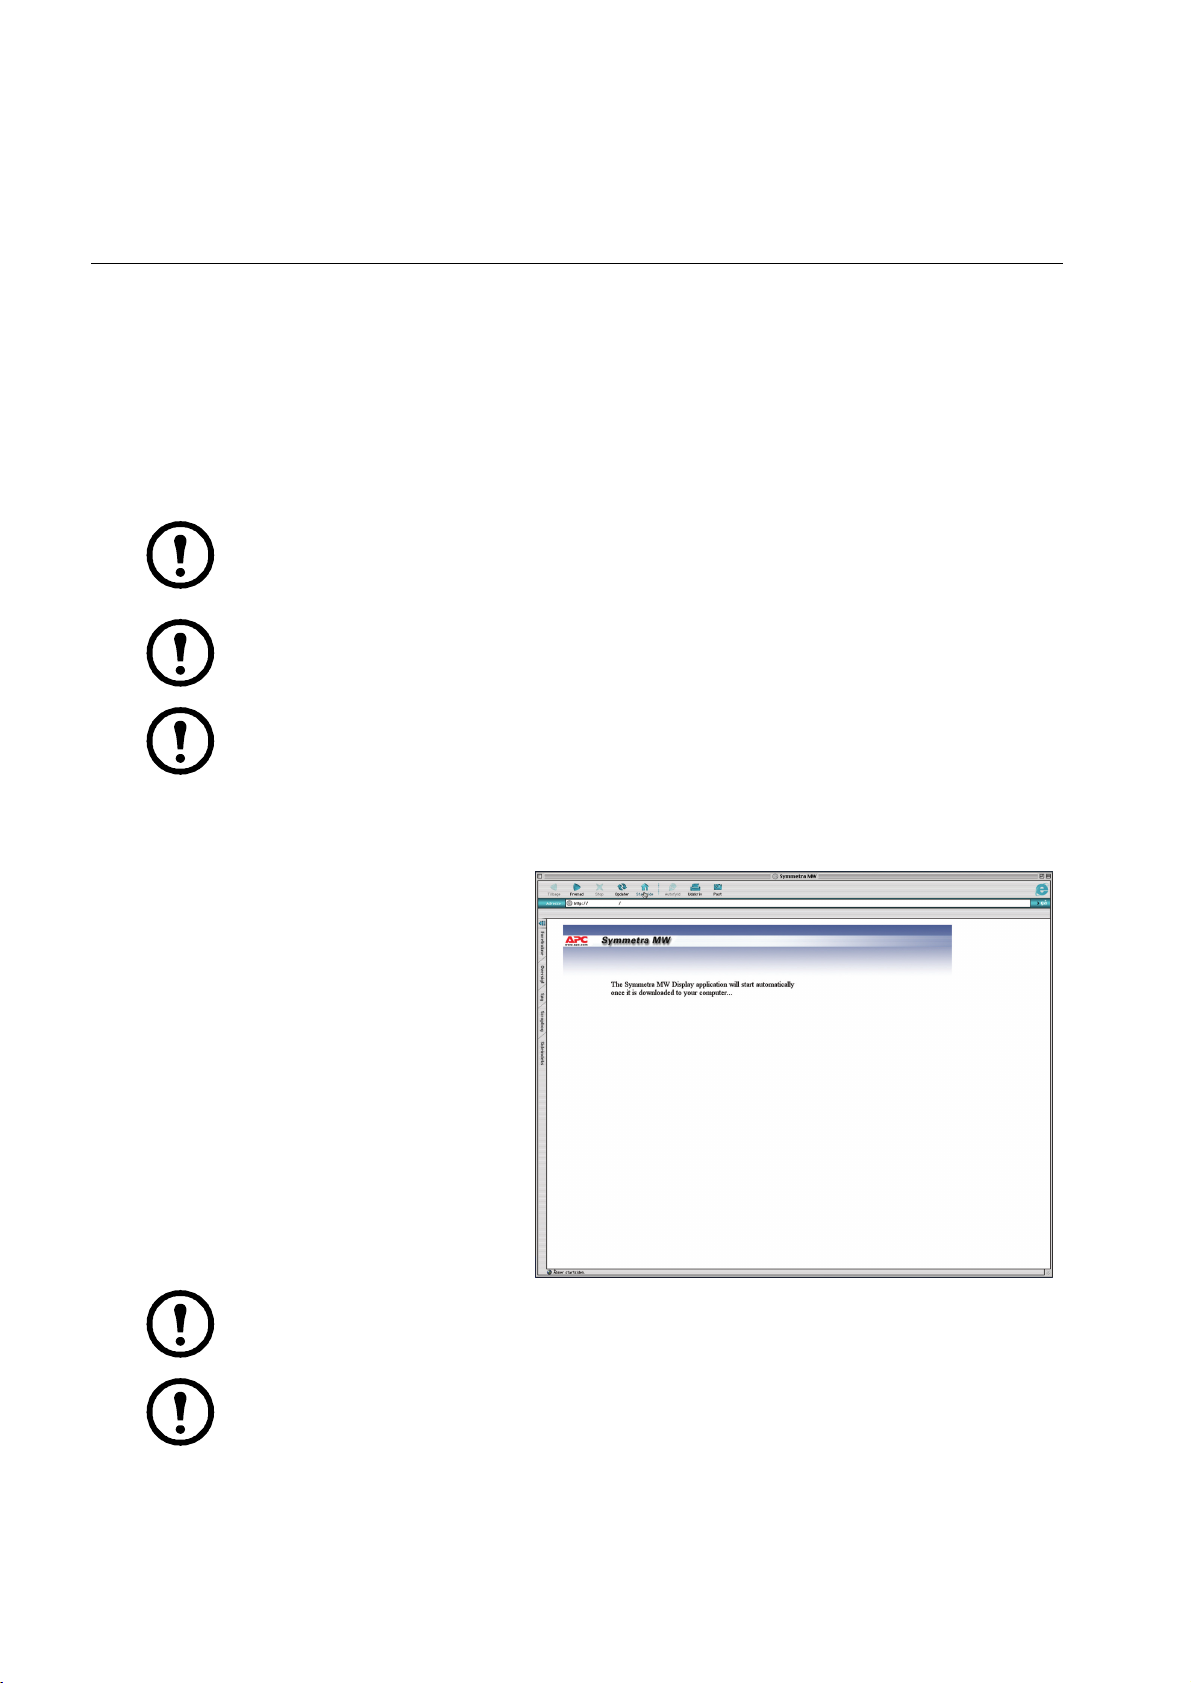
How to start a web-based remote session
• Start the web-based remote session
by entering the IP address of the
APC Symmetra MW UPS in the
web browser address field. After a
few seconds, a new window will
open and display the shown screen.
• After a few seconds, a new window
will open and display shown screen.
• Use the mouse to touch the buttons
to see the other screens.
• Close the window or the web
browser to end the remote session.
Note: For security reasons, there is a time limit of 5 minutes for a remote session. The
connection will be disconnected after 5 minutes and reconnection is required.
Note: Only one remote session at a time is allowed.
XXX.XXX.XXX.XX
6 Symmetra MW with External Bypass Static Switch Operation Manual - 990-1377D-001
Page 11

Operation
Operation Modes
Normal operation
During online operation, the critical load is supported by the inverters. While the UPS system is operating
in this mode, a single-line diagram will appear on the screen. The green line indicates the power flow
from the utility, through the UPS units, and then to the load.
External Bypass SSW
Delta Inverter
Battery operation
During battery operation, the critical load is supported by the inverters. The main inverter is supplied by
battery power, ensuring uninterrupted support to the load. While the UPS system is operating in battery
operation, a single-line diagram will appear on the screen. The green line indicates the power flow from
the batteries, through the main inverters, and then to the load.
External Bypass SSW
Main Inverter
Battery
Delta Inverter
Symmetra MW with External Bypass Static Switch Operation Manual - 990-1377D-001 7
Main Inverter
Battery
Page 12

Operation: Operation Modes
Static bypass operation
During static bypass operation, the critical load is supplied directly by utility power. A single-line
diagram will appear on the screen with an orange line indicating the power flow through the External
Bypass Static Switch (SSW) to the load.
External Bypass SSW
Delta Inverter
Main Inverter
Battery
Manual bypass operation
During maintenance bypass operation, the critical load is supplied directly by utility power. Maintenance
bypass allows the UPS units to be isolated for maintenance purposes. In maintenance bypass there is no
backup from the UPS system to the load. While the UPS system is operating in this mode, a single-line
diagram will appear on the screen with an orange line indicating the power flow from the utility to the
load through the Q3 breaker.
External Bypass SSW
Delta Inverter
8 Symmetra MW with External Bypass Static Switch Operation Manual - 990-1377D-001
Main Inverter
Battery
Page 13

Operation Procedures
How to access screens protected by the user-password
When prompted for the user-password, press
the password field to access the keyboard.
How to start up the system from manual bypass operation
Note: The UPS Startup screen on this page shows an example of a generic start-up sequence.
Follow and complete the start-up sequence as shown on your UPS Startup screen.
Close the Q5 and Q1 breakers in the external maintenance bypass panel to power up the internal
power supply. Wait for the display to become active.
Press the Operation button on the UPS Summary
screen.
Type in the user password and press Enter.
Note: On installation, the user-password is
set to apc.
Symmetra MW with External Bypass Static Switch Operation Manual - 990-1377D-001 9
Page 14

Operation: Operation Procedures
Press the Startup button. Press inside the password
field and type in the user password using the
keyboard on the screen. Complete with Enter.
The UPS Startup screen appears with the Charge DC
Capacitors step highlighted. Follow the procedure
on the screen which is specific to your system.
Verify that the status in the upper right corner has
changed to Normal.
How to shut down the system from normal to manual bypass operation
Note: The UPS Shutdown screen on this page shows an example of a generic shutdown
sequence. Follow and complete the shutdown sequence as shown on your UPS Shutdown
screen.
Press the Operation button on the UPS Summary
screen.
10 Symmetra MW with External Bypass Static Switch Operation Manual - 990-1377D-001
Page 15

Press the Shutdown button. Press inside the
password field and type in the user password using
the keyboard on the screen. Complete with Enter.
Follow the procedure on the screen which is specific
to your system.
Operation: Operation Procedures
How to transfer from normal to static bypass operation
Press the Operation button on the UPS Summary
screen.
Press the Online -> Static Bypass button. Press
inside the password field and type in the user
password using the keyboard on the screen.
Complete with Enter.
Symmetra MW with External Bypass Static Switch Operation Manual - 990-1377D-001 11
Page 16

Operation: Operation Procedures
Press Initiate Transfer.
Verify that the status in the upper right corner of the
screen has changed to Static bypass.
How to transfer from static bypass to normal operation
Press the Operation button on the UPS Summary
screen.
Press the Static Bypass -> Online button. Press
inside the password field and type in the user
password using the keyboard on the screen.
Complete with Enter.
Press Initiate Transfer.
Verify that the status in the upper right corner of the
screen has changed to Normal.
12 Symmetra MW with External Bypass Static Switch Operation Manual - 990-1377D-001
Page 17

Configuration
How to Configure the System
The UPS is configured from the password-protected user configuration area of the display.
Note: On installation, the user password is set to apc.
Press the Operation button in the bottom
left corner to access the Operation screen.
Select the parameter that you wish to set.
Press the User Configuration button to
access the User Configuration screen.
Symmetra MW with External Bypass Static Switch Operation Manual - 990-1377D-001 13
Page 18

Configuration: How to Configure the System
How to change the password
Press the Password Settings button on the User
Configuration screen to access the Password
Settings screen.
Change the User Password:
–Press the Enter current password field and
type the current password by using the
keyboard in the screen. Complete with
ENTER.
–Press the Enter new password field and type
the new password by using the keyboard on the
screen. Complete with ENTER.
–Press the Re-enter new password field and re-
type the new password. Complete with
ENTER.
Press Apply Changes to complete the password change procedure.
How to configure the Touch-Screen settings screen
Press the Touch-Screen Settings button on the
User Configuration screen to access the Touch-
Screen Settings screen.
14 Symmetra MW with External Bypass Static Switch Operation Manual - 990-1377D-001
Page 19

Change the touch-screen settings:
– Brightness: Place the finger on the indicator
and slide it left or right to the desired setting.
– Contrast: Place the finger on the indicator and
slide it left or right to the desired setting.
– Backlight mode: Select “Always on” or “Off
after inactivity”.
– Backlight timeout (minutes): Select the time
limit for turning off the screen backlight.
– Recalibrate Display: Press this button to
initiate the calibration of the screen.
Note: If the backlight mode is set to “Always on” this will reduce the lifetime of the display.
Note: If a display reboot is required, it can be achieved by recalibrating the display.
Configuration: How to Configure the System
How to configure the Modbus Settings screen
The Modbus Settings screen allows monitoring of the UPS by a Building Management System (BMS).
Press the Modbus Settings button on the User
Configuration screen to access the Modbus
Settings screen.
Change the modbus settings:
– BMS modbus RTU address: The modbus
address of the UPS device.
– Baud rate: Select 9600, 19200, 38400, 57600,
or 115200.
– Parity: Select None, Odd, or Even.
Press Apply Changes to complete the changes.
Symmetra MW with External Bypass Static Switch Operation Manual - 990-1377D-001 15
Page 20

Configuration: How to Configure the System
How to configure the Regional Settings screen
Press the Regional Settings button on the User
Configuration screen to access the Regional
Settings screen.
Change the regional settings:
– Temperature unit: Select Celsius in 400 V
regions and Fahrenheit in 480 V regions.
– Date format: Select the preferred date format.
Press Apply Changes to complete the changes.
How to configure the Network Configuration screens
All network settings information must be provided before any network functions can be used.
Press the Network Configuration button on the
User Configuration screen to access the Network
Configuration screens.
16 Symmetra MW with External Bypass Static Switch Operation Manual - 990-1377D-001
Page 21

Configuration: How to Configure the System
Configure the Network Settings screen:
– Enable network: Use this checkbox to connect
or disconnect the UPS from the network.
– IP Settings
• IP address: The static IP address.
• Subnet mask: The subnet mask for the
network segment containing the UPS.
• Gateway: The network gateway for the
segment containing the UPS.
– DNS Settings
• Primary DNS server: The IP address of the DNS server to be used by the UPS (optional).
• Secondary DNS server: The IP address of a backup DNS server if the primary server is not
available (optional).
– Host Name Settings
• Host name: The network host name for the system. This uniquely identifies the system on the
network. Standard letters (a-z and A-Z), digits (1-9), and hyphen (-) can be used.
• Domain name: The DNS network domain containing the UPS. Standard letters (a-z and A-Z),
digits (1-9), and hyphen (-) can be used.
– SMTP Settings
• From address: The source address used when sending e-mails.
• SMTP server: The SMTP server responsible for sending e-mails.
–Press Apply Changes to complete the changes and select arrow down to go to the next Network
Configuration screen.
Note: The display will have to be rebooted in order for the changes to the domain name or
DNS servers to take effect.
Configure the E-mail Settings screen:
– Enable E-mail: Select to enable the e-mail
notifications.
– To add a new e-mail recipient, touch the Add
New button, type in the e-mail address and
specify the minimum severity of alarm. All
entries will appear in red until Apply Changes
is pressed.
– To edit or delete an e-mail recipient, select the
recipient from the recipient list, and then
choose to either update or delete it.
Symmetra MW with External Bypass Static Switch Operation Manual - 990-1377D-001 17
Page 22

Configuration: How to Configure the System
– Apply Changes: Press this button after all changes have been made. Entries will appear in red
until this button is touched.
– Send Test E-mail: Pressing this button sends a test e-mail to all configured e-mail recipients. This
button can be used to validate the e-mail settings.
– Press arrow down to go to the next Network Configuration screen.
Configure the SNMP Settings screen. The UPS
can be set to send SNMP traps if UPS alarm
conditions occur, and when the conditions return
to normal afterwards. Each trap contains a
description of the alarm condition. Up to 10 trap
receivers can be entered. The trap receiver must
have the APC PowerNet MIB (version 3.6.1 or
later). The latest version of the PowerNet MIB
can be downloaded from www.apc.com.
– Enable SNMP: Enable the SNMP functionality
by selecting this checkbox.
– To add a new trap receiver, press the Add New button, type in the address and specify the
minimum severity of alarm. All entries will appear in red until Apply Changes is pressed.
– To edit or delete a trap receiver, select the recipient from the recipient list, and then choose to
either update or delete them.
– Apply Changes: Press this button after all changes have been made. Entries will appear in red
until this button has been pressed.
– Send Test SNMP: Pressing this button sends a test trap to all configured trap receivers. This
button can be used to validate SNMP settings.
– Press arrow down to go to the next Network Configuration screen.
Configure the Remote Monitoring Service
Settings screen. The APC Remote Monitoring
Service (RMS) is an APC professional service
which securely monitors the customer’s Network-
Critical Physical Infrastructure (NCPI) from a
remote 24x7 operation center, responding to
events according to a pre-defined customer
escalation procedure. Go to http://rms.apc.com to
learn more about this service.
The APC Remote Monitoring Service uses the
HTTP protocol to post information to its
database. If a proxy server is used for Internet connection, then the required proxy server port
settings must be specified (a proxy server acts as an agent between a workstation user or other
networked device and the Internet to regulate security, administrative control and caching).
18 Symmetra MW with External Bypass Static Switch Operation Manual - 990-1377D-001
Page 23

Configuration: How to Configure the System
Note: The APC Remote Monitoring Service (RMS) will not be activated until the RMS Team
has been contacted. The contact details can be found at http://rms.apc.com.
– Enable APC RMS: Select this checkbox to start using the service. Once selected, information
about your UPS will periodically be sent to APC’s Remote Monitoring Service.
– Use Proxy: Select this checkbox if the Internet connection method uses a HTTP proxy server to
connect to the Internet.
– Proxy server address: Enter the fully qualified IP-address or fully qualified domain name of the
proxy server. If you do not know the server address or port number, contact your network
administrator.
– Proxy server port: Enter the port number of the proxy server.
– Use authentication: Select this checkbox if the proxy server requires a login. Then specify a
Proxy server login (user name) and a Proxy server password.
–Press Apply Changes to complete the changes and select arrow down to go to the next Network
Configuration screen.
Configure the APC ISX Manager Settings screen:
– Enable ISX manager discovery: Press the field
to enable the APC ISX Manager to discover
your Symmetra MW.
– Community name: Specify a valid community
name. This is automatically set to public.
– System location (optional).
– System contact (optional).
–Press Apply Changes to complete the
changes.
How to configure the Display Settings
Press the Display Settings button on the User
Configuration screen to access the Display
Settings screen.
Symmetra MW with External Bypass Static Switch Operation Manual - 990-1377D-001 19
Page 24

Configuration: How to Configure the System
Change the display settings:
– Enable APC Q breaker prefix: Use this
checkbox to enable or disable the APC Q
breaker prefix.
– Enable audible alarms: Use this checkbox to
enable or disable the audible alarms.
How to configure the Battery Test Settings screen
Press the Battery Test Settings button on the
User Configuration screen to access the Display
Settings screen.
Change the battery test settings. From the Battery
Test Settings screen, two different battery tests
can be performed and the battery monitor can be
reset.
– Battery monitor test: Setting this value to True
results in an automatic battery monitor test
occurring dependant in the battery test options
configured by the service engineer.
– Battery capacity test: Setting this value to True
results in the batteries being discharged until a
Battery Low Voltage Level is reached. This
test can only be performed manually. The test is used to cycle the batteries in order to calibrate
the backup time with the current load and battery modules installed.
– Battery monitor reset: In the event of a weak battery or another battery problem, use this button
to reset the battery monitor.
20 Symmetra MW with External Bypass Static Switch Operation Manual - 990-1377D-001
Page 25

Maintenance
Predictive Maintenance Screens
The Predictive Maintenance screens display the stress status and the Expected Remaining Lifetime (ERL)
of the critical components of the Symmetra MW UPS system.
Warning: Only personnel trained in the construction and operation of the equipment,
and the electrical and mechanical hazards involved, may install or remove system
components.
How to access Predictive Maintenance screens
Press the Operation button in the bottom
left corner to access the Operation screen.
Inverter DC Capacitors screen
The Inverter DC Capacitor screen displays the actual status and Expected Remaining Lifetime (ERL) of
the Inverter DC Capacitors. You can sort the data by pressing any of the column labels.
• Stress Status: Shows the actual status of the
Inverter DC Capacitors. The possible values
are:
– Normal (displayed in green)
– Stressed (displayed in yellow)
– Major Stress (displayed in red)
• ERL (months): Predicts the expected
remaining lifetime of the particular
component.
Press the Predictive Maintenance button to
access the Predictive Maintenance screens.
Symmetra MW with External Bypass Static Switch Operation Manual - 990-1377D-001 21
Page 26

Maintenance: Predictive Maintenance Screens
Inverter AC Capacitors screen
The Inverter AC Capacitor screen displays the actual status and Expected Remaining Lifetime (ERL) of
the Inverter AC Capacitors. You can sort the data by pressing any of the column labels.
• Stress Status: Shows the actual status of the
Inverter AC Capacitors. The possible values
are:
– Normal (displayed in green)
– Stressed (displayed in yellow)
– Major Stress (displayed in red)
• ERL (months): Predicts the expected
remaining lifetime of the particular
component.
Top Fans screen
The Top Fans screen displays the actual status and Expected Remaining Lifetime (ERL) of the Top Fans.
You can sort the data by touching any of the column labels.
• Stress Status: Shows the actual status of the
Top Fans. The possible values are:
– Normal (displayed in green)
– Stressed (displayed in yellow)
– Major Stress (displayed in red)
• ERL (months): Predicts the expected
remaining lifetime of the particular
component.
22 Symmetra MW with External Bypass Static Switch Operation Manual - 990-1377D-001
Page 27

Maintenance: Predictive Maintenance Screens
Inverter Fans screen
The Inverter Fans screen displays the actual status and Expected Remaining Lifetime (ERL) of the
Inverter Fans. You can sort the data by pressing any of the column labels.
• Stress Status: Shows the actual status of the
Inverter Fans. The possible values are:
– Normal (displayed in green)
– Stressed (displayed in yellow)
– Major Stress (displayed in red)
• ERL (months): Predicts the expected
remaining lifetime of the particular
component.
Main Static Switch Fans screen
The Main Static Switch Fans screen displays the actual status and Expected Remaining Lifetime (ERL)
of the Main Static Switch Fans. You can sort the data by pressing any of the column labels.
• Stress Status: Shows the actual status of the
Main Static Switch Fans. The possible values
are:
– Normal (displayed in green)
– Stressed (displayed in yellow)
– Major Stress (displayed in red)
• ERL (months): Predicts the expected
remaining lifetime of the particular
component.
Symmetra MW with External Bypass Static Switch Operation Manual - 990-1377D-001 23
Page 28

How to Change the Air Filters
Check the air filters at regular intervals (every three months under normal working conditions) for
accumulated dust on the surface facing the finishing panels. Change all filters at the same time.
Pull the lower part of the top finishing panel off the UPS.
Lift the finishing panel off the dead front panel and remove.
Follow this procedure until all panels in one column have been removed. Use the same procedure
for the next column of panels until all panels have been removed from the UPS system.
Note: Note the orientation of the air filter.
Remove the air filters and install new filters.
Re-install the finishing panels in reverse order.
24 Symmetra MW with External Bypass Static Switch Operation Manual - 990-1377D-001
Page 29

Troubleshooting
Alarm Types
The color of the top of the screen changes from blue to red when an alarm situation occurs and the alarm
symbol is shown at the top of the screen.
Alarm button
Touching the alarm button will display the Active Alarms screen showing all active
alarms, along with a methodology for addressing each alarm.Touching the alarm button
or any other display button will automatically silence the alarm.
Alarm levels
There are three different alarm levels.
Info. Informational Alarm. No immediate action required. Check the cause of the alarm at next
maintenance visit.
Warning. Warning Alarm. Example: The UPS system may have gone into bypass. The load remains
supported, but action must be taken. Call Technical Support. The area on the right side of the top screen
alternates between blue and red.
Severe. Severe Alarm. Take immediate action. Call Technical Support. The red area of the top of the
screen alternates between blue and red.
How to silence the alarm
Touch the Alarm Button or any other display button to silence the alarm.
Symmetra MW with External Bypass Static Switch Operation Manual - 990-1377D-001 25
Page 30

Troubleshooting: Alarm Types
How to view active alarms
Press the red triangular alarm symbol to
view active alarms.
Note: The Active Alarms screen includes a recommended action for resolving each problem.
Only active alarms will appear in this list.
Previous alarms are stored in the Event Log,
which contains a detailed record of the
system’s last 1024 events. Press the Event
Log button to go to the Event Log.
How to view the event log
The event log can be accessed either by pressing the Event Log button on the Active Alarms screen (see
“How to view active alarms” on page 26) or by following this procedure:
Press the Operation button in the bottom
left corner to access the Operation screen.
The Event Log screen contains a detailed record of the system’s latest 1024 events. This includes
operation mode changes, system alarms, etc.
26 Symmetra MW with External Bypass Static Switch Operation Manual - 990-1377D-001
Press the View Event Log button to access
the Event Log screen.
Page 31

Troubleshooting: Alarm Types
The Param (Parameter) column is used to associate an event with a specific component. Should there be
data relevant to a particular event, it will be displayed in the Data column e.g. if a temperature threshold
was exceeded, the actual temperature at the time the event occurred may be shown.
• Refresh: Press the Refresh button to update the
Event Log.
• Stop (only visible during update): Press this
button to stop further downloading of the event
log. This button is useful for viewing only the
most recent events.
• E-mail Event Log: Press this button to e-mail
the event log to a specific e-mail address. Type
in the e-mail address and press Send.
Note: Network settings and E-mail settings must be enabled and configured correctly before
the event log can be e-mailed.
Symmetra MW with External Bypass Static Switch Operation Manual - 990-1377D-001 27
Page 32

APC Worldwide Customer Support
Customer support for this or any other APC product is available at no charge in any of the following ways:
• Go to the APC Web site to access documents in the APC Knowledge Base and to submit customer
support requests.
– www.apc.com (Corporate Headquarters)
Connect to localized APC Web sites for specific countries, each of which provides customer support
information.
– www.apc.com/support/
Global support searching APC Knowledge Base and using e-support.
• Contact an APC Customer Support center by telephone or e-mail.
– Local, country-specific centers: go to www.apc.com/support/contact for contact information.
Contact the
information on how to obtain local customer support.
APC representative or other distributor from whom you purchased your APC product for
Entire contents copyright 2008 American Power Conversion Corporation. All rights reserved.
Reproduction in whole or in part without permission is prohibited. APC, the APC logo, and Symmetra are
trademarks of American Power Conversion Corporation. All other trademarks, product names, and
corporate names are the property of their respective owners and are used for informational purposes only.
06/2008990-1377D-001
*990-1377D-001*
 Loading...