

Page 1

Measure what you see.
temp-gard / temp-chart
Short
Instructions
ENGLISH
A member of
Additives & Instruments
Page 2

Please note the detailed operating instructions in English on CD.
BYK-Gardner GmbH
Lausitzer Strasse 8
82538 Geretsried
Germany
Tel. +49-8171-3493-0
Fax +49-8171-3493-140
www.byk.com/instruments
BYK-Gardner USA
9104 Guilford Road
Columbia · MD 21046
USA
Phone +1-301-483-6500
Fax +1-301-483-6555
www.byk.com/instruments
Page 3
A member of
Measure what you see.
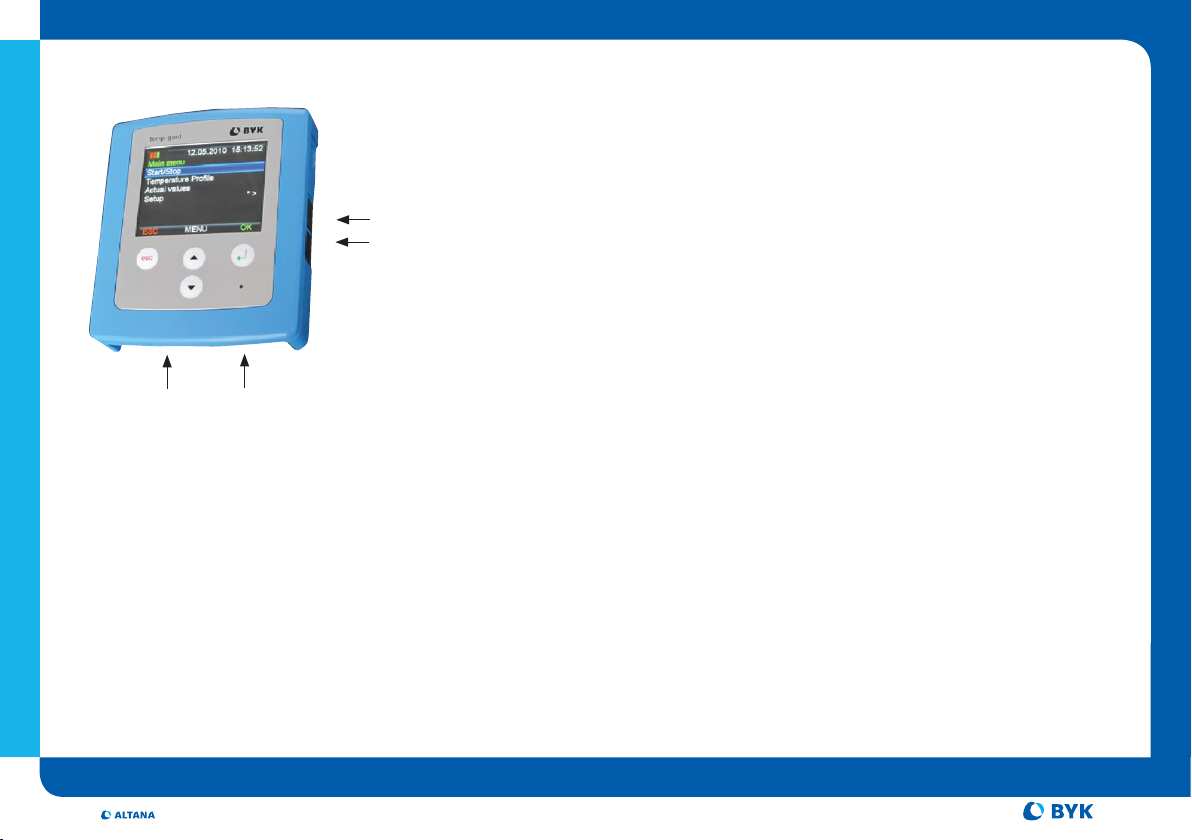
temp-gard Operation
USB Port 2
USB Port 1
Temperature Probe Connections
ENGLISH
Enter Button 8 Switch on
Select function
Start / Stop a measurement
esc Button Always takes you one level up
UP / Down Button s t Navigation
USB Port 1 Transfer via cable
USB Port 2 Transfer via USB-Stick
Main Menu
Start / Stop Start / Stop a measurement
Temperature Profile Display of temperature curve
Actual values Displays the actual temperature data of the
connected probes
Setup Definition of measurement and instrument
parameters
Setup Menu
Measurement Parameters Set number of probes
Set measurement time
Set trigger for measurement start
Set measurement interval
Define temperature units (°C / °F)
Instrument Select display time
Enter time / date
Select language
Info (Serial No. – Version)
Quick Start with temp-gard logger
• Define the measurement and instrument parameters in the
“Setup menu”.
• Go back to Main Menu and start measurement with Start/Stop
• LED will blink green g logger is active. Temperature data will be
saved based on trigger and interval settings!
Note:
When the temp-gard logger is switched on the status of the setup settings
will be displayed.
1
Additives & Instruments
269 020 584 E 0806
Page 4
Measure what you see.
A member of
Setup via temp-chart Software
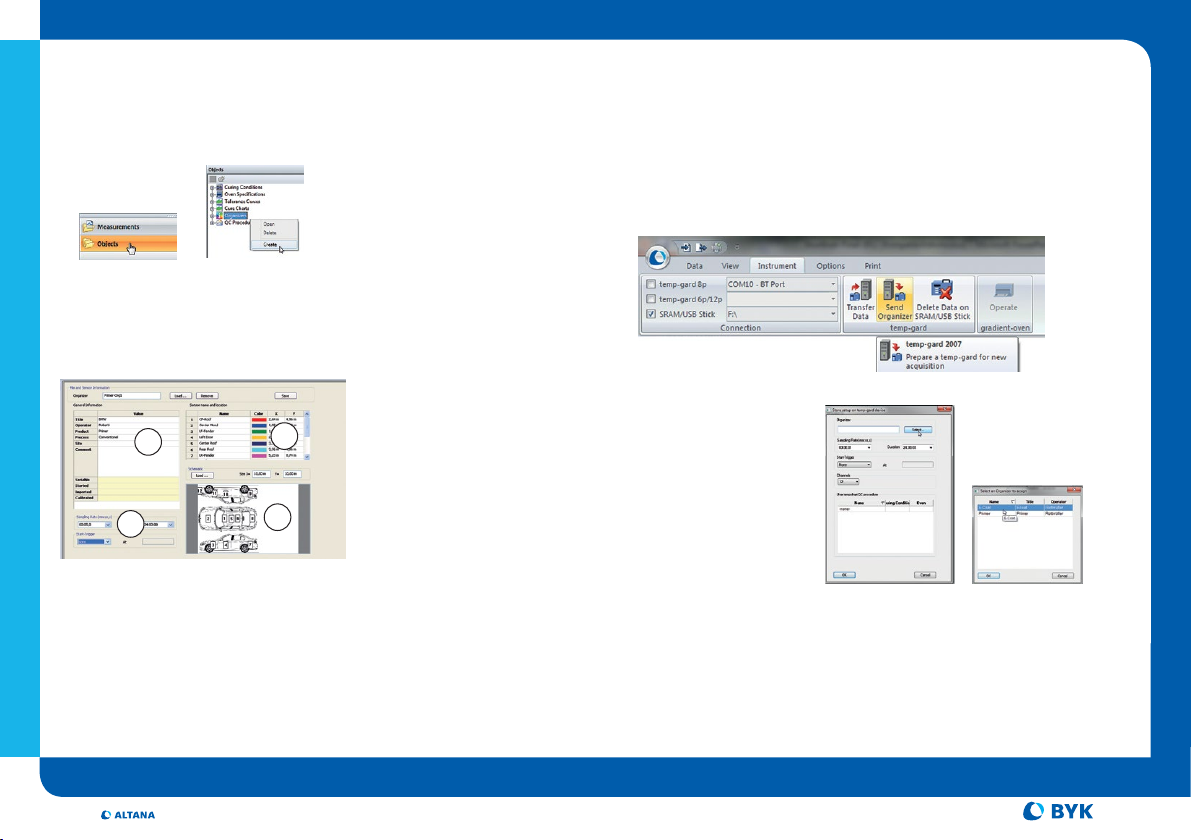
How to create an Organizer?
…define the “Setup parameters” and names of the probe position
• Select Objects
• Select Organizer
Right mouse click to create a new organizer
g A blank organizer template will appear
g Name organizer by pressing “Save As” button
ENGLISH
1
2
How to transfer an Organizer to the temp-gard logger?
• Connect USB-Stick to computer (or transfer via cable)
• Select Instrument Menu
• Select SRAM/USB Stick
• Select Drive
• Select Send Organizer
• Select Organizer
g and Confirm “OK”
3
1: General Information to enter customer name, location, comments
2: Sensor names
3: Measurement parameters: sampling rate, trigger duration
4: Load Schematic: bmp or jpg-file sensor locations are shown on the
schematic by dragging it from the upper left
4
• Select Organizer
g Transfer of organizer to
USB-Stick is done after selecting OK
• Connect USB-Stick to temp-gard logger
• USB-Stick will be detected automatically
• Press OK to transfer the organizer to the temp-gard logger
2
Additives & Instruments
Page 5
A member of
Measure what you see.
How to transfer data to temp-chart?
• Switch on the temp-gard logger
• Connect USB-Stick to temp-gard logger
• Data will be automatically saved on the USB-Stick
1. Empty USB-Stick
gMeasurement data is saved on USB-Stick and remain on logger
• Select file to be transferred g Organizer name will be offered as
file name (changeable)
2. USB-Stick with Organizer Files
g The selection menu “Configuration Files” will appear
−No configuration g organizer & measurement data remain in
−Organizer xxx g measurement data is saved on USB-Stick
• Remove stick from logger and connect to PC
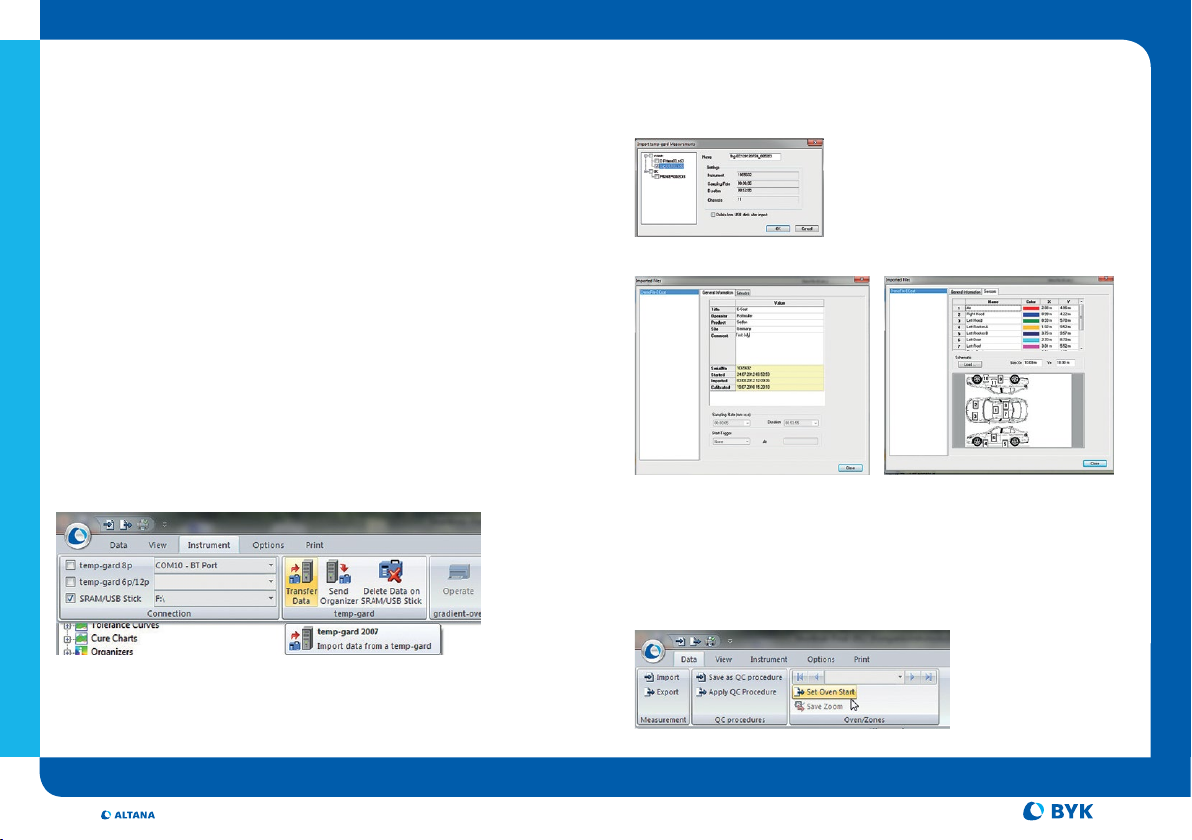
• Select menu “Instrument” in temp-chart
ENGLISH
• Select SRAM/USB Stick
• Select “Transfer Data”
logger, data is saved on USB-Stick
organizer & data are deleted in logger g new organizer is
transferred to logger
Confirm or Modify “General Information” and Sensors
• Close g Measuring Curve will be displayed
How to set Oven Start?
• Data Menu
g Set Oven Start
A vertical line appears which can be fixed on the real start point.
3
Additives & Instruments
269 020 584 E 0806
Page 6
A member of
Measure what you see.
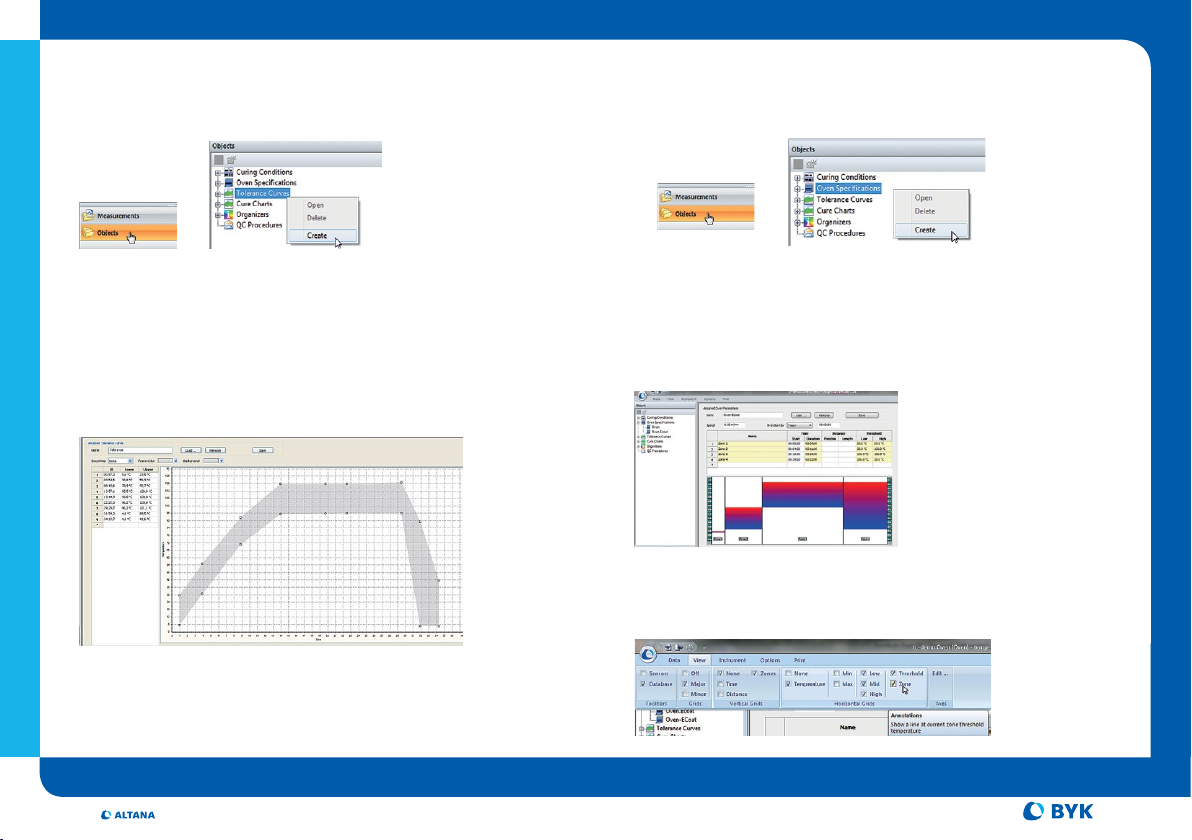
How to Set a Tolerance Curve?
• Select Objects
• Select Tolerance Curves
Right mouse click to create new tolerance curve
g A blank tolerance curve template will appear
g Name tolerance curve by pressing “Save As” button
g Enter tolerance settings
ENGLISH
How to Set Oven Specifications?
• Select Objects
• Select Oven Specifications
Right mouse click to create new oven specifications
g A blank oven specifications template will appear
g Name oven specifications by pressing “Save As” button
g Enter the oven specifications
• Save
The set oven specifications will be displayed on the graph, if they are
selected in View menu
• Save
4
Additives & Instruments
269 020 584 E 0806
Page 7
Measure what you see.
A member of
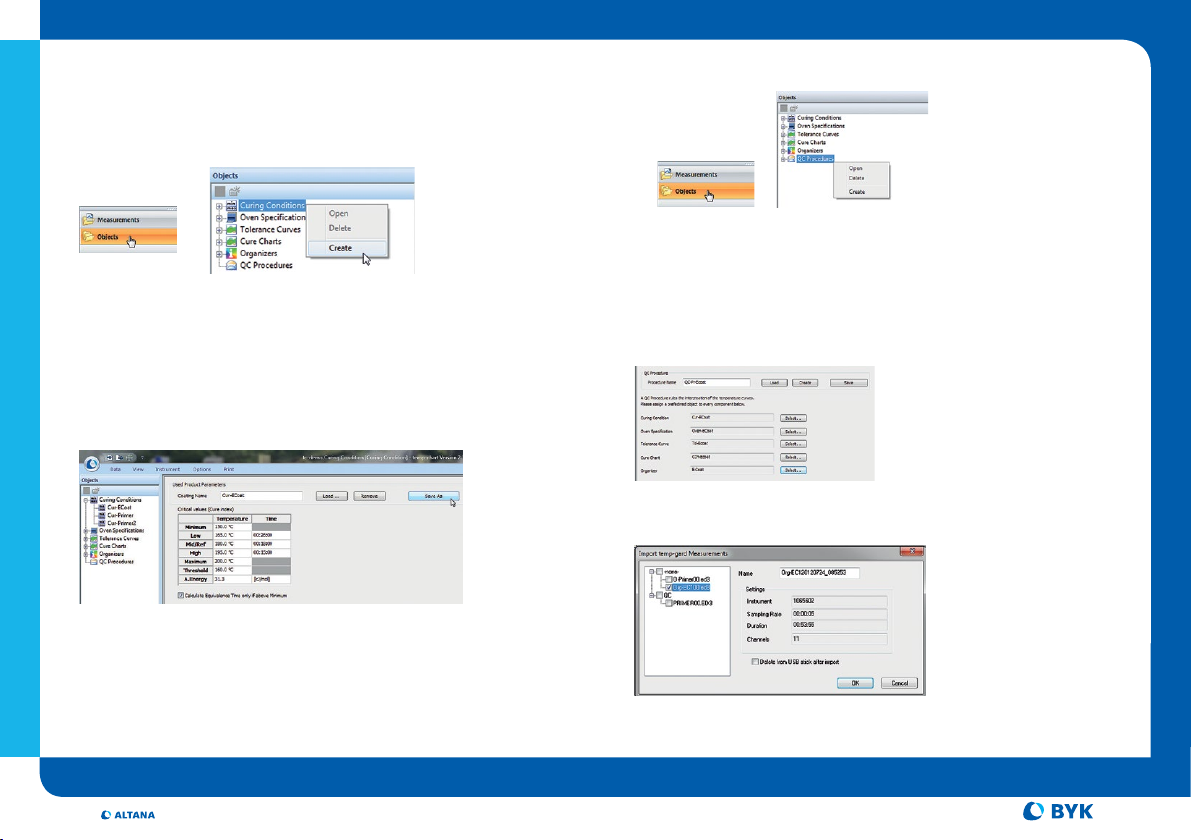
How to Set Curing Conditions?
The paint makers recommended temperature/time conditions will be
compared to the actual temperature/time.
• Select Objects
• Select Curing Conditions
Right mouse click to create new curing conditions
g Empty curing conditions template will appear
g Name curing conditions by pressing “Save As” button
g Enter the recommended curing conditions
ENGLISH
• Save
Critical Values and Cure Index will be calculated based on these
curing conditions
How to set a QC-Procedure?
• Select Objects
• Select QC-Procedure
Right mouse click to create new QC-Procedure
g Empty QC procedure template will appear
g Name QC-Procedure by pressing “Save As” button
g Select the objects which should be grouped in the QC-Procedure
• QC-Procedure allocates “Curing Conditions”, “Oven Settings” and
“Tolerance curve” to a measurement curve.
5
Additives & Instruments
Page 8
Measure what you see.
A member of
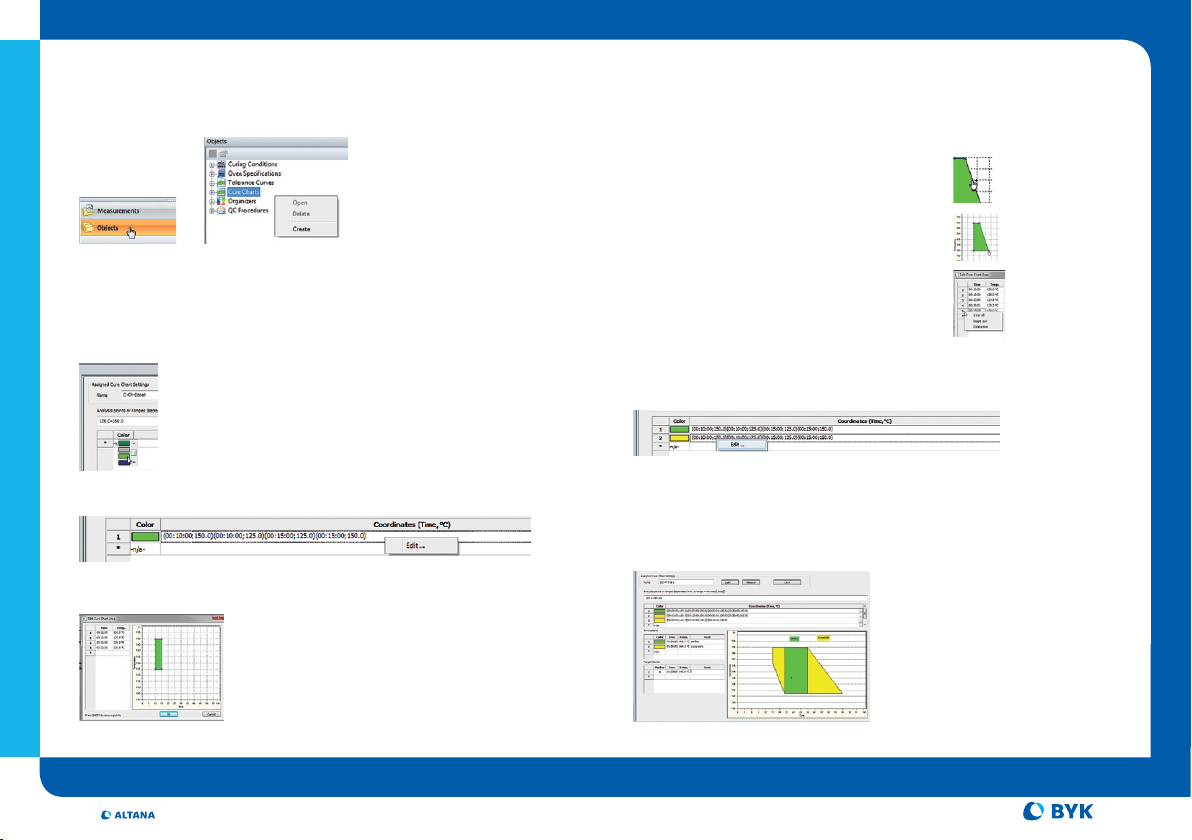
How to create a Cure Chart?
• Select Objects
• Select Cure Chart
• There are different possibilities to edit the area
g Typing into the table duration time & temperature
g Grabbing the box at the edges
• Right mouse click to create a new cure chart
g Empty Cure Chart template will appear
g Name Cure Chart by pressing “Save As” button
g Select a color e.g. green for the zone “perfect”
ENGLISH
• Right mouse click into the row for editingcuring conditions
g The “Edit Cure Chart Area” Window will appear
g Add an additional corner mark
g Delete or insert a row
by right mouse click into the 1st column
• Additional Zones will be created by selecting another color and
defining coordinates again.
• Cure chart is complete when
g All coordinates are listed
g Analysis temperatures and steps are filled in the related row
g Annotations and Target Points can be defined
6
Additives & Instruments
Page 9
Measure what you see.
A member of
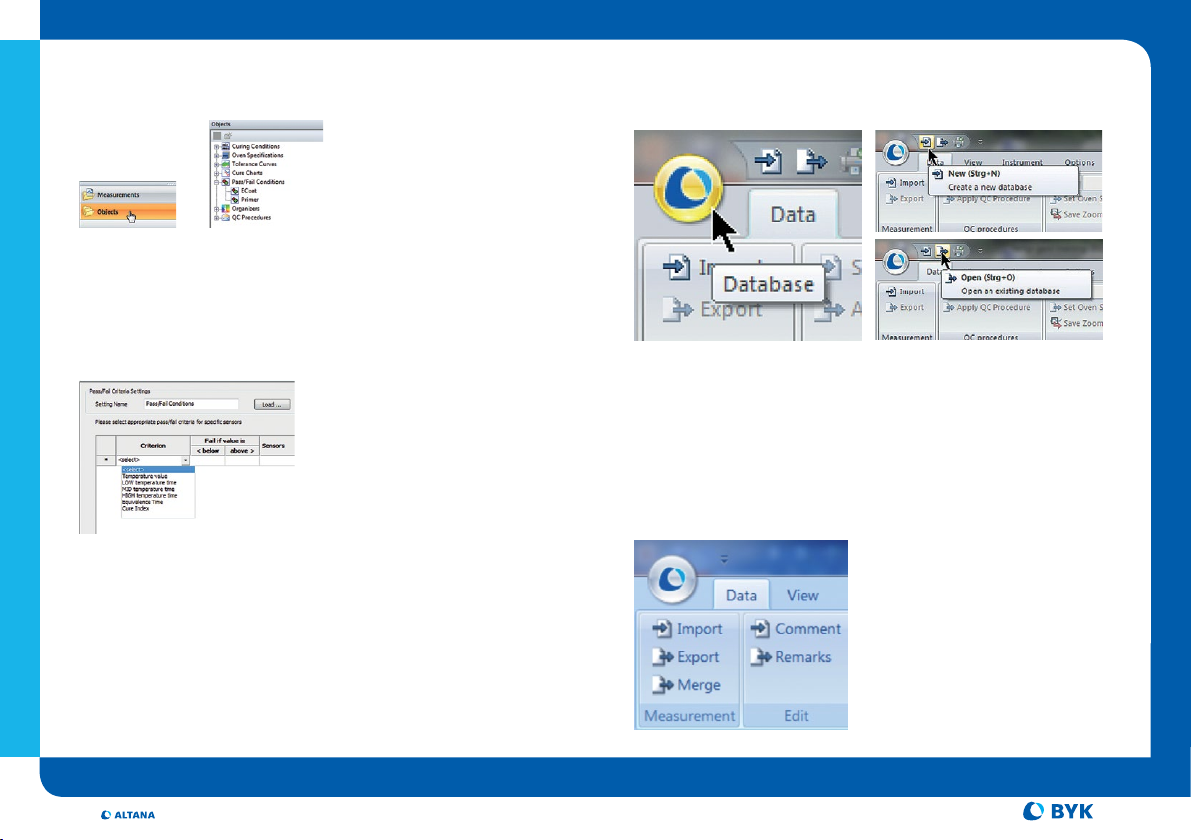
How to set Pass / Fail Conditions?
• Select Objects
• Select Pass Fail
• Right mouse click to create Pass / Fail Conditions
g Empty Pass / Fail template will appear
g Name Pass / Fail by pressing “Save As” button
g Select a Criterion
ENGLISH
g Type in Fail Values
Pass / Fail Results are shown as:
• P/F dots in database listing
• RED marked values in analysis tables
• Pass / Fail Result table
Database Handling
• There are different ways to create or change the database
Edit Functions
• Menu Data
g Edit tab
g Comment, allows to put in comments after data transfer. These
comments will be displayed in the comment field of the printout
g Remark, allows putting in remarks – text boxes for additional
information, which appear in the chart area.
7
Additives & Instruments
Page 10
A member of
Measure what you see.
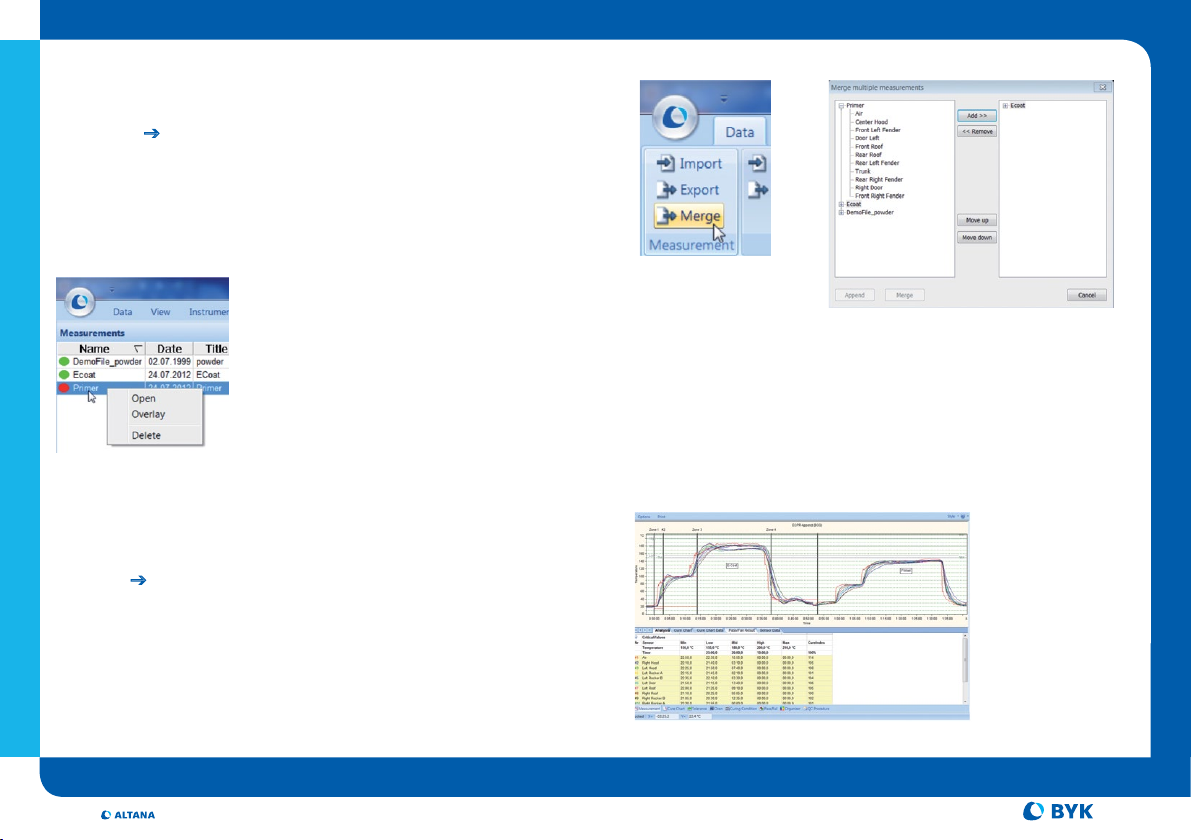
How to display multiple measurements?
Overlay g display of several measurements –
no saving
• Open the desired measurement from database pane g curve will be
displayed
• Right mouse click into database pane to pick out the second curve g
select “Overlay”
ENGLISH
The analyse table will show all results in the order 1. selection , 2. selection
Analysis according to the objects of the 1. Measurement
Merge g combines several measurements –
new file will be created
• Select Data g Measurement g Merge
Merge Multiple measurement window will appear
g select the complete data set or individual sensors
The functions “Move up” and “Move down“ will change the order and
the selection of analysis objects.
• Select “Merge” to combine several measurements
g Analyze table lists sensors of all selected measurements
g Analysis will be done according to the first selected measurement.
• Select ”Append” to show the measurement consecutively
g Analyze table lists sensors of first selected measurement. Results will
be summarized
g Analysis will be done according to the first selected measurement.
8
269 020 584 E 0806
Additives & Instruments
Page 11
A member of
Measure what you see.
temp-gard Technical Specifications temp-chart Hardware Requirements
Accuracy +/- 0.5 °C
Resolution 0,10 °C from 0 – 400 °C
No. of Channels 6 or 12
Memory 20,000 readings per channel
Sampling interval 0.1 sec up to 24 hrs
Temperature Range 0 – 400 °C (32 – 752 °F)
Battery Capacity 0.5 sec interval = 50 hrs
Display Color, 79 x 60 mm (3.1 x 2.4 in)
Interface USB 2.0
Thermal Barrier 255 x 215 x 135 mm
Weight 3.56 kg (7.82 lbs)
ENGLISH
Maxium Duration at 100 °C – 8.5 hrs
0.18 °F from 32 – 752 °F
10 x 8.5 x 5.3 in
at 200 °C – 2.5 hrs
at 250 °C – 2.0 hrs
PC with Pentium processor
Interface USB port
Memory min 256 MB RAM
recommended 512 MB
Hard Disk Capacity min 100 MB
Disk drive CD-ROM
Monitor resolution XGA (1024 x 768) or higher
Operating System Windows 2000 or higher
Exel version 2003 inkluding VBA
9
Additives & Instruments
269 020 584 E 0806
Page 12

255 021 549 E 1310
 Loading...