

Page 1
Quick Reference Guide
Operating Modes
Page 2
1
SMS™ Mobile Operating Modes
This document covers the general functionality of all operating modes in SMS Mobile:
Main Operating Mode/Map Screen
Map Toolbar and Action Buttons
Map Layers
Map Tooltips
Map Settings
Tools Common to All Operating Modes
Navigation View
Boundary Mode
Soil Sampling Mode
Coverage Logging Mode
General Logging Mode
Crop Scouting Mode
SMS Mobile Operating Modes
Revision 8/1/2013 © 2013 Ag Leader Technology, Inc All Rights Reserved
Page 3
2
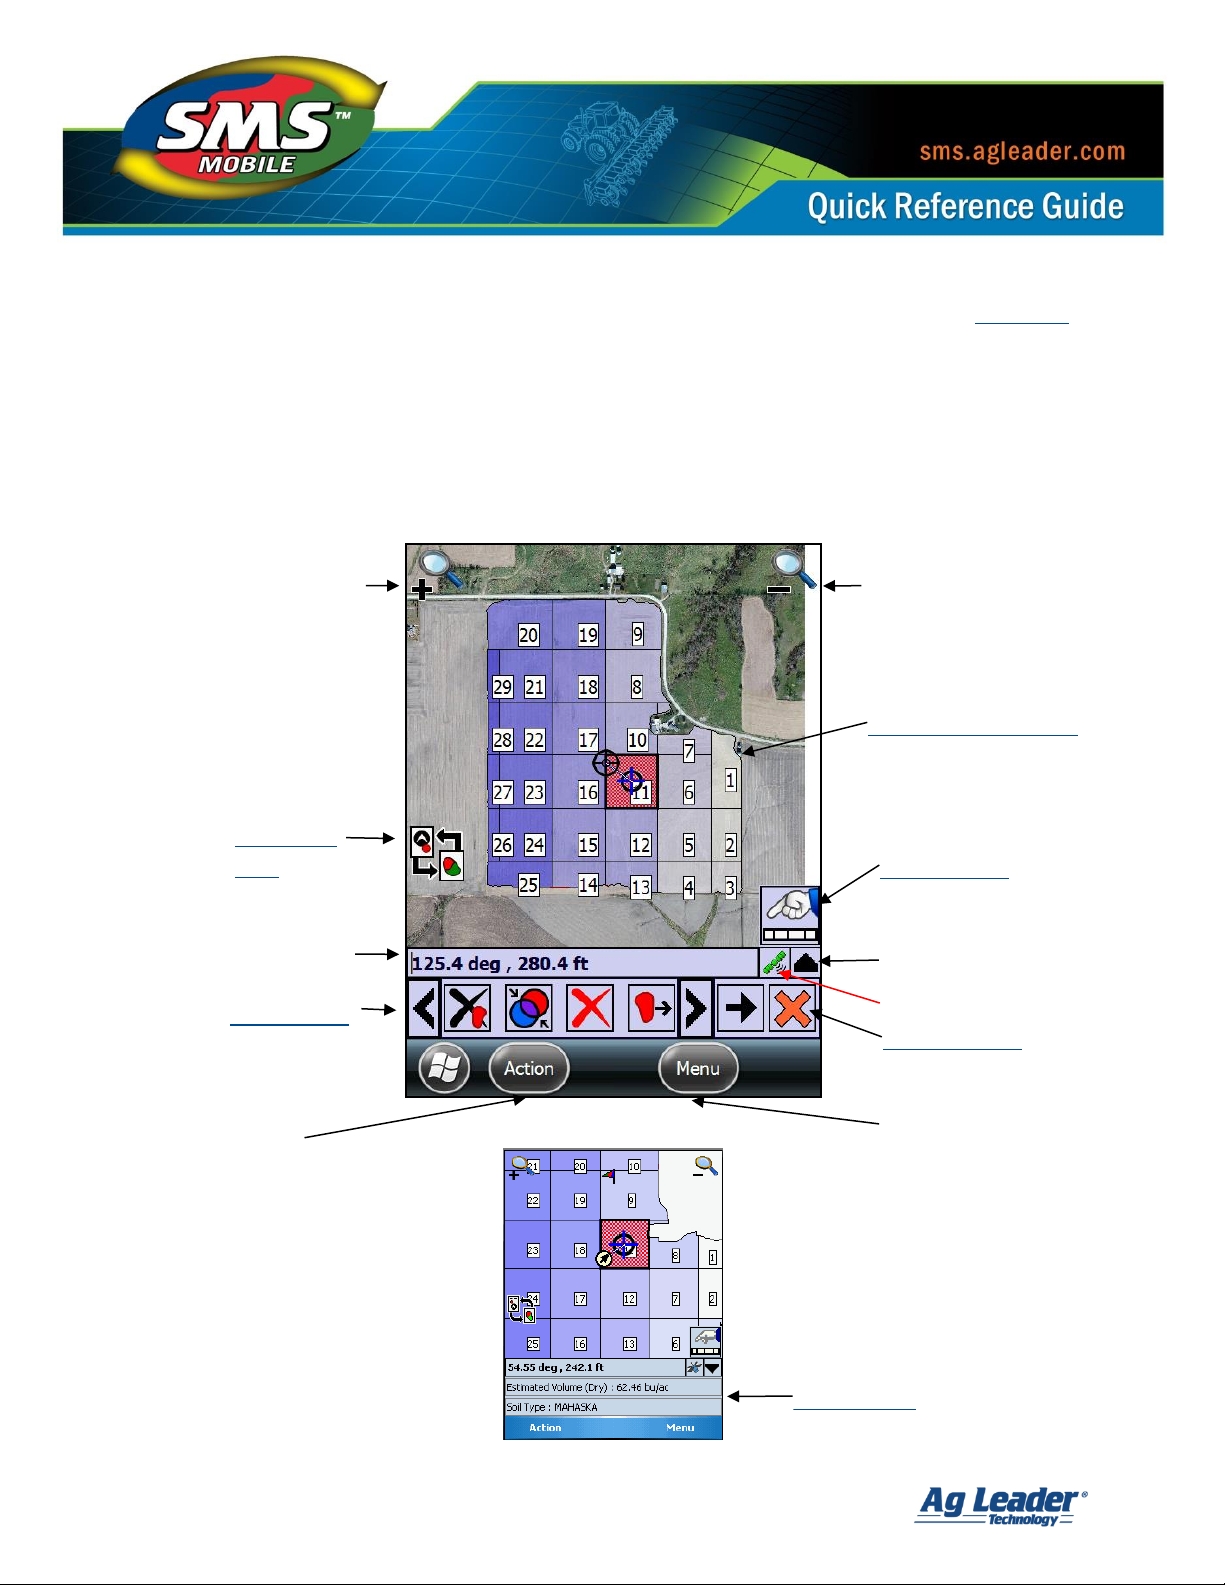
Status Bar
Hide/Show Toolbar
Action Button
See Section 2
Action Buttons
See Section 2
Main Menu
Map Toolbar
See Section 2
Navigation
View
GPS Status
Zoom In
Zoom Out
Map (Selected Layers)
See Sections 3 and 5
Map Tooltips
See Section 4
Action
Button
Menu
Main Operating Mode/Map Screen [Back to Top]
SMS Mobile uses the same concept and layout for all modes of operation in terms of map
display and available tools. This makes operation from mode to mode very consistent and
easy to pick up. The images below show the general layout of the operating/map screens
and key items that are displayed on these screens.
Windows Mobile Device Screens:
SMS Mobile Operating Modes
Revision 8/1/2013 © 2013 Ag Leader Technology, Inc All Rights Reserved
Page 4
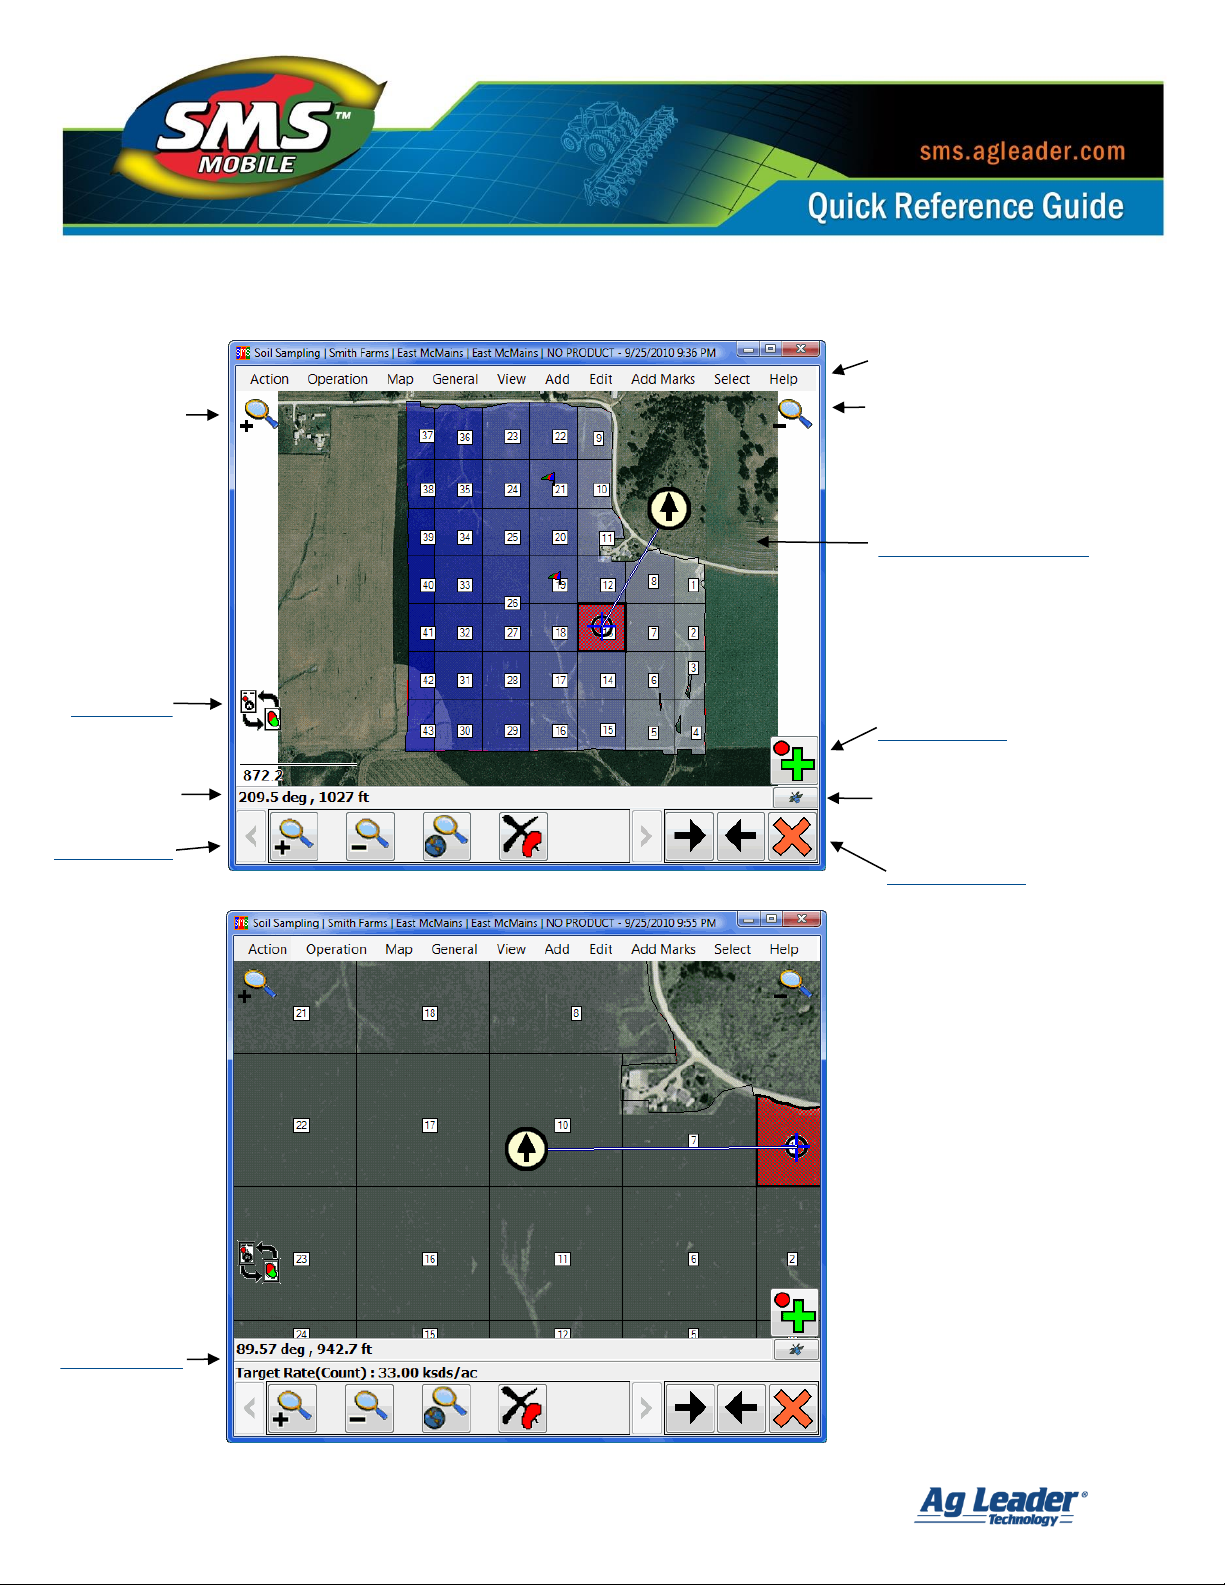
3
Zoom In
Zoom Out
Main Menu
Map (Selected Layers)
See Sections 3 and 5
Action Button
See Section 2
Navigation
View
Status Bar
Map Tooltips
See Section 4
GPS Status
Action Buttons
See Section 2
Map Toolbar
See Section 2
Windows PC Screens:
SMS Mobile Operating Modes
Revision 8/1/2013 © 2013 Ag Leader Technology, Inc All Rights Reserved
Page 5

4
Map Toolbar and Action Buttons [Back to Top]
Map Toolbar
The map toolbar allows you to quickly select an available tool without expanding the Main
Menu on a Windows Mobile device or using the menu items on a PC based device to find
your desired tool. Arrow buttons are provided on each side of the toolbar that also allow you
to quickly scroll thru the available toolbar buttons or you can use the left/right buttons on
your mobile devices directional pad to scroll the toolbar. For SMS Mobile PC the toolbar
related items are located under the Help Menu and then Toolbar.
The Map Toolbar can be customized per operating mode. To edit what buttons are available
in the toolbar, from within an operating mode, go to the Main Menu and select Toolbar and
then Set Visible Tools. You will then be able to check/uncheck the buttons that you would
like to be visible. You can NOT change the order of the buttons though.
In addition you can also set a default tool that the toolbar will scroll to when you select
another tool as your active tool. For example if when you Add Point, you always want to see
the Save button on the toolbar by default you can set Save as the linked tool for the Add
Point tool. To do this, go to the Main Menu and select Toolbar and then Set Linked Tool
(Help Toolbar for SMS Mobile PC). From here you can set the linked tools for any tool that
can have another tool linked to it.
The Map Toolbar does automatically filter itself based on the current tool that is selected.
This means that when you select a tool, only other tools that can be used while that tool is
active will be displayed in the toolbar.
SMS Mobile Operating Modes
Revision 8/1/2013 © 2013 Ag Leader Technology, Inc All Rights Reserved
Page 6
5
Icon
Name
Description
Field Operations
Start Logging
Starts continuous data logging without having to make any other
selection. Only available when logging/creating data from GPS.
Log a Point or
Region
Adds a point or vertex manually each time this button is selected. Or in
Crop Scouting Mode adds an Observation Region based on the default
diameter you have set.
All Modes
Pause
Pauses the current logging/creation of data. Pausing also puts you into
a basic navigation mode where the pause point is marked and a line is
drawn between the current position and pause point.
All Modes
Next Item
Increments to the next spatial object that is available. For example,
when navigating to soil sampling sites this button selects the next
available sample site that is either closest or next in order.
All Modes
Previous Item
Increments to the previous spatial object that is available. For
example, when navigating to soil sampling sites this button selects the
previous sample site that is either closest or the previous site in order.
All Modes
Stop Tool
Stops the current logging/creation/function of the current tool. For
example if you are drawing a polygon selecting Stop will finalize the
polygon and create it.
All Modes
Cancel Tool
Cancels the currently selected tool. To finish a function you must
always select Cancel. Cancel is never available until a tool is stopped.
All Modes
Action Buttons [Back to Top]
The Action Buttons, shown below, indicate what specific actions are available for the tool
that you have currently selected in an operating mode. There are a maximum of three action
buttons that can be displayed at a time for a selected tool. The first action button is always
displayed in the lower right corner of the on-screen map, for easy access. The remaining
action buttons, if available, will display to the right in the Map Toolbar.
The Action Buttons are also accessible via the Action Menu button, at all times, in the lower
left side of the mobile device screen. SMS Mobile PC displays these Action buttons via a
menu selection in the top left hand corner of the window.
See the Action Button descriptions below:
SMS Mobile Operating Modes
Revision 8/1/2013 © 2013 Ag Leader Technology, Inc All Rights Reserved
Page 7

6
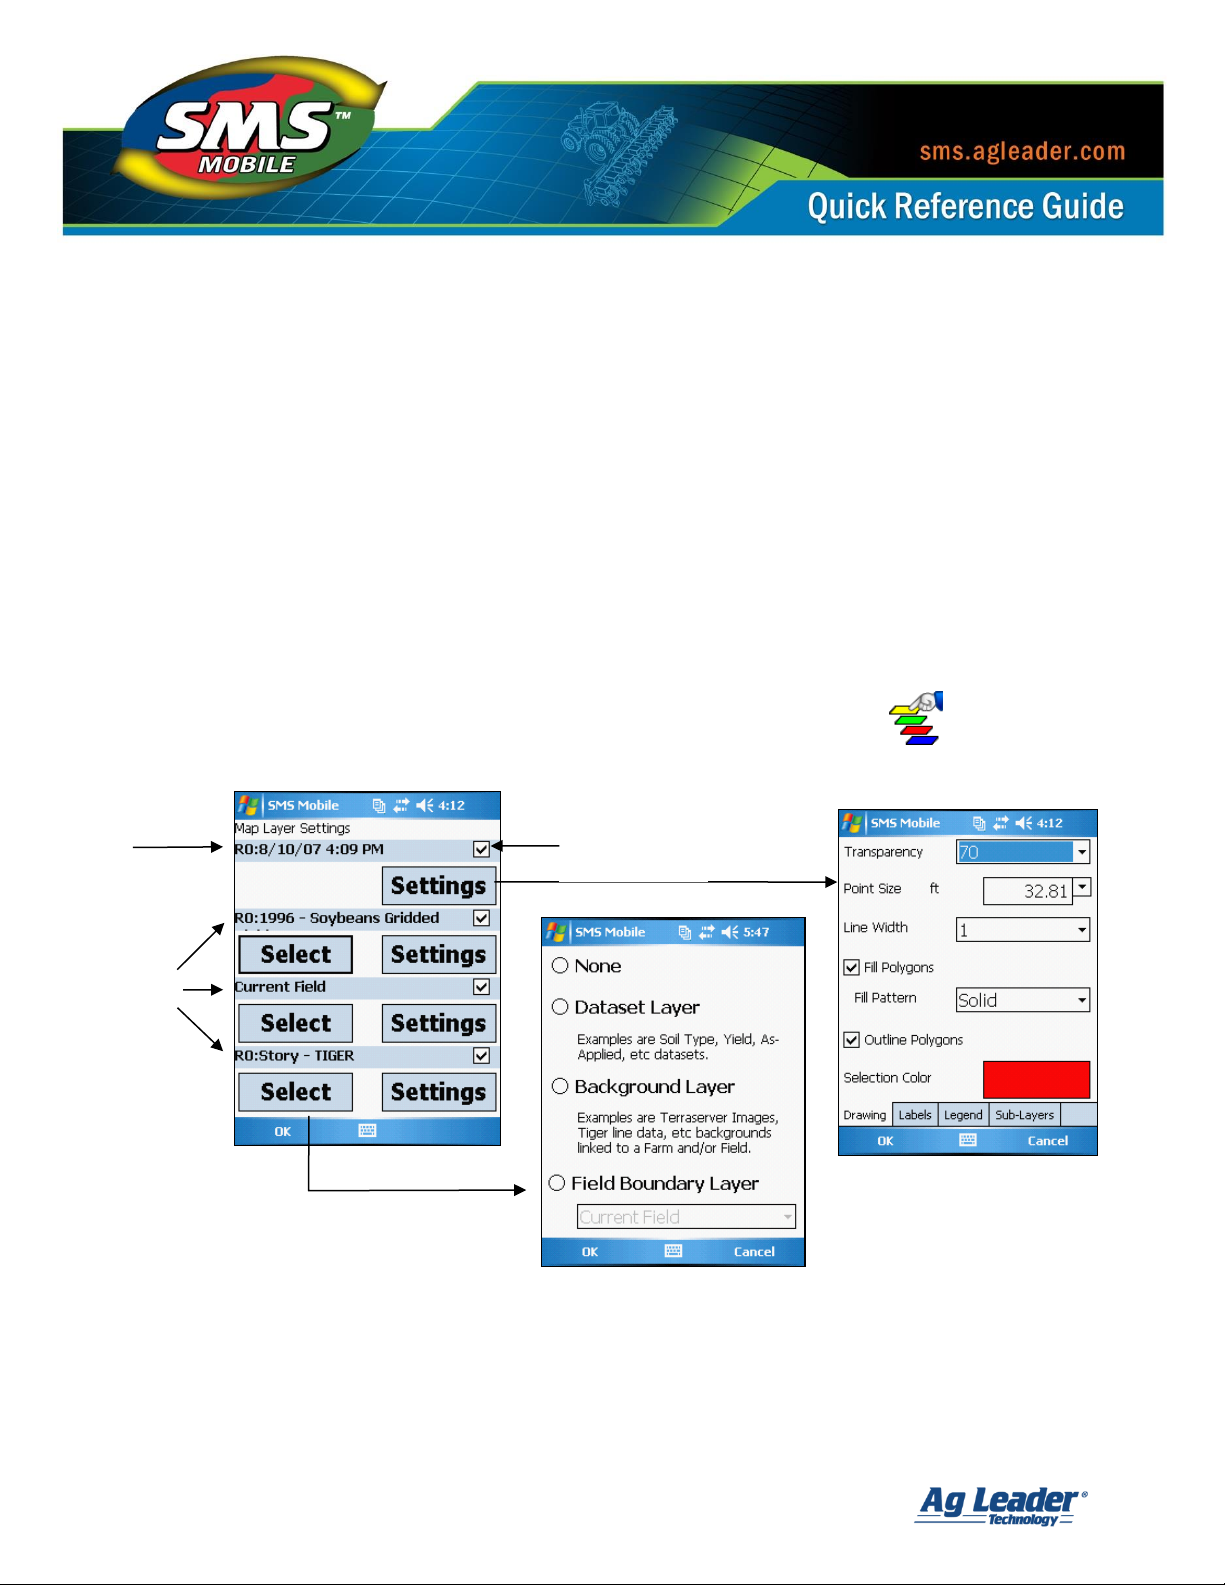
Map Layers
SMS Mobile provides the ability to display multiple layers on a map at one time when in an
operating mode. Four layers are allowed to be mapped at one time. The first, or top layer, is
always the editable/logging layer where new data is created or existing data is edited. The
next three layers can be set to whatever data you have loaded into SMS Mobile, such as
field boundaries, backgrounds, or other datasets you have imported, created, or setup from
the desktop software.
[Back to Top]
When selecting layers to display below the editing/logging layer you have the following options:
None – No data will be displayed at all for this layer.
Dataset Layer – Allows the selection of any data that has been created or imported
into SMS Mobile or exported out from the desktop software that isn’t background
type data. An example would be Grain Harvest data, Soil Type data, Soil Sampling
sites/results, etc.
Background Layer – Allows the selection of either a Farm background, Field
background, or to download/load a background image from the internet. The option
to download an image from the internet only works initially if you have an internet
connection for your device. Once an image is downloaded it remains in memory as a
special type of background that is tied to the current field but is ONLY available for
use in SMS Mobile and only visible when this option is selected. Once an image is
downloaded an internet connection is NOT required to use this option or display the
background image. Tools for managing these special background images are
available under Setup\ \ Batch or General.
Field Boundary Layer – Allow the selection of either current field level boundary for
display or all field level boundaries for the current Farm.
SMS Mobile Operating Modes
Revision 8/1/2013 © 2013 Ag Leader Technology, Inc All Rights Reserved
Page 8
7
Hide/Show
Layer
User
Selectable
Layers
Edit/Logging
Layer
A unique function of the map layers, is that once you have selected a type of data to map in
one of the available layer slots, SMS Mobile will automatically keep track of what type of
data you selected for the current operating mode. When you switch to a different field to
collect/edit data, SMS Mobile will automatically try and find the same type of data for the
field and display it for you so that you don’t have to reselect data you want to see each time
you switch fields, create new datasets, or open and close SMS Mobile.
In addition to selecting layers to display, you also have a large number of options in terms of
how the selected layers are displayed on the map. Each layer selected has a Settings button
that when selected allows you to set parameters for how the layer is drawn on the map.
Examples include if a label should be displayed and how, what attribute should be used for a
legend for the layer and how it looks, and lastly, settings for the display of sub-layers such as
Marks and Buffers.
To get to the layer selection and settings for your map layers when you are in an operating
mode you can either press the Select Layers button on the Map Toolbar or you can
open the Main Menu, then Map, and then Select Layers.
SMS Mobile Operating Modes
Revision 8/1/2013 © 2013 Ag Leader Technology, Inc All Rights Reserved
Page 9
8
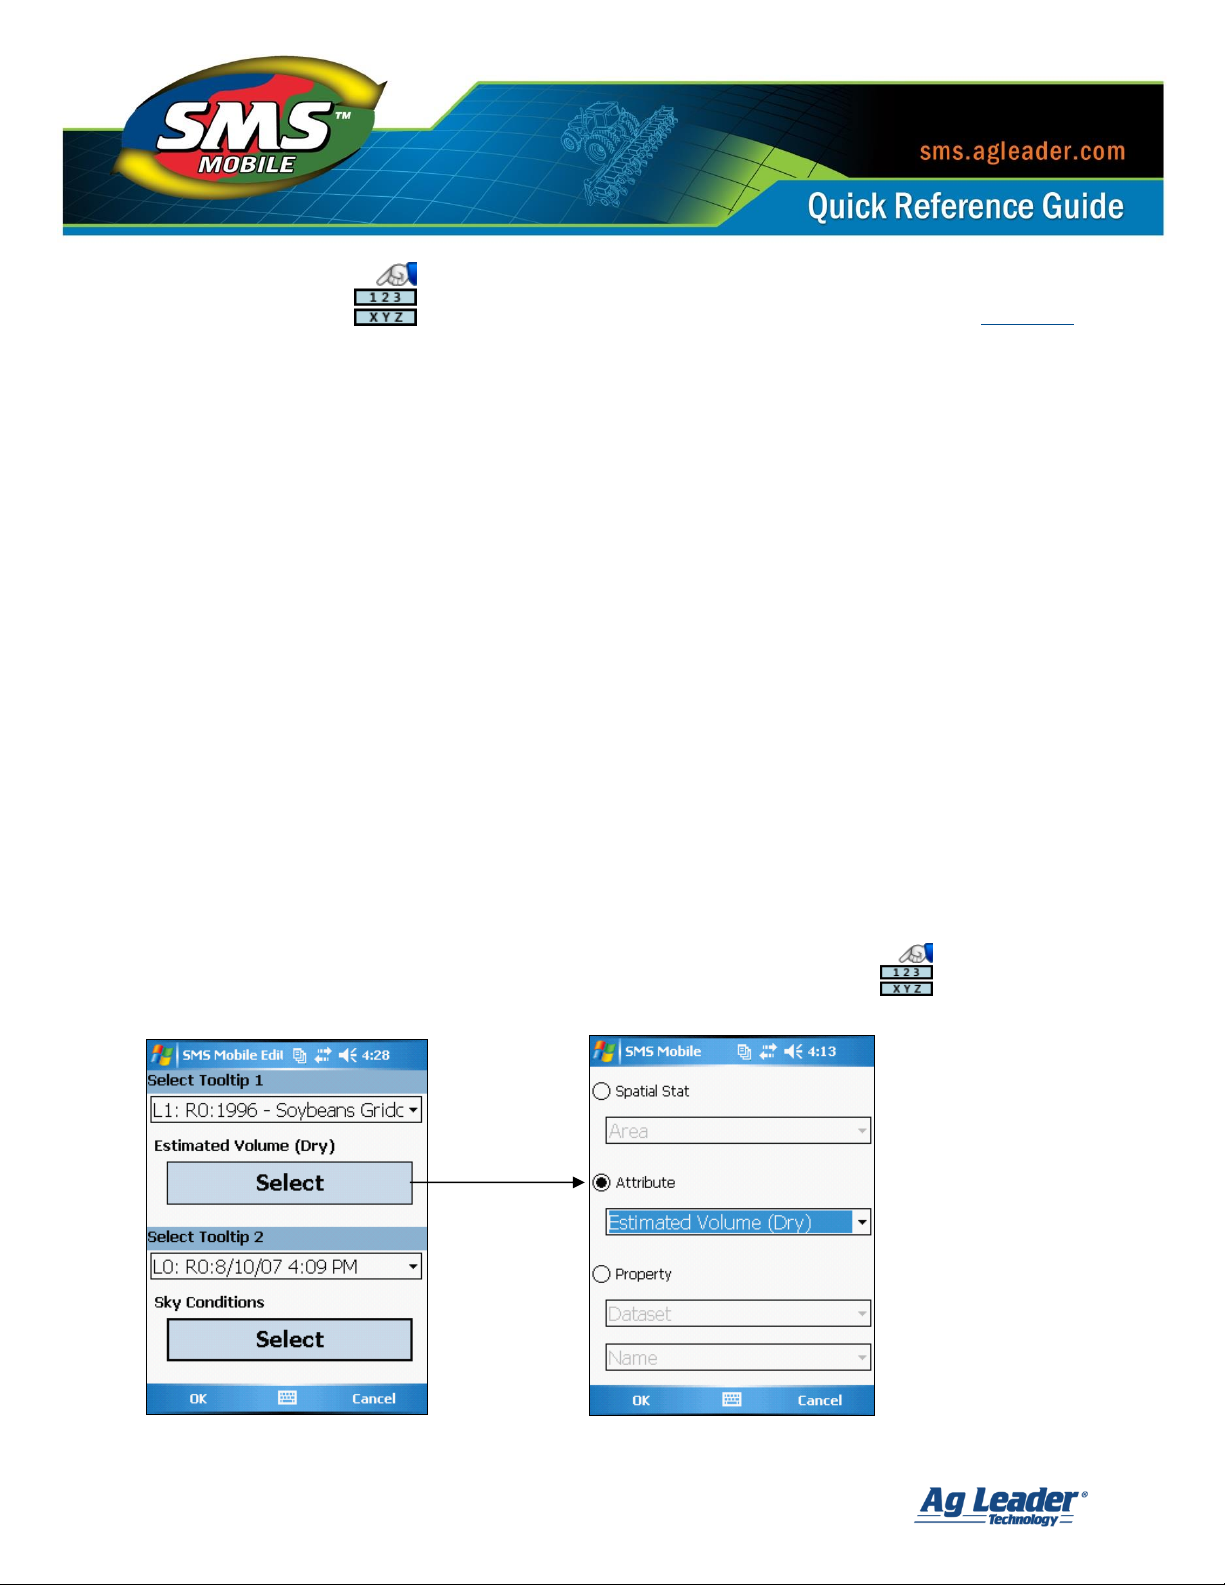
Map Tooltips
[Back to Top]
SMS Mobile provides the ability to display real-time values/stats from a selected layer while
you are in an operating mode. We call this display of real-time values from a selected layer
Map Tooltips. These tooltips are displayed below the map and Status Bar. On Windows
Mobile devices the map tooltips share the same area as the map toolbar. When you hide the
Map Toolbar the Map Tooltips are displayed. On a Windows PC device the tooltips are
displayed at the same time as the map toolbar but above it and the tooltips area isn’t
displayed at all unless you have at least one tooltip set to display.
Two Map Tooltips can be selected for display. You can pick any of the mapped layers to use as the
source for your tooltip and you can pick a Spatial Stat, Attribute, or Property to show a value for.
Map Tooltips get their values two different ways, depending on the layer type. If the layer is the
Edit layer (the first layer in the list and one the one you create/log/edit data in) then the
values come from the last logged/entered value. If the layer is one of the 3 other Reference
layers then the values come from the object that is currently under your current GPS position.
Map Tooltips are very useful on the smaller screens of mobile devices because there really
isn’t room to show full legends for all your layers on the screen. So by using map tooltips you
can see the color coding of your layers and as you drive across an object that is below you,
you will see the actual value for the item you selected to display, thus in a way showing you a
legend value without taking up extra space on the screen.
To get to the Map Tooltips and set them, press the Map Tooltips button on the Map
Toolbar or go to the Main Menu, then Map, then Select Tooltips.
SMS Mobile Operating Modes
Revision 8/1/2013 © 2013 Ag Leader Technology, Inc All Rights Reserved
Page 10
9
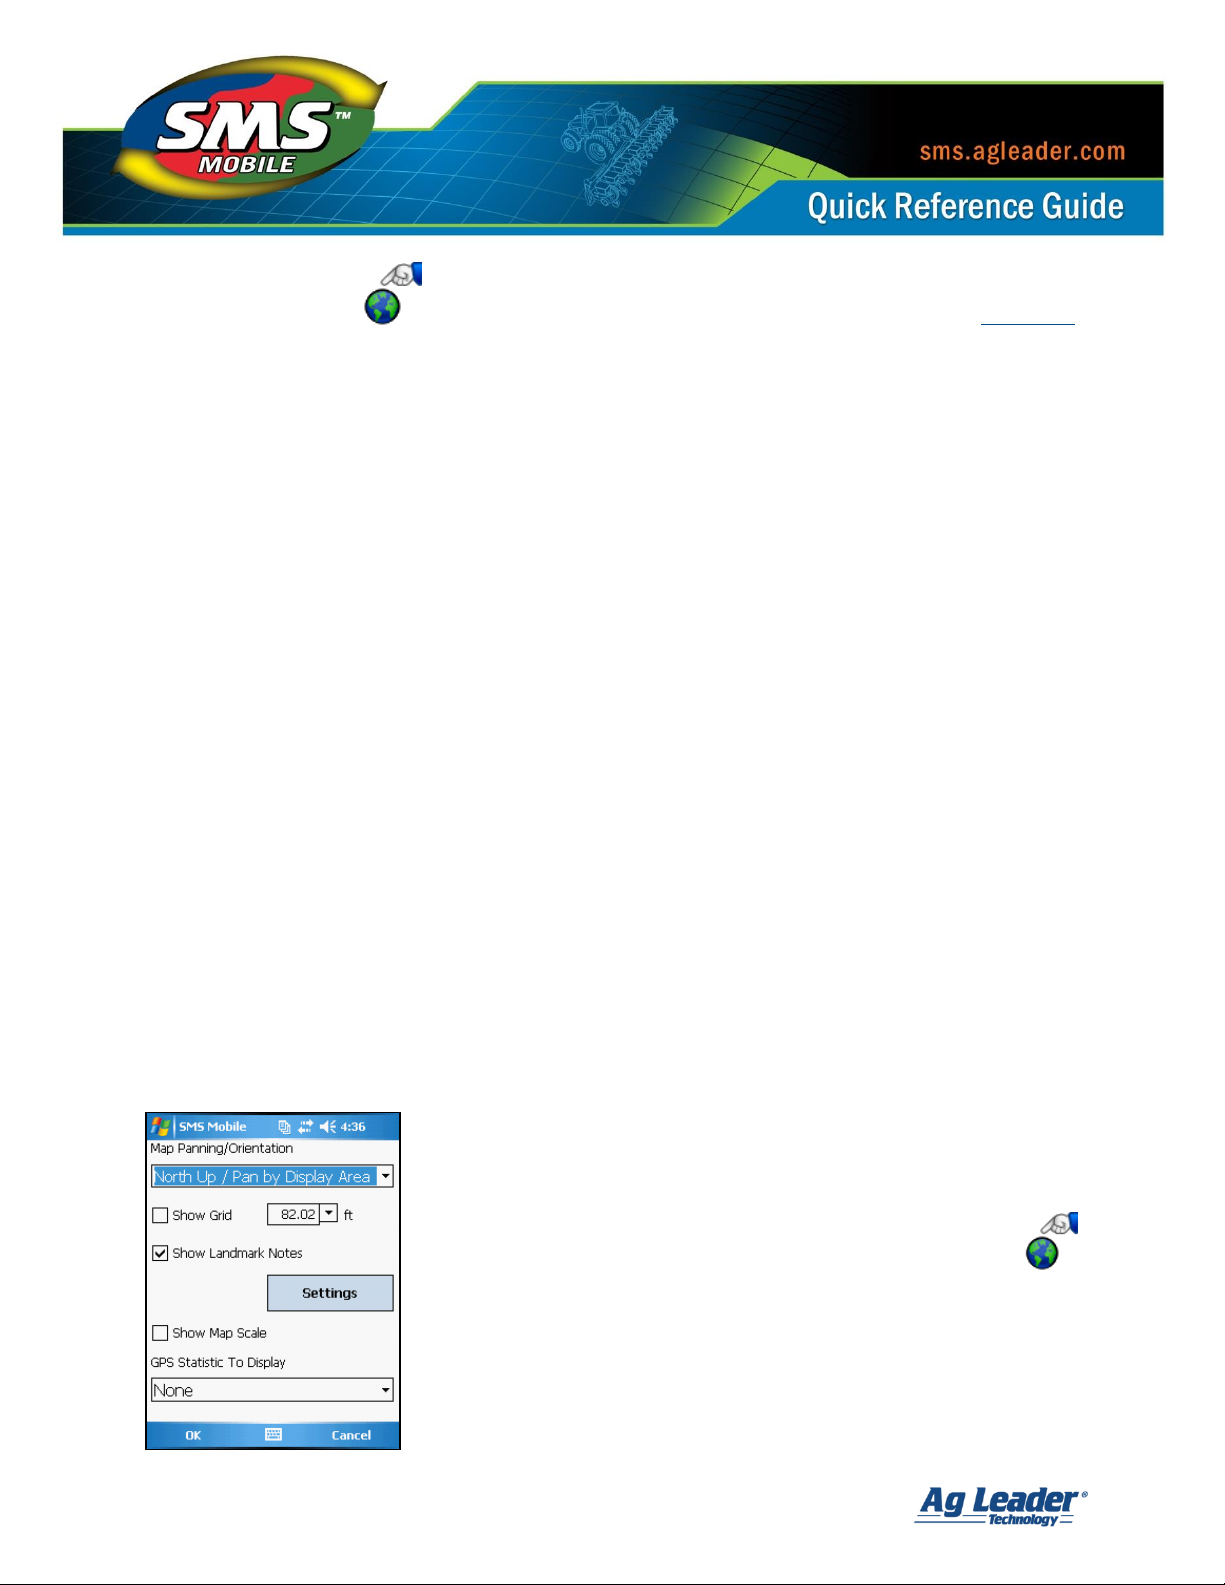
Map Settings
[Back to Top]
SMS Mobile provides the ability to customize a number of settings that affect how your map
is displayed, independent of the layers you have selected and their display settings. We call
these settings Map Settings. The following is a brief explanation of the available options.
Map Panning/Orientation allows you to select if you would like the map to auto pan and the
method of auto pan as you are moving or zooming in or out. By default this is set to “North
Up/Pan by Display Area”. You can turn auto panning off but this isn’t recommended when
you are logging or creating data from GPS. If you will be hand drawing data and wish to
manually pan the map or you are just reviewing data in SMS Mobile then turning the auto
panning off is suggested otherwise the map will keep adjusting to try and pan/center on
your current position all of the time. “Heading Up/Pan to Current Location” will rotate the
map layers to always match your current heading/direction of travel. This option can be very
useful for providing some manual navigation but it can also cause some slowdown of the
mapping, especially if you have all layers set to a dataset.
Show Grid – allows you to overlay a square grid over your map to use as a reference.
Show Landmark Notes – allows you decide to show landmark notes created in SMS
Mobile or export from SMS desktop software. You can also adjust the display settings
for the Landmark Notes, such as turning on labels.
Show Map Scale – will display a simple distance based scale in the lower left hand
corner of the map when selected.
GPS Statistic To Display – allows you to select a GPS based stat to display along the
bottom center edge of the map. This includes showing things like number of
satellites, GPS speed, or the current Latitude and Longitude.
Map Settings are saved per operation mode. This means you can
have different default display options for your map for each of
the unique operating modes in SMS Mobile.
To get to the Map Settings press the Map Settings button
in the Map Toolbar or go to the Main Menu, then Map,
and select Map Settings.
SMS Mobile Operating Modes
Revision 8/1/2013 © 2013 Ag Leader Technology, Inc All Rights Reserved
Page 11

10
Tools Common to All Operating Modes [Back to Top]
GPS Offsets
GPS Offsets allow you to enter forward/back, left/right,
and height offsets for the actual position of your GPS
receiver or where you would like your GPS signal to be
positioned even if you physically aren’t driving there or
don’t have your GPS positioned there. This for example
would be useful in situations where you are driving a field
boundary but can’t physically drive the true edge of the
field or can’t actually drive in the field but you know there
is a fairly fixed offset from where you can drive and where
the edge of the field is.
If you have set the GPS offsets for a Vehicle you have
selected to log/create data with you can select the Load
Vehicle Antenna Offsets button and the offset values you
have defined for that vehicle will fill for you automatically.
It should be noted that offsets are only applied to new data that is logged and offsets can be
changed at any time. Those changes however don’t apply to data you have already logged,
just new data that is collected.
To get to the GPS Offsets they are located in all operating modes via the GPS Offsets
button or through the Main Menu, then Map, and select GPS Offsets.
Measure Tools and
Two different measurement tools are provided in SMS Mobile; Single Segment and Multi-Segment.
SMS Mobile Operating Modes
Revision 8/1/2013 © 2013 Ag Leader Technology, Inc All Rights Reserved
Page 12

11
Navigation Tools and [Back to Top]
The first navigation tool is the Navigate to Manual
Location tool. It allows navigation to manual locations,
such as a manually entered position, a position you
select on the map, or the current field boundary.
The second navigation tool is the Navigate to Mapped
Layer Objects tool. It allows navigation to spatial
objects or marks in one of the mapped layers,
landmark notes, or the current field boundary.
In addition you can select whether you would like to
navigate to the closest edge of a selected object or you
can navigate to the object center point. (The center of
the object is generated by fitting a circle into the object.
This may result in the center point not visually being in
the center of odd shaped objects.)
SMS Mobile Operating Modes
Revision 8/1/2013 © 2013 Ag Leader Technology, Inc All Rights Reserved
Page 13

12
Add Marks
There are 8 possible marks that can be setup and used in SMS Mobile. The marks each
have a unique button that is shown in the Map Toolbar when a Mark is checked as active.
Mark Names can be edited and the custom name will log with your data when a Mark is
selected. When displayed on the map Marks will use a standard set of mark icons, the same
as is used in the desktop software; they will NOT use the Mark button icon when displayed
on the map.
As a general note, Marks only log a single mark per selection, they do not log continuously when
selected. Each press of a Mark button or selection from the Menu will only log one mark.
[Back to Top]
Add Landmark Notes
Landmark Notes can be defined for display across all operating modes, no matter which
mode you were in when you created a Landmark Note. Landmark Notes can only be added
when no other tools are selected/active. So for example you cannot add a Landmark Note
while you are logging coverage data unless you cancel the Log Coverage tool.
Add Layer Notes
Layer Notes (also referred to as Picture Notes) can only be added to the current dataset that
is being created/edited. Layer Notes can also be created while logging/creating data or
other tools are selected/active. Special functionality for creating Picture Notes with specific
Pest Observations in the Scouting operation is also provided.
SMS Mobile Operating Modes
Revision 8/1/2013 © 2013 Ag Leader Technology, Inc All Rights Reserved
Page 14

13
Distance
to Target
or Time
to Target
Target
Heading
or Target
Lat/Lon
Current
Lat/Lon
Target
Circle
Compass
Circle
Compass
Arrow –
Heading/
Direction
Navigation View
When a tool is active that provides navigation functionality,
such as the Navigate to... tools or Take Samples, a button will
display in the lower left hand side of the map view. Selecting
this button will toggle to a dedicated navigation view.
Navigation is still possible using the map view as well with
the crosshair located at the target location, a line drawn
between your current position and the target, and
heading/distance information to the target listed in the
status line below the map. SMS Mobile PC also provides a
third view that can be toggled to that is a split screen view
of the navigation view and the map view.
Settings for the Navigation View are located under
Setup\\General\\Navigation. Two settings are provided;
Compass Radius which defines the width of the large black
circle, and Stop Radius which defines the distance from the target location at which the
navigation will tell you to stop.
[Back to Top]
SMS Mobile Operating Modes
Revision 8/1/2013 © 2013 Ag Leader Technology, Inc All Rights Reserved
Page 15

14
The Navigation View provides a visual interface to help you navigate to a target location,
such as a field boundary or a soil sampling site. The view consists of a target circle, a
compass circle, and various stat displays to help you navigate to your target. The target
circle will rotate around the edge of the compass circle until you are within the set radius of
the compass circle. Also the Target circle will change colors to help indicate how far you are
from being offline from the target, so if its red then you’re not on a heading that will get you
to the target. If the color is green then you are within a few degrees of the proper heading to
line up with the target circle. The goal is to line up your heading of travel so that the Target
circle is green and then to drive towards the target. Once you are within the compass radius
then the target circle will start to move inside of the compass circle. Now keep driving until
the compass arrow and direction are lined up within the Target circle. Once you reach the
STOP radius that is set, you will stop getting navigation and the screen will change to
indicate a STOP state. At that point you have reached your target and should stop.
SMS Mobile Operating Modes
Revision 8/1/2013 © 2013 Ag Leader Technology, Inc All Rights Reserved
Page 16

15
Boundary Mode
SMS Mobile allows you to create or edit field boundaries. This includes what we call Field
Level boundaries or Dataset Level Boundaries. Field Level boundaries are tied directly to a
Field Management Item and are used for auto management selection, spatial sorting, etc.
Dataset Level boundaries are regular datasets that are saved in the Management tree as a
Boundary operation and they are not used for any sorting, etc.
[Back to Top]
To create/edit a boundary follow these steps:
1. Select the Field Operation bar or Main Menu item and then select Boundary.
2. The next step depends on if you have GPS, field boundaries, and if you are close to or
within a field boundary. If you don't have GPS or a field boundary you are in or close
to then you will be prompted to manually select your Grower, Farm, Field. If you have
GPS and are within range of a Field Level boundary(s) but not inside of one you will
be prompted with a list of the closest fields or given the option to manually select a
Grower/Farm/Field. If you have GPS and are within an existing Field Level boundary
then it will be automatically selected.
3. Once you have selected a field, either automatically or manually, you will be
prompted to select a boundary type to create or edit. You can edit a Field Level
boundary but you can't create one directly. You can create a new Boundary level
dataset or edit an existing one. In SMS Mobile when you create a new Dataset Level
Field boundary and then save it you will also have the option to set it as the new Field
Level boundary.
4. If you selected either of the edit options you will now be taken to the Boundary mode
editor to being editing. If you selected to create a new boundary option you will now
be prompted to select the management items for your new boundary dataset, after
which you will be taken to the Boundary mode editor.
5. You can now go to the Main Menu or Map Toolbar and select to Add a Polygon,
Freehand Polygon, or Circle.
6. Once you have created an object you can then edit it using the Move tool, Divide by
Line or Polygon, or by adding another object that intersects the existing object. You
can also use the Merge tool to merge multiple objects that are selected.
7. Once you are satisfied with your boundary you can then save it by selecting the Save
option from the menu or from the Map toolbar. You can also just select Close from
the Main Menu, and if you haven't saved manually yet, you will be prompted to Save.
NOTE: When creating or editing a boundary you can also add Marks or Landmark Notes.
SMS Mobile Operating Modes
Revision 8/1/2013 © 2013 Ag Leader Technology, Inc All Rights Reserved
Page 17

16
Soil Sampling Mode
SMS Mobile allows you to load, create, or edit soil sampling datasets. Soil Sampling data can
either be points, grids, or polygon regions. SMS Mobile not only provides the tools to create
soil sampling locations but it also provides tools for helping you navigate to each sample.
[Back to Top]
To create a soil sampling dataset follow these steps:
1. Select the Field Operation bar or Main Menu item and then select Soil Sampling.
2. You will now be prompted to either create a new dataset or open an existing dataset.
3. The next step depends on if you have GPS, field boundaries, and if you are close to or
within a field boundary. If you don't have GPS or a field boundary you are in or close
to then you will be prompted to manually select your Grower, Farm, Field. If you have
GPS and are within range of a Field Level boundary(s) but not inside of one you will
be prompted with a list of the closest fields or given the option to manually select a
Grower/Farm/Field. If you have GPS and are within an existing Field level boundary
then it will be automatically selected.
4. If you selected to add to or edit an existing dataset you will now be prompted with a
tree of available datasets that can be selected for the selected Field above and that
are also soil sampling datasets.
5. You will now be prompted to select the management items for your new soil sampling
dataset, after which you will be taken to the Soil Sampling mode editor.
6. You will now be prompted with the default attributes that are currently available and
the current default values for each. All sample sites that are created will get these
attributes and their values. These values can be edited now before you continue. You
can NOT add attributes from here. Attributes can only be added from the Operations
setup. Press OK to continue.
7. You will now enter the Soil Sampling Mode editor. Now select Create Samples from
the Main Menu or from the Map Toolbar.
8. You will now be prompted to select the source area to use to generate your samples
from. You can either use your Field Level boundary, your current selection on the
map, or one of reference layers you currently have mapped. Press OK once you make
your selection.
SMS Mobile Operating Modes
Revision 8/1/2013 © 2013 Ag Leader Technology, Inc All Rights Reserved
Page 18

17
9. Now you will be prompted to select the method to use to create the samples. You can
select to create points, grids, or polygon regions.
10. Now you will be prompted to select the parameters for generating the samples based on
the method you selected above. Once you have entered the parameters you desire press
the OK button.
11. Next you get to verify the samples that will be created. At this point you see a preview
of the samples but you can also use the provided Rotate Grid or Shift Grid tools to
rotate and shift the sample grids to position them as you choose. Press OK when you
are satisfied with the samples that will be created.
12. You will now be prompted with an option to merge polygons that are small with other
larger polygons (if you selected the option to Create Sample Grids). If you want to
automatically merge the small polygons check the option and then select the
percentage of the area to merge by. This percentage is based on the original grid size
you selected.
13. The last step in this wizard, which is optional, is to auto-fill an attribute with
sequential values. By default Sample ID will be selected and this tool allows you to
generate values for all samples automatically based on a scheme you define such as
"Sample 1, Sample 2, Sample 3, etc". You can cancel this step if you don't want to
auto-fill values for an attribute and finish the creation of your samples.
14. You will now be returned to the map and you should see the samples that you just
created, labeled by Feature ID by default.
NOTE: Point samples can be added to the samples that are created via the Create
Samples wizard. Samples can also be manually selected and deleted.
SMS Mobile Operating Modes
Revision 8/1/2013 © 2013 Ag Leader Technology, Inc All Rights Reserved
Page 19

18
To take samples follow these steps:
1. Enter the Soil Sampling mode.
2. Now either follow the steps above to create a new sampling dataset or you will have
a dataset selected that you previously created, exported from the desktop software,
or imported manually into SMS Mobile.
3. Once you have a sampling dataset, select the Take Samples tool from the Main Menu
or select it from the Map Toolbar.
4. You will now be prompted to select a method to be guided to your sample sites. You
can either select to be navigated by object/sample order or by the closest
object/sample to your current position.
5. You will now return to the map and a line will be displayed to the first sample site to
navigate to as well as a crosshair placed on the center of the sample site. The
sample site that is the current navigation target will also be selected. You will also
have several action buttons available depending on the state of your data; Add Point,
Edit Selection, Next Item, and Cancel. You will also see a heading and distance
displayed in the Status bar indicating the navigation to the currently selected sample
site.
6. As you are driving to a sample site that is currently selected you will be able to add
points. When you drive within 30 feet of a sample point or you drive inside of a
selected grid or region type sample site the Add Point tool will change to an Edit
Attributes tool and will allow you to edit the attribute values for the sample site. When
you select the Edit Attributes tool and press OK on edit attribute values dialog that
sample you were editing will be marked as "sampled". What this means is that as you
increment through the other sample sites, you will only be guided to sample sites that
have not been sampled already. You can reset this by selecting the Reset Samples
tool which will mark all samples as un-sampled.
SMS Mobile Operating Modes
Revision 8/1/2013 © 2013 Ag Leader Technology, Inc All Rights Reserved
Page 20

19
Coverage Logging Mode
SMS Mobile allows you to log coverage data, based on a swath width that you select. This is
useful for activities such as logging tillage operations or basic hybrid/variety mapping (single
product). Coverage logging data is currently saved as the Site Verification operation only.
Coverage logging data is actually logged as points but includes attribute information for
swath, distance, and duration so accurate coverage data can be calculated and displayed.
To improve coverage logging quality, the Virtual Implement Switch (VIS) is provided as an
option for this mode. If you have a field boundary defined for your field when you enter this
mode you will be provided an option to Enable or Disable the VIS. The VIS automatically turns
off coverage logging based on whether you are inside the field boundary and also based on
area you have already covered inside the field boundary. This eliminates the need to
manually Stop or Pause logging when in a covered area or when you drive outside the field. In
addition, the VIS will also automatically reduce your swath width based on uncovered or
overlapping area. The VIS can be disabled in the operating mode at any time.
[Back to Top]
To log coverage data follow these steps:
1. Select the Field Operation bar or Main Menu item and then select Coverage Logging.
2. You will now be prompted to select either to create a new dataset or open an
existing dataset.
3. The next step depends on if you have GPS, field boundaries, and if you are close to or
within a field boundary. If you don't have GPS or a field boundary you are in or close
to then you will be prompted to manually select your Grower, Farm, Field. If you have
GPS and are within range of a Field Level boundary(s) but not inside of one you will
be prompted with a list of the closest fields or given the option to manually select a
Grower/Farm/Field. If you have GPS and are within an existing Field level boundary
then it will be automatically selected.
4. If you selected to add to or edit an existing dataset you will now be prompted with a
tree of available datasets that can be selected for the selected Field above and that
are site verification datasets.
5. You will now be prompted to select the management items for your new site verification
dataset, after which you will be taken to the Coverage Logging mode editor.
SMS Mobile Operating Modes
Revision 8/1/2013 © 2013 Ag Leader Technology, Inc All Rights Reserved
Page 21

20
6. You will now be prompted with the default attributes that are currently available and
the current default values for each. All logged points that are created will get these
attributes and their values. These values can be edited now before you continue. You
can NOT add attributes from here. Attributes can only be added from the Operations
setup. Press OK to continue.
7. Now you will be prompted with an option to map related datasets. Related datasets are
other load/regions that are related to the new dataset you are creating or an existing
dataset you have selected to add to. An example would be that you have logged
multiple days of coverage data in the same field and you have multiple datasets with
different products. Selecting the option to map all related datasets will show the other
datasets on your map plus the new data you are logging. The other benefit is that this
does not use up an additional map layer slot. Press OK to continue.
8. The last step before entering the operating mode, which is only available if you have
a set field boundary, is the settings for the Virtual Implement Switch (VIS). Select
whether you want to Enable or Disable the VIS and how you want it to handle holes
inside your field boundary. Click OK to continue.
9. You will now enter the Coverage Logging mode editor. To begin logging coverage
data, select Log Coverage from the Main Menu or from the Map Toolbar.
10. To begin logging data you now select the Start button in the right corner of the map,
press the Enter key on your mobile devices keypad, or press the Action Menu and
select Start. Once selected, the Start icon and selections will change to Pause.
11. To stop logging select Cancel. Save does not need to be selected in this mode
because data is automatically saved as it is logged.
NOTE: Coverage data cannot be edited or undone once logged. To remove data you
must go to Dataset Maintenance and delete the entire dataset or edit it in the
desktop software.
SMS Mobile Operating Modes
Revision 8/1/2013 © 2013 Ag Leader Technology, Inc All Rights Reserved
Page 22

21
General Logging Mode
SMS Mobile allows you load, create, or edit generic data such as points, lines, or polygons.
This mode of operation is commonly used for logging/creating things like tile lines, crop
scouting, crop plans, or any other general type of data that is needed that isn't covered by
one of the other operating modes.
[Back to Top]
To create a general logging dataset follow these steps:
1. Select the Field Operation bar or Main Menu item and then select General Logging.
2. You will now be prompted to select either to create a new dataset or open an
existing dataset.
3. The next step depends on if you have GPS, field boundaries, and if you are close to or
within a field boundary. If you don't have GPS or a field boundary you are in or close
to then you will be prompted to manually select your Grower, Farm, Field. If you have
GPS and are within range of a Field Level boundary(s) but not inside of one you will
be prompted with a list of the closest fields or given the option to manually select a
Grower/Farm/Field. If you have GPS and are within an existing Field level boundary
then it will be automatically selected.
4. If you selected to add to or edit an existing dataset you will now be prompted with a
tree of available datasets that can be selected for the Field above and that are site
verification, generic, or crop plan datasets.
5. You will now be prompted to select the management items for your new dataset,
after which you will be taken to the General Logging mode editor.
6. You will now be prompted with the default attributes that are currently available and
the current default values for each. All logged points that are created will get these
attributes and their values. These values can be edited now before you continue. You
can NOT add attributes from here. Attributes can only be added from the Operations
setup. Press OK to continue.
7. You will now enter the General Logging mode editor. The General Logging mode
provides the most options and tools for collecting/creating/editing spatial data in
SMS Mobile. You can create/log points, lines, and polygons in this mode.
8. To begin logging/creating data go to the Add Menu and select one of the available
tools or select the tool from the Map Toolbar.
SMS Mobile Operating Modes
Revision 8/1/2013 © 2013 Ag Leader Technology, Inc All Rights Reserved
Page 23

22
9. All of the Add tools generally function the same in that the Action tools allow you to
add objects/vertices of an object one at a time or they can log automatically as you
drive. Select the action button in the right corner of the map, press the Enter key on
your mobile devices keypad, or press the Action Menu and select first action item to
start logging or add a point/vertex.
10. To stop logging/creating data select Stop, which will complete the object you are
creating, unless you are logging/adding points.
11. In this mode you must select the Save item to save your data, it is not saved
automatically. So either manually select Save from the Main Menu or from the
Toolbar. If you haven't saved yet you will get prompted if you would like to Save
before closing the mode editor.
SMS Mobile Operating Modes
Revision 8/1/2013 © 2013 Ag Leader Technology, Inc All Rights Reserved
Page 24

23
Crop Scouting Mode
SMS Mobile allows you to load, create, or edit crop scouting regions. This mode of operation
is used to log the conditions and state of your crop. You can also log Pests that you observe
in your field and document information about those pests. Only polygon areas can be
created to document your scouting regions/observations. Observations can be made on the
fly by manually creating observation regions (using tools in the Add Menu or toolbar) or by
generating pre-defined regions that you will specifically scout. The following details the
process of creating a pre-defined scouting dataset but please note that you DO NOT have to
create pre-defined regions to using the scouting mode; you can manually add regions as you
observe them.
[Back to Top]
To create scouting observation regions using the wizard tools follow these steps:
1. Select the Field Operation bar or Main Menu item and then select Crop Scouting.
2. You will now be prompted to either create a new dataset or open an existing dataset.
If you don’t have any existing Scouting datasets then you will automatically move to
the next step.
3. The next step depends on if you have GPS, field boundaries, and if you are close to or
within a field boundary. If you don't have GPS or a field boundary you are in or close
to, then you will be prompted to manually select your Grower, Farm, Field. If you have
GPS and are within range of a Field Level boundary(s) but not inside of one you will
be prompted with a list of the closest fields or given the option to manually select a
Grower/Farm/Field. If you have GPS and are within an existing Field level boundary
then it will be automatically selected.
4. If you selected to add to or edit an existing dataset you will now be prompted with a
tree of available datasets that can be selected for the selected Field above and that
are also scouting datasets.
5. You will now be prompted to select the management items for your new scouting
datasets(s), after which you will be taken to the Crop Scouting Mode Editor.
6. You will now be prompted with the default attributes that are currently available and
the current default values for each. All observation sites that are created will get
these attributes and their values. These values can be edited now before you
continue. You can NOT add attributes from here. Attributes can only be added from
the OPERATIONS setup. Press OK to continue.
7. You will now enter the Crop Scouting Mode Editor. Now select Create Scouting
Observations from the Main Menu or from the Map Toolbar.
SMS Mobile Operating Modes
Revision 8/1/2013 © 2013 Ag Leader Technology, Inc All Rights Reserved
Page 25

24
8. You will now be prompted to select the source area to use to generate your
observations from. You can either use your Field Level boundary, your current
selection on the map, or one of the reference layers you currently have mapped.
Press OK once you make your selection.
NOTE: If you are re-scouting previous observations, and you want to return to the same
observations, set the Scouting dataset that you want to re-scout as one of your reference
map layers. Then in this step select to use a reference layer to create new scouting
observations from. This is important because you do not want to edit the original
observations because you want to keep that as a historical record of previous scouting.
9. Now you will be prompted to select the method to use to create the observations. You
can select to create observation grids or polygon regions.
10. Now you will be prompted to select the parameters for generating the observations
grid if you selected that option or if you selected the option to generate polygon
regions go to step 12. Once you have entered the parameters you desire for the grid
press the OK button.
11. Now you get the opportunity to verify the observation regions that will be created and
adjust as needed. At this point you see a preview of the observations and can use the
provided Rotate Grid or Shift Grid tools to rotate and shift the sample grids to position
them as you choose. Press OK when you are satisfied with the zones that will be created.
12. You will now be prompted with an option to merge polygons that are small with other
larger polygons (if you selected the option to Create Sample Grids). If you want to
automatically merge the small polygons check the option and then select the
percentage of the area to merge by. This percentage is based on the original grid size
you selected.
13. The last step in this wizard, which is optional, is to auto-fill an attribute with
sequential values. You can cancel this step if you don't want to auto-fill values for an
attribute and finish the creation of your observations.
14. You will now be returned to the map and you should see the zones that you just
created, labeled by Feature ID.
NOTE: Additional observation regions can be added to the observations that are
created via the Create Scouting Observations wizard. Observations can also be
manually selected and deleted.
SMS Mobile Operating Modes
Revision 8/1/2013 © 2013 Ag Leader Technology, Inc All Rights Reserved
Page 26

25
To start scouting or re-scout already defined observation regions follow these steps:
1. Enter the Crop Scouting Mode.
2. Now either follow the steps above to create a new scouting dataset or you will have a
dataset selected that you previously created, re-scouting previous observations,
exported from the desktop software, or imported manually into SMS Mobile.
NOTE: These steps can still be used even if you don't have predefined regions. You
can use these steps to manually add observations using the Add Region tool which
will add an observation region based on the default observation diameter. Just follow
the steps below and the only difference is that you won’t get guidance to any regions
because you won’t have any.
3. Once you have a scouting dataset, select the Start Scouting tool from the Main Menu
or select it from the Map Toolbar.
4. You will now be prompted to select a method to be guided to your observation
regions. You can either select to be navigated by object/sample order or by the
closest object/sample to your current position. Please note that even though you
select one of these navigation options you can still manually add new observation
regions manually using the Add Region button or Action Menu selection.
5. You will now return to the map and a line will be displayed to the first observation
region to navigate to as well as there will be a crosshair placed on the center of the
observation region. The observation region that is the current navigation target will
also be selected. You will also have several action buttons available depending on
the state of your data; Add Region, Edit Selection, Next Item, and Cancel. You will
also see a heading and distance displayed in the Status bar indicating the navigation
to the currently selected observation region.
6. As you are driving to an observation region that is currently selected you will be able
to add observations. A new observation region can be added on the fly by selecting
the Add Region tool but an area can only be added as long as no part it touches any
other observation region. When you drive inside of a selected grid or region type
observation region the Add Region tool will change to an Edit Attributes tool and will
allow you to edit the attribute values for the observation region. When you select the
Edit Attributes tool and press OK that observation region you were editing will be
marked as "scouted". What this means is that as you increment through the other
observation regions, you will only be guided to observations that have not been
scouted already. You can reset this though by selecting the Reset Observations tool
which will mark all observation regions as un-scouted.
SMS Mobile Operating Modes
Revision 8/1/2013 © 2013 Ag Leader Technology, Inc All Rights Reserved
Page 27

26
7. When adding or editing an observation region you have access to set values for the
attributes assigned to the scouting operation(s) and also to add Pest observations to
your dataset. When you Add Pests to your dataset you will actually be adding a new
dataset that is specific to the Pest you add and the type of pest it is. You will not see
this as a separate layer in SMS Mobile though. Only if you export the scouting data or
sync with the desktop software will you see the data split up per Scouting Operation
and Pest. Whenever you edit this data in the desktop software or SMS Mobile though
all the related scouting data will be combined back into one dataset that you can
edit. So what you see in the editor in SMS Mobile is what we call Scouting – All
Observations which is a special dataset made up of all the observations you collect
together, no matter what Pest (or even No Pest) that they are.
You can Add Picture Notes to Pest Observations at this point as well. This
allows you to set an image for a specific object/observation in the field. The
Picture Notes can be viewed for the pest observation but must be synced
back to SMS desktop software to be printed.
NOTE: No Pest is a selection that should be used to document additional scouting
data that isn’t Pest related but you want to track. No Pest will actually create your
data as a Scouting – General operation which allows you to document things such
as weather damage, nutrient deficiency, etc.
8. When editing the values for an observation you can set the general scouting attribute
values which are generally items that should be available to all scouting information,
like Crop Growth Stage or Crop Height and then you can add Pest specific information
to document very specific items you need to document for an observation region.
SMS Mobile Operating Modes
Revision 8/1/2013 © 2013 Ag Leader Technology, Inc All Rights Reserved
 Loading...