

Udo Huber
Saponification of procaine: Kinetic
measurements with the Agilent high
throughput analysis system
Abstract
In this application note we describe how the cleavage of procaine, a
p-aminobenzoic acid ester, can be monitored using the Agilent 220
microplate sampler (MPS) with the Agilent 1100 Series LC system. The
data of the measurements is transferred to ChemStore C/S, the data-
base module of the Agilent ChemStation Plus, for data analysis. We
show that the data can then be transferred easily to a spreadsheet
program, for example Microsoft®Excel®, for further calculations such
as determination of the rate coefficient.
Application Note
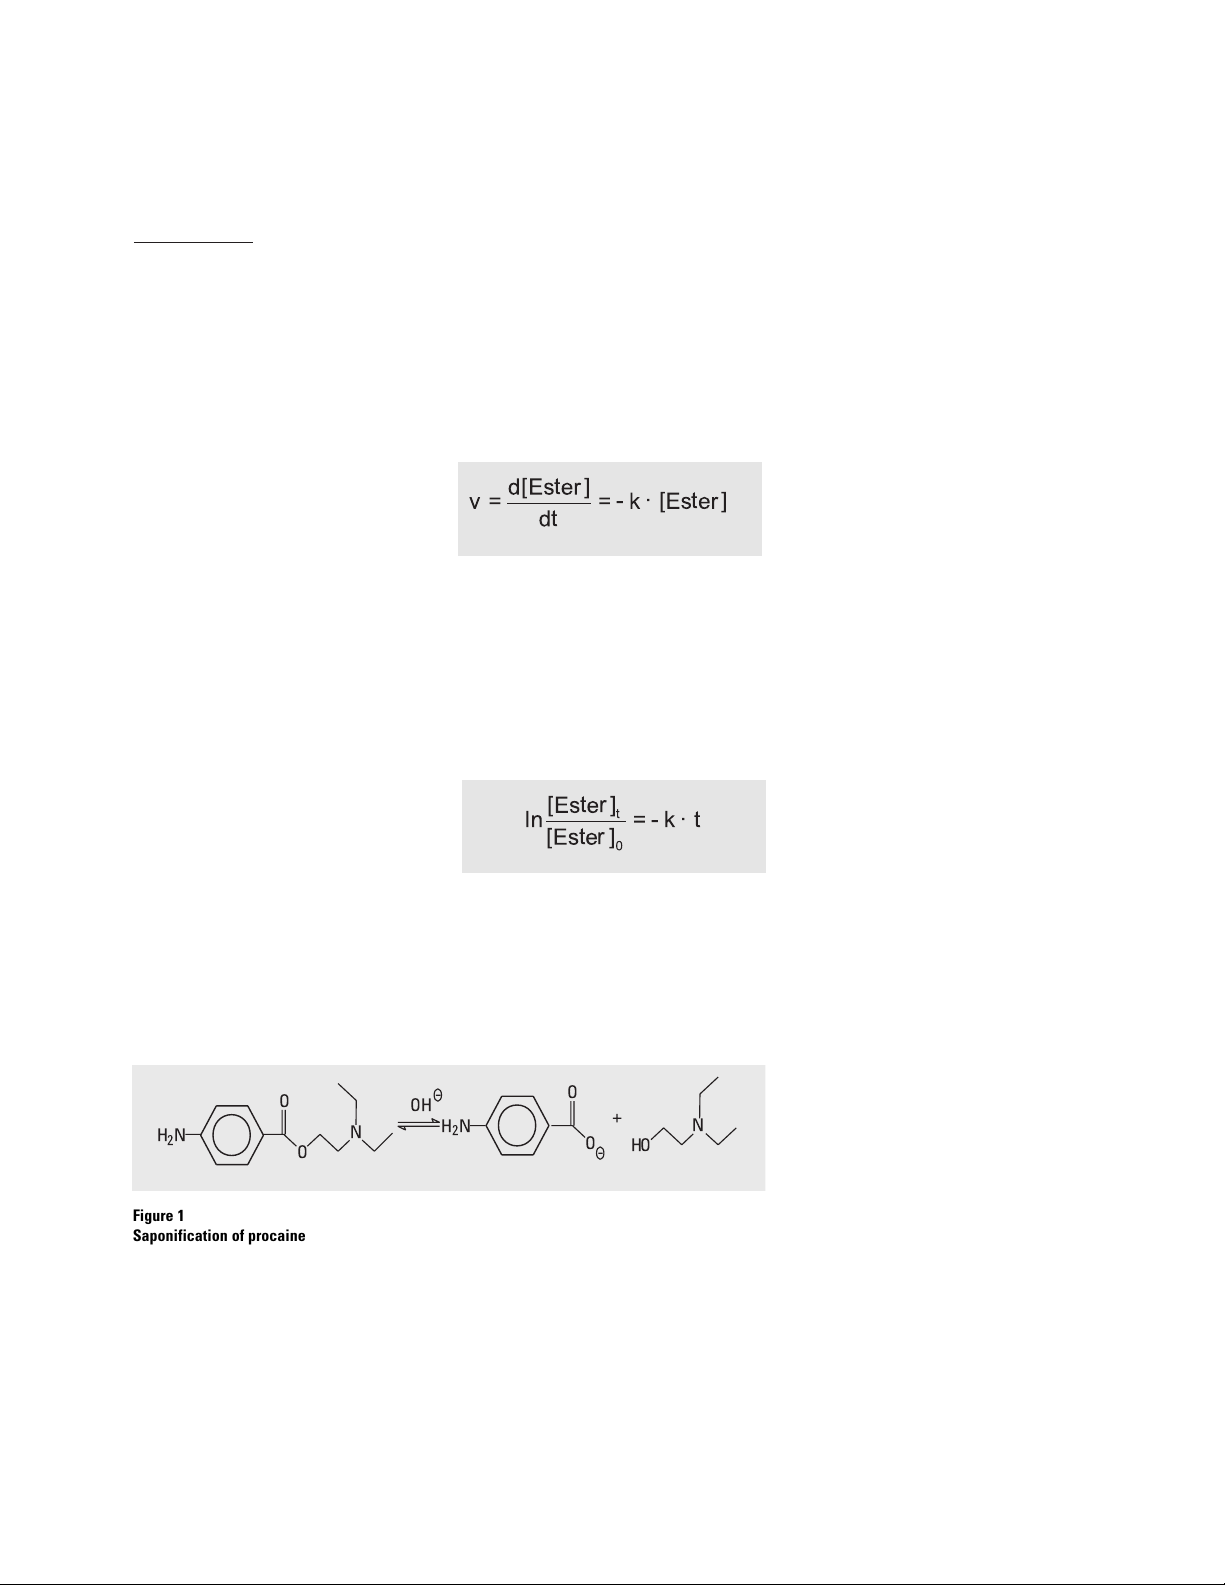
Procaine is a p-aminobenzoic acid
ester, which can be saponificated
into p-aminobenzoic acid (PABA)
and an alcohol. The reaction is
shown in figure 1.
Since the reaction is first order
the rate of reaction can be
described as:
with:
v (rate of reaction)
k (rate coefficient)
[Ester] (concentration of
procaine)
Integration of this formula gives:
The rate coefficient k can be
determined from the slope of the
straight line in the graph
ln([Ester]
t
/[Ester]0) against time.
Introduction
Kinetic measurements play an
important role in pharmaceutical
chemistry. Not only for pharmacokinetics where the rate of active
compound degradation has to be
determined, but also for drug discovery to test the inhibition effect
of a compound on an enzyme. For
very fast reactions special apparatus, for example shock tubes,
have to be used but slower reactions can be monitored by analyzing reaction samples at specific
time intervals. This application
note describes how this is
achieved using the Agilent 220
MPS with the Agilent 1100 Series
LC System and the Agilent ChemStation Plus software. Saponification of procaine at pH=10 was
selected as a model scenario.
Figure 1
Saponification of procaine
v·-==
Esterd
][][Esterk
dt
][
ln
Ester
Ester
t
][
0
tk
·-=
O
H2N
OH
N
O
H2N
O
+
O
HO
N
Equipment
The system included an Agilent
1100 Series vacuum degasser, an
Agilent 1100 Series binary pump,
an Agilent 1100 Series thermostatted column compartment, an Agilent 1100 Series diode array detector and an Agilent 220 micro plate
sampler.
The system was controlled using
the Agilent ChemStation Plus (version A.07.01) and the micro plate
sampling software (version
A.03.01).
System Setup Overview
1. A chromatographic method for
measuring procaine and PABA
was developed on the Agilent
220 MPS and the Agilent 1100
Series LC system.
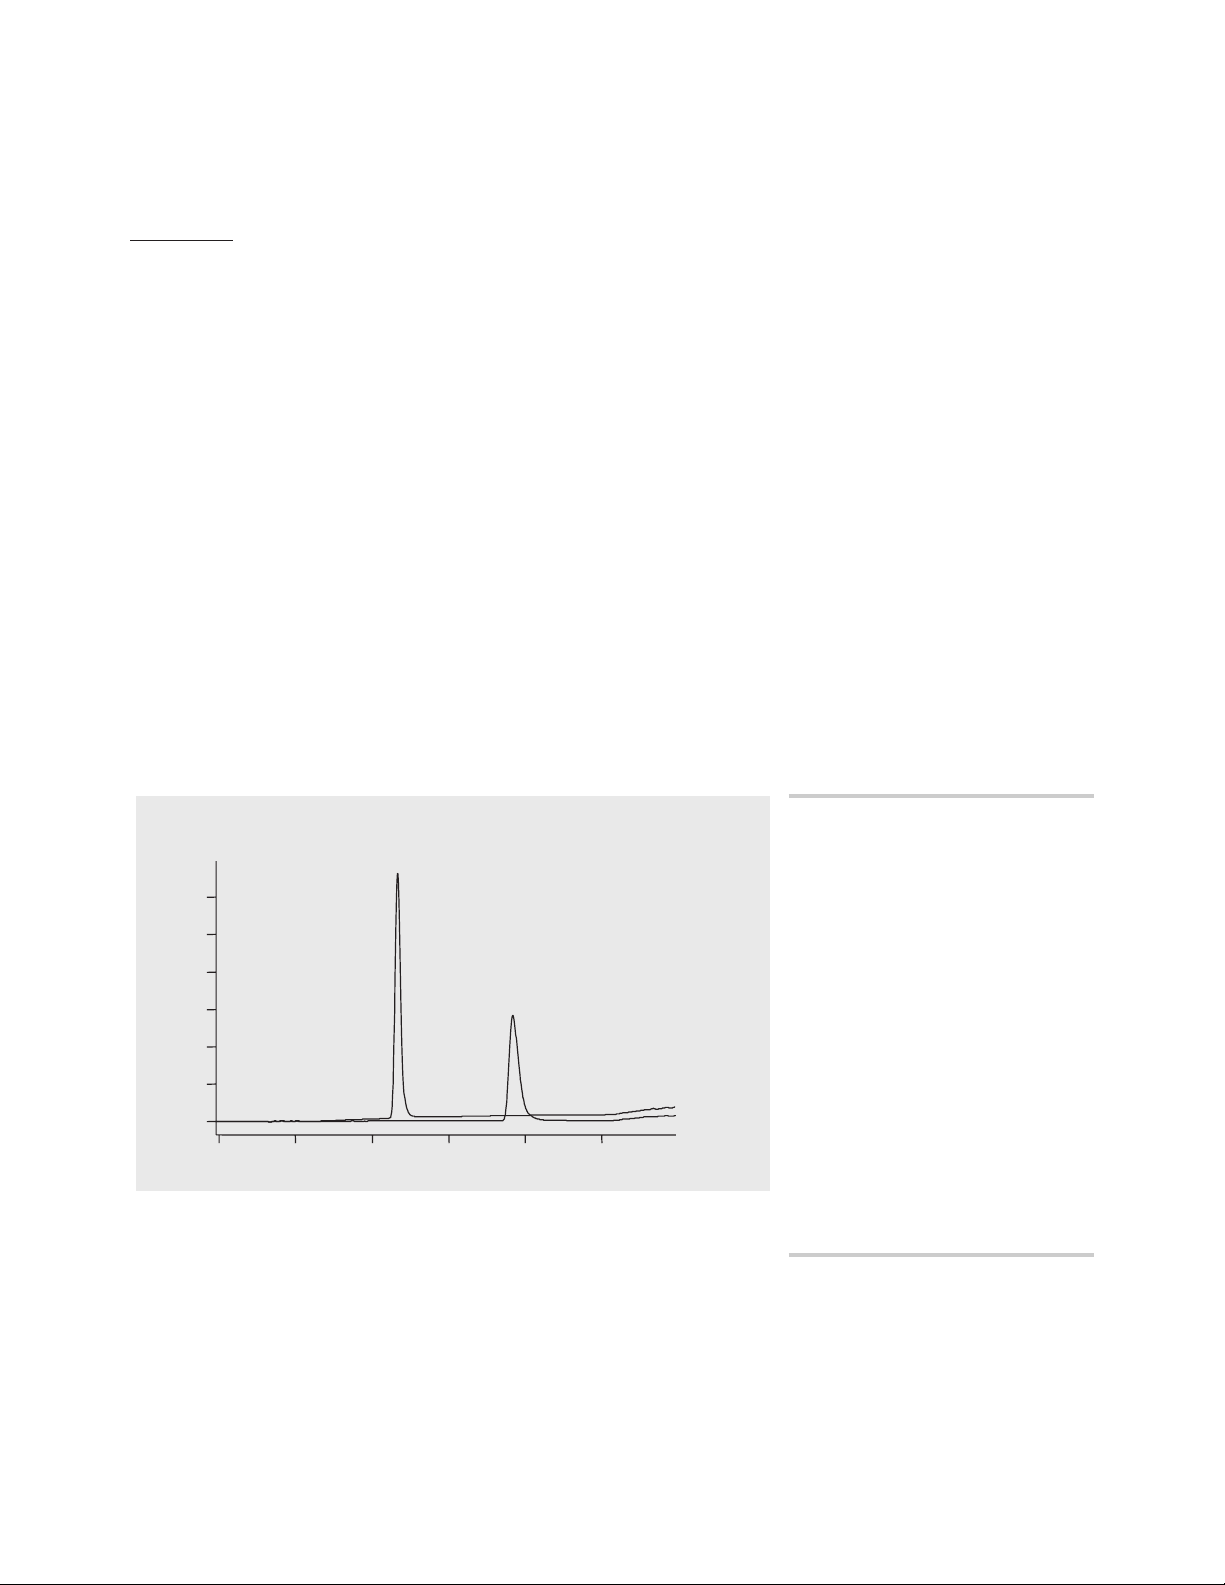
2. Standards for both compounds
were measured, the method
was calibrated and the run time
was extended to 20 minutes
(figure 2).
3. Three procaine samples were
dissolved in 0.025 M NaH2PO
4,
buffer adjusted to pH=10.
These samples were measured
with the method described
before, which gives an overall
run time of one hour for the
three samples.
4. The measurement was repeated
24 times to give an overall
study run time of 24 hours.
5. The measured data was automatically transferred to the
ChemStation Plus database
module were the Charts
amount against reaction time
was created.
6. To determne the rate coefficient
the data was then automatically
transferred to Microsoft Excel.
Time [min]
012345
Absorbance
[mAU]
0
50
100
150
200
250
300
PABA
Procaine
Mobile Phases: A= 0.025M NaH2PO4in
water (pH=2.5), B = ACN
Gradient: 5 % B for 3.5 min,
flow 1 ml/min
5 % B to 50 % B in 1.5 min,
flow 1 ml/min
50 % B for 0.5 min,
flow 1 ml/min
50 % B to 5 % B in 0.5 min,
flow 1 ml/min
5 % B, flow from 1 ml/min to
0.1 ml/min in 0.1 min
5 % B,
flow 0.1 ml/min for 18.9 min
5 % B, flow 0.1 ml/min to
1 ml/min in 0.1 min
5 % B for 0.9 min,
flow 1 ml/min
Stop time: 20 min
Column: Zorbax SB-C18, 4.6 x 75 mm,
5 µm
Column temp.: 50 ºC
UV detector: DAD 204 nm/16
(reference 360 nm/100)
Figure 2
Measurement of standards

Results and Discussion
Method calibration
A three-level calibration was done
after measuring standards for procaine and PABA using the method
in figure 2.
Study setup and sample
measurement
The method above was renamed
four times and set up in the Study
Parameters screen. Injection
ordered by method was selected
and three samples were set up, as
shown in figure 3. Since every
method runs for about 20 minutes,
each of the three samples was
analyzed every hour. To measure
the samples over 24 hours the
study was repeated six times. This
was set up in the Start Study window.
The study was started and the
measured sample data was automatically transferred to a ChemStation Plus database study, which
was set up before.
Figure 3
Study setup

ChemStation Plus database
results and charts
The study results were loaded into
the ChemStation Plus database
module and Sample Name, Injec-
tion Time and Amount were dis-
played in Compound view. By
selecting procaine and/or PABA in
the Compound List the results
were displayed in a comprehensible table (Table Layout). The
results for a specific sample were
displayed using a Filter on the
field Sample Name. The reaction
is first order, as can be clearly
seen in the chart shown in
figure 4, which was created in the
Chart Layout view of the ChemStation database module.
0
20
40
60
80
100
120
Thu 12:00
Thu 15:00
Thu 18:00
Thu 21:00
Fri 00:00
Fri 03:00
Fri 06:00
Fri 09:00
Fri 12:00
Amount [mg/l]
Injection Time
Amount / Injected [PABA]
Amount / Injected [Procaine]
Figure 4
Saponification of procaine: Amount against reaction time

Determination of the rate
coefficient by exporting the
data to Microsoft Excel
The table created for procaine
containing the fields Sample
Name, Injection Time and
Amount in the ChemStation Plus
database module was filtered for
one sample and transferred to a
Microsoft Excel file. This was
done using the Export function of
the ChemStation Plus database
module by selecting Data and MS
Excel in the Export window. In
Microsoft Excel the injection time
difference was calculated in seconds beginning at the first injection at t0. The calculated value
gives the x-axis of figure 5.
The y-axis is calculated as
ln([Ester]t/[Ester]0). The negative
value of the rate coefficient is the
slope of the resulting straight line
(figure 5). The calculated results
for the first seven injections are
shown in table 1.
Sample injected (X) Time difference Time difference Procaine amount (Y) [Ester]
t
[hh:mm:ss] [s] [mg/l] [Ester]
0
2/3/00 11:02:59 AM = t
0
129.838290062179 = [Ester]0
2/3/00 12:06:45 PM 1:03:46 3826.00 125.14649513062 -0.036804741
2/3/00 1:10:30 PM 2:07:31 7651.00 120.783350276534 -0.072291306
2/3/00 2:14:27 PM 3:11:28 11488.00 116.502232323668 -0.108379319
2/3/00 3:18:14 PM 4:15:15 15315.00 112.19641294469 -0.146038731
2/3/00 4:22:05 PM 5:19:06 19146.00 108.006644852136 -0.184097002
2/3/00 5:25:56 PM 6:22:57 22977.00 104.201332127358 -0.21996484
Figure 5
Determination of rate coefficient
Table 1
Calculated results
ln
0 20000 40000 60000 80000 100000
0
-0.2
-0.4
ln ([E]t\[E]0)
-0.6
-0.8
-1
y = -0.0000099x + 0.0081439
R2 = 0.9996792
k = 9.9E-6
Time [s]

Conclusion
In this application note a kinetic
measurement for the saponification of procaine at pH=10 was performed and analyzed using the
Agilent 220 MPS, the Agilent 1100
Series LC system and the Agilent
ChemStation Plus. The progress of
the reaction was monitored in the
ChemStation Plus database module and the data was transferred
further to Microsoft Excel for calculation of the rate coefficient.
The transfer was done automatically. It was not necessary to
transfer the data manually, which
would have been a slow, tedious
and error-prone process.

Copyright © 2000 Agilent Technologies
All Rights Reserved. Reproduction, adaptation
or translation without prior written permission
is prohibited, except as allowed under the
copyright laws.
Printed 07/2000
Publication Number 5980-1661E
Udo Huber is an application
chemist based at Agilent
Technologies, Waldbronn,
Germany
For more information on our products and services, visit our website at:
http://www.agilent.com/chem
Microsoft and Excel are registered trademarks
of Microsoft Corporation.
 Loading...