

Page 1

T
oday’s wireless communications market,
from cellular phones to wireless data, is
expanding at an incredible rate. Along
with this growth comes an increasing need for
test equipment that verifies the performance
of these devices and systems. Signal generators play a multifaceted role in the development of both receivers and transmitters. They
are used for generating signals ranging from
simple sinusoidal tones for LO substitution to
fully modulated signals
for receiver testing.
This article focuses on
the importance of using a signal generator
with relatively high
spectral purity for RF
communications testing. The ideal signal
generator would provide perfect sinusoids
at carrier and sideband
frequencies, but in reality all signals have
imperfections. The
foresight to take these
flaws into account allows the engineer to select the appropriate signal generator and reduce development time.
WHAT IS SPECTRAL PURITY?
Spectral purity is the inherent frequency stability of a signal. Stability is defined over a period of time: short or long term. Long-term stability, or drift, is usually defined as frequency
changes over a period of time greater than one
second. Short-term stability is defined as fre-
quency changes over less than one second.
Current signal generator technology generally
offers good long- and short-term stability. For
wireless communications testing, short-term
stability is of greater concern. This article discusses key spectral purity components and the
importance of spectral purity in testing wireless
communications equipment. Implications of
spectral purity are briefly covered for LO substitution, phase noise measurements, receiver
performance tests and radar applications.
Phase Noise
Perhaps the most common method for
specifying the spectral purity of a signal generator is its phase noise. In the time domain,
phase noise is exhibited as a jitter in the zero
crossings of a sine wave, as shown in Figure 1.
For a high performance signal generator, the
phase noise is not usually discernible in the
time domain. In the frequency domain, the
phase noise appears as noise sidebands on the
SIGNAL GENERATOR
SPECTRAL PURITY
CONSIDERATIONS IN RF
COMMUNICATIONS TESTING
TUTORIAL
BRIAN CHENG
Hewlett-Packard Co.,
Microwave Instruments Division
Santa Rosa, CA
“...in reality all signals have
imperfections. The foresight
to take these flaws into
account allows the engineer
to select the appropriate
signal generator and reduce
development time.”
▲Fig. 1 Time domain phase noise jitter.
PHASE NOISE
V (t)
TIME (t)
Page 2

carrier, as shown in Figure 2. The
US National Bureau of Standards defines single-sideband (SSB) phase
noise +(f) as the ratio of the noise
power in a 1 Hz bandwidth at a frequency f away from the carrier to the
signal power of the carrier:
+(f) is expressed as decibels relative
to the carrier per hertz (dBc/Hz). A 1
Hz bandwidth is used to allow the
phase noise in other bandwidths to be
easily calculated for comparison.
The SSB phase noise at a specified
carrier frequency is often graphically
represented on a log-log plot, as
shown in Figure 3. Phase noise can
be conveniently displayed for a wide
range of frequency offsets by using a
log scale on the frequency axis.
+(f) =
noise power in a 1 Hz
bandwidth at a frequency
f (Hz) away from the carrier
power level of the carrier
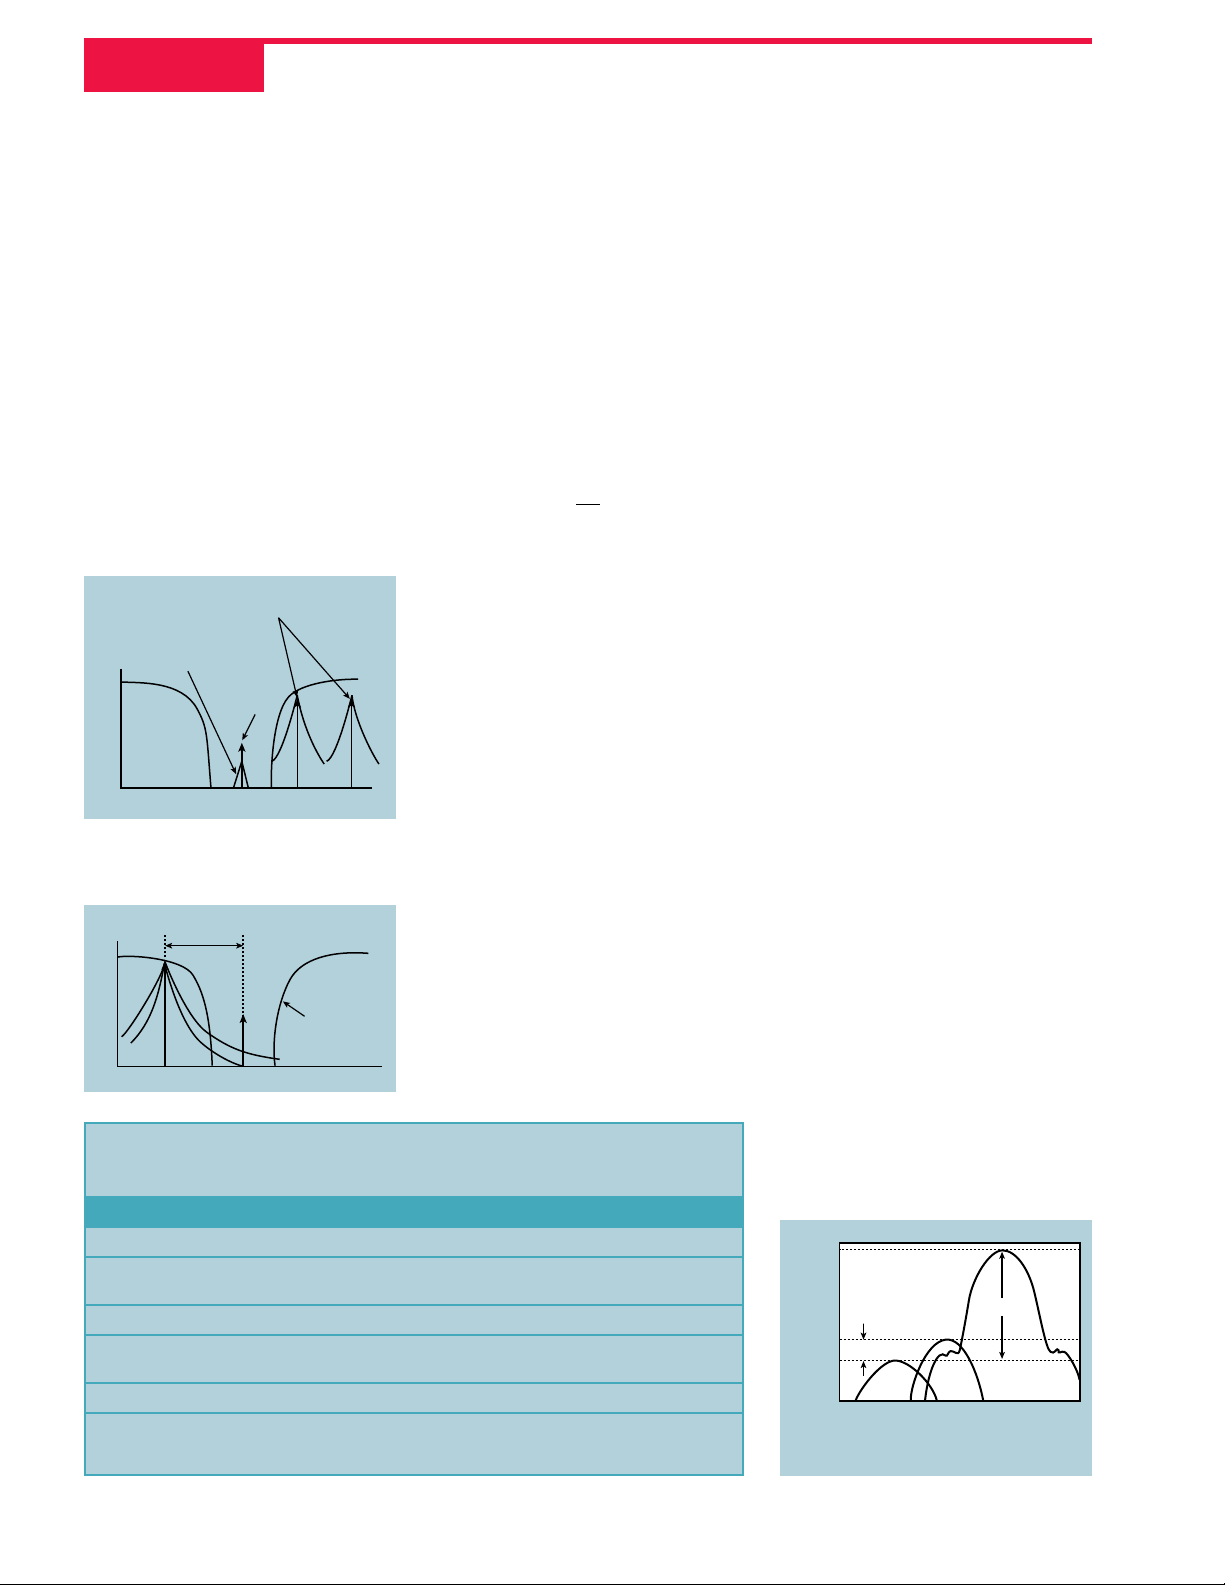
Spurious: Harmonics,
Subharmonics and Nonharmonics
Spurious signals are frequency
spikes that appear in the spectrum.
These spectral components may be
divided into three categories: harmonic, subharmonic and nonharmonic, as shown in Figure 4.
Harmonics are generated by device nonlinearities in the signal generator and are integer multiples of
the carrier frequency. For example, a
100 MHz carrier frequency will have
harmonics at 200 MHz, 300 MHz
and so on. The amplitudes of the harmonics (relative to the amplitude of
the carrier signal) are determined by
the nonlinear characteristics of the
components in the signal generator.
Subharmonics are generated when
frequency multiplying to create the
carrier frequency. The frequency being multiplied may leak through the
signal path and appear at the output.
For example, a 500 MHz signal multiplied by two to arrive at a 1 GHz
carrier frequency might appear as a
subharmonic.
Nonharmonics are frequency components that do not appear related to
the carrier frequency. Although signal
generator designers can determine
the location of these spurious signals,
they are unpredictable to the user.
Today’s signal generators are able to
suppress harmonics, subharmonics
and nonharmonics to a level acceptable for most applications.
Residual FM
Residual FM is another method
commonly used to specify the frequency stability of signal generators.
Residual FM includes the effects of
both spurious signals and phase
noise. It is the integral of the SSB
curve with limits set by the post-detection bandwidth. Common bandwidths are 300 Hz to 3 kHz and 20
Hz to 15 kHz.
SPECTRAL PURITY
CONSIDERATIONS
IN RF RECEIVER DESIGN
A spectrally pure signal generator
provides high value to those designing and verifying analog and digital
communications devices. As an example, a simple communications receiver, shown in Figure 5, is used to illustrate the effects of phase noise and
spurious signals on practical applications and measurements. Three major applications discussed here are
LO substitution, phase noise measurements and receiver performance
tests. All of these applications require
the use of a signal generator with sufficient spectral purity.
LO Substitution
In receiver development, as well
as transmitter development, a spectrally clean LO is required for upconversion and downconversion of signals. A signal generator is often used
to substitute an onboard LO for testing and system troubleshooting.
Looking at the downconversion in the
receiver, the importance of spectral
purity for LO substitution is readily
apparent. Suppose that two signals
are present at the input of the receiver, as shown in Figure 6. These signals are mixed with an LO signal
down to an intermediate frequency
(IF) where highly selective IF filters
separate one of the signals for amplification, detection and baseband processing. If the desired signal is the
larger signal, there is no difficulty in
recovering it.
On the other hand, a problem
might arise if the desired signal is the
smaller of the two because any phase
noise on the LO signal is translated
directly to the mixer products. Notice
that the translated noise in the mixer
output completely masks the smaller
signal. Even though the receiver’s IF
filtering might be sufficient to re-
TUTORIAL
▲ Fig. 2 A frequency carrier (a) without
and (b) with phase noise sidebands.
▼
Fig. 3 A typical phase noise plot.
▲
Fig. 4 Harmonic, subharmonic
and nonharmonic signals.
▼
Fig. 5 A simple communications receiver.
AMPLITUDE
f
0
(a)
(b)
FREQUENCY
AMPLITUDE
f
FREQUENCY
+(f)
FREQUENCY OFFSET FROM CARRIER (f)
SUB-
HARMONICS
AMPLITUDE
0.5 f
0
CW OUTPUT
PHASE
NOISE
f
0
FREQUENCY
HARMONIC
SPUR
NON-
HARMONIC
SPUR
2 f
0
RF
MIXERLOFILTER
0
PRESELECTOR
AMLIFIER
A/D TO DSP
Page 3

move the larger signal’s mixing product, the smaller signal’s mixing product is no longer recoverable due to
the translated LO noise.
Phase Noise Measurements
Eventually, the signal generator
that is substituting as the LO must be
replaced by the actual LO. The phase
noise of this onboard oscillator must
be measured to ensure a quality signal. In this case, a low phase noise
signal generator can be used to make
the measurement.
Many methods exist to measure
phase noise. One of the most sensitive measurement techniques is the
two-source phase detector technique.
Here, the signal under test is downconverted to 0 Hz and examined on a
low frequency spectrum analyzer. A
low noise LO is required as the phase
detector reference. The basic measurement setup for measuring
phase noise using the two-source
technique is shown in Figure 7.
The noise measured by this twosource technique represents the combined noise of both the source under
test and the reference source. This level is the upper limit for the phase noise
of either device. Therefore, if the
phase noise of the reference is better
than the source under test, the phase
noise of the source under test can be
determined.
Receiver Performance Tests
After the design of the receiver is
complete, various tests must be performed to confirm design parameters.
The primary goal of most receiver
tests is to measure
the receiver’s ability
to maintain a certain
sensitivity level in
the presence of unwanted signals.
Receiver performance verification
tests may be divided
into in-channel and
out-of-channel
tests. Common inchannel tests include sensitivity and
co-channel rejection. Common outof-channel tests are spurious and intermodulation rejection, and adjacent-channel selectivity. All of these
tests, except for sensitivity, require a
modulated or unmodulated interfering signal with allowable uncertainties, phase noise and spurious content
as defined in the communications
standard. Figure 8 shows the test
setup for co-channel or out-of-channel rejection measurements.
For analog receivers, sensitivity is
defined as the minimum power level
at which the receiver can successfully
detect and demodulate the incoming
signal. For digital receivers, sensitivity
is defined as the median level of the
received signal that produces a specified bit error rate when the signal is
modulated with a pseudorandom binary sequence of data. The important
specification of the signal generator
for sensitivity tests is power level accuracy (rather than spectral purity).
Co-channel rejection is the ability
of the receiver to maintain sensitivity
in the presence of an in-channel interfering signal. Frequently, this cochannel interfering signal will be a
continuous-wave (CW) signal, as
shown in Figure 9. The specific communications standard defining this
test will set phase noise and spurious
signal requirements for the CW tone.
Spurious immunity is a measure of
the ability of the receiver to receive a
modulated input signal in the presence of unwanted input signals at frequencies other than those specified
for adjacent- and alternate-channel
tests. The specific communications
standard defines the spurious signal
frequency location and tolerable
phase noise level.
Intermodulation rejection is a
measure of the capability of the receiver to receive a wanted modulated
signal without exceeding a given
degradation due to the presence of
two or more unwanted signals with a
TUTORIAL
▲ Fig. 6 Phase noise effects at the mixer;
the (a) RF input, (b) LO
and (c) mixer output spectra.
▲ Fig. 7 Basic measurement setup for the two-source
phase detector technique.
▲ Fig. 8 The test setup for co-channel or out-of-channel rejection measurements.
▲ Fig. 9 Co-channel rejection.
(a)
AMPLITUDE
FREQUENCY
f
f
1
2
AMPLITUDE
f
LO
(b)
FREQUENCY
(c)
AMPLITUDE
f1−fLOf2−f
FREQUENCY
LO
SOURCE
UNDER
DOUBLE-
BALANCED
MIXER
LOW NOISE
REFERENCE
SOURCE
TEST
OSCILLOSCOPE
LOWPASS
FILTER
LOW NOISE
AMPLIFIER
IN-CHANNEL SIGNAL
(MODULATED SIGNAL)
OUT-OF-CHANNEL SIGNAL
(CW OR MODULATED SIGNAL)
LOW
FREQUENCY
SPECTRUM
ANALYZER
AUDIO
SIGNAL
OR
DATA
CO-CHANNEL
INTERFERER
LEVEL (dB)
DESIRED
SIGNAL
FREQUENCY
IF REJECTION
CURVE
SSB PHASE
NOISE
Page 4
specific frequency relationship to the
wanted signal frequency. Typically,
two out-of-channel CW tones are
placed so that their third-order intermodulation distortion product falls on
top of the desired signal, as shown in
Figure 10. Intermodulation rejection
measures how well the receiver rejects this unwanted distortion.
Adjacent-channel selectivity measures a communications receiver’s
ability to process a desired signal
while rejecting a strong signal in an
adjacent channel. Alternate-channel
selectivity is a similar test where the
interfering signal is spaced two RF
channels away from the passband of
the receiver. These tests are very important for both analog and digital
units where channel spacings are nar-
row and many signals may be encountered in a small geographical area.
PHASE NOISE REQUIREMENTS
FOR ADJACENT-CHANNEL
SELECTIVITY
For many receivers, the SSB phase
noise of the signal generator used to
produce the interfering signal is a
critical spectral characteristic. If the
phase noise energy inside the passband of the IF filter is excessive, the
receiver might appear to fail the test.
This case is shown in Figure 11.
The required signal generator SSB
phase noise may be calculated using
where
Φn= signal generator SSB phase
noise (dBc/Hz) at the channel
spacing offset
Be= receiver noise-equivalent
bandwidth (Hz)
Pac= adjacent- or alternate-channel
selectivity specification (dB)
P
mar
= test margin (dB)
Since Beand Pacare fixed by the
specifications or design, the test margin determines the power that the
signal generator phase noise is allowed to contribute to the IF passband of the receiver. A large test margin increases confidence that the receiver operates properly in the
presence of signal-to-noise degradation due to fading in the channel or
imperfections in receiver components. For a system using a new technology or new operating frequencies,
a large test margin should be used to
compensate for uncertainties.
Φ
n
e
ac mar
B
P P=
101log – –
For a receiver with a noise-equivalent bandwidth of 14 kHz, Pacat the
adjacent channel of 70 dB, margin of
10 dB and channel spacing of 25 kHz,
the required SSB phase noise is –121
dBc/Hz at 25 kHz offset. This condition is typical for an analog FM receiver. Unlike the FM receiver in this
example, most digital communications receivers have adjacent-channel
selectivity values less than 15 dB. For
a GSM receiver with a noise-equivalent bandwidth of 200 kHz, a Pacat
the adjacent channel of 9 dB, margin
of 10 dB and channel spacing of 200
kHz, the required SSB phase noise is
–72 dBc/Hz at 200 kHz offset. The
required SSB phase noise is driven
primarily by Pac.
Table 1 lists the values of adjacent- and alternate-channel selectivity for various communications systems as well as the required signal
generator SSB phase noise. A 10 dB
test margin was used. Clearly, for adjacent- and alternate-channel selectivity testing on many digital RF communications formats, the signal generator SSB phase noise is not as
important as for analog FM systems.
For selectivity tests, the spectral
shape of the signal is the characteristic of primary importance. The digital
modulation formats used by GSM,
CDMA, North American Digital Cellular (NADC) and personal digital
cellular (PDC) characteristically leak
a small amount of power into the adjacent channels. Figures 12, 13 and
14 show amplitude vs. frequency for
the selectivity values specified previously. The impact of the spectral
shape on the adjacent and alternate
channels of the receiver is evident. To
properly test a digital radio receiver,
the adjacent-channel power of a signal generator must be below the re-
TUTORIAL
▲ Fig. 10 Intermodulation rejection.
Fig. 11 Phase noise in adjacent-channel
selectivity.
▼
TABLE I
MAXIMUM TOLERABLE SSB PHASE NOISE
Analog FM GSM NADC PDC
Channel spacing (kHz) 25 200 30 25
Approximate receiver noise
14 200 35 33
bandwidth (kHz)
Adjacent-channel selectivity (dB) 70 9 13 1
Maximum SSB phase noise –121 –72 –68 –56
at offset (dBc/Hz) at 25 kHz at 200 kHz at 30 kHz at 25 kHz
Alternate-channel selectivity (dB) – 41 42 42
Maximum SSB phase noise
–
–104 –97 –97
at offset (dBc/Hz) at 400 kHz at 60 kHz at 50 kHz
Fig. 12 A GSM adjacent- and alternatechannel selectivity spectrum.
▼
OUT-OF-CHANNEL
CW TONES
THIRD-ORDER
INTERMODULATION
DISTORTION
DESIRED
SIGNAL
LEVEL (dB)
FREQUENCY
CHANNEL
SPACING
LEVEL (dB)
FREQUENCY
IF REJECTION
CURVE
−44
−76
9 dB
−85
AMPLITUDE (dBm)
f
OFFSET FROM NOMINAL CENTER
41 dB
+200 +400
C
FREQUENCY (kHz)
Page 5

quired system specification plus the
desired test margin.
RADAR
Radar applications have traditionally required spectrally clean signal
generators. Doppler radars determine the velocity of a target by measuring the small Doppler shifts in frequency undergone by the return
echoes. Return echoes of targets approaching the radar are shifted higher in frequency than the transmitted
carrier, while return echoes of targets
moving away from the radar are shifted lower in frequency. Unfortunately,
the return signal includes much more
than just the target echo. In the case
of airborne radar, the return echo
also includes a large clutter signal
that is basically unavoidable frequency-shifted echoes from the ground.
Figure 15 shows the typical return frequency spectrum of airborne
pulsed-Doppler radar. In some situations, the ratio of main-beam clutter
to target signal might be as high as 80
dB. This problem is aggravated when
the received spectrum has frequency
instabilities, specifically phase noise,
caused by either the transmitter oscillator or the receiver LO. Such phase
noise on the clutter signal can partially or totally mask the target signal,
depending on the relative level of the
target signal and its frequency separation from the clutter signal.
CONCLUSION
As the wireless communications
revolution moves forward and the
frequency spectrum becomes increasingly crowded, the bandwidth
requirements for signals become
tighter and tighter. Systems must be
designed such that only the desired
signal is detected in the presence of
adjacent-channel signals and other
channel interference. More stringent
tests on communications devices
must be passed. At the same time,
test equipment must also meet these
strict requirements. A spectrally pure
signal generator complements the
other test equipment on a development engineer’s bench and is highly
valued for applications such as LO
substitution and receiver testing. ■
Reference
1. “Testing and Troubleshooting Digital RF
Communications Receiver Designs,”
Hewlett-Packard Application Note 1314
(Literature # 5968-3579E).
Brian Cheng received his BSEE from the
University of California at Berkeley in May
1998. He works at Hewlett-Packard Co. in the
Microwave Instruments Division as an
applications engineer where he supports the
company’s RF and microwave sources.
TUTORIAL
▲ Fig. 14 A PDC adjacent-
and alternate-channel selectivity spectrum.
▲ Fig. 15 An airborne pulsed-Doppler
radar’s typical return frequency spectrum.
−65
▲ Fig. 13 An NADC adjacent- and
alternate-channel selectivity spectrum.
−94
−107
AMPLITUDE (dBm)
OFFSET FROM NOMINAL CENTER
13 dB
f
C
FREQUENCY (kHz)
42 dB
−100
AMPLITUDE (dBm)
+60+30
−58
1 dB
−99
f
+25
C
OFFSET FROM NOMINAL CENTER
FREQUENCY (kHz)
42 dB
+50
OPENING
TARGET
SIDELOBE
CLUTTER
AMPLITUDE
MAIN BEAM
CLUTTER
ATTITUDE
LINE
f
Transmitter carrier
FREQUENCY
LO NOISE
CLOSING
TARGET
NOISE
 Loading...