

Page 1
f
-
3B SCIENTIFIC
NMR Supplementary Set 1000642
Instruction manual
06/12 ALF
®
PHYSICS
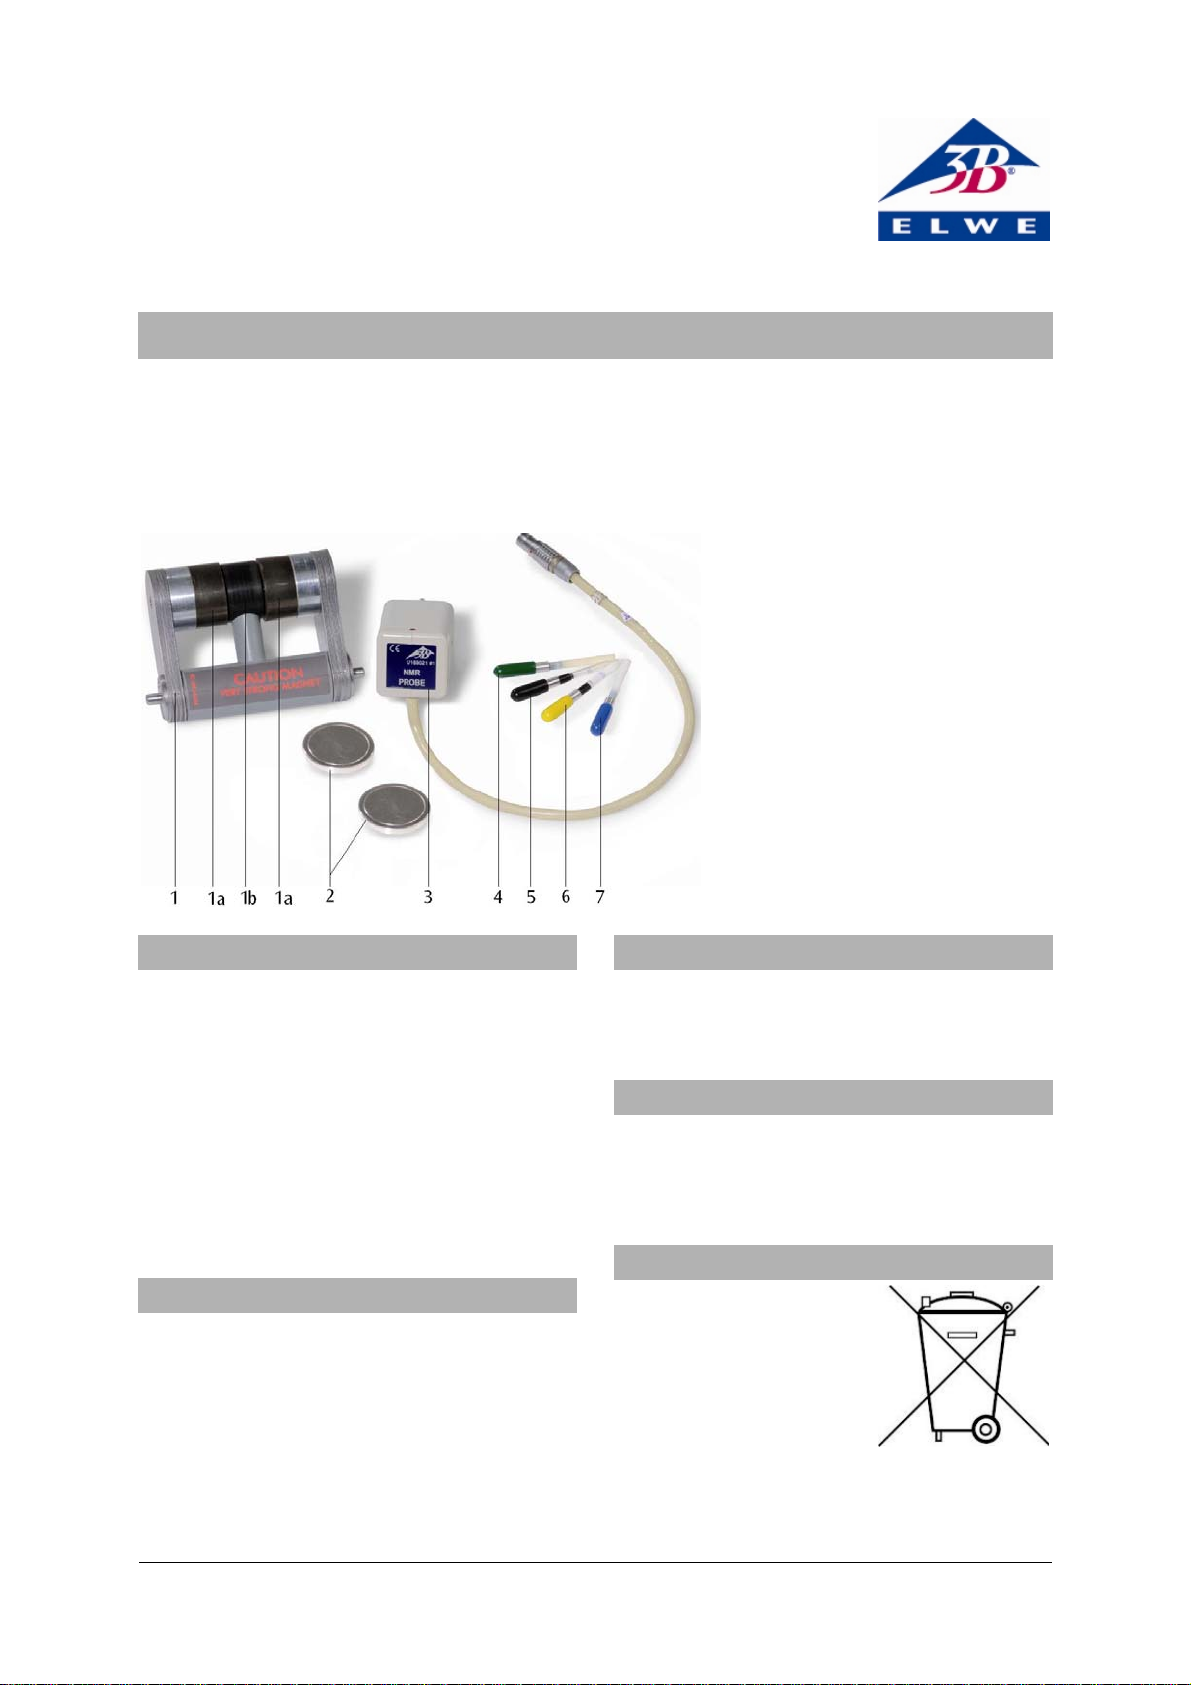
1 Magnet unit
1a Magnet
1b Yoke
2 Discs for assembly
3 NMR probe
4 Polystyrene sample
5 Comparison sample
6 Glycerine sample
7 Teflon sample
1. Safety instructions
The permanent magnets can generate considerable forces of attraction and repulsion with the
result that there is a risk of squashing or splintering.
• Be especially cautious when inserting magnets into the basic unit.
• Never use the magnets except as specified.
Magnetic fields can erase data from magnetic
media and affect or destroy electronic or mechanical components like heart pacemakers.
• People with pacemakers should not conduct
this experiment.
2. Description
The NMR supplement set is to be used with the
ESR/NMR basic set (1000637 resp. 1000638) for
investigating nuclear spin resonance in glycerine,
polystyrene and Teflon.
The set consists of an NMR probe with a highfrequency coil, a strong and uniform permanent
magnet, a glycerine sample, a polystyrene sample, a Teflon sample, an empty comparison sample and two discs for assembling the apparatus.
3. Technical data
Magnetic flux of
permanent magnets: 300 mT approx.
Frequency range: 11 − 15 MHz approx.
4. Maintenance and storage
• Remove any debris from the surfaces of the
permanent magnet poles and of the assembly discs using a cloth with some isopropanol.
• Keep permanent magnets in a dry place.
5. Disposal
• The packaging should
be disposed of at local
recycling points.
• If the equipment itsel
needs to be scrapped, it is
safe to dispose of all com
ponents other than the
probe in domestic waste.
The probe should be disposed of in containers
dedicated to the disposal of electrical refuse.
1
Page 2
6. Equipment required in addition
1 ESR/NMR basic set (230 V, 50/60 Hz) 1000638
or
1 ESR/NMR basic set (115 V, 50/60 Hz) 1000637
1 Analogue oscilloscope, 2x30 MHz 1002727
2 High-frequency cables 1002746
alternatively
1 3B NETlog™ unit (230 V, 50/60 Hz) 1000540
or
1 3B NETlog™ unit (115, 50/60 Hz) 1000539
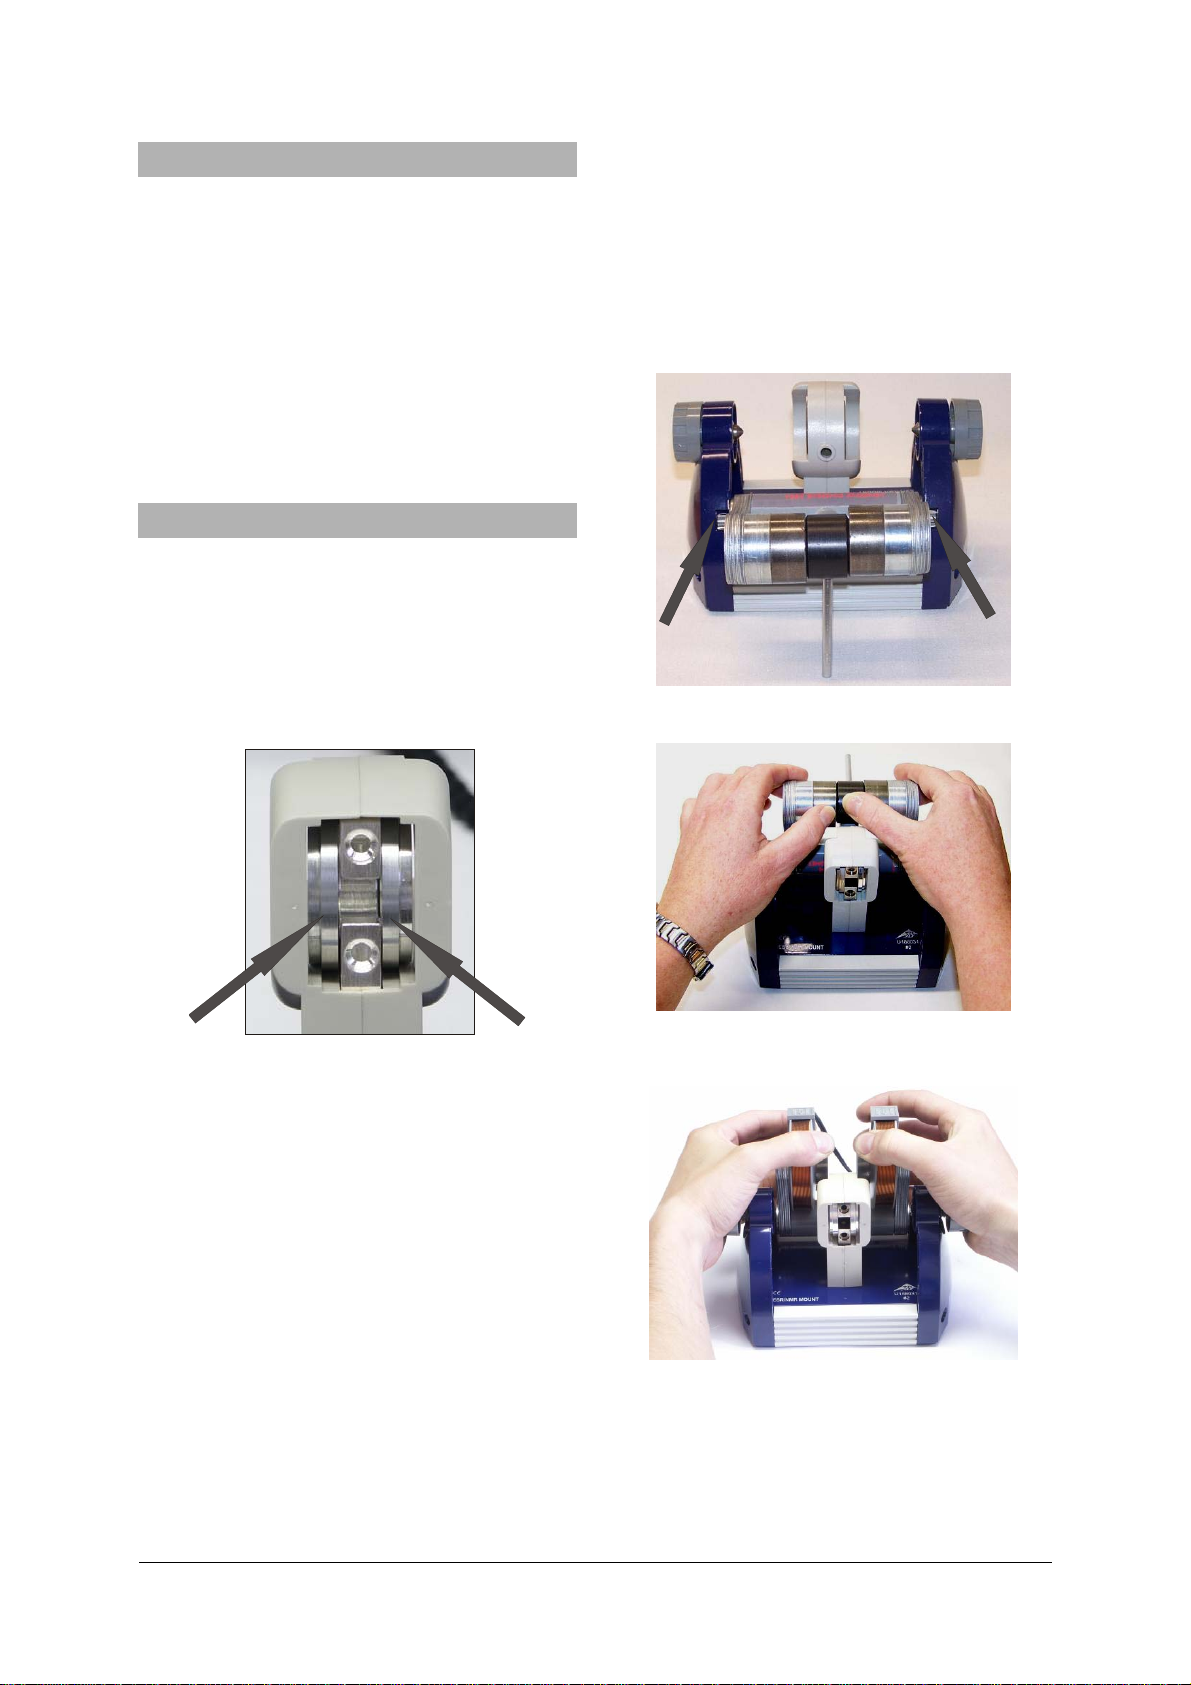
assembly discs (see Fig. 4).
• Push back the two discs with your thumbs and
pull on the coils to move the magnet supports
into their end positions (see Fig. 5).
• Tighten both knurled screws by hand at the
same time. Make sure that the magnets are
accurately aligned on top of the assembly
discs. If necessary, slot the discs all the way
back into the probe chamber and then push
the magnet supports into their end positions.
1 3B NETlab™ 1000544
2 High-frequency cables, BNC/4-mm plug 1002748
1 PC
7. Operation
7.1 Assembly of the basic unit
The discs, the pole surfaces of the magnets and
the probe chamber in the basic unit must all be
free of grease, dust and debris.
• If necessary they should be cleaned using
isopropanol.
• Insert the discs into both sides of the sample
chamber (see Fig. 1).
Fig. 2 Permanent magnet inserted into basic unit
Fig. 1 Sample chamber with assembly discs inserted
• Twist the metal rod into the yoke of the
magnet unit. Place the magnet unit in the
clip on the basic unit as shown in Fig. 2.
• Take the magnet unit in both hands and push
the yoke downwards with your thumbs (see
Fig. 3).
• Push the coils over the magnets, making
sure the direction if the windings is the
same. The embossed arrows on the coils
must point in the same direction.
• Clean any grit or metal shavings off the two
magnets with a cloth.
• Move the completed magnetic unit onto the
assembly discs, making sure to carry out the
steps that follow: (see Fig. 4).
• Separate the two coils with your hands, pulling them outwards to increase the gap between them. You can rest your hands on the
knurled screws while doing this. Push the
magnets about a quarter of the way onto the
Fig. 3 Removing the yoke from the permanent magnet
Fig. 4 Pulling the two permanent magnets apart
2
Page 3

Fig. 5 Pulling the magnets onto the assembly discs
7.2 Connection to control console
• Insert the probe into the sample chamber in
such a way that it rests on the housing (see
Fig. 8).
• Connect the cable for the probe to the
“Probe In” socket of the control console, taking note of the socket's slot.
• Connect the coils to the “Coil” sockets on
the back of the control console.
• Connect the control console to its power
supply via the “12 VAC/1A“ socket.
Fig. 6 Basic unit completed with permanent magnets
and coils
7.1.1 Removing magnet unit
• Take the sample out of the sample chamber
in the basic unit.
• Disconnect the cables between the coils and
the control console.
• Loosen the knurled screws.
• Turn the basic unit so that the magnet unit is
pointing forwards.
• Lift up the yoke till it is on top of the sample.
• Hold the yoke in place with your thumbs and
use your fingers to pull the magnet unit towards the front till the yoke is between the
two magnets. Then take the entire unit out of
the basic unit (see Fig. 7).
• Take the discs out of the sample chamber.
Fig. 7 Removing the magnet unit from the basic unit
Fig. 8 Basic unit with probe
7.3 Calibration and settings
7.3.1 Using an oscilloscope
• Connect the “SIGNAL OUT” socket of the
control console to channel 1 of the oscilloscope and the “FIELD OUT” output to channel 2 (see Fig. 12).
• Set the oscilloscope as follows:
Channel 1: 0.5 V DC
Channel 2: 0.5 V DC
Time base: 5 ms
Trigger from a falling edge on channel 1.
7.3.2 Using 3B NETlog™
• Connect the “SIGNAL OUT” socket of the
control console to input
log™ unit and “FIELD OUT” to the input
• Connect the 3B NETlog™ unit to a computer
and run the 3BNETlab
IN
U on the 3B NET-
B
U .
TM
software
IN
A
• Create a new data record from the “Measurement lab” menu and define the following
parameters:
Input A: Field, Input mode VDC, Input range 2 V
Input B: Signal, Input mode VDC, Input
range 2 V
Measurement interval: 500 µs (2 kHz)
• Set to trigger from Input A with a falling edge
and a positive trigger point at about 10 to 20%.
• Activate the “Oscilloscope” button and start
measuring.
The oscilloscope window will open.
3
Page 4

7.4 Experiment procedure
ν=ν
• Insert the glycerine sample (yellow top) into
the sample chamber (see Fig. 9).
7.5.1 Use the two knurled screws to vary the
pressure on the assembly discs and observe the
signal as you do so. It may be necessary to
tighten the two screws to differing degrees.
7.5.2 Pull the probe out some of the way (up to
5 mm) and observe the signal.
7.5.3 Slightly loosen the two knurled screws and
move the magnets about 1 to 2 mm away from
their end positions. To do this, use your thumbs
to push back the two coils while resting your
fingers on the base unit (Fig. 10). Tighten the
knurled screws while observing the peak.
Fig. 9 Basic unit with glycerine sample inserted
• Set a frequency of about 13 MHz on the
control console (since the frequency knob is
a 10-turn potentiometer, it may need to be
turned by multiple revolutions).
• Set the sensitivity to medium and adjust if
necessary.
At the optimum setting, the LED can be seen to
flicker slightly. If the LED lights up fully, the signal is overloaded.
• Carefully adjust the fine setting using the
frequency selector knob seeking out a peak
in the signal between about 1 ms to 1.5 ms
in width.
Note:
When looking for the peak, it can be helpful to
loosen the knurled screws a bit to change the
strength of the magnetic field and thus the signal. In order to optimise the signal refer to section 7.5.
• Vary the frequency to bring it to the middle
of the peak and write down what that frequency is.
• Carry out the experiment again with different
material samples.
For the polystyrene sample (green top) the frequency will be in the same range as for the
glycerine sample. For the Teflon sample (blue
top) the frequency will be lower (see Figs. 13 to
15).
Another experiment can be carried out in which
the stalk of a plant can be inserted into the sample chamber for its resonant frequency to be
determined.
7.5 Optimisation of signal
If the signal is fuzzy (width of signal > 2ms),
there are several ways it can be improved. The
basic requirement for this is that some kind of
signal, no matter how poor its quality, needs to
be obtained for the glycerine sample. The objective is to obtain a signal with a median width of 1
ms.
Fig. 10 Moving the magnets
Fig. 11 Magnet moved out of its end position
7.5.4 Slightly loosen the two knurled screws and
move the magnets about 1 to 2 mm away from
their end positions, then move them back to the
ends. In doing so, move the two discs a little
further forward. Tighten the knurled screws
while observing the peak.
7.6 Evaluation
Resonant frequencies of material samples
Glycerine (
Polystyrene (
Teflon (
Plant stalk (
1
H) 42.58 MHz/T
1
H) 42.58 MHz/T
19
F) 40.06 MHz/T
1
H) 42.58 MHz/T
The following therefore applies:
ePolystyrenGlycerine
ν
Teflon
ν
Glycerine
06.40
=
58.42
4
Page 5

Fig. 12 Experiment set-up featuring NMR unit with an oscilloscope
Fig. 13 Screenshot from 3BNETlab
TM
(Glycerine ν = 12,854 MHz)
5
Page 6

Fig. 14 Screenshot from 3BNETlab
TM
(Polystyrene ν = 12,854 MHz)
Elwe Didactic GmbH ▪ Steinfelsstr. 5 ▪ 08248 Klingenthal ▪ Germany ▪ www.elwedidactic.com
3B Scientific GmbH ▪ Rudorffweg 8 ▪ 21031 Hamburg ▪ Germany ▪ www.3bscientific.com
Fig. 15 Screenshot from 3BNETlab
Subject to technical amendments
© Copyright 2012 3B Scientific GmbH
TM
(Teflon ν = 12,100 MHz)
 Loading...