

Page 1

SL1400
ScopeCorder LITE
IM 701240-01E
4th Edition
Page 2

Product Registration
Thank you for purchasing YOKOGAWA products.
YOKOGAWA provides registered users with a variety of information and
services.
Please allow us to serve you best by completing the product registration
form accessible from our homepage.
http://tmi.yokogawa.com/
PIM 103-03E
Page 3

Notes
Thank you for purchasing the SL1400 ScopeCorder LITE.
This user’s manual contains useful information about the instrument’s functions and
operating procedures and lists the handling precautions of the SL1400. To ensure
correct use, please read this manual thoroughly before operation. After reading the
manual, keep it in a convenient location for quick reference whenever a question arises
during operation.
The following manuals are provided for the SL1400. Please read all of them.
Manual Title Manual No. Description
SL1400 ScopeCorder LITE IM 701240-01E This manual. The manual explains all the
User’s Manual SL1400 functions and procedures other than
the communication interface functions.
SL1400 ScopeCorder LITE IM 701240-02E The manual explains the basic operations of
Operation Guide the SL1400 and provides an overview of its
functions.
SL1400 ScopeCorder LITE IM 701240-17E The supplied CD contains the PDF file of this
Communication Interface manual. The manual explains the SL1400
User’s Manual communication interface functions and
instructions on how to use them.
• The contents of this manual are subject to change without prior notice as a result of
continuing improvements to the instrument’s performance and functions. The figures
given in this manual may differ from those that actually appear on your screen.
• Every effort has been made in the preparation of this manual to ensure the accuracy
of its contents. However, should you have any questions or find any errors, please
contact your nearest YOKOGAWA dealer.
• Copying or reproducing all or any part of the contents of this manual without the
permission of YOKOGAWA is strictly prohibited.
• The TCP/IP software of this product and the document concerning the TCP/IP
software have been developed/created by YOKOGAWA based on the BSD
Networking Software, Release 1 that has been licensed from the Regents of the
University of California.
Trademarks
• Microsoft, Internet Explorer, MS-DOS, Windows, Windows NT, and Windows XP are
either registered trademarks or trademarks of Microsoft Corporation in the United
States and/or other countries.
• Adobe, Acrobat, and PostScript are either registered trademarks or trademarks of
Adobe Systems Incorporated.
• Zip is either a registered trademark or trademark of Iomega Corporation in the United
States and/or other countries.
• UNIX is either a registered trademark or trademark of The Open Group in the United
States and/or other countries.
• Compact-VJE is a trademark of Yahoo Japan Corporation.
• GIGAZoom ENGINE is a registered trademark of Yokogawa Electric Corporation.
• In this manual, the ® and TM symbols do not accompany their respective registered
trademark or trademark names.
• Other company and product names are registered trademarks or trademarks of their
respective holders.
4th Edition : September 2013(YMI)
All Rights Reserved, Copyright © 2006 Yokogawa Electric Corporation
All Rights Reserved, Copyright © 2013 Yokogawa Meters & Insturments Corporation
IM 701240-01E
i
Page 4

Revisions
• 1st Edition: June 2006
• 2nd Edition: October 2006
• 3rd Edition: May 2009
• 4th Edition: September 2013
ii
IM 701240-01E
Page 5

Waste Electrical and Electronic Equipment
Waste Electrical and Electronic Equipment (WEEE), Directive 2002/96/EC
(This directive is only valid in the EU.)
This product complies with the WEEE Directive (2002/96/EC) marking
requirement. This marking indicates that you must not discard this electrical/
electronic product in domestic household waste.
Product Category
With reference to the equipment types in the WEEE directive Annex I, this
product is classified as a “Monitoring and Control instrumentation” product.
Do not dispose in domestic household waste. When disposing products in the
EU, contact your local Yokogawa Europe B. V. office.
New EU Battery Directive
New EU Battery Directive, DIRECTIVE 2006/66/EC
(This directive is valid only in the EU.)
Batteries are included in this product. This marking indicates they shall be
sorted out and collected as ordained in ANNEX II in DIRECTIVE 2006/66/EC.
Battery type
1. Lithium battery
You cannot replace batteries by yourself. When you need to replace
batteries, contact your local Yokogawa Europe B.V.office.
2. Alkaline dry cell
When you remove batteries from this product and dispose them, discard
them in accordance with domestic law concerning disposal.
Take a right action on waste batteries, because the collection system in the
EU on waste batteries are regulated.
For instructions on how to remove the battery pack, see section 7.7.
IM 701240-01E
iii
Page 6
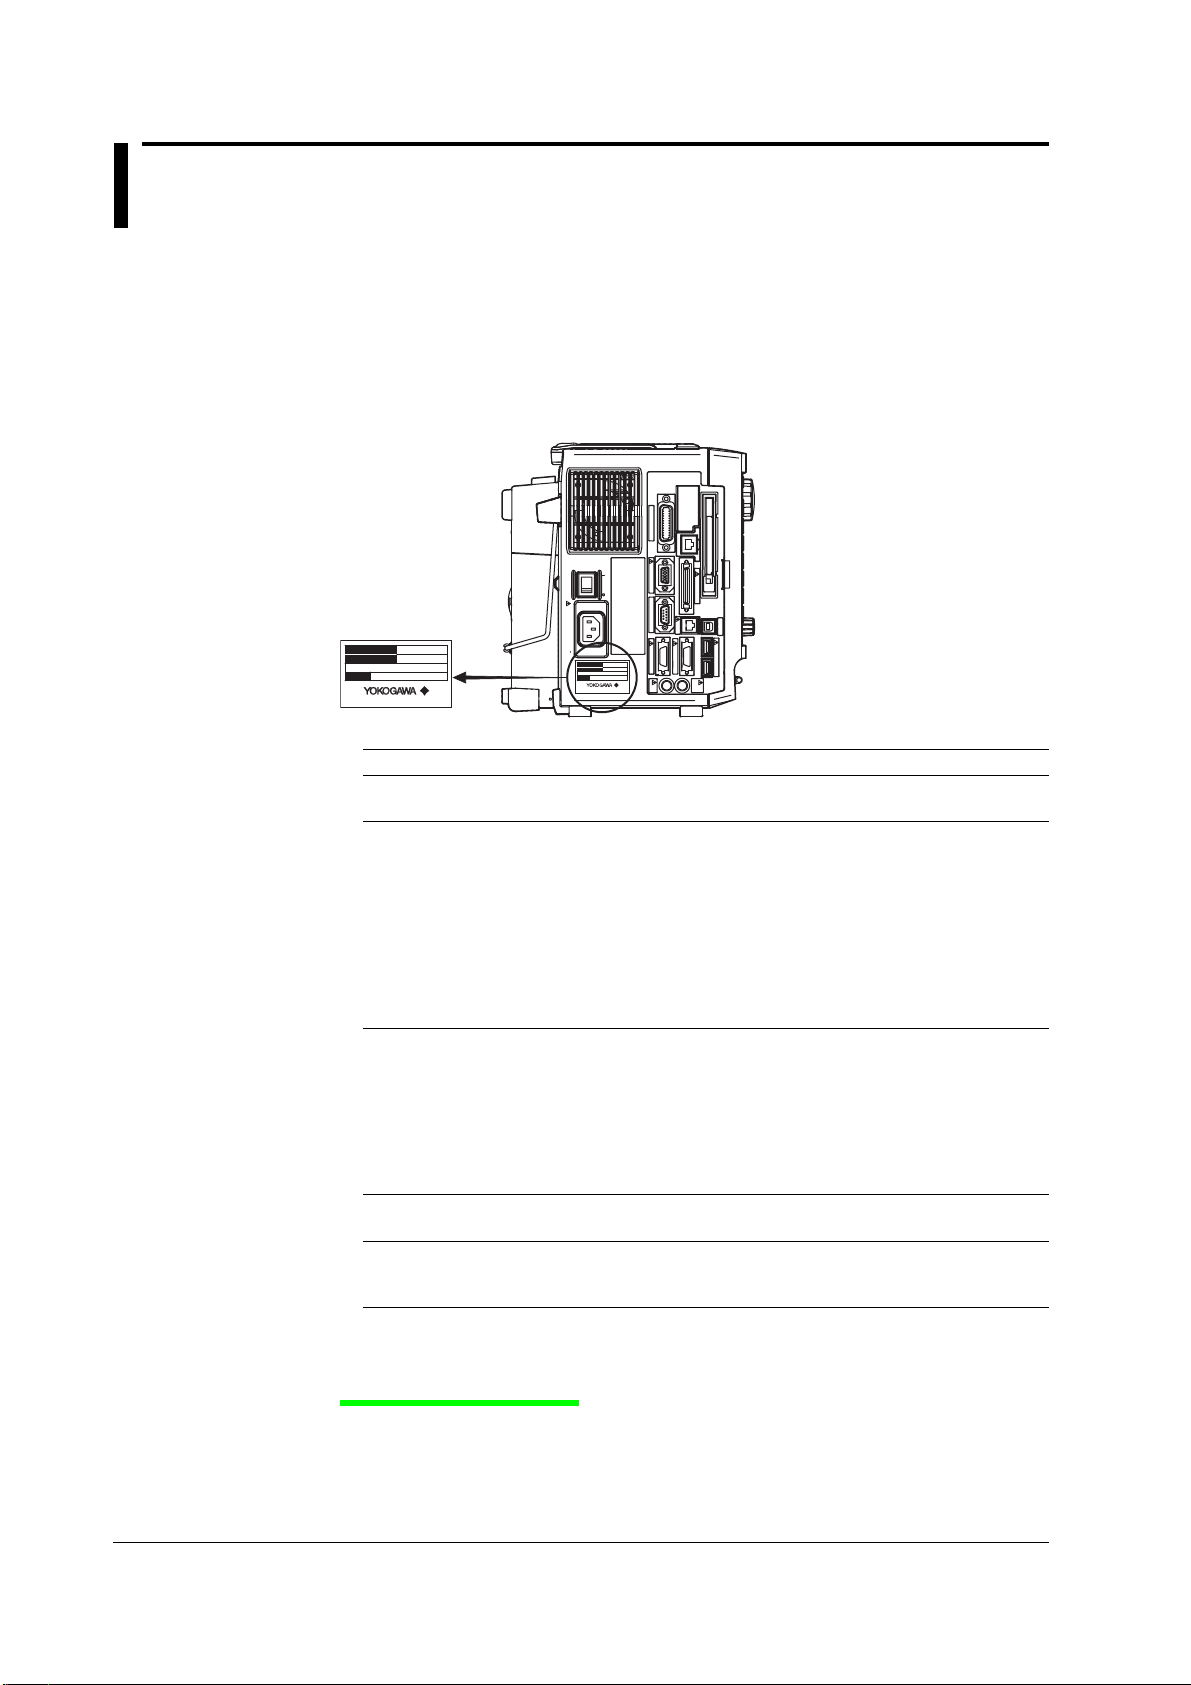
Checking the Contents of the Package
Unpack the box and check the contents before operating the instrument. If some of the
contents are not correct, or if any items are missing or damaged, contact the dealer from
whom you purchased them.
SL1400
Check that the model name and suffix code given on the name plate on the left side
panel of the SL1400 match those on your order.
GP-IB
(
IEEE488
LINK
100BASE-TX
)
ACT
VIDEO OUT
ON
POWER
(
SVGA
SCSI
)
OFF
100-120V/200-240V AC
300VA MAX 50/60Hz
MODEL
SUFFIX
NO.
Made in Japan
MODEL
SUFFIX
NO.
Made in Japan
MODEL Suffix Code Description
701240 (SL1400) The input module is not included with the instrument.
Power cord
1
-D UL/CSA Standard power cord (Part No.: A1006WD)
-F VDE Standard power cord (Part No.: A1009WD)
-Q BS Standard power cord (Part No.: A1054WD)
-R AS Standard power cord (Part No.: A1024WD)
-H GB Standard power cord (Part No.: A1064WD)
Default language -HE English
-HJ Japanese
-HC Chinese
-HK Korean
-HG German
-HF French
-HL Italian
-HP Spanish
Built-in media drive -J0 No built-in media drive
-J3 PC card drive
Options /C8 Internal hard disk 40 GB (FAT32)
1 Make sure that the attached power cord meets the designated standards of the country and
area that you are using it in.
SERIAL
(
RS-232
START/
STOP
)
LOGIC B
TRIG IN
USB
USB PERIPHERAL
LOGIC A
EXT CLK IN
TRIG OUT/
See the next page for information on the input module.
Maximum rated voltage: 125 V
Maximum rated voltage: 250 V
Maximum rated voltage: 250 V
Maximum rated voltage: 250 V
Maximum rated voltage: 250 V
/C10 Ethernet interface
/P4 Four probe power outputs
NO. (Instrument Number)
When contacting the dealer from which you purchased the instrument, please give them
this number.
iv
IM 701240-01E
Page 7
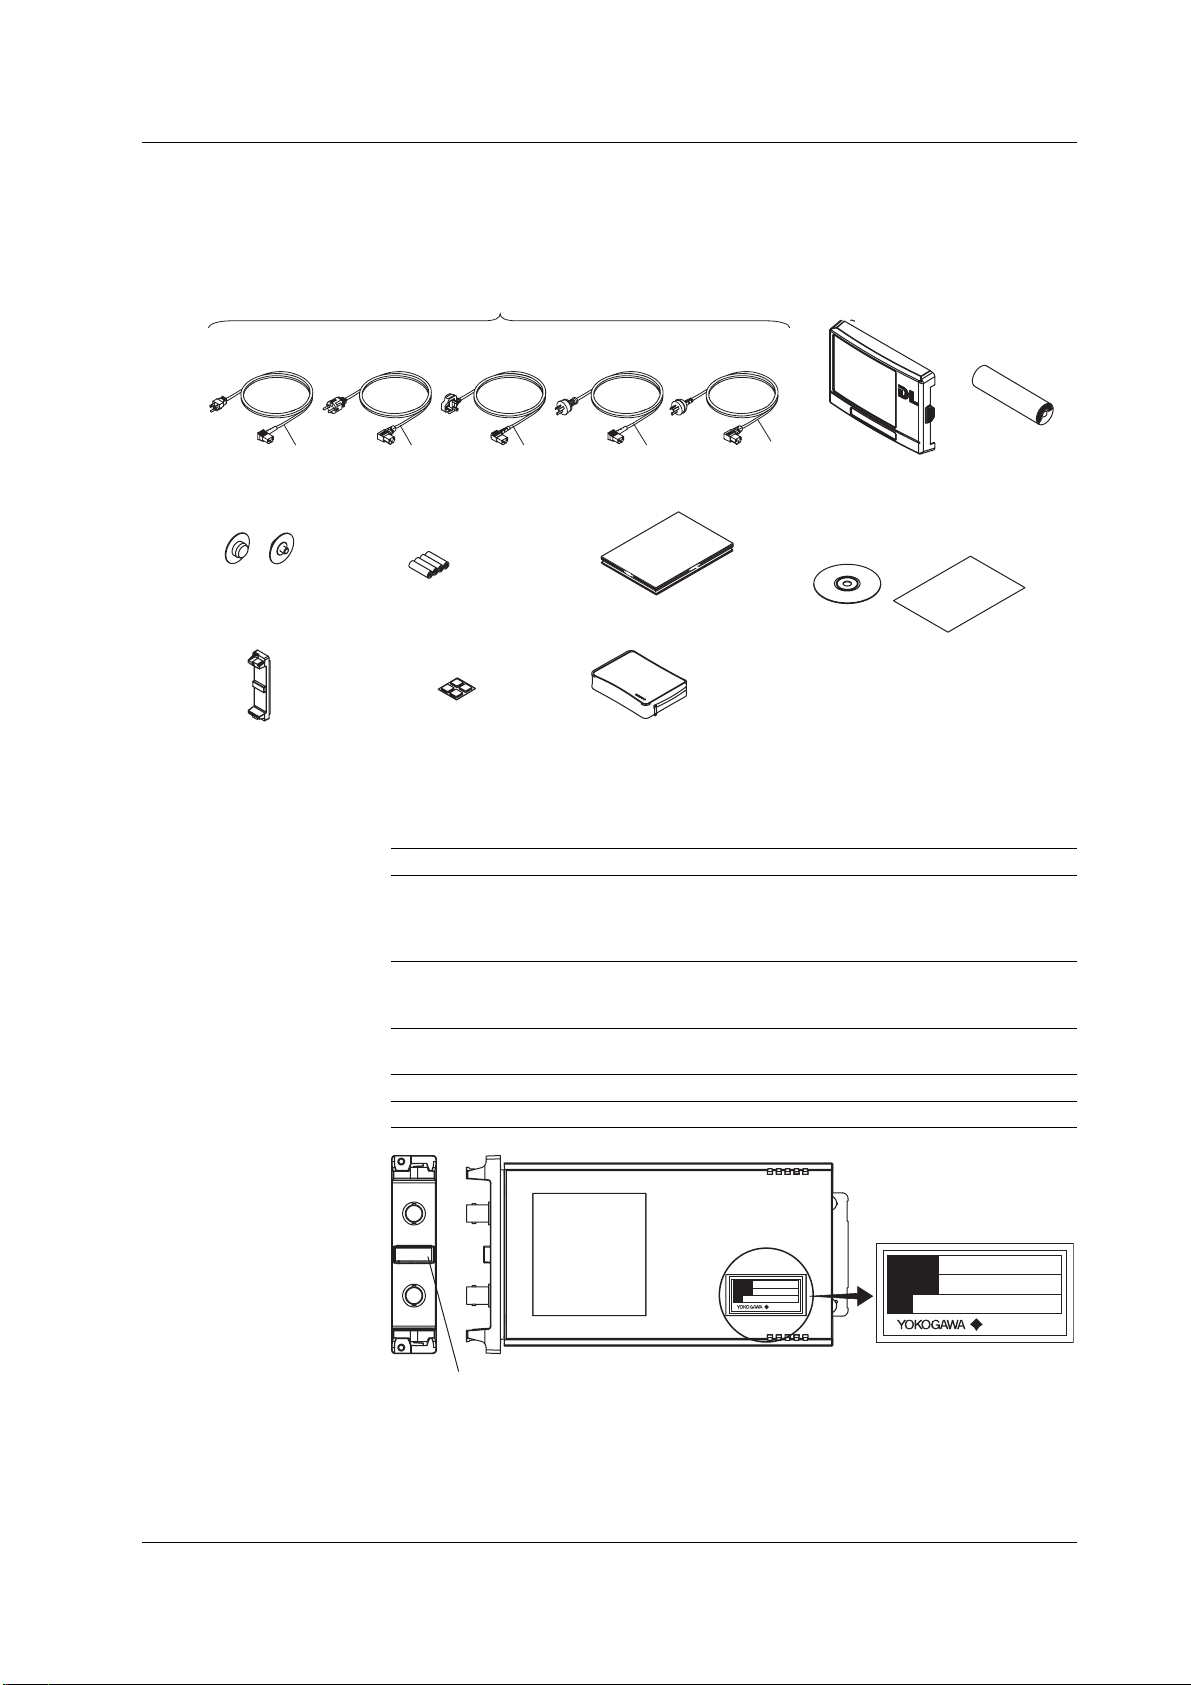
Standard Accessories
The standard accessories below are supplied with the instrument. Check that all
contents are present and undamaged.
Checking the Contents of the Package
Power Cord (one of the following power cords
is supplied according to the instrument’s suffix codes)*
UL/CSA Standard
A1006WD
VDE Standard
A1009WD
BS Standard
A1054WD
D F Q R
Roll paper flange
B8024CA 2 pieces
AAA Alkaline batteries
(for acquisition memory
backup)
A1070EB 4 cells
Cover panels
B8023EN 8 pieces
Rubber feet
B9989EX 4 pieces
(1 sheet)
* Make sure that the attached power cord meets the designated standards of the country and area
that you are using it in.
Input Modules (Sold Separately)
Check that the MODEL indicated on the input module is what you ordered.
MODEL Name Abbreviation
701250 High-Speed 10 MS/s, 12-Bit Isolation Module HS10M12
701251 High-Speed High-Resolution 1 MS/s, 16-Bit Isolation Module HS1M16
701255 High-Speed 10 MS/s, 12-Bit Non-Isolation Module NONISO_10M12
701267 High-Voltage 100 kS/s, 16-Bit Isolation Module (with RMS) HV (with RMS)
701261 Universal (Voltage/Temp.) Module UNIVERSAL
701262 Universal (Voltage/Temp.) Module (with AAF) UNIVERSAL (AAF)
701265 Temperature, High Precision Voltage Isolation Module TEMP/HPV
701270 Strain Module (NDIS) STRAIN_NDIS
701271 Strain Module (DSUB, Shunt-Cal) STRAIN_DSUB
701275 Acceleration/Voltage Module (with AAF) ACCL/VOLT
701280 Frequency Module FREQ
AS Standard
A1024WD
GB Standard
A1064WD
• User’s Manual
• Operation Guide
Soft case
B9946EB
Front panel protection
cover (transparent)
B8023EA
H
• Communication Interface
User’s Manual
(CD-ROM) B8024YY
• Handling of the CD-ROM
Printer roll
paper
701966 1 roll
IM 701240-01E
701250
HS10M12
MODEL
SUFFIX
NO.
Made in Japan
MODEL
SUFFIX
NO.
Made in Japan
Top row: MODEL
Bottom row: Abbreviated name
This user’s manual refers to the input modules by MODEL (abbreviation).
For example, the High-Speed 10 MS/s, 12-Bit Isolation Module is indicated as 701250
(HS10M12). However, the module may be indicated only by the model (701250) if a
description about the same module is given immediately before it.
v
Page 8

Checking the Contents of the Package
Optional Accessories (Sold Separately)
The optional accessories below are available for purchase separately. Check that all
contents are present and undamaged. For information and ordering, contact your
nearest YOKOGAWA dealer.
Name Model Safety standard1Description
Isolated probe 700929 1000 Vrms CAT II 10:1 safety probe, for the 701250/701251
Current probe 701930 300 Vrms CAT III DC to 10 MHz bandwidth. Used by connecting to the
701931 300 Vrms CAT III DC to 2 MHz bandwidth. Used by connecting to the probe
701933 300 Vrms DC to 50 MHz bandwidth. Used by connecting to the
10:1 passive probe 701940 – For non-isolated input on the 701255: 600 V or less
Differential probe 700924 1000 Vrms CAT III2Switchable between 1000:1 and 100:1
1:1 BNC safety adapter lead 701901 1000 Vrms CATII For use with the 701250 and 701251. Used with the
Measurement lead 758933 1000 Vrms CAT III 1 m in length; for use with the 701267. Used with the
Alligator clip (dolphin type) 701954 1000 Vrms CAT III 2 pieces in one set (red/black)
Safety mini-clip (hook type) 701959 1000 Vrms CAT II 2 pieces in one set (red/black)
Alligator clip adapter 758922 300 Vrms CAT II 2 pieces in one set
Alligator clip adapter 758929 1000 Vrms CAT II 2 pieces in one set
Fork terminal adapter 758921 1000 Vrms CAT II 2 pieces in one set (red/black), for 4-mm screws
3
Cables
Banana-alligator clip cable 366961 – For measuring low voltage of less than or equal to 42 V
High-speed logic probe 700986 – 42 V or less, 8-bit non-isolated/response speed of 1 µs
Isolated logic probe 700987 250 Vrms CAT II 8 bits, each channel isolated, response speed of 20 ms
Measurement lead for isolated 758917 1000 Vrms CAT II 2 pieces in one set, used with the 758922 or 758929
logic adapter sold separately
Logic probe 702911 – 35 V or less, 8-bit non-isolated, response speed 3 µs,
Conversion adapter 366928 – 42 V or less, BNC (jack) to RCA (plug)
Modular cable 366973 – For external start/stop
Safety BNC cable (1 m) 701902 1000 Vrms CAT II –
Safety BNC cable (2 m) 701903 1000 Vrms CAT II –
Safety BNC-to-banana adapter 758924 500 Vrms CAT II For the 701250, 701251, and 701255
Bridge head 701955 – NDIS, bridge resistance: 120 Ω
Soft carrying case 701967 – With three pockets
Sold in units of 1 piece.
1 The actual voltage that can be used is the lower voltage of the specifications of the SL1400 and the cable.
2 Be sure to connect the GND lead provided with the 700924 to the functional ground terminal of the SL1400. A measurement
of 1400 Vpeak is possible by connecting the GND lead to the SL1400.
3 Use cables (366926) that YOKOGAWA has been shipping since February 4, 1998. Cables (366926) shipped before this
date cannot be used in combination with the SL1400 input modules.
366926 – For measuring low voltage of less than or equal to 42 V
702912 – 35 V or less, 8-bit non-isolated, response speed 3 µs,
701956 – NDIS, bridge resistance: 350 W
701957 – DSUB, bridge resistance: 120 W, shunt-cal support
701958 – DSUB, bridge resistance: 350 W, shunt-cal support
probe power terminal
power terminal
probe power terminal
For isolated input other than above: 42 V or less
Measurable voltage: 1400 Vpeak (1000 Vrms)
following items (which are sold separately): the 701954,
701959, 758922, 758929, or 758921.
following items (which are sold separately): the 701954,
701959, 758922, 758929, or 758921.
for the 701261, 701262, or 701265
(for AC)
(lead length: 1 m)
(lead length: 3 m)
vi
IM 701240-01E
Page 9
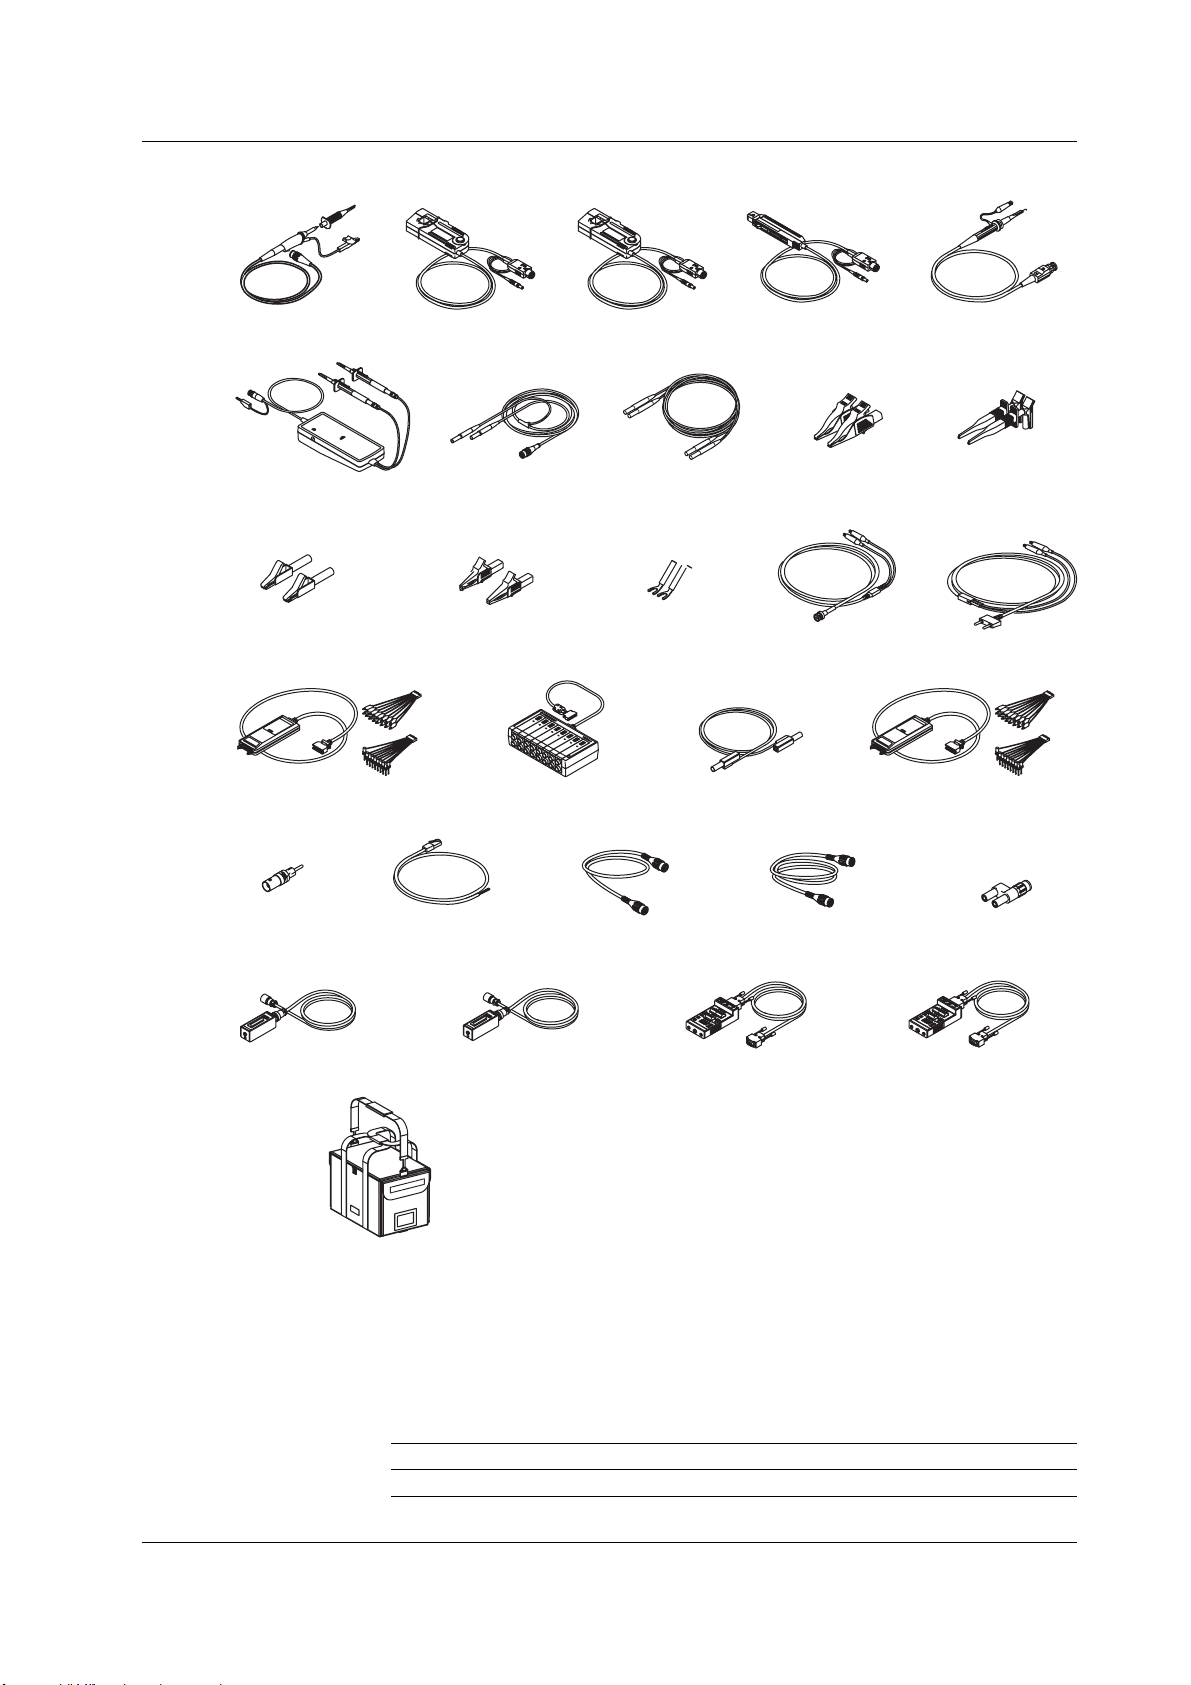
Checking the Contents of the Package
Isolated probe
700929
Differential probe
700924
Alligator clip adapter
(Rated voltage 300 V)
758922
High-speed logic probe
700986
Current probe
701930
1:1 BNC safety
adapter lead
701901*
Alligator clip adapter
(Rated voltage 1000 V)
758929
Isolated logic probe
700987
Current probe
701931
Measurement lead
758933*
Fork terminal
adapter
758921
Current probe
701933
Cable
366926
Measurement lead
for isolated logic
758917*
10:1 passive probe
701940
Alligator clip
(dolphin type)
701954
Banana-alligator clip
cable
366961
Logic probe
702911 (1 m)/702912 (3 m)
Safety mini-clip
(hook type)
701959
Conversion
adapter
366928
Bridge head
701955 (NDIS, 120Ω)
Soft carrying case
701967
* The 1:1 BNC safety adapter lead (701901) and the measurement lead (758933) must be used with one of
the following accessories (which are sold separately): alligator clip (dolphin type: 701954), safety mini-clip
(hook type: 701959), alligator adapter (758922 or 758929), and/or the fork terminal adapter (758921).
GO/NO-GO cable
366973
Bridge head
701956 (NDIS, 350Ω)
Spare Parts (Sold Separately)
The spare parts below are available for purchase separately. Check that all contents are
present and undamaged.
For information about the spare parts and ordering, contact your dealer.
Name Part No. Minimum Q’ty Note
Printer roll paper 701966 6 Thermal paper, 210mm × 20 m
Safety BNC cable
(1 m) 701902
Safety BNC cable
(2 m) 701903
Bridge head
701957 (DSUB, 120Ω)
Safety
BNC-to-banana
adapter
758924
Bridge head
701958 (DSUB, 350Ω)
IM 701240-01E
vii
Page 10
Safety Precautions
This instrument is an IEC safety class I instrument (provided with a terminal for
protective earth grounding).
The general safety precautions described herein must be observed during all phases of
operation. If the instrument is used in a manner not specified in this manual, the
protection provided by the instrument may be impaired. YOKOGAWA assumes no
liability for the customer’s failure to comply with these requirements.
The following symbols are used on this instrument.
Warning: handle with care. Refer to the user’s manual or service manual. This
symbol appears on dangerous locations on the instrument which require special
instructions for proper handling or use. The same symbol appears in the
corresponding place in the manual to identify those instructions.
Risk of electric shock
Protective ground terminal
Ground, or the functional ground terminal (do not use this terminal as a
protective ground terminal.)
Alternating current
ON (power)
OFF (power)
viii
IM 701240-01E
Page 11

Safety Precautions
Failure to comply with the precautions below could lead to injury or death or damage
to the instrument.
WARNING
Use the Instrument Only for Its Intended Purpose
This instrument is a waveform measuring device that monitors and measures
electrical signals. Do not use this instrument for anything other than as a
waveform measuring device.
Check the Physical Appearance
Do not use the instrument if there is a problem with its physical appearance.
Use the Correct Power Supply
Before connecting the power cord, ensure that the source voltage matches the
rated supply voltage of the instrument and that it is within the maximum rated
voltage of the provided power cord.
Use the Correct Power Cord and Plug
To prevent the possibility of electric shock or fire, be sure to use the power cord
supplied by YOKOGAWA. The main power plug must be plugged into an outlet
with a protective earth terminal. Do not invalidate this protection by using an
extension cord without protective earth grounding. Additionally, do not use the
power cord supplied with this instrument with another instrument.
Connect the Protective Grounding Terminal
Make sure to connect the protective earth to prevent electric shock before
turning ON the power. The power cord that comes with the instrument is a threeprong type power cord. Connect the power cord to a properly grounded threeprong outlet.
Do Not Impair the Protective Grounding
Never cut off the internal or external protective earth wire or disconnect the
wiring of the protective earth terminal. Doing so poses a potential shock hazard.
Do Not Operate with Defective Protective Grounding or Fuse
Do not operate the instrument if the protective earth or fuse might be defective.
Also, make sure to check them before operation.
Do Not Operate in an Explosive Atmosphere
Do not operate the instrument in the presence of flammable liquids or vapors.
Operation in such an environment constitutes a safety hazard.
Do Not Remove the Covers or Disassemble or Alter the Instrument
Only qualified YOKOGAWA personnel may remove the covers and disassemble
or alter the instrument. The inside of the instrument is dangerous because parts
of it have high voltages.
Ground the Instrument before Making External Connections
Securely connect the protective grounding before connecting to the item under
measurement or to an external control unit. If you are going to touch the circuit,
make sure to turn OFF the circuit and check that no voltage is present.
IM 701240-01E
ix
Page 12

Safety Precautions
Precautions to Be Taken When Using the Modules
• Do not apply input voltage exceeding the maximum input voltage, withstand
voltage, or allowable surge voltage.
• To prevent the possibility of electric shock, be sure to furnish protective earth
grounding of the SL1400.
• To prevent the possibility of electric shock, be sure to fasten the module screws.
Otherwise, the electrical protection function and the mechanical protection
function will not be activated.
• Do not leave the instrument connected to devices in an environment that may
be subject to voltage surges.
Precautions to Be Taken When Using the Probes
• When measuring high voltages using the 701250 (HS10M12) or the 701251
(HS1M16), use the isolated probe (700929), 1:1 safety cable (combination of
701901 and 701954), or differential probe (700924).
• Be sure to connect the GND lead of the differential probe (700924) to the
functional ground terminal of the SL1400. High voltage may appear at the BNC
connector of the differential probe. Be sure to connect the GND lead to the
SL1400 before connecting the probe to the parameter to be measured.
• When using the 701255 (NONISO_10M12), be sure to fasten the module
screws. Fastening the module screws activates the protection function and the
non-isolation function. It is extremely dangerous if you do not fasten the screws.
In addition, when measuring high voltage above 42 V, be sure to use the
passive probe (701940).
• The BNC part of the passive probe (701940) is made of metal. Therefore, use
the probe at 42 V or less for isolated inputs (701250 (HS10M12), 701251
(HS1M16), etc.) for safety reasons. (Do not connect voltage above 42 V to both
the High and Low sides.)
For non-isolated inputs (701255 (NONISO_10M12), etc.), fasten the module
screws as described before.
• When measuring high voltage using the 701267 (HV (with RMS)), use the
measurement leads (758933) and the alligator clips (751954).
• The measurement category of the 701267 (HV (with RMS)) is 400V-CAT II for
the low side and 700V-CAT II for the high side. Use caution because the
overvoltage tolerance differs between the low and high sides.
Measurement Category
The measurement category of this instrument’s signal input terminals varies
depending on the modules that are installed. Use the instrument within the
scope of the measurement category that corresponds to the module
specifications. Do not use the instrument outside the scope of the measurement
category that corresponds to the module specifications.
Installation Location
• This instrument is designed to be used indoors. Do not install or use it outdoors.
• Install the instrument so that you can immediately remove the power cord if an
abnormal or dangerous condition occurs.
CAUTION
Operating Environment Limitations
This product is a Class A (for industrial environments) product. Operation of this
product in a residential area may cause radio interference in which case the
user will be required to correct the interference.
x
IM 701240-01E
Page 13

Conventions Used in This Manual
Markings
The following markings are used in this manual.
Improper handling or use can lead to injury to the user or damage
to the instrument.
indicate that the user must refer to the users manual for special
instructions. The same symbol appears in the corresponding place
in the user’s manual to identify those instructions. In the manual,
the symbol is used in conjunction with the word “WARNING” or
“CAUTION.”
This symbol appears on the instrument to
WARNING
CAUTION
Note
Calls attention to actions or conditions that could cause serious or
fatal injury to the user, and precautions that can be taken to prevent
such occurrences.
Calls attentions to actions or conditions that could cause light injury
to the user or damage to the instrument or user’s data, and
precautions that can be taken to prevent such occurrences.
Calls attention to information that is important for proper operation
of the instrument.
Notations Used in the Procedural Explanations
On pages that describe the operating procedure in Chapters 3 through 17, the following
notations are used to distinguish the procedure from their explanations.
Procedure
Explanation
Follow the numbered steps. All procedures are written with
inexperienced users in mind; experienced users may not need to
carry out all the steps.
This section describes the setup items and the limitations regarding
the procedures. A detailed description of the function is not
provided in this section. For a detailed explanation of the function,
see chapter 2.
IM 701240-01E
Notation of User Controls
Panel Keys and Soft Keys
Bold characters used in the procedural explanations indicate characters that are marked on the
panel keys or the characters of the soft keys or menus displayed on the screen.
Jog Shuttle+SELECT
Jog shuttle+SELECT
shuttle, the SELECT key, and other keys. For details on the procedure, see section 4.1 or 4.2.
indicates selecting or setting parameters and entering values using the jog
Unit
k: Denotes 1000. Example: 100 kS/s (sampling rate)
K: Denotes 1024. Example: 459 KB (file data size)
xi
Page 14
Flow of Operation
Preparations for Measurements
Displaying Waveforms on the Screen
Horizontal and Vertical Axes Setting
The figure below provides an overview of the flow of operations described in this manual.
For a description of each item, see the relevant chapter or section.
Preparations for Measurements
Install the SL1400 Section 3.2
Install the modules Section 3.3
Connect the power supply and turn it ON/OFF Section 3.4
Connect the probe and correct the phase Sections 3.7, 3.8, and 3.12
Voltage Measurement Temp. Measurement Strain Measurement Acceleration Measurement Frequency
Connect the
measurement lead
Section 3.9
2
Connect the
thermocouple
Section 3.10
2 Only when measuring voltage with the 701261,
701262, 701267, or 701265.
Displaying Waveforms on the Screen
Initialize the SL1400 Section 4.4
Perform auto setup Section 4.5
Horizontal and Vertical Axes Setting
Set the horizontal (time) axis Sections 5.2 and 5.20
Set the vertical axis
•
Turn the channels ON/OFF Section 5.1
1
1 When measuring logic waveforms
Connect the bridge
head
Section 3.11
Connect the
acceleration sensor
Section 3.13
Measurement, Etc.
Connect the sensor
Section 3.14
3 Number of rotations, period, duty cycle, power supply frequency,
pulse width, pulse integration, and velocity.
3
Voltage Measurement Temp. Measurement Strain Measurement Acceleration
• Input range
Section 5.3
• Vertical position
Section 5.4
• Input coupling
Section 5.5
• Probe attenuation
and current-to-voltage
conversion ratio
Section 5.6
• Bandwidth limit
Section 5.7
• Zoom in or out of
the vertical axis
Sections 5.8 and 5.9
• Linear scaling
Section 5.11
• Inversion
Section 5.12
• Rms measurement
Section 5.13
• Input coupling
Section 5.5
• Bandwidth limit
Section 5.7
• Temperature
measurement setting
Section 5.14
xii
• Bandwidth limit
Section 5.7
• Linear scaling
Section 5.11
• Inversion
Section 5.12
• Strain measurement
setting
Section 5.15
Measurement
• Vertical position
Section 5.4
• Input coupling
Section 5.5
• Bandwidth limit
Section 5.7
• Zoom in or out of
the vertical axis
Sections 5.8 and 5.9
• Acceleration
measurement setting
Section 5.16
Frequency
Measurement, Etc.
• Vertical position
Section 5.4
• Zoom in or out of the
vertical axis
Sections 5.8 and 5.9
• Offset value
Section 5.10
• Linear scaling
Section 5.11
• Frequency*
measurement setting
Section 5.17
* Number of rotations, period, duty cycle, power supply frequency,
pulse width, pulse integration, and velocity.
Continues to the next page
*
IM 701240-01E
Page 15
Display the waveform and information
Acquiring Waveforms
Recording in Recorder Mode
Setting the Trigger
Setting the Trigger
Flow of Operation
From the previous page
• Trigger type* (simple/enhanced) Sections 6.5 to 6.17
• Trigger source, trigger slope,
trigger level, etc Sections 6.5 to 6.17
• Trigger mode Sections 6.1 and 7.4
• Trigger position Section 6.2
• Trigger delay Section 6.3
Acquiring Waveforms
• Acquisition mode Sections 7.2 and 7.3
• Start/Stop the waveform acquisition Section 7.1
Display the waveform and information
* Simple trigger
• Input signal trigger Sections 6.5
and 6.9
• External trigger Section 6.6
• Line trigger Section 6.7
• Time trigger Section 6.8
Enhanced trigger
• A → B(N) trigger Section 6.10
• A Delay B trigger Section 6.11
• Edge on A trigger Section 6.12
• OR trigger Section 6.13
• B > Time, B < Time, and B
Timeout trigger Section 6.14
• Periodic trigger Section 6.15
• Window trigger Section 6.16
• Wave window trigger Section 6.17
• Realtime recording to the
internal hard disk (option) Section 7.5
• Acquisition memory
backup Section 7.7
• Set the waveform display conditions Sections 8.1 to 8.4 and 8.8
• Zoom and auto scroll the waveform Section 8.5
• Display the X-Y waveform Section 8.6
• Snapshot and clear trace Section 8.7
• Set the information display conditions Sections 8.9 to 8.13
Recording in Recorder Mode
• Select the recorder mode Section 9.1
• Perform T-Y waveform recording Sections 9.2 to 9.4
• Perform numeric value recording Section 9.5
• Perform X-Y waveform recording Section 9.6
• Reprint on the built-in printer Section 9.7
• Create a PDF file of the reprint image Section 9.8
Continues to “Waveform Computation, Analysis, and
Search” on the next page
IM 701240-01E
xiii
Page 16
Saving and Loading Dat
Printing Screen Images
Computing, Analyzing, and Searching Waveforms
Flow of Operation
From “Acquiring Waveforms” on the previous page
Computing, Analyzing, and Searching Waveforms
• Waveform computation Sections 10.1 to 10.4
• History search Sections 11.2 and 11.3
• Cursor measurement Section 11.4
• Automated measurement of waveform parameters Section 11.5
• Statistical processing Section 11.6
Printing Screen Images
• Print on the built-in printer Section 12.1
• Print on a USB Printer Section 12.2
• Printing on a Network Printer* Sections 15.4 and 12.3
* Configure the network according to
chapter 15, “Ethernet Communication
(Option)” before carrying out printing on
the network printer.
Saving and Loading Dat
• Format the storage medium Section 13.6
• Save/Load Waveform Data Section 13.8
• Save/Load setup data Sections 13.1
and 13.9
• Save/Load snapshot waveforms Section 13.10
• Save the results of the automated
measurement of waveform
parameters Section 13.11
•
Save the screen image data
and 13.13
•
Create a PDF File of the print image
• Load/Convert realtime recorded
waveforms Section 13.15
• Operate files on the storage
medium
to 13.18
1
a
Sections 13.12
Section 13.14
2
Sections 13.16
1 Configure the network according to
chapter 15, “Ethernet Communication
(Option)” before saving data to the
network drive.
2 File operations
• Change the file attribute,
• Delete/copy files,
• Change the directory/file name on the
storage medium, create directories
xiv
IM 701240-01E
Page 17
Flow of Operation
Ethernet interface and other operations do not have to be configured in order from
previous chapter. They can be configured independently.
Ethernet Communication (Option)
• Connect the SL1400 to the PC* Section 15.1
• Set the TCP/IP Section 15.2
• Save/Load data on a network drive
(FTP client function) Section 15.3
• Send e-mail Section 15.5
• Access the SL1400 from the PC*
(FTP server function) Section 15.6
• Web server function Section 15.7
• Use the SL1400 as a Windows
network drive Section 15.11
* Personal computer (PC) or workstation
Other Operations
• Set the menu/message language Section 16.1
• Turn the click sound ON/OFF Section 16.1
• Change the screen font size Section 16.2
• Set the screen color and intensity Section 16.3
• Set the backlight Section 16.4
• Lock the keys Section 16.5
IM 701240-01E
xv
Page 18

Contents
Checking the Contents of the Package ........................................................................................iv
Safety Precautions ..................................................................................................................... viii
Conventions Used in This Manual ............................................................................................... xi
Flow of Operation ........................................................................................................................ xii
Chapter 1 Names and Functions of Parts
1.1 Panels ............................................................................................................................ 1-1
1.2 Panel Keys and Knobs .................................................................................................. 1-5
1.3 Display Screens ............................................................................................................. 1-7
Chapter 2 Explanation of Functions
2.1 System Configuration and Block Diagram ..................................................................... 2-1
2.2 Setting the Horizontal and Vertical Axes ....................................................................... 2-3
2.3 Setting the Trigger ....................................................................................................... 2-17
2.4 Setting Waveform Acquisition Conditions and Display Conditions .............................. 2-28
2.5 Recording in Recorder Mode ....................................................................................... 2-37
2.6 Waveform Computation ............................................................................................... 2-41
2.7 Waveform Analysis and Search ................................................................................... 2-43
2.8 Communications .......................................................................................................... 2-47
2.9 Other Useful Functions ................................................................................................ 2-49
Chapter 3 Preparations for Measurements
3.1 Handling Precautions ..................................................................................................... 3-1
3.2 Installing the Instrument ................................................................................................. 3-3
3.3 Installing Input Modules ................................................................................................. 3-5
3.4 Connecting the Power Supply and Turning the Power Switch ON/OFF ........................ 3-8
3.5 Loading the Roll Paper for the Built-in Printer ............................................................. 3-10
3.6 Setting the Date and Time ........................................................................................... 3-13
3.7 Connecting Probes ...................................................................................................... 3-15
3.8 Compensating the Probe (Phase Correction) .............................................................. 3-21
3.9 Connecting Measurement Leads .................................................................................3-23
3.10 Connecting Thermocouples ......................................................................................... 3-25
3.11 Connecting the Bridge Head........................................................................................ 3-27
3.12 Connecting Logic Probes............................................................................................. 3-30
3.13 Connecting Acceleration Sensors................................................................................ 3-32
3.14 Connecting Sensors to the Frequency Module............................................................ 3-34
Chapter 4 Common Operations
4.1 Operations and Functions of Keys and the Jog Shuttle ................................................. 4-1
4.2 Entering Values and Strings .......................................................................................... 4-3
4.3 Operating the SL14000 Using a USB Keyboard or a USB Mouse ................................ 4-6
4.4 Initializing Settings ....................................................................................................... 4-15
4.5 Performing Auto Setup ................................................................................................ 4-17
4.6 Performing Calibration ................................................................................................. 4-20
xvi
IM 701240-01
Page 19

3
10
11
12
13
14
15
16
17
18
App
Index
Contents
Chapter 5 Horizontal and Vertical Axes
Voltage Measurement (Input Module 701250, 701251, 701255, 701267, 701261, 701262,
701265, or 701275)
5.1 Turning Channels ON/OFF ............................................................................................ 5-1
5.2 Setting the Record Time and Sample Rate ................................................................... 5-2
5.3 Setting the Voltage Range ............................................................................................. 5-4
5.4 Setting the Vertical Position of the Waveform ............................................................... 5-6
5.5 Selecting the Input Coupling .......................................................................................... 5-8
5.6 Selecting the Probe Attenuation or Current-to-Voltage Conversion Ratio ................... 5-10
5.7 Selecting the Bandwidth Limit ...................................................................................... 5-11
5.8 Zooming Vertically by Setting the Zoom Rate ............................................................. 5-13
5.9 Zooming Vertically by Setting the Upper and Lower Limits of the Display Range ....... 5-15
5.11 Using the Linear Scaling Function (AX+B or P1-P2) ................................................... 5-18
5.12 Inverting the Waveforms .............................................................................................. 5-21
5.13 Setting the RMS Measurement.................................................................................... 5-22
5.19 Entering Settings on the All Channel Menu ................................................................. 5-46
5.20 Selecting the Time Base (Internal Clock or External Clock) ........................................ 5-49
Temperature Measurement (Input Module 701261, 701262, or 701265)
5.1 Turning Channels ON/OFF ............................................................................................ 5-1
5.2 Setting the Record Time and Sample Rate ................................................................... 5-2
5.5 Selecting the Input Coupling .......................................................................................... 5-8
5.7 Selecting the Bandwidth Limit ...................................................................................... 5-11
5.14 Setting the Temperature Measurement ....................................................................... 5-23
5.19 Entering Settings on the All Channel Menu ................................................................. 5-46
5.20 Selecting the Time Base (Internal Clock or External Clock) ........................................ 5-49
Strain Measurement (Input Module 701270 or 701271)
5.1 Turning Channels ON/OFF ............................................................................................ 5-1
5.2 Setting the Record Time and Sample Rate ................................................................... 5-2
5.7 Selecting the Bandwidth Limit ...................................................................................... 5-11
5.11 Using the Linear Scaling Function (AX+B or P1-P2) ................................................... 5-18
5.12 Inverting the Waveforms .............................................................................................. 5-21
5.15 Setting the Strain Measurement .................................................................................. 5-25
5.19 Entering Settings on the All Channel Menu ................................................................. 5-46
5.20 Selecting the Time Base (Internal Clock or External Clock) ........................................ 5-49
1
2
3
4
5
6
7
8
9
10
11
12
13
14
IM 701240-01
Acceleration Measurement (Input Module 701275)
5.1 Turning Channels ON/OFF ............................................................................................ 5-1
5.2 Setting the Record Time and Sample Rate ................................................................... 5-2
5.4 Setting the Vertical Position of the Waveform ............................................................... 5-6
5.5 Selecting the Input Coupling .......................................................................................... 5-8
5.7 Selecting the Bandwidth Limit ...................................................................................... 5-11
5.8 Zooming Vertically by Setting the Zoom Rate ............................................................. 5-13
5.9 Zooming Vertically by Setting the Upper and Lower Limits of the Display Range ....... 5-15
5.16 Setting the Acceleration Measurement ........................................................................ 5-31
5.19 Entering Settings on the All Channel Menu ................................................................. 5-46
5.20 Selecting the Time Base (Internal Clock or External Clock) ........................................ 5-49
xvii
15
16
17
18
App
Index
Page 20

Contents
Frequency (Number of Rotations, Period, Duty Cycle, Power Supply Frequency, Pulse
Width, Pulse Integration, and Velocity) Measurement (Input Module 701280)
5.1 Turning Channels ON/OFF ............................................................................................ 5-1
5.2 Setting the Record Time and Sample Rate ................................................................... 5-2
5.4 Setting the Vertical Position of the Waveform ............................................................... 5-6
5.8 Zooming Vertically by Setting the Zoom Rate ............................................................. 5-13
5.9 Zooming Vertically by Setting the Upper and Lower Limits of the Display Range ....... 5-15
5.10 Setting the Offset ......................................................................................................... 5-17
5.11 Using the Linear Scaling Function (AX+B or P1-P2) ................................................... 5-18
5.17 Setting the Frequency (Number of Rotations, Period, Duty Cycle, Power Supply
5.19 Entering Settings on the All Channel Menu ................................................................. 5-46
5.20 Selecting the Time Base (Internal Clock or External Clock) ........................................ 5-49
Logic Waveform Measurement
5.1 Turning Channels ON/OFF ............................................................................................ 5-1
5.4 Setting the Vertical Position of the Waveform ............................................................... 5-6
5.8 Zooming Vertically by Setting the Zoom Rate ............................................................. 5-13
5.18 Setting Logic Waveforms ............................................................................................. 5-44
Chapter 6 Triggering
6.1 Setting the Trigger Mode ............................................................................................... 6-1
6.2 Setting the Trigger Position ........................................................................................... 6-3
6.3 Setting the Trigger Delay ............................................................................................... 6-5
6.4 Setting the Hold Off Time .............................................................................................. 6-6
6.5 Setting the Edge Trigger (SIMPLE) ............................................................................... 6-8
6.6 Setting the External Trigger (SIMPLE) ........................................................................ 6-11
6.7 Activating Triggers on the Power Signal (SIMPLE) ..................................................... 6-12
6.8 Setting the Timer Trigger (SIMPLE) ............................................................................ 6-13
6.9 Setting the Logic Trigger (SIMPLE) ............................................................................. 6-15
6.10 Setting the A->B(N) Trigger (ENHANCED) ................................................................. 6-17
6.11 Setting the A Delay B Trigger (ENHANCED)............................................................... 6-20
6.12 Setting the Edge on A Trigger (ENHANCED) .............................................................. 6-23
6.13 Setting the OR Trigger (ENHANCED) ......................................................................... 6-27
6.14 Setting the B > Time, B < Time, or B Timeout (Pulse Width) Trigger (ENHANCED) .. 6-30
6.15 Setting the Period Trigger (ENHANCED) .................................................................... 6-34
6.16 Setting the Window Trigger (ENHANCED) .................................................................. 6-37
6.17 Setting the Wave Window Trigger (ENHANCED)........................................................ 6-40
6.18 Setting the Action-on-Trigger ....................................................................................... 6-45
6.19 Activating Manual Triggers .......................................................................................... 6-48
Frequency, Pulse Width, Pulse Integration, and Velocity) Measurement .................... 5-33
Chapter 7 Waveform Acquisition
7.1 Starting/Stopping Waveform Acquisition ....................................................................... 7-1
7.2 Setting the Acquisition Mode ......................................................................................... 7-3
7.3 Acquiring Data Using Box Average ............................................................................... 7-6
7.4 Acquiring Data Using the Sequential Store Function (Single (N) Mode) ....................... 7-8
7.5 Realtime Recording to the Internal Hard Disk (Option) ................................................. 7-9
7.6 Setting the Action When Waveform Display Is Updated (Action-on-Stop) .................. 7-13
7.7 Backing Up the Acquisition Memory ............................................................................ 7-16
xviii
IM 701240-01
Page 21

3
10
11
12
13
14
15
16
17
18
App
Index
Contents
Chapter 8 Waveform Display and Information Display
8.1 Changing the Display Format ........................................................................................ 8-1
8.2 Setting the Display Interpolation Method ....................................................................... 8-3
8.3 Changing the Graticule .................................................................................................. 8-5
8.4 Accumulated Waveform Display .................................................................................... 8-6
8.5 Zooming and Auto Scrolling the Waveform ................................................................... 8-8
8.6 Displaying X-Y Waveforms .......................................................................................... 8-13
8.7 Taking Snapshots and Clearing Traces ....................................................................... 8-16
8.8 Turning ON/OFF the Translucent Display ................................................................... 8-17
8.9 Turning the Scale Value Display ON/OFF ................................................................... 8-18
8.10 Setting Waveform Labels............................................................................................. 8-19
8.11 Turning the Extra Window ON/OFF ............................................................................. 8-20
8.12 Turning the Level Indicator Display ON/OFF ............................................................... 8-22
8.13 Displaying Channel Information/Displaying Waveforms on a Full Screen
(Expanding the Waveform Display Area)..................................................................... 8-23
Chapter 9 Recording in Recorder Mode
9.1 Selecting the Recorder Mode ........................................................................................ 9-1
9.2 Setting the Record Conditions of T-Y Waveform Recording ......................................... 9-3
9.3 Setting the Recording Format of T-Y Waveform Recording .......................................... 9-6
9.4 Recording T-Y Waveforms .......................................................................................... 9-11
9.5 Recording Numeric Values .......................................................................................... 9-13
9.6 Recording X-Y Waveforms .......................................................................................... 9-16
9.7 Reprinting on the Built-in Printer .................................................................................. 9-20
9.8 Creating a PDF File of the Reprint Image .................................................................... 9-24
1
2
3
4
5
6
7
8
9
10
Chapter 10 Waveform Computation
10.1 Adding, Subtracting, Multiplying, and Dividing Waveforms ......................................... 10-1
10.2 Performing Binary Computation................................................................................... 10-4
10.3 Performing Power Spectrum Computation (FFT) ........................................................ 10-7
10.4 Shifting the Phase...................................................................................................... 10-11
Chapter 11 Waveform Analysis/Search
11.1 Displaying History Waveforms ..................................................................................... 11-1
11.2 Searching History Memory Data Using Zones (History Search Function) ................... 11-5
11.3 Searching History Memory Data Using Parameters (History Search Function) .......... 11-8
11.4 Measuring Waveforms Using Cursors ....................................................................... 11-11
11.5 Automated Measurement of Waveform Parameters ................................................. 11-25
11.6 Performing Statistical Processing .............................................................................. 11-32
Chapter 12 Printing the Screen Image
12.1 Printing on the Built-in Printer ...................................................................................... 12-1
12.2 Printing on a USB Printer........................................................................................... 12-11
12.3 Printing on a Network Printer (Option) ....................................................................... 12-15
11
12
13
14
15
16
17
18
App
IM 701240-01
Index
xix
Page 22

Contents
Chapter 13 Saving and Loading Data
13.1 Storing and Recalling the Setup Data.......................................................................... 13-1
13.2 PC Cards ..................................................................................................................... 13-3
13.3 Internal Hard Disk (Option) .......................................................................................... 13-4
13.4 Connecting a USB Storage Device (MO Disk Drive, Hard Disk, or Flash Memory)
to the USB PERIPHERAL Interface............................................................................. 13-5
13.5 Connecting a SCSI Device .......................................................................................... 13-7
13.6 Formatting the Storage Medium .................................................................................. 13-8
13.7 Changing the SCSI ID Number.................................................................................. 13-12
13.8 Saving and Loading Waveform Data ......................................................................... 13-14
13.9 Saving/Loading the Setup Data ................................................................................. 13-23
13.10 Saving/Loading Snapshot Waveforms....................................................................... 13-28
13.11 Saving the Results of the Automated Measurement of Waveform Parameters ........ 13-32
13.12 Saving Screen Image Data ........................................................................................ 13-35
13.13 Displaying Thumbnails of the Saved Screen Image Data ......................................... 13-39
13.14 Creating PDF Files of the Printed Image ................................................................... 13-43
13.15 Loading/Converting Realtime Recorded Waveforms................................................. 13-50
13.16 Changing the File Attributes and Deleting Files......................................................... 13-53
13.17 Copying Files ............................................................................................................. 13-56
13.18 Changing the Directory/File Name of the Storage Medium and Creating Directories 13-59
13.19 Connecting a PC to the SL1400 via SCSI ................................................................. 13-62
Chapter 14 External Trigger I/O, External Clock Input, and Video Signal Output
14.1 External Trigger Input (TRIG IN).................................................................................. 14-1
14.2 Trigger Output (TRIG OUT) ......................................................................................... 14-2
14.3 External Clock Input (EXT CLK IN).............................................................................. 14-3
14.4 Video Signal Output (VIDEO OUT (SVGA)) ................................................................ 14-4
14.5 External Start/Stop Input.............................................................................................. 14-6
Chapter 15 Ethernet Interface (Option)
15.1 Connecting the SL1400 to the Network ....................................................................... 15-1
15.2 Setting up the TCP/IP .................................................................................................. 15-3
15.3 Saving/Loading Data to a Network Drive (FTP Client Function).................................. 15-8
15.4 Setting up the Network Printer (LPR Client Function) ............................................... 15-11
15.5 Sending Periodic Mail or Action Mail (SMTP Client Function) ................................... 15-13
15.6 Accessing the SL1400 from a PC or Workstation (FTP Server Function) ................. 15-17
15.7 Using the Web Server Function ................................................................................. 15-20
15.8 Setting the Time Difference from GMT (Greenwich Mean Time)/SNTP .................... 15-44
15.9 Checking the Presence of the Ethernet Interface and the MAC Address .................. 15-46
15.10 Setting the FTP Passive Mode and LPR/SMTP Timeout .......................................... 15-47
15.11 Using the Instrument as a Windows Network Drive................................................... 15-48
Chapter 16 Other Operations
16.1 Changing the Message/Menu Language and Turning the Click Sound ON/OFF ........ 16-1
16.2 Switching the Screen Display Font Size ...................................................................... 16-2
16.3 Setting the Screen Color and Brightness..................................................................... 16-3
16.4 Turning OFF the Backlight and Setting the Brightness of the Backlight ...................... 16-5
16.5 Locking the Keys ......................................................................................................... 16-6
xx
IM 701240-01
Page 23

3
10
11
12
13
14
15
16
17
18
App
Index
Contents
Chapter 17 Troubleshooting, Maintenance, and Inspection
17.1 Troubleshooting ........................................................................................................... 17-1
17.2 Messages and Corrective Actions ............................................................................... 17-2
17.3 Self Test..................................................................................................................... 17-12
17.4 Checking the System Conditions (Overview) ............................................................ 17-15
17.5 Recommended Replacement Parts ........................................................................... 17-16
1
2
3
Chapter 18 Specifications
18.1 Input Section ................................................................................................................ 18-1
18.2 Trigger Section ............................................................................................................ 18-1
18.3 Time Axis ..................................................................................................................... 18-2
18.4 Display ......................................................................................................................... 18-3
18.5 Function ....................................................................................................................... 18-3
18.6 Built-in printer............................................................................................................... 18-7
18.7 Storage ........................................................................................................................ 18-7
18.8 USB PERIPHERAL Interface....................................................................................... 18-8
18.9 Auxiliary I/O Section .................................................................................................... 18-8
18.10 Computer Interface .................................................................................................... 18-10
18.11 General Specifications ............................................................................................... 18-11
18.12 Module Specifications ................................................................................................ 18-15
18.13 Logic Probe Specifications ........................................................................................ 18-37
18.14 External Dimensions .................................................................................................. 18-38
4
5
6
7
8
9
Appendix
Index
Appendix 1 Relationship between the Record Time, Sample Rate and Record
Length in Memory Mode .................................................................................App-1
Appendix 2 Relationship between the Chart Speed, Sample Rate and Record
Length in Recorder Mode ............................................................................... App-2
Appendix 3 Maximum Number of Acquisitions to the History Memory and Time
Axis Range That Allows Realtime Recording ................................................. App-3
Appendix 4 How to Calculate the Area of a Waveform ..................................................... App-4
Appendix 5 ASCII Header File Format ..............................................................................App-6
Appendix 6 List of Default Values ...................................................................................App-10
Appendix 7 Key Assignments of the USB Keyboard .......................................................App-13
Appendix 8 Waveform Acquisition Operation When the Power Supply Recovers
after a Power Failure ....................................................................................App-17
Appendix 9 Basic Defining Equation of Strain ................................................................. App-18
Appendix 10 Shunt Calibration of the Strain Module......................................................... App-19
Appendix 11 Measurement Principles (Measurement Method and Update Rate)
of the Frequency Module ..............................................................................App-24
Appendix 12 List of Preset Settings of the Frequency Module.......................................... App-28
Appendix 13 TCP and UDP Port Number Used in Ethernet Communications.................. App-30
Appendix 14 High-Voltage 100 kS/s, 16-Bit Isolation Module (with RMS) (701260)
Specifications ...............................................................................................App-31
10
11
12
13
14
15
16
17
18
IM 701240-01
App
Index
xxi
Page 24
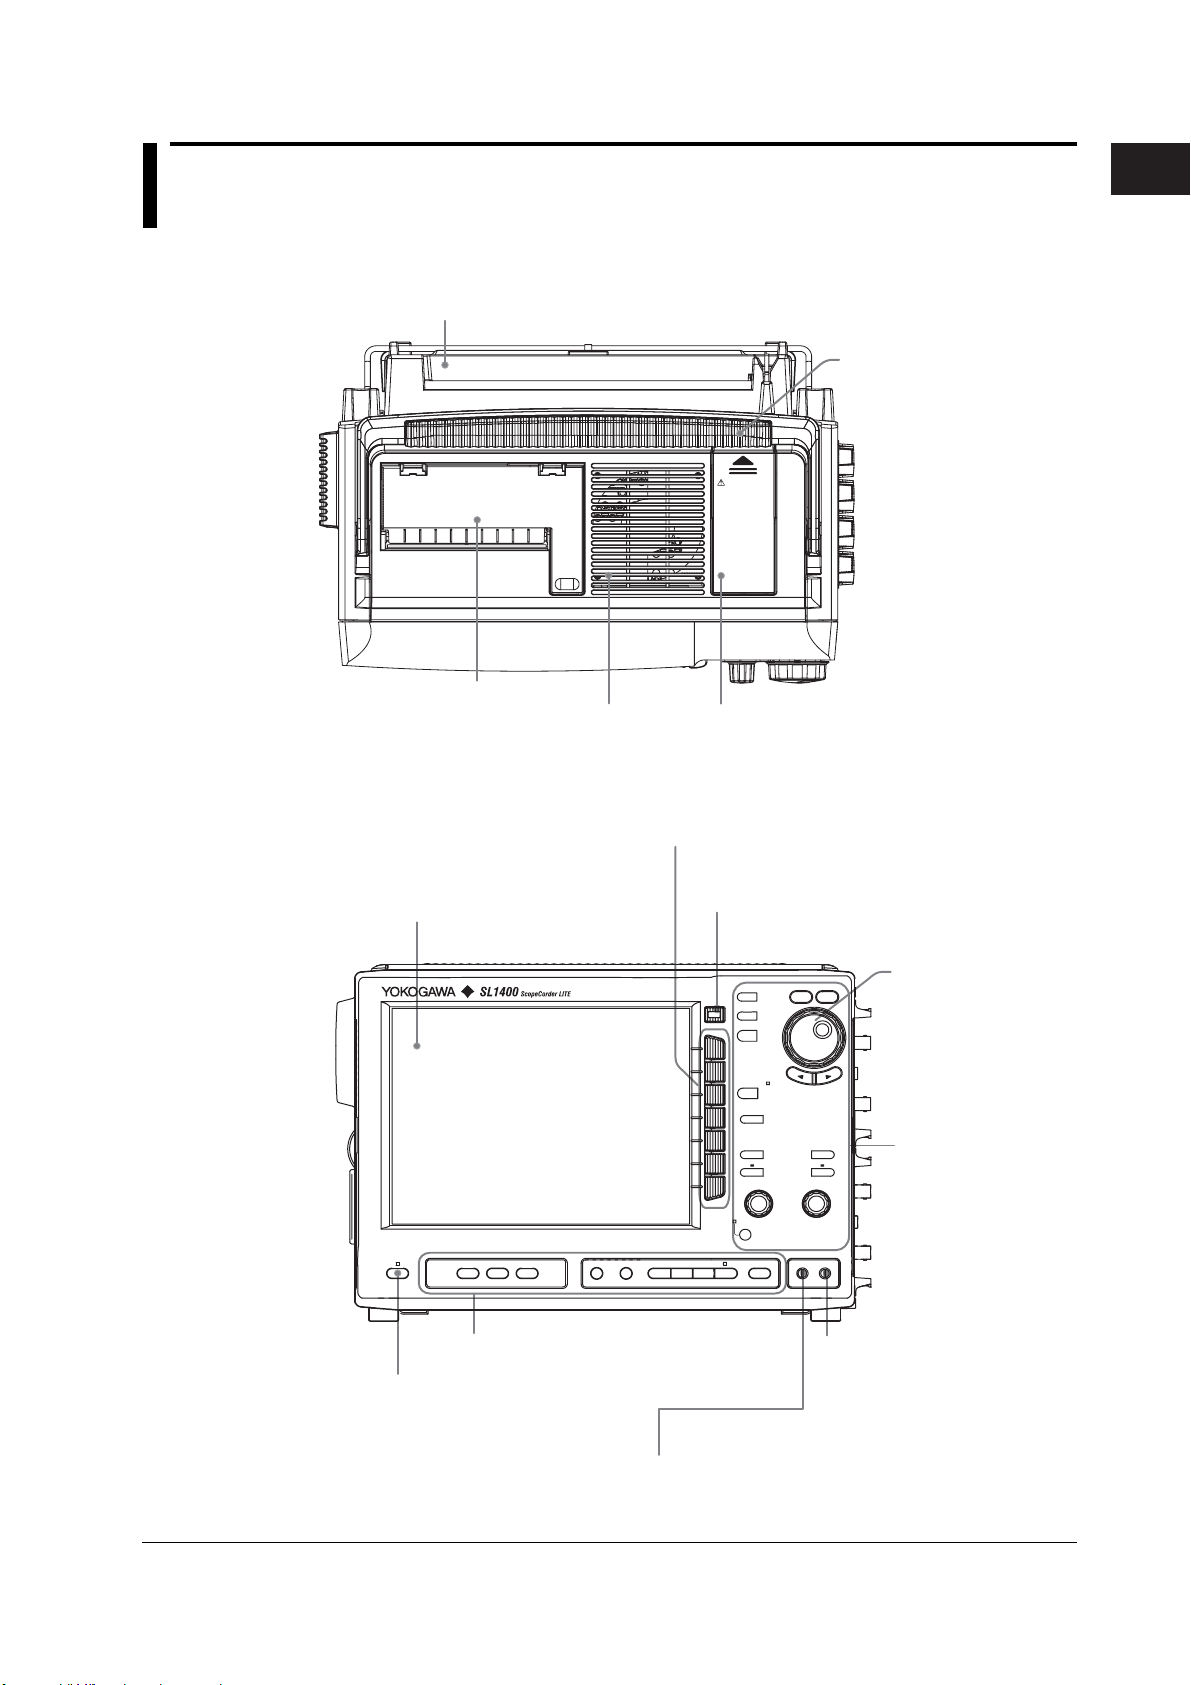
Chapter 1 Names and Functions of Parts
1.1 Panels
Top Panel
Built-in printer for the DL750
A built-in printer for a separate
model (DL750) is installed here.
It is not used on the SL1400.
Front Panel
Built-in printer
Prints the displayed information.
For the procedure to set the roll paper, see section 3.5.
For the printout procedure, see sections 9.4, 9.6, 9.7, and 12.1.
ACQ MEMORY
BACKUP BATTERIES
Vent holes
Battery box for memory backup
Stores batteries used to back up the contents of
the acquisition memory when the power is OFF.
For the procedure to install the batteries, see section 7.7.
Soft keys
Used to select items on the soft key menu
that appears when setting up the SL1400.
LCD
For a description of the displayed
information, see chapter 8.
ESC key
Used to clear the soft key menu and
pop-up menu.
RESET
RECORD
START/
STOP
SELECT
CHART
SPEED
ALL CH
CH
RANGE
POSITION
FINE
FINE
MENU
DISPLAY
MODE
RANGE POSITION
TRID'D
MANUAL TRIG
1
Names and Functions of Parts
Handle
Jog shuttle
Used to change settings
and move the cursor.
Tu rn the shuttle ring to
vary the rate of change
according to its angle.
Panel keys/knobs
For a description, see
section 1.2.
IM 701240-01E
IMAGE
PRINTFEEDPROTECT
SAVE
Panel keys
For a description, see section 1.2.
PROTECT key
Locks the keys. See section 16.5.
HISTORY
MEASURE
FILEZOOMCURSOR
Probe compensation signal
output terminal (1 kHz/1 VP-P)
Outputs the probe compensation
signal.
For the probe phase correction,
see section 3.8.
Functional ground terminal
Connect the ground cable when be sure to perform phase
correction the probe.
1-1
Page 25
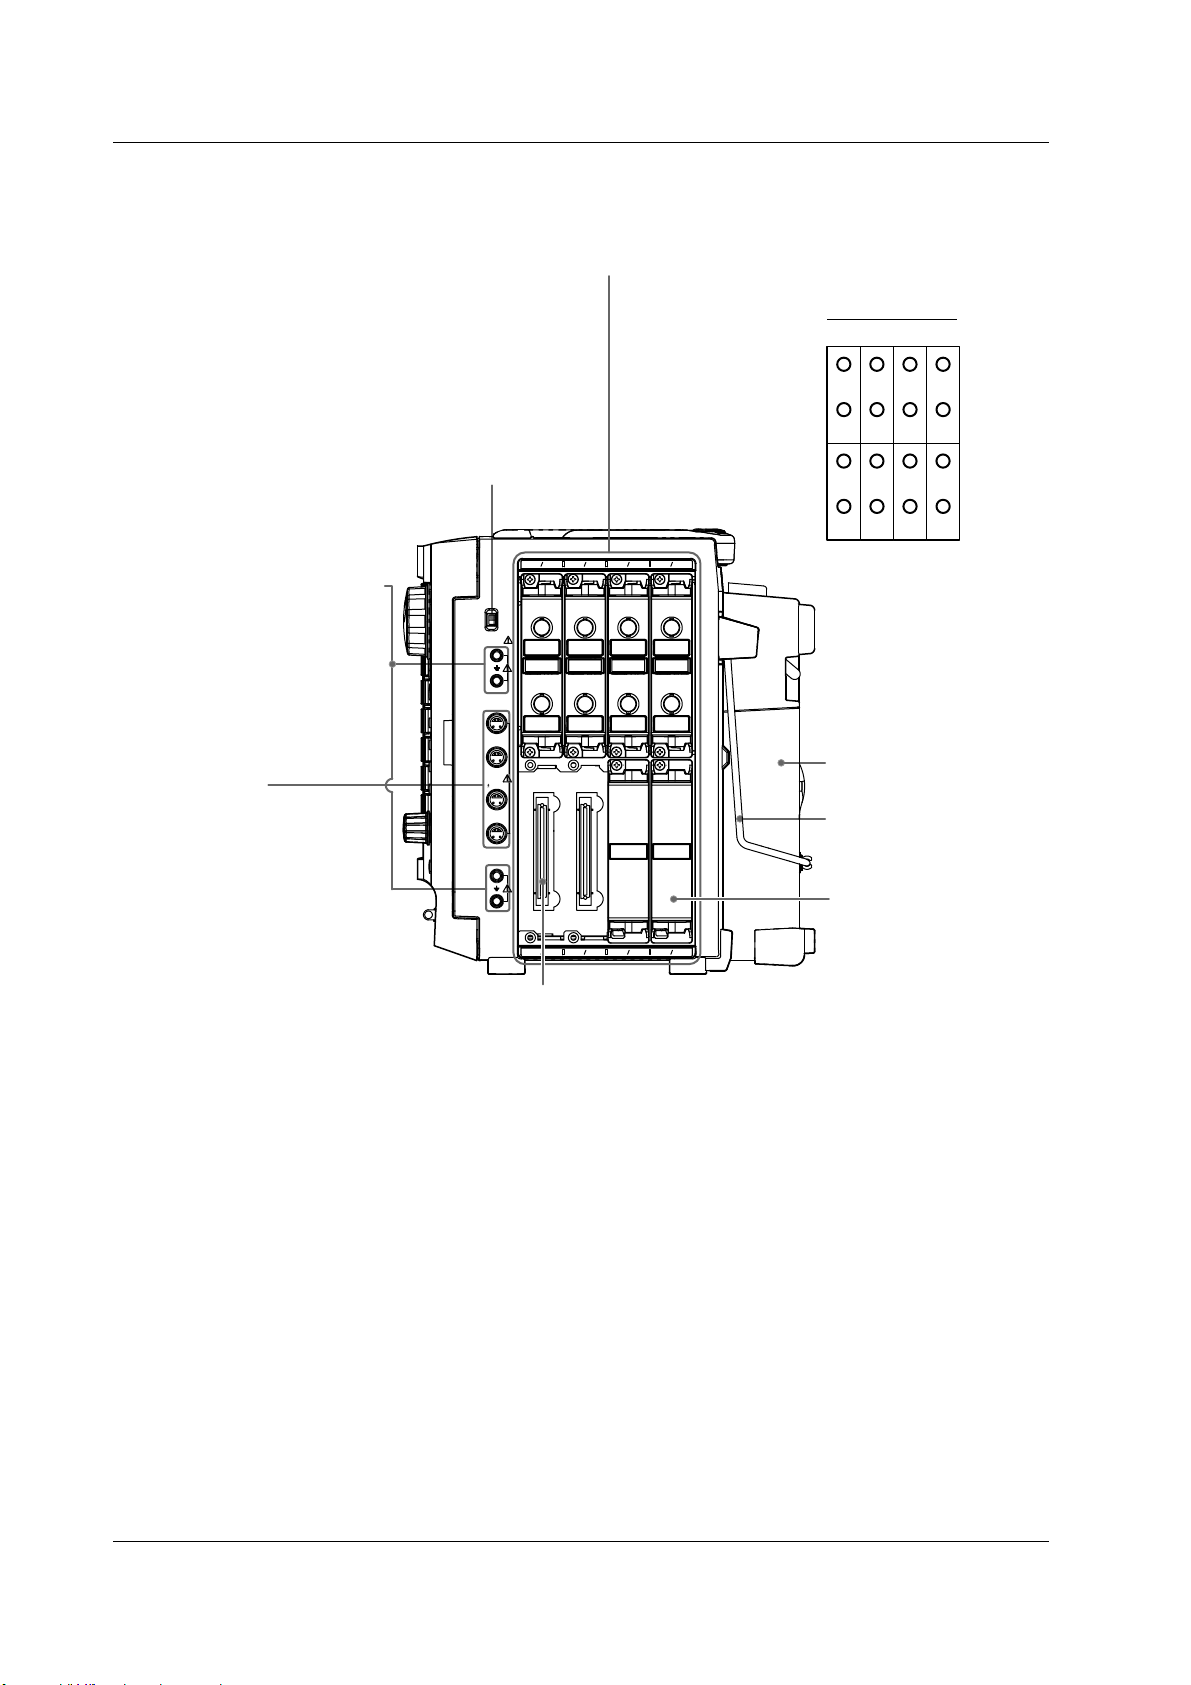
1.1 Panels
Right Side Panel
Input module installation slot
A total of eight slots in the top and bottom rows.
For the installation and removal procedure of
input modules, see section 3.3.
Input channel
arrangement
Slot 1 2 3 4
Acquisition memory backup ON/OFF
Tu rns ON/OFF the battery power for backing
up the acquisition memory.
For the acquisition memory backup function,
see section 7.7.
Functional ground terminal
Used to connect the ground
line from the high-voltage
differential probe or enhance the
grounding of the measurement
system. For the probe connection
procedure, see section 3.7.
Probe power
supply terminal
Used to supply power (±12 V)
to the probes when using
current probes.
For the probe connection
procedure, see section 3.7.
CH1
CH3
CH5
CH4
CH11
CH13
CH12
ACQ
MEMORY
BACKUP
PROBE
POWER
( 12V)
CH2
ON
OFF
CH9
CH10
Input module connector
CH3
CH4
CH11
CH12
CH5
CH6
CH13
CH14
CH7
CH8
CH15
CH16
8
CH1
CH2
CH9
CH10
CH7
CH8
CH6
Slot 5 6 7
Built-in printer
Stand
For the installation procedure,
see section 3.2.
Empty slot protection
cover panel
CH15
CH14
CH16
Attached to the slots that are
not used.
1-2
IM 701240-01E
Page 26
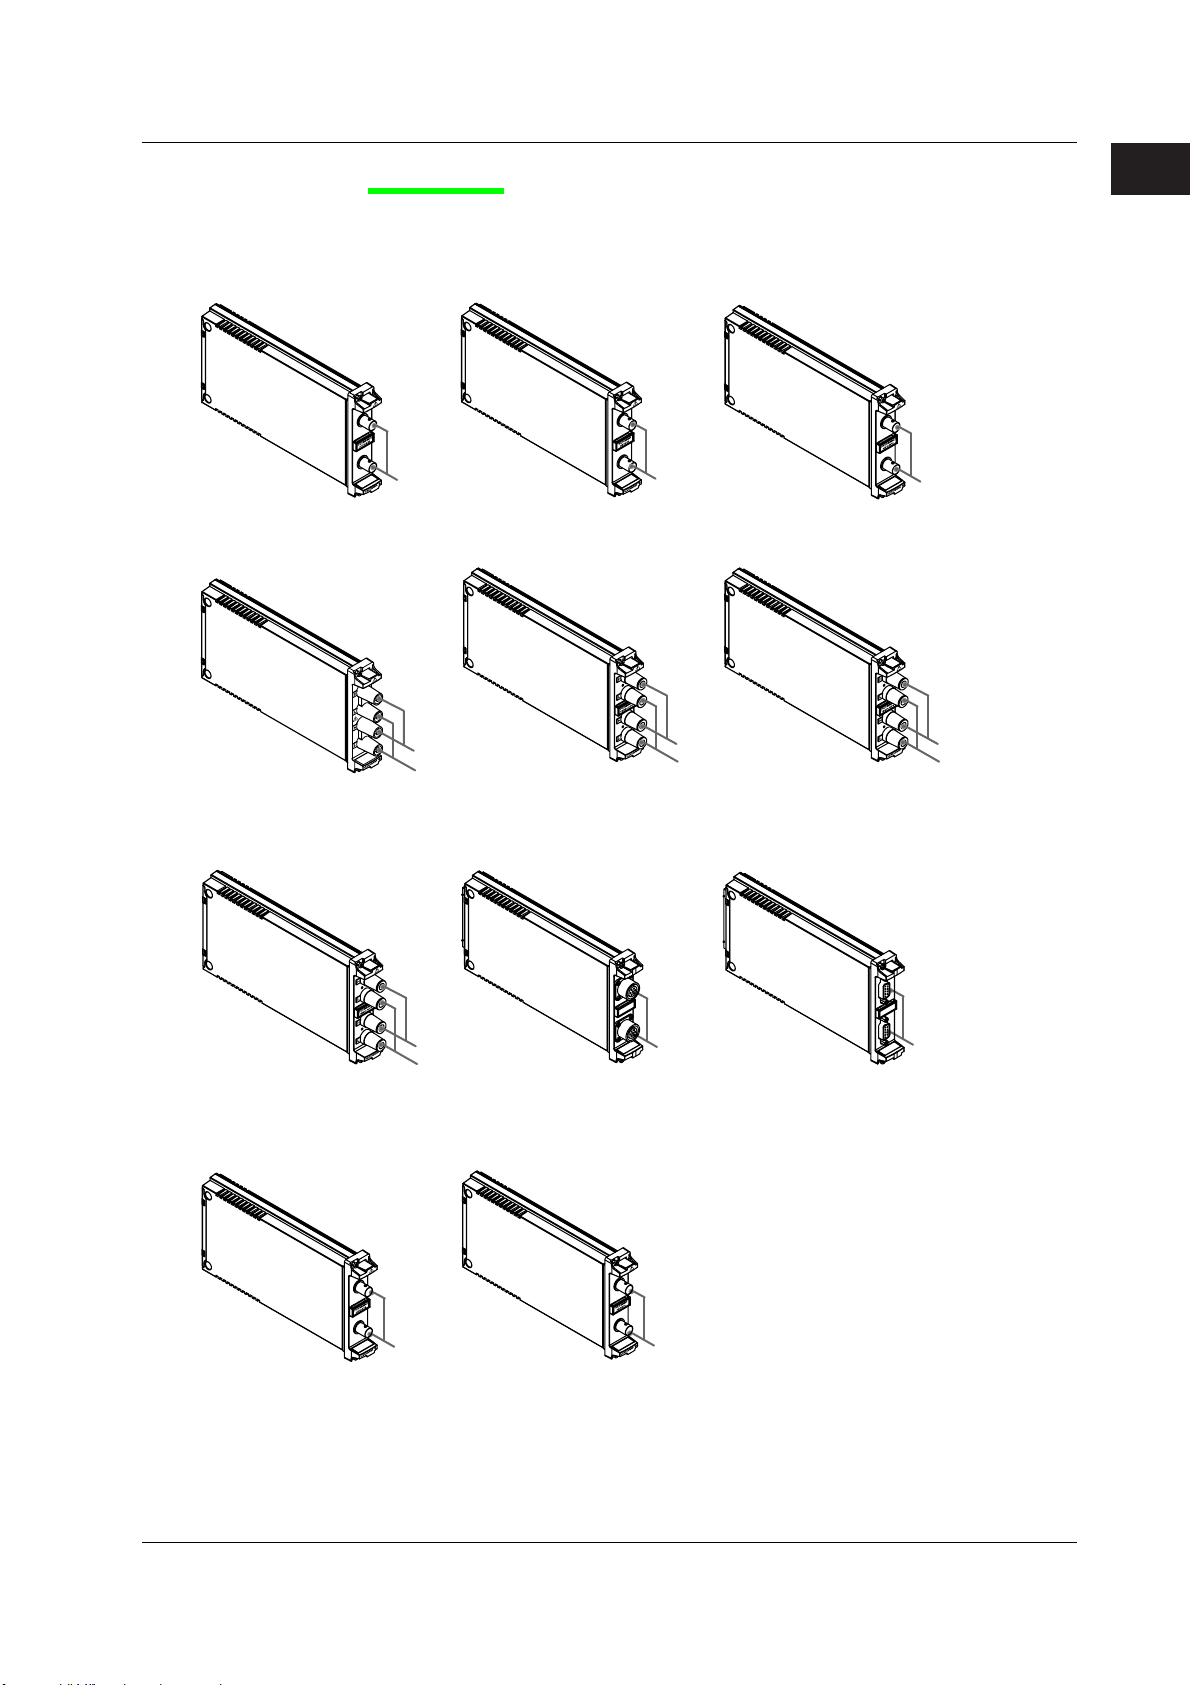
1.1 Panels
Input Modules
The following 11 input modules are available.
High-Speed 10 MS/s, 12-Bit
Isolation Module
HS10M12 (model: 701250)
Input terminal
(2ch)
High-Voltage 100 kS/s, 16-Bit
Isolation Module (with RMS)
HV (with RMS) (model: 701267)
Temperature, High Precision
Voltage Isolation Module
TEMP/HPV (model: 701265)
High-Speed High-Resolution
1 MS/s, 16-Bit Isolation Module
HS1M16 (model: 701251)
Universal (Voltage/Temp.) Module
UNIVERSAL (model: 701261)
H input terminal
L input terminal
(2ch)
Strain Module (NDIS)
STRAIN_NDIS (model: 701270)
High-Speed 10 MS/s, 12-Bit
Non-Isolation Module
NONISO_10M12 (model: 701255)
Input terminal
(2ch)
Universal (Voltage/Temp.) Module (with AAF)
UNIVERSAL (AAF) (model: 701262)
H input terminal
L input terminal
(2ch)
Strain Module (DSUB, Shunt-Cal)
STRAIN_DSUB (model: 701271)
1
Names and Functions of Parts
Input terminal
(2ch)
H input terminal
L input terminal
(2ch)
Acceleration/Voltage Module
(with AAF)
ACCL/VOLT (model: 701275)
IM 701240-01E
H input terminal
L input terminal
(2ch)
Frequency Module
FREQ (model: 701280)
Input terminal
(2ch)
Input terminal
(2ch)
Input terminal
(2ch)
Input terminal
(2ch)
1-3
Page 27
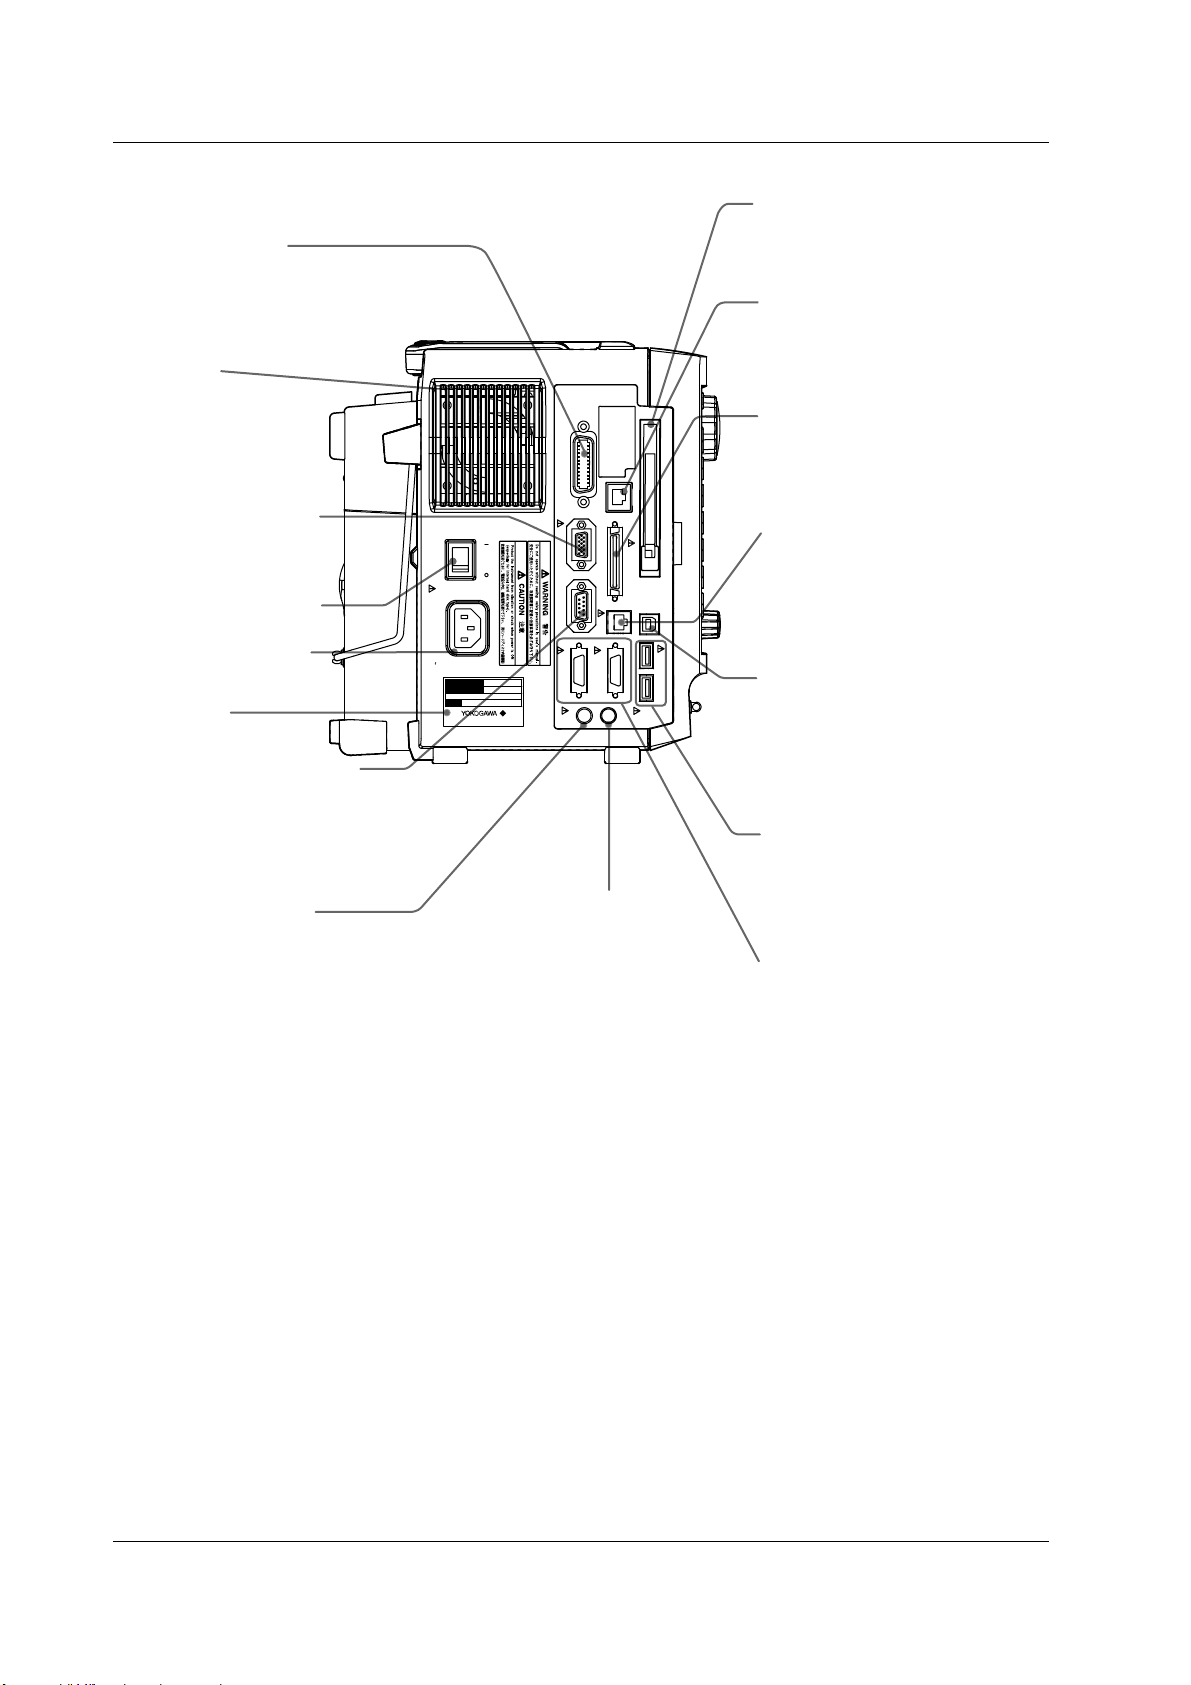
1.1 Panels
Left Side Panel
GP-IB connector
Used to perform communications via
the GP-IB interface. For a description
on how to use the terminal, see the
Communication Interface User’s Manual.
Vent holes
Video signal output
terminal
Outputs the displayed
image using SVGA RGB
signals. For a description
on how to use the terminal,
see section 14.4.
Main power switch
For the power ON/OFF
operation, see section 3.4.
Power connector
For details on connecting
the power, see section 3.4.
Name plate
RS-232 interface connecter
Used to perform communications
with a personal computer (PC)
via the RS-232 interface.
For a description on how to use the
terminal, see the Communication
Interface User’s Manual.
Trigger input terminal
Used to input external trigger signals.
For a description on how to use the
terminal, see section 14.1.
GP-IB
(
100-120V/200-240V AC
300VA MAX 50/60Hz
MODEL
SUFFIX
NO.
Made in Japan
ON
OFF
POWER
IEEE488
)
VIDEO OUT
(
SVGA
)
SERIAL
(RS-232)
LOGIC B
TRIG IN
100BASE-TX
START/
STOP
LOGIC A
LINK
ACT
SCSI
EXT CLK IN
TRIG OUT/
Trigger output/external clock
input terminal
Used to output trigger signals or input
clock signals.
For a description on how to use the
terminal, see sections 14.2 and 14.3.
USB
USB PERIPHERAL
PC card slot
Used to save data to a PC card.
For a description on how to use
the terminal, see section 13.2.
Ethernet port
(100BASE-TX)
Used to connect to a LAN.
For a description on how to use
the terminal, see section 15.1.
SCSI connector
Used to connect to a SCSI device
such as a SCSI hard disk.
For a description on how to use
the terminal, see section 13.5.
External start/stop input
connector
Used to externally control the
start/stop of the SL1400.
For a description on how to use
the terminal, see section 14.5.
USB connector for a
personal
computer (PC)
Used to connect a PC with a USB
interface.
For a description on how to use
the terminal, see the Communication
Interface User’s Manual.
USB connector for peripherals
Used to connect a USB keyboard, USB
printer, USB mouse, or USB storage.
For a description on how to use the
terminal, see sections 4.3 and 12.2.
Logic signal input connector
Used to measure logic signals.
For a description on how to use
the terminal, see section 3.12.
1-4
IM 701240-01E
Page 28
1.2 Panel Keys and Knobs
MENU
DISPLAY
MODE
RESET
SELECT
RECORD
ALL CH
RANGE
POSITION
TRIG'D
MANUAL TRIG
START/
STOP
CHART
SPEED
CH
RANGE
FINE
POSITION
FINE
1
Names and Functions of Parts
TRIG'D
MENU
DISPLAY
MODE
RECORD
START/
STOP
CHART
SPEED
CH
RANGE
FINE
RANGE
MANUAL TRIG
RESET
ALL CH
POSITION
FINE
SELECT
POSITION
•MENU Key (explained by function in each chapter and section)
Displays a setup menu for measurement conditions (sections 5.2, 5.20, 7.2, 7.3, and
7.5), record conditions (chapter 9), triggers (chapter 6), waveform computation
(chapter 10), store and recall of setup parameters (section 13.1), screen image data
printing (chapter 12) and saving (sections 13.12, 13.13, and 15.3), system
configuration (sections 3.6, 16.1 to 16.3, and 17.4), initialization and calibration
(sections 4.4 to 4.6), remote control (Communication Interface User’s Manual),
network (chapter 15), backlight (section 16.4), self-test (17.3), etc. The displayed
menu varies depending on the mode selected using the MODE key.
• DISPLAY Key (Chapter 8)
Displays a menu related to the screen display.
•MODE Key (Section 9.1)
Displays a menu used to select the mode. Three modes are available: Memory, Chart
Recorder, and X-Y Recorder.
• START/STOP Key (Sections 7.1, 9.4, and 9.6)
Starts/Stops waveform acquisition (or waveform recording). Waveform acquisition (or
waveform recording) is in progress when the indicator above the key is illuminated.
• CHART SPEED Key (Section 9.2)
This key is valid only when Chart Recorder mode is selected with the MODE key.
Press this key to display a menu used to set the chart speed.
• CH Key (explained by function in each chapter and section)
Displays a menu used to select the channel.
If you select a channel from CH1 to CH16, a menu is displayed that is used to turn the
display of each channel ON/OFF (section 5.1), set the vertical position (section 5.4),
coupling (section 5.5), Probe attenuation or current-to-voltage conversion ratio
(section 5.6), bandwidth limit (section 5.7), vertical axis expansion/reduction (sections
5.8 and 5.9), linear scaling (section 5.11), inverted display of waveforms (section
5.12), and waveform label (section 8.10).
If you select Logic A or Logic B, a menu is displayed that is used to set the vertical
position (section 5.4), vertical axis expansion/reduction (section 5.8), logic probe
(section 5.18), displayed bits (section 5.18), bit label (section 5.18), mapping (section
5.18), and logic waveform label (section 8.10).
• ALL CH Key (Section 5.19)
Displays a pop-up window containing a list of settings similar to those displayed on
the menu when the CH key is pressed.
• RANGE FINE Key (Section 5.8)
Press the key to illuminate the indicator above the key. In this condition, you can turn
the range knob to expand or reduce the vertical axis by specifying the magnification
(zoom rate).
• POSITION FINE Key
Press the key to illuminate the indicator above the key. In this condition, you can turn
the position knob to set the vertical display position of the waveform in 0.1-division
resolution.
• RANGE Knob (Section 5.3)
Sets the voltage range. You select the target channel with the CH key before you turn
this knob. If you change the setting when waveform acquisition is stopped, the new
setting takes effect when you restart the waveform acquisition.
IM 701240-01E
1-5
Page 29
FIL E
ZOOM
CURSOR
HISTORY
FEED
MEASURE
IMAGE
SAVE
PRI NT
PROTECT
1.2 Panel Keys and Knobs
• POSITION Knob (Section 5.4)
Sets the vertical display position of the waveform. You select the target channel with
the CH key before you turn this knob.
•MANUAL TRIG Key (Section 6.19)
Press the key to forcibly activate a trigger.
• RESET Key
Resets the numeric entry to the default value.
• SELECT Key
Applies the menu item that you selected using the jog shuttle.
• Arrow Keys( Keys)
Moves the numeric entry digit (cursor) left or right.
PROTECT
FEED
PRINT
IMAGE
SAVE
SNAPSHOT CLEAR TRACE
HISTORY
MEASURE
CURSOR
ZOOM
FILE
• PROTECT Key (Section 16.5)
Pressing this key causes the LED above the key to illuminate, and the front panel
keys to be disabled. Pressing the key again clears the condition.
• FEED Key (Section 3.5)
Feeds the paper in the built-in printer.
• PRINT Key (Section 12.1)
Executes the printing of the screen image. You can enter the print settings on the
PRINT menu that appears when you press the MENU key.
•IMAGE SAVE Key (Section 13.12)
Saves the screen image data to a storage medium. You can enter the storage
settings of the screen image data on the IMAGE menu that appears when you press
the MENU key.
• SNAPSHOT Key (Section 8.7)
Leaves the current displayed waveform on the screen in black and white. Waveforms
acquired using the snapshot function can be saved and loaded.
• CLEAR TRACE Key (Section 8.7)
Clears the waveform acquired using the snapshot function and accumulated
waveforms.
• HISTORY Key (Sections 11.1 to 11.3)
Displays a menu used to recall data using the history memory function.
•MEASURE Key (Sections 11.5 and 11.6)
Displays a menu used to perform automated measurement of waveform parameters
and statistical processing.
• CURSOR Key (Section 11.4)
Displays a menu used to perform cursor measurements.
• ZOOM Key (Section 8.5)
Displays a menu related to the zoom display of waveforms.
• FILE Key (Chapter 13)
Displays a menu used to save various data to, recall various data, or execute file
operations on a storage medium such as a PC card and external SCSI device
(option).
1-6
IM 701240-01E
Page 30
1.3 Display Screens
g
Normal Display Screen
Scale value of the vertical
axis (section 8.9)
Span corresponding to the displayed
waveform (section 5.3)
Setup channel and its
measurement
range (section 5.3)
Channel number of
the scale value
Trigger level
(section 6.5)
Record length (see the explanation below)
Record time
Trigger
position
Channel number of
the displayed waveform
Sample rate
Acquisition mode
(See the explanation below.)
1
Names and Functions of Parts
T/div
(Time per division)
Ground level
Vertical position
(section 5.4)
Time from the
trigger position
(section 6.2)
Waveform
acquisition
count
(section 7.2)
Date/time when the displayed waveform was acquired
Waveform acquisition status
Stopped Pre...: Acquiring pre data
Running Post...: Acquiring post data
Waiting for trigger
HD out: Continuous writin
Trigger type (chapter 6)
Trigger mode
(section 6.1)
to hard disk
Level indicator (section 8.12)
Comment
(sections 12.1 to 12.3 and 13.12)
Zoom Waveform Position on the Normal Waveform
<When displaying normal waveforms>
Record length
<When displaying zoom waveforms>
Display position of zoom waveform Z1
Display position of zoom
Z1
Z2
waveform Z2
Soft key menu
Current date/time
(section 3.6)
IM 701240-01E
Acquisition Mode Display
Normal: Normal mode
Env: Envelope mode
Avg: Average mode
BoxAvg: Box average mode
Note
In some cases, the LCD on the SL1400 may include few defective pixels. For details, see section
18.4.
1-7
Page 31

1.3 Display Screens
Screen When Displaying Zoom Waveforms
T/div (time per division) of Z1
Zoom range of Z1
Normal waveform
display area
Display position of zoom waveform Z1
on the normal waveform
Display position of zoom waveform Z2
on the normal waveform
Zoom range of Z2
T/div (time per division)
of the normal waveform
display
Record length of Z1
Zoom waveform
display area
Z1 zoom waveform
display area
T/div (time per division)
of Z2
Record length of Z2
Z2 zoom waveform
display area
1-8
IM 701240-01E
Page 32

1
Chapter 2 Explanation of Functions
2.1 System Configuration and Block Diagram
System Configuration
USB PERIPHERAL
interface
USB storage device
(MO, HDD, or flash memory)
Save/Load data
SCSI
2
Explanation of Functions
USB keyboard
External SCSI device
(MO, Zip drive, etc.)
• External clock input
• External trigger input
• Video signal output
• Trigger output
Device under
measurement
• Module
• Probe
1
2
Signal input
• Mesurement lead
1 • High-Speed 10 MS/s, 12-Bit
Isolation Module
• High-Speed High-Resolution
1 MS/s, 16-Bit Isolation Module
• High-Speed 10 MS/s, 12-Bit
Non-Isolation Module
• High-Voltage 100 kS/s, 16-Bit
Isolation Module (with RMS)
• Temperature, High Precision
Voltage Isolation Module
• Universal (Voltage/Temp.) Module
• Universal (Voltage/Temp.) Module
(with AAF)
• Strain Module (NDIS)
• Strain Module (DSUB, Shunt-Cal)
• Acceleration/Voltage Module
(with AAF)
• Frequency Module
2 • Differential probe
• Current probe
•
Logic probe
Built-in printer
(rear panel)
SL1400
• FTP server
• FTP client
• Web server
FTP
server
Built-in HDD (option)
USB PERIPHERAL
interface
• Waveform data
• Setup data
• Screen data
Personal
computer
(PC)
PC card
Shared HDD
Ethernet interface (option)
PC
Network printer
USB mouse
Screen data
USB printer
• GP-IB interface
• RS-232 interface
• USB interface
(Remote control through
command communications)
• SCSI
(data download)
Printer
Printer
server
Printer
IM 701240-01E
2-1
Page 33

2.1 System Configuration and Block Diagram
Block Diagram
Module Block Diagram
Plug-in Module CH1 - CH16
2-2
701250(HS10M12)
ATT
ATT
701255(NONISO_10M12)
ATT
ATT
701251(HS1M16)
ATT
ATT
701267(HV(with RMS))
H
ATT
L
H
ATT
L
701261(UNIVERSAL)
701262(UNIVERSAL(AAF))
RJC
H
ATT
L
RJC
H
ATT
L
701265(TEMP/HPV)
RJC
H
ATT
L
RJC
H
ATT
L
701270(STRAIN_NDIS)
701271(STRAIN_DSUB)
+
Inst.
AMP
-
+
-
+
Inst.
AMP
-
+
-
701275(ACCL/VOLT)
ATT
ATT
701280(FREQ)
ATT
ATT
Signal Flow on the SL1400
The flow of the signal applied to the input signal varies depending on the input module. Here, the high-speed 10
MS/s, 12-bit isolation module (701250 (HS10M12)) is used as an example for the explanation. (For details on the
flow of the signal of each module, see the block diagram.)
The signal applied to the two input terminals is first processed by the input section of each module.
On the 701250 (HS10M12), (1) the attenuator (ATT) attenuates and the amplifier (AMP) amplifies the input signal,
(2) the filter (FLT) limits its bandwidth, and (3) the A/D converter samples the input signal at a sample rate of 10
MS/s (10 million times per second) and converts the signal to digital data. Then, the signal passes through the
isolator and ASIC and enters the waveform processing ASIC (ACQ-ASIC).
The 16 channels of digital data collected at the CPU board passes through the waveform processing ASIC (ACQASIC) and stored in the acquisition memory (ACQ Memory). The digital data stored in the ACQ memory is
compressed at high speeds by the waveform processing ASIC (ACQ-ASIC), passes through the graphic controller,
and shown on the SVGA TFT color display.
The SL1400 can acquire simultaneously up to 16 analog input channels and 16-bit logic data.
AMP
AMP
Isolation Block
AMP
AMP
AMP
AMP
Isolation Block
AMP
AMP
Isolation Block
AMP
AMP
Isolation Block
AMP
AMP
Isolation Block
AMP
Bridge
Power
AMP
Bridge
Power
Isolation Block
Current source
AMP
Current source
AMP
Isolation Block
AMP
AMP
Isolation Block
FLT
12
AD
FLT
AD
FLT
AD
FLT
AD
FLT
AD
FLT
AD
FLT
AD
FLT
AD
FLT
AD
FLT
AD
AD
AD
FLT
DAC
FLT
DAC
FLT
AD
FLT
AD
FLT
COMP
FLT
COMP
12
12
12
16
16
16
16
16
16
16
16
Isolator
AD
AD
16
16
Isolator
Isolator
Isolator
Isolator
Isolator
16
16
Isolator
Isolator
CPU
ASIC
ASIC
ASIC
ASIC
CPU
ASIC
CPU
ASIC
ASIC
ASIC
ASIC
ASIC
Acquisition Block Diagram
ACQ Memory
50MW
GIGAZoom
Engine
(ACQ-ASIC)
Logic Probe
POD-A
POD-B
Logic Probe
Ext. trig In/out
Ext. Clk In
CPU Block Diagram
CPU
Main Memory
64 MB
Printer
Controller
Graphic
Controller
PC CARD
SCSI
USB
GP-IB
RS-232
100 BASE-LAN
SVGA 800 × 600
40 GB
HDD
USB Port
GP-IB Port
RS-232 Port
Ethernet
Internal Thermal
Printer (A4 width)
10.4 Color TFT
VIDEO OUT(SVGA)
SCSI Port
IM 701240-01E
Page 34

1
2.2 Setting the Horizontal and Vertical Axes
Horizontal (Time) Axis «For procedures, see section 5.2.»
Record Time
When using the internal clock*, the time axis scale is set using the length of time within
one screen. The record time is the length of time within one screen. The record time is
set in units of second, minute, hour, and day. The transition from seconds to minutes to
hours to days is automatically performed. The selectable record time varies depending
on the maximum record length installed in the SL1400, the number of channels whose
display is turned ON, and the specified sample rate.
* Internal clock and external clock (time base selection)
Under the initial setting, the sampling timing of waveform data is controlled by the clock signal
generated from the time base circuit within the SL1400.
The sampling timing can also be controlled by a clock signal applied externally. External clock
signals are input through the external clock input terminal on the left panel facing the SL1400.
This external clock input is useful for observing a signal whose period varies or for observing
waveforms by synchronizing to the clock signal of the signal being measured.
T/div
T/div is 1/10th the record time or the time per one grid square (1 div).
2
Explanation of Functions
Record time 5 ms
10 div
1 div = 500 µs
Record time 10 ms
10 div
1 div = 1 ms
Sample Rate
The sample rate is the number of times the measured waveform is sampled (in unit of S/
s). The sample rate is set according to the measurement purpose or the speed of
variation.
The maximum sample rate varies depending on the module. The SL1400 can display
waveforms correctly up to one-half the frequency of the sample rate as defined by the
Nyquist sampling theorem.*
* If the sample rate is comparatively low with respect to the input signal frequency, the
harmonics contained in the signal are lost. In this case, some of the harmonics will appear at
low frequencies due to the effects described by the Nyquist sampling theorem. This
phenomenon is called aliasing. You can prevent aliasing by acquiring waveforms with the
acquisition mode set to envelope.
Aliasing signal Input signal Sampling point
IM 701240-01E
2-3
Page 35

Record length
2.2 Setting the Horizontal and Vertical Axes
Record Length
The term
in the acquisition memory. The record length changes when you change the record time
or sample rate (see appendix 1). The following equation holds: record length = record
time × sample rate. The maximum record length of the SL1400 is 50 MW. The measured
waveform signal of a single channel can be acquired up to the maximum record length of
50 MW when only a single channel is displayed.
The record length that is stored in the acquisition memory and the record length of the
displayed waveform are the same.
record length
Display along the Time Axis
There are 10 divisions along the time axis, and 1001 points (logical number of points, not
the dots on the screen) are used to draw the waveforms. Therefore, if the record length
is exactly 1 kW (the number of acquired data points is 1001), the waveform is displayed
using 1001 points. However, if the record length is greater than or equal to 2 kW, the
maxim and minimum values are determined (P-P compression) and aligned at the same
time position (total number of points: 2002) to draw the waveform.
normally refers to the number of data points acquired per channel
Record length
Maximum value
Minimum value
1001 points*
0
* 1001 points is a logical number
of points. On the screen the
data is compressed to 651 dots
(when the zoom waveform area is
expanded to 751) and displayed.
1000
Vertical axis
Time axis
Sampled data
<P-P compression display>
Zooming Horizontally and Drawing Waveforms
The SL1400 is capable of expanding (zooming) the waveform horizontally (see page
2-34). When the zoom rate of the waveform is increased, the number of displayed
points decreases. The waveform is displayed P-P compressed until the number of
display points falls to 2002 points. When the number of displayed points falls below
1001, the waveform can no longer be displayed using continuous lines. In this case,
the display data is interpolated using the display interpolation function (see page 2-33)
so that the number of displayed points is 1001 points.
2-4
IM 701240-01E
Page 36

1
2.2 Setting the Horizontal and Vertical Axes
Dot Display
By default, the display interpolation function works automatically. However, you can
also disable the display interpolation in which case the waveform is displayed using
dots. In this setting, up to 100100 points (100 kpoints) of the acquired data are
displayed without using P-P compression. For example, if the display record length is
10 kW (the number of acquired data points is 10010 points), all the points of the
waveform are drawn by aligning 10 points vertically at the same time axis positions. If
the number of acquired data points exceeds 100100, only the data per given interval
is displayed. In other words, the data is decimated down to 100100 points (100 k
points) for displaying the waveform.
Record Time and Roll Mode Display
If the trigger mode is set to Auto, Auto Level, Single, or Log and the record time is set
greater than or equal to 1 s/div, the waveform is displayed in roll mode. In roll mode, the
displayed waveform is not updated using triggers (update mode). Rather, the oldest data
is deleted as new data is acquired, and the waveform is shifted from right to left on the
screen.
2
Explanation of Functions
Roll mode display allows waveforms to be observed in the same way as on a pen
recorder. It is useful in observing signals with a long period or signals that change slowly.
It is also useful in detecting glitches (spikes in the waveform) that occur intermittently.
IM 701240-01E
2-5
Page 37

2.2 Setting the Horizontal and Vertical Axes
Vertical (Voltage) Axis (for Modules Other Than the Strain Module) «For procedures,
see section 5.3.»
Setting the Voltage Range
The voltage range setting is used to adjust the displayed amplitude of the waveform so
that it can be easily observed. The voltage range is set using a voltage across the top
and bottom edges of the waveform display area (10 divisions). The voltage range
changes by switching the input section to an attenuator with different values of
attenuation. The sensitivity is changed in steps as in 1 V to 2 V to 5 V.
If 10 V is changed to 5 V
10 V 5 V
Vertical position
mark
Ground mark
Measurement Range and Display Range
The measurement range of the SL1400 is ±10 divisions (20 divisions of absolute width
(span) around 0 V. The display range of the screen is ±5 divisions (10 divisions of span).
The following functions can be used to move the displayed waveform and display the
waveform outside the display range by expanding/reducing the displayed waveform.
• Move the vertical position → See page 2-7.
• Zoom in or out vertically (expand/reduce) → See page 2-7.
+10 div
+5 div
Measurement
range
20 div
0 V
–10 div
Displayed
range
10 div
–5 div
2400 levels
Note
• For measuring the voltage with high accuracy
To measure the voltage with high accuracy, set the voltage range so that the input signal is
measured with as large amplitude as possible.
• Measurement Resolution
The measurement resolution varies depending on the module. For example, the 701250
(HS10M12) and 701255 (NONISO_10M12) sample the input signal using a 12-bit A/D
converter at a resolution of 150 levels per division. The 701251 (HS1M16), 701267 (HV (with
RMS)), 701261 (UNIVERSAL), 701262 (UNIVERSAL (AAF)), 701265 (TEMP/HPV), and
701275 (ACCL/VOLT) sample the input signal using a 16-bit A/D converter at a resolution of
2400 levels per division.
2-6
IM 701240-01E
Page 38

1
2.2 Setting the Horizontal and Vertical Axes
Vertical Position of Waveforms «For procedures, see section 5.4.»
Since the SL1400 can display the waveforms of the analog input channels (CH1 to
CH16) and computation waveforms (Math1 to Math8), the waveforms may overlap
making them difficult to be observed. In this happens, you can change the vertical
display position of waveforms for easier viewing.
The vertical position can be moved within a range of ± 5 div.
The voltage sensitivity per division switches around the vertical position mark.
Position: 3 div
Position:0 div
Vertical position
mark
Position: –3 div
Zooming in or out Vertically «For procedures, see sections 5.8 and 5.9.»
Zooming in or out by Setting the Magnification
You can expand or reduce the waveform display vertically in the range of ×0.1 to ×100
(varies depending on the input module) for each displayed waveform. The waveform
display can be zoomed around the vertical position.
2
Explanation of Functions
If V Zoom is set to ×2
Vertical position
mark
Ground mark
1 div = 1 V
1 div = 0.5 V
Zooming in or out According to the Upper and Lower Limits of the Display
Range
You can zoom in on the desired section of the observed waveform by specifying the
upper and lower limits of the vertical axis to change the display range to a narrower
range for each displayed waveform. Conversely, you can widen the display range to view
waveforms outside the display range.
+10 V
+6 V
Zoom
+4 V
–10 V
IM 701240-01E
+2 V
2-7
Page 39

2.2 Setting the Horizontal and Vertical Axes
Input Coupling «For procedures, see section 5.5.»
If you want to measure just the amplitude of an AC signal, it is best to remove the DC
component from the input signal. On the other hand, there are times when you want to
check the ground level or measure the entire input signal (both the DC and AC
components). In these cases, you can change the input coupling setting. By changing
the input coupling, the input method used to input the signal to the vertical control circuit
(voltage axis) is switched. The following types of input coupling are available.
DC
The input signal is directly coupled to the attenuator of the vertical control circuit. Select
DC if you want to measure the entire input signal (DC and AC components).
AC (Only When Measuring the AC Voltage)
The input signal is coupled to the attenuator of the vertical control circuit through a
capacitor. Select AC if you want to measure only the amplitude of the AC signal,
eliminating the DC components from the input signal.
GND
Input signal is coupled to the ground not to the attenuator of the vertical control circuit.
By selecting GND, you can check the ground level on the screen.
DC AC
Input
terminal
1 MΩ
Vertical
control
circuit
Input
terminal
1 MΩ
Vertical
control
circuit
GND
Input
terminal
Vertical
control
circuit
TC (Only When Measuring the Temperature)
Select TC if you are measuring the temperature using the 701261 (UNIVERSAL),
701262 (UNIVERSAL (AAF)), or 701265 (TEMP/HPV).
DC-RMS
Using the 701267 (HV (with RMS)), both the DC and AC components of the signal are
converted to rms values and displayed. An RMS conversion circuit is connected to the
vertical control circuit of the same input coupling circuit used when the coupling is set to
“DC.”
AC-RMS
Using the 701267 (HV (with RMS)), only the AC component of the signal is converted to
rms values and displayed. An RMS conversion circuit is connected to the vertical control
circuit of the same input coupling circuit used when the coupling is set to “AC.”
DC-RMS AC-RMS
Input
terminal
1 MΩ
Vertical
control
circuit
RMS
conversion
circuit
AD
Input
terminal
1 MΩ
Vertical
control
circuit
RMS
conversion
circuit
AD
2-8
ACCL (Only When Measuring Acceleration)
Select ACCL if you are measuring acceleration on the 701275 (ACCL/VOLT).
IM 701240-01E
Page 40

1
2.2 Setting the Horizontal and Vertical Axes
Probe Attenuation or Current-to-Voltage Conversion Ratio «For procedures, see section 5.6.»
For voltage (current) measurement, a probe is normally used in connecting the circuit
being measured to the signal input terminal. Using a probe has the following advantages.
• Prevents disturbing the voltage and current of the circuit being measured.
• Inputs the signal with no distortion.
• Expands the measurable voltage (current) range of the SL1400.
When using a probe, the attenuation setting on the SL1400 must be set equal to the
probe attenuation or current-to-voltage conversion ratio so that the measured voltage
(current) can be read directly.
The SL1400 has the following attenuation settings: 1:1, 10:1, 100:1, 1000:1, 10A:1V,
*1
and
100A:1V.*2 If you are using a probe other than the ones provided as accessories (sold
separately), set the attenuation ratio on the SL1400 according to the attenuation of the probe.
*1 Output voltage rate: 0.1 V/A
*2 Output voltage rate: 0.01 V/A
Note
Use a probe that matches the input capacity of each module. Otherwise, the capacity cannot be
adjusted.
Bandwidth Limit «For procedures, see section 5.7.»
A bandwidth limit can be applied for each module. By limiting the bandwidth, you can
eliminate high frequency components (such as high frequency noise) from the input
signal for waveform observation.
2
Explanation of Functions
Linear Scaling «For procedures, see section 5.11.»
When measuring the voltage (current), strain, or frequency (number of rotations, period,
duty cycle, power supply frequency, pulse width, pulse integration, and velocity), there
are two methods of linear scaling: “AX+B” and “P1-P2.”
AX+B
Scaling is performed using the specified scaling coefficient A and offset B according to
the equation shown below. Cursor measurement values and automated measurement
values of waveform parameters are displayed using scaled values. You can also assign
a unit to the linearly scaled value.
Y = AX + B (where X is the measured value and Y is the scaling result)
P1-P2
Specify arbitrary scale values (P1:Y and P2:Y) for the measured values of two arbitrary points
(P1:X and P2:X). The conversion equation (y = ax + b) is derived from these four values.
Scale value
P2:Y
P1:Y
P1
y = ax + b
P2
P1:X
Measurement range
P2:X
Measured value
In addition, the current input value can be loaded into P1:X or P2:X.
IM 701240-01E
2-9
Page 41

2.2 Setting the Horizontal and Vertical Axes
Inversion «For procedures, see section 5.12.»
When measuring voltage or strain, the waveform can be displayed with the vertical axis
inverted around the vertical position as shown below.
Normal display
Vertical position
mark
Pulse/Rotate «For procedures, see section 5.20.»
When the time base is set to external clock, one data sample is captured to the
acquisition memory when one pulse of the external clock signal is input. You can specify
the number of pulses of the external signal (in other words, the number of data samples
captured in the acquisition memory) that will correspond to one mechanical rotation (one
cycle). The selectable range is from 1 to 24000 pulses. For example, if the pulse/rotate
setting is set to 100 pulses, then 10 rotations of data samples will be acquired when the
record length is set to 1 kW. When the pulse/rotate setting is set to 1 pulse, one data
sample will correspond to one rotation (one cycle).
The pulse/rotate setting affects only the X-axis (horizontal) measurement values in
cursor measurements and the time axis display on the screen. For example, if the pulse/
rotate setting is 100 pulses and the record length is 1 kW, 1 division will be 1 rotation. In
this case, moving the cursor by 1 division during cursor measurements causes the
horizontal measured value to increase or decrease by “1.”
Inverted display
2-10
IM 701240-01E
Page 42

1
2.2 Setting the Horizontal and Vertical Axes
RMS Measurement «For procedures, see section 5.13.»
If the module of the selected channel is a 701267 (HV (with RMS)), the rms value of the
input signal can be observed.
AC-RMS
This setting is used when you want to observe only the rms values of the AC signal,
eliminating the DC components from the input signal.
Example
When the rms value of a 2-V
approximately 1.4 V is displayed (see the right figure below).
sinusoid input signal is measured, a DC waveform at
peak
2
Explanation of Functions
2 Vpeak
Approx. 1.4 V
The rms value is derived from the following equation:
T
1
T
u(t)2 dt
0
Where u(t) is the input signal and T is one period of the input signal.
If u(t) = Vmsinωt (where Vm is the peak value and ω is the angular velocity (= 2 πf, where f
is the frequency of the sinusoid signal)), the rms value, V
2π
Vrms
= The average of u(t)
2
over one cycle = =
1
(Vmsinwt)2 dwt
2π
0
As in the above example, when Vm is 2 V, the rms value, V
, is derived from
rms
Vm
2
, is approximately 1.4 V.
rms
DC-RMS
This setting is used when you want to observe the rms values of both the DC and AC
components of the input signal.
Example
When the rms value of a 2-V
component is measured, a DC waveform at approximately 1.7 V is displayed (see the
right figure below).
sinusoid input signal riding on top of a 1-V DC
peak
2 V
peak
+ 1 V
dc
Approx. 1.7 V
If the DC component is expressed as Vdc and the AC component as u(t) = Vmsinωt, the
rms value, V
(+DC), of the sinusoid input signal riding on top of the DC component is
rms
derived from the following equation:
2π
Vrms(+DC)
1
= =
(Vmsinwt+Vdc)2 dwt
2π
0
As in the above example, when Vdc is 1 V and Vm is 2 V, the rms value, V
Vm
2
2
2
dc)
(V
+
(+DC), is
rms
approximately 1.7 V.
IM 701240-01E
2-11
Page 43

2.2 Setting the Horizontal and Vertical Axes
Temperature Measurement «For procedures, see section 5.14.»
Thermocouple Types
The following types of thermocouples are available.
K, E, J, T, L, U, R, S, B, N, W, and Au7Fe
Selectable Temperature Units
You can select °C or K.
Reference Junction Compensation (RJC)
The voltage generated by a thermocouple depends on the temperature of the spot of
measurement and the reference junction temperature. In this case, the function used to
compensate the temperature on the measurement instrument side to the cold junction is
referred to as reference junction compensation. The SL1400 normally performs
reference junction compensation with the built-in RJC circuit. The SL1400 allows you to
turn ON or OFF the internal reference junction compensation.
Burnout
This function is used to accurately detect a burnout in the thermocouple. If the
thermocouple measurement input detects a burnout, the measured value is fixed to the
upper limit of the measurement range of each thermocouple.
Strain Measurement «For procedures, see section 5.15.»
Strain can be measured by connecting a strain gauge bridge (bridge head) or a strain
gauge transducer to the strain module (701270 (STRAIN_NDIS) or 701271
(STRAIN_DSUB)).
Relationship between the Strain (µSTR) and the Transducer Output (mV/V)
The SL1400 allows the unit to be changed between “the strain unit (µSTR: ×10–6 strain)”
and “the output unit of the strain gauge transducer (mV/V)
exists between µSTR and mV/V.
* Unit corresponding to the output of the strain gauge transducer. A value expressing the
transducer output per volt applied to the bridge in mV. You can set the bridge voltage
(excitation: voltage applied to the bridge) from 2 V, 5 V, and 10 V. However, since the mV/V
value is a converted value, the measured value is basically constant.
mV/V = 0.5×(µSTR/1000)
Example
500 (µSTR) → 0.5×500(µSTR/1000) = 0.25 (mV/V)
Gauge Factor (K) when mV/V Is Selected
You can set the gauge factor to an arbitrary value on the SL1400. However, if there are
no specifications on the strain gauge transducer, set K to 2.
If K is not 2, e is derived within the SL1400 using the following equation.
e = (4/K)×(V/E)
e: Measured value of the strain gauge transducer [mV/V]
V: Voltage measured on the bridge [V]
E: Voltage applied to the bridge [V]
K: Gauge factor
*
.” The following relationship
2-12
IM 701240-01E
Page 44

1
2.2 Setting the Horizontal and Vertical Axes
Shunt Calibration
The 701271 (STRAIN_DSUB) supports shunt calibration.
* Shunt calibration refers to the act of correcting the gain of the strain measurement by
connecting a known resistance (shunt calibration resistance) to the strain gauge in parallel.
For a description of the basic defining equation of strain, see appendix 9. For details on
shunt calibration, see appendix 10.
Acceleration Measurement «For procedures, see section 5.16.»
The Acceleration/Voltage Module (with AAF) (701275 (ACCL/VOLT)) measures
acceleration using the output signal from the acceleration sensor. Direction connection is
possible to a built-in amplifier type acceleration sensor. Direct connection is not possible
to a charge output type acceleration sensor that does not have a built-in amplifier.
Current Supply to Acceleration Sensors
The 701275 (ACCL/VOLT) can supply 4 mA of current to the acceleration sensor when
measuring acceleration.
Filter
If you set the bandwidth limit to Auto, the anti-aliasing filter (AAF) and low-pass filter are
enabled depending on the sample rate to eliminate high-frequency noise from the input
signal. Using the anti-aliasing filter when measuring voltage allows elimination of aliasing
noise resulting from FFT computation. The filter is effective not only during acceleration
measurement but also during voltage measurement.
2
Explanation of Functions
Frequency Measurement «For procedures, see section 5.17.»
The Frequency Module (701280 (FREQ)) measures frequency, number of rotations,
period, duty cycle, power supply frequency, pulse width, pulse integration, and velocity.
Measurement Items
Frequency
Frequency (Hz) = 1/Tw (s)
Period
Period (s) = Tw (s)
Tw(s)
RPMs/RPSs
RPMs = Frequency (Hz)/the number of pulses per rotation (Nr) × 60
RPSs = Frequency (Hz)/the number of pulses per rotation (Nr)
F (Hz)
Nr: The number of
pulses per rotation
IM 701240-01E
2-13
Page 45

2.2 Setting the Horizontal and Vertical Axes
Duty Cycle
Duty cycle (%) = T
T
T
(s)
high
Pulse Width
Pulse width (s) = T
T
(s)
high
Power Supply Frequency
Power supply frequency (Hz) = 1/Tw (s)
Tw(s)
Pulse Integration (Distance/Flow Rate)
Pulse integrated value = N (count) × physical amount per pulse (I)
Set the physical amount per pulse (I) to distance or flow rate. A suitable user-defined
unit can be assigned to the specified physical amount.
(s)/Tw (s) or Duty (%) = T
high
(s)
w
T
(s)
low
(s) or Pulse width (s) = T
high
T
(s)
low
(s)/Tw (s)
low
(s)
low
N (count)
l
Velocity
Velocity (km/h) = Distance per pulse l (km)/Tw (s) × 3600
Velocity (m/s) = Distance per pulse l (m)/Tw (s)
The distance and unit can be user defined (angular velocity, etc.).
Tw(s)
Distance
per pulse (l)
2-14
IM 701240-01E
Page 46

1
2.2 Setting the Horizontal and Vertical Axes
Deceleration Prediction and Stop Prediction
The 701280 (FREQ) automatically performs internal computation and displays waveforms
by predicting the deceleration curve and stop point even when the input pulse is suddenly
cut off. This function allows the measurement of waveforms of deceleration behavior that is
close to the actual physical phenomenon in applications in which the deceleration behavior
of an object that have inertia is measured such as in the brake test of automobiles.
Deceleration Prediction
The deceleration curve is computed according to the following equation using the
elapsed time after the pulse input stops (∆t).
Frequency (f) = 1/period (∆t)
The deceleration prediction starts after a pulse period (T) of the pulse one period
before the pulse input stopped elapses after the pulse input stopped.
Stop Prediction
The function determines the stop point at a constant time after the pulse input stops,
and the frequency is set to 0. The time from the point when the pulse input stops to
the point when the function determines that the object has stopped can be set to ×1.5,
×2, ×3, ... , ×9, and ×10 (10 settings) of the pulse period (T) of the pulse one period
before the pulse input stopped.
Pulse input stop
T×n
n: 1.5 to 10
2
Explanation of Functions
T
f
0
Deceleration
prediction
t
f = 1/ t
Stop prediction
0
Filter
Smoothing Filter (Moving Average)
The frequency module can display waveforms by taking the moving average of the
data in realtime. The order of moving average can be set in terms of time in the range
of 0.1 ms to 1 s (up to 25000
specified time divided by 40 µs.
The smoothing filter has the following characteristics.
• Converts a waveform that changes in steps to a smooth waveform.
• Improves the resolution by reducing the measurement jitter. The resolution improves
especially when measuring high frequencies or when expanding the display using the
offset function. Consequently, highly accurate measurements can be made.
• Can be used on all measurement parameters of the frequency module.
th
order). The order of moving average is equal to the
When using the smoothing filter
Filter order: 400 ms
Original
waveform
IM 701240-01E
2-15
Page 47

2.2 Setting the Horizontal and Vertical Axes
• When using the offset function (see this page) and making
measurements by expanding near 100 kHz
Original waveform
When using the smoothing filter
Filter order: 50 ms
Pulse Average
Measures the input pulse by dividing the pulse by the specified number of pulses (1 to
4096 pulses). The pulse average has the following characteristics.
• If pulse dropouts are present or pulse interval is fluctuating within a period,
measurements can be made by eliminating the effects from the dropout or
fluctuation (fluctuating component of the waveform used to measure the frequency
or period).
• The measured result is displayed as a value per input pulse even when pulse
average is used. Therefore, there is no need to perform scaling again.
• Can be used when measuring frequency, number of rotations, power supply
frequency, pulse integration, and velocity.
•Value/div: 200 Hz/div
•Upper display limit: 101 kHz
•Lower display limit: 99 kHz
The accuracy improves when
the smoothing filter is used.
N = 11
f1
f2
When pulse average is not used
Offset Function
The 701280 (FREQ) allows you to set the center of observation (offset value) and
expand the area around the offset value for close observation. It allows you to measure
the fluctuation around a certain frequency.
Logic Waveforms «For procedures, see section 5.18.»
Logic waveforms can be measured by connecting logic probes to the logic signal input
connectors (two connectors marked Logic A and Logic B) on the left side panel. A-1 to A8 (8 bits) and B-1 to B8 (8 bits) can be applied to the Logic A and Logic B ports,
respectively.
2-16
f3
When pulse average is used
IM 701240-01E
Page 48

1
2.3 Setting the Trigger
Trigger Type «For procedures, see chapter 6.»
The trigger used on the SL1400 can be classified into two main types: simple trigger and
enhanced trigger.
Simple Trigger
This function activates a trigger on a single trigger source.
Input Signal Trigger
A trigger is activated when the trigger source (input signal of CH1 to CH16, Logic A, or
Logic B) reaches or exceeds the preset trigger level (rising) or falls to or below the
trigger level (falling) or both.*
*A trigger is activated when the specified trigger condition is met. At this point, the waveform is
ready to be displayed on the screen.
Trigger slope
Trigger source
refers to the rising or falling edge of the signal.
When set to rising ( ), the trigger occurs here
2
Explanation of Functions
Trigger level
External Trigger
A trigger is activated using the external signal applied to the EXT TRIG IN terminal on
the side panel of the SL1400.
Line Trigger
A trigger is activated on the rising edge of the power signal that is being supplied to
the SL1400. Waveforms synchronized to the commercial power supply frequency (50
Hz or 60 Hz) can be observed.
Timer Trigger
A trigger is activated at specified time intervals (1 min to 24 hours) from a specified
time.
Specified date/time
Trigger is activated Trigger is activated Trigger is activated
Specified time
IM 701240-01E
2-17
Page 49

2.3 Setting the Trigger
Enhanced Trigger
A −>B(N) Trigger
A trigger is activated the Nth time condition B becomes true after condition A has
become true.
Tru e
A
Condition A
Tru e N times
B
Tri gger
Condition B
CH1 to CH16
L: Low level
H: High level
X: Don't care
LogicA/LogicB
Disable: Do not use logic input
Enable: Use logic input
Condition
Enter: True when the preset condition is met
Exit: True when the preset condition is not met
A Delay B Trigger
A trigger is activated the first time condition B becomes true after condition A has
become true and a preset time has elapsed.
Condition A
Condition B
CH1 to CH16
L: Low level
H: High level
X: Don't care
LogicA/LogicB
Disable: Do not use logic input
Enable: Use logic input
Condition
Enter: True when the preset condition is met
Exit: True when the preset condition is not met
2-18
IM 701240-01E
Page 50

1
g
g
e
l
e
g
g
e
2.3 Setting the Trigger
Edge on A Trigger
A trigger is activated when an edge trigger is detected on any of the channels set to
edge trigger while condition A is true.
Tru e
A
Edge
detection
Trigger
Condition A
CH1 to CH16
L: Low level
High leve
on't car
isin
Fallin
on't car
LogicA/LogicB
Disable: Do not use logic input
Enable: Use logic input
Condition
Tr ue: While all channels match in the
preset pattern
False: While all channels do not match
the preset pattern
2
Explanation of Functions
OR Trigger
A trigger is activated when any of the channels set to edge trigger meets the
condition. For example, a trigger can be activated on the rising edge of CH1 or CH2.
CH1 to CH16
isin
Fallin
on’t car
LogicA/LogicB
Disable: Do not use logic input
Enable: Use logic input
IM 701240-01E
2-19
Page 51

2.3 Setting the Trigger
B > Time Trigger, B < Time Trigger, and B TimeOut Trigger
A trigger is activated on the falling or rising edge of the pulse when the pulse width
(width over which condition B is met) exceeds (or drops below) a preset time. In the
case of a timeout trigger, a trigger is activated when a preset time elapses.
CH1 to CH16
L: Low level
H: High level
X: Don’t care
LogicA/LogicB
Disable: Do not use logic input
Enable: Use logic input
•B > Time Trigger
Time
B
Tri gg er
•B < Time Trigger
Time
B
Tri gg er
•B TimeOut Trigger
Time
B
Trigger
B: Pulse width
2-20
IM 701240-01E
Page 52

1
2.3 Setting the Trigger
Period Trigger
A trigger is activated by measuring the pulse period (period from the time condition T
is met to the next time when condition T is met).
T
CH1 to CH16
L: Low level
H: High level
X: Don’t care
LogicA/LogicB
Disable: Do not use logic input
Enable: Use logic input
•T > Time
A trigger is activated when condition B is met the second time, if the time (T) when
condition B is met the second time is longer than a specified time.
2
Explanation of Functions
When condition B: CH1=H and Time=10 µs
8 µs
CH1
B is true
8 µs
B is true
12 µs
B is true
B is true
Trigger activated here
•T < Time
A trigger is activated when condition B is met the second time, if the time (T) when
condition B is met the second time is shorter than a specified time.
When condition B: CH1=H and Time=10 µs
CH1
12 µs
B is true
12 µs
B is true
8 µs
B is true
B is true
Trigger activated here
• T1 < T < T2
A trigger is activated when condition B is met the second time, if the time (T) when
condition B is met the second time is within a specified time range (T1 to T2).
When condition B: CH1=H, Time1=10 µs, and Time2=14 µs
8 µs
8 µs
12 µs
16 µs
12 µs
IM 701240-01E
CH1
B is true
B is true
B is true
B is true
Trigger activated here
CH1
B is true
B is true
B is true
Trigger activated here
2-21
Page 53

w
w
e
e
.
B
t
t
2.3 Setting the Trigger
•T < T1, T2 < T
A trigger is activated when condition B is met the second time, if the time (T) when
condition B is met the second time is outside a specified time range (T1 to T2).
When condition B: CH1=H, Time1=6 µs, and Time2=10 µs
8 µs
8 µs
12 µs
8 µs
8 µs
4 µs
CH1
B is true
B is true
B is true
B is true
Trigger
activated
here
CH1
B is true
B is true
B is true
Window Trigger
A certain voltage range (window) is set and a trigger is activated when the trigger
source level enters this voltage range (IN) or exits from this voltage range (OUT).
IN
Center
Width
Trigger is activated
Window
Trigger is activated
CH1 to CH16
nters the windo
OUT:
xits from the windo
on’t care
OUT
Center
Trigger is activated
Width
B is true
Trigger
activated
here
Window
2-22
ogicA/Logic
isable:
nable:
dge trigger is used for the logic input
o not use logic inpu
se logic inpu
on’t care
Falling edg
ising edg
IM 701240-01E
Page 54

1
2.3 Setting the Trigger
Wave Window Trigger
This trigger is used to monitor the power supply waveform. It detects abnormalities in the
power supply (disruption, sag, surge, frequency fluctuation, voltage drop, etc.).
A reference waveform (realtime template) is created by setting a tolerance (window width) to a
waveform derived by averaging 1 to 4 cycles of waveforms before the target cycle of the
current waveform. The current waveform is compared against the realtime template. If the
current waveform falls outside the realtime template, a trigger is activated.
4 cycles of the waveform immediately before
Target waveform
Power supply waveform
2
Explanation of Functions
Realtime template
Averaged waveform
of 1, 2, and 4 cycles
Averaged waveform
+ tolerance width
•Wave Window Trigger Example
Disruption
(Trigger)
Sag
(Trigger)
CH1 to CH16
ON: Use as a trigger source
OFF: Not use as a trigger source
Trigger activated here
Compare the target waveform against
the realtime template
Trigger activated when the current waveform
falls outside the realtime template
Surge
(Trigger)
Sag
(Trigger)
Cycle Frequency: Power supply frequency of the measured item
Reference Cycle
Sync. Ch: Synchronization channel
Level: Level of the synchronization channel
Hys: Hysteresis of the synchronization channel
* Because waveform determination is performed per cycle in wave window trigger,
synchronization signal must be retrieved from the reference channel, and the start and end
points of comparison must be detected. This reference channel is called a synchronization
channel. Sync.Ch is used to specify the synchronization channel, and Level is used to specify
the start level of the synchronization channel. Normally, Sync.Ch is set to Auto (the channel
with the smallest number among the modules that can perform wave window trigger). If the
trigger is not activated adequately, specify an appropriate channel.
IM 701240-01E
1
for starting triggers
2-23
Page 55

2.3 Setting the Trigger
Trigger Mode «For procedures, see section 6.1.»
The trigger mode sets the conditions for updating the displayed waveforms. The
following six trigger modes are available.
Auto Mode
If a trigger occurs within a specified amount of time (approximately 50 ms, referred to as
the timeout period), the displayed waveforms are updated. If a trigger is not activated
within the timeout period, the displayed waveforms are automatically updated.
Auto Level Mode
Within the timeout period (approximately 1 s), the waveforms are displayed in the same
fashion as in the auto mode. If a trigger is not activated within the timeout period, then
the center value of the amplitude of the trigger source is detected, and the trigger level is
changed to that value. A trigger is activated using the new value, and the displayed
waveforms are updated.
Normal Mode
The waveform display is updated only when a trigger occurs. (The displayed waveforms
are not updated if a trigger does not occur.)
1/2 the amplitude
Trigger level Amplitude
1/2 the amplitude
Single Mode
When a trigger is activated, the displayed waveforms are updated only once, and
acquisition stops. This mode is suitable for observing a single-shot signal.
Single (N) Mode (Sequential Store Function)
This mode is selected when using the sequential store function (see section 2.4).
Waveforms are acquired and stored in different memory areas each time a trigger is
activated the specified number of times. Then, acquisition is stopped, and all the
acquired waveforms are displayed. Acquired waveforms can be displayed together, or
they can be displayed individually. This mode is useful for detecting sudden
abnormalities in a waveform.
1st acquisition 2nd acquisition nth acquisition
Log Mode
In this mode, the trigger settings are disabled. The specified record length of data is
acquired once when acquisition is started, and the displayed waveforms are updated.
2-24
IM 701240-01E
Page 56

1
Trigger Delay «For procedures, see section 6.3.»
Normally, the waveform around the trigger point is displayed. However, by setting a
trigger delay, you can display the waveform that is acquired a specified time after the
trigger point.
T (Trigger position)
Delay
Trigger point
Trigger Position «For procedures, see section 6.2.»
The trigger position specifies the position of the waveform captured in the acquisition
memory to be displayed on the screen. The point at which the trigger occurred is called
the
trigger point
trigger point and the trigger position match. By moving the trigger position, you can
observe the pre-trigger section of the waveform before the trigger point.
0%
Pre-trigger section Post-trigger section
. If the trigger delay described in the previous section is set to 0 s, the
Display record length
Trigger position
100%
2.3 Setting the Trigger
2
Explanation of Functions
Trigger Source, Trigger Slope, and Trigger Level «For procedures, see sections 6.5 to
6.16.»
Trigger Source
Trigger source
can set an external trigger signal or a commercial power supply as a trigger source.
Trigger Slope
For an edge trigger, trigger slope specifies how the trigger source is to cross a specified
level for activating the trigger. Select the trigger slope from
(both rising and falling).
Trigger Level
Trigger level
falling edge of the signal) and the like.
refers to the target channel on which trigger conditions are specified. You
(rising), (falling), and
refers to the voltage level that is used to determine the trigger slope (rising/
IM 701240-01E
2-25
Page 57

2.3 Setting the Trigger
Trigger Hysteresis «For procedures, see sections 6.5, and 6.10 to 6.16.»
If there is insufficient trigger level width such as when noise is present in the trigger source,
the trigger point fluctuates each time a trigger is activated. This causes the displayed
waveforms to be unstable. To solve this problem, a specified margin (hysteresis) is added
to the trigger level. You can select the trigger hysteresis from the following:
. The hysteresis width varies depending on the input module.
Hysteresis width
Trigger is activated
Trigger Hold-off «For procedures, see section 6.4.»
Trigger hold-off
once a trigger has been activated. This function is useful when observing a pulse train
signal, such as a PCM code, and you want to display the waveform in sync with
repetitive cycles; or when using the history memory function described later and you
want to change the waveform acquisition period.
refers to the act of temporarily stopping the detection of the next trigger
, , and
Trigger level
Input signal
Trigger source
signal
Trigger signal limited by hold off time t (when the trigger slope is set to rising edge)
Repetition period: T
t
Action-on-Trigger «For procedures, see section 6.18.»
A specified action can be executed each time a trigger is activated. The following five
types of actions are available.
Print the Screen Image Data (PRINT)
Prints the screen image to a specified printer.
Save the Screen Image Data (Image)
Saves the screen image data to the save destination specified in the IMAGE menu.
Save Waveform Data (Save to File)
Saves the waveform data in binary, ASCII, or floating format to the save destination
specified in the FILE menu.
2-26
Beep Sound (Buzzer)
Sounds a buzzer.
Send Mail
Sends an e-mail message to a specified address (when Ethernet interface option is
installed).
IM 701240-01E
Page 58

1
Manual Trigger «For procedures, see section 6.19.»
You can activate a trigger regardless of the specified trigger condition by pressing the
MANUAL TRIG key on the front panel.
2.3 Setting the Trigger
2
Explanation of Functions
IM 701240-01E
2-27
Page 59

2.4 Setting Waveform Acquisition Conditions and Display Conditions
Acquisition Mode «For procedures, see sections 7.2 and 7.3.»
When storing sampled data in the acquisition memory, it is possible to perform
processing on data and display waveforms based on the processed data. The following
four types of data processing are available.
Normal Mode
In this mode, sampled data are stored in the acquisition memory without data
processing.
Averaging Mode
Averaging
average of waveform data at the same time point (the same time in relation to the trigger
point).
The SL1400 takes the simple or exponential average of the waveform data and writes
the results to the acquisition memory. The averaged data is then used to generate the
display. You can set the attenuation constant to a value between 2 and 256 (in 2
where n is a natural number) and the averaging count to a value between 2 and 65536.
is a process in which waveforms are acquired repeatedly to obtain the
n
steps,
Exponential average (when set to infinite)
1
An = {(N – 1)A
N
th
:n
An
averaged value
th
Xn
:n
measured value
N
: Attenuation (2 to 256, 2
n–1
+ Xn}
n
steps)
Simple average (when set to 2 to 65536)
N
Σ X
n
n = 1
N
=
A
N
th
measured value
XnN:n
: Average count
(acquisition count, 2
n
steps)
Averaging is effective such as when eliminating the random noise riding on the signal.
Envelope Mode
In normal mode and averaging mode, if you increase the record time, you must reduce
the sample rate (the number of times data is acquired per second in the acquisition
memory) to keep the record length of the acquisition memory the same (see appendix 1).
However, in the envelope mode, the maximum and minimum values are determined at
every time interval from the data sampled at the maximum sample rate of each input
module. The time interval used to determine the values is twice the sample rate of the
normal mode. The maximum and minimum values are paired and stored in the
acquisition memory.
Envelope mode is effective when you want to avoid aliasing, since the sample rate is
kept high irrespective of the time axis setting. It is also effective when you want to detect
glitches (pulse signals which rise very fast) or display an envelope of a modulating
signal.
2-28
Envelope curve
IM 701240-01E
Page 60

1
2.4 Setting Waveform Acquisition Conditions and Display Conditions
Box Average Mode
This mode is valid on the 701250 (HS10M12) and 701255 (NONISO_10M12). The rolling
average of the data sampled at the maximum sample rate is determined. The resultant
data is stored in the acquisition memory and used to generate the display. Box averaging
is effective in eliminating small amounts of noise from the input signal. It can also remove
noise from a single-shot signal.
36
. . . . .
20
21
Input signal
(500 kS/s)
. . . . .
2
1
. . .
.
2
Explanation of Functions
Voltage
Box averaged data
Voltage
a
Sequential Store «For procedures, see section 7.4.»
In the case of the history memory function describe in the next subsection, the waveform
data of each block is updated in order until the measurement is stopped. However, in the
sequential store function, you specify the waveform acquisition count (number of blocks),
and the measurement stops when the specified count is reached. The updating of the
waveform display is carried out after acquiring the entire waveform data. To acquire
waveforms using this function, set the trigger mode to Single(N). The maximum
Single(N) count is equal to N that is explained in the history memory function. The stored
waveform data can be recalled using the history memory function.
The figure below shows an example when data is sequentially stored 100 times.
Display example when the acquisition count is 100
• Displays all waveforms
(When All display is
executed)
• Displays only the newest
waveform(When Selected
Record No. = 0)
Time
b
Time
• Displays only the oldest
waveform(When Selected
Record No. = –99)
IM 701240-01E
2-29
Page 61

2.4 Setting Waveform Acquisition Conditions and Display Conditions
History Memory «For procedures, see section 11.1.»
If the record length is set short on the SL1400, the memory is divided into blocks, and
waveform data is saved to the individual blocks each time a trigger occurs. If N
represents the maximum number of blocks determined by the record length, the oldest
waveform data block is cleared when the number of activated triggers exceeds N. If you
stop the measurement, you can recall the waveform data stored in each block and
display the data on the screen. Once the specified number of waveforms have been
stored, you can display any of the waveforms individually or all of them together. This
function is useful when capturing the changes in the waveform over time.
The following figure indicates an example when N = 100.
Holds waveform data of the last 100 triggers
Currently displayed waveform
(Selected Record No. = 0)
Selected Record No. 0
Displays waveforms before the
currently displayed waveform
(Select the Selected Record
Selected Record No. –25
No. in the range of –1 to –99)
You can also search a particular waveform from the past waveforms that are held
(history search function). For details, see “History Search” in section 2.7.
2-30
IM 701240-01E
Page 62

1
2.4 Setting Waveform Acquisition Conditions and Display Conditions
Realtime Recording to the Internal Hard Disk (Option) «For procedures, see section
7.5.»
The data can be recorded in realtime to the internal hard disk (option). The stored data
can be recalled. The realtime recording area is allocated on the internal hard disk in
advance (the default value is 50% of the entire capacity of the internal hard disk). You
can set the realtime recording area in the range of 30% to 70% of the entire capacity of
the internal hard disk when you format the internal hard disk (see section 13.6).
The time axis range and the maximum sample rate that allow realtime recording vary
depending on the number of channels to be recorded in realtime. For details, see
appendix 3.
The following two modes of realtime recording operation are available.
Single: Starts realtime recording with the start of waveform acquisition and stops
realtime recording when the specified record time is reached.
Continue: Starts realtime recording with the start of waveform acquisition and stops
realtime recording when the specified record time is reached. This
sequence is repeated the specified number of times (count).
If you select Single, Auto or Log trigger modes are available. If you select Continue, only
Log is valid.
Auto: Acquisition is started by pressing START. If the specified record time is
exceeded, old data is overwritten. Acquisition continues until you press
STOP.
Log: Acquisition is started by pressing START. When the specified record time is
reached, acquisition stops.
2
Explanation of Functions
How the Internal Hard Disk (Option) Is Used
Copy
Realtime recording
area
Realtime recording
Input signal
Recall the waveform
data
Measurements other
than realtime recording
(normal measurement)
(30 to 70% of the
total capacity)
Acquisition
memory
Copy
Data storage area
PC
SCSI, GP-IB, Ethernet,
or USB interface
Save/Load the waveform data
IM 701240-01E
2-31
Page 63

2.4 Setting Waveform Acquisition Conditions and Display Conditions
Action-on-Stop «For procedures, see section 7.6.»
A specified action can be carried out when the waveform is displayed after acquiring the
specified record length of data after the measurement is started or when measurement is
stopped. The following five types of actions are available.
Print the Screen Image Data (PRINT)
Prints the screen image to a specified printer.
Save the Screen Image Data (Image)
Saves the screen image data to the save destination specified in the IMAGE menu.
Save Waveform Data (Save to File)
Saves the waveform data in binary, ASCII, or floating format to the save destination
specified in the FILE menu.
Beep Sound (Buzzer)
Sounds a buzzer.
Send Mail
Sends an e-mail message to a specified address (when Ethernet interface option is
installed).
Backing Up the Acquisition Memory «For procedures, see section 7.7.»
If the ACQ MEMORY BACKUP switch on the right side panel of the SL1400 is turned
ON, the history memory data in the acquisition memory is backed up even when the
power supply is cut off. The data held in the acquisition memory is backed up
immediately before the power is turned OFF. This function protects the data in the
acquisition memory from sudden power failures.
Alkaline dry cells or nickel hydride rechargeable batteries (four AAA batteries) are
required for the backup. The backup time varies depending on the operating
environment.
For reference values of the backup time, see section 18.5.
Display Format and Waveform Mapping «For procedures, see section 8.1.»
Display Format
Waveforms can be displayed in divided windows to facilitate the viewing of multi-channel
waveforms and computed waveforms.
Waveform Mapping
You can select the mapping of the input channels to the divided windows from the
following:
Auto: The input channels whose display is turned ON are assigned in order by the
channel numbers.
Fixed: Waveforms are assigned in order from the top regardless of whether the input
channel display is turned ON/OFF.
User: The channels can be assigned arbitrarily to the divided windows regardless of
whether the input channel display is ON/OFF.
2-32
IM 701240-01E
Page 64

1
2.4 Setting Waveform Acquisition Conditions and Display Conditions
Display Interpolation «For procedures, see section 8.2.»
In areas where less than 1000 points of data exist in the 10 divisions along the time axis
(referred to as interpolation areas), a continuous waveform cannot be displayed because
there is not enough sampled points. In this case, waveform is displayed by interpolating
between data points. You can select the interpolation method from the following:
Linear Interpolation
Linearly interpolates between two points.
Sine Interpolation
sin x
Generates interpolation data using the function sin(x)/x then interpolates between
x
two dots using the resulting sine curve. Sine interpolation is suitable for observing sine
waves or similar waves.
Interpolation OFF
Displays discrete dots without performing interpolation.
Linear Interpolation Sine Interpolation Interpolation OFF
2
Explanation of Functions
If the interpolation is OFF, waveforms are displayed using dots. In this setting, up to
100100 points (100 kpoints) of the acquired data are displayed without using P-P
compression (page 2-4). For details, see page 2-5.
Graticule «For procedures, see section 8.3.»
You can change the type of graticule that is displayed to suit your needs. For example,
you can show a grid on the screen or show only the frame.
Accumulated Display «For procedures, see section 8.4.»
This mode holds each waveform on the screen for a time that is longer than the update
cycle, so that newer waveforms appear overlapped on older waveforms. If you select
Persist, the waveforms are accumulated.
Accumulated display is useful when you want to observe jitters and temporary turbulence
in waveforms. Accumulated display is also possible on waveforms that are recalled using
the history memory function.
IM 701240-01E
2-33
Page 65

2.4 Setting Waveform Acquisition Conditions and Display Conditions
Zooming in on the Waveform Horizontally «For procedures, see section 8.5.»
The displayed waveform can be expanded along the time axis. This function is useful
when the waveform acquisition time is set long and you want to observe a particular
section of the waveform closely. Zooming is not possible if the number of displayed
points on the screen is less than or equal to 10 (less than or equal to 50 for FFT
waveforms). The zoom position is set in units of divisions of the grid.
Display Format When the Waveform Is Zoomed
Zoomed waveforms of two locations can be displayed simultaneously (dual zoom).
Below are the combinations of the display methods of zoom waveforms.
Main: Main waveform display frame
Z1, Z2: Zoom waveform display frame
<Main>
<Z2><Z1>
<Main>
<Z1> or <Z2>
<Z1>
<Z2>
<Z1> or
<Z2>
When displaying Main (main waveform) and Z1 or Z2 (zoomed waveform)
simultaneously, a zoom box indicating the zoom position is displayed within the main
waveform display frame. The center of the zoom area corresponds to the center of the
zoom box.
Z1 box
Main waveform
display frame
Z1 waveform
display frame
Z2 box
Z2 waveform
display frame
Auto Scroll
The zoom box automatically moves (scrolls) in the specified direction. You can scroll
while viewing the expanded waveform.
2-34
IM 701240-01E
Page 66

1
2.4 Setting Waveform Acquisition Conditions and Display Conditions
X-Y Waveform «For procedures, see section 8.6.»
The voltage relationship between signals can be observed by assigning the voltage of
the input signal of the specified channel on the horizontal axis (X-axis) and the voltage of
another input signal (signal that has the display turned ON) on the vertical axis (Y-axis).
Simultaneous observation of X-Y waveforms and normal T-Y waveforms (waveform
display using voltage axis and time axis) is possible.
You can use the X-Y waveform display function to measure the phase angle between
two sine wave signals. For example, the waveform that appears when two sine
waveforms are shown on the X-Y display is called a Lissajous waveform. From this
waveform, the phase angle can be read.
Lissajous waveform
Phase
angle 0°
Phase
angle 45°
Phase
angle 90°
2
Explanation of Functions
Frequency
ratio
(X:Y)
1:1 1:2
Snapshot «For procedures, see section 8.7.»
If the trigger mode is set to a mode other than single, the displayed waveforms are
periodically updated or displayed in roll mode.
The snapshot function allows you to temporarily hold the waveform that would be cleared
when the screen is updated (snapshot waveform) on the screen. The snapshot
waveform is displayed in white, allowing for easy comparison against the updated
waveform. The snapshot waveform is a screen image waveform. You can save, load,
and print the screen image data, but cursor measurements, automated measurement of
waveform parameters, zoom, and computation cannot be performed on it.
Snapshot waveforms
Clear Trace «For procedures, see section 8.7.»
You can clear the snapshot waveform and restart averaging and accumulation using one
key operation.
Pressing the CLEAR TRACE key temporarily clears the measured waveforms from the
screen. Pressing the ESC key redisplays them.
1:3
Translucent Display «For procedures, see section 8.8.»
The pop-up menu is shown translucent so that the display under the pop-up menu can
be seen.
IM 701240-01E
2-35
Page 67

2.4 Setting Waveform Acquisition Conditions and Display Conditions
Scale Values «For procedures, see section 8.9.»
The upper and lower limits (scale values) of the vertical and horizontal axes of each
channel can be displayed.
Waveform Labels «For procedures, see section 8.10.»
A waveform label can be assigned arbitrarily to the input waveform of each channel
using up to eight characters.
Extra Window «For procedures, see section 8.11.»
This area displays data such as cursor measurement values and values resulting from
automated measurement of waveform parameters. The extra window is useful when
reading of the values is difficult because waveforms are overlapping them.
Level Indicators «For procedures, see section 8.12.»
The level of each waveform is displayed using an indication mark to the right of the
waveform display frame.
Trigger position
Waveform label
Level indicator
Scale value
Extra window
(Displays cursor
measurement values)
Channel Information, Numeric Monitor, and Waveform Display Area Expansion «For
procedures, see section 8.13.»
If you clear the setup menu by pressing ESC, channel information is displayed such as
the voltage/division, input coupling, probe attenuation (type), bandwidth limit,
temperature/division , thermocouple type, µSTR/division (or [mV/V]/division),
measurement range, acceleration/div, gain, bias, value/division, measurement mode,
and preset settings. However, some items are skipped when the number of displayed
channels increases.
Pressing ESC once when the channel information is displayed clears the channel
information and shows the numeric monitor.
Pressing ESC once when the numeric monitor is displayed expands the waveform
display area horizontally to cover the entire screen.
2-36
If you press SELECT when the channel information or waveform monitor is displayed or
when the waveform display area is expanded and an item is under jog shuttle control in
the setup menu that was showing immediately before you pressed ESC, the item is
displayed at the upper right of the display and can be controlled using the jog shuttle.
IM 701240-01E
Page 68

1
2.5 Recording in Recorder Mode
The SL1400 is equipped with an A-4 size printer. If Chart Recorder mode is selected in
the menu that appears when MODE is pressed and waveform acquisition is started, T-Y
waveforms (T-Y waveform recording) or numeric values can be recorded in realtime. In
addition, if X-Y Recorder mode is selected and waveform acquisition is started and
stopped, the X-Y waveform over the interval in which waveform was acquired can be
recorded (X-Y waveform recording).
Chart Recorder Mode «For procedures, see sections 9.1 to 9.5.»
Print Style
In Chart Recorder mode, the print style can be selected from the following two styles.
T-Y Waveform Recording
In T-Y waveform recording, recording is performed at the specified chart speed (10
mm/h to 20 mm/s). The scale used in T-Y waveform recording is fixed to 10 mm per
division on the horizontal axis (time axis). The scale on the vertical axis (voltage axis)
can be set to 10 mm per division or [1 division of the 10 equally divided chart
recording zone] per division. The recording can also be stopped automatically after
recording a specified length (shot recording).
Numeric Value Recording
Numeric values can be recorded at the specified time interval (1 s to 60 min). Up to 16
channels can be recorded. If waveform acquisition is started on more than 16
channels, 16 channels are recorded in the following order: CH1 to CH6, Logic A, and
Logic B.
2
Explanation of Functions
Acquisition Mode during Chart Recorder Mode
During Chart Recorder mode, the acquisition mode is set to envelope. The acquisition
mode cannot be changed using the ACQ menu as with the normal operation. However,
the acquisition mode can be changed to normal using other menus. Select normal mode
if you are using the acquired waveform as numeric data such as in an analysis.
Selectable Trigger Modes in Chart Recorder Mode
The following four trigger modes are available.
Auto
Recording on the built-in printer starts at the same time measurement is started by
pressing START/STOP. Recording continues until measurement is stopped by
pressing START/STOP again. The maximum number of divisions of the most recent
data that can be saved (see page 2-39) is saved in the internal memory.
Measurement start
The maximum number of
divisions of the most recent data
is saved in the internal memory.
Record start
Measurement stop
Record stop
IM 701240-01E
2-37
Page 69

2.5 Recording in Recorder Mode
Log
Recording on the built-in printer starts at the same time measurement is started by
pressing START/STOP. Measurement and recording stop automatically when the
maximum number of divisions of measured values that can be saved is recorded. The
maximum number of divisions of measured data that can be saved is saved in the
internal memory.
Measurement start
Record start
Single (Only during T-Y Waveform Recording)
Recording on the built-in printer starts when the trigger condition is met after
measurement is started by pressing START/STOP. The data is saved to the internal
memory at the same time recording is started. Measurement and recording stop when
the maximum number of divisions of measured values that can be saved is recorded.
The maximum number of divisions of measured data that can be saved is saved in the
internal memory.
The maximum number of
divisions of the data is saved
in the internal memory.
Measurement stop (the point where the maximum number
of divisions of data that can be saved was measured)
Record stop (the point where the maximum number
of divisions of data that can be saved was recorded)
Measurement start
Trigger condition met
Record start
Repeat (Only during T-Y Waveform Recording)
Recording on the built-in printer starts when the trigger condition is met after
measurement is started by pressing START/STOP. The data is saved to the internal
memory at the same time recording is started. Recording stops when the shot record
length of measured values is recorded. Then, the SL1400 enters the trigger-wait
state. The most recent shot record length of measured data is saved to the internal
memory.
Measurement start
Trigger condition met
Trigger-wait
state
Record start
The maximum number of
divisions of the data is saved
in the internal memory.
Trigger-wait
Record stop
(Point where the shot record
length of data is recorded)
Measurement stop
divisions of data that can be saved was measured)
Record stop
of divisions of data that can be saved was recorded)
Trigger condition met
state
The most recent shot record
length of data is saved in the
internal memory.
Record start
(the point where the maximum number of
(the point where the maximum number
Measurement stop
Record stop
(Point where the shot record
length of data is recorded)
2-38
IM 701240-01E
Page 70

1
2.5 Recording in Recorder Mode
Saving Data in the Internal Memory
In Chart Recorder mode, up to 1000 divisions of the recorded data are automatically
saved in the internal memory. The required section of the data that has been cleared
from the screen can be redisplayed after the recording is finished by using functions
such as zoom (limited to the data in the range defined by “Number of Data Points That
Can Be Saved” below). As with the normal data (data when the recorder mode is OFF),
cursor measurements, automated measurement of waveform parameters, normal
statistical processing*, zoom, and display setting modification in the DISPLAY menu can
be performed on the redisplayed data. The redisplayed data can also be saved as
waveform data in the same fashion as normal data.
Furthermore, the redisplayed data can be reprinted by changing the print conditions or a
PDF file of the reprint image can be created (see “Reprinting on the Built-in Printer” or
“Creating a PDF File of the Reprinted Image” on page 2-40).
* Cyclic statistical processing and statistical processing of history data cannot be performed in
Chart Recorder mode.
Number of Data Points That Can Be Saved
If the chart speed is slow, the number of data points that can be saved in the internal
memory is reduced. For example, if the chart speed is 10 mm/h, up to 100 divisions of
data (up to 4 days of data) are saved. If the chart speed is 20 mm/s, up to 1000
divisions of data (up to 8 minutes 20 seconds of data) are saved. The maximum
number of divisions that can be saved for each chart speed is as follows:
Chart Speed Maximum Number of Divisions That Can Be Saved
20 [mm/s] to 1 [mm/s] 1000
100 [mm/min] to 2 [mm/min] 1000
1 [mm/min] 500
100 [mm/h] 1000
50 [mm/h] 500
25 [mm/h] 250
20 [mm/h] 200
10 [mm/h] 100
2
Explanation of Functions
IM 701240-01E
For the relationship between the chart speed and sample rate, see appendix 2.
Functions That Cannot Be Used in Chart Recorder Mode
When making measurements in Chart Recorder mode, functions of history memory and
waveform computation cannot be used (The HISTORY key and MENU key > MATH
menu cannot be used).
Measured Data Compatibility
The measured data in Chart Recorder mode is not compatible with the measured data in
Memory mode. The measured/saved data in Chart Recorder mode cannot be loaded in
Memory mode, and vice versa.
2-39
Page 71

2.5 Recording in Recorder Mode
X-Y Recorder Mode «For procedures, see section 9.6.»
X-Y Waveform Recording:
In X-Y waveform recording, the X-Y waveform display starts when waveform acquisition
is started. If reprint is executed from the Reprint Setup menu after the record length of
waveform (fixed to 1 MW) is acquired or after stopping waveform acquisition, the X-Y
waveform acquired up to the point immediately before the measurement was stopped is
recorded on paper.
The scale of the X-Y waveform recording is 10 mm per division for both X- and Y-axes,
and the waveform recording area is ±10 divisions (20 divisions). The screen also shows
the X-Y waveform. Recording to paper can also be started automatically when waveform
acquisition is stopped (auto print).
Acquisition Mode during X-Y Recorder Mode
The acquisition mode is automatically set to normal mode during X-Y record mode. The
acquisition mode cannot be changed using the Menu key > ACQ menu as with the
normal operation.
Saving Data in the Internal Memory
In X-Y recorder mode, up to 1 MW of data is automatically saved in the internal memory.
Also, a PDF file of the reprint image can be created.
Functions That Cannot Be Used during X-Y Recorder Mode
When making measurements in X-Y Recorder mode, functions of history memory and
waveform computation cannot be used (The HISTORY key and MENU key > MATH
menu cannot be used). In addition, items set using the MENU key > ACQ menu cannot
be changed.
Measured Data Compatibility
The measured data in X-Y Recorder mode is not compatible with the measured data in
Memory mode. The measured/saved data in X-Y Recorder mode cannot be loaded in
Memory mode, and vice versa.
Reprinting on the Built-in Printer (Only during T-Y Recording) «For procedures, see
section 9.7.»
After the T-Y recording in Chart Recorder mode is finished, the data stored in the internal
memory can be recalled and reprinted by changing the print conditions.
Creating a PDF File of the Reprint Image «For procedures, see section 9.8.»
After the waveform recording in Chart Recorder mode or X-Y Reorder Mode is finished,
the data stored in the internal memory can be recalled and a PDF file of the reprint
image can be created.
In X-Y Recorder Mode, the most recent 1 MW of data stored in the internal memory are
output to the PDF file. If data exceeding 1 MW is recalled, the waveform displayed on the
screen and the waveform recorded on the printer may differ from the waveform output to
the PDF file.
2-40
IM 701240-01E
Page 72

1
2.6 Waveform Computation
Various computations can be performed on up to 800 kW of data on the SL1400. (If a waveform
greater than 800 kW is displayed, computation cannot be performed over all the data at once.)
The computed results become Math1 to Math8 waveforms.
Addition, Subtraction, Multiplication, and Division «For procedures, see section 10.1.»
Addition, subtraction, multiplication, and division can be performed between two arbitrary
waveforms of CH1 to CH16 and Math1 to Math7. These computations are useful in the
following cases.
Addition and subtraction: Comparison with the standard signal, confirmation of the
signal logic, phase comparison, etc.
Multiplication and division: Confirmation of the power waveform by applying the voltage
and current signals, etc.
2
Explanation of Functions
+Computation
waveform
–Computation
waveform
×Computation
waveform
Binary Computation «For procedures, see section 10.2.»
The specified waveform is converted to a digital waveform of 0s and 1s with respect to
the specified threshold level. The computation can be performed on CH1 to CH16 and
Math1 to Math7.
Power Spectrum Display «For procedures, see section 10.3.»
The power spectrum of the input signal can be displayed by taking the FFT (Fast Fourier
Transform). This is useful when you wish to check the frequency distribution of the input signal.
Power spectrum
waveform
Waveform to
be computed
Computed
waveform
The following three FFT windows are available.
Rectangular (Rect)
The rectangular window is best suited to transient signals, such as impulse waves, which
attenuate completely within the time window.
Hanning and FlatTop
The Hanning and flattop windows allow continuity of the signal by gradually attenuating the parts
of the signal located near the ends of the time window down to the 0 level. Hence, it is best suited
to continuous signals. With the Hanning window, the frequency resolution is high compared to
the flattop window. However, the flattop window has a higher level of accuracy. When the
waveform being analyzed is a continuous signal, select the proper window for the application.
IM 701240-01E
2-41
Page 73

2.6 Waveform Computation
FFT is performed on 1000, 2000, 5000, 10000, 20000, 50000, or 100000 points of
measured data. The data is converted to half the specified number of points and
displayed.
Window Integral Power spectrum
Rectangular
window
T
T
Hanning window
Sine wave
t
Rectangular window
Hanning window
Flat top window
T
Flat top window
T
FFT Function
Given that the complex function resulting after the FFT is G = R + jI, the power spectrum
can be expressed as follows:
2 + I2
Power spectrum = 10 log
R
( )
2
R: Real Part, I: Imaginary Part
Reference value (0 dB) of the logarithmic magnitude (Log mag): 1 Vrms
Phase Shift «For procedures, see section 10.4.»
You can shift the phase of CH1 to CH16 and Math1 to Math7 waveforms and display the
resultant waveforms or perform computation using the phase-shifted data.
T
T
: W(t) = u(t) – u(t – T) U(t): Step function
: W(t) = 0.5 – 0.5 cos(2 π )
: W(t) = {0.54 – 0.46 cos(2 π )}
t
T
t
T
sin{2 π(1 – 2t/T)}
2 π(1 – 2t/T)
2
Scaling of Computed Waveforms «For procedures, see chapter 10.»
Normally, the SL1400 performs auto scaling when computed waveforms are displayed.
However, you can also select manual scaling. When auto scaling, the upper and lower
limits suitable for displaying the waveform are determined from the first computed
waveform. If you select manual scaling, you can arbitrarily set the upper and lower limits
of the computed waveform display.
2-42
IM 701240-01E
Page 74

1
2.7 Waveform Analysis and Search
Displaying History Waveforms «For procedures, see section 11.1.»
Past waveform data (history waveforms) stored in the acquisition memory can be
displayed when waveform acquisition is stopped. You can display a specified history
waveform from the data (up to 2000 waveforms, or the number of triggers) stored in the
acquisition memory.
The number of waveforms N that can be acquired and held as history waveforms varies
from 1 to 2000 depending on the record length and acquisition mode settings. The
waveform currently displayed on the screen (most recent waveform) is counted as the
1st waveform, and up to N–1 waveforms in the past can be displayed.
History Search «For procedures, see sections 11.2 and 11.3.»
You can search history waveforms that meet specified conditions when waveform
acquisition is stopped.
Zone Search
You can search history waveforms that pass or do not pass a specified search zone.
Waveform stored in the history memory
Specified area
2
Explanation of Functions
Selected Record No. 0
Detects the waveform that
passed through the specified area
Selected Record No. –25
Waveform Parameter Search
You can search history waveforms that meet or do not meet the specified search
parameter conditions.
Waveform that was saved using the history memory function
Item Setup : P-P
Condition : OUT
Start RecEnd Rec
Detects a waveform
whose P-P exceeds
a specified range
T-Range2
T-Range1
Selected Record No. 0
P-P
Selected Record No. 28
IM 701240-01E
2-43
Page 75

2.7 Waveform Analysis and Search
Cursor Measurement «For procedures, see section 11.4.»
The following cursors are available for analyzing the values of each waveform data.
H (Horizontal) Cursors
Two broken lines (H cursors) are displayed on the X-axis (horizontal axis). The voltage of
each H cursor and the voltage difference between the H cursors are measured.
V (Vertical) Cursor
Two broken lines (V cursors) are displayed on the Y-axis (vertical axis). The time from
the trigger position to each V cursor and the time difference between the V cursors are
measured. The voltage value of the signal at each cursor position and the voltage
difference between the cursors are also measured.
H&V Cursors
H cursors and V cursors are displayed simultaneously.
Marker Cursors
Four markers are displayed on the specified waveform. The voltage and the time from
the trigger position of each marker as well as the voltage difference and time difference
between markers are measured.
Degree Cursors
Measures the angle between two angle cursors with respect to a reference angle
corresponding to the width between the zero point and the end point, which are
measurement references.
• H cursor
Cursor measurement value
(when the extra window is not displayed)
• Marker cursor
Marker 1
Marker 2
Marker 3
Cursor1
Cursor2
Marker 4
• V cursor
Cursor1
Cursor measurement value
(when the extra window is displayed)
• Angle cursor
Reference
cursor 1
Reference
width
Cursor2
Reference
cursor 2
2-44
Unit
Cursor2Cursor1
IM 701240-01E
Page 76

1
2.7 Waveform Analysis and Search
Automated Measurement of Waveform Parameters «For procedures, see section 11.5.»
Automated measurement can be performed on parameters such as the rise time and
pulse width on the specified channel. There are 29 measurement parameters. Up to 24
parameters from the selected parameters of all channels can be displayed. The
measurement range is up to 10 MW from the measurement start point (Time Range1).
Measurement
range
Automated measured value
of waveform parameters
Statistical Processing «For procedures, see section 11.6.»
Statistical processing is performed on the measured values of automated waveform
parameters described on the previous item. The following five statistics are determined
on the three measured values of automated measurement parameters.
The number of measured values used to determine the maximum value, minimum value,
average value, standard deviation, and statistical processing.
2
Explanation of Functions
Measurement range
Values obtained by the
automated measurement
of statistical processing
targets
Statistical processing
results
The following three statistical processing modes are available.
Normal Statistical Processing
Statistical processing is performed on all acquired waveforms while acquiring
waveforms.
IM 701240-01E
2-45
Page 77

2.7 Waveform Analysis and Search
Cyclic Statistical Processing
Divides the displayed waveform using a cycle that is automatically calculated and
determined and performs statistical processing on the values obtained through the
automated measurement of waveform parameters over the determined cycle.
Statistical processing is performed from the oldest measured data of the displayed
waveform. Statistical processing of up to 48000 measured values of automated
waveform parameters is possible. If statistical processing is performed on a single
parameter, statistical processing of up to 48000 cycles is possible.
Example in which CH1 is selected as the waveform used to determine the cycle
CH2
CH1
a
Automated measurement parameters are measured in each range, a, b, and c, and
statistical processing is performed on the automated measurement parameters in the order
a, b, and c.
The automated measurement parameters of other channels are also measured using
ranges a, b, and c.
Automated measurement can also be made using the cycle of each waveform as the range.
b
c
Statistical Processing of History Data
Performs automated measurement of waveform parameters on the waveform that is
acquired using the history memory function and performs statistical processing.
Statistical processing is performed from the oldest waveform.
2-46
IM 701240-01E
Page 78

1
2.8 Communications
Command Communications (GP-IB, Serial (RS-232), USB, and Ethernet) «For
procedures, see the Communication Interface User’s Manual on the CD-ROM.»
The SL1400 comes standard with GP-IB, serial (RS-232), and USB interfaces. The
Ethernet interface is available as an option.
Through communication functions, you can output waveform data to a PC for data
analysis or control the SL1400 using an external controller to carry out waveform
measurements.
2
Explanation of Functions
SL1400
Communication
interface
PC
Saving/Loading Data to a Network Drive (FTP Client Function) «For procedures, see
chapter 15.»
Waveform data,*1 screen image data, and setup data can be saved, deleted, or copied
on an FTP server
disk (option), or external SCSI device.
*1 The following types of waveform data cannot be loaded from a network drive.
• Waveform data that is 50 MB or more in size.
• Waveform data saved on the all waveform display (All) of the history memory function.
*2 PC or workstation on which the FTP server function is running.
SL1400
*2
on the network in the same way as the built-in PC card, internal hard
Ethernet
FTP server
Printing on a Network Printer «For procedures, see section 15.4.»
The screen image data can be printed on a network printer in the same way as the builtin printer or USB printer.
Ethernet
SL1400
Printer
IM 701240-01E
2-47
Page 79

2.8 Communications
Transmitting E-mail Messages (SMTP Client) «For procedures, see section 15.5.»
Information from the SL1400 can be transmitted periodically in an e-mail message to a
specified mail address. You can also transmit information such as the trigger time in an
e-mail message as an action for action-on-trigger.
Ethernet
SL1400
E-mail
PC
Accessing the SL1400 from a PC or Workstation (FTP Server Function) «For
procedures, see section 15.6.»
The files on the built-in PC card, internal hard disk (option), or external SCSI device on
the SL1400 can be retrieved by accessing the SL1400 from an FTP client* on the
network.
* PC or workstation on which the FTP client function is running.
Ethernet
PC
FTP server
(
SL1400
)
or
Workstation
Web Server Function «For procedures, see section 15.7.»
The SL1400 can function as a Web server. By using the Web page of the SL1400, file
transfer, monitoring of displayed waveforms, basic SL1400 key control, and retrieval of
waveform data are possible.
2-48
Web server
(
SL1400
Ethernet
PC
)
IM 701240-01E
Page 80

1
2.9 Other Useful Functions
Entering Values and Strings from a USB Keyboard «For procedures, see section 4.3.»
You can connect a USB keyboard for entering file names, comments, and other
information. In addition, the functions of each key on the front panel of the SL1400 are
assigned to the keys on the keyboard. Thus, the keyboard can be used to carry out
operations that are the same as the key operations on the SL1400. For the key
assignments, see appendix 7.
2
Explanation of Functions
USB keyboard
USB connection
SL1400
Operations Using a USB Mouse «For procedures, see section 4.3.»
You can use a USB mouse to operate the SL1400 as you would using the front panel keys.
In addition, you can point to a desired item on a menu and click the item. This is analogous
to pressing a soft key corresponding to a menu and pressing the SELECT key.
SL1400
USB mouse
Initialization «For procedures, see section 4.4.»
The settings of each key can be reset to their initial conditions. However, date and time settings,
communication settings, and SCSI ID setting are not initialized. To reset the communicationrelated and SCSI ID settings to factory default, turn ON the power while holding down RESET.
Release RESET after a beep sound is heard. (Date and time settings are not reset.)
Auto Setup «For procedures, see section 4.5.»
This function automatically sets the voltage axis, time axis, trigger settings, and other
settings to suit the input signal. This is useful when the characteristics of the input signal are
unknown. However, the auto setup function may not work depending on the input signal.
Printing the Screen Image «For procedures, see chapter 12.»
Screen images can be printed on the built-in printer (option), USB printer, or network
printer (when the Ethernet interface option is installed).
USB printer
USB
Built-in printer
SL1400
Ethernet
Printer server
Network printer
Supporting TCP/IP
(LPR protocol)
Note
There is a function that enables comments to be entered and displayed using a keyboard that
appears on the screen or a USB keyboard. You can enter a comment describing the displayed
waveform before printing the screen image. The comment is printed along with the waveform
allowing the printed matter to be identified later on.
IM 701240-01E
2-49
Page 81

2.9 Other Useful Functions
Saving and Loading Data on the Storage Medium «For procedures, see chapter 13.»
The SL1400 allows various data to be stored to and loaded from the following storage
media.
• PC card
• Internal hard disk (option)
• External USB storage (MO disk, hard disk, and flash memory)
• External SCSI device (MO disk, Zip disk, etc.)
• Network drive (when the Ethernet interface option is installed)
Internal hard disk (option)
PC
MO/
Zip drive,
etc.
SL1400
PC card
Saving the Screen Image Data and Displaying the Thumbnails of the
Stored Screen Image Data
The screen image data can be stored to a specified storage medium. The data can be
stored in PNG, JPEG, BMP, and PostScript formats allowing the screen image to be
pasted on a document created with a DTP application.
In addition, the thumbnails (reduced and simplified image) of the screen image data
saved to the storage medium can be displayed on the SL1400 screen. This feature is
useful for checking the contents of the stored screen image data.
Thumbnail Display on the FILE Menu
Selecting a file from the File List and
pressing SELECT displays
the thumbnail screen of the selected
screen image data
Thumbnail screen
2-50
Thumbnail Display on the IMAGE Menu
Thumbnail screen
Pressing the Thumbnail soft key displays a
thumbnail screen of the screen image data
saved to the specified format.
Thumbnail screen
Selecting a file from the File List and
pressing SELECT displays the thumbnail
screen of the selected screen image data
IM 701240-01E
Page 82

1
2.9 Other Useful Functions
Saving and Loading Setup Data, Waveform Data, and Snapshot Waveform
Data
The setup data, waveform data, and snapshot waveform data can be saved to or loaded
from a specified storage medium.
Saving the Results of the Automated Measurement of Waveform
Parameters
The automated measured values of waveform parameters can be stored to a specified
storage medium.
Creating a PDF File of the Print Image «For procedures, see section 13.14.»
By setting the output destination in the PRINT menu to “PDF,” a PDF file of the print
image (image similar to fine print (see section 12.1)) can be created. A print image of the
specified range and magnification is created to the specified file name on the specified
storage medium simply by pressing the PRINT key.
Operating the SL1400 Using a Free Software Program
The SL1400 can be controlled from a PC using Wirepuller, a free software program,
when connected via the GP-IB, USB, or Ethernet interface. To download the software
program, go to the following website, and then browse to the download page.
2
Explanation of Functions
• English version http://www.yokogawa.com/ymi/
• Japanese version http://www.yokogawa.com/jp-ymi/
Connecting the SL1400 and the PC via the SCSI «For procedures, see section 13.19.»
You can connect a PC to the SCSI of the SL1400 and download the files on the internal
hard disk (option) to the PC.
You cannot upload or delete files on the internal hard disk. If you do, the internal hard
disk may become unusable.
The following limitations exist.
While connected to the PC, the File List window of the SL1400 may not be displayed
properly. If the connected PC enters sleep, standby, or rest mode, the SL1400 will not be
able to access its internal hard disk. Before connecting the PC to the SL1400, disable
such modes on the PC.
IM 701240-01E
2-51
Page 83

3
2
1
Chapter 3 Preparations for Measurements
3.1 Handling Precautions
Safety Precautions
If you are using this instrument for the first time, make sure to thoroughly read “Safety
Precautions” on pages vi to viii.
Do Not Remove the Case
Do not remove the case from the instrument. Some parts of the instrument use high
voltages, which are extremely dangerous. For internal inspection and adjustment,
contact your nearest YOKOGAWA dealer.
Unplug If Abnormal Behavior Occurs
If you notice any symptoms of trouble such as unusual odors or smoke coming from the
instrument, immediately turn OFF the power switch and unplug the power cord. If these
symptoms occur, contact your nearest YOKOGAWA dealer.
Handle the Power Cord with Care
Do not place objects on top of the power cord and keep it away from any heat sources.
When unplugging the power cord from the outlet, never pull by the cord itself. Be sure to
pull by the plug. If the power cord is damaged, contact your dealer for replacement.
Refer to page iii for the part number when placing an order.
3
Preparations for Measurements
General Handling Precautions
Do Not Place Objects on Top of the Instrument
Never place other instruments or objects containing water on top of the instrument,
otherwise a breakdown may occur.
Do Not Apply Shock to the Input Section
Applying shock to the input connectors or probes may turn into electrical noise and enter
the instrument via the signal lines.
Do Not Damage the LCD
Since the LCD screen is very vulnerable and can be easily scratched, do not allow any
sharp objects near it. Also, it should not be exposed to vibrations and shocks.
Unplug during Extended Non-Use
Unplug the power cord from the outlet.
IM 701240-01E
3-1
Page 84

3.1 Handling Precautions
Carry the Instrument Properly
First, remove the power cord and connection cables. Always carry the instrument by the
handles as shown below or carry it with both hands.
WARNING
• When you hold or put away the handle, be careful not to get your hand caught
between the handle and the case.
• When you carry the instrument, be careful not to get your hand caught between
the wall, installation surface, or other objects and the instrument.
Clean the Instrument Properly
When cleaning the case or the operation panel, first remove the power cord from the
outlet. Then, wipe with a dry, soft, clean cloth. Do not use volatile chemicals such as
benzene or thinner for cleaning, as this may lead to discoloration or deformation.
3-2
IM 701240-01E
Page 85

3
2
1
3.2 Installing the Instrument
Installation Conditions
Install the instrument in a place that meets the following conditions:
Flat, Even Surface
Set the instrument in the proper direction (see page 3-4) and in a level and stable place. Note
that the instrument can be tilted on the stand if the instrument is set with the rear panel facing
down. If placed in an uneven or unstable place, printing quality may deteriorate.
Well-Ventilated Location
There are inlet holes on the bottom side of the instrument. In addition, there are vent
holes for the cooling fans in the left side and top panels. To prevent internal overheating,
allow for enough space around the instrument (see the figure below) and do not block
the vent and inlet holes.
WARNING
• This instrument is designed to be used indoors. Do not install or use it outdoors.
• Install the instrument so that you can immediately remove the power cord if an
abnormal or dangerous condition occurs.
CAUTION
If you block the inlet or outlet holes on the SL1400, the SL1400 will become hot
and may break down.
3
Preparations for Measurements
10 cm or more
10 cm
or more
When connecting various cables or when opening or closing the built-in printer cover,
IM 701240-01E
provide extra space for operation in addition to the space indicated above.
10 cm
or more
5 cm
or more
3-3
Page 86

3.2 Installing the Instrument
Ambient Temperature and Ambient Humidity
Ambient temperature: 5 to 40°C
Ambient humidity: 20 to 85%RH (when the printer is not used: no condensation)
35 to 85%RH (when using the printer: no condensation)
Note
• To ensure high measurement accuracy, operate the instrument in the 23 ± 5°C temperature
range and 55 ± 10%RH.
• Condensation may occur, if the instrument is moved to another place where the ambient
temperature is higher or if the temperature changes rapidly. In such cases, allow the
instrument adjust to the new environment for at least an hour before using the instrument.
Do Not Install the Instrument in the Following Places.
•Outdoors.
• In direct sunlight or near heat sources.
• Where the instrument is exposed to water or other liquids.
• Where an excessive amount of soot, steam, dust, or corrosive gas is present.
• Near strong magnetic field sources.
• Near high voltage equipment or power lines.
• Where the level of mechanical vibration is high.
• On an unstable surface.
Installation Position
Place the instrument in a horizontal position or with the rear panel facing down. When
using the stand, pull it until it locks (see the right figure below). To retract it, press the
stand backward while pressing it inward.
Installed horizontally
Installed with the rear
panel facing down
Installed using the stand
WARNING
• When you put away the stand, be careful not to get your hand caught between
the stand and the instrument.
• Handling the stand without firmly supporting the instrument can be dangerous.
Please take the following precautions.
• Only handle the stand when the instrument is on a stable surface.
• Do not handle the stand when the instrument is tilted.
• Do not place the instrument in any position other than those shown in the above
figures.
Also, do not stack the instrument.
Rubber Feet
3-4
If the instrument is installed in a horizontal position as shown in the figure above, rubber
stoppers can be attached to the feet to prevent the instrument from sliding. One set (four
pieces) of rubber feet are included in the package.
IM 701240-01E
Page 87

3
2
1
3.3 Installing Input Modules
WARNING
• To prevent electric shock and damage to the instrument, make sure to turn OFF
the power before installing or removing the input module.
• Check that the input cable is not connected to the input terminals before
installing or removing the input module.
• To prevent electric shock and to satisfy the specifications, make sure to put the
accessory cover plate on the slots that are not being used.
Using the instrument without the cover plate allows the dust to enter the instrument
and may cause malfunction due to the rise in temperature inside the instrument.
• If the input module happens to come out of the slot while it is in use, it may cause
electric shock or cause damage to the instrument as well as the input module. Make
sure to screw the input module in place at the two locations (top and bottom).
• Do not put your hand inside the slot, because there are protrusions along the
module guide that may injure your fingers.
Precautions to Be Taken When Using the Modules
• Do not apply input voltage exceeding the maximum input voltage, withstand
voltage, or allowable surge voltage.
• To prevent electric shock, be sure to furnish protective earth grounding of the
SL1400.
• To prevent electric shock, be sure to fasten the module screws. Otherwise, the
electrical protection function and the mechanical protection function will not be
activated.
• Do not leave the instrument connected to devices in an environment that may
be subject to voltage surges.
• When measuring high voltages using the 701250 (HS10M12) or the 701251
(HS1M16), use the isolated probe (700929), 1:1 safety cable (combination of
701901 and 701954), or differential probe (700924).
• Be sure to connect the GND lead of the differential probe (700924) to the
functional ground terminal of the SL1400. High voltage may appear at the BNC
connector of the differential probe. Be sure to connect the GND lead to the
SL1400 before connecting the probe to the parameter to be measured.
• When using the 701255 (NONISO_10M12), be sure to fasten the module
screws. Fastening the module screws activates the protection function and the
non-isolation function. It is extremely dangerous if you do not fasten the screws.
In addition, when measuring high voltage above 42 V, be sure to use the
passive probe (701940).
• The BNC part of the passive probe (701940) is made of metal. Therefore, use the
probe at 42 V or less for isolated inputs (701250 (HS10M12), 701251 (HS1M16),
701275 (ACCL, VOLT), and 701280 (FREQ)) for safety reasons. (Do not connect
voltage above 42 V to both the High and Low sides.) For non-isolated inputs
(701255 (NONISO_10M12), etc.), fasten the module screws as described before.
• When measuring high voltages using the 701267 (HV (with RMS)), use a
measurement lead 758933 and alligator clip 701954.
• The measurement category of 701267 (HV (with RMS)) when used with 758933
measurement leads and 701954 alligator clips is 400V-CAT II on the low side
and 700V-CAT II on the high side. Be careful because the overvoltage tolerance
between the low and high sides is different.
• When measuring high voltage to the 701280 (FREQ), use the isolated probe (700929).
3
Preparations for Measurements
IM 701240-01E
3-5
Page 88

3.3 Installing Input Modules
Types of Input Modules
There are 11 types of input modules. See page iii. For detailed specifications, see
section 18.12.
Precautions to Be Taken When Installing or Removing Input Modules
Switching the installed input module with a different module and turning ON the power
initializes the settings on that channel. To save the settings, specify the destination
media (see sections 13.1 or 13.9).
Installation Procedure of Modules
1. Check that the power switch on the left side panel is OFF.
2. Check the channel number indicated the slots for installing the input modules on
the right side panel of the instrument. Then, install the module along the guide.
Holding the handles on the top and bottom of the input module, press firmly until
it clicks in place.
If there is a cover plate on the slot in which to install the module, remove the
cover plate, first.
3. Make sure to screw the two locations, top and bottom, of the input module firmly
into place (screw tightening torque: 0.6 N•m).
4. Turn ON the power switch.
5. Check to see that the correct input module name is displayed at the
corresponding slot number in the overview screen. If it is not correct, remove the
module according to the steps in “Removal” shown below, and reinstall the
module according to steps 1 to 3 shown above. For the procedure to display the
overview display, see section 17.4.
Removal Procedure
3-6
Guide
1. Check that the power switch is OFF.
2. Loosen the two screws holding the input module in place.
3. Holding the handles on the top and bottom of the input module, pull out the
module.
IM 701240-01E
Page 89

3
2
1
LEDs on the Frequency Module
On the front panel of the frequency module (701280 (FREQ)) are LEDs for each
channel. These LEDs allow you to check the input condition of the pulse.
Note
• The LEDs on the frequency module illuminates in green when pulse is applied and red when
the input voltage level is over range. It is independent of the start/stop condition of waveform
acquisition of the SL1400.
• If the frequency module preset (see section 5.17) is set to “EM Pickup (electromagnetic
pickup),” the LED does not illuminate in red even when the input voltage level is over range.
ACT
OVER
1M
35
pF
FREQ
ACT
OVER
1M
35
pF
701280 (FREQ)
3.3 Installing Input Modules
3
Preparations for Measurements
LED
Illuminated in green: When pulse is applied
Illuminated in red: When the input voltage
level is over range.
Off: When pulse is not applied
IM 701240-01E
3-7
Page 90

3.4 Connecting the Power Supply and Turning the Power Switch ON/OFF
Before Connecting the Power Supply
Make sure that you observe the following points before connecting the power. Failure to
do so may cause electric shock or damage to the instrument.
WARNING
• Before connecting the power cord, ensure that the source voltage matches the
rated supply voltage of the instrument and that it is within the maximum rated
voltage of the provided power cord.
• Connect the power cord after checking that the power switch of the instrument is
turned OFF.
• To prevent electric shock or fire, be sure to use the power cord for the
instrument that is supplied by YOKOGAWA.
• Make sure to provide protective earth grounding to prevent electric shock.
Connect the power cord to a three-prong power outlet with a protective earth
terminal.
• Do not use an extension cord without protective earth ground. Otherwise, the
protection function will be compromised.
• If an AC outlet that matches the power cord provided is unavailable and
protective grounding cannot be furnished, do not use the instrument.
Connecting the Power Cord
1. Check that the power switch is turned OFF.
2. Connect the power cord plug to the power connector on the left side panel.
3. Connect the plug on the other end of the power cord to the outlet that meets the
conditions below. The AC outlet must be of a three-prong type with a protective
earth ground terminal.
Item
Rated supply voltage* 100 to 120 VAC/200 to 240 VAC
Permitted supply voltage range 90 to 132 VAC/180 to 264 VAC
Rated power supply frequency 50/60 Hz
Permitted power supply frequency range 48 to 63 Hz
Maximum power consumption Approx. 200 VA Max.
* The instrument can use a 100-V or a 200-V system for the power supply. The maximum rated
voltage of the power cord varies depending on its type. Check that the voltage supplied to the
instrument is less than or equal to the maximum rated voltage of the provided power cord
(see page ii) before using it.
Power cord
(standard accessory)
(Reference value: 135 VA when the built-in printer
is not used and 16 channels are running)
3-prong outlet
3-8
IM 701240-01E
Page 91

3
2
1
3.4 Connecting the Power Supply and Turning the Power Switch ON/OFF
Turning ON/OFF the Power Switch
Items to Be Checked before Turning ON the Power
• Check that the instrument is properly installed. See section 3.2.
• Check that the power cord is properly connected. See the previous page.
Power Up Operation
Turning ON/OFF the Power Switch
Pressing the power switch located on the left side panel to the “ON (|)” side, turns the
power ON. Pressing it to the “OFF (O)” side turns the power OFF.
When the power switch is turned on, self testing and calibration start automatically. This
lasts for approximately 30 seconds. When the SL1400 starts normally, the waveform
display screen appears. Check that the SL1400 has started normally before you use it.
If the SL1400 Does Not Start Normally When the Power Is Turned On
Turn off the power switch, and check the following items.
• Check that the power cord is securely connected.
• Check that the correct voltage is coming to the power outlet, see the previous page.
• Initialize the settings to their factory defaults by turning on the power switch while
holding down the RESET key. For details about initializing the settings, see section 4.4.
If the instrument still does not work properly, contact your nearest YOKOGAWA dealer
for repairs.
3
Preparations for Measurements
Note
• After turning the power off, wait at least 10 seconds before you turn it on again.
• It takes several seconds for the startup screen to appear.
Power Down Operation
Settings existing immediately before the power is turned OFF (also if the power cord is
removed) are retained. This allows measurements to be performed using those saved
settings the next time the power is turned ON.
Note
The settings are stored using an internal lithium battery. The battery lasts for approximately 5
years, if it is used at an ambient temperature of 23°C. When the lithium battery voltage falls below
a specified level, a message is displayed on the screen (error 907) when the power switch is
turned ON. If this message appears frequently, the battery must be replaced quickly. The user
cannot replace the battery. Contact your nearest YOKOGAWA dealer to have the battery replaced.
To Make Accurate Measurements
• Allow the instrument to warm up for at least 30 minutes after turning ON the power
switch.
• After warm-up is complete, perform calibration (see section 4.6). If auto calibration is
IM 701240-01E
turned ON, the calibration is automatically executed when the measurement range is
changed or when the waveform acquisition is started.
3-9
Page 92

3.5 Loading the Roll Paper for the Built-in Printer
Printer Roll Paper
Use a dedicated roll paper that is provided by YOKOGAWA. Do not use other types of
roll paper. When you are using the printer for the first time, use the roll paper that came
with the package. Order extra rolls from your nearest YOKOGAWA dealer.
Part number: 701966
Specifications: Thermal paper, 20 m
Minimum Q’ty: 6 rolls
Roll Paper Handling
The paper is a thermal paper that changes color with the application of heat. Note the
following:
Storage Precautions
The paper starts changing color at around 70°C. It is affected by heat, humidity, light,
and chemicals regardless of whether the paper has been used.
• Store the paper rolls in a cool, dry, and dark place.
• After opening the package, use it quickly.
• If the paper is left in contact with plastic film containing plasticizers (such as a vinyl
chloride film or cellophane tape) for an extended time, the paper will lose some of its
ability to reproduce color. If you are going to store the paper in a folder, for example,
use a folder made of paper stock or polypropylene.
• When using glue on the paper, do not use glue containing organic solvents such as
alcohol or ether, as they will change the color of the paper.
• For prolonged storage, we suggest you make copies of results printed on the roll
paper. Due to the characteristics of the thermal paper, the recording section may lose
color over time.
Handling Precautions
• Be sure to use only genuine paper rolls provided by YOKOGAWA.
• Touching the paper with sweaty hands can leave finger prints or blur the printing.
• Rubbing the surface with a hard object can cause the paper to change color due to
the heat caused by friction.
• If chemicals, oil, or other liquids come in contact with the paper, the paper may
change color or the printing may fade.
Precautions to Be Taken When Using the Built-in Printer
Allow enough space around the output area of the printer. If the roll paper is continuously
fed out when the output area is close to a wall, for example, the roll paper that has been
delivered may reenter the output area and get entangled.
3-10
IM 701240-01E
Page 93

3
2
1
Procedure
Loading the Roll Paper
Release lever: FREE
Printer cover
3.5 Loading the Roll Paper for the Built-in Printer
1. While pressing the knob down on the top side of
the printer cover, open the printer cover.
2. Move the release lever at the top left side to the
FREE position (up direction).
3
Preparations for Measurements
Bearing
Shaft
Roll paper flange
Tape
Shaft
Guide
Holder
Bearing
Leading edge
of roll paper
Roll paper
Platen
3. Fit the roll paper flange to the left and right edges
of the roll paper core.
4. With the leading edge of the roll paper in the
back, load the roll paper in the holder by pressing
the shaft of the roll paper flange in the holder
bearing.
Set the direction of the roll paper as shown in the
left figure. If the direction is reversed, the printer
head does not make contact with the thermal
surface. If this happens, nothing may be printed,
or the paper may not feed properly.
5. Insert the leading edge of the roll paper evenly
from the bottom side of the platen, and pass it
through so that approximately 2 cm is showing
from the top side. Align the roll paper with the left
and right guides.
To remove a roll paper that is already loaded, pull
the tape in the direction of the arrow.
6. Pull the roll paper out further to straighten out the
paper.
IM 701240-01E
3-11
Page 94

3.5 Loading the Roll Paper for the Built-in Printer
Release lever: HOLD
Feeding the Paper
7. Move the release lever to the HOLD position
(down direction). The printing will fail with an error
message, if the release arm is in the FREE
position during operation.
8. Close the printer cover. Push the printer cover
down firmly until it clicks into place.
Note
• If you are reusing an old roll paper that had been taken out, the roll paper can be inserted
easily by cutting the leading edge at an angle.
• Before closing the printer cover, be sure to set the release arm position to HOLD.
• After loading the roll paper, make sure that the paper is feeding properly according to the
steps given below. If the paper is not being fed evenly, continue to feed the paper for
approximately 30 cm. The paper will straighten out.
You can feed the paper to check whether the roll paper has been loaded properly or to
skip dirty sections.
Feeding the Paper with the FEED Key
Press FEED. Each time you press the key, the paper is fed out by 15 mm.
Feeding Paper from the PRINT Menu
1. Press MENU.
2. Press the PRINT soft key.
3. Press the Print to soft key. The printer selection menu appears. (Net Print
appears only when the Ethernet interface option is installed.)
4. Press the Printer soft key.
5. Press the Paper Feed soft key. Each time you press the key, the paper is fed
out by 15 mm.
3-12
IM 701240-01E
Page 95

3
2
1
3.6 Setting the Date and Time
Procedure
1. Press MENU.
2. Press the Next 1/2 soft key.
3. Press the System Config soft key.
4. Press the Date/Time soft key. The Date/Time dialog box opens.
Turning ON/OFF the Date/Time display
5. Use jog shuttle+SELECT to set Display to ON or OFF.
3
Preparations for Measurements
Setting the Time and Date Manually (Manual)
6. Use jog shuttle+SELECT to set Type to Manual.
7. Use jog shuttle+SELECT to set Date Year.
8. Likewise, set the Month, Day, Time Hour, Minute, and Second.
9. Use the jog shuttle to move the cursor to Set and press SELECT. The date and
time specified in steps 6 to 8 are applied.
Setting the Date and Time Using the SNTP Server (Option)
To obtain the time from the SNTP server, you must first connect to the network and
then to the SNTP server. For details, see sections 15.2 and 15.8.
10. After step 5, use jog shuttle+SELECT to set Type to SNTP.
11. Use jog shuttle+SELECT to set Time Hour under Time Difference from GMT.
12. Likewise, set Minute.
13. Use the jog shuttle to move the cursor to Set and press SELECT. The time is
obtained from the SNTP server, and the date and time calculated from the
specified GMT time difference are set.
IM 701240-01E
3-13
Page 96

3.6 Setting the Date and Time
Explanation
Date (Year/Month/Day)
Set the year, month and day.
Time (Hour/Minute/Second)
Set the time using a 24-hour clock.
Setting the Time Using the SNTP Server
You can use the SNTP server time to set the date and time on the instrument.
This function is available on models with the Ethernet interface installed.
For details on SNTP and GMT, see section 15.8.
The time difference from GMT specified here is linked to the setting of 15.8.
Note
• The date and time information is backed up with the internal lithium battery, even if the power
is turned OFF.
• Leap year information is retained.
• If you are using the Web server function (when the Ethernet interface option is installed), you
must set the time offset from GMT (Greenwich Mean Time) in addition to the date and time.
For the setup procedure, see section 15.8.
3-14
IM 701240-01E
Page 97

3
2
1
3.7 Connecting Probes
Connecting Probes
Connect the probes (or other input cables such as BNC cables) to any of the input
terminals of the modules below. The input impedance is 1 MΩ ± 1% and approximately
35 pF in parallel.
• High-Speed 10 MS/s, 12-Bit Isolation Module: 701250 (HS10M12)
• High-Speed High-Resolution 1 MS/s, 16-Bit Isolation Module: 701251 (HS1M16)
• High-Speed 10 MS/s, 12-Bit Non-Isolation Module: 701255 (NONISO_10M12)
• Acceleration/Voltage Module (with AAF): 701275 (ACCL/VOLT)
• Frequency Module: 701280 (FREQ)
3
Preparations for Measurements
WARNING
• When connecting the item to be measured, be sure to turn OFF the power to the
item. Connecting or disconnecting the measurement lead while the item being
measured is turned ON is very dangerous.
Precautions to Be Taken When Using the Modules
• Do not apply input voltage exceeding the maximum input voltage, withstand
voltage, or allowable surge voltage.
• To prevent electric shock, be sure to furnish protective earth grounding of the SL1400.
• To prevent electric shock, be sure to fasten the module screws. Otherwise, the
electrical protection function and the mechanical protection function will not be
activated.
• Do not leave the instrument connected to devices in an environment that may
be subject to voltage surges.
• Use only specified cables. Using cables that do not meet the safety
specifications is extremely dangerous (especially when using high voltages
(42 V or higher).
• When measuring high voltages using the 701250 (HS10M12) or the 701251
(HS1M16), use the isolated probe (700929), 1:1 safety cable (combination of
701901 and 701954), or differential probe (700924).
• The BNC part of the passive probe (701940) is made of metal. Therefore, use
the probe at 42 V or less for isolated inputs (701250 (HS10M12), 701251
(HS1M16), 701275 (ACCL, VOLT), and 701280 (FREQ)) for safety reasons. (Do
not connect voltage above 42 V to both the High and Low sides.) For nonisolated inputs (701255 (NONISO_10M12), etc.), fasten the module screws.
• When measuring high voltage to the 701280 (FREQ), use the isolated probe
IM 701240-01E
(700929).
3-15
Page 98

3.7 Connecting Probes
Precautions When Using the High Voltage Differential Probes
Be sure to connect the GND lead of the differential probe (700924/700925) to
the functional ground terminal on the right side panel of the SL1400. Otherwise,
high voltage may appear at the BNC connector making it dangerous.
Maximum Input Voltages and Maximum Allowable Common Mode Voltages
for the Modules
Applying a voltage exceeding the value indicated below may damage the input
section. If the frequency is above 1 kHz, damage may occur even when the
voltage is below this value.
• For the 701250 (HS10M12)
Maximum input voltage (at a frequency of 1 kHz or less):
• Combined with the isolated probe 700929 (10:1)
1
600 V (DC+ACpeak)
• Safety cable (1:1) (combined with 701901+701954)
5
200 V (DC + ACpeak) (as a value that meets the safety standard)
250 V (DC + ACpeak) (maximum allowable voltage, as a value that does not
damage the instrument when applied)
• Direct input (cable that does not comply with the safety standards)
9
42V (DC+ACpeak)
Maximum allowable common mode voltage (at a frequency of 1 kHz or less)
• Combined with the isolated probe 700929 (10:1)
(combined with 701901+701954)
8
2
or safety cable (1:1)
400 Vrms (measurement category Other (O)), 300 Vrms (CAT II)
• Direct input (cable that does not comply with the safety standards)
10
42 V (DC+ACpeak) (CAT II, 30 Vrms)
• For the 701251 (HS1M16)
Maximum input voltage (at a frequency of 1 kHz or less)
• Combined with the isolated probe 700929 (10:1)
1
600 V (DC+ACpeak)
• Safety cable (1:1) (combined with 701901+701954)5 or direct input
9
140 V (DC+ACpeak)
• Direct input (cable that does not comply with the safety standards)
9
42V (DC+ACpeak)
Maximum allowable common mode voltage (at a frequency of 1 kHz or less)
• Combined with the isolated probe 700929 (10:1)
(combined with 701901+701954)
8
2
or safety cable (1:1)
400 Vrms (measurement category Other (O)), 300 Vrms (CAT II)
• Direct input (cable that does not comply with the safety standards)
10
42 V (DC+ACpeak) (CAT II, 30 Vrms)
• For the 701255 (NONISO_10M12)
This module is non-isolated. Be sure to fasten the module screws when
measuring a voltage above 42 V on this module. In addition, use the dedicated
701940 non-isolated passive probe (10:1).
Maximum input voltage (at a frequency of 1 kHz or less)
• Combined with the 701940 passive probe (10:1)
600 V (DC+ACpeak)
• Direct input (cable that does not comply with the safety standards)
9
200 V (DC + ACpeak) (as a value that meets the safety standard)
250 V (DC + ACpeak) (maximum allowable voltage, as a value that does not
damage the instrument when applied)
3-16
IM 701240-01E
Page 99

3
2
1
3.7 Connecting Probes
• For the 701275 (ACCL/VOLT)
Maximum input voltage (at a frequency of 1 kHz or less)
• Combined with the 701940 passive probe (10:1)
does not comply with the safety standards)
11
or direct input (cable that
9
42 V (DC+ACpeak)
Maximum allowable common mode voltage (at a frequency of 1 kHz or less)
• Combined with the 701940 passive probe (10:1)
does not comply with the safety standards)
12
or direct input (cable that
10
42 V (DC+ACpeak) (CAT II, 30 Vrms)
• For the 701280 (FREQ)
Maximum input voltage (at a frequency of 1 kHz or less)
• Combined with the isolated probe 700929 (10:1)
1
420 V (DC+ACpeak)
• Safety cable (1:1) (combined with 701901+701954)5 or direct input (cable that
does not comply with the safety standards)
9
42 V (DC+ACpeak)
Maximum allowable common mode voltage (at a frequency of 1 kHz or less)
• Combined with the isolated probe 700929 (10:1)
2
300 Vrms (CAT II)
• Safety cable (1:1) (combined with 701901+701954)8 or direct input (cable that
does not comply with the safety standards)
10
42 V (DC+ACpeak) (CAT II, 30 Vrms)
3
Preparations for Measurements
With the 700929
700929
Direct input (cable that does not comply
with the safety standards)
BNC
9
1
L
4
H
L
10
3
With the 701901 and 701954
H
2
701901
With the 10:1 passive probe (701940)
701954
11
Over-Range Indication
If over-range is indicated, the SL1400 may be receiving a voltage higher than
the observed waveform or measured waveform values. To prevent electric
shock, change the vertical scale with the RANGE knob so that the entire
amplitude of the waveform is displayed within the waveform display area, and
check the input voltage level.
H
5
6
L
7
L
8
H
12
Over-range indication
Indicates the number of the channel that over-range is occurring on.
If over-range is occurring on multiple channels, the smallest channel
number among them is indicated.
IM 701240-01E
3-17
Page 100

3.7 Connecting Probes
Precautions to Be Taken When Connecting Probes
• When connecting the probe for the first time, perform phase correction of the probe as
• You cannot perform phase correction of the probe on the frequency module (701280
• If the object to be measured is connected to the instrument directly, without using a
• When using a voltage probe other than the isolated probe (700929), correct measured
• Follow the instructions given in section 5.6 to set the probe attenuation to match the
Connecting Current Probes
When using current probes* made by YOKOGAWA, use the probe power supply (option)
on the right side panel of the SL1400.
described in section 3.8. If you do not, frequency characteristics will not be flat, and
measurements will not be correct. Make the phase correction on each channel to
which the probe is to be connected.
(FREQ)). Perform phase correction of the probe on another module before connecting
the probe to the 701280 (FREQ).
probe, correct measurement cannot be performed due to the input impedance.
values cannot be displayed if the probe’s attenuation is not 1:1, 10:1, 100:1, or
1000:1.
actual value using the soft key menu. If they do not match, measured values cannot
be read correctly.
* Current probes made by YOKOGAWA: 701930, 701931, and 701933
For details on the connection procedure, see the manual that comes with the current
probe.
CAUTION
Do not use the probe power supply terminals (option) on the right side panel of
the SL1400 for purposes other than supplying power to the current probes. Also,
be sure to use only the number of probes allowed. Otherwise, the device
connected to the probe power supply terminal may break.
3-18
IM 701240-01E
 Loading...