


MSO-5000B
Mixed Storage Oscilloscope
User Manual

Contents
Contents
CONTENTS ............................................................................................................................................................ I
COPYRIGHT DECLARATION ......................................................................................................................... IV
CHAPTER 1 SAFETY TIPS .......................................................................................................................... 1
1.1 GENERAL SAFETY SUMMARY .................................................................................................................. 1
1.2 SAFETY TERMS AND SYMBOLS ................................................................................................................ 2
1.3 TERMS ON PRODUCT ............................................................................................................................... 2
1.4 SYMBOLS ON PRODUCT ........................................................................................................................... 2
1.5 PRODUCT SCRAPPING .............................................................................................................................. 2
CHAPTER 2 OVERVIEW .............................................................................................................................. 3
2.1 BRIEF INTRODUCTION TO MSO-5000B ................................................................................................... 3
2.2 HELP SYSTEM .......................................................................................................................................... 3
CHAPTER 3 GETTING STARTED GUIDE ................................................................................................ 5
3.1 INSTALLATION ......................................................................................................................................... 5
3.1.1 Power Supply ............................................................................................................................... 5
3.1.2 Power Cord .................................................................................................................................. 5
3.2 FUNCTIONAL CHECK ............................................................................................................................... 5
3.2.1 Power on the oscilloscope ......................................................................................................... 5
3.2.2 Connect the oscilloscope ........................................................................................................... 5
3.2.3 Observe the waveform ............................................................................................................... 6
3.3 PROBE EXAMINATION .............................................................................................................................. 6
3.3.1 Safety ............................................................................................................................................ 6
3.3.2 Use of Probe Check Wizard ...................................................................................................... 7
3.4 MANUAL PROBE COMPENSATION ............................................................................................................ 7
3.5 PROBE ATTENUATION SETTING ................................................................................................................ 8
3.6 SELF CALIBRATION ................................................................................................................................. 8
3.7 LOGIC ANALYZER FLAT INPUT CABLE ..................................................................................................... 9
CHAPTER 4 MAIN FEATURE DESCRIPTION ....................................................................................... 10
4.1 OSCILLOSCOPE SETUP ........................................................................................................................... 10
4.2 TRIGGER ............................................................................................................................................... 10
4.3 DATA ACQUISITION ............................................................................................................................... 12
4.4 WAVEFO RM SCALING AND POSITIONING ............................................................................................... 12
4.5 WAVEFO RM MEASUREMENT .................................................................................................................. 13
CHAPTER 5 BASIC OPERATION ............................................................................................................ 15
5.1 DISPLAY AREA ...................................................................................................................................... 15
5.1.1 XY Format .................................................................................................................................. 17
5.2 HORIZONTAL CONTROLS ....................................................................................................................... 17
MSO-5000B Digital Storage Oscilloscope User Manual i

Contents
5.2.1 Scan Mode Display (Roll Mode) .............................................................................................. 20
5.3 VERTICAL CONTROLS ............................................................................................................................ 20
5.3.1 Math FFT .................................................................................................................................... 22
5.3.1.1 Setting Time-domain W aveform .............................................................................................................. 22
5.3.1.2 Displaying FFT Spectrum ........................................................................................................................ 23
5.3.1.3 Selecting FFT Window ............................................................................................................................ 24
5.3.1.4 FFT Aliasing ............................................................................................................................................ 26
5.3.1.5 Eliminating Aliases .................................................................................................................................. 26
5.3.1.6 Magnifying and Positioning FFT Spectrum ............................................................................................. 26
5.3.1.7 Using Cursors to Measure FFT Spectrum ................................................................................................ 27
5.4 TRIGGER CONTROLS ............................................................................................................................. 27
5.5 MENU AND OPTION BUTTONS ............................................................................................................... 33
5.5.1 SAVE/RECALL .......................................................................................................................... 34
5.5.2 MEASURE .................................................................................................................................. 35
5.5.3 ACQUIRE ................................................................................................................................... 36
5.5.4 UTILITY ....................................................................................................................................... 38
5.5.5 CURSOR .................................................................................................................................... 38
5.5.6 DISPLAY ..................................................................................................................................... 39
5.6 FAST ACTION BUTTONS ......................................................................................................................... 40
5.6.1 AUTOSET ................................................................................................................................... 40
5.6.2 Help ............................................................................................................................................. 41
5.6.3 Default Setup ............................................................................................................................. 42
5.7 MULTI-FUNCTIONAL KNOBS AND BUTTONS .......................................................................................... 44
5.8 SIGNAL CONNECTORS ........................................................................................................................... 44
5.9 LOGIC ANALYZER CHANNELS SETUP .................................................................................................... 45
CHAPTER 6 APPLICATION EXAMPLES ................................................................................................ 48
6.1 EXAMPLE 1: TAKING SIMPLE MEASUREMENTS ..................................................................................... 48
6.2 EXAMPLE 2: TAKING CURSOR MEASUREMENTS .................................................................................... 50
6.3 EXAMPLE 3: ANALYZING INPUT SIGNALS TO ELIMINATE RANDOM NOISE ............................................. 53
6.4 EXAMPLE 4: CAPTURING SINGLE-SHOT SIGNAL .................................................................................... 54
6.5 EXAMPLE 5: USING X-Y MODE ............................................................................................................. 55
6.6 EXAMPLE 6: TRIGGERING ON PULSE WIDTH ......................................................................................... 56
6.7 EXAMPLE 7: TRIGGERING ON VIDEO SIGNAL ........................................................................................ 57
6.8 EXAMPLE 8: USING SLOPE TRIGGER TO CAPTURE PARTICULAR SLOPE SIGNAL .................................... 59
6.9 EXAMPLE 9: USING OVERTIME TRIGGER TO MEASURE LONG PULSE SIGNAL ....................................... 60
6.10 EXAMPLE 10: USING MATH FUNCTIONS TO ANALYZE WAVEF ORM S ...................................................... 61
6.11 EXAMPLE 11: MEASURING DATA PROPAGATION DELAY ........................................................................ 62
6.12 EXAMPLE 12: USING TRIGGER TO MEASURE DIGITAL SIGNAL ................................................................... 63
CHAPTER 7 TROUBLESHOOTING ......................................................................................................... 68
7.1 PROBLEM SETTLEMENT ......................................................................................................................... 68
CHAPTER 8 SPECIFICATIONS ................................................................................................................ 69
8.1 TECHNICAL SPECIFICATIONS ................................................................................................................. 69
MSO-5000B Digital Storage Oscilloscope User Manual ii

Contents
8.2 ACCESSORIES ........................................................................................................................................ 74
8.3 OPEN SOURCE INFORMATION ................................................................................................................ 75
CHAPTER 9 GENERAL CARE AND CLEANING .................................................................................. 76
9.1 GENERAL CARE ..................................................................................................................................... 76
9.2 CLEANING ............................................................................................................................................. 76
APPENDIX A HARMFUL AND POISONOUS SUBSTANCES OR ELEMENTS ..................................... 77
APPENDIX B INDEX ......................................................................................................................................... 78
APPENDIX C GNU GENERALPUBLIC LICENSE VERSION 2, JUNE 1991 .......................................... 80
MSO-5000B Digital Storage Oscilloscope User Manual iii

Copyright Declaration
Copyright Declaration
All rights reserved; no part of this document may be reproduced or transmitted in any form or by
any means, electronic or mechanical, without prior written permission from our company.
Our company reserves all rights to modify this document without prior notice. Please contact our
company for the latest version of this document before placing an order.
Our company has made every effort to ensure the accuracy of this document but does not
guarantee the absence of errors. Moreover, our company assumes no responsibility in obtaining
permission and authorization of any third party patent, copyright or product involved in relation to
the use of this document.
MSO-5000B Digital Storage Oscilloscope User Manual iv

Safety Tips
Chapter 1 Safety Tips
1.1 General Safety Summary
Read the following safety precautions to avoid injury and prevent damage to this product or any
products connected to it. To evade potential hazards, use this product only as specified.
Only qualified personnel should perform maintenance.
Avoid fire or personal injury.
Use suitable power cord. Use only the power cord specified for this product and certified for the
country of use.
Connect and disconnect properly. Connect a probe with the oscilloscope before it is connected
to measured circuits; disconnect the probe from the oscilloscope after it is disconnected from
measured circuits.
Ground the product. This product is grounded through the grounding conductor of the power
cord. To avoid electric shock, the grounding conductor must be connected to earth ground. Before
making connections to the input or output terminals of the product, ensure that the product is
properly grounded.
Connect the probe in a right way. The probe ground lead is at ground potential. Do not connect
the ground lead to an elevated voltage.
Check all terminal ratings. To avoid fire or shock hazard, check all ratings and markings on the
product. Refer to the product manual for detailed information about ratings before making
connections to the product.
Do not operate without covers. Do not operate this product with covers or panels removed.
Avoid exposed circuitry. Do not touch exposed connections and components when power is
present.
Do not operate with suspected failures. If you suspect there is damage to this product, have it
inspected by qualified service personnel.
Assure good ventilation.
Do not operate in wet/damp environments.
Do not operate in an explosive atmosphere.
Keep product surfaces clean and dry.
MSO-5000B Digital Storage Oscilloscope User Manual 1
Safety Tips
1.2 Safety Terms and Symbols
The following terms may appear in this manual:
WAR NING . Warning statements point out conditions or practices that could result in injury
or loss of life.
CAUTION. Caution statements identify conditions or practices that could result in damage
to this product or other property.
1.3 Terms on Product
The following terms may appear on the product:
DANGER indicates an injury hazard immediately accessible as you read the marking.
WARNING indicates an injury hazard not immediately accessible as you read the marking.
CAUTION indicates a possible hazard to this product or other property.
1.4 Symbols on Product
The following symbols may appear on the product:
Protective
Ground
(Earth)
Terminal
Mains
Disconnected
OFF (Power)
Measurement
Ground
Terminal
Mains
Connected
ON (Power)
CAUTION
Refer to Manual
High Voltage
Measurement
Input Terminal
1.5 Product Scrapping
Device Recycling
We need extract and utilize natural resources to produce this device. If you do not reclaim the
device in a proper way, some substances it contains may become harmful or poisonous to
environments or human bodies. To avoid them being released outside and to minimize the waste
of natural resources, we suggest you reasonably call back this device to ensure proper recovery
and recycling of most materials within it.
MSO-5000B Digital Storage Oscilloscope User Manual 2

Overview
Chapter 2 Overview
2.1 Brief Introduction to MSO-5000B
Model Channels Bandwidth Sample Rate LCD
MSO-5062B 2 60MHz 1GS/s 7 inch color
MSO-5102B 2 100MHz 1GS/s 7 inch color
Table 2-1 MSO-5000B main specification
MSO-5000B oscilloscope is with the bandwidth of 60MHz/100MHz, and provides the real-time
and equivalent sample rates respectively up to 1GSa/s and 25GSa/s. In addition, it has maximum
1M memory depth for better observation of the waveform details, and 7 inch color TFT LCD as
well as WINDOWS-style interfaces and menus for easy operation.
What’s more, the plenty menu information and the easy-to-operate buttons allow you to gain
information as much as possible in measurement; the multifunctional knobs and the powerful
shortcut keys help you save a lot of time in operation; the Autoset function lets you detect sine and
square waves automatically; the Probe Check Wizard guides you to adjust the probe
compensation and set the Probe option attenuation factor. By using the three methods the
oscilloscope provides (context-sensitive, hyperlinks, and an index), you may master all operations
on the device in quite a short time so as to greatly improve your efficiency in production and
development.
2.2 Help System
This oscilloscope has a Help system with topics covering all of its features. You can use the Help
system to display several kinds of information:
General information about understanding and using the oscilloscope, such as Using the Menu
System.
Information about specific menus and controls, such as the Vertical Position Control.
Advice to problems you may come across while using an oscilloscope, such as Reducing
Noise.
The Help system provides three methods for you to find the information you want:
context-sensitive, hyperlinks, and an index.
Context-Sensitive
Push the HELP front-panel button and the oscilloscope displays information about the last menu
displayed on the screen. The HELP SCROLL LED lights beside the HORIZONTAL POSITION
knob indicate the alternative function of the knob. If a topic uses more than one page, turn the
MSO-5000B Digital Storage Oscilloscope User Manual 3

Overview
HELP SCROLL knob to move from page to page within the topic.
Hyperlinks
Most of the help topics contain phrases marked with angle brackets, such as <Autoset>. They are
links to other topics. Turn the HELP SCROLL knob to move the highlight from one link to another.
Push the Show Topic option button to display the topic corresponding to the highlighted link. Press
the Back option button to return to the previous topic.
Index
Push the front-panel HELP button, and then press the Index option button. Push the Page Up or
Page Down option button until you find the index page which contains the topic you want to view.
Turn the HELP SCROLL knob to highlight a help topic. Press the Show Topic option button to
display the topic.
NOTE: Press the Exit option button or any menu button to remove the Help text from the
screen and return to displaying waveforms.
MSO-5000B Digital Storage Oscilloscope User Manual 4
Getting Started Guide
Chapter 3 Getting Started Guide
3.1 Installation
To keep proper ventilation of the oscilloscope in operation, leave a space of more than 5cm away
from the top and the two sides of the product.
3.1.1 Power Supply
Use a power supply that delivers 90 to 240 V
, 45 to 440 Hz.
RMS
3.1.2 Power Cord
Use only power cords designed for this product. Refer to 8.2 Accessories for specific standards.
3.2 Functional Check
Follow the steps below to perform a quick functional check to your oscilloscope.
3.2.1 Power on the oscilloscope
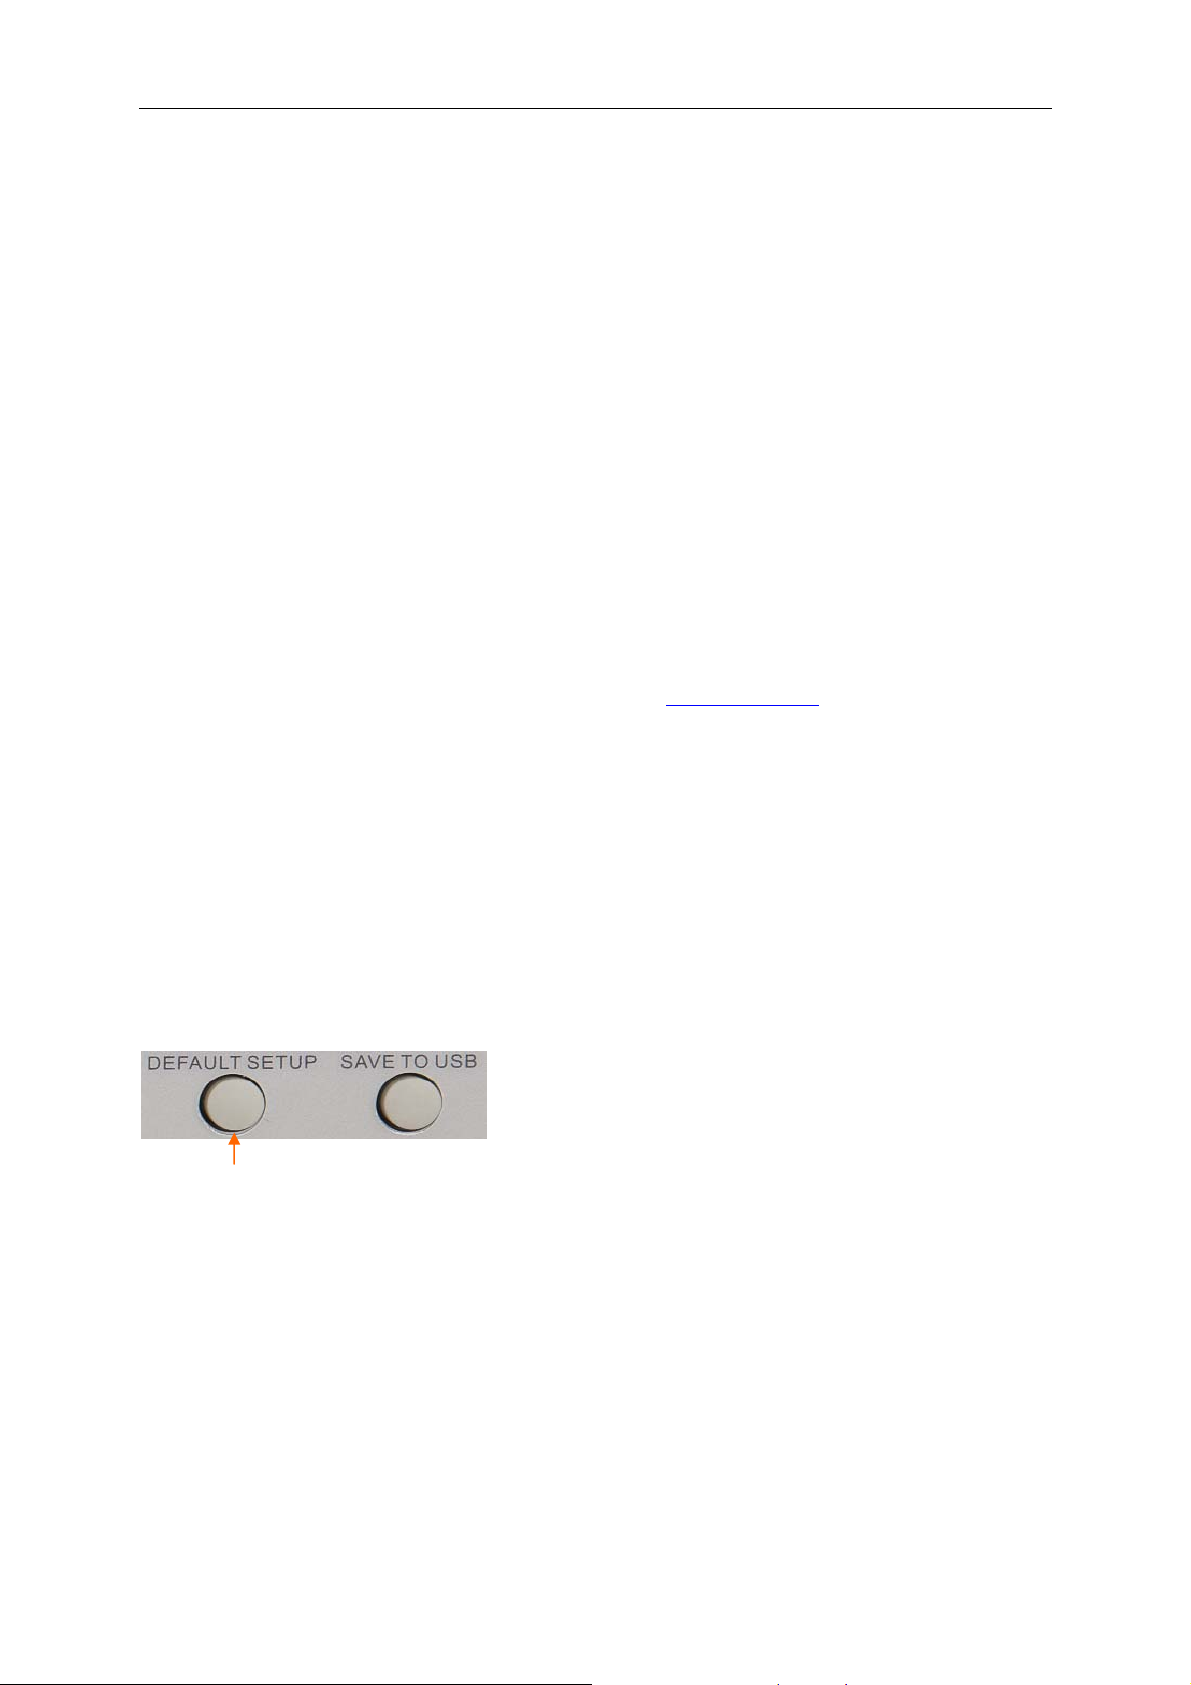
Plug in the oscilloscope and press the ON/OFF button. Then push the DEFAULT SETUP button.
The default Probe option attenuation setting is 10X.
The Default Setup button
3.2.2 Connect the oscilloscope
Set the switch on the probe to 10X and connect the probe to Channel 1 on the oscilloscope. First,
align the slot in the probe connector with the protuberance on the CH1 BNC and push to connect;
then, turn to right to lock the probe in place; after that, connect the probe tip and reference lead to
the PROBE COMP connectors. There is a mark on the panel: Probe COMP ~5V@1KHz.
MSO-5000B Digital Storage Oscilloscope User Manual 5
Getting Started Guide
CH1: to connect with the probe
PROBE COMP
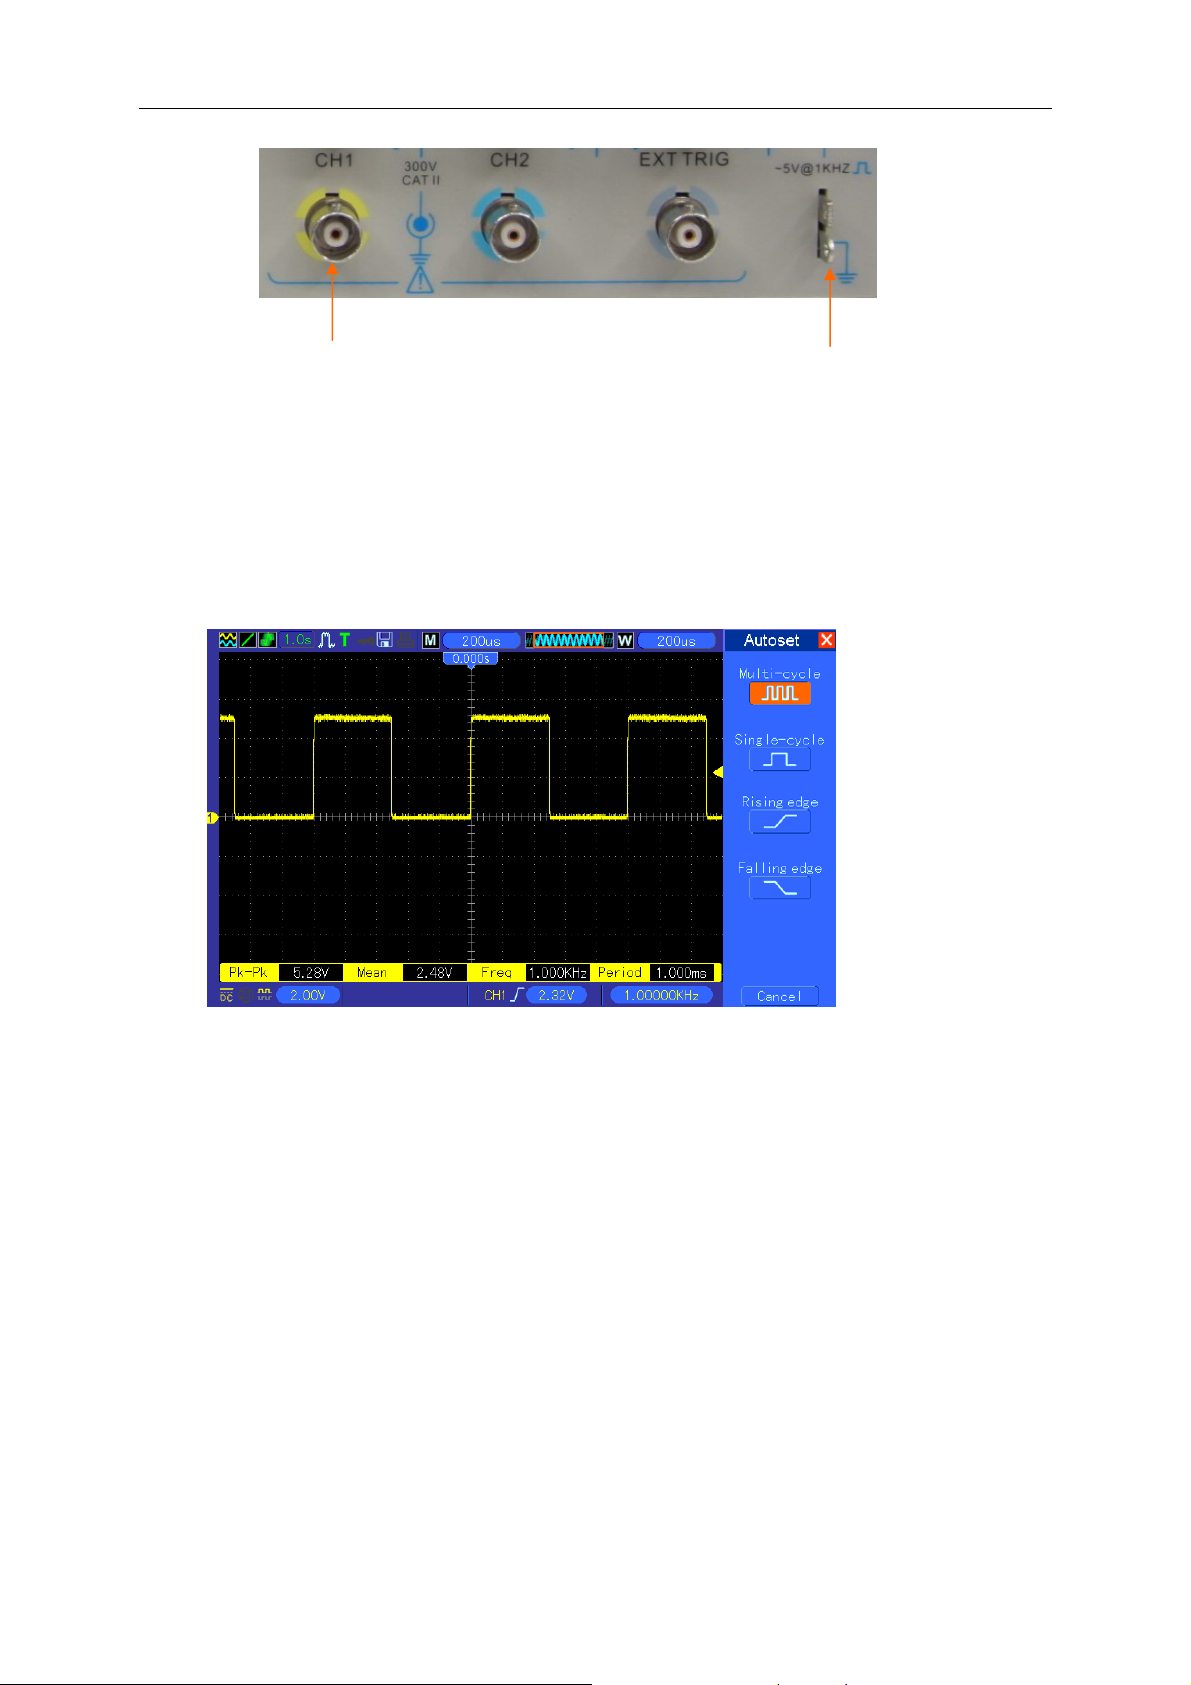
3.2.3 Observe the waveform
Press the AUTOSET button and you should see within a few seconds a square wave of about 5V
peak-to-peak at 1kHz in the display. Press the CH1 MENU button twice to remove Channel 1.
Push the CH2 MENU button and repeat Step 2 and Step 3 to observe Channel 2.
3.3 Probe Examination
3.3.1 Safety
When using the probe, keep your fingers behind the guard on the probe body to avoid electric
shock. Do not touch metallic portions of the probe head while it is connected to a voltage source.
Connect the probe to the oscilloscope and connect the ground terminal to ground before you start
any measurements.
MSO-5000B Digital Storage Oscilloscope User Manual 6

Getting Started Guide
3.3.2 Use of Probe Check Wizard
Every time you connect a probe to an input channel, you should use the probe check wizard to
verify that this probe is operating correctly. There are two ways to do this:
1) Use the vertical menu (for example, push the CH1 MENU button) to set the Probe option
attenuation factor.
2) Press the PROBE CHECK button to use the Probe Check Wizard and configure the probe
option attenuation factor properly following menu prompts.
3.4 Manual Probe Compensation
Upon the first connection of a probe and an input channel, you should manually perform this
adjustment to match the probe to the input channel. Uncompensated or miscompensated probes
may lead to errors or faults in measurement. To adjust the probe compensation, follow the steps
below.
1. Set the Probe option attenuation in the channel menu to 10X. Set the switch on the probe to
10X and connect the probe to Channel 1 on the oscilloscope. If you use the probe hook-tip,
ensure it is firmly inserted onto the probe. Attach the probe tip to the PROBE COMP
~5V@1KHz connector and the reference lead to the PROBE COMP Ground connector.
Display the channel and then press the AUTOSET button.
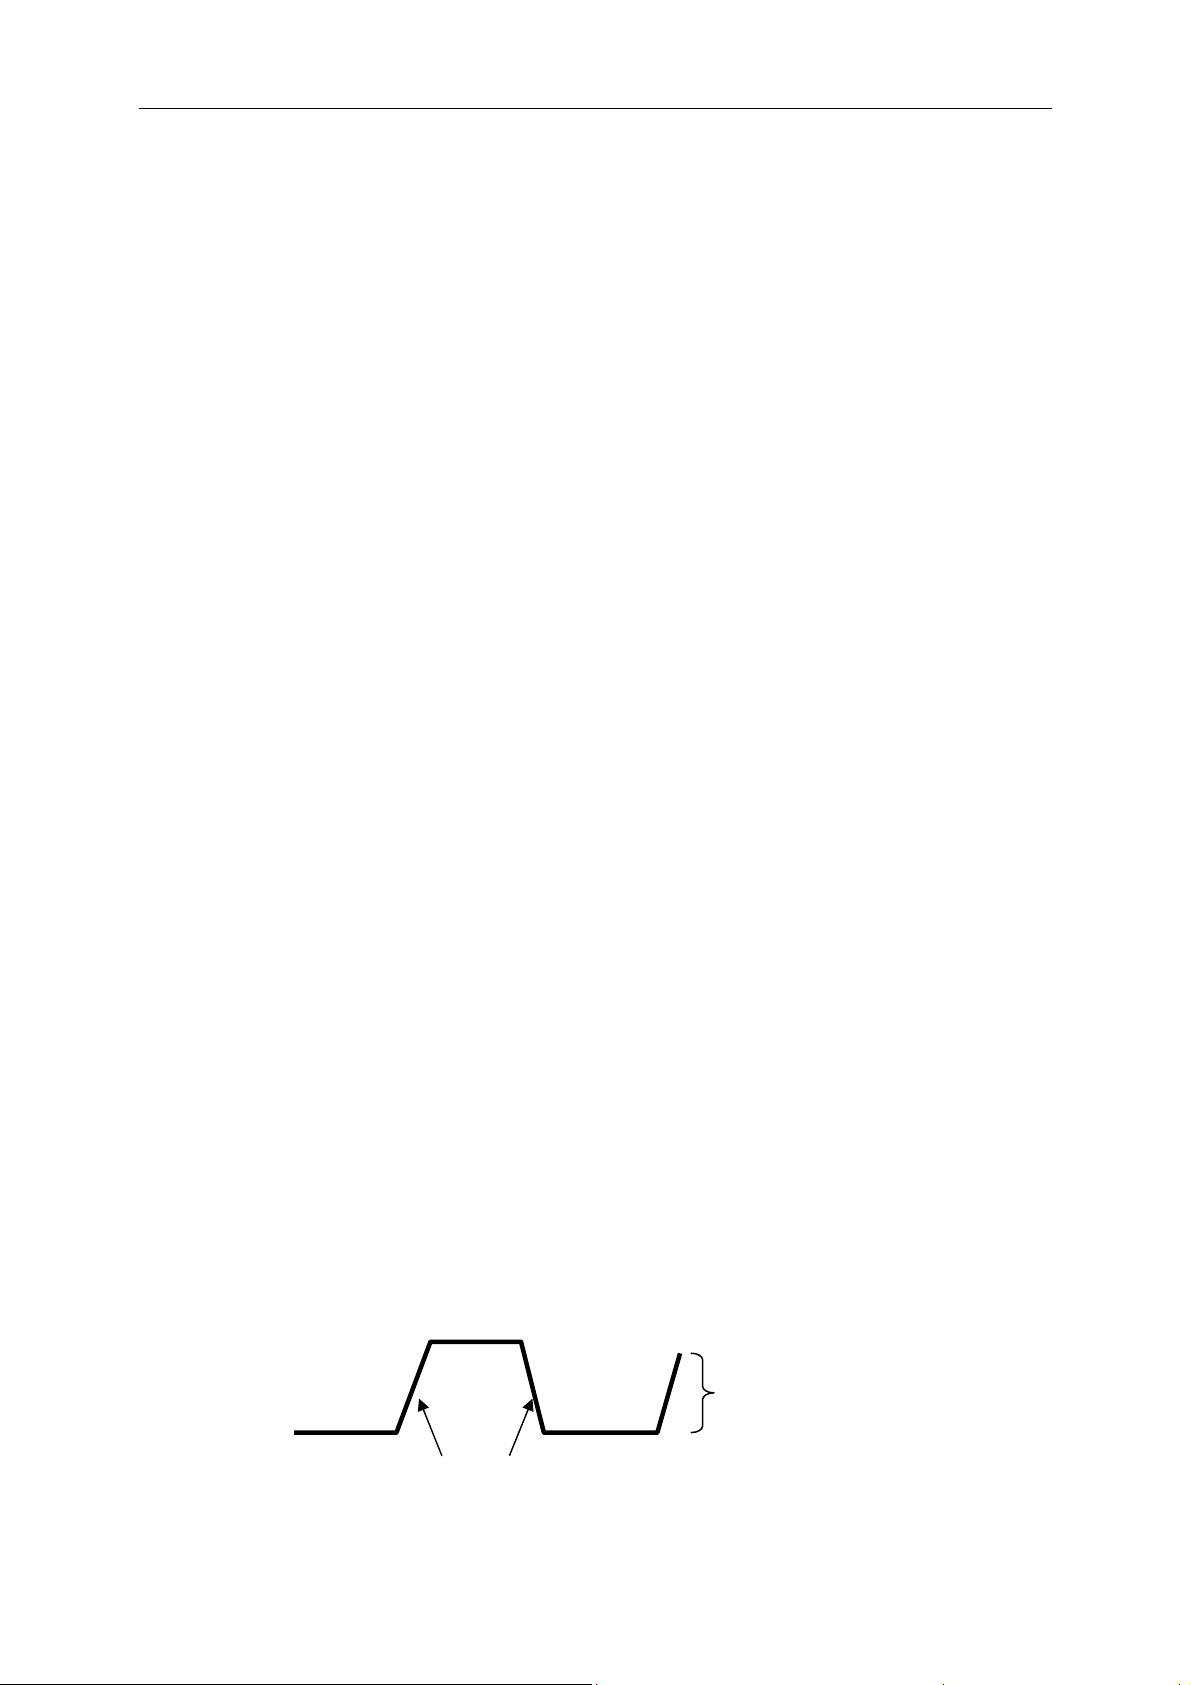
2. Check the shape of the displayed waveform.
Compensated correctly
Overcompensated
Undercompensated
3. If necessary, use a nonmetallic screwdriver to adjust the variable capacity of your probe until
the shape of the waveform turns to be the same as the above figure. Repeat this step as
necessary. See the figure below for the way of adjustment.
MSO-5000B Digital Storage Oscilloscope User Manual 7
Getting Started Guide
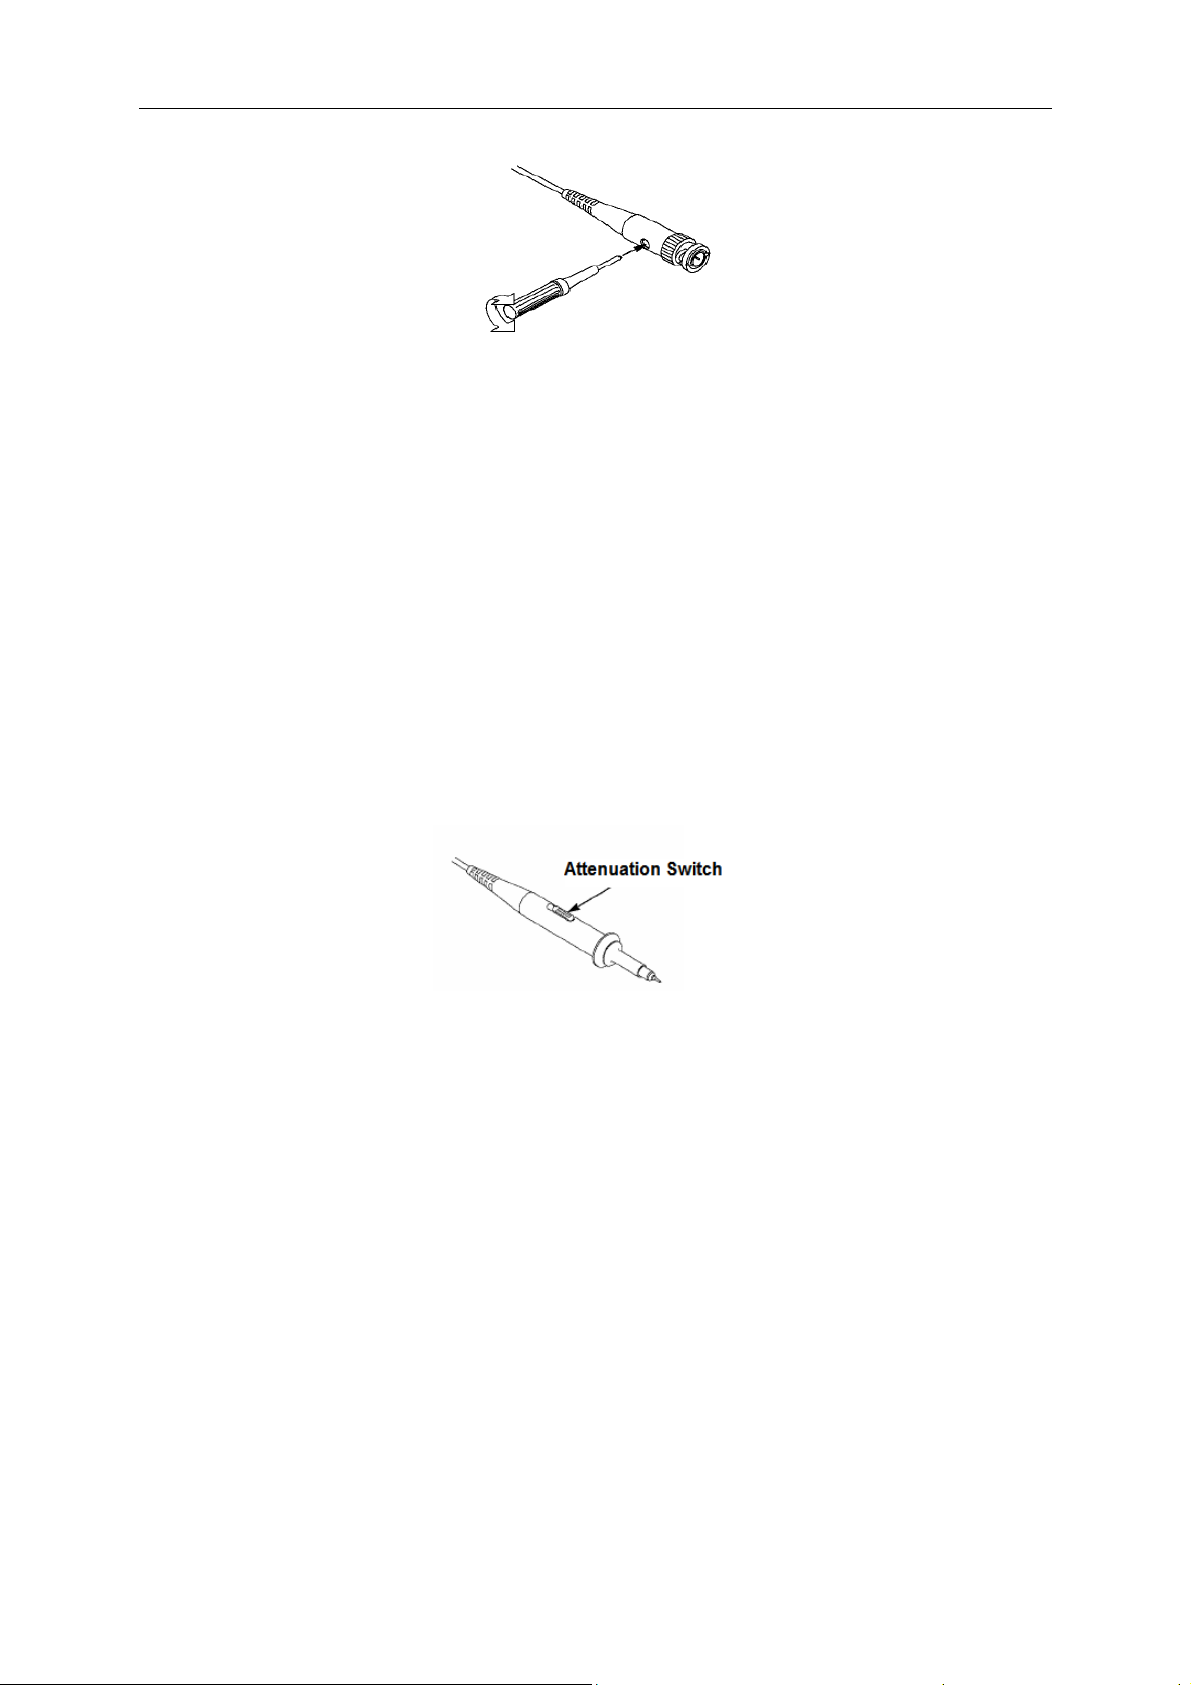
3.5 Probe Attenuation Setting
Probes are of various attenuation factors which affect the vertical scale of the signal. The Probe
Check function is used to verify if the Probe attenuation option matches the attenuation of the
probe.
As an alternative method to Probe Check, you can push a vertical menu button (such as the CH 1
MENU button) and select the Probe option that matches the attenuation factor of your probe.
Make sure that the Attenuation switch on the probe matches the Probe option in the oscilloscope.
Switch settings are 1X and 10X.
When the Attenuation switch is set to 1X, the probe limits the bandwidth of the oscilloscope to
6MHz. To use the full bandwidth of the oscilloscope, be sure to set the switch to 10X.
3.6 Self Calibration
The self calibration routine helps optimize the oscilloscope signal path for maximum measurement
accuracy. You can run the routine at any time but should always run it if the ambient temperature
changes by 5℃ or more. For a more accurate calibration, please power on the oscilloscope and
wait for 20 minutes until it has adequately warmed up.
To compensate the signal path, disconnect any probes or cables from the front-panel input
connectors. Then, push the UTILITY button, select the Do Self Cal option and follow the directions
on the screen.
MSO-5000B Digital Storage Oscilloscope User Manual 8
Getting Started Guide
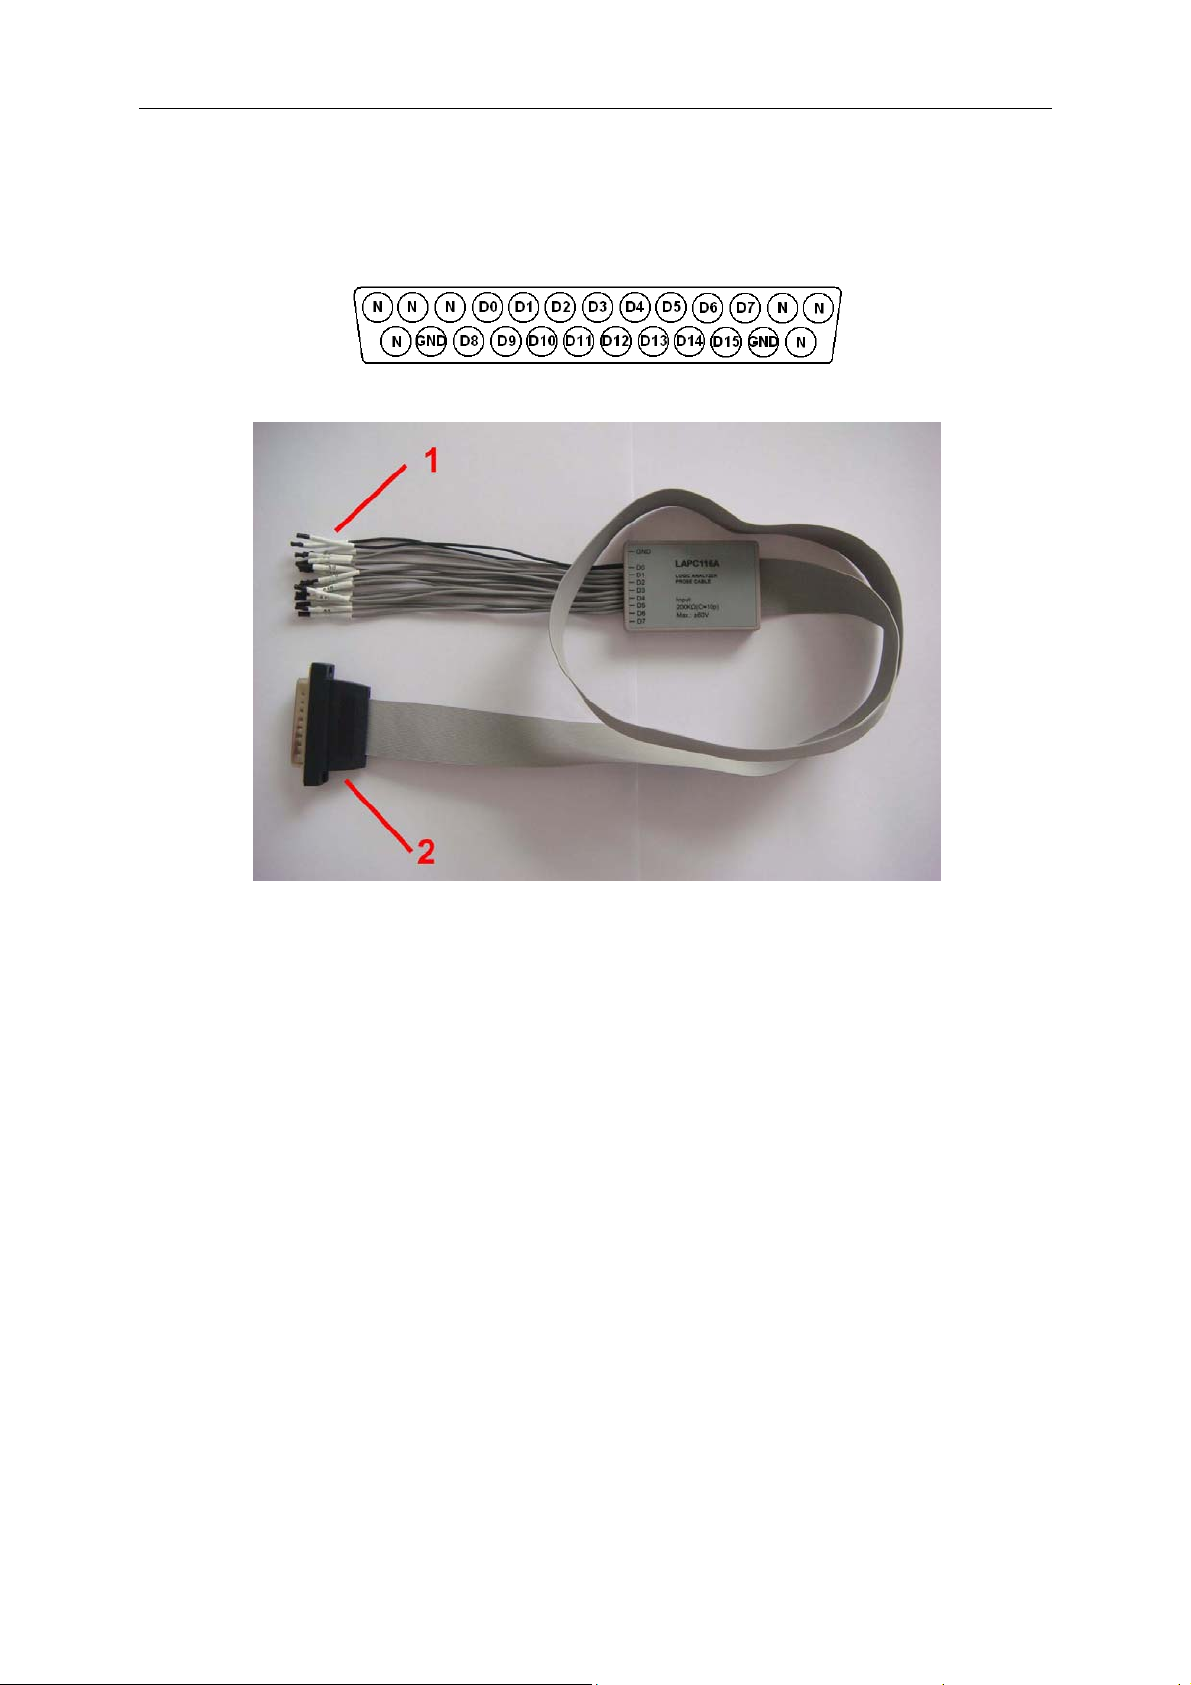
3.7 Logic Analyzer Flat Input Cable
MSO-5000B series has logic analyzer function, and its logic signal input port is shown as follows:
The flat terminal connection cable is shown as below.
1.Digital Input Terminal
The digital signal input terminals from left to right are GND, D0-D15, GND, totally 18 terminals.
Note: “From left to right” refers to the sequence of the digital input terminals when the flat cable is
connected to the logic signal input port.
2.Flat Cable Plug
Plug the flat cable into the logic signal input port in accordance with the sequence of the input port.
.
MSO-5000B Digital Storage Oscilloscope User Manual 9

Main Feature Description
Chapter 4 Main Feature Description
This chapter provides some general information that you need to learn before using an
oscilloscope. It contains:
1. Oscilloscope setup
2. Trigger
3. Data acquisition
4. Waveform scaling and positioning
5. Waveform measurement
4.1 Oscilloscope Setup
While operating the oscilloscope, you may often use three features: Autoset, saving a setup and
recalling a setup. Hereinafter they are introduced one by one.
Autoset: This function can be used to adjust the horizontal and vertical scales of the oscilloscope
automatically and set the trigger coupling, type, position, slope, level and mode, etc., to acquire a
stable waveform display.
Saving a Setup: By default, the oscilloscope will save the setup each time before being closed,
and automatically recall the setup once being turned on. (Note: If you modify the setup, please
wait for more than 5 seconds before turning off the oscilloscope to ensure the proper
storage of new settings.) You can save 10 settings permanently in the oscilloscope and reset
them as necessary.
Recalling a Setup: The oscilloscope can recall any of your saved setups or the default factory
setup.
Default Setup: The oscilloscope is preset for normal operations when it is shipped from the
factory. This is the default setup. You may recall this setup at any time for your requirements. To
view the default settings, refer to Section 5.6.3.
4.2 Trigger
The trigger determines when the oscilloscope begins to acquire data and display a waveform.
Once a trigger is properly set up, the oscilloscope can convert unstable displays or blank screens
to meaningful waveforms. Here introduce some basic concepts about trigger.
Trigger Source: The trigger can be generated with multiple sources. The most common one is the
input channel (alternative between CH1 and CH2). Whether the input signal is displayed or not, it
can trigger normal operations. Also the trigger source can be any signal connected to an external
MSO-5000B Digital Storage Oscilloscope User Manual 10
Main Feature Description
g
j
trigger channel or the AC power line (only for Edge triggers). The source with the AC power line
shows the frequency relationship between the signal and the AC commercial power.
Trigger Type: The oscilloscope has six types of triggers: Edge, Video, Pulse Width, Slope,
Overtime and Swap.
Edge Trigger uses the analog or digital test circuits for triggering. It happens when the
input trigger source crosses a specified level in a specified direction.
Video Trigger performs a field or line trigger through standard video signals.
Pulse Width Trigger can trigger normal or abnormal pulses that meet trigger conditions.
Slope Trigger uses the rise and fall times on the edge of signal for triggering.
Overtime Trigger happens after the edge of signal reaches the set time.
Swap Trigger, as a feature of analog oscilloscopes, gives stable displays of signals at
two different frequencies. Mainly it uses a specific frequency to switch between two
analog channels CH1 and CH2 so that the channels will generate swap trigger signals
through the trigger circuitry.
Trigger Mode: You can select the Auto or Normal mode to define how the oscilloscope acquires
data when it does not detect a trigger condition. Auto Mode performs the acquisition freely in
absence of valid trigger. It allows the generation of untriggered waveforms with the time base set
to 80ms/div or slower. Normal Mode updates the displayed waveforms only when the
oscilloscope detects a valid trigger condition. Before this update, the oscilloscope still displays the
old waveforms. This mode shall be used when you want to only view the effectively triggered
waveforms. In this mode, the oscilloscope displays waveforms only after the first trigger. To
perform a single sequence acquisition, push the SINGLE SEQ button.
Trigger Coupling: Trigger Coupling determines which part of the signal will be delivered to the
trigger circuit. This can help to obtain a stable display of the waveform. To use trigger coupling,
push the TRIG MENU button, select an Edge or Pulse trigger, and then select a Coupling option.
Trigger Position: The horizontal position control establishes the time between the trigger position
and the screen center.
Slope and Level: The Slope and Level controls help to define the trigger. The Slope option
determines whether the trigger point is on the rising or falling edge of a signal. To perform the
trigger slope control, press the TRIG MENU button, select an Edge trigger, and use the Slope
button to select rising or falling. The TRIGGER LEVEL knob controls the trigger point is on which
position of the edge.
Trigger level can be
usted vertically
ad
Rising Edge
Trigger slope can be rising or fallin
MSO-5000B Digital Storage Oscilloscope User Manual 11
Falling Edge

Main Feature Description
4.3 Data Acquisition
When you acquire an analog signal, the oscilloscope will convert it into a digital one. There are
two kinds of acquisition: Real-time acquisition and Equivalent acquisition. The real-time acquisition
has three modes: Normal, Peak Detect, and Average. The acquisition rate is affected by the
setting of time base.
Normal: In this acquisition mode, the oscilloscope samples the signal in evenly spaced intervals to
establish the waveform. This mode accurately represents signals in most time. However, it does
not acquire rapid variations in the analog signal that may occur between two samples, which can
result in aliasing and may cause narrow pulses to be missed. In such cases, you should use the
Peak Detect mode to acquire data.
Peak Detect: In this acquisition mode, the oscilloscope gets the maximum and minimum values of
the input signal over each sample interval and uses these values to display the waveform. In this
way, the oscilloscope can acquire and display those narrow pulses that may have otherwise been
missed in Normal mode. However, noise will appear to be higher in this mode.
Average: In this acquisition mode, the oscilloscope acquires several waveforms, averages them,
and displays the resulting waveform. You can use this mode to reduce random noise.
Equivalent Acquisition: This kind of acquisition can be utilized for periodic signals. In case the
acquisition rate is too low when using the real-time acquisition, the oscilloscope will use a fixed
rate to acquire data with a stationary tiny delay after each acquisition of a frame of data. After
repeating this acquisition for N times, the oscilloscope will arrange the acquired N frames of data
by time to make up a new frame of data. Then the waveform can be recovered. The number of
times N is related to the equivalent acquisition rate.
Time Base: The oscilloscope digitizes waveforms by acquiring the value of an input signal at
discrete points. The time base helps to control how often the values are digitized. Use the
SEC/DIV knob to adjust the time base to a horizontal scale that suits your purpose.
4.4 Waveform Scaling and Positioning
The display of waveforms on the screen can be changed by adjusting their scale and position.
Once the scale changes, the waveform display will increase or decrease in size. Once the position
changes, the waveform will move up, down, right, or left.
The channel reference indicator (located on the left of the graticule) identifies each waveform on
the screen. It points to the ground level of the waveform record.
Vertical Scale and Position: The vertical position of a waveform can be changed by moving it up
and down on the screen. To compare data, you may align a waveform over another. When you
push the VOLTS/DIV button to change the vertical scale of a waveform, the waveform display will
contract or expand vertically to the ground level.
Horizontal Scale and Position: Pretrigger Information
MSO-5000B Digital Storage Oscilloscope User Manual 12

Main Feature Description
You can adjust the HORIZONTAL POSITION control to view waveform data before the trigger,
after the trigger, or some of each. When you change the horizontal position of a waveform, you are
actually changing the time between the trigger position and the screen center.
For example, if you want to find out the cause of a glitch in your test circuit, you should trigger on
the glitch and make the pretrigger period long enough to capture data before the glitch. Then you
can analyze the pretrigger data and perhaps find the cause. You are allowed to change the
horizontal scale of all the waveforms by turning the SEC/DIV knob. For example, you may want to
see just one cycle of a waveform to measure the overshoot on its rising edge. The oscilloscope
shows the horizontal scale as time per division in the scale readout. Since all active waveforms
use the same time base, the oscilloscope only displays one value for all the active channels.
4.5 Waveform Measurement
The oscilloscope displays graphs of voltage versus time and can help to measure the displayed
waveform. There are several ways to take measurements, using the graticule, the cursors or
performing an automatic measurement.
Graticule: This method allows you to make a quick, visual estimate and take a simple
measurement through the graticule divisions and the scale factor.
For example, you can take simple measurements by counting the major and minor graticule
divisions involved and multiplying by the scale factor. If you counted 6 major vertical graticule
divisions between the minimum and maximum values of a waveform and knew you had a scale
factor of 50mV/division, you could easily calculate your peak-to-peak voltage as follows:
6 divisions x 50mV/division = 300mV.
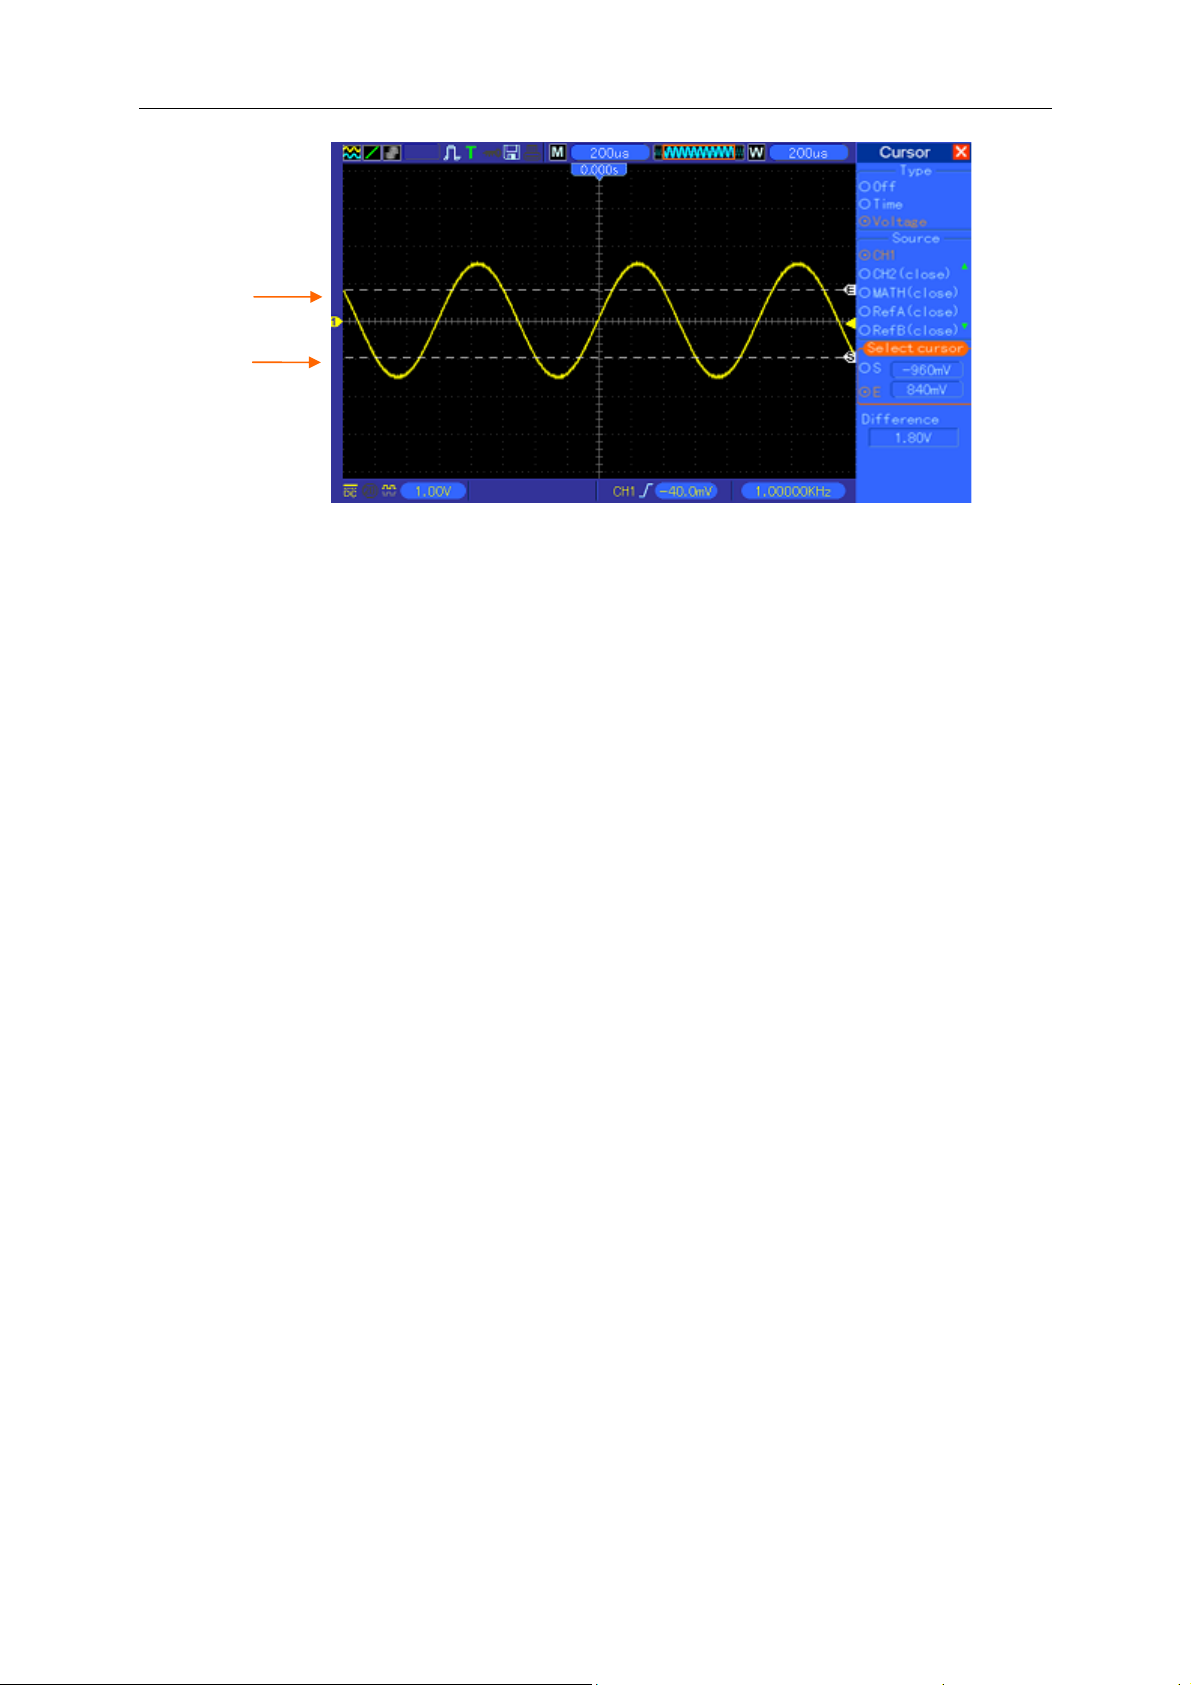
Cursor: This method allows you to take measurements by moving the cursors. Cursors always
appear in pairs and the displayed readouts are just their measured values. There are two kinds of
cursors: Amplitude Cursor and Time Cursor. The amplitude cursor appear as a horizontal broken
line, measuring the vertical parameters. The time cursor appear as a vertical broken line,
measuring the horizontal parameters.
When using cursors, please make sure to set the Source to the waveform that you want to
measure on the screen. To use cursors, push the CURSOR button.
MSO-5000B Digital Storage Oscilloscope User Manual 13
Main Feature Description
Cursor
Cursor
Automatic Measurement: The oscilloscope performs all the calculations automatically in this
mode. As this measurement uses the waveform record points, it is more precise than the graticule
and cursor measurements. Automatic measurements show the measurement results by readouts
which are periodically updated with the new data acquired by the oscilloscope
MSO-5000B Digital Storage Oscilloscope User Manual 14
Basic Operation
Chapter 5 Basic Operation
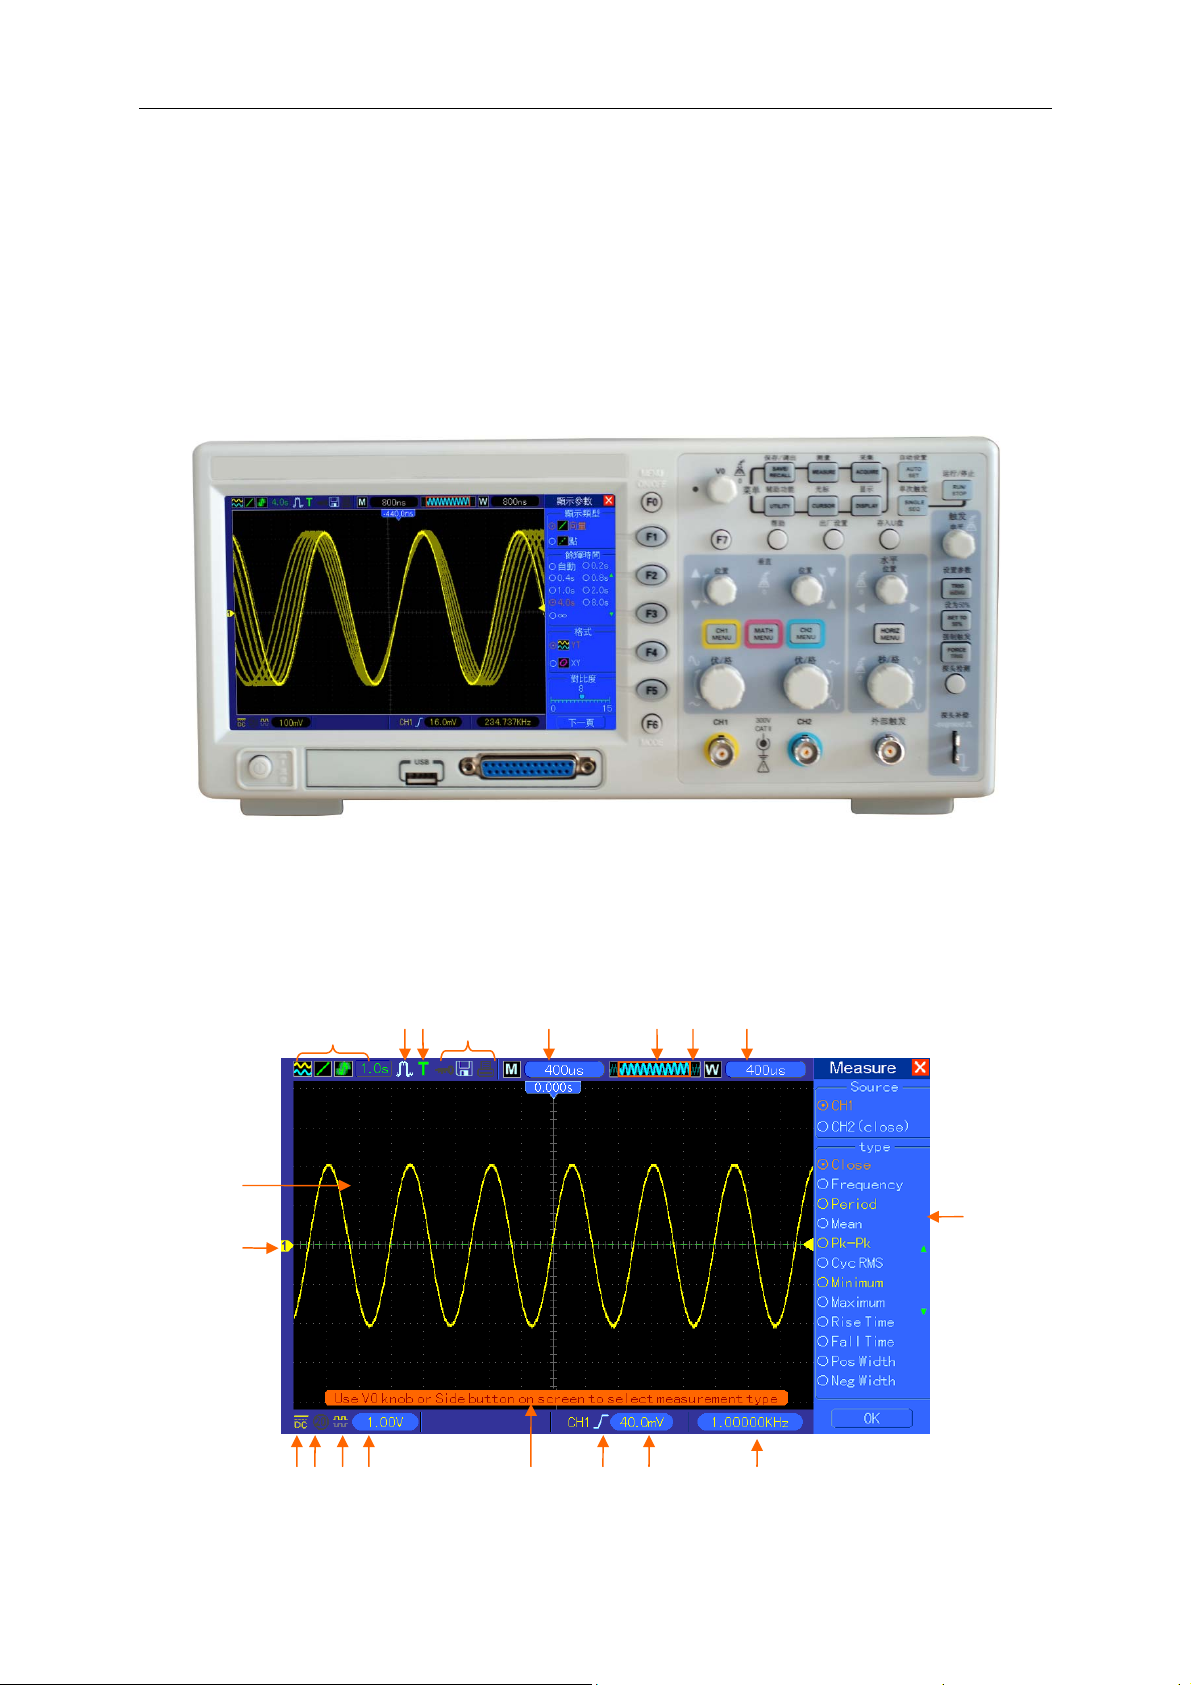
The front panel of the oscilloscope is divided into several functional areas. In this chapter we will
give a quick overview of all control buttons and knobs on the front panel as well as the displayed
information on the screen and relative testing operations. The figure below illustrates the front
panel of the MSO-5000B digital oscilloscope.
5.1 Display Area
1 2 3 4 5 6 7 8
19
18
Front Panel of MSO-5000B
9
10 13 12 11 17 16 15 14
MSO-5000B Digital Storage Oscilloscope User Manual 15
1. Display Format:
Basic Operation
: YT
: Vectors
: Gray indicates auto persistence; Green means persistence display is enabled. When
the icon is set to green, the time for persistence display will be shown behind it.
2. Acquisition Mode: Normal, Peak Detect or Average
3. Trigger Status:
The oscilloscope is acquiring pretriggered data.
All pretriggered data have been acquired and the oscilloscope is ready to accept a trigger.
T The oscilloscope has detected a trigger and is acquiring the posttrigger information.
The oscilloscope works in auto mode and is acquiring waveforms in the absence of
triggers.
The oscilloscope is acquiring and displaying waveform data continuously in scan mode.
● The oscilloscope has stopped acquiring waveform data.
: XY
: Dots
S The oscilloscope has finished a single sequence acquisition.
4. Tool Icon:
: If this icon lights up, it means the keyboard of the oscilloscope is locked by the host computer
via USB control.
: If this icon lights up, it means the USB disk has been connected.
: This icon lights up only when the USB slave interface is connected with the computer.
5. Readout shows main time base setting.
6. Main Time Base Window
7. Display of window’s position in data memory and data length.
8. Window Time Base
9. Operating Menu shows different information for different function keys.
10. Readout shows frequency count.
11. Readout points out horizontal waveform position
12. Trigger Type:
:
Edge trigger on the rising edge.
: Edge trigger on the falling edge.
: Video trigger with line synchronization.
MSO-5000B Digital Storage Oscilloscope User Manual 16

Basic Operation
: Video trigger with field synchronization.
: Pulse Width trigger, positive polarity.
: Pulse Width trigger, negative polarity.
13. Pop-up Prompt
14. Readout tells trigger level.
15. Icon indicates whether the waveform is inverted or not.
16. 20M Bandwidth Limit. If this icon lights up, it means the bandwidth limit is enabled, otherwise
disabled.
17. Icon indicates channel coupling.
18. Channel Marker
19. Window displays waveform.
5.1.1 XY Format
The XY format is used to analyze phase differences, such as those represented by Lissajous
patterns. The format plots the voltage on CH1 against the voltage on CH2, where CH1 is the
horizontal axis and CH2 is the vertical axis. The oscilloscope uses the untriggered Normal
acquisition mode and displays data as dots. The sampling rate is fixed at 1 MS/s.
The oscilloscope can acquire waveforms in YT format at any sampling rate. You may view the
same waveform in XY format. To perform this operation, stop the acquisition and change the
display format to XY.
The table below shows how to operate some controls in XY format.
Controls Usable or not in XY format
CH1 VOLTS/DIV and VERTICAL POSITION controls Set the horizontal scale and position
CH2 VOLTS/DIV and VERTICAL POSITION controls
Reference or Math Unusable
Cursors Unusable
Autoset (display format reset to YT) Unusable
Time base controls Unusable
Trigger controls Unusable
Continuously set the vertical scale and
position
5.2 Horizontal Controls
Use the horizontal controls to change the horizontal scale and position of waveforms. The
horizontal position readout shows the time represented by the center of the screen, using the
trigger time as zero. When you change the horizontal scale, the waveform will expand or contract
to the screen center. The readout near the upper right of the screen shows the current horizontal
MSO-5000B Digital Storage Oscilloscope User Manual 17

Basic Operation
position in second. M represents ‘Main Time Base’, and W indicates ‘Window Time Base’. The
oscilloscope also has an arrow icon at the top of the graticule to indicate the horizontal position.
1. HORIZONTAL POSITION Knob: Used to control the trigger position against the screen center.
Push this button to reset the trigger point back to the screen center.
AN: Used to set the horizontal position as zero.
2. Each option in HORIZ MENU is described as follows.
Options Settings Comments
Window Control Major Window
Minor Window
Selects the major or minor window in dual-window
mode. The window is highlighted once selected.
Press this option button in single-window mode to
enter the daul-window mode.
Mark Right arrow
Left arrow
Set/Clear
Clear All
This function is usable only in dual-window mode. It
sets marks at some waveform record locations that
users are interested in, and searches for these marks
by right and left arrows. Then it positions the window
to this mark for further observation.
Holdoff None Select this menu and turn the multi-functional knob to
adjust the trigger holdoff time within the range of
100ns-10s. Select this menu and push the
multi-functional knob to reset the holdoff time with the
starting value 100ns.
Autoplay None This function is usable in dual-window mode. Push
this menu button and auto move it from left to right at
a specified speed. In the expanded window will
display corresponding waveforms until it stops once
reaching the rightmost side of the major scan window
Single-window Mode
MSO-5000B Digital Storage Oscilloscope User Manual 18
Dual-window Mode (Full Screen)
Location of expanded window data in memory
Basic Operation
Major Window
Minor Window
(Expanded Window)
Multi-functional
Knob
3.SEC/DIV Knob: Used to change the horizontal time scale so as to magnify or compress the
waveform horizontally. If the waveform acquisition is stopped (by using the RUN/STOP or SINGLE
SEQ button), the SEC/DIV control will expand or compress the waveform. In dual-window mode,
push this knob to select major or minor window. When the major window is selected, this knob
provides the same functions as it provides in single-mode window. When the minor window is
selected, turn this knob to scale the waveform whose magnification is up to 1000.
Notes:
MSO-5000B Digital Storage Oscilloscope User Manual 19
Basic Operation
1. For more information of the trigger holdoff, see Section Trigger Controls.
2. In single-window mode, press F0 to hide or show the menus on the right side. The
dual-window mode does not support the menu hiding function.
5.2.1 Scan Mode Display (Roll Mode)
With the SEC/DIV control set to 80ms/div or slower and the trigger mode set to Auto, the
oscilloscope works in the scan acquisition mode. In this mode, the waveform display is updated
from left to right without any trigger or horizontal position control.
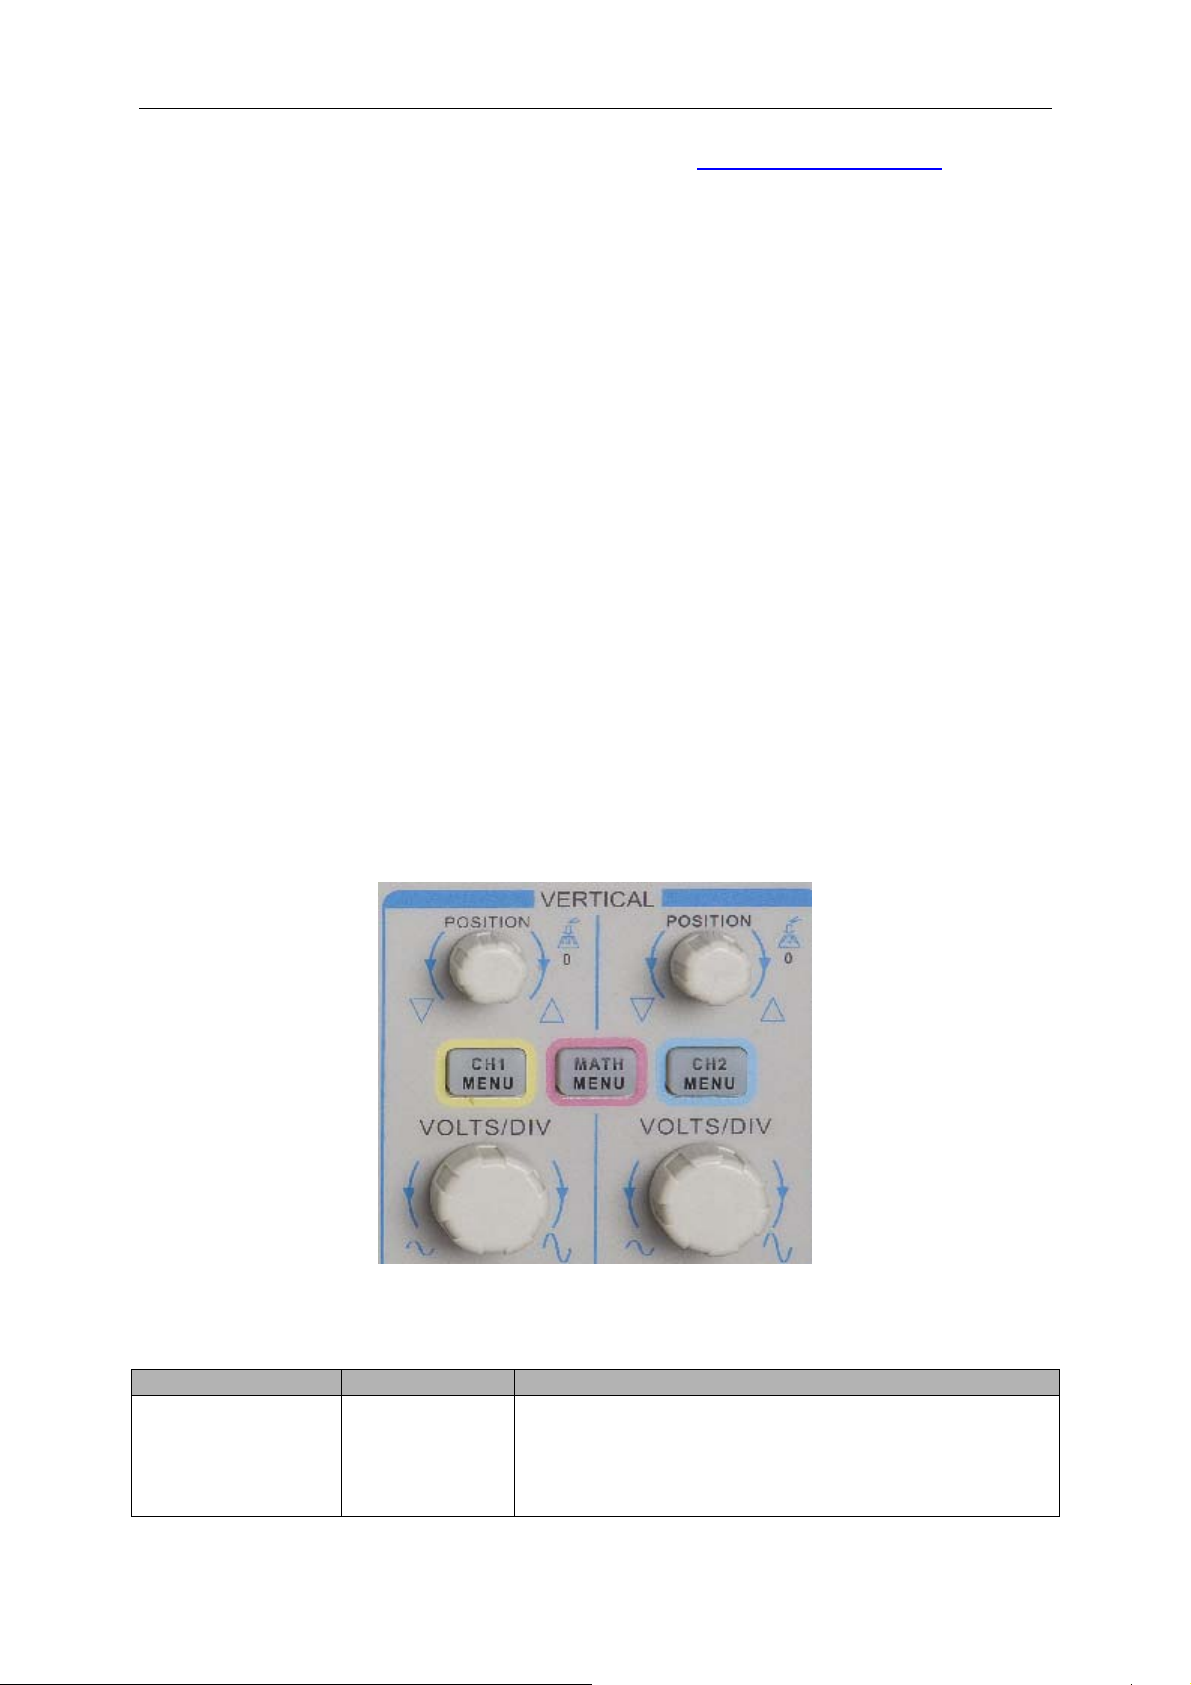
5.3 Vertical Controls
Vertical controls can be used to display and remove waveforms, adjust vertical scale and position,
set input parameters and perform math calculations. Each channel has a separate vertical menu
to set. See below for menu description.
1. VERTICAL POSITION Knob: Move the channel waveform up and down on the screen. In
dual-window mode, move the waveforms in both windows at the same time in a same direction.
Push this knob to return waveforms to the vertical center position on the screen. Two channels
correspond to two knobs.
2. Menu (CH1, CH2): Display vertical menu options; turn on or off the display of channel
waveforms.
Options Settings Comments
DC passes both DC and AC components of the input
DC
Coupling
MSO-5000B Digital Storage Oscilloscope User Manual 20
AC
Ground
signal.
AC blocks the DC component of the input signal and
attenuates signals below 10Hz.
Ground disconnects the input signal.

Basic Operation
20MHz Bandwidth
Limit
VOLTS/DIV
Probe Attenuation
Invert
Unlimited
Limited
Coarse
Fine
1X
10X
100X
1000X
Off
On
Limits the bandwidth to reduce display noise; filters the
signal to eliminate noise and other unnecessary HF
components.
Selects the resolution of the VOLTS/DIV knob.
Coarse defines a 1-2-5 sequence. Fine changes the
resolution to small steps between the Coarse settings.
Selects a value according to the probe attenuation factor
so as to ensure correct vertical readouts. Reduce
bandwidth to 6MHz when using a 1X probe.
Inverts the waveform relative to the reference level.
Ground Coupling
Used to display a zero-volt waveform. Internally, the channel input is connected with a zero-volt
reference level.
Fine Resolution
In the fine resolution setting, the vertical scale readout displays the actual VOLTS/DIV setting. The
vertical scale changes only after you adjust the VOLTS/DIV control and set to coarse.
Remove Waveform Display
To remove a waveform from the screen, first push the menu button to display the vertical menu,
then push again to remove the waveform. A channel waveform which is unnecessary to be
displayed can be used as a trigger source or for math operations.
3. VOLTS/DIV Knob
Control the oscilloscope to magnify or attenuate the source signal of the channel waveform. The
vertical size of the display on the screen will change (increase or decrease) to the ground level.
Also you may use this knob to switch between coarse and fine.
4. MATH MENU: Display the waveform math operations. See the table below for details.
The MATH menu contains source options for all math operations.
Operations Source Options Comments
+ CH1+CH2 Add Channel 1 to Channel 2.
CH1-CH2
-
CH2-CH1
Subtract the Channel 2 waveform from the
Channel 1 waveform.
Subtract the Channel 1 waveform from the
Channel 2 waveform.
Three types of window available for selection:
Hanning, Flattop, Rectangular.
FFT CH1 or CH2
Zoom: Use the FFT Zoom button to adjust the
window size.
Scale: x1, x2, x5, x10.
Note: All selected menus are highlighted in orange.
MSO-5000B Digital Storage Oscilloscope User Manual 21

Basic Operation
5.3.1 Math FFT
This chapter elaborates how to use the Math FFT (Fast Fourier Transform). You can use the Math
FFT mode to convert a time-domain (YT) signal into its frequency components (spectrum), and to
observe the following types of signals:
Analyze harmonics in power cords;
Measure harmonic content and distortion in systems;
Characterize noise in DC power supplies;
Test impulse response of filters and systems;
Analyze vibration.
To use the Math FFT mode, perform the following tasks:
Set the source (time-domain) waveform;
Display the FFT spectrum;
Choose a type of FFT window;
Adjust the sample rate to display the fundamental frequency and harmonics without aliasing;
Use zoom controls to magnify the spectrum;
Use cursors to measure the spectrum.
5.3.1.1 Setting Time-domain Waveform
It is necessary to set the time-domain (YT) waveform before using the FFT mode. Follow the steps
below.
1. Push the AUTOSET button to display a YT waveform.
2. Turn the VERTICAL POSITION knob to vertically move the YT waveform to the center (zero
division) so as to ensure the FFT will display a true DC value.
3. Turn the HORIZONTAL POSITION knob to position the part of the YT waveform to be
analyzed in the center eight divisions of the screen. The oscilloscope uses the 2048 center
points of the time-domain waveform to calculate the FFT spectrum.
4. Turn the VOLTS/DIV knob to ensure the entire waveform remains on the screen. If the entire
waveform is invisible, the oscilloscope may display wrong FFT results by adding
high-frequency components.
5. Turn the SEC/DIV knob to provide the resolution you need in the FFT spectrum.
6. If possible, set the oscilloscope to display multiple signal cycles.
If you turn the SEC/DIV knob to select a faster setting (fewer cycles), the FFT spectrum will display
a larger frequency range and reduce the possibility of FFT aliasing.
To set the FFT display, follow the steps below.
1. Push the MATH MENU button;
MSO-5000B Digital Storage Oscilloscope User Manual 22

Basic Operation
2. Set the Operation option to FFT;
3. Select the Math FFT Source channel.
In many situations, the oscilloscope can also generate a useful FFT spectrum despite the YT
waveform not being triggered. This is especially true if the signal is periodic or random (such as
noise).
Note: You should trigger and position transient or burst waveforms as close as possible to
the screen center.
Nyquist Frequency
The highest frequency that any real-time digital oscilloscope can measure without errors is half of
the sample rate, which is called the Nyquist frequency. Frequency information beyond the Nyquist
frequency is undersampled which brings about the FFT aliasing. The math function can convert
the center 2048 points of the time-domain waveform to an FFT spectrum. The resulting FFT
spectrum contains 1024 points from DC (0Hz) to the Nyquist frequency. Usually, the screen
compresses the FFT spectrum horizontally to 250 points, but you can use the FFT Zoom function
to expand the FFT spectrum so that you can clearly view the frequency components at each of the
1024 data points in the FFT spectrum.
Note: The oscilloscope’s vertical response is a little bit larger than its bandwidth (60MHz;
or 20MHz when the Bandwidth Limit option is set to Limited). Therefore, the FFT spectrum
can display valid frequency information above the oscilloscope bandwidth. However, the
amplitude information near or above the bandwidth will not be accurate.
5.3.1.2 Displaying FFT Spectrum
Push the MATH MENU button to display the Math menu. Use the options to select the Source
channel, the Window algorithm and the FFT Zoom factor. Only one FFT spectrum can be
displayed at a time.
Math FFT Options Settings Comments
Source CH1, CH2 Choose a channel to be the FFT source.
Window
FFT Zoom X1, X2, X5, X10
Hanning, Flattop,
Rectangular
Select a type of the FFT window. For more
information, refer to Section 5.3.1.3.
Change the horizontal magnification of the FFT
display. For detailed information, refer to Section
5.3.1.6.
MSO-5000B Digital Storage Oscilloscope User Manual 23

1
Fundamental frequency component
Frequency component
Basic Operation
5
2 3 4
1. Frequency at the center graticule line
2. Vertical scale in dB per division (0dB=1V
RMS
)
3. Horizontal scale in frequency per division
4. Sample rate in number of samples per second
5. FFT window type
5.3.1.3 Selecting FFT Window
Using windows can eliminate the spectral leakage in the FFT spectrum. The FFT algorithm
assumes that the YT waveform repeats all the time. When the number of cycles is integral (1, 2,
3 ...), the YT waveform starts and ends at the same amplitude and there are no discontinuities in
the signal shape.
If the number of cycles is nonintegral, the YT waveform starts and ends at different amplitudes and
transitions between the start and end points will cause discontinuities in the signal that introduces
high-frequency transients.
MSO-5000B Digital Storage Oscilloscope User Manual 24

Basic Operation
Applying a window to the YT waveform changes the waveform so that the start and stop values
are close to each other, which reduces the discontinuities.
The Math FFT function has three FFT Window options. There is a trade-off between frequency
resolution and amplitude accuracy for each type of window. You shall determine which one to
choose according to the object you want to measure and the source signal characteristics.
Window Measurement Characteristics
Hanning Periodic Waveform Better frequency, poorer amplitude accuracy than Flattop
Flattop Periodic Waveform Better amplitude, poorer frequency accuracy than Hanning
Rectangular
MSO-5000B Digital Storage Oscilloscope User Manual 25
Pulse or Transient
Waveform
Special-purpose window applicable to discontinuous
waveforms. This is actually the same as no windows.

Basic Operation
5.3.1.4 FFT Aliasing
Problems occur when the time-domain waveform acquired by the oscilloscope contains frequency
components higher than the Nyquist frequency. The frequency components above the Nyquist
frequency will be undersampled and displayed as lower frequency components that ‘fold back’
from the Nyquist frequency. These erroneous components are called aliases.
5.3.1.5 Eliminating Aliases
To eliminate aliases, use the following methods.
Turn the SEC/DIV knob to set a faster sample rate. Because the Nyquist frequency increases
as you increase the sample rate, the aliased frequency components will be displayed correct.
If too many frequency components appear on the screen, you may use the FFT Zoom option
to magnify the FFT spectrum.
If there is no need to observe the frequency components above 20MHz, set the Bandwidth
Limit option to Limited.
Filter the signal input from outside and limit the bandwidth of the source waveform to lower
than the Nyquist frequency.
Identify and ignore the aliased frequencies.
Use zoom controls and cursors to magnify and measure the FFT spectrum.
5.3.1.6 Magnifying and Positioning FFT Spectrum
You may scale the FFT spectrum and use cursors to measure it through the FFT Zoom option
which enables the horizontal magnification. To vertically magnify the spectrum, use the vertical
controls.
Horizontal Zoom and Position
You can use the FFT Zoom option to magnify the FFT spectrum horizontally without changing the
sample rate. The available zoom factors are X1(default), X2, X5 and X10. When the zoom factor is
set to X1 and the waveform is located at the center graticule, the left graticule line is at 0Hz and
the right is at the Nyquist frequency.
You magnifies the FFT spectrum to the center graticule line when you change the zoom factor.
That is, the axis for horizontal magnification is the center graticule line. Turn the Horizontal
Position knob clockwise to move the FFT spectrum to the right. Push the SET TO ZERO button to
position the center spectrum at the center of the graticule.
Vertical Zoom and Position
When the FFT spectrum is being displayed, the channel vertical knobs become the zoom and
position controls corresponding to their respective channels. The VOLTS/DIV knob provides the
following zoom factors: X1(default), X2, X5 and X10. The FFT spectrum is magnified vertically to
MSO-5000B Digital Storage Oscilloscope User Manual 26

Basic Operation
p
the marker M (math waveform reference point on the left edge of the screen). Turn the VERTICAL
POSITION knob clockwise to move up the spectrum.
5.3.1.7 Using Cursors to Measure FFT Spectrum
You may use cursors to take two measurements on the FFT spectrum: amplitude (in dB) and
frequency (in Hz). Amplitude is referenced to 0db that equals 1VRMS here. You may use cursors
to measure at any zoom factor.
Push the CURSOR button, choose the Source option and then select Math. Press the Type option
button to select between Amplitude and Frequency. Click the SELECT CURSOR option to choose
a cursor. Then use the V0 knobs to move Cursor S and Cursor E. Use the horizontal cursor to
measure the amplitude and the vertical cursor to measure the frequency. Now the display at the
DELTA menu is just the measured value, and the values at Cursor S and Cursor E.
Delta is the absolute value of Cursor S minus Cursor E.
Frequency Cursors
Am
litude Cursors
5.4 Trigger Controls
The trigger can be defined through the Trigger Menu and front-panel controls. There are six types
of trigger: Edge, Video, Pulse Width, Swap, Slope and Overtime. Refer to the following tables to
find a different set of options for each type of trigger.
MSO-5000B Digital Storage Oscilloscope User Manual 27
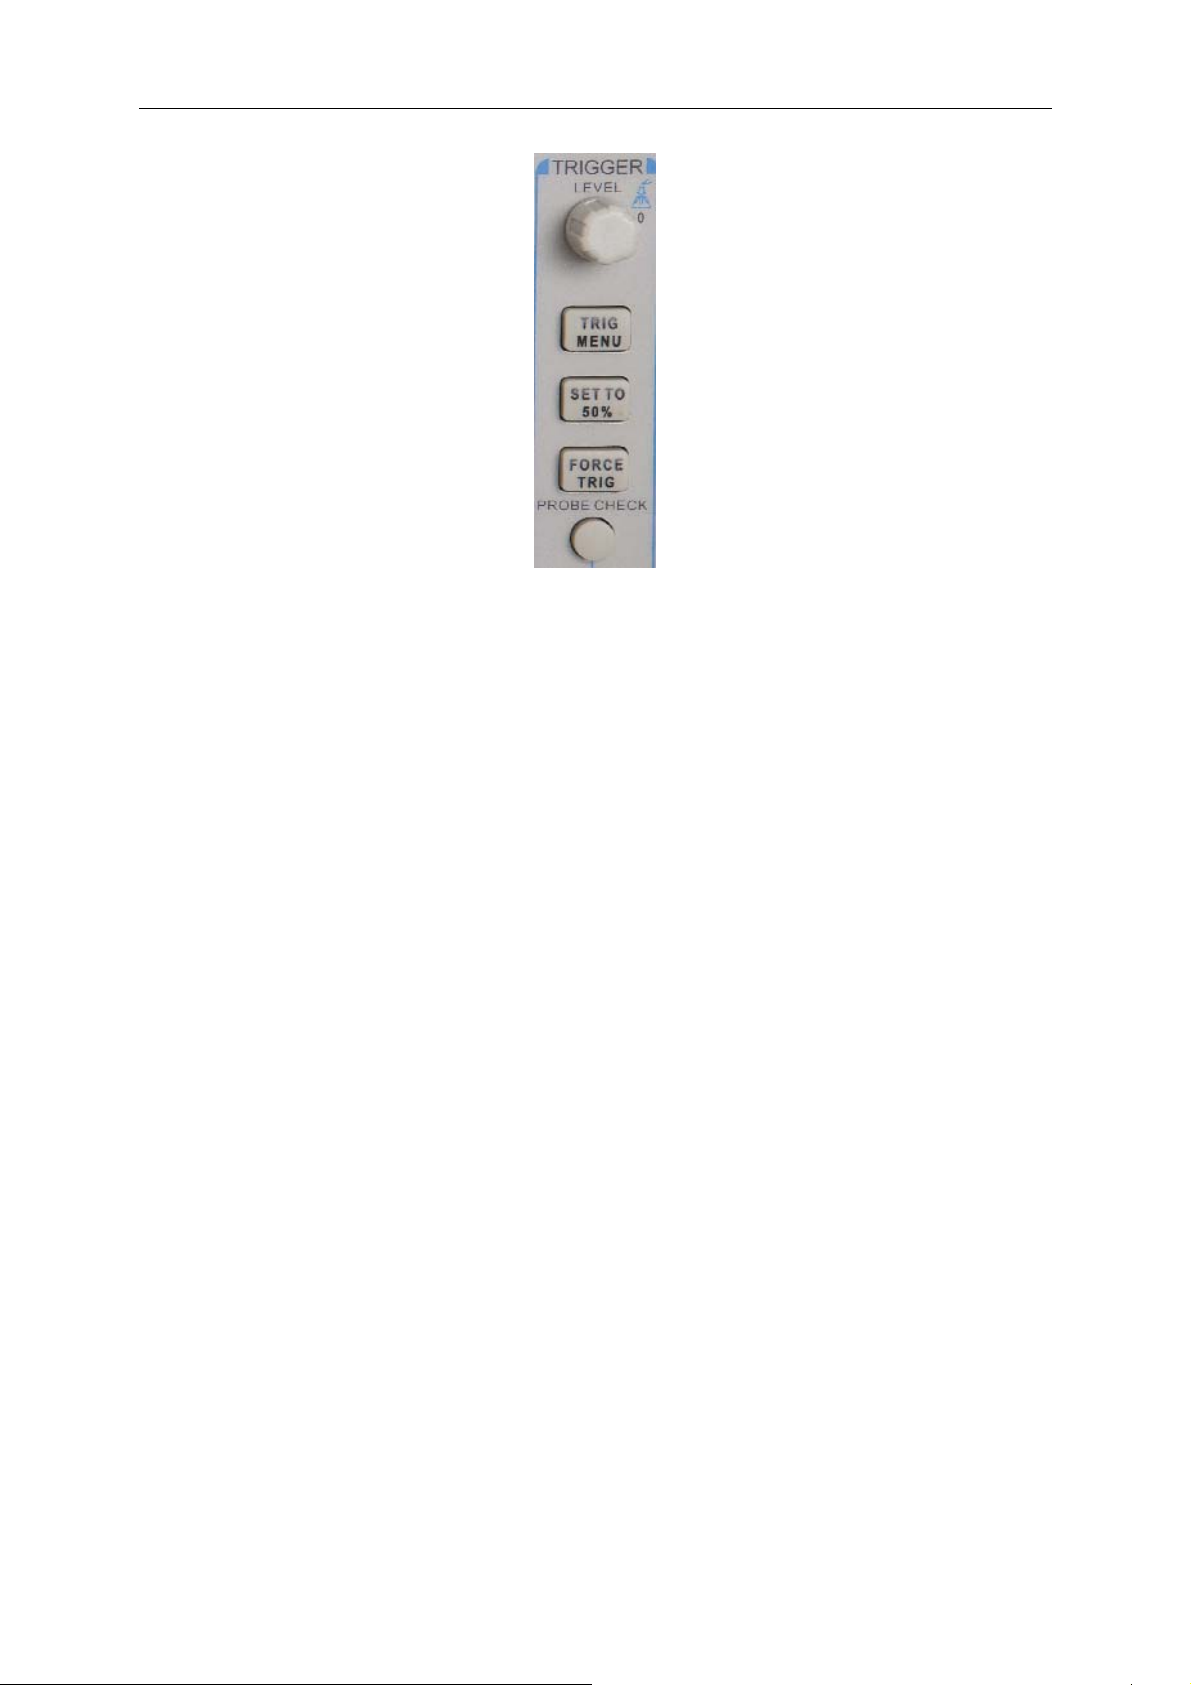
Basic Operation
1. Level
It sets the amplitude level the signal must cross to cause an acquisition when using the Edge or
Pulse Width trigger.
2. Set to 50%
The trigger level is set to the vertical midpoint between the peaks of the trigger signal.
3. Force Trigger
Used to complete an acquisition regardless of an adequate trigger signal. This button becomes
useless if the acquisition is already stopped.
4. TRIG MENU
Push this button to display trigger menus. The edge trigger is in common use. See the table below
for details.
MSO-5000B Digital Storage Oscilloscope User Manual 28

Options Settings Comments
Trigger Type
Edge Video
Pulse Slope
Swap Overtime
By default the oscilloscope uses the edge trigger which
triggers the oscilloscope on the rising or falling edge of the
input signal when it crosses the trigger level (threshold).
Select the input source as the trigger signal.
CH1, CH2: No matter the waveform is displayed or not, a
Source
CH1
CH2
EXT
EXT/5
AC Line
certain channel will be triggered.
EXT: Does not display the trigger signal and allows a
trigger level range of +1.6V to -1.6V.
EXT/5: Same as EXT option, but attenuates the signal by
a factor of 5 and allows a trigger level range of +8V to -8V.
AC Line: Uses a signal derived from the power cord as the
trigger source.
Select a trigger mode.
By default, the oscilloscope uses the Auto mode. In this
mode, the oscilloscope is forced to trigger when it does
not detect a trigger within a certain amount of time based
on the SEC/DIV setting. The oscilloscope goes into the
scan mode at 80ms/div or slower time base settings.
In the Normal mode, the oscilloscope updates the display
Mode
Auto
Normal
only when it detects a valid trigger condition. New
waveforms are not displayed until they replace old ones.
Use this mode to just view valid triggered waveforms.
Only after the first trigger does the display appear.
Select the components of the trigger signal applied to the
trigger circuitry.
AC: Blocks DC components and attenuates signals below
10Hz.
DC: Passes all components of the signal.
HF Reject: Attenuates the high-frequency components
above 80kHz.
Coupling
AC
DC
HF Reject
LF Reject
LF Reject: Blocks DC components and attenuates the
low-frequency components below 8kHz.
Basic Operation
NOTE: Trigger coupling only affects the signal passed through the trigger system. It does
not affect the bandwidth or coupling of the signal displayed on the screen.
Video Trigger
Options Settings Comments
With Video highlighted, an NTSC, PAL or SECAM
Video
standard video signal will be triggered. The trigger
coupling is preset to AC.
Source
Polarity
CH1
CH2
EXT
EXT/5
Normal
Inverted
Select the input source as the trigger signal. Ext and
Ext/5 use the signal applied to the EXT TRIG connector
as the source.
Normal: Triggers on the negative edge of the sync pulse.
Inverted: Triggers on the positive edge of the sync pulse.
All Lines
Sync
Line Number
Odd Field
Even Field
Choose a proper video sync. When selecting Line
Number for the Sync option, you may use the User
Select knob to specify a line number.
All Fields
Standard
MSO-5000B Digital Storage Oscilloscope User Manual 29
NTSC
PAL/SECAM
Choose a video standard for sync and line number
count.

Basic Operation
Note: When you choose Normal Polarity, the trigger always occurs on negative-going sync
pulses. If the video signal contains positive-going sync pulses, use the Inverted Polarity
option.
Pulse Width Trigger
You can use it to trigger on aberrant pulses.
Options Settings Comments
With Pulse highlighted, the trigger occurs on pulses that
Pulse
meet the trigger condition (defined by the Source, When
and Set Pulse Width options).
CH1
Source
CH2
EXT
Select the input source as the trigger signal.
EXT5
=
When
≠
<
Select the trigger condition.
>
Set Pulse
Width
Polarity
Mode
20ns to 10.0sec
Positive
Negative
Auto
Normal
With Set Pulse Width highlighted by pressing F4, turn the
multi-functional knob to set the pulse width.
Select to trigger on positive or negative pulses.
Select the type of trigger. The Normal mode is best for
most pulse width trigger applications.
AC
Coupling
DC
HF Reject
Select the components of the trigger signal applied to the
trigger circuit.
LF Reject
More Switch between submenu pages.
Trigger When: The pulse width of the source must be ≥5ns so that the oscilloscope can detect the
pulse.
Triggers when pulse is
less than width setting
Triggers when pulse is
greater than width setting
Threshold level
Triggers when pulse is not
equal to width setting ±5%
Triggers when pulse is
equal to width setting ±5%
Threshold level
Tolerance
Tolerance
= Trigger Point
=, ≠: Within a ±5% tolerance, triggers the oscilloscope when the signal pulse width is equal to
MSO-5000B Digital Storage Oscilloscope User Manual 30

Basic Operation
or not equal to the specified pulse width.
<, >: Triggers the oscilloscope when the source signal pulse width is less than or greater
than the specified pulse width.
Slope Trigger: Judges trigger according to the time for rising or falling, more flexible and accurate
than the Edge trigger.
Options Settings Comments
Slope
CH1
Source
CH2
EXT
Select the input source as the trigger signal.
EXT5
Slope
Mode
Rising
Falling
Auto
Normal
Select the slope type of signal.
Select the type of trigger. The Normal mode is best for
most pulse width trigger applications.
AC
Coupling
DC
Noise Reject
HF Reject
Selects the components of the trigger signal applied to
the trigger circuitry.
LF Reject
Next Page
Vertical
V1
V2
Adjust the vertical window by setting two trigger levels.
Select this option and press F3 to choose V1 or V2.
=
When
≠
<
Select the trigger condition.
>
Time 20ns to 10.0sec
With this option highlighted by pressing F4, turn the
multi-functional knob to set the time span.
Swap Trigger: As a feature of analog oscilloscopes, it gives stable displays of signals at two
different frequencies. Mainly it uses a specific frequency to switch between two analog channels
CH1 and CH2 so that the channels will generate swap trigger signals through the trigger circuitry.
Options Settings Comments
Swap
Trigger
Mode
Channel
Auto
Normal
CH1
CH2
Select the type of trigger.
Push an option such as CH1, select the channel trigger type
and set the menu interface.
Below list options in submenus. Swap Trigger allows CH1 and CH2 to select different trigger
modes and to display waveforms on a same screen. That is, both channels can choose the
following four trigger modes.
MSO-5000B Digital Storage Oscilloscope User Manual 31

Type Edge
Slope
Rising
Falling
AC
Coupling
DC
HF Reject
Push F3 or F4 to select the components of the trigger signal
applied to the trigger circuitry.
LF Reject
Type Video
Polarity
Standard
Normal
Inverted
NTSC
PAL/SECAM
All Lines
Line Number
Sync
Odd Field
Select by F4, F5.
Even Field
All Fields
Type Pulse
Polarity
Positive
Negative
=
When
≠
<
Select by F3.
>
Set Pulse
Width
Pulse Width
Push F4 to select. Adjust the multi-functional knob V0 to set
the pulse width.
AC
DC
Coupling
Noise Reject
Select by F5.
HF Reject
LF Reject
Type Slope
Slope
Mode
Rising
Falling
Auto
Normal
Select the slope type of signal.
Select the type of trigger. The Normal mode is best for most
pulse width trigger applications.
AC
Coupling
DC
Noise Reject
HF Reject
Selects the components of the trigger signal applied to the
trigger circuitry.
LF Reject
Next Page
Vertical
V1
V2
Adjust the vertical window by setting two trigger levels.
Select this option and press F3 to choose V1 or V2.
When = Select the trigger condition.
Basic Operation
MSO-5000B Digital Storage Oscilloscope User Manual 32

Basic Operation
f
A
A
≠
<
>
Time 20ns to 10.0sec
Overtime Trigger: In Pulse Width trigger, you may sometimes be puzzled with the long time for
trigger, as you do not need a complete pulse width to trigger the oscilloscope, but want the trigger
occurs just upon the overtime point. This is called Overtime Trigger.
Options Settings Comments
Type OT
Source
Polarity
Mode
Overtime t
Coupling
CH1
CH2
Positive
Negative
Auto
Normal
AC
DC
HF Reject
LF Reject
Press F4 to select this option. Turn the multi-functional knob
to set the time span.
Select the trigger source.
Select to trigger on positive or negative pulses.
Press F5 to select Overtime option and adjust V0 to set the
time.
Selects the components of the trigger signal applied to the
trigger circuitry.
Holdoff: To use Trigger Holdoff, push the HORIZONTAL Menu button and set the Holdoff Time
option by pressing F4. The Trigger Holdoff function can be used to generate a stable display of
complex waveforms (such as pulse trains). Holdoff is the time between when the oscilloscope
detects one trigger and when it is ready to detect another. During the holdoff time, the oscilloscope
will not trigger. For a pulse train, the holdoff time can be adjusted to let the oscilloscope trigger only
on the first pulse in the train.
cquisition Interval
Trigger Level
Indicates
Trigger Points
Holdof
cquisition Interval
Holdoff
5.5 Menu and Option Buttons
As shown below, these six buttons at the top of the front panel are used mainly to recall relative
MSO-5000B Digital Storage Oscilloscope User Manual 33

setup menus.
SAVE/RECALL: Displays the Save/Recall menu for setups and waveforms.
MEASURE: Displays the Measure menu.
ACQUIRE: Displays the Acquire menu.
UTIILITY: Displays the Utility menu.
CURSOR: Displays the Cursor menu.
DISPLAY: Displays the Display menu.
Basic Operation
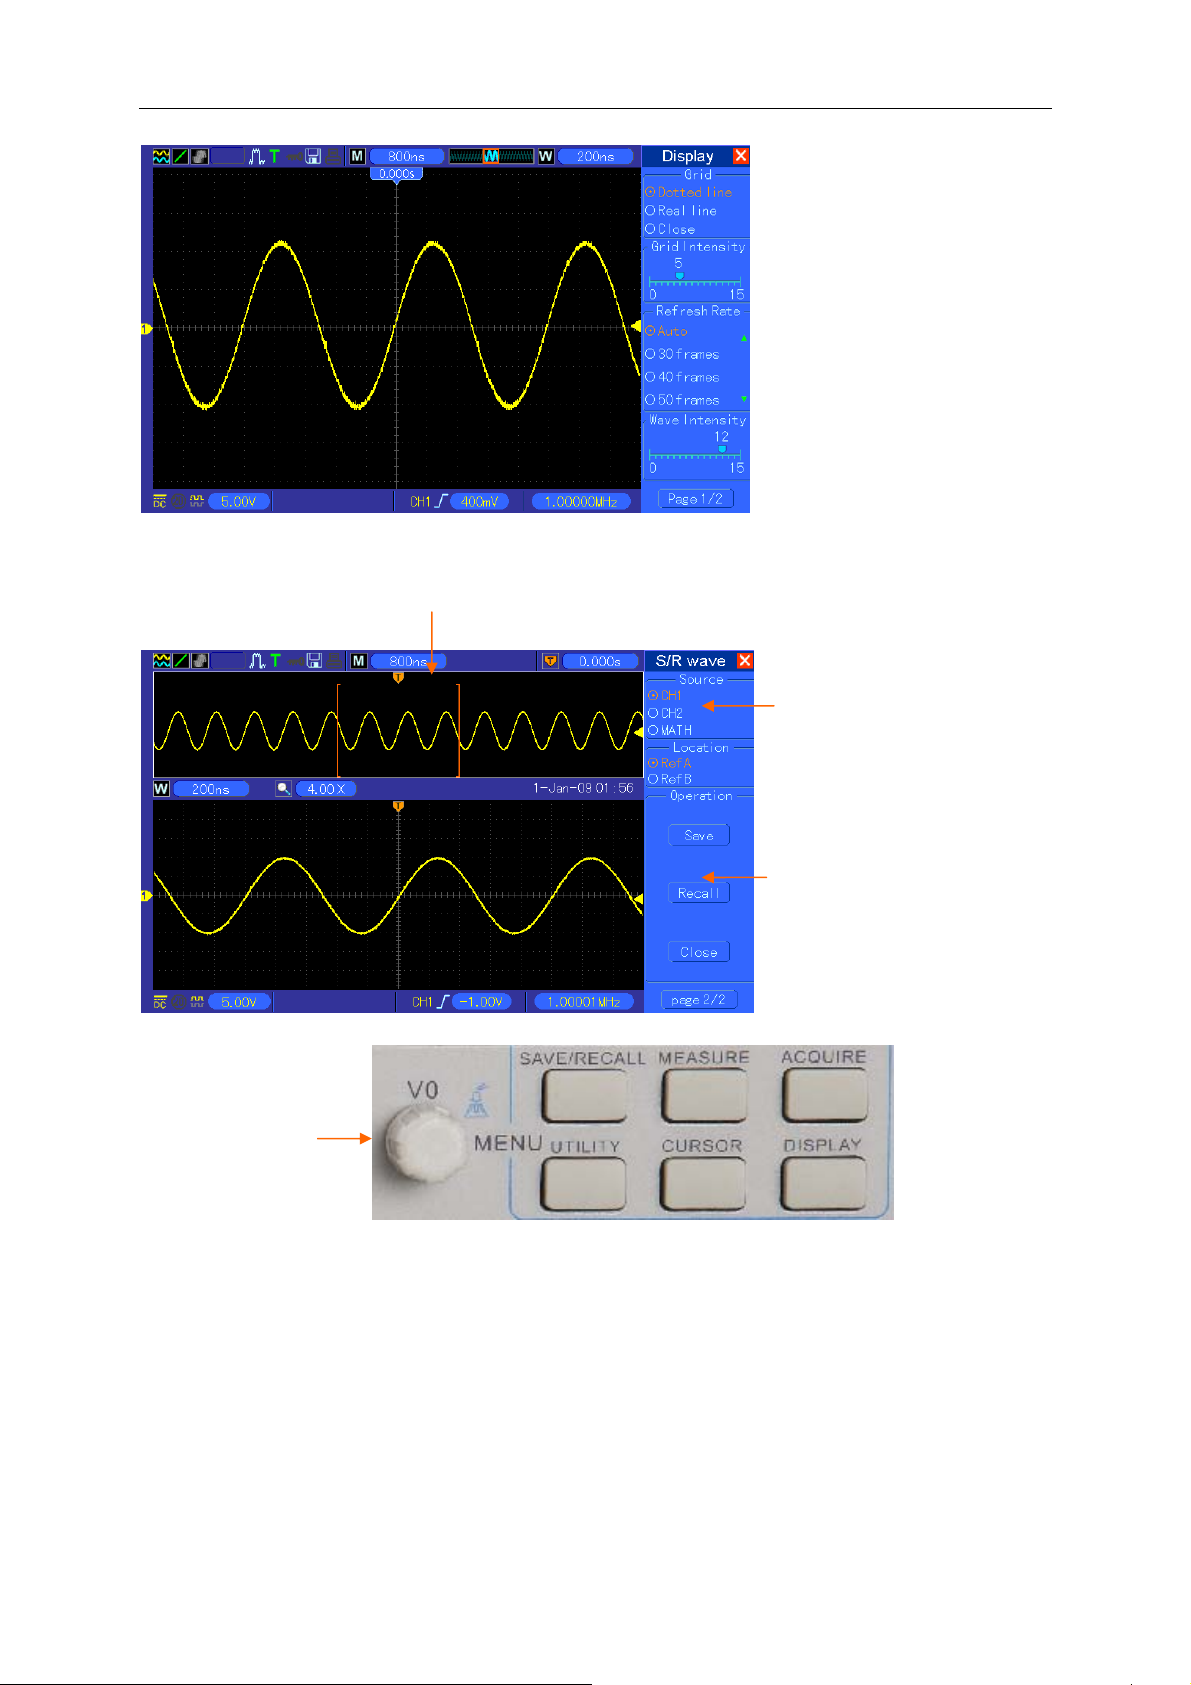
5.5.1 SAVE/RECALL
Press the SAVE/RECALL button to save or recall oscilloscope setups or waveforms.
The first page shows the following menu.
Options Settings Comments
Waveforms
Source
REF
Operation
Press ‘Next Page’ to recall the following menu.
Options Settings Comments
Setups
Operation
Source
Memory 0 to 9
Operation
Flash memory
USB disk
Save Complete the saving operation.
Recall
CH1
CH2 off
MATH off
RefA
RefB
Save Save the source waveform to the selected reference location.
Ref on
Ref off
Select a waveform display to store.
Select the reference location to store or recall a waveform.
Display or remove the reference waveform on the screen.
Store the current setups to the USB disk or the memory of the
oscilloscope.
Specify the memory location in which to store the current waveform
settings or from which to recall the waveform settings. Use the V0 knob
to select.
Recall the oscilloscope settings stored in the location selected in the
Setup field. Push the Default Setup button to initialize the oscilloscope
MSO-5000B Digital Storage Oscilloscope User Manual 34

to a known setup.
A
See below for waveform menus.
Basic Operation
The white waveforms on the menu is
the recalled RefA waveform
Note: The oscilloscope will save the current settings if you wait 5 seconds after the last
modification, and it will recall these settings the next time you power on the oscilloscope.
t most 9 groups of
setups can be stored
5.5.2 MEASURE
Push the MEASURE button to perform auto measurements. There are 11 types of measurements
and up to 8 can be displayed at a time.
Turn the V0 knob to select an unspecified option. Press V0 or F6 when the red arrow icon stops on
it. Then the following menu appears.
Options Settings Comments
Source
Measurement
Type
Period Calculate the time of the first cycle.
Mean Calculate the arithmetic mean voltage over the entire record.
Pk-Pk
Cyc RMS
Min
Max
Rise Time
Fall Time
Positive Width
Negative Width
Off Do not take any measurement.
CH1
CH2
Frequency Calculate the waveform frequency by measuring the first cycle.
Select the measure source.
Calculate the absolute difference between the greatest and the
smallest peaks of the entire waveform.
Calculate the actual RMS measurement of the first complete
cycle of the waveform.
Examine the waveform record of all points in the current
window and display the minimum value.
Examine the waveform record of all points in the current
window and display the maximum value.
Measure the time between 10% and 90% of the first rising
edge of the waveform.
Measure the time between 90% and 10% of the first falling
edge of the waveform.
Measure the time between the first rising edge and the next
falling edge at the waveform 50% level.
Measure the time between the first falling edge and the next
rising edge at the waveform 50% level.
Use the knob V0 or the functional keys F3, F4 to select the type of measurement.
MSO-5000B Digital Storage Oscilloscope User Manual 35

The readouts in big font size on
the menu are just results of the
corresponding measurements.
Basic Operation
Taking Measurements: For a single waveform (or a waveform divided among multiple
waveforms), up to 8 automatic measurements can be displayed at a time. The waveform channel
must stay in an ‘ON’ (displayed) state to facilitate the measurement. The automatic measurement
can not be performed on reference or math waveforms, or in XY or Scan mode.
5.5.3 ACQUIRE
Push the ACQUIRE button to set the acquisition parameter.
Options Settings Comments
Category
Mode
(Real Time)
Averages
(Real Time)
Memory Depth
(Real Time)
Real Time
Equ-Time
Normal
Peak Detect
Average
4
16
64
128
4K, 40K, 512K, 1M Select the memory depth for different board models.
Acquire waveforms by real-time digital technique.
Rebuild waveforms by equivalent sample technique.
Acquire and accurately display most waveforms.
Detect glitches and eliminate the possibility of
aliasing.
Reduce random or uncorrelated noise in signal
display. The number of averages is selectable.
Select the number of averages by pressing F3 or F4.
Normal: For the oscilloscope model with the bandwidth of 100MHz, the maximum sample rate is
1GS/s. For time base with insufficient sample rate, you may use the Sine Interpolation Algorithm to
interpolate points between sampled points to produce a complete waveform record (4K by
MSO-5000B Digital Storage Oscilloscope User Manual 36
default).
Basic Operation
Normal Acquisition Intervals
8372 4 5 61 9 10
Sample Points
Normal Mode Acquires a Single Sample Point in Each Interval
Peak Detect: Use this mode to detect glitches within 10ns and to limit the possibility of aliasing.
This mode is valid at the SEC/DIV setting of 4µs/div or slower. Once you set the SEC/DIV setting
to 4µs/div or faster, the acquisition mode will change to Normal because the sample rate is fast
enough that Peak Detect is unnecessary. The oscilloscope does not display a message to tell you
that the mode has been changed to Normal.
Average: Use this mode to reduce random or uncorrelated noise in the signal to be displayed.
Acquire data in Normal mode and then average a great number of waveforms. Choose the
number of acquisitions (4, 16, 64 or 128) to average for the waveform.
Stopping the Acquisition: When you are running the acquisition, the waveform display is live.
Stop the acquisition (press the RUN/STOP button) to freeze the display. In either mode, the
waveform display can be scaled or positioned by vertical and horizontal controls.
Equivalent Acquisition: Just repeat the Normal acquisition. Use this mode to take a specific
observation on repeatedly displayed periodic signals. You can get a resolution of 40ps, i.e.
25GSa/s sample rate, which is much higher than that obtained in real-time acquisition.
The acquisition principle is as follows.
Input repeated signals
First Acquisition
Second Acquisition
Third Acquisition
Fourth Acquisition
As shown above, acquire input signals (cycle repeatable) for more than once at a slow sample rate,
arrange the sample points by the time they appear, then recover waveforms.
MSO-5000B Digital Storage Oscilloscope User Manual 37

Basic Operation
5.5.4 UTILITY
Push the UTILITY button to display the Utility Menu as follows.
Options Comments
System Info Display the software and hardware versions, serial number and some other
information about the oscilloscope.
Update
Program
Save
Waveform
Self
Calibration
Advance Buzzer and time setups
Insert a USB disk with upgrade program and the disk icon at the top left corner is
highlighted. Press the Update Program button and the Software Upgrade dialog
pops up. Push F6 to upgrade or push F2 to cancel.
Insert a USB disk and the disk icon at the top left corner is highlighted. Click on
this icon and you can see the waveform pause for a while, being saved. You can
find the saved waveform data in the USB disk. Here X represents how many
times you press the button. Each press generates a corresponding folder. For
example, press once and a folder 1 is generated; press twice and two folders 1, 2
are generated.
Press this option and the Self Calibration dialog pops up. Press F6 to perform the
self calibration. Press F4 to cancel.
Press this button to see the dialog for buzzer and time setups. Turn the knob V0
to select buzzer or time (with a black frame). Press V0 and the black frame turn to
be red. Turn V0 again to set ON/OFF or time. Press V0 again to exit or save the
setups.
Self Calibration: The self calibration routine can optimize the precision of the oscilloscope to fit
the ambient temperature. To maximize the precision, you should perform the self calibration once
the ambient temperature changes by 5℃ or more. Follow the instructions on the screen.
Tip: Press any menu button on the front panel to remove the status display and enter a
corresponding menu.
5.5.5 CURSOR
Push the CURSOR button to display the Cursor Menu.
Options Settings Comments
Type
Source
Select Cursor
Off
Voltage
Time
CH1
CH2
MATH
REFA
REFB
S
E
Select a measurement cursor and display it.
Voltage measures amplitude while Time measures time and
frequency.
Select a waveform to take the cursor measurement.
Use the readouts to show the measurement.
S indicates Cursor 1. E indicates Cursor 2.
A selected cursor is highlighted, which can be moved freely. Both
cursors can be selected and moved at the same time. The box
MSO-5000B Digital Storage Oscilloscope User Manual 38
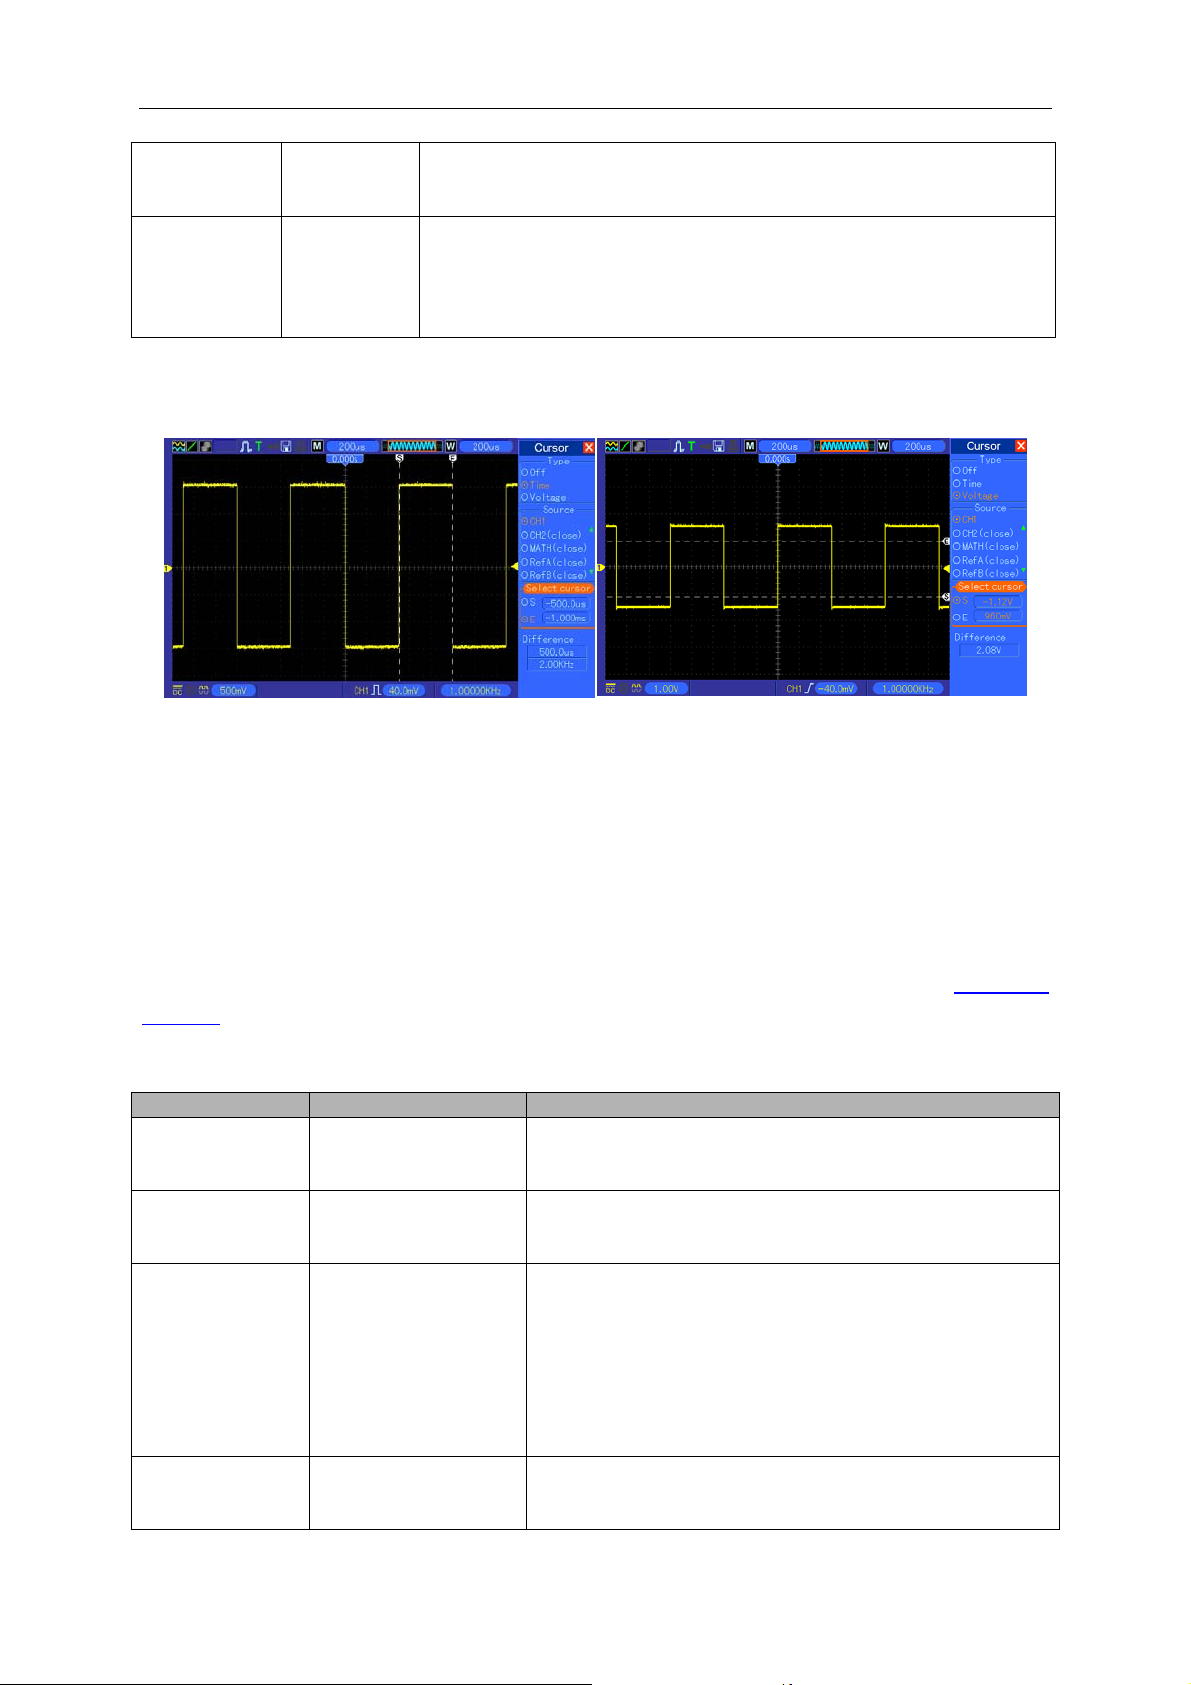
Basic Operation
behind the cursor displays the location of the cursor.
Display the
difference
Delta
Moving Cursors: Press the key near Select Cursor to select a cursor and turn V0 to move it.
Cursors can be moved only when the Cursor Menu is displayed.
(delta)
between the
cursors.
Display the measurement in the box under this option.
Time Cursor
Voltage Cursor
5.5.6 DISPLAY
The waveform display is affected by settings of the oscilloscope. A waveform can be measured
once it is captured. The different styles to display a waveform on the screen give significant
information about it.
There are two modes to display waveforms Single-window and Dual-window. Refer to Horizontal
Controls for more information.
Push the DISPLAY button and the following menu appears.
Options Settings Comments
Vectors fills up the space between adjacent sample
points in the display; Dots only displays the sample
points.
Sets the time length to display each displayed sample
point.
YT format shows the vertical voltage in relation to time
(horizontal scale); XY format displays a dot between
CH1 and CH2 each time when a sample is acquired,
where the voltage or current of CH1 determines the X
coordinate of the dot (horizontal) and the voltage or
current of CH2 determines the Y coordinate (vertical).
For detailed information, refer to descriptions on XY
format in the following text.
0-15 16 ranks adjustable, with a progress bar to
display; Press F5 to select this option. Turn the
multi-functional knob to adjust.
Type
Persist
Format
Contrast
Vectors
Dots
OFF
0.2S-8S selectable
Infinite
YT
XY
MSO-5000B Digital Storage Oscilloscope User Manual 39
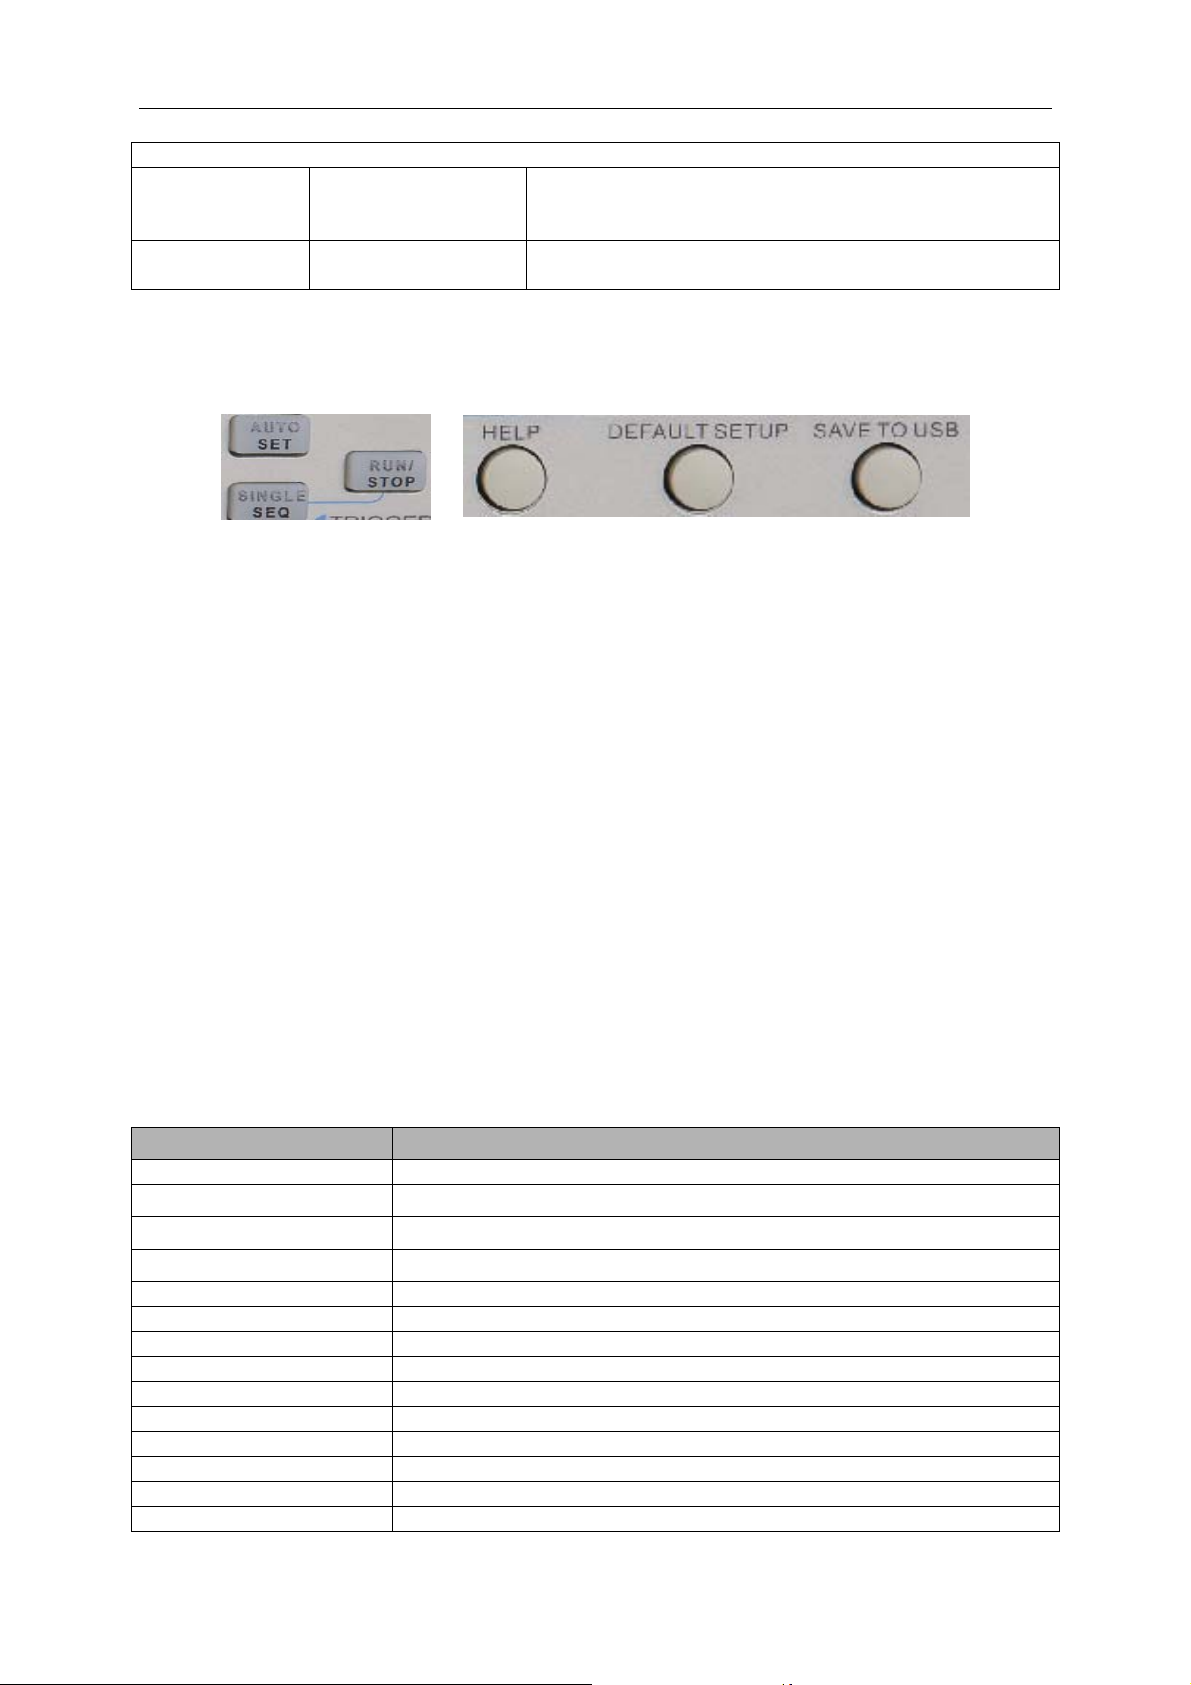
Basic Operation
Next Page
Grid
Grid Intensity
Dotted line
Real line
OFF
Off only displays the horizontal and vertical coordinates
at the center graticule on the screen.
0-15 16 ranks adjustable, with a progress bar to
display.
5.6 Fast Action Buttons
AUTOSET: Automatically set the oscilloscope controls to generate a usable display of the input
signals. Refer to the following table for relative content.
SINGLE SEQ: Acquire a single waveform and then stop the acquisition.
RUN/STOP: Continuously acquire waveforms or stop the acquisition.
HELP: Display the Help menu.
DEFAULT SETUP: Recall the factory setup. Refer to the following table for relative content.
Save to USB Disk: Save all displays on the screen to a USB device, just like the screen capturing
function of a computer.
5.6.1 AUTOSET
Autoset is one of the advantages digital oscilloscopes have. When you push the AUTOSET button,
the oscilloscope will identify the type of waveform (sine or square wave) and adjust controls
according to input signals so that it can accurately display the waveform of the input signal.
Functions Settings
Acquire Mode Adjusted to Normal or Peak Detect
Cursor Off
Display Format Set to YT
Display Type Set to Vectors for an FFT spectrum; otherwise, unchanged
Horizontal Position Adjusted
SEC/DIV Adjusted
Trigger Coupling Adjusted to DC, Noise Reject or HF Reject
Trigger Holdoff Minimum
Trigger Level Set to 50%
Trigger Mode Auto
Trigger Source Adjusted; Autoset can not be used for the EXT TRIG signal
Trigger Slope Adjusted
Trigger Type Edge
Trigger Video Sync Adjusted
MSO-5000B Digital Storage Oscilloscope User Manual 40

Basic Operation
Trigger Video Standard Adjusted
Vertical Bandwidth Full
Vertical Coupling
VOLTS/DIV Adjusted
The Autoset function examines all channels for signals and displays corresponding waveforms.
Autoset determines the trigger source according to the following conditions.
If multiply channels get signals, the oscilloscope will use the channel with the lowest
frequency signal as the trigger source.
If no signals are found, the oscilloscope will use the lowest-numbered channel displayed
in Autoset as the trigger source.
If no signals are found and no channels are displayed, the oscilloscope will display and
use Channel 1 as the trigger source.
Sine Wave:
When you use the Autoset function and the oscilloscope determines that the signal is similar to a
sine wave, the oscilloscope displays the following options.
Sine Wave Options Details
Multi-cycle Sine
Single-cycle Sine Set the horizontal scale to display about one cycle of the waveform.
FFT
Undo Setup Let the oscilloscope recall the previous setup.
DC (if GND was chosen before); AC for the video signal; otherwise,
unchanged
Display multiple cycles that have appropriate vertical and
horizontal scales.
Convert the input time-domain signal to its frequency components
and display the result as a graph of frequency versus amplitude
(spectrum). Since it is a math calculation, see Section 5.3.1 Math
FFT for more information.
Square Wave or Pulse:
When you use the Autoset function and the oscilloscope determines that the signal is similar to a
square wave or pulse, the oscilloscope displays the following options.
Square Wave Options Details
Multi-cycle Square
Single-cycle Square
Rising Edge Display the rising edge.
Falling Edge Display the falling edge.
Undo Setup Let the oscilloscope recall the previous setup.
Display multiple cycles that have appropriate vertical and
horizontal scales.
Set the horizontal scale to display about one cycle of the waveform.
The oscilloscope displays Min, Mean and Positive Width automatic
measurements.
5.6.2 Help
Push the HELP button to display the Help menu which provides topics covering all the menu
options and controls of the oscilloscope. For detailed information about the Help system, refer to
Section 2.2.
MSO-5000B Digital Storage Oscilloscope User Manual 41

Basic Operation
5.6.3 Default Setup
When you push the DEFAULT SETUP button, the oscilloscope will display the CH1 waveform and
remove all the others. When you are at the default setup, press F1 to Undo Preset. Then the
oscilloscope returns to the status before default setup. The table below gives the options, buttons
and controls that change settings at default setup.
Menu or System Option, Button or Knob Default Setting
(Three mode options) Normal
Acquire
Cursor
Display
Horizontal
Math
FFT
Measure
Trigger (Edge)
Trigger (Video)
Trigger (Pulse)
Averages 16
Run/Stop Run
Type Off
Source CH1
Horizontal (amplitude) ±3.2div
Vertical (time) ±4div
Type Vectors
Persist Off
Format YT
Window Mode Single-window
Trigger Knob Level
Position 0.00s
SEC/DIV 200μs
Operation —
Source CH1-CH2
Position 0div
Vertical Scale 20dB
FFT Operation
Source CH1
Window Hanning
FFT Zoom X1
Source CH1
Type None
Type Edge
Source CH1
Slope Rising
Mode Auto
Coupling DC
Level 0.00v
Polarity Normal
Sync All lines
Standard NTSC
When =
Set Pulse Width 1.00ms
Polarity Positive
Mode Auto
MSO-5000B Digital Storage Oscilloscope User Manual 42

Basic Operation
Coupling DC
Slope Rising
Mode Auto
Trigger (Slope)
Coupling DC
When =
CH1
Type Edge
Slope Rising
Mode Auto
Coupling DC
Level 0.00v
Trigger (Swap)
CH2
Type Edge
Slope Rising
Mode Auto
Coupling DC
Level 0.00v
Source CH1
Polarity Positive
Trigger (OT)
Mode Auto
Time 20ns
Coupling DC
Bandwidth Limit Unlimited
VOLTS/DIV Coarse
Vertical System,
All Channels
Probe Voltage
Voltage Probe Attenuation 10X
Invert Off
Position 0.00div (0.00V)
VOLTS/DIV 1.00V
The following settings do not change when you push the DEFAULT SETUP button.
Language Option
Saved Settings
Saved Reference Waveforms
Display Contrast
Calibration Data
MSO-5000B Digital Storage Oscilloscope User Manual 43

5.7 Multi-functional Knobs and Buttons
V0: Multi-functional knob. Under different menu options, it supports selecting menu
options (MEASURE), moving cursors and levels (Slope Trigger).
Press this knob to reset data (trigger holdoff, overtime of the overtime trigger and
slope trigger), select menu options and so on. Easy to operate.
F7: Push this button in single-window mode to switch between dotted line display
and cross display. Push it in dual-window mode to perform autocruise.
F0: Hide/Show button. Push it to hide the menu options on the right side of the
screen and give a full screen display of waveforms. Push it again to show the menu
options.
F1-F5: These five buttons are all multi-functional. They are in charge of selecting
corresponding menu options on the screen in different menu modes. For example, in
the UTILITY menu, F1-F5 respectively correspond to ‘System Info’ – ‘Advance’.
F6: This functional button is mainly used to turn pages and confirm a selection, such
as ‘next page’, ‘previous page’, and ‘press F6 to confirm’ appearing when you push
Self Calibration option.
Basic Operation
5.8 Signal Connectors
See the figure below to find the three signals connectors and a pair of metal electrodes at the
bottom of the oscilloscope panel.
1. CH1, CH2: Input connectors for waveform display, through which to connect and input the
signal to be measured.
2. EXT TRIG: Input connector for an external trigger source, though with to connect and input the
external trigger signal.
3. Probe Compensation: Voltage probe compensation output and ground, used to electrically
match the probe to the oscilloscope input circuit. The probe compensation ground and BNC
MSO-5000B Digital Storage Oscilloscope User Manual 44

Basic Operation
shields connect to earth ground and are considered to be ground terminals. To avoid damages,
do not connect a voltage source to any of these ground terminals.
5.9 Logic Analyzer Channels Setup
MST1000B series- the mixed signal oscilloscope equipped with 16 channels logical analyzer,
which provides 16 logical channels, is able to carry out the measurement on mixed signals with the
other 2 analog oscilloscope channels. You may open (or close) a single channel or a group of
channels (8 channels), set the size of waveforms, change the display position of digital channels
on the screen and select threshold type.
Press F7 button twice, the system will display the menu of logic analyzer channel. Please see the
description in following table.
Logic Analyzer Interface
Menu Operation
Function
Menu
D7-D0 Setup the channel group: D7-D0
D15-D8 Setup the channel group: D15-D8
Current <D15-D0> Select the removable current digital channel
Threshold
User <Threshold Setup the threshold level value in user-defined type.
MSO-5000B Digital Storage Oscilloscope User Manual 45
Settings Description
TTL
CMOS
ECL
User
Select the threshold types for all the digital channels. To setup the
level value of threshold when select the User type.

Basic Operation
Level>
1. Display and Rearrange the Digital Channels
(1) Press F7-> F7->D7-D0 or D15-D8 to enter the channel group setup menu and open or close
the display of the digital channels.
(2) Press F7-> F7->Current to enable the multifunction knob to select digital channels.
Turn the multifuction knob to select the digital channels and the number of the selected channel
will be displayed in red.
(3) Press multifuction knob, and turn it to make the selected channel reposition on the screen.
Menu display as follows.
2. Setup the Threshold Type of the Digital Channels
Press F7-> F7->Threshold Type, select the pre-set threshold type or select the user-defined type
to set your own threshold level.
Menu display as follows.
Threshold Description
Threshold type: TTL CMOS ECL User-defined
Threshold level changes between 2.6V 2.5V -1.3V -8V to +8V.
Setup the Channel Group
MSO-5000B Digital Storage Oscilloscope User Manual 46

Basic Operation
Press F7-> F7->D7-D0 or D15-D8, the system will display D7-D0 or D15-D8 channel group setup
menu, open or close a single channel or a group channel ( with 8 channels for a group) and setup
the size of the waveforms.
Function
Settings
Description
Menu
Channel D7-D0
D7-D0 Turn On
Open or close the single channels within D7-D0
Compulsively open or close the 8 channels of D7-D0
Turn Off
Size
Reset
Full screen to display 8 channels
Full screen to display 16 channels
Reset the waveforms in D7-D0 channel group
1. Open and close single digital channel
Press F7-> F7->D7-D0->channel setup, turn the multifuction knob to select the digital channel you
want to open or close. Press the no. 1 menu operating key of channel setup or the multifuction
knob to open or close the channel. When the channel is open, the box of the operating key of the
channel setup menu is in green; When close, the box is in white.
2. Compulsively open or close all of the digital channels
Press F7-> F7->D7-D0->D7-D0 to open all or close all, or push D15-D8->D15-D8->open all or
close all to Compulsively open or close all the selected digital channels. Open or close a channel,
turn the multifunction knob to select the channel, then press channel setup-F1 button or the
multifuction knob.
3. Setup the size of digital channel waveforms
Press F7-> F7->D7-D0->waveform size, or push D15-D8->waveform size to select the size of the
digital channel waveforms.
4. Reset the display of the digital channel waveforms
Press F7-> F7->D7-D0->reset, or push D15-D8->reset to make the digital channel display reset.
MSO-5000B Digital Storage Oscilloscope User Manual 47

Application Examples
Chapter 6 Application Examples
This chapter unfolds a further description on main features of the oscilloscope by giving eleven
simplified application examples for reference to help solve your own test problems.
1. Taking simple measurements
Using AUTOSET
Using the Measure menu to take auto measurements
2. Taking cursor measurements
Measuring ring frequency and ring amplitude
Measuring pulse width
Measuring rise time
3. Analyzing input signals to eliminate random noise
Observing a noisy signal
Eliminating random noise
4. Capturing a single-shot signal
5. Using X-Y mode
6. Triggering on a pulse width
7. Triggering on a video signal
Observing triggers on video fields and video lines
8. Using Slope Trigger to capture a particular slope signal
9. Using Overtime Trigger to measure a long pulse signal
10. Using math functions to analyze waveforms
11. Measuring data propagation delay
6.1 Example 1: Taking Simple Measurements
When you want to observe an unknown signal in a certain circuit without having its amplitude and
frequency parameters, you may use this function to take a fast measurement on the frequency,
period and peak-to-peak amplitude of the signal.
Follow the steps below.
1. Set the switch on the oscilloscope probe to 10X;
2. Push the CH1 MENU button and set the Probe option attenuation to 10X;
3. Connect the CH1 probe to the test point of the circuit;
4. Press the AUTOSET button.
The oscilloscope will automatically set the waveform to a best display. If you want to further
optimize the waveform display, you may manually adjust the vertical and horizontal controls until
the waveform meets your particular requirement.
MSO-5000B Digital Storage Oscilloscope User Manual 48

Application Examples
Taking Auto Measurements
The oscilloscope can display most signals by automatic measurements. To measure such
parameters as the signal frequency, period, peak-to-peak amplitude, rise time and positive width,
follow the steps below.
1. Push the MEASURE button to see the Measure menu.
2. Turn the knob V0 to select the first ‘unspecified’ option (marked by red arrow), press V0 or F6
to enter the submenu.
3. Select CH1 for the Source option. Then repeatedly push F3 or F4 to select measure items in
the Type menu. Push the back menu to go back to the measure interface. Or turn and push
V0 to select a measure item and go back to the measure interface. The corresponding box
under the measure item shows the measurements.
4. Repeat Step 2 and Step 3. Then select other measure items. Totally 8 measure items can be
displayed.
Note: All readouts change with the measured signals.
The figure below shows three measure items as an example. The boxes under them display the
measurements in large fonts.
MSO-5000B Digital Storage Oscilloscope User Manual 49

Application Examples
6.2 Example 2: Taking Cursor Measurements
You can use the cursor to quickly measure the time and amplitude of a waveform.
Measuring Ring Time (convertible to Frequency) and Amplitude on Rising Edge of Pulse
To measure the ring time on the rising edge of the pulse, follow the steps below.
1. Push the CURSOR button to view the Cursor menu.
2. Push F1 the Type option button and select Time.
3. Push F2 or F3 the Source option button and select CH1.
4. Push F4 to select a cursor. If S is selected, turn V0 to move Cursor S on the screen; if E is
selected, turn V0 to move Cursor E; if both are selected, turn V0 to move them at the same
time.
5. Put Cursor S on the first peak of the ring.
6. Put Cursor E on the second peak of the ring.
7. At Delta displays the measured time and at Cursor S an Cursor E display the positions of
these two cursors.
8. Push the Type option button and select Voltage.
9. Put Cursor S on the highest peak of the ring.
10. Put Cursor E on the lowest point of the ring. The amplitude of the ring will be displayed at
Delta.
See figures below for better understanding.
MSO-5000B Digital Storage Oscilloscope User Manual 50

Application Examples
Measuring Pulse Width
To analyze a pulse signal and to know its width, follow the steps below.
1. Push the CURSOR button to view the Cursor menu.
2. Push F1 the Type option button and select Time.
3. Push F2 or F3 the Source option button and select CH1.
4. Push F4 to select a cursor. If S is selected, turn V0 to move Cursor S on the screen; if E is
selected, turn V0 to move Cursor E; if both are selected, turn V0 to move them at the same
time.
5. Place Cursor S on the rising edge of the pulse and Cursor E on the falling edge.
6. Thus at Delta displays the measured time and at Cursor S and Cursor E displays the time
relative to the trigger.
See the figure below for better understanding.
MSO-5000B Digital Storage Oscilloscope User Manual 51

Application Examples
Measuring Rise Time of Pulse
You may need to measure the rise time of the pulse in many application environments, usually, to
measure the rise time between the 10% and 90% levels of the pulse waveform. To do so, follow
the steps below.
1. Turn the SEC/DIV knob to display the rising edge of the waveform.
2. Turn the VOLTS/DIV and VERTICAL POSITION knobs to adjust the waveform amplitude to
about 5 divisions.
3. Push the CH1 MENU button.
4. Push the VOLTS/DIV option button and select Fine. Turn the VERTICAL POSITION knob to
accurately separate the waveform into 5 divisions.
5. Turn the VERTICAL POSITION knob to center the waveform. Position the waveform baseline
to 2.5 divisions below the center graticule.
6. Press the CURSOR button.
7. Push the Type option button and select Time. Push the Source option button to select CH1.
8. Select Cursor S and turn V0 to place it at the 10% level of the waveform.
9. Select Cursor E and turn V0 to place it at the 90% level of the waveform.
10. The Delta readout in the Cursor Menu is the rise time of the pulse.
See the figure below for better understanding.
MSO-5000B Digital Storage Oscilloscope User Manual 52

Application Examples
5 divisions
6.3 Example 3: Analyzing Input Signals to Eliminate
Random Noise
In certain circumstances, to display a noisy signal on the oscilloscope and to get its details, you
may follow the steps below to analyze this signal.
Observing Noisy Signal
1. Press the ACQUIRE button to see the Acquire menu.
2. Push the Type option button and select Real Time.
3. Push the Peak Detect option button.
4. If necessary, push the DISPLAY button and set the Contrast option to view the noise more
clearly.
See the figure below for better understanding.
MSO-5000B Digital Storage Oscilloscope User Manual 53

Eliminating Random Noise
1. Press the ACQUIRE button to see the Acquire menu.
2. Push the Type option button and select Real Time.
Application Examples
3. Push the Average option button.
4. Push the Averages option button and adjust the number of running averages to watch the
change in the waveform display.
Note: Averaging reduces random noise and let you view the signal details more easily.
See the figure below for better understanding
6.4 Example 4: Capturing Single-shot Signal
You may refer to the following example to easily capture some aperiodic signals like pulses and
glitches.
MSO-5000B Digital Storage Oscilloscope User Manual 54
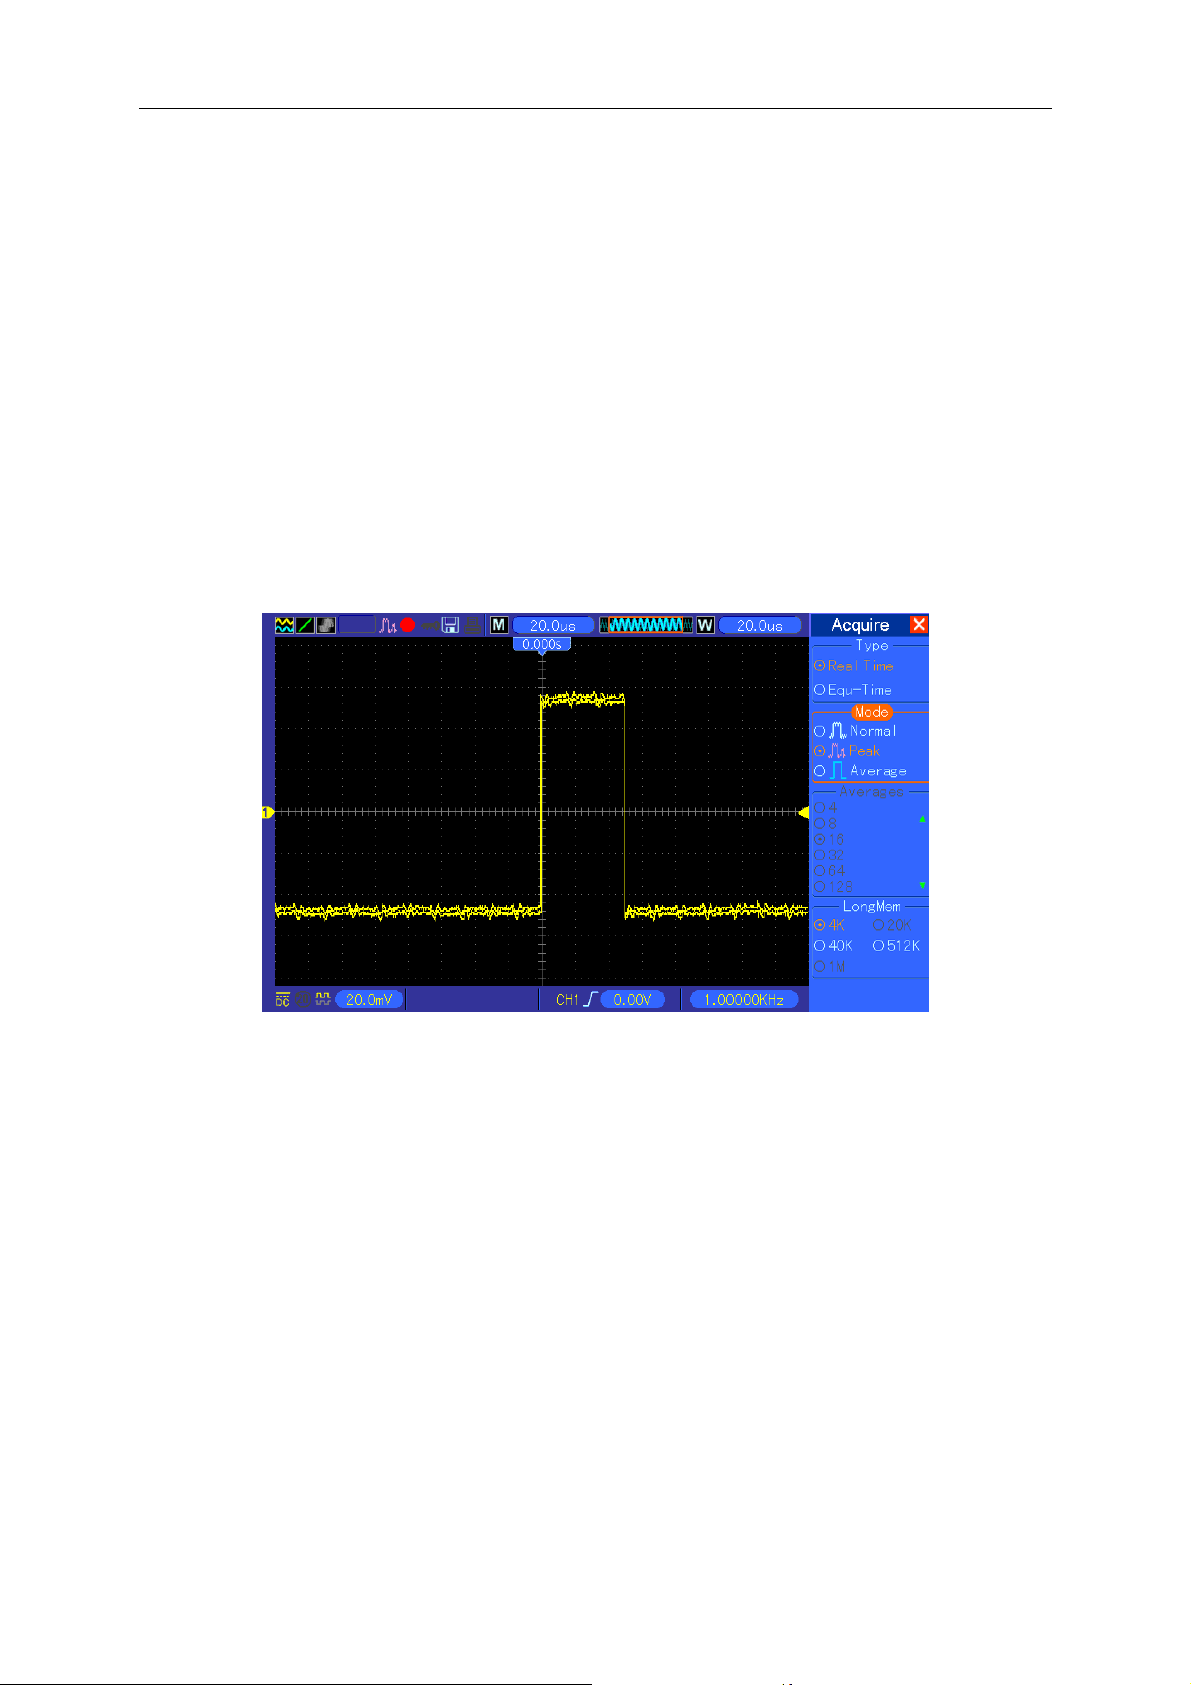
Application Examples
To set for a single-shot acquisition, follow the steps below.
1. First, set up the oscilloscope probe and the attenuation factor of CH1.
2. Turn the vertical VOLTS/DIV and horizontal SEC/DIV knobs to a proper position for a better
examination of the signal.
3. Press the ACQUIRE button to see the Acquire menu.
4. Push the Peak Detect option button.
5. Push the TRIG MENU button and select Rising for the Slope option. Then adjust the trigger
level properly.
6. Push the SINGLE SEQ button to start the acquisition.
Using this feature can help you to capture occasional events more easily. This is an advantage of
the digital storage oscilloscope.
6.5 Example 5: Using X-Y Mode
Viewing Phase Differences between Two Channel Signals
For example, you need to measure the change in a phase across a circuit network.
Connect the oscilloscope with circuitry and view the input and output of the circuit in XY mode.
Follow the steps below.
1. First, prepare two oscilloscope probes and set the switches to 10X on both probes.
2. Push the CH1 MENU button and set the Probe option attenuation to 10X; push the CH2
MENU button and set the Probe option attenuation to 10X.
3. Connect the CH1 probe to the input of the network, and connect the CH2 probe to the output.
4. Push the AUTOSET button.
MSO-5000B Digital Storage Oscilloscope User Manual 55
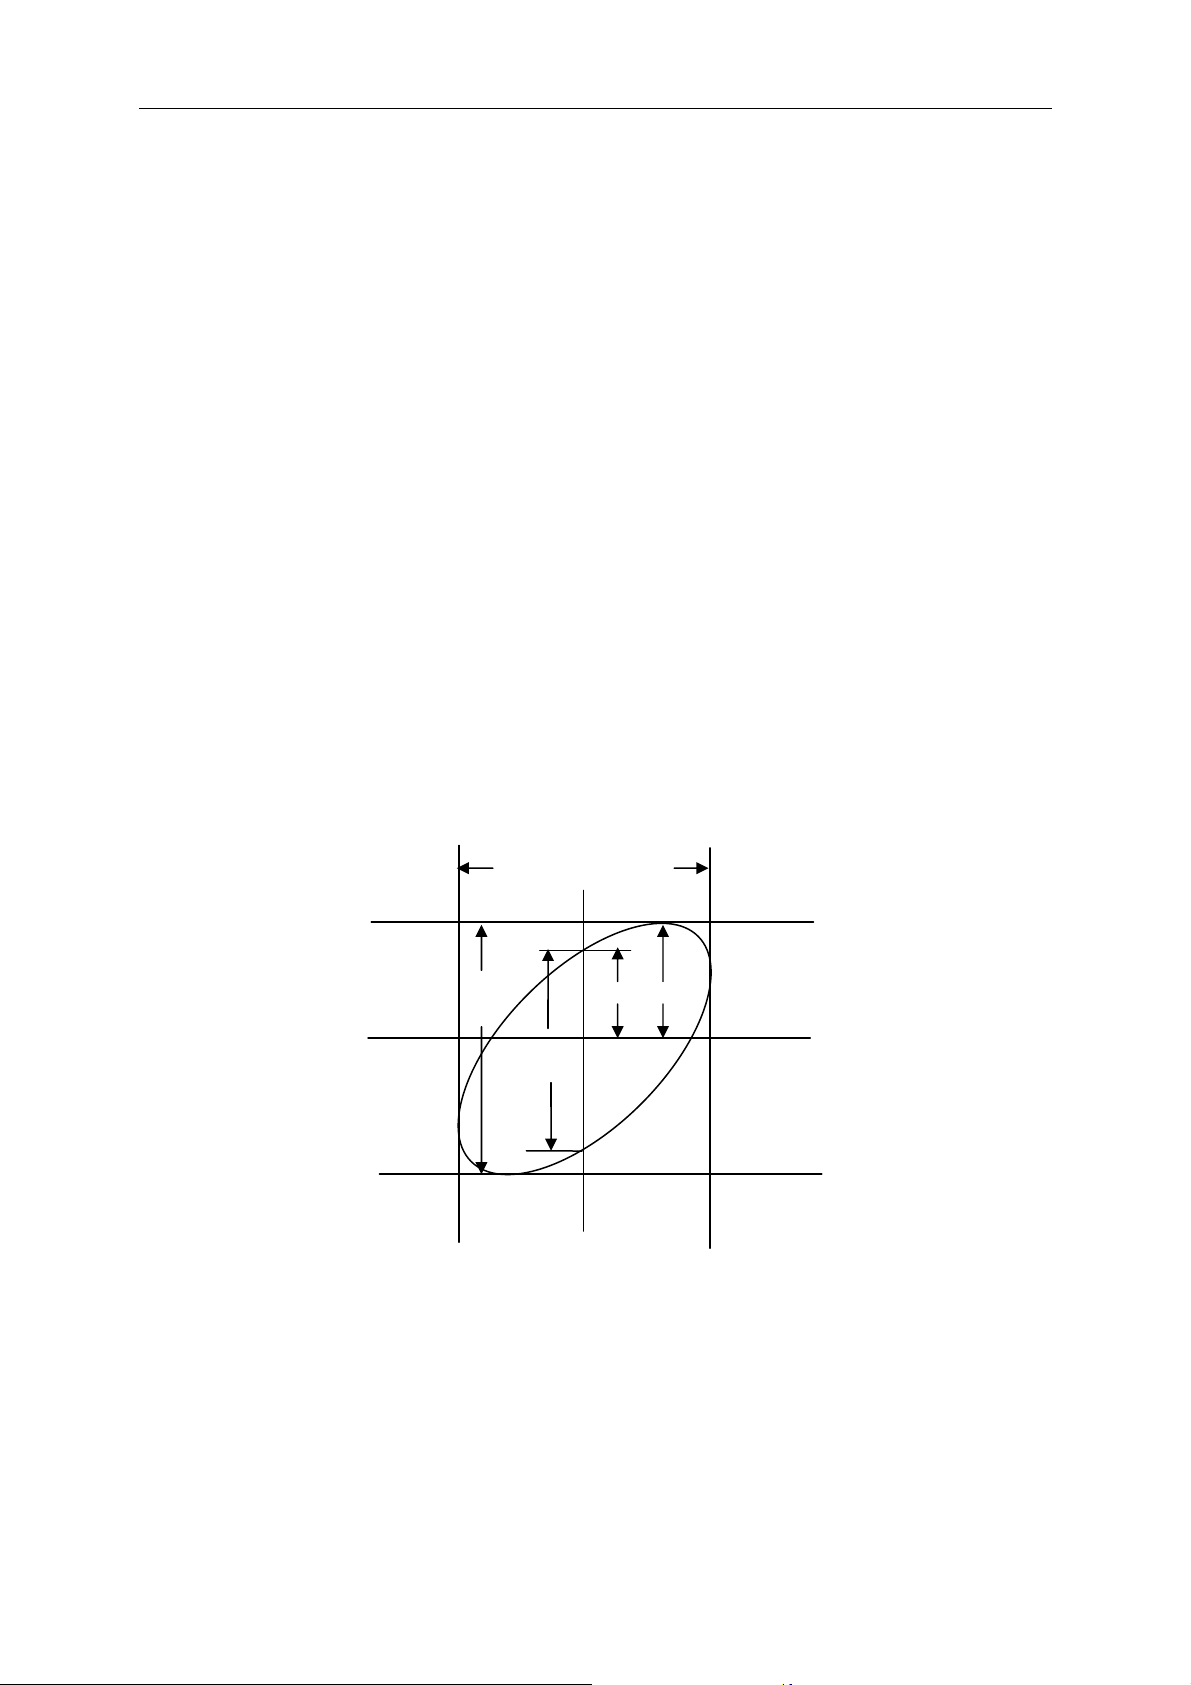
Application Examples
5. Turn the VOLTS/DIV knobs to display approximately the same amplitude signals on each
channel.
6. Push the DISPLAY button to see the Display menu.
7. Push the Format option button and select XY.
8. Now the oscilloscope displays a Lissajous pattern to characterize the input and output of the
circuit.
9. Turn the VOLTS/DIV and VERTICAL POSITION knobs to properly scale the waveform
display.
10. Use the Lissajous's oscillographic method to observe and calculate the phase differences
following the formula below.
As sinθ=A/B or C/D, in which θ is the phase difference angle between channels and A, B, C, D
represent what shown in the figure below, you can get the value of the phase difference angle by
the formula: θ=±arcsin(A/B) or ±arcsin(C/D).
If the principal axes of the ellipse are in the first and third quadrants, the phase difference angle
should be in the first and fourth quadrants, i.e. within (0~π/2) or (3π/2~2π). If the principal axes of
the ellipse are in the second and fourth quadrants, the phase difference angle should be in the
second and third quadrants, i.e. within (π/2~π) or (π-3π/2). See the figure below for better
understanding.
Signal Horizontal
Centering
B
D
A
C
6.6 Example 6: Triggering on Pulse Width
Triggering on a Specific Pulse Width
While testing the pulse width of a signal in a circuit, you may need to verify the pulse width is
consistent with the theoretic value. Or even if the edge triggering shows that your signal has the
same pulse width with the specific signal, you still doubt about the result. Then you can follow the
MSO-5000B Digital Storage Oscilloscope User Manual 56

Application Examples
steps below.
1. Set the Probe option attenuation to 10X.
2. Push the AUTOSET button to trigger a stable waveform display.
3. Push the Single Cycle option button in the Autoset menu and read out the signal pulse width.
4. Push the TRIG MENU button.
5. Push F1 to select Pulse for the Type option; push F2 to select CH1 for the Source option; turn
the TRIGGER LEVEL knob to set the trigger level at the bottom of the signal.
6. Push F6 to enter the next page. Select the When option button and Push F4 to select ‘=’.
7. Push the Set Pulse Width option button. Turn V0 to set the pulse width to the value read out in
Step 3.
8. Turn the TRIGGER LEVEL knob to set the pulse width to the value read out in Step 3.
9. Push the More option button and select Normal for the Mode option. Once triggering on
normal pulses, the oscilloscope can give a stable waveform display.
10. If the When option is set to >, < or ≠ and there appear any aberrant pulses that meet the
specified condition, the oscilloscope will trigger. For example, the signal contains such
aberrant pulses as shown below, you may select ‘≠’ or ‘<’ to trigger on the pulse.
As shown in the above figure, you can get a stable waveform display if inputting a square wave at
the frequency of 1KHz, with pulse width set to 500μs.
6.7 Example 7: Triggering on Video Signal
Assume that you are monitoring the video signals of a television to see if they are input normally,
and the video signal is of an NTSC system. You can get a stable display by using the video trigger.
Triggering on Video Fields
MSO-5000B Digital Storage Oscilloscope User Manual 57

Application Examples
To trigger on the video fields, follow the steps below.
1. Push the TRIG MENU button to see the Trigger menu.
2. Push F1 to select Video for the Type option.
3. Push the Source option button to select CH1; push the Polarity option button to select Normal;
push the Standard option button to select NTSC.
4. Push the Sync option button to select Odd Field, Even Field or All Fields.
5. Turn the Trigger Level knob to adjust the trigger level and stabilize video signals.
6. Turn the horizontal SEC/DIV and the Vertical Position knobs to display on the screen a
complete video signal triggering on a video field.
The figure below shows a stable signal triggering on a video field.
Triggering on Video Lines
To trigger on the video lines, follow the steps below.
1. Push the TRIG MENU button to see the Trigger menu.
2. Push F1 to select Video for the Type option.
3. Push the Source option button to select CH1; push the Polarity option button to select Normal;
push the Standard option button to select NTSC; push the Sync option button to select Line
Number.
4. Turn the Trigger Level knob to adjust the trigger level and stabilize video signals.
5. Turn V0 to adjust the line number (NTSC: 0-525 lines).
6. Turn the horizontal SEC/DIV and the vertical VOLTS/DIV knobs to display on the screen a
complete video signal triggering on a video line. See the figure below.
MSO-5000B Digital Storage Oscilloscope User Manual 58
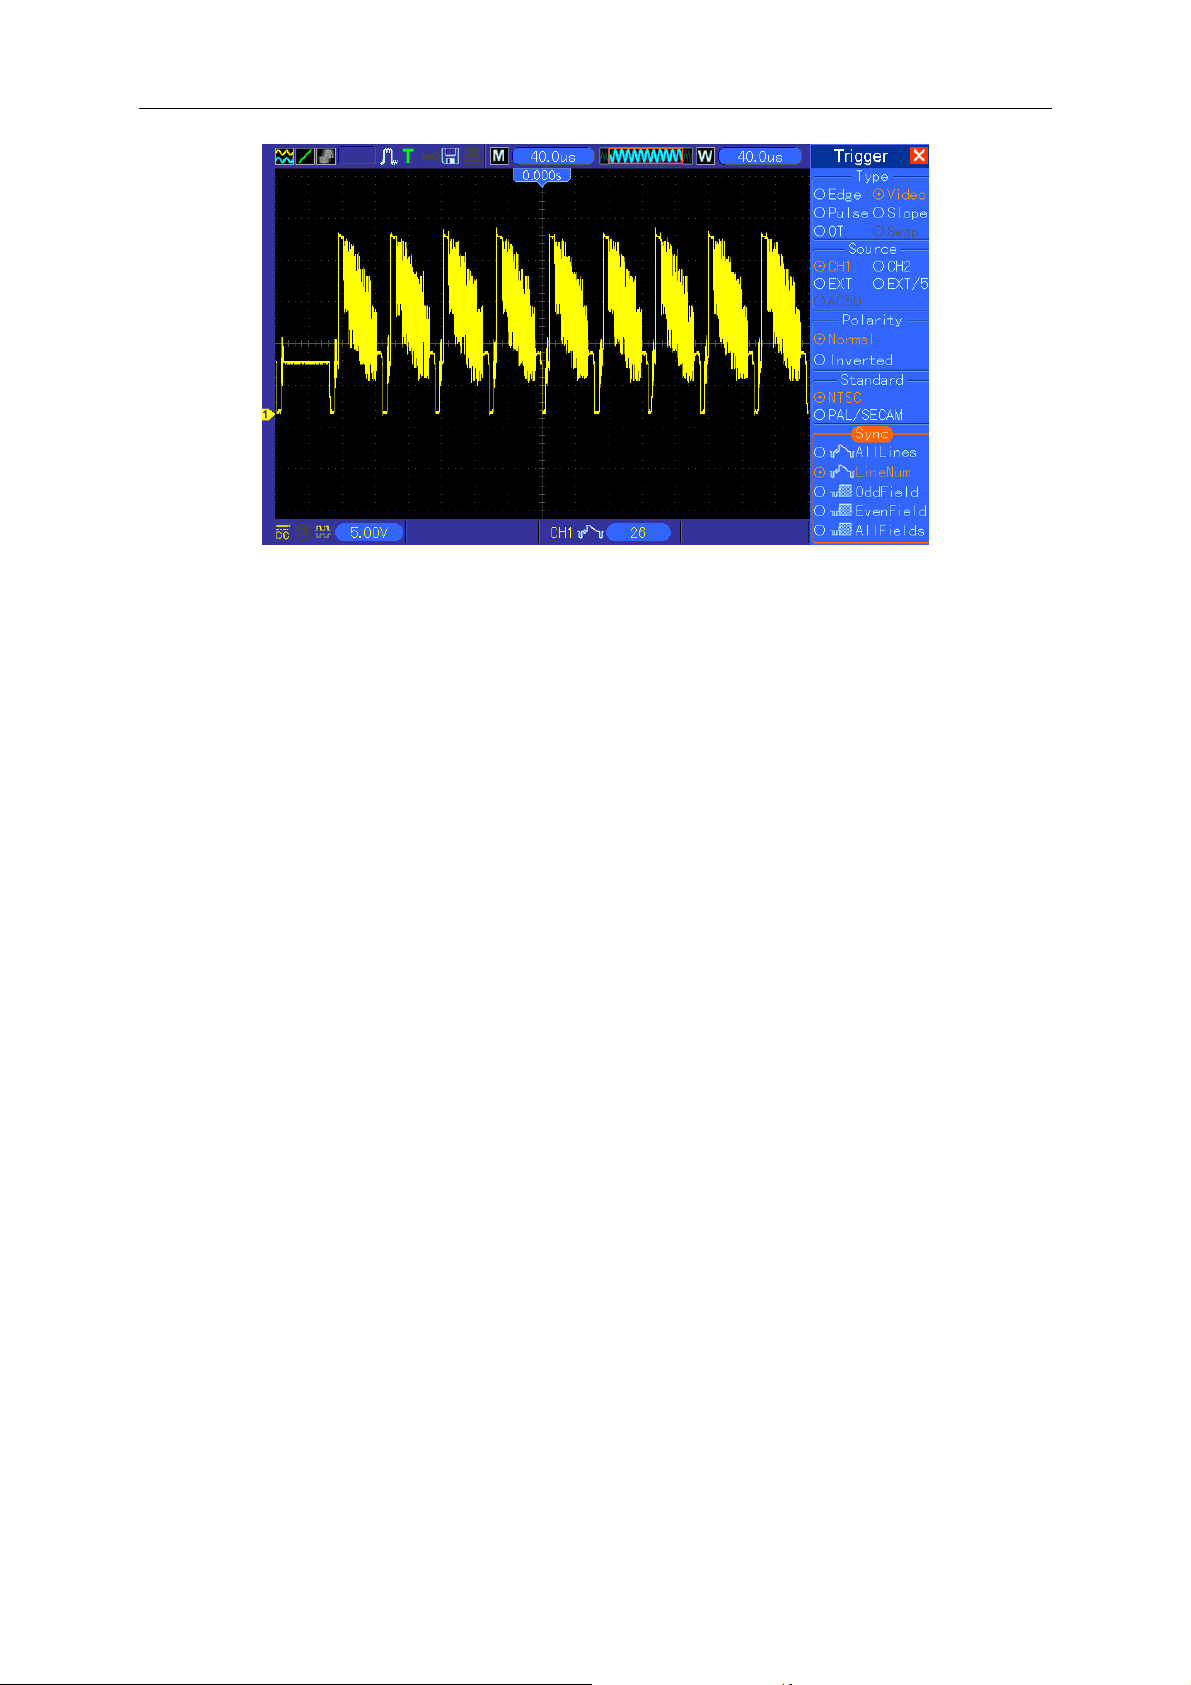
Application Examples
6.8 Example 8: Using Slope Trigger to Capture Particular
Slope Signal
In many occasions, we are not only concerned about the edge of the signal, but also want to know
the rise and fall times of the signal. To better observe this kind of signals, we bring in the slope
trigger. Follow the steps below.
1. Push the TRIG MENU button to see the Trigger menu.
2. Push F1 to select Slope for the Type option.
3. Push the Source option button to select CH1; push the Slope option button to select Rising;
push the Mode option button to select Auto; push the Coupling option button to select DC.
4. Click the ‘Next Page’ button and select Vertical. Turn the V0 knob to adjust V1 and V2 to
proper locations. Select the When option button and set it to ‘=’.
5. Select ‘Time’ and turn V0 to adjust the time until you get a stable display of waveforms. See
the figure below.
MSO-5000B Digital Storage Oscilloscope User Manual 59

Application Examples
6.9 Example 9: Using Overtime Trigger to Measure Long
Pulse Signal
It is not easy to observe some part of a long pulse signal by using the edge or pulse width trigger.
In such case, you can use the overtime trigger by following steps.
1. Push the TRIG MENU button to see the Trigger menu.
2. Push F1 to select OT for the Type option; push the Polarity option button to select Normal;
push the Mode option button to select Auto; push the Coupling option button to select DC.
3. Turn the Trigger Level knob to adjust the trigger level and stabilize video signals.
4. Turn V0 to adjust the line number (NTSC: 0-525 lines).
5. Turn the horizontal SEC/DIV and the vertical VOLTS/DIV knobs to display on the screen a
complete video signal triggering on a video line. See the figure below.
MSO-5000B Digital Storage Oscilloscope User Manual 60

Application Examples
Note: The difference between the overtime and the delay triggers is that the overtime
trigger can identify the pulse you need according to your set time and trigger on any point
of the pulse. In the other word, the overtime trigger occurs based on pulse identification. It
is similar to the > mode of the pulse width trigger, but not the same.
6.10 Example 10: Using Math Functions to Analyze
Waveforms
Using math functions to analyze input waveforms is another advantage of the digital oscilloscope.
For example, you want to get the instantaneous difference between two channel waveforms. By
using the math function of the oscilloscope, you can get a better representation of the waveform
on the screen. To observe this signal, follow the steps below.
1. Set the Probe option attenuation to 10X.
2. Open CH1 and CH2 at the same time, both with the attenuation of 10X.
3. Push the AUTOSET button to trigger a stable waveform.
4. Push the MATH MENU button to see the Math menu.
5. Push the Operation option button and select ‘CH1+CH2’.
6. Turn the horizontal SEC/DIV and the vertical VOLTS/DIV knobs to properly scale the
waveform for easy check.
In addition, the oscilloscope also supports the - and FFT functions. For a detailed analysis on FFT,
refer to Chapter 5.3.1 Math FFT.
Note: You should compensate both probes before performing the math operation;
otherwise, differences in probe compensation will appear as errors in the differential
signal.
As illustrated in the above figure, input a 1KHz sine wave from CH1 and a 1KHz square wave from
MSO-5000B Digital Storage Oscilloscope User Manual 61

Application Examples
CH2.
Follow the above steps to set up the Math menu, and observe the subtracted waveform as shown
in the figure below.
Those in pink are added waveforms.
6.11 Example 11: Measuring Data Propagation Delay
When you doubt that there appear instabilities in a serial data propagation control circuit, you can
set the oscilloscope to measure the propagation delay between the enable signal and the transfer
data.
To set the propagation delay measurement, follow the steps below.
1. Connect two oscilloscope probes respectively to the CS (chip-select) pin and the DATA pin on
the chip.
2. Set the Probe option attenuation to 10X for both probes.
3. Open CH1 and CH2 at the same time, both with the attenuation of 10X.
4. Push the AUTOSET button to trigger a stable waveform display.
5. Adjust the horizontal and vertical controls to optimize the waveform display.
6. Push the CURSOR button to view the Cursor menu.
7. Push the Type option button and select Time.
8. Select Cursor S and turn V0 to place it on the active edge of the enable signal.
9. Select Cursor E and turn V0 to place it on the data output transition (See the figure below).
10. Read the data propagation delay in the Delta readout.
MSO-5000B Digital Storage Oscilloscope User Manual 62

Application Examples
CS
DATA
DATA
CH1
CH2
CS
6.12 Example 12: Using Trigger to Measure Digital Signal
Edge Trigger
To observe digital signal by using the edge trigger, please use following steps.
1.Push the TRIG MENU button to see the trigger menu.
2.Push F1 button to select “Edge” as the trigger type.
3.Push F2 button to select the trigger source (D0~D15).
4.Push F3 button to select the trigger slope ( on rising edge or falling edge).
5.Push F4 button to select the trigger mode : Auto or Normal
6.The coupling method is only applicable to the analog signal.
7.Turn the timebase knob “SEC/DIV” and adjust the time until you get a stable display of
MSO-5000B Digital Storage Oscilloscope User Manual 63

waveforms. See the picture below.
Application Examples
Pulse Width Trigger
To observe digital signal by using the pulse width trigger, please follow the steps as below:
1. Push the TRIG MENU button to see the trigger menu.
2. Push F1 button to select “Pulse” as the trigger type.
3. Push F2 button to select trigger source (D0~D15).
4. Push F3 button to select the pulse polarity ( positive or negative).
5. Push F4 button to select the trigger mode as Auto or Normal.
6. The Coupling method is only applicable to the analog signal.
7. Push the ‘Next Page’ button and push F4 button to select the trigger event (=,≠,>,<).
8. Push F5 button to select the the pulse width of the trigger, and turn VO knob to adjust the trigger
pulse width.
9. Turn the timebase knob “SEC/DIV“ and adjust the time until you get a stable display of
waveforms. See the picture below.
MSO-5000B Digital Storage Oscilloscope User Manual 64

Application Examples
Code-Pattern Trigger
To observe digital signal by using the code-pattern trigger, please follow below steps:
1. Push the TRIG MENU button to see the trigger menu.
2. Push F1 button to select “Pattern” as the trigger type
3. Push F2 button to select the trigger source channel (D0~D15).
4. Push F3 button to select the code-pattern ( H, L or X).
5. Push F4 button to select the trigger mode as Auto or Normal.
6. Turn the timebase knob “SEC/DIV“ and adjust the time until you get a stable display of
waveforms. See the picture below.
Duration Trigger.
To observe digital signal by using the duration trigger, please follow the steps as below:
1.Push the TRIG MENU button to see the trigger menu.
MSO-5000B Digital Storage Oscilloscope User Manual 65

Application Examples
2. Push F1 button to select “Duration” for the trigger type.
3. Push F2 button to select the trigger source channel(D0~D15).
4. Push F3 button to select the “Pattern” option ( H, L or X).
5. Push F4 button to select the trigger mode as Auto or Normal.
6. Push F5 button to select the duration time, and turn VO knob to adjust the time of duration.
7. Turn the timebase knob “SEC/DIV“ and adjust the time until you get a stable display of
waveforms. See the picture below.
Queue Trigger
To observe digital signal by using the queue trigger, please follow the step as below:
1.Push the TRIG MENU button to see the trigger menu.
2. Push F1 button to select “Queue” for the trigger type.
3. Push F2 button to select the specific queue index (0-3).
4. Push F3 button to select the trigger source channel (D0~D15).
5. 5.Push F4 button to select the pattern ( H, L or X).
6. Turn the timebase knob “SEC/DIV“ and adjust the time until you get a stable display of
waveforms. See the picture below.
MSO-5000B Digital Storage Oscilloscope User Manual 66

Application Examples
Iteration Trigger
To observe digital signal by using the iteration trigger, please follow the steps as below.
1. Push the TRIG MENU button to see the trigger menu.
2. Push F1 button to select “Iteration” as the trigger type.
3. Push F2 button to select the trigger source channel (D0~D15).
4. Push F3 button to select the pattern ( H, L or X).
5. Push F4 button to select the “Times” of Iteration, and turn VO knob to set the times.
6. Turn the timebase knob “SEC/DIV“ and adjust the time until you get a stable display of
waveforms. See the picture below.
MSO-5000B Digital Storage Oscilloscope User Manual 67

Troubleshooting
Chapter 7 Troubleshooting
7.1 Problem Settlement
1. If the oscilloscope does not start up at power on, follow these steps:
1) Check the power cord to verify it has been connected properly;
2) Check the power on/off button to ensure it has been pushed;
3) Then restart the oscilloscope.
Contact your local distributor or directly keep touch with our Technical Support department if the
oscilloscope still can not be turned on normally.
2. If there is no display of waveforms on the screen when the oscilloscope is turned on,
follow these steps:
1) Check the probe to assure its proper connection to the input BNC;
2) Check the channel switch (such as CH1, CH2 menu buttons) to make sure it has been turned
on;
3) Check the input signal to verify it has been connected to the probe correctly;
4) Affirm that all measured circuits have signals to output;
5) Turn up the magnitude for DC signals with large magnitude;
6) In addition, you may press the Auto Measure button to perform an automatic detection of
signals at first.
Contact our Technical Support department in time if there is still no display of waveforms.
3. If the waveform of the input signal is distorted seriously, follow these steps:
1) Check the probe to assure its proper connection to the channel BNC;
2) Check the probe to assure its good connection to the measured object;
3) Check the probe to verify it has been well calibrated. Otherwise, refer to the content about
calibration described in this manual.
4. If the waveform is rolling continuously on the screen but can not be triggered, follow
these steps:
1) Check the trigger source to make sure it consistent with the input channel;
2) Check the trigger level to assure its correct adjustment. You may push the TRIGGER LEVEL
knob or press the SET TO 50% button to reset the trigger level back to the center of the signal;
3) Check the trigger mode to confirm it is a right choice for the input signal. The default trigger
mode is edge trigger. However, it is not suitable for all kinds of input signals.
MSO-5000B Digital Storage Oscilloscope User Manual 68

Specifications
Chapter 8 Specifications
8.1 Technical Specifications
All specifications herein mentioned apply to the MSO-5000B oscilloscopes. Before checking an
oscilloscope from our company to see if it complies with these specifications, make sure it meets
the following conditions:
The oscilloscope must have been operating continuously for twenty minutes under the
specified operating temperature.
The Do Self Cal operation must be performed through the Utility menu if the operating
temperature changes by more than 5℃.
The oscilloscope must be within the factory calibration interval.
All specifications are guaranteed unless noted ‘typical’.
Oscilloscope Specifications
Horizontal
Sample Rate Range 500MS/s dual channel
Waveform Interpolation (sin x)/x
Record Length
SEC/DIV Range 8ns/div to 40s/div, in a 2, 4, 8 sequence
Sample Rate and
Delay Time Accuracy
Delta Time Measurement
Accuracy
(Full Bandwidth)
Position Range
Vertical
Maximum 1M samples per single-channel; maximum 512K
samples per dual-channel (4K, 40K optional)
±50ppm over any ≥1ms time interval
Single-shot, Normal mode
± (1 sample interval +100ppm × reading + 0.6ns)
>16 averages
± (1 sample interval + 100ppm × reading + 0.4ns)
Sample interval = s/div ÷ 200
20ns/div to 80μs/div (-8div × s/div) to 40ms
200μs/div to 40s/div (-8div × s/div) to 400s
A/D Converter
VOLTS/DIV Range 2mV/div to 5V/div at input BNC
Position Range
MSO-5000B Digital Storage Oscilloscope User Manual 69
8-bit resolution,
each channel sampled simultaneously
2mV/div to 200mV/div, ±2V
>200mV/div to 5V/div, ±50V

Specifications
Analog Bandwidth in
Normal and Average
modes at BNC or with probe, DC
Coupled
Selectable Analog Bandwidth Limit,
typical
2mV/div to 20mV/div, ±400mV
50mV/div to 200mV/div, ±2V
500mV/div to 2V/div, ±40V
5V/div, ±50V
20MHz
Low Frequency Response (-3db) ≤10Hz at BNC
Rise Time at BNC, typical <3.5ns(MSO-5102B) , <5.8ns(MSO-5062B)
±3% for Normal or Average acquisition mode, 5V/div to
DC Gain Accuracy
10mV/div
±4% for Normal or Average acquisition mode, 5mV/div
to 2mV/div
Measurement Type: Average of ≥16 waveforms with
vertical position at zero
Accuracy: ± (3% × reading + 0.1div + 1mV) when
10mV/div or greater is selected
DC Measurement Accuracy,
Average Acquisition Mode
Measurement Type: Average of ≥16 waveforms with
vertical position not at zero
Accuracy: ± [3% × (reading + vertical position) + 1% of
vertical position + 0.2div]
Add 2mV for settings from 2mV/div to 200mV/div; add
50mV for settings from 200mV/div to 5V/div
Volts Measurement Repeatability,
Average Acquisition Mode
Delta volts between any two averages of ≥16 waveforms
acquired under same setup and ambient conditions
Note: Bandwidth reduced to 6MHz when using a 1X probe.
Trigger
Coupling Sensitivity
CH1
CH2
1div from DC to 10MHz;
1.5div from 10MHz to Full
DC
Trigger Sensitivity
(Edge Trigger Type)
EXT
EXT/5
200mV from DC to 100MHz
1V from DC to 100MHz
AC Attenuates signals below 10Hz
HF Reject Attenuates signals above 80kHz
LF Reject
Same as the DC-coupled limits for frequencies above
150kHz; attenuates signals below 150kHz
Source Range
Trigger Level Range
CH1, CH2 ±8 divisions from center of screen
EXT ±1.2V
MSO-5000B Digital Storage Oscilloscope User Manual 70

EXT/5 ±6V
Trigger Level
Accuracy, typical
(Accuracy is for
signals having rise
and fall times ≥20ns)
Set Level to 50%,
typical
Source Accuracy
CH1, CH2
0.2div × volts/div within ±4 divisions from center of
screen
EXT ± (6% of setting + 40mV)
EXT/5 ± (6% of setting + 200mV)
Operates with input signals ≥50Hz
Note: Bandwidth reduced to 6MHz when using a 1X probe.
Video Trigger Type Source Range
CH1, CH2
EXT 400mV
Peak-to-peak amplitude of 2
divisions
EXT/5 2V
Signal Formats and
Field Rates, Video
Trigger Type
Supports NTSC, PAL and SECAM
broadcast systems for any field or
any line
Holdoff Range 100ns to 10s
Pulse Width Trigger
Pulse Width Trigger
Mode
Trigger when < (Less than), > (Greater than), = (Equal), or ≠ (Not Equal);
Positive pulse or Negative pulse
Equal: The oscilloscope triggers when the trailing edge of the pulse
crosses the trigger level.
Not Equal: If the pulse is narrower than the specified width, the trigger
Pulse Width Trigger
Point
point is the trailing edge. Otherwise, the oscilloscope triggers when a
pulse continues longer than the time specified as the Pulse Width.
Less than: The trigger point is the trailing edge.
Greater than (also called overtime trigger): The oscilloscope triggers
when a pulse continues longer than the time specified as the Pulse Width.
Pulse Width Range Selectable from 20ns to 10s
Slope Trigger
Slope Trigger Mode
Trigger when < (Less than), > (Greater than), = (Equal), or ≠ (Not Equal);
Positive slope or Negative slope
Equal: The oscilloscope triggers when the waveform slope is equal to the
set slope.
Not Equal: The oscilloscope triggers when the waveform slope is not
Slope Trigger Point
equal to the set slope.
Less than: The oscilloscope triggers when the waveform slope is less
than the set slope.
Greater than: The oscilloscope triggers when the waveform slope is
greater than the set slope.
Specifications
MSO-5000B Digital Storage Oscilloscope User Manual 71

Specifications
Time Range Selectable from 20ns to 10s
Overtime Trigger The leading edge: Rising edge or Falling edge; Time Setting: 20-10s
Swap Trigger
CH1 Internal Trigger: Edge, Pulse Width, Video, Slope
CH2 Internal Trigger: Edge, Pulse Width, Video, Slope
Trigger Frequency
Counter
Readout Resolution 6 digits
Accuracy (typical) ±30ppm (including all frequency reference errors and ±1 count errors)
Frequency Range AC coupled, from 4Hz minimum to rated bandwidth
Pulse Width or Edge Trigger modes: all available trigger sources
The Frequency Counter measures trigger source at all times, including
when the oscilloscope acquisition pauses due to changes in the run
status, or acquisition of a single shot event has completed.
Pulse Width Trigger mode: The oscilloscope counts pulses of significant
Signal Source
magnitude inside the 1s measurement window that qualify as triggerable
events, such as narrow pulses in a PWM pulse train if set to < mode and
the width is set to a relatively small time.
Edge Trigger mode: The oscilloscope counts all edges of sufficient
magnitude and correct polarity.
Video Trigger mode: The Frequency Counter does not work.
Acquisition
Acquisition Modes Normal, Peak Detect, and Average
Acquisition Rate,
typical
Up to 2000 waveforms per second per channel (Normal acquisition mode,
no measurement)
Single Sequence Acquisition Mode Acquisition Stop Time
Upon single acquisition on all
Normal, Peak Detect
channels
simultaneously
After N acquisitions on all channels
Average
simultaneously, N can be set to 4, 8,
16, 32, 64 or 128
Inputs
Inputs
Input Coupling DC, AC or GND
Input Impedance,
DC coupled
1MΩ±2% in parallel with 20pF±3pF
Probe Attenuation 1X, 10X
Supported Probe
Attenuation Factors
1X, 10X, 100X, 1000X
MSO-5000B Digital Storage Oscilloscope User Manual 72

Maximum Input
Voltage
Measurements
Cursors
Automatic
Measurements
Specifications
Overvoltage Category Maximum Voltage
CAT I and CAT II 300V
CAT III 150V
(10×), Installation Category
RMS
(1×)
RMS
Installation Category II: derate at 20dB/decade above 100kHz to 13V peak
AC at 3MHz* and above. For non-sinusoidal waveforms, peak value must
be less than 450V. Excursion above 300V should be of less than 100ms
duration. RMS signal level including all DC components removed through
AC coupling must be limited to 300V. If these values are exceeded, damage
to the oscilloscope may occur.
Voltage difference between cursors: △V
Time difference between cursors: △T
Reciprocal of △T in Hertz (1/∆T)
Frequency, Period, Mean, Peak-to-peak, Cycle RMS, Minimum, Maximum,
Rise Time, Fall Time, Positive Width, Negative Width
General Specifications
Display
Display Type 7 inch 64K color TFT (diagonal liquid crystal)
Display Resolution 800 horizontal by 480 vertical pixels
Display Contrast Adjustable (16 gears) with the progress bar
Probe Compensator Output
Output Voltage,
typical
About 5Vpp into ≥1MΩ load
Frequency, typical 1kHz
Power Supply
Supply Voltage
100-120VAC
120-240VAC
(±10%), 45Hz to 440Hz, CAT
RMS
(±10%), 45Hz to 66Hz, CAT
RMS
Power Consumption <30W
Fuse 2A, T rating, 250V
Environmental
Operating: 32 to 122 (0 to 50)
Temperature
Nonoperating: -40 to 159.8 (-40 to +71)
Cooling Method Convection
+104℉ or below (+40℃ or below): ≤90% relative humidity
Humidity
106 to 122 (+41 to 50): ≤60% relative humidity
Altitude Operating and Nonoperating 3,000m (10,000 feet)
Random Vibration
Nonoperating
0.31g
minutes on each axis
2.46g
minutes on each axis
from 50Hz to 500Hz, 10
RMS
from 5Hz to 500Hz, 10
RMS
Mechanical Shock Operating 50g, 11ms, half sine
MSO-5000B Digital Storage Oscilloscope User Manual 73

Mechanical
Length 313mm
Size
Weight
Packing
Gross Weight inclusive of all accessories About 3.2Kg
Logic Analyzer
Sampling Channels 16
Max Input 200K (C=10p)
Input Level Range -60V~60V
Logic Gate Range -8V~8V
Max Sampling Rate 500 MHz
Bandwidth 100MHz
Compatible Input TTL,LVTTL,CMOS,LVCOMS,ECL,PECL,EIA
Sampling Rate 512KSample
Cursor
Measurement Period and Frequency
Memory Position
Trigger
Height 142mm
Depth 108mm
exclusive of packing and
accessories
Length 385mm
Width 200mm
Height 245mm
Voltage Difference
Time Difference
1/
△T(Hz)
RefA
RefB
Edge D0-D15 rising or falling edge
Pulse
Code Type D0-D15 Code Type (H,L,X)
Continuous
Array D0-D15 Data Index (0-3) and Code Type (H,L,X)
Repeat D0-D1 Code Type (H,L,X), Repeat Times
△V
△T
D0-D15 Polarity (positive or negative), Pulse
Event (=,≠,>,<), Pulse Width
D0-D15 Continuous Time and Trigger Event (Data
Finish, Data Begin, Data Delay)
2.08Kg
Specifications
8.2 Accessories
All the following accessories are available by contacting your local distributor.
Standard Accessories
MSO-5000B Digital Storage Oscilloscope User Manual 74

Sketch Description
X1, X10 two passive probes. The passive probes have a 6MHz
bandwidth (rated 100Vrms CAT III) when the switch is in the X1
position, and a maximum bandwidth (rated 300Vrms CAT II) when
the switch is in the X10 position. Each probe consists of all
necessary fittings.
A power cord special for this product. In addition to the power cord
shipped with your instrument, you may purchase another one
certified for the country of use.
A USB A-B line, used to connect external devices with USB-B
interface like a printer or to establish communications between PC
and the oscilloscope.
16 channel cable for logic analyzer
Specifications
Eighteen little test hook
Logic analyzer with high-quality test hook.
A software installation CD. It contains the user manual of
MSO-5000B, giving particular descriptions on the MSO-5000B
series oscilloscopes.
8.3 Open Source Information
General Information:
Kernel Version Linux2.6.30
Supported File system Yaffs, Fat32
Buzzer Driver, DMA Driver, FPGA Driver, I2C Driver,SPI Driver,
Drivers
Linux Applications busybox1.18.4, gnupg1.4.11
U_boot Version U_boot 1.1.6
Sourcecode download website
License: GPLV2 See Appendix C
IO-bank Driver, USB Host Driver, LCD Driver, USB
massstorage、gadget Driver
http://www.produktinfo.conrad.com
(Please enter the product code "122481” or “122482" to search)
MSO-5000B Digital Storage Oscilloscope User Manual 75

General Care and Cleaning
Chapter 9 General Care and Cleaning
9.1 General Care
Do not put or leave the device in a place where the LCD display will be exposed to direct sunlight
for long periods of time.
Note: To avoid damage to the oscilloscope or probes, do not expose them to sprays, liquids, or
solvents.
9.2 Cleaning
Examine the oscilloscope and probes as often as operating conditions require. To clean the
exterior surface, perform the following steps:
1) Use a lint-free cloth to remove floating dust on the outside of the oscilloscope and probes.
Take care to avoid scratching the glabrous display filter.
2) Use a soft cloth dampened with water to clean the oscilloscope. For more efficient cleaning,
you may use an aqueous solution of 75% isopropyl alcohol.
Note: To avoid damage to the surface of the oscilloscope or probes, do not use any
corrosive or chemical cleaning agents.
MSO-5000B Digital Storage Oscilloscope User Manual 76

Harmful and Poisonous Substances or Elements
Appendix A Harmful and Poisonous
Substances or Elements
Harmful and poisonous substances or elements 1
Component2 Pb Hg Cd Cr(Vi) PBB PBDE
Shell and Chassis X 0 0 X 0 0
Display Module X X 0 0 0 0
Circuit Board X 0 0 X 0 0
Power Supply X 0 0 X 0 0
Electric Wire and Cable Assembly X 0 0 0 0 0
Connector X 0 0 X 0 0
Fastener and Installed Hardware X 0 X X 0 0
Other Accessories (including probes) X 0 0 X 0 0
Others 0 0 0 0 0 0
‘X’ means that at least the content of this poisonous and harmful substance in a homogeneous
material of this component exceeds the limit specified in the SJ/T 11363-2006 standard.
‘0’ indicates that the content of this poisonous and harmful substance in all homogeneous
materials of this component is refrained under the limit stated in the SJ/T 11363-2006 standard.
This component list contains components approved in the file ‘Management Measures’.
MSO-5000B Digital Storage Oscilloscope User Manual 77

Appendix B Index
Search by alphabetical order
A
AC coupling 66
ACQUIRE button 35
Acquisition mode 11
Amplitude cursor 12
Application examples 45
Automatic measurement 12
AUTOSET 3
AUTOSET button 6
Autoset function 3
Average 11
B
Bandwidth limit 16
C
Capturing single-shot signal 51
CH1 MENU button 6
CH2 MENU button 6
Cleaning 70
Coarse, Fine 20
Connector 5
Contrast 39
Coupling 9
CURSOR 12
CURSOR button 12
Cyc RMS 34
D
DISPLAY button 38
Dual-window 17
E
Edge trigger 10
EXT TRIG 28
F
Factory setup 9
FFT aliasing 22
FFT Window 21
Harmful and Poisonous Substances or Elements
FFT Zoom 21
Field synchronization 16
Fine resolution 20
Force trigger 27
Frequency counter 65
Functional check 5
Fundamental frequency 21
G
Ground coupling 20
H
Hanning 21
HELP button 4
HELP SCROLL LED 4
Help system 3
Holdoff 18
Horizontal controls 17
HORIZONTAL POSITION knob 4
Hyperlinks 3
I
Intensity 39
L
Language 43
Level 9
Lissajous pattern 16
M
Main time base 16
Math FFT 21
MATH MENU button 22
MEASURE button 34
Measure FFT spectrum 26
Measurement cursor 38
Mechanical 67
Mechanical shock 67
Menu hiding 19
Multi-functional knob 43
MSO-5000B Digital Storage Oscilloscope User Manual 78

Harmful and Poisonous Substances or Elements
N
Negative pulse 29
NTSC 28
Nyquist frequency 22
O
Option button 4
Overtime Trigger 10
Overview 3
P
PAL 28
Peak Detect 11
Pk-Pk 34
Power cord 5
Power supply 5
Probe 1
Probe attenuation 8
PROBE CHECK button 7
PROBE COMP connector 5
Probe compensation 3
Probe ground lead 1
Pulse width trigger 10
R
Recall 9
Rectangular 21
RUN/STOP button 36
S
Sample rate 3
SAVE/RECALL 33
Scale 11
Scan mode display (roll mode) 19
SECAM 28
SEC/DIV knob 11
Self calibration 8
SET TO 50% button 61
Simple measurement 12
Sine wave 40
SINGLE SEQ button 10
Slope 9
Slope trigger 10
Software installation CD 68
Square wave 3
Standard accessories 67
Swap Trigger 10
T
Time 10
Time base 10
Time cursor 12
Time-domain waveform 21
Trigger 9
Trigger coupling 9
Trigger source 9
Trigger status 15
TRIG MENU button 10
Troubleshooting 61
U
UTILITY 8
UTILITY button 8
V
Vectors 39
Vertical controls 19
Vertical position 11
Vertical scale 11
Video signal 10
Video trigger 10
Voltage 1
VOLTS/DIV knob 20
W
Waveform autocruise 43
Waveform display 9
Waveform scaling and positioning 9
Window Time Base 16
X
XY format 16
MSO-5000B Digital Storage Oscilloscope User Manual 79

Harmful and Poisonous Substances or Elements
Appendix C
GNU GENERALPUBLIC LICENSE
Version 2, June 1991
Copyright (C) 1989, 1991 Free Software Foundation, Inc.,
51 Franklin Street, Fifth Floor, Boston, MA 02110-1301 USA
Everyone is permitted to copy and distribute verbatim copies of this license document, but
changing it is not allowed.
Preamble
The licenses for most software are designed to take away your freedom to share and change it.
By contrast, the GNU General Public License is intended to guarantee your freedom to share and
change free software--to make sure the software is free for all its users. This General Public
License applies to most of the Free Software Foundation's software and to any other program
whose authors commit tousing it. (Some other Free Software Foundation software is covered by
the GNU Lesser General Public License instead.) You can apply it to your programs, too.
When we speak of free software, we are referring to freedom, notprice. Our General Public
Licenses are designed to make sure that you have the freedom to distribute copies of free
software (and charge for this service if you wish), that you receive source code or can get it if you
want it, that you can change the software or use pieces of it in new free programs; and that you
know you can do these things.
To protect your rights, we need to make restrictions that forbid anyone to deny you these rights
or to ask you to surrender the rights. These restrictions translate to certain responsibilities for you
if you distribute copies of the software, or if you modify it.
For example, if you distribute copies of such a program, whether gratis or for a fee, you must
give the recipients all the rights that you have. You must make sure that they, too, receive or can
get the source code. And you must show them these terms so they know their rights.
We protect your rights with two steps: (1) copyright the software, and (2) offer you this license
which gives you legal permission to copy, distribute and/or modify the software.
Also, for each author's protection and ours, we want to make certain that everyone understands
that there is no warranty for this free software. If the software is modified by someone else and
passed on, we want its recipients to know that what they have is not the original, so that any
problems introduced by others will not reflect on the original authors' reputations.
MSO-5000B Digital Storage Oscilloscope User Manual 80

Harmful and Poisonous Substances or Elements
Finally, any free program is threatened constantly by software patents. We wish to avoid the
danger that redistributors of a free program will individually obtain patent licenses, in effect making
the program proprietary. To prevent this, we have made it clear that any patent must be licensed
for everyone's free use or not licensed at all.
The precise terms and conditions for copying, distribution and modification follow.
GNU GENERAL PUBLIC LICENSE
TERMS AND CONDITIONS FOR COPYING, DISTRIBUTION AND MODIFICATION
0. This License applies to any program or other work which contains a notice placed by the
copyright holder saying it may be distributed under the terms of this General Public License. The
"Program", below, refers to any such program or work, and a "work based on the Program" means
either the Program or any derivative work under copyright law: that is to say, a work containing the
Program or a portion of it, either verbatim or with modifications and/or translated into another
language. (Hereinafter, translation is included without limitation in the term "modification".)
Each licensee is addressed as "you".
Activities other than copying, distribution and modification are not covered by this License; they
are outside its scope. The act of
running the Program is not restricted, and the output from the Program is covered only if its
contents constitute a work based on the Program (independent of having been made by running
the Program). Whether that is true depends on what the Program does.
1. You may copy and distribute verbatim copies of the Program's source code as you receive it,
in any medium, provided that you conspicuously and appropriately publish on each copy an
appropriate copyright notice and disclaimer of warranty; keep intact all the notices that refer to this
License and to the absence of any warranty; and give any other recipients of the Program a copy
of this License along with the Program.
You may charge a fee for the physical act of transferring a copy, and you may at your option offer
warranty protection in exchange for a fee.
2. You may modify your copy or copies of the Program or any portion of it, thus forming a work
based on the Program, and copy and distribute such modifications or work under the terms of
Section 1 above, provided that you also meet all of these conditions:
a) You must cause the modified files to carry prominent notices stating that you changed the
files and the date of any change.
b) You must cause any work that you distribute or publish, that in whole or in part contains or
is derived from the Program or any part thereof, to be licensed as a whole at no charge to all third
parties under the terms of this License.
MSO-5000B Digital Storage Oscilloscope User Manual 81

Harmful and Poisonous Substances or Elements
c) If the modified program normally reads commands interactively when run, you must cause
it, when started running for such interactive use in the most ordinary way, to print or display an
announcement including an appropriate copyright notice and a notice that there is no warranty (or
else, saying that you provide a warranty) and that users may redistribute the program under
these conditions, and telling the user how to view a copy of this License. (Exception: if the
Program itself is interactive but does not normally print such an announcement, your work based
on the Program is not required to print an announcement.)
These requirements apply to the modified work as a whole. If identifiable sections of that work
are not derived from the Program, and can be reasonably considered independent and separate
works in themselves, then this License, and its terms, do not apply to those sections when you
distribute them as separate works. But when you distribute the same sections as part of a whole
which is a work based on the Program, the distribution of the whole must be on the terms of
this License, whose permissions for other licensees extend to the entire whole, and thus to each
and every part regardless of who wrote it.
Thus, it is not the intent of this section to claim rights or contest your rights to work written entirely
by you; rather, the intent is to exercise the right to control the distribution of derivative or collective
works based on the Program.
In addition, mere aggregation of another work not based on the Program with the Program (or with
a work based on the Program) on a volume of a storage or distribution medium does not bring the
other work under the scope of this License.
3. You may copy and distribute the Program (or a work based on it, under Section 2) in object
code or executable form under the terms of Sections 1 and 2 above provided that you also do one
of the following:
a) Accompany it with the complete corresponding machine-readable source code, which must
be distributed under the terms of Sections 1 and 2 above on a medium customarily used for
software interchange; or,
b) Accompany it with a written offer, valid for at least three years, to give any third party, for a
charge no more than your cost of physically performing source distribution, a complete
machine-readable copy of the corresponding source code, to be distributed under the terms
of Sections 1 and 2 above on a medium customarily used for software interchange; or,
c) Accompany it with the information you received as to the offer to distribute corresponding
source code. (This alternative is allowed only for noncommercial distribution and only if you
received the program in object code or executable form with such an offer, in accord with
Subsection b above.)
The source code for a work means the preferred form of the work for making modifications to it.
For an executable work, complete source code means all the source code for all modules it
MSO-5000B Digital Storage Oscilloscope User Manual 82

Harmful and Poisonous Substances or Elements
contains, plus any associated interface definition files, plus the scripts used to control compilation
and installation of the executable. However, as a special exception, the source code distributed
need not include anything that is normally distributed (in either source or binary form) with the
major components (compiler, kernel, and so on) of the operating system on which the executable
runs, unless that component itself accompanies the executable.
If distribution of executable or object code is made by offering access to copy from a designated
place, then offering equivalent access to copy the source code from the same place counts as
distribution of the source code, even though third parties are not compelled to copy the source
along with the object code.
4. You may not copy, modify, sublicense, or distribute the Program except as expressly provided
under this License. Any attempt otherwise to copy, modify, sublicense or distribute the Program
is void, and will automatically terminate your rights under this License. However, parties who have
received copies, or rights, from you under this License will not have their licenses terminated so
long as such parties remain in full compliance.
5. You are not required to accept this License, since you have not signed it. However, nothing
else grants you permission to modify or distribute the Program or its derivative works. These
actions are prohibited by law if you do not accept this License. Therefore, by modifying or
distributing the Program (or any work based on the Program), you indicate your acceptance of this
License to do so, and all its terms and conditions for copying, distributing or modifying the Program
or works based on it.
6. Each time you redistribute the Program (or any work based on the Program), the recipient
automatically receives a license from the original licensor to copy, distribute or modify the Program
subject to these terms and conditions. You may not impose any further restrictions on the
recipients' exercise of the rights granted herein. You are not responsible for enforcing compliance
by third parties to this License.
7. If, as a consequence of a court judgment or allegation of patent infringement or for any other
reason (not limited to patent issues), conditions are imposed on you (whether by court order,
agreement or otherwise) that contradict the conditions of this License, they do not excuse you
from the conditions of this License. If you cannot distribute so as to satisfy simultaneously your
obligations under this License and any other pertinent obligations, then as a consequence you
may not distribute the Program at all. For example, if a patent license would not permit
royalty-free redistribution of the Program by all those who receive copies directly or indirectly
through you, then the only way you could satisfy both it and this License would be to refrain
entirely from distribution of the Program.
If any portion of this section is held invalid or unenforceable under any particular circumstance, the
balance of the section is intended to apply and the section as a whole is intended to apply in other
circumstances.
MSO-5000B Digital Storage Oscilloscope User Manual 83

Harmful and Poisonous Substances or Elements
It is not the purpose of this section to induce you to infringe any patents or other property right
claims or to contest validity of any such claims; this section has the sole purpose of protecting the
integrity of the free software distribution system, which is implemented by public license practices.
Many people have made generous contributions to the wide range of software distributed through
that system in reliance on consistent application of that system; it is up to the author/donor to
decide if he or she is willing to distribute software through any other system and a licensee cannot
impose that choice.
This section is intended to make thoroughly clear what is believed to be a consequence of the rest
of this License.
8. If the distribution and/or use of the Program is restricted in certain countries either by patents
or by copyrighted interfaces, the original copyright holder who places the Program under this
License may add an explicit geographical distribution limitation excluding those countries, so that
distribution is permitted only in or among countries not thus excluded. In such case, this License
incorporates the limitation as if written in the body of this License.
9. The Free Software Foundation may publish revised and/or new versions of the General
Public License from time to time. Such new versions will be similar in spirit to the present version,
but may differ in detail to address new problems or concerns.
Each version is given a distinguishing version number. If the Program specifies a version number
of this License which applies to it and "any later version", you have the option of following the
terms and conditions either of that version or of any later version published by the Free Software
Foundation. If the Program does not specify a version number of this License, you may choose
any version ever published by the Free Software Foundation.
10. If you wish to incorporate parts of the Program into other free programs whose distribution
conditions are different, write to the author to ask for permission. For software which is
copyrighted by the Free Software Foundation, write to the Free Software Foundation; we
sometimes make exceptions for this. Our decision will be guided by the two goals of preserving
the free status of all derivatives of our free software and of promoting the sharing and reuse of
software generally.
NO WARRANTY
11. BECAUSE THE PROGRAM IS LICENSED FREE OF CHARGE, THERE IS NO
WARRANTY FOR THE PROGRAM, TO THE EXTENT PERMITTED BY APPLICABLE LAW.
EXCEPT WHEN OTHERWISE STATED IN WRITING THE COPYRIGHT HOLDERS AND/OR
OTHER PARTIES PROVIDE THE PROGRAM "AS IS" WITHOUT WARRANTY OF ANY KIND,
EITHER EXPRESSED OR IMPLIED, INCLUDING, BUT NOT LIMITED TO, THE IMPLIED
WARRANTIES OF MERCHANTABILITY AND FITNESS FOR A PARTICULAR PURPOSE. THE
ENTIRE RISK AS TO THE QUALITY AND PERFORMANCE OF THE PROGRAM IS WITH YOU.
MSO-5000B Digital Storage Oscilloscope User Manual 84

Harmful and Poisonous Substances or Elements
SHOULD THE PROGRAM PROVE DEFECTIVE, YOU ASSUME THE COST OF ALL
NECESSARY SERVICING, REPAIR OR CORRECTION.
12. IN NO EVENT UNLESS REQUIRED BY APPLICABLE LAW OR AGREED TO IN WRITING
WILL ANY COPYRIGHT HOLDER, OR ANY OTHER PARTY WHO MAY MODIFY AND/OR
REDISTRIBUTE THE PROGRAM AS PERMITTED ABOVE, BE LIABLE TO YOU FOR
DAMAGES, INCLUDING ANY GENERAL, SPECIAL, INCIDENTAL OR CONSEQUENTIAL
DAMAGES ARISING OUT OF THE USE OR INABILITY TO USE THE PROGRAM (INCLUDING
BUT NOT LIMITED TO LOSS OF DATA OR DATA BEING RENDERED INACCURATE OR
LOSSES SUSTAINED BY YOU OR THIRD PARTIES OR A FAILURE OF THE PROGRAM TO
OPERATE WITH ANY OTHER PROGRAMS), EVEN IF SUCH HOLDER OR OTHER PARTY HAS
BEEN ADVISED OF THE POSSIBILITY OF SUCH DAMAGES.
END OF TERMS AND CONDITIONS
How to Apply These Terms to Your New Programs
If you develop a new program, and you want it to be of the greatest possible use to the public,
the best way to achieve this is to make it free software which everyone can redistribute and
change under these terms.
To do so, attach the following notices to the program. It is safest to attach them to the start of
each source file to most effectively convey the exclusion of warranty; and each file should have at
least the "copyright" line and a pointer to where the full notice is found.
<one line to give the program's name and a brief idea of what it does.>
Copyright (C) <year> <name of author>
This program is free software; you can redistribute it and/or modify it under the terms of the
GNU General Public License as published by the Free Software Foundation; either version 2 of
the License, or (at your option) any later version.
This program is distributed in the hope that it will be useful, but WITHOUT ANY WARRANTY;
without even the implied warranty of MERCHANTABILITY or FITNESS FOR A PARTICULAR
PURPOSE. See the GNU General Public License for more details.
You should have received a copy of the GNU General Public License along with this program;
if not, write to the Free Software Foundation, Inc., 51 Franklin Street, Fifth Floor, Boston, MA
02110-1301 USA.
Also add information on how to contact you by electronic and paper mail.
If the program is interactive, make it output a short notice like this when it starts in an interactive
mode:
MSO-5000B Digital Storage Oscilloscope User Manual 85

Harmful and Poisonous Substances or Elements
Gnomovision version 69, Copyright (C) year name of author Gnomovision comes with
ABSOLUTELY NO WARRANTY; for details type `show w'. This is free software, and you are
welcome to redistribute it under certain conditions; type `show c' for details.
The hypothetical commands `show w' and `show c' should show the appropriate parts of the
General Public License. Of course, the commands you use may be called something other than
`show w' and `show c'; they could even be mouse-clicks or menu items--whatever suits your
program.
You should also get your employer (if you work as a programmer) or your school, if any, to sign a
"copyright disclaimer" for the program, if necessary. Here is a sample; alter the names:
Yoyodyne, Inc., hereby disclaims all copyright interest in the program
`Gnomovision' (which makes passes at compilers) written by James Hacker.
<signature of Ty Coon>, 1 April 1989
Ty Coon, President of Vice
This General Public License does not permit incorporating your program into proprietary programs.
If your program is a subroutine library, you may consider it more useful to permit linking proprietary
applications with the library. If this is what you want to do, use the GNU Lesser General Public
License instead of this License.
MSO-5000B Digital Storage Oscilloscope User Manual 86
 Loading...