

Page 1

DSO Four-Channel Series
Digital Storage Oscilloscopes
User Manual
Page 2

General W arranty
We warrants that the product will be free from defects in materials and workmanship for a
period of 3 years from the date of purchase of the product by the original purchaser from
our company. The warrant y period for accessories such as probes, battery is 12 months.
This warranty only applies to the original purchaser and is not transferable to a third party.
If the product proves defective during the warranty period, we will either repair the
defective product without charge for parts and labour, or will provide a replacement in
exchange for the defective product. Parts, modules and replacement products used by our
company for warranty work may be new or reconditioned like new. All replaced parts,
modules and products become the property of our company.
In order to obtain service under this warranty, the customer must notify our company of
the defect before the expiration of the warranty period. Customer shall be responsible for
packaging and shipping the defective product to the designated service centre, a copy of
the customers proof of purchase is also required.
This warranty shall not apply to any defect, failure or damage caused by improper use or
improper or inadequate maint enance and car e. We shall not be obligated to furnish service
under this warranty a) to repair damage resulting from attempts by personnel other than
our company representatives to install, repair or service the product; b) to repair damage
resulting from improper use or connection to incompatible equipment; c) to repair any
damage or malfunction caused by the use of not our supplies; or d) to service a product
that has been modified or integrated with other products when the effect of such
modification or integration increases the time or difficulty of servicing the product.
Please contact the neares t S ales an d Servi ce Offi ces for se rvices o r a com pl ete cop y of th e
warranty statement.
Excepting the after-sales services provided in this summary or the applicable warranty
statements, we will not offer any guarantee for maintenance definitely declared or hinted,
including but not limited to the implied guarantee for marketability and special-purpose
acceptability. We should not take any responsibilities for any indirect, special or consequent
damages.
Page 3

Table of Contents
1. General Safety Requirements .......................................................................................... 1
2. Safety Terms and Symbols ............................................................................................... 2
3. Junior User Guidebook ................................................................................................... 4
Introduction to the Structure of the Oscillo scope ..................................................................... 5
Front Panel ............................................................................................................................................... 5
Rear Panel ................................................................................................................................................ 6
Control Area ............................................................................................................................................. 7
User Interface Introduction ........................................................................................................ 8
How to Implement the General Inspection ............................................................................. 10
How to Implement the Function Inspection ............................................................................ 10
How to Implement the Probe Compensation .......................................................................... 11
How to Set the Probe Attenuation Coefficient ........................................................................ 12
How to Use the Probe Safely..................................................................................................... 13
How to Implement Self-calibration .......................................................................................... 13
Introduction to the Vertical System ......................................................................................... 14
Introduction to the Horizontal System .................................................................................... 15
Introduction to the Trigger System ......................................................................................... 16
Touchscreen Controls ............................................................................................................... 16
4. Advanced User Guidebook ............................................................................................ 22
How to Set the Vertical System ................................................................................................ 23
Use Mathematical Manipulation Function ............................................................................. 25
Waveform math .................................................................................................................................... 26
User defined function ............................................................................................................................. 27
Digital Filter ........................................................................................................................................... 27
Using FFT function ................................................................................................................................ 28
Use Vertical Position and Scale Knob s .................................................................................... 30
How to Set the Horizontal System ........................................................................................... 31
Zoom the Waveform .............................................................................................................................. 31
How to Set the Trigger/Decoding System ................................................................................ 32
Single Trigger ......................................................................................................................................... 32
Logic Trigge r.......................................................................................................................................... 41
Bus Trigger ............................................................................................................................................. 42
Bus Decoding ......................................................................................................................................... 48
How to Operate the Function Menu ........................................................................................ 53
How to Implement Sampling Setup ....................................................................................................... 53
How to Set the Display System .............................................................................................................. 54
How to Save and Recall a Waveform ..................................................................................................... 57
i
Page 4

How to Reco r d/Playback Waveforms .................................................................................................... 64
How to Clone and Recall a waveform .................................................................................................... 68
How to Implement the Auxiliary System Function Setting .................................................................... 73
How to Update your Instrument Firmware............................................................................................. 76
How to Measure Automatically.............................................................................................................. 77
How to Measure with Cursors ................................................................................................................ 82
How to Use Autoscale ............................................................................................................................ 85
How to Use Built-in Help ....................................................................................................................... 86
How to Use E xecutive Buttons............................................................................................................... 87
How to Print the Screen Image ............................................................................................................... 89
5. Use the Arbitrary Function Generator (Optional) ............................................................. 90
Output Connection .................................................................................................................... 90
To Set Channels ......................................................................................................................... 90
To Set Signals ............................................................................................................................. 91
To Output Sine Signals........................................................................................................................... 91
To Set the Frequency ........................................................................................................................................... 91
To Set the Period .................................................................................................................................................. 92
To Set the Start Phase .......................................................................................................................................... 92
To Set the Amplitude ........................................................................................................................................... 92
To Set the Offset .................................................................................................................................................. 92
To Set the High Level .......................................................................................................................................... 92
To Set the Low Level ........................................................................................................................................... 93
To Output Sq uare Signals ....................................................................................................................... 93
To Output Ramp Signals ........................................................................................................................ 93
To Set the Symmetry of Ramp ............................................................................................................................. 93
To Output P ul s e Signals ......................................................................................................................... 93
To Set the Pulse Width of Pulse ........................................................................................................................... 93
To Set the Duty Cycle of Pulse ............................................................................................................................ 93
To Output Arbitrary Signals ................................................................................................................... 93
Create a New Waveform ...................................................................................................................................... 94
File Browse .......................................................................................................................................................... 95
Built-in Wavefor m ............................................................................................................................................... 95
Frequency Response Analysis .................................................................................................. 97
6. Communication with PC ............................................................................................... 99
Using USB Port .......................................................................................................................... 99
Using LAN Port ....................................................................................................................... 100
Connect directly ................................................................................................................................... 100
Connect through a router ...................................................................................................................... 101
7. Demonstration ............................................................................................................. 104
Example 1: Measurement a Simple Signal ............................................................................ 104
Example 2: Gain of a Amplifier in a Metering Circuit ........................................................ 105
Example 3: Capturing a Single Signal ................................................................................... 106
ii
Page 5

Example 4: Analyze the Details of a Signal ........................................................................... 107
Example 5: Application of X-Y Function .............................................................................. 109
Example 6: Video Signal Trigger ........................................................................................... 110
8. Tr oubleshooting ............................................................................................................ 112
9. Technical Specifications ............................................................................................... 113
Oscilloscope .............................................................................................................................. 113
Trigger .................................................................................................................................................. 116
Waveform Generator (optional) ............................................................................................ 117
General Technical Specifications ........................................................................................... 118
10. Appendix ..................................................................................................................... 119
Appendix A: Enclosure ........................................................................................................... 119
Appendix B: General Care and Cleaning ............................................................................. 119
Appendix C: Optional Battery Using Guide ......................................................................... 120
Appendix D: Line Fuse Replacement .................................................................................... 121
iii
Page 6

1.General Safety Requirements
1. General Safety Requirements
Before use, please read the following safety precautions to avoid any possible bodily
injury and to prevent this product or any other connected products from damage. In
order to avoid any contingent danger, ensure this product is only used within the
range specified.
Only the qualified technicians can implement the maintenance.
To avoid Fire or Personal Injury:
Connect the probe correctly. The grounding end of the probe corresponds to the
grounding phase. Please don't connect the grounding end to the positive phase.
Use Proper Power Cord. Use only the power cord supplied with the product and
certified to use in your country.
Connect or Disconnect Correctly. When the probe or test lead is connected to a
voltage source, please do not connect and disconnect the probe or test lead at random.
Product Grounded. This instrument is grounded through the power cord grounding
conductor. To avoid electric shock, the grounding conductor must be grounded. The
product must be grounded properly before any connection with its input or output
terminal.
When powered by AC power, it is not allowed to measure AC power source
directly, because the testing ground and power cord ground conductor are
connected together, otherwise, it will cause short circuit.
When powered by battery, the product must ground connection. To avoid electric
shock, there must be a ground wire connect between ground and the ground port
(on the back of product panel).
Check all Terminal Ratings. To avoid fire or shock hazard, check all ratings and
markers of this product. Refer to the user's manual for more information about ratings
before connecting to the instrument.
Do not operate without covers. Do not operate the instrument with covers or panels
removed.
Use Proper Fuse. Use only the specified type and rating fuse for this instrument.
Avoid exposed circuit. Do not touch exposed junctions and components when the
instrument is powered.
Do not operate if in any doubt. If you suspect damage occurs to the instrument, have
it inspected by qualified service personnel before further operations.
Use your Oscilloscope in a well-ventilated area. Make sure the instrument installed
with proper ventilation, refer to the user manual for more details.
Do not operate in wet conditions.
Do not operate in an explosive atmosphere.
Keep product surfaces clean and dry.
1
Page 7
2.Safety T erms and Symbols
2. Safety Terms and Symbols
Safety Term s
Terms in this manual. The following terms may appear in this manual:
Warning: Warning indicates the conditions or practices that could result in
injury or loss of life.
Caution: Caution indicates the conditions or practices that could result in
damage to this product or other property.
Terms on the product. The following terms may appear on this product:
Danger: It indicates an injury or hazard may immediately happen.
Warning: It indicates an injury or hazard may be accessible potentially.
Caution: It indicates a potential damage to the instrument or other property might occur.
Safety Symbols
Symbols on the product. The following symbol may appear on the product:
Hazardous Voltage
Protective Earth Terminal
Test Ground
To avoid body damage and prevent product and connected equipment damage, carefully
read the following safety information before using the test tool. This product can only be
used in the specified applications.
Refer to Manual
Chassis Ground
Warning:
The four channels of the oscilloscope are not electrically isolated. The channels
should adopt a common ground during measuring. To prevent short circuits, the 2
probe grounds must not be connected to 2 different non-isolated DC levels.
2
Page 8
2.Safety T erms and Symbols
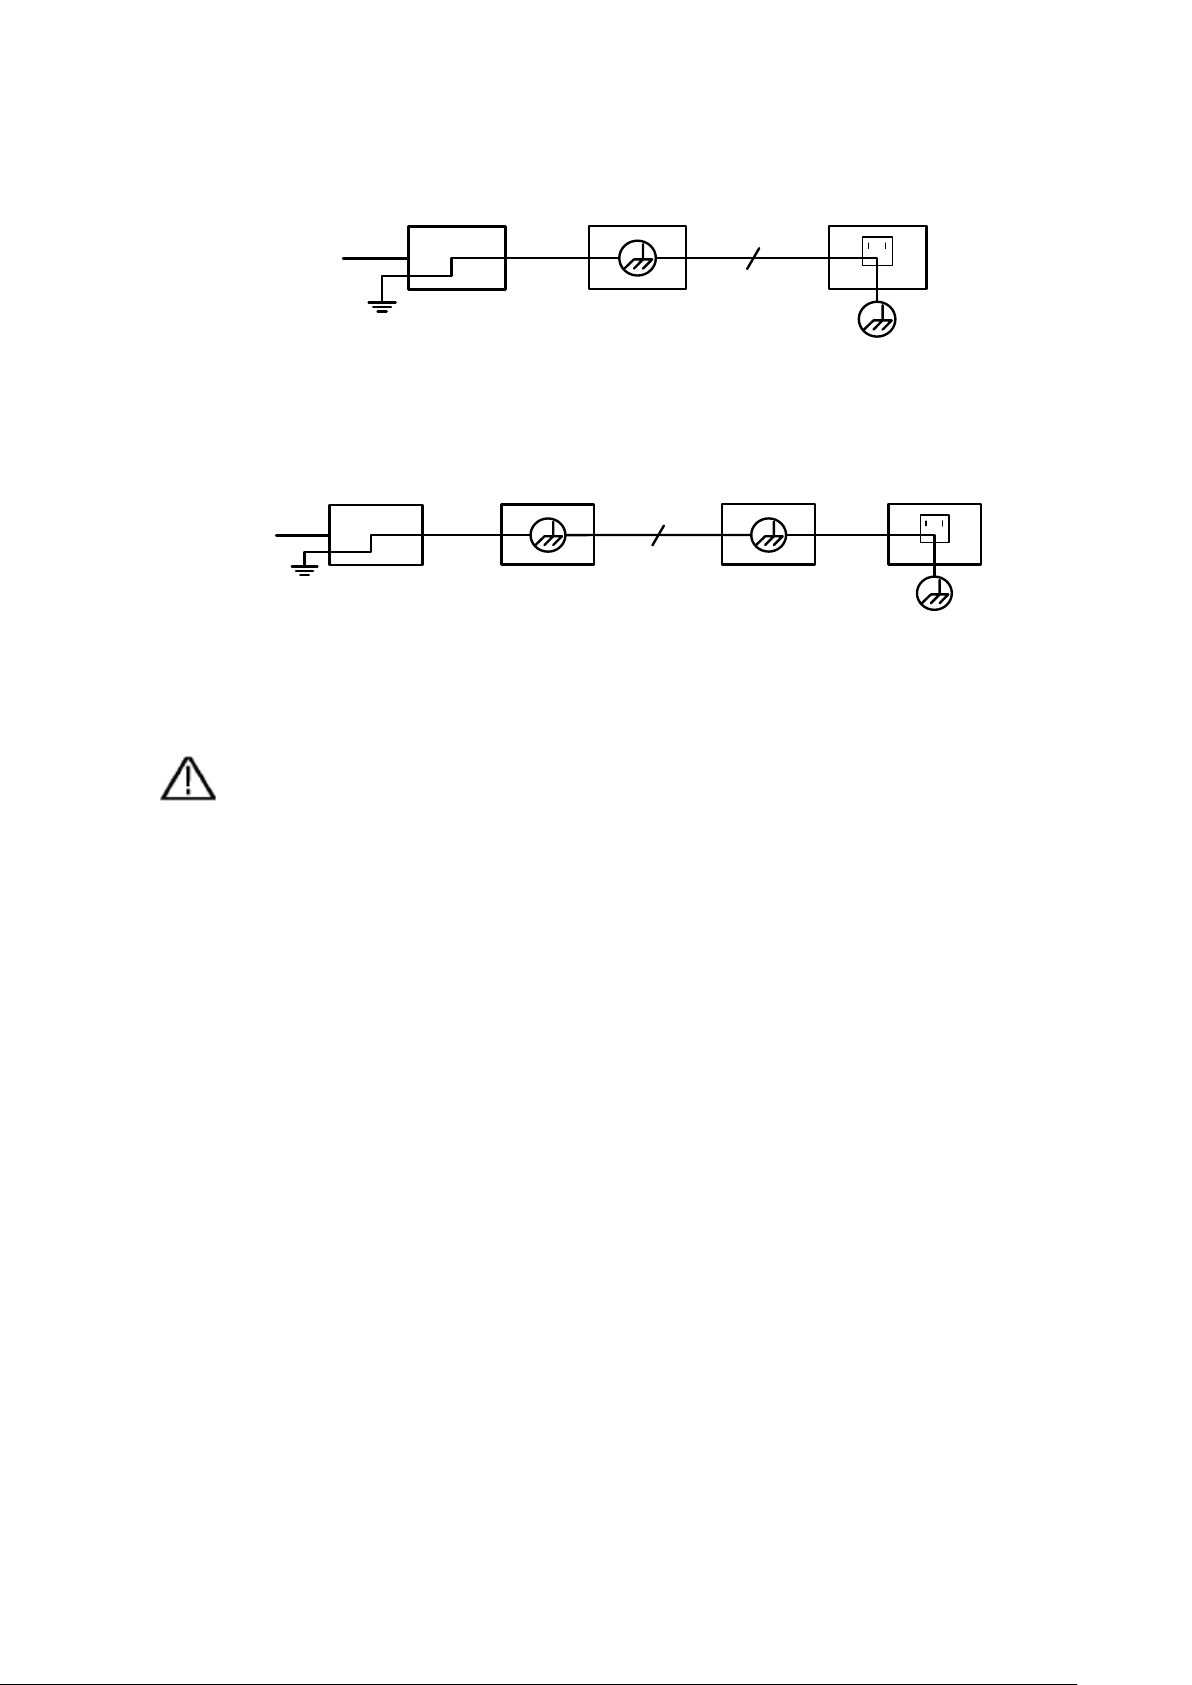
Ground Clip
Signal Input
Oscilloscope
Electrical Outlet
Probe
Power Cord
Ground Clip
Signal Input
Oscilloscope
(Battery-power)
PC Electrical OutletProbe
USB/VGA/COM/
LAN Cable
Warning:
To avoid fire or electrical shock
connected
42V peak (30Vrms) or on circuits of more than
4800VA
Do not apply input voltages above the rating of the instrument
will directly transmit to the
The diagram of the oscilloscope ground wire connection:
The diagram of the ground wire connection when the battery-powered oscilloscope is
connected to the AC-powered PC through the ports:
It is not allowed to measure AC power when the oscilloscope i s A C p o w e re d, o r when
the battery-powered oscilloscope is connected to the AC-powered PC through the
ports.
is more than
, please take note of below items:
Only use accessory insulated voltage probes and test lead.
Check the accessories such as probe before use and replace it if
there are any damages.
Remove probes, test leads and other accessories immediately after
use.
Remove USB cable which connects oscilloscope and computer.
because the probe tip voltage
oscilloscope. Use with caution when the probe is set as 1:1.
Do not use exposed metal BNC or banana plug connectors.
Do not insert metal objects into connectors.
, when the oscilloscope input signal
3
Page 9

3.Junior User Guidebook
3. Junior User Guidebook
This chapter deals with the following topics mainly:
Introduct ion to th e str uct ure of the os ci ll o sc ope
Introduct ion to th e user interface
How to im plement the gene ral inspect ion
How to im plement the func tion inspec tion
How to make a probe compensation
How to set the probe att en ua ti o n coefficient
How to use t he probe safely
How to im plement an self-calibration
Introduct ion to th e ve rti cal system
Introduct ion to th e ho riz on ta l sy stem
Introduct ion to th e tr igg er sy stem
Touchscreen Controls
4
Page 10
3.Junior User Guidebook
10
3
5
4
9
8
1
6
2
7
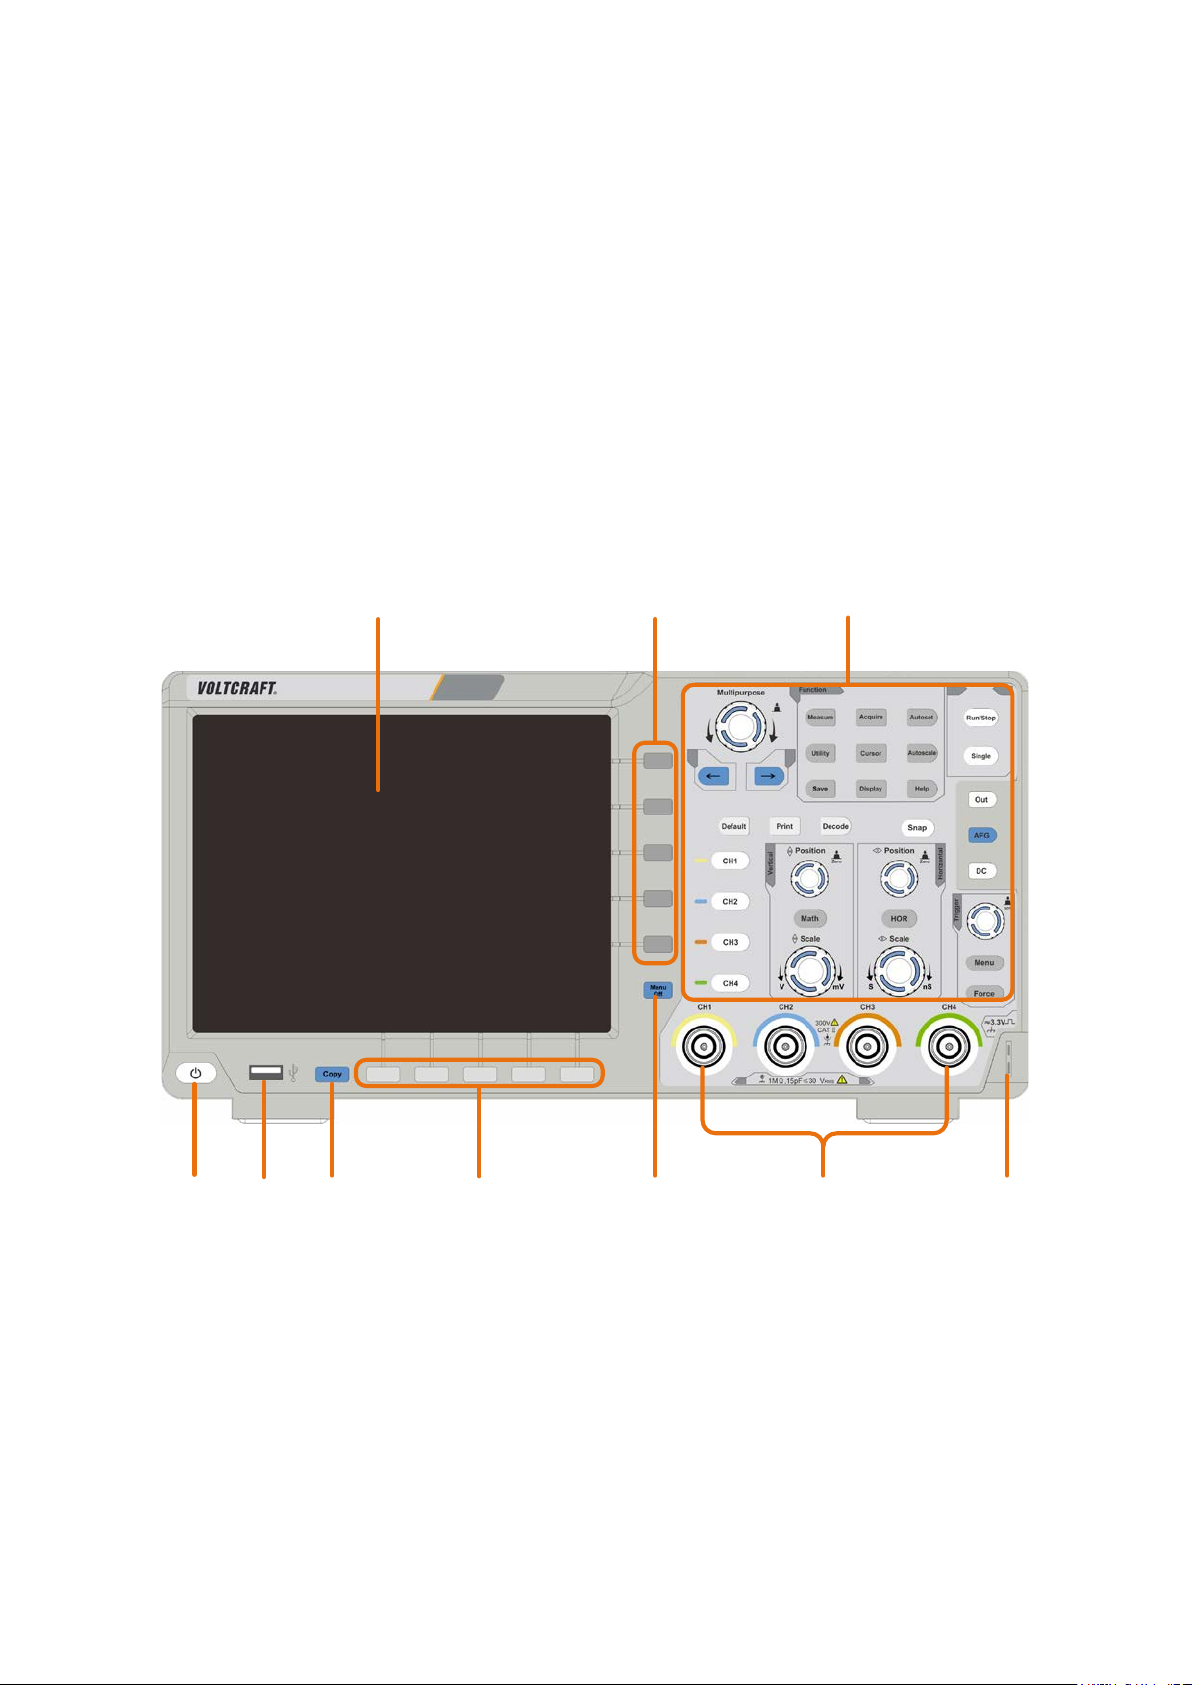
Introduction to the Structure of the Oscilloscope
This chapter makes a simple description of the operation and function of the front panel of
the oscilloscope, enabling you to be familiar with the use of the oscilloscope in the
shortest time.
Front Panel
The front panel has knob s and function buttons. The 5 buttons in the column on the right
side of the display screen or in the row under the display screen are menu selection
buttons, through which, you can set the different options for the current menu. The other
buttons are function buttons, through which, you can enter different function menus or
obtain a specific function application directly.
1. Display area
2. Select the right menu item
3. Control (button and knob) area
4. Probe Compensation: Measurement signal ( ≈ 3.3V/1kHz) output.
5. Input connectors of four channels
6. Remove the left and right menu
7. Select the bottom menu item
8. Copy button: You can save the waveform by just pressing this button in any user
Figure 3-1 Front panel
5
Page 11
3.Junior User Guidebook
8
7
6
10
9
1 2
5
3
4
interface.
9. USB Host port: It is used to transfer data when external USB equipment connects to
the oscilloscope regarded as "host device". For example: Saving the waveform to
USB flash disk needs to use this port.
10. Power on/off
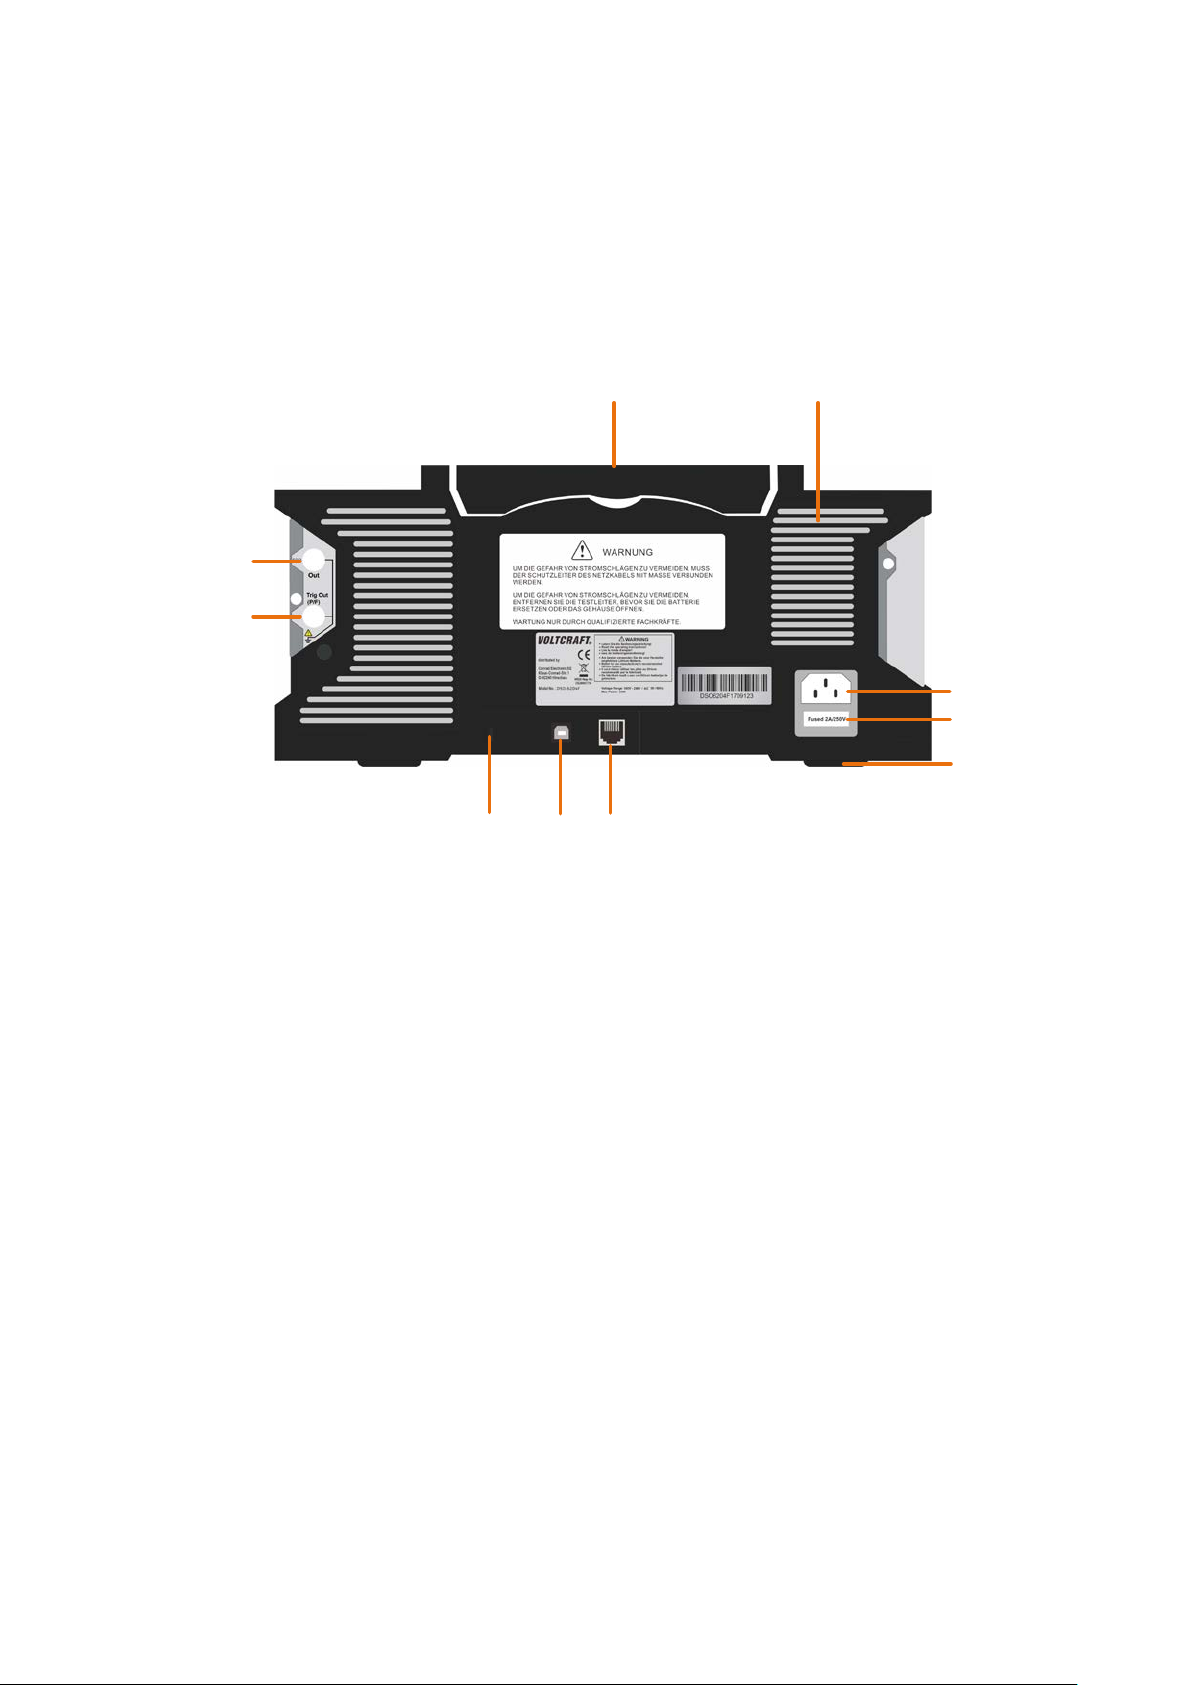
Rear Panel
Figure 3-2 Rear Panel
1. Handle
2. Air vents
3. AC power input jack
4. Fuse
5. Foot stool: Adjust the tilt angle of the oscilloscope.
6. LAN port: the network port which can be used to connect with PC.
7. USB Device port: It is used to transfer data w hen external USB equipment connects to
the oscilloscope regarded as "slave device". For example: to use this port when
connect PC to the oscilloscope by USB.
8. Lock Hole: You can lock the oscilloscope to a fixed location using the security lock
(please buy it yourself) to secure the oscilloscope.
9. Trig Out(P/F) port: Trigger signal output or Pass/Fail output, also can be used as the
port of CH2 Output of optional dual-channel waveform generator. The output type can
be set on the menu (Utility menu→Output→Output).
10. Out 1 port: Output (single-channel) or CH1 Output (dual-channel) of optional
waveform generator.
6
Page 12
Control Area
1
2
3
8
7
5
4
6
3.Junior User Guidebook
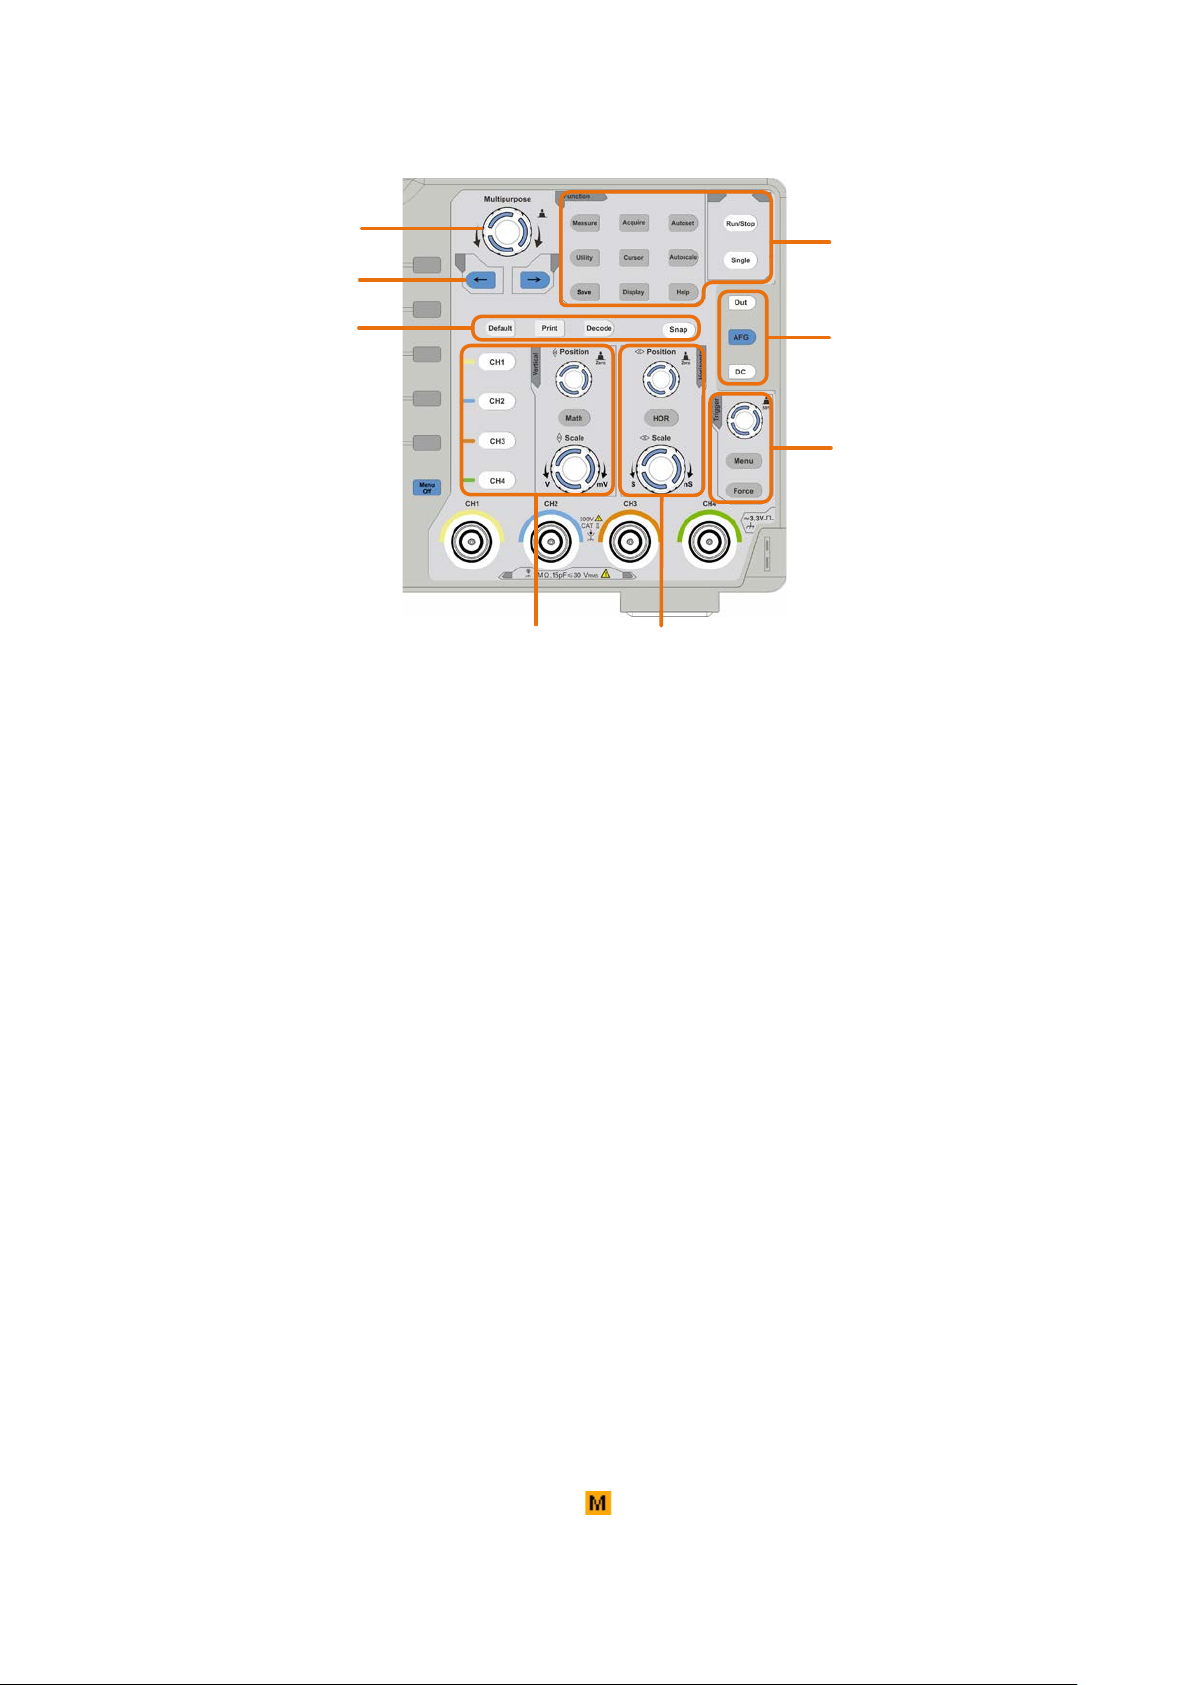
Figure 3-3 Control Are a Overview
1. Function button area: Total 11 buttons
2. Waveform generator controls (optional)
or
DAQ: This function is not available.
P/F: Pass/Fail (see "Pass/Fail" on P74)
W.REC: Waveform Record (see "How to Record/Playback Waveforms" on P64)
3. Trigger control area with 2 buttons and 1 knob.
The Trigger Level knob is to adjust trigger voltage. Other 2 buttons refer to trigger
system setting.
4. Horizontal control area with 1 button and 2 knobs.
"HOR" button refer to horizontal system setting menu, "Horizontal Position" knob
control trigger position, "Horizontal Scale" control time base.
5. Vertical control area with 5 buttons and 2 knobs.
CH1 - CH4 buttons correspond to setting menu in CH1 - CH4. "Math" button
provides access to math waveform functions (+, -, ×, /, FFT, user function, digital
filter). The "Vertical Position" knob control the vertical position of current chann el,
and the "Scale" knob control voltage scale of current channel.
6. Default: Call out the factory settings.
Print: Print an image of what appears on the instrument screen.
Decode: Turn on/off Decode function.
Snap: Shortcut button for measurement snapshot.
7. Direction key: Move the cursor of the focused parameter.
8. M knob (Multipurpose knob): when a symbol appears on the menu, it indicates
you can turn the M knob to select the menu or set the value. You can push it to close
7
Page 13
3.Junior User Guidebook
1
3
9
19
13
27
24
6
8
10
11
14
15
20
22
28
30
7
25
2
4
5
23
12
5
18
29
16
17
21
26
the menu on the left and right.
User Interface Introduction
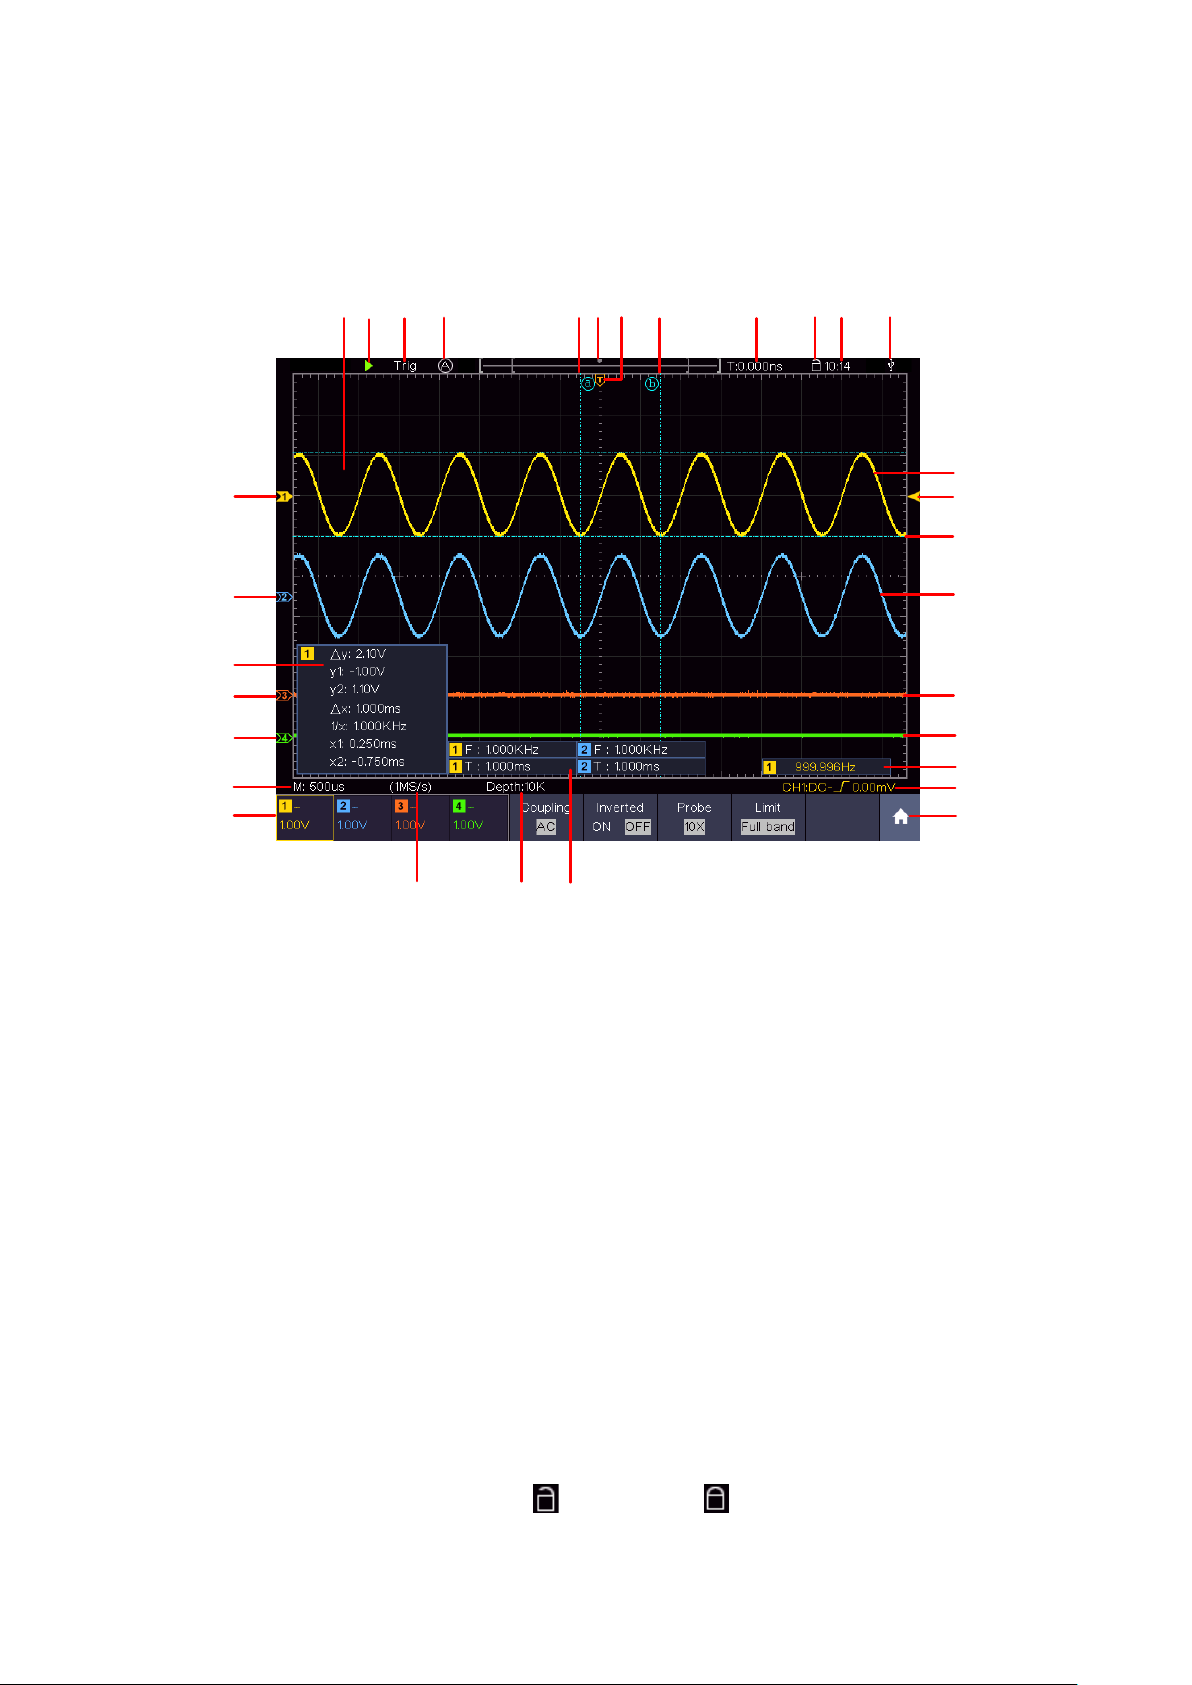
Figure 3-4 Illustrative Drawing of Display Interfaces
1. Waveform Display Area.
2. Run/Stop (touchable) (see "How to Use Executive Buttons" on P87)
3. The state of trigger, including:
Auto: Automatic mode and acquire waveform without triggering.
Trig: Trigger detected and acquire waveform.
Ready: Pre-triggered data captured and ready for a trigger.
Scan: Capture and display the waveform continuously.
Stop: Data acquisition stopped.
4. Click to auto set.
5. The two blue dotted lines indicates the vertical position of cursor measurement.
6. The pointer indicates the trigger position in the record length.
7. The T pointer indicates the horizontal position for the trigger.
8. It shows present triggering value and displays the site of present window in
internal memory.
9. Touchable icon is to enable (
10. It shows setting time (see "Config" on P73).
) or disable (
8
) the touchscreen controls.
Page 14

3.Junior User Guidebook
11. It indicates that there is a USB disk connecting with the oscilloscope.
12. The waveform of CH1.
13. The pointer shows the trigger level position of the source in trigger menu.
14. The two blue dotted lines indicate the horizontal position of cursor measurement.
15. The waveform of CH2.
16. The waveform of CH3.
17. The waveform of CH4.
18. The frequency of the trigger signal.
19. The icon shows the selected trigger type, e.g. represents triggering on the
rising e dge for an Edge trigger. The reading shows the trigger level value of the
corresponding channel.
20. Click to show/hide the touchable shortcut menu.
21. It indicates the measured type and value of the corresponding channel. "T" means
period, "F" means frequen cy, "V" means the average value, "Vp" the peak-peak
value, "Vr" the root-mean-square value, "Ma" the maximum amplitude value,
"Mi" the minimum amplitude value, "Vt" the Voltage value of the waveform's
flat top value, "Vb" the Voltage value of the waveform's flat base, "Va" the
amplitude value, "Os" the overshoot value, "Ps" the Preshoot value, "RT" the rise
time value, "FT" the fall time v alue, "PW" the +width value, "NW" t he -Width
value, "+D" the +Duty value, "-D" the -Duty value, "PD" the Delay A->B
value, "ND" the Delay A->B value, "TR" the Cycle RMS, "CR" the Cursor
RMS, "WP" the Screen Duty, "RP" the Phase A->B , "FP" the Phase A->B ,
"+PC" the + Pulse count, "-PC" the - Pulse count, "+E" th e Ri se ed ge coun t, "-E"
the Fall edge count, "AR" the Area, "CA" the Cycle area.
22. The readings show the record length.
23. The readings show current sample rate.
24. The readings indicate the corresponding Voltage Division of the channels.
"BW" indicates bandwidth limit.
The icon shows the coupling mode of the channel.
"—" indicates direct current coupling
"~" indicates AC coupling
" " indicates GND coupling
25. The reading shows the setting of main time base.
26. The green pointer indicates the grounding datum point (zero point position) of the
waveform of the CH1 channel.
27. The orange pointer indicates the grounding datum point (zero point posi tion) of
the waveform of the CH1 channel.
28. It is cursor measure window, showing the absolute values and the readings of the
cursors.
29. The blue pointer indicates the grounding datum point (zero point position) of the
waveform of the CH1 channel.
30. The yellow pointer indicates the grounding datum point (zero point position) of
9
Page 15

3.Junior User Guidebook
the waveform of the CH1 channel.
How to Implement the General Inspection
After you get a new oscilloscope, it is recommended that you should make a check on
the instrument according to the following steps:
1. Check whether there is any damage caused by transportation.
If it is found that the packaging carton or the foamed plastic protection cushion has
suffered serious damage, do not throw it away first till the complete device and its
accessories succeed in the electrical and mechanical property tests.
2. Check the Accessories
The supplied acc essori es have b een al read y des crib ed in t he "Appendix A: Enclosure" of
this Manual. You ca n check whether t here is an y loss of acc essories w ith r eferenc e to
this description. If it is found that there is any accessory lost or damaged, please get in
touch with our distributor responsible for this service or our local offices.
3. Check the Complete Instrument
If it is found that there is damage to the appearance of the instrument, or the
instrument can not work normally, or fails in the performance test, please get in touch
with our distributor responsible for this business or our local offices. If there is
damage to the instrument caused by the transportation, please keep the package. With
the transportation department or our distributor responsible for this business informed
about it, a repairing or replacement of the instrument will be arranged by us.
How to Implement t he Function Inspec t ion
Make a fast function check to verify the normal operation of the instrument, according
to the following steps:
1. Connect the power cord to a power source. Long press the
bottom left of the instrument.
The instrument carries out all self-check items and shows the Boot Logo. Push the
Utility button, select Function in the bottom menu. S elect Adjust in the left menu,
select Default in the bottom menu. The def ault attenu ation coefficient s et v alue of t he
probe on the menu is 10X.
button on the
2. Set the Switch in the Oscilloscope Probe as 10X and Connect the Oscilloscope
with CH1 Channel.
Align the slot in the probe with the plug in the CH1 connector BNC, and then tighten
the probe with rotating it to the right side.
Connect the probe tip and the ground clamp to the connector of the probe
compensator.
10
Page 16
3.Junior User Guidebook
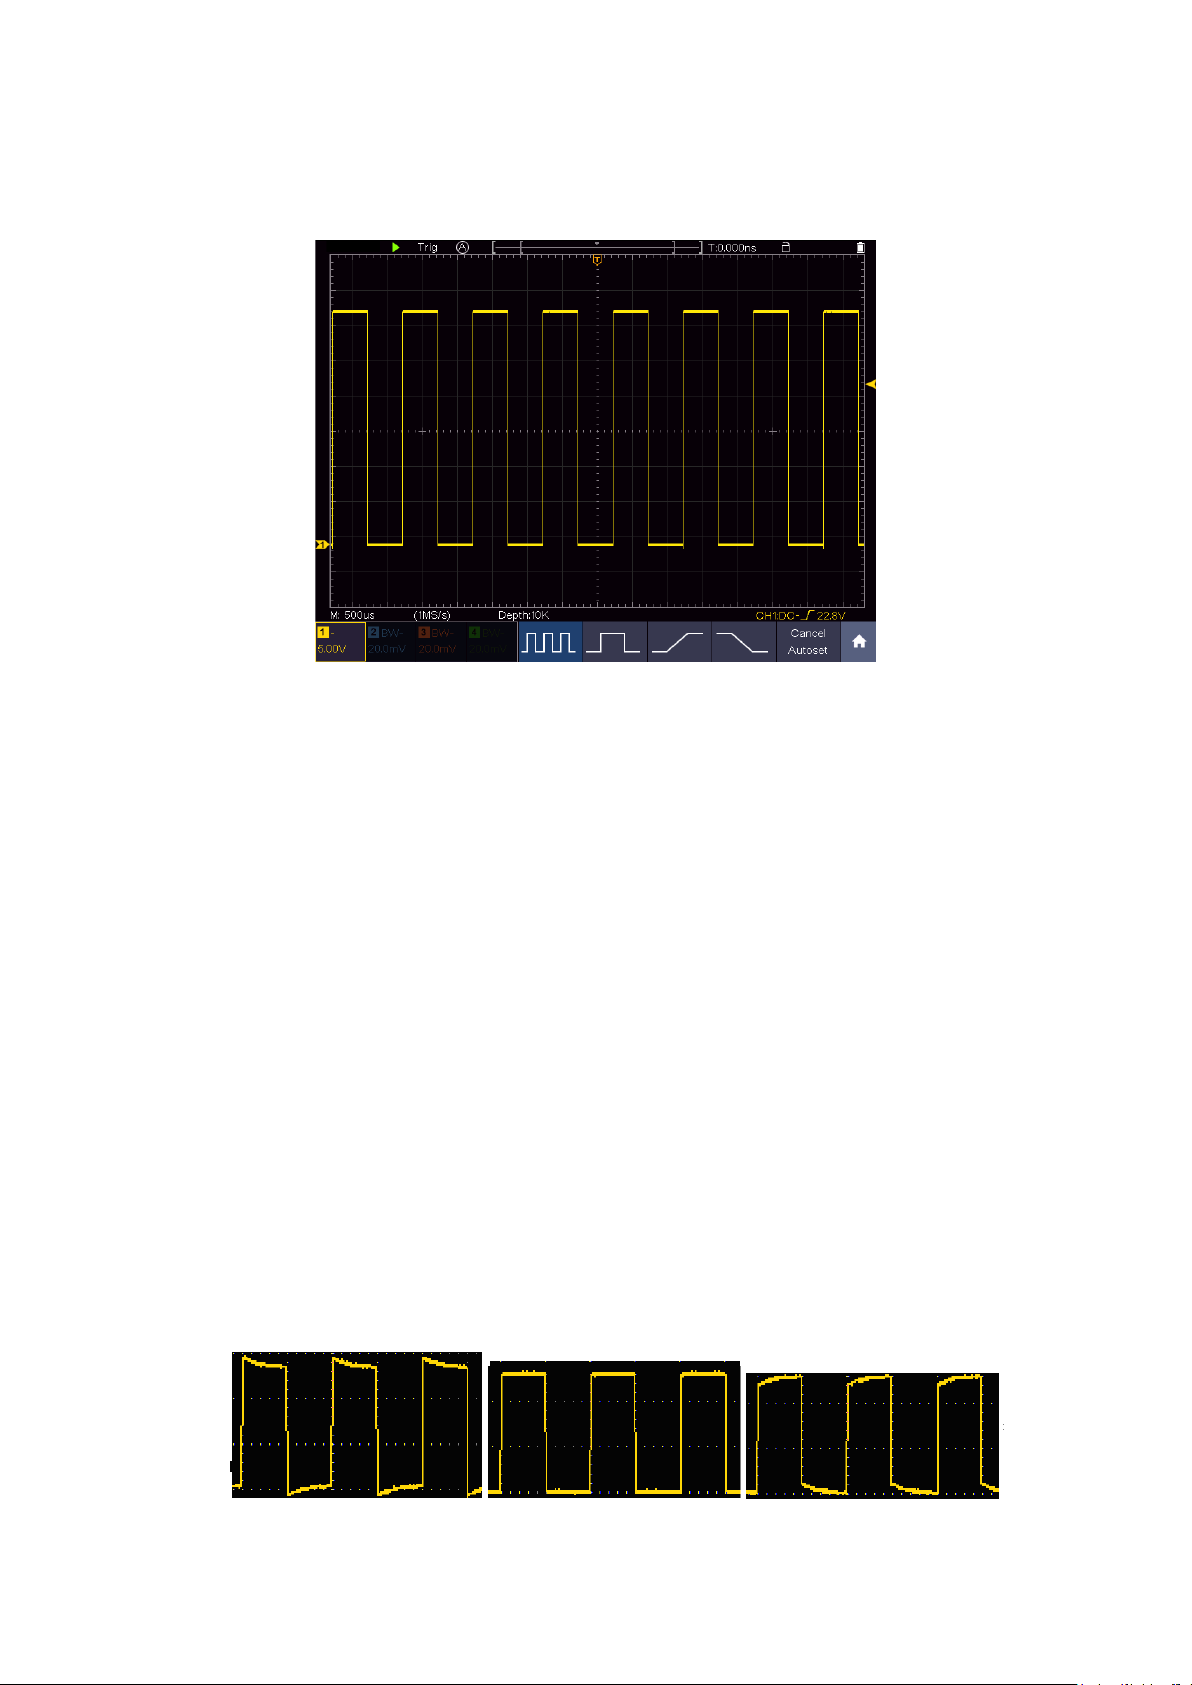
3. Push the Autoset Button on the front panel.
The square wave of 1 KHz frequency and 3.3V peak-peak value will be displayed in
several seconds (see Figure 3-5).
Figure 3-5 Auto set
Check CH2, CH3 and CH4 by repeating Step 2 and Step 3.
How to Implement the Probe Compensation
When connect the probe with any input channel for the first time, make this
adjustment to match the probe with the input channel. The probe which is not
compensated or presents a compensation deviation will result in the measuring error
or mistake. For adjusting the probe compensation, please carry out the following
steps:
1. Set the attenuation coefficient of the probe on th e menu as 10X and that of the
switch in the probe as 10X (see "How to Set the Probe Attenuation Coefficient"
on P12), and connect the probe with the CH1 channel. If a probe hook tip is used,
ensure that it keeps in close touch with the probe. C onnect the probe tip with the
signal connecto r of the prob e compensator and connect the reference wire clamp
with the ground wire connector of the probe connector, and then push the
Autoset button on the front panel.
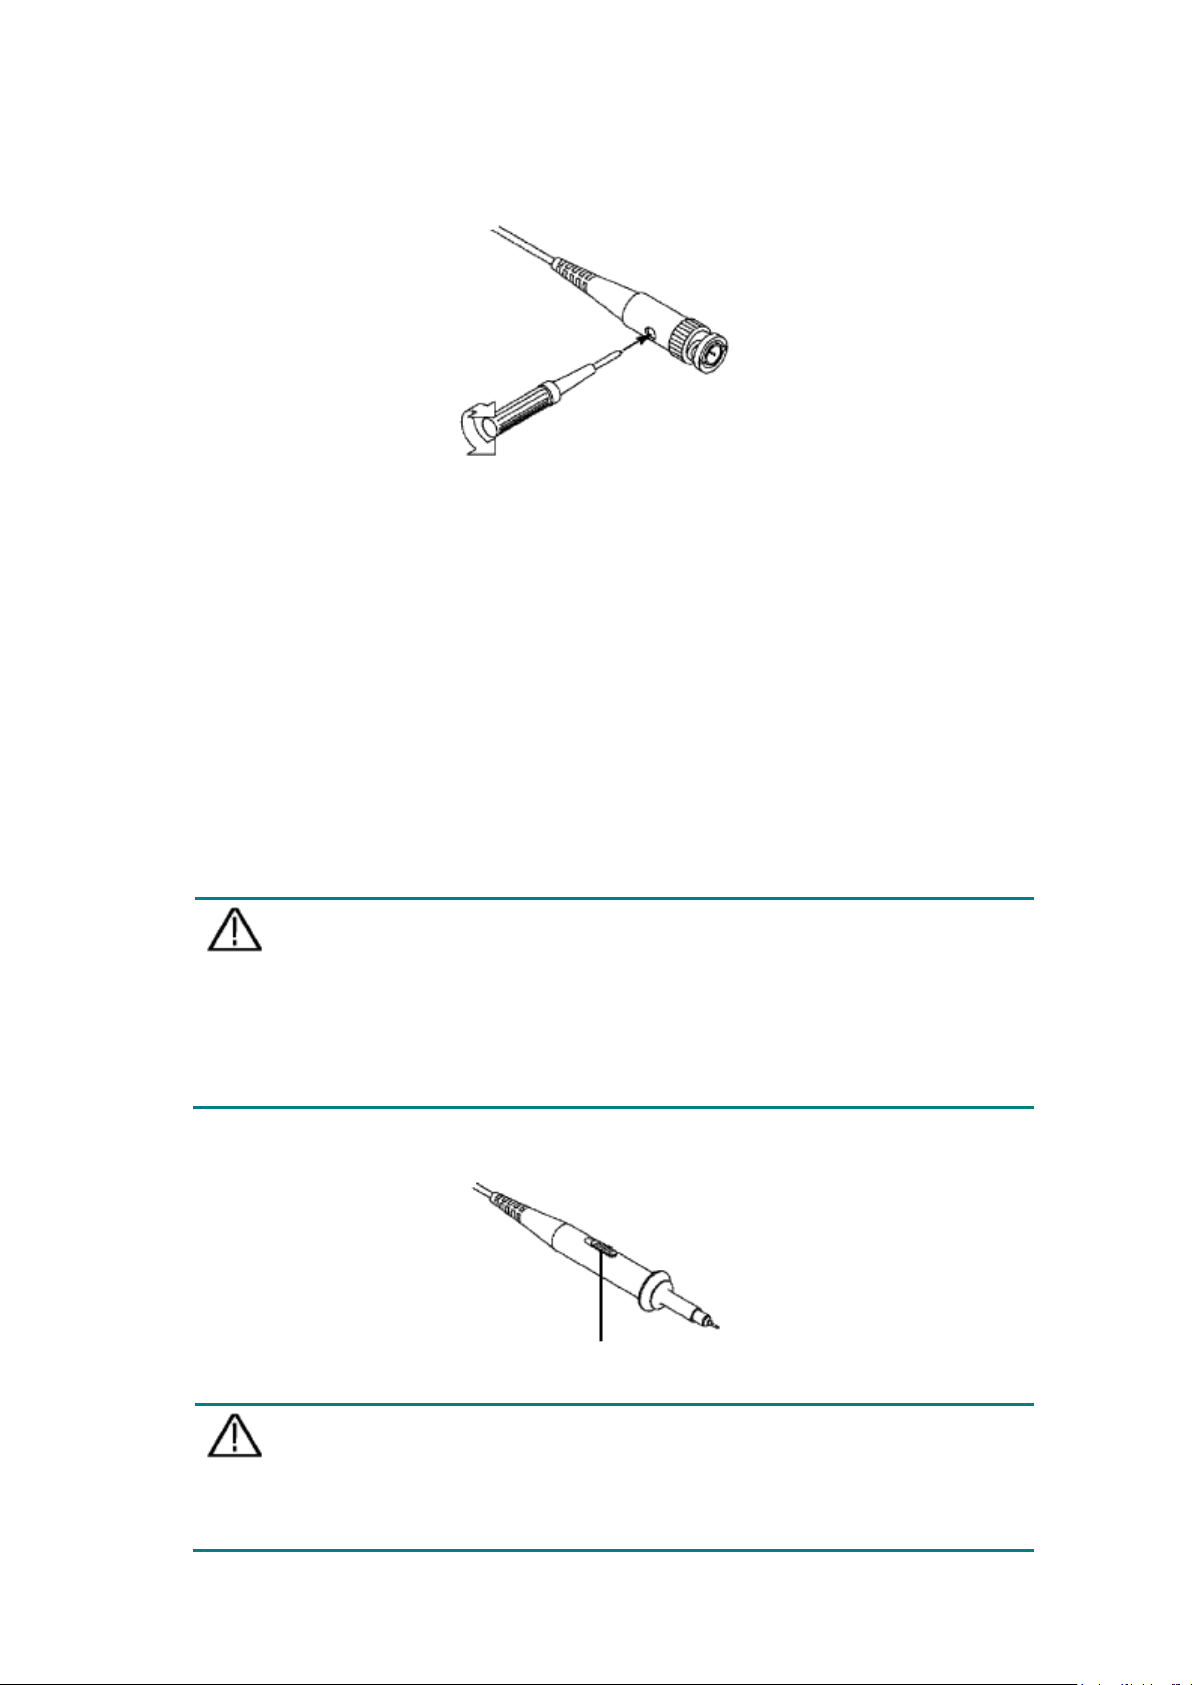
2. Check the displayed waveforms and regulate the probe till a correct
compensation is achieved (see Figure 3-6 and Figure 3-7).
Overcompensated Compensated correctly Under compensated
11
Page 17
3.Junior User Guidebook
Caution:
same as the menu selection of the probe attenuation coefficient in the
Caution:
Figure 3-6 Displayed Waveforms o f the Prob e Com pe ns ati o n
3. Repeat the steps mentioned if needed.
Figure 3-7 Adjust Probe
How to Set the Probe Attenuation Coefficient
The probe has sev eral att enuation coefficien ts, which wi ll influence t he verti cal scale
factor of the oscilloscope.
To change or check the probe attenuation coefficient on the menu of oscilloscope:
(1) Push the function menu button of the used channels (CH1 - CH4 button).
(2) Select Probe in the bottom menu; select Attenu in the right menu, turn the M
knob to select the proper value corresponding to the probe.
This setting will be valid all the time before it is changed again.
The default attenuation coefficient of the probe on the instrument is preset to
10X.
Make sure that the set value of the attenuation switch in the probe is the
oscilloscope.
The set values of the probe switch are 1X and 10X (see Figure 3-8).
Figure 3-8 Attenuation Switch
When the attenuation switch is set to 1X, the probe will limit the bandwidth
of the oscilloscope in 5MHz. To use the full bandwidth of the oscilloscope,
the switch must be set to 10X.
12
Page 18
3.Junior User Guidebook
connect the probe to the
Identify the Probe Attenuation C oe fficient Au tomatically
The oscilloscope can identify the probe attenuation coefficient of the 100:1
(impedance 5K±20%) or 10:1 (impedance 10K±20%) probe with the identifying
pin. When you attach the probe, the oscilloscope set the attenuation automatically on
the oscilloscope vertical menu for the channel to match the probe.
For example, if you attach a 10:1 probe with the identifying pin, the screen will
prompt "The probe attenuation factor is X10", and set the attenuation to 10X
automatically on the oscilloscope vertical menu for the channel.
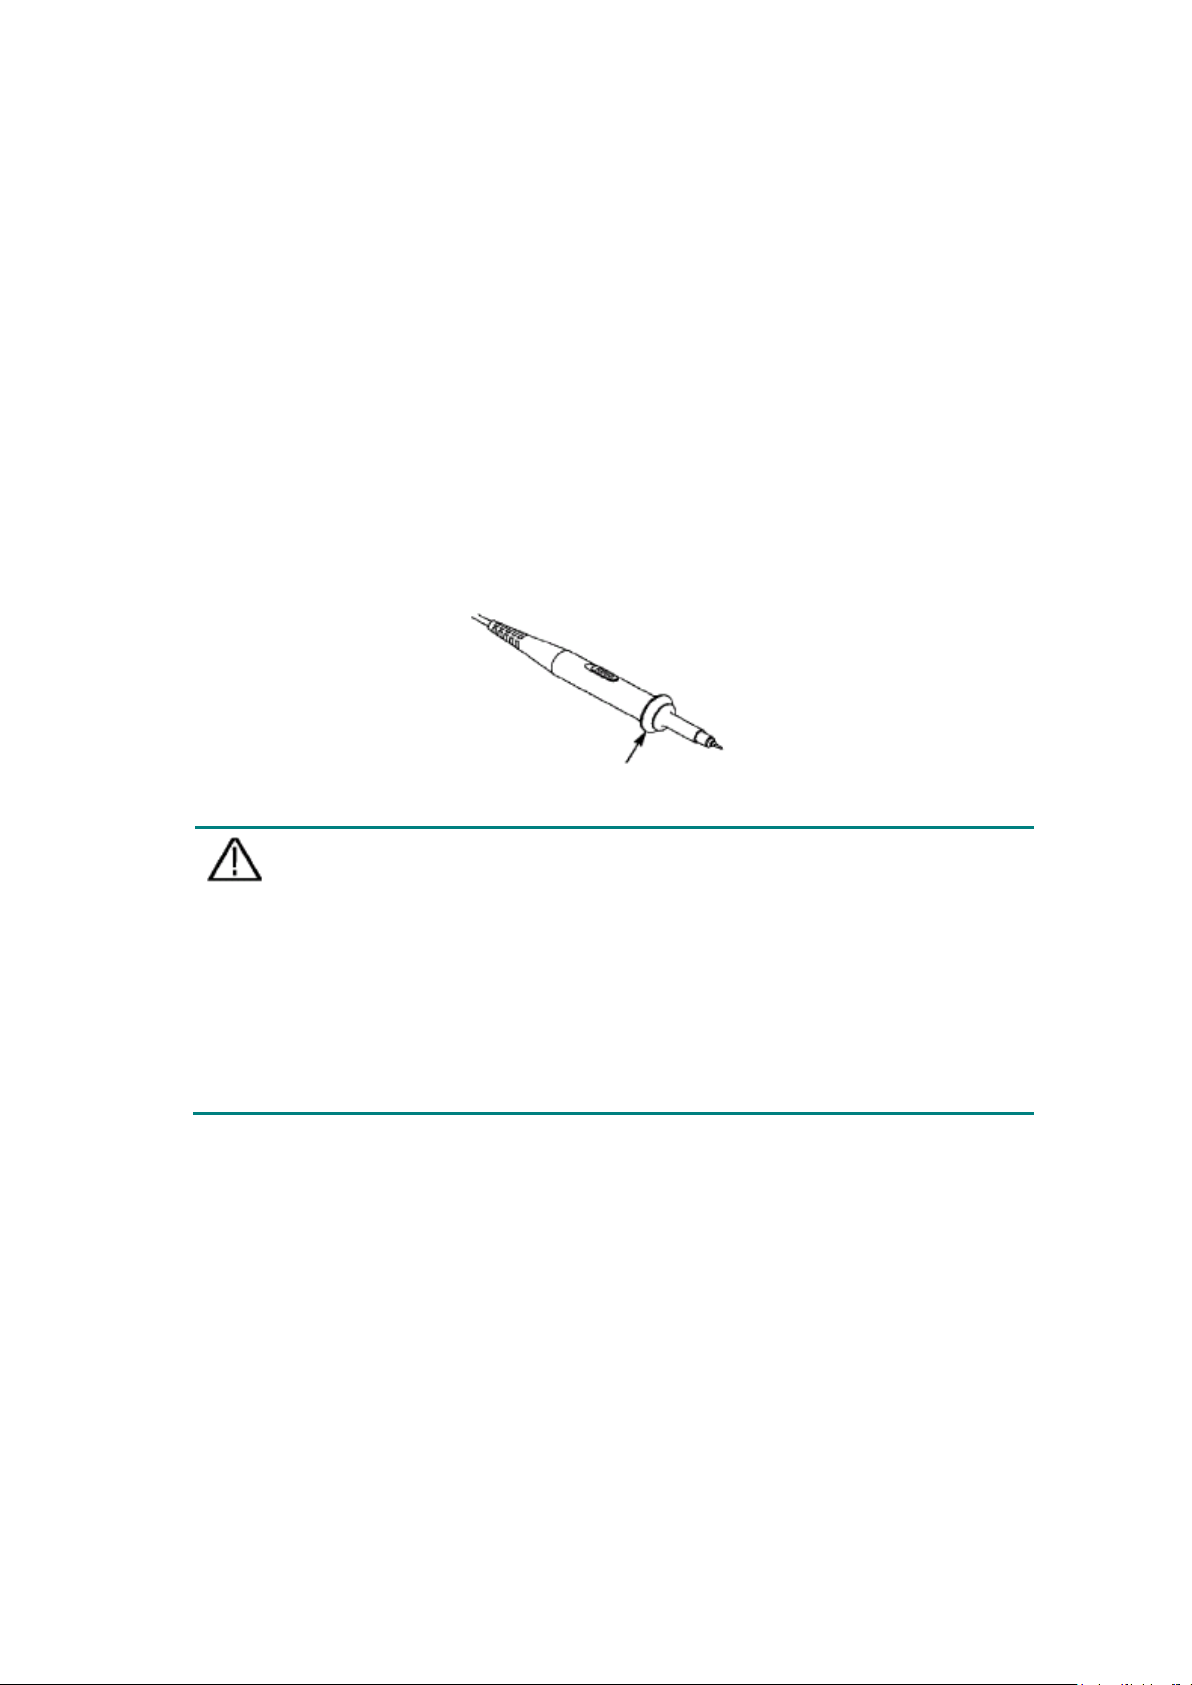
How to Use the Probe Safely
The safety guard ring around the probe bod y protects your finger against any electric
shock, shown as Figure 3-9.
Figure 3-9 Finger Guard
Warning:
To avoid electric shock, always keep your finger behind the safety guard
ring of the probe during the operation.
To protect you from suffering from the electric shock, do not touch any
metal part of the probe tip when it is connected to the power supply.
Before making any measurements, always
instrument and connect the ground terminal to the earth.
How to Implement Self-calibration
The self-calibration application can make the oscilloscope reach the optimum
condition rapidly to obtain the most accurate measurement value. You can carry out
this application program at any time. This program must be executed whenever the
change of ambient temperature is 5℃ or over.
Before performing a self-calibration, disconnect all probes or wires from the input
connector. Push the Utility button, select Function in the bottom menu, select Adjust.
in the left menu, select Self Cal in the bottom menu; run the program after everything
is ready.
13
Page 19
3.Junior User Guidebook
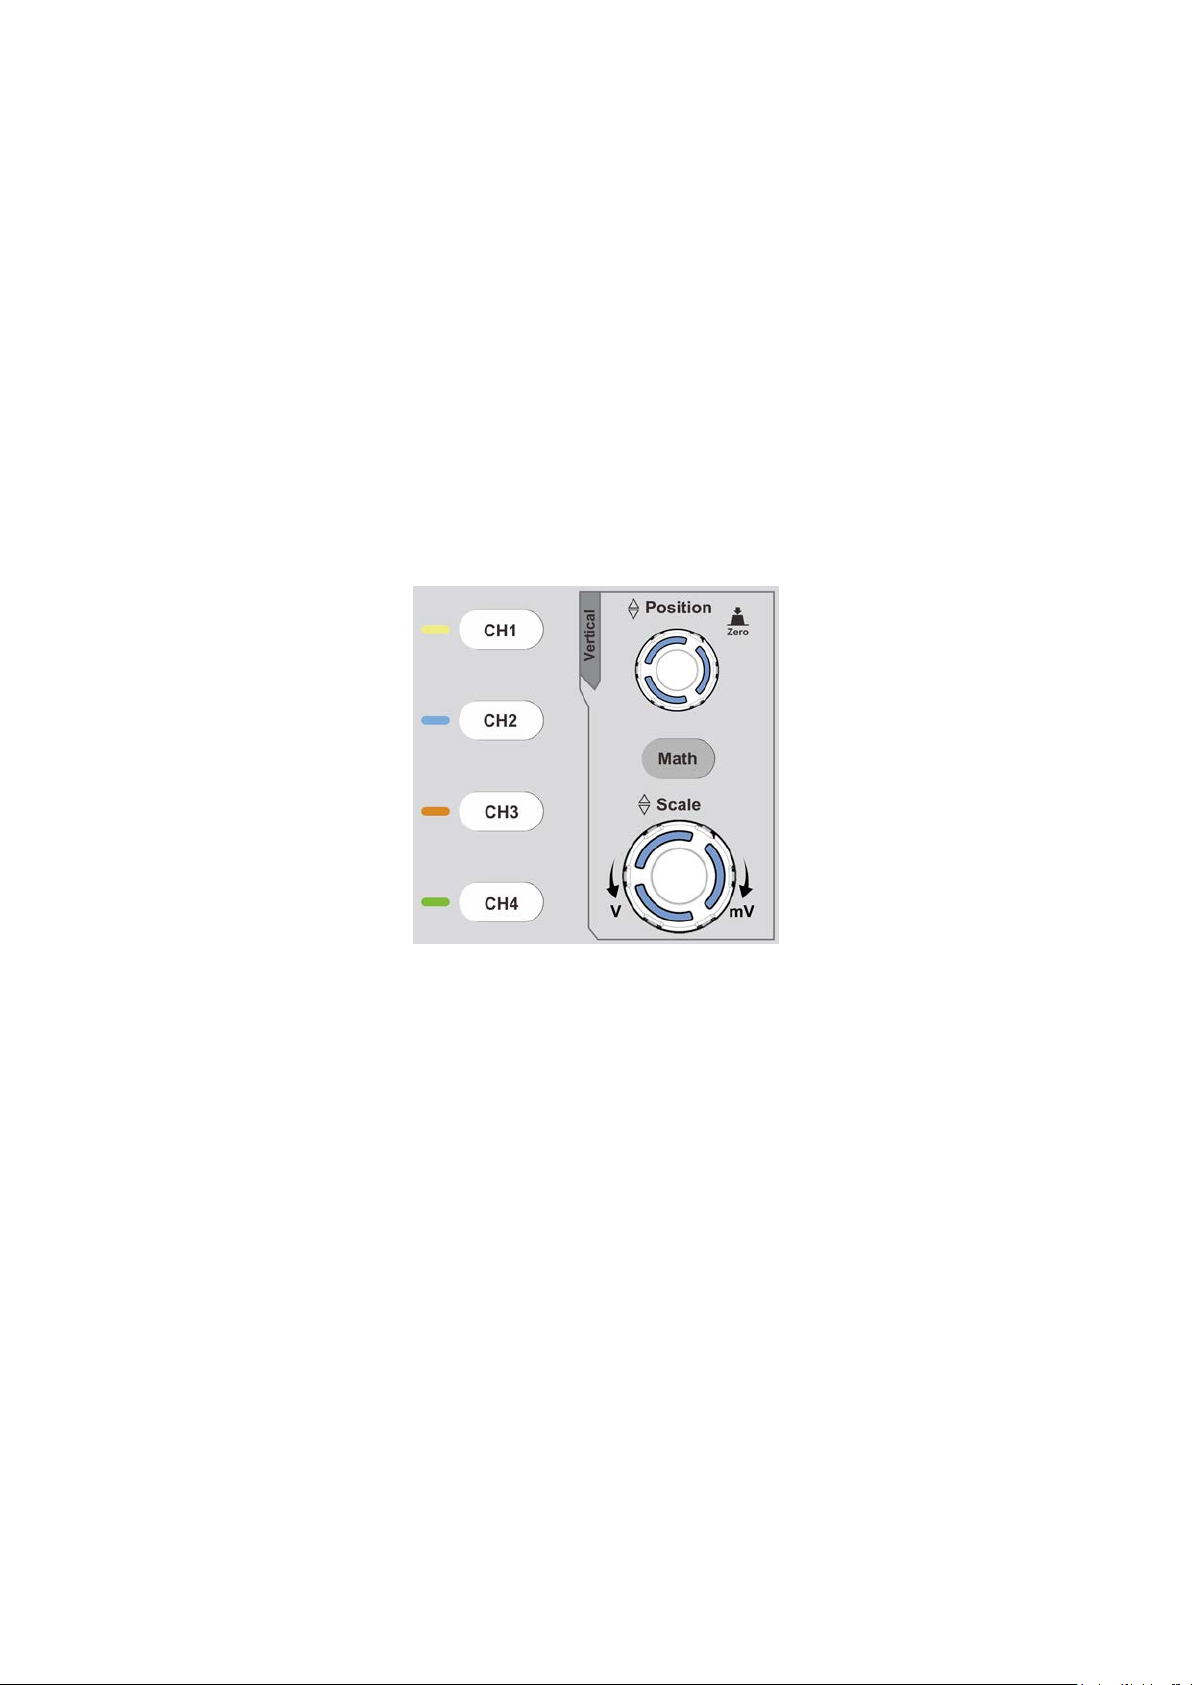
Introduction to the Vertical System
As shown in Figure 3-10, there are a few of buttons and knobs in Vertical Controls.
The 4 channels are marked by different colors which are also used to mark both the
corresponding waveforms on the screen and the channel input connectors. Press one
of the channel buttons to open the corresponding channel menu, and press again to
turn off the channel.
Press the Math button to display the math menu in the bottom. The pink M waveform
appears on the screen. Press again to turn off the math waveform.
The 4 channels use the same Vertical Position and Vertical Scal e knobs. If you want
to set the vertical scale and vertical position of a channel, please press CH1, CH2,
CH3 or CH4 at first to select the desired channel. Then turn the Vertical Position and
Vertical Scale knobs to set the values.
Figure 3-10 Vertical Control Zone
The following practices will gradually direct you to be familiar with the using of the
vertical setting.
1. Press CH1, CH2, CH3 or CH4 to select the desired channel.
2. Us e the Vertical Position knob to show the selected channel w aveform in the center
of the waveform window. The Vertical Position knob functions the regulating of the
vertical display position of the selected channel waveform . Thus, when the Vertical
Position knob i s rotated, the pointer of the earth datum point of the selected channel
is directed to move up and down following the waveform, and the position message at
the center of the screen would change accordingly.
Measuring Skill
If the channel is under the DC coupling mode, you can rapidly measure the DC
component of the signal through the observation of the difference between the wave
form and the signal ground.
If the channel is under the AC mode, the DC component would be filtered out. This
mode helps you display the AC component of the signal with a higher sensitivity.
14
Page 20
3.Junior User Guidebook
Vertical offset back to 0 shortcut key
Turn the Vertical Position knob to change the vertical display position of the selected
channel, and push the position knob to set the vertical display position back to 0 as a
shortcut key, this is especially helpful when the trace position is far out of the screen
and want it to get back to the screen center immediately.
3. Change the Vertical Setting and Observe the Consequent State Information Change.
With the information displayed in the status bar at the bottom of the waveform
window, you can determine any changes in the channel vertical scale factor.
Turn the Vertical Scale knob and change the "Vertical Scale Factor (Voltage
Division)" of the s electe d chann el, it can be found that the s cale factor of the selected
channel in the status bar has been changed accordingly.
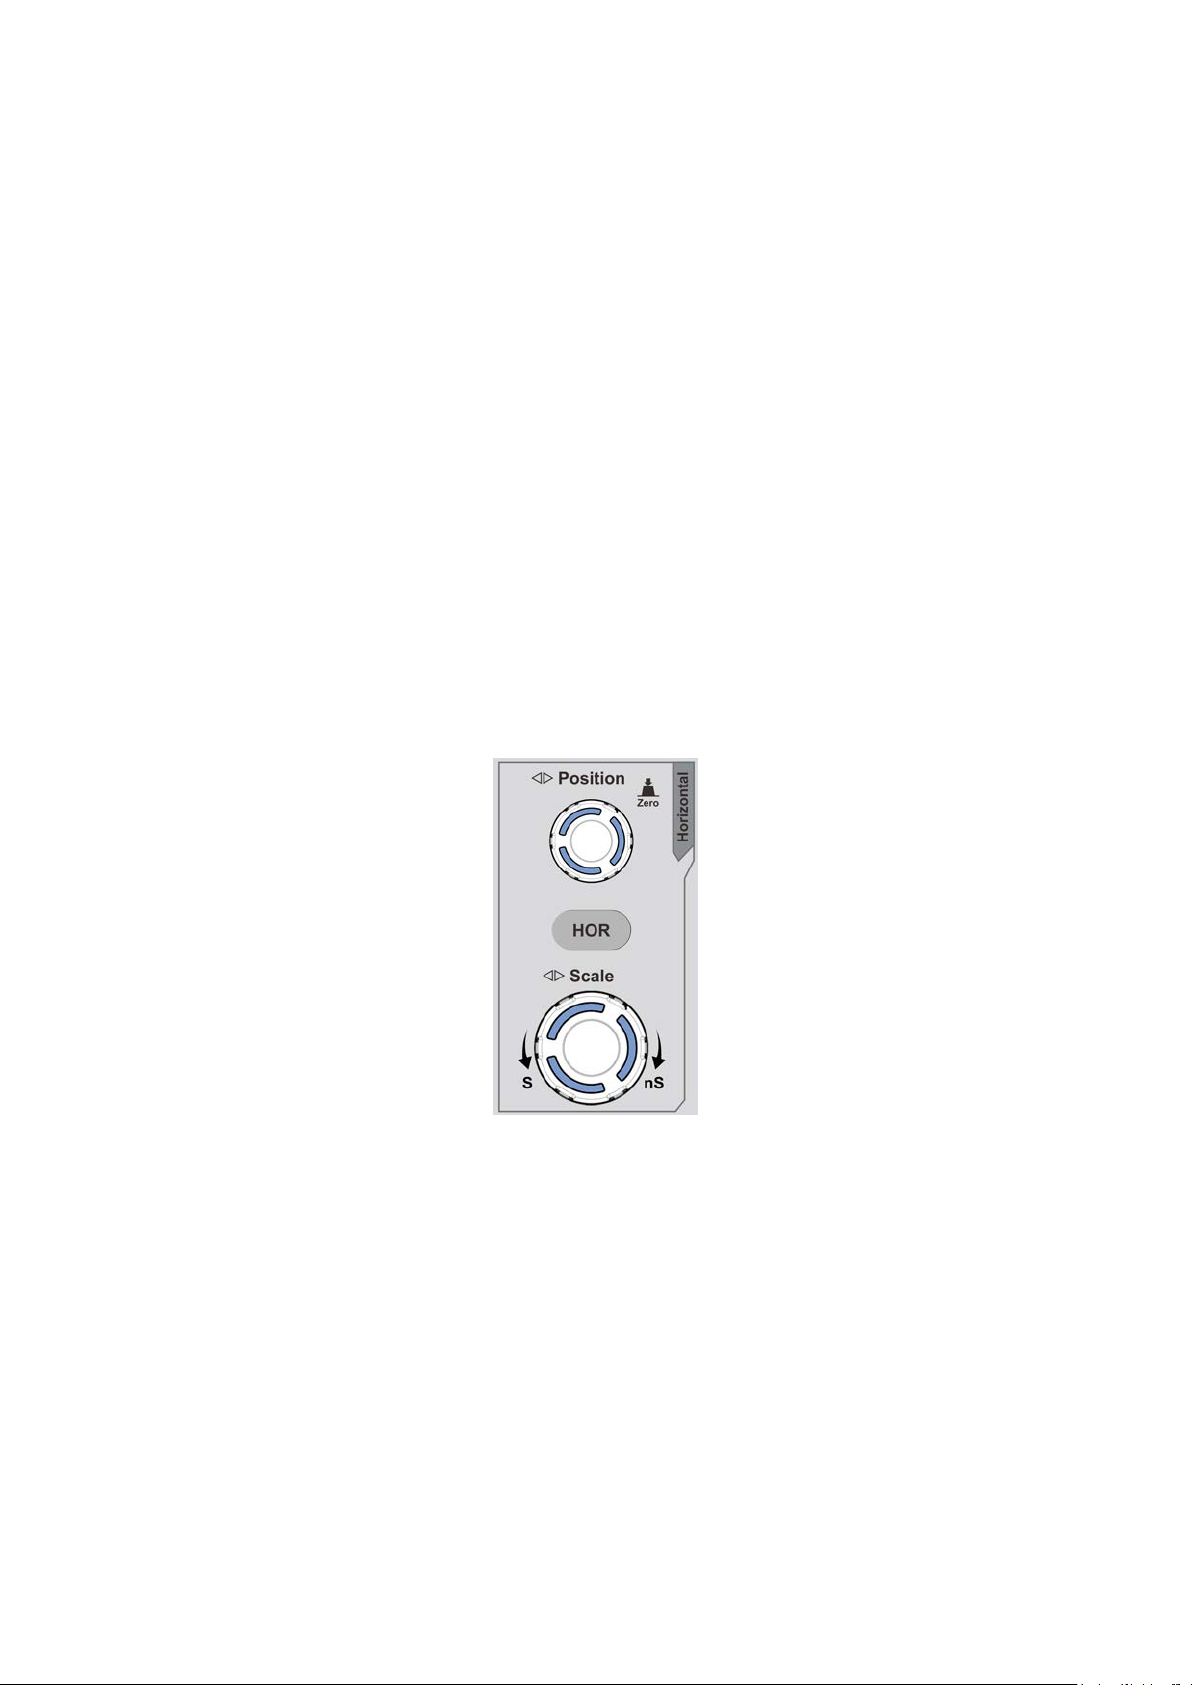
Introduction to the Horizontal System
Shown as Figure 3-11, there are a button and two knobs in the Horizontal Controls.
The following practices will gradually direct you to be familiar with the setting of
horizontal time base.
Figure 3-11 Horizontal Control Zone
1. Turn the Horizontal Scale knob to change the horizontal time base setting and
observe the consequent status information change. Turn the Horizontal Scale
knob to change the horizontal time base, and it can be found that the Horizontal
Time Base displayed in the status bar changes accordingly.
2. Us e the Horizontal Position knob to adjust the horizontal position of the signal
in the waveform window. The Horizontal Position knob is used to control the
triggering displacement of the signal or for other special applications. If it is
applied to triggering the displacement, it can be observed that the waveform
moves horizontally with the knob when you rotate the Horizontal Position knob.
Triggering displacement back to 0 shortcut key
Turn the Horizontal Position knob to change the horizontal position of channel
15
Page 21
3.Junior User Guidebook
and push the Horizontal Position knob to set the triggering displacement back to 0
as a shortcut key.
3. Push the Horizontal HOR button to switch between the normal mode and the
wave zoom mode.
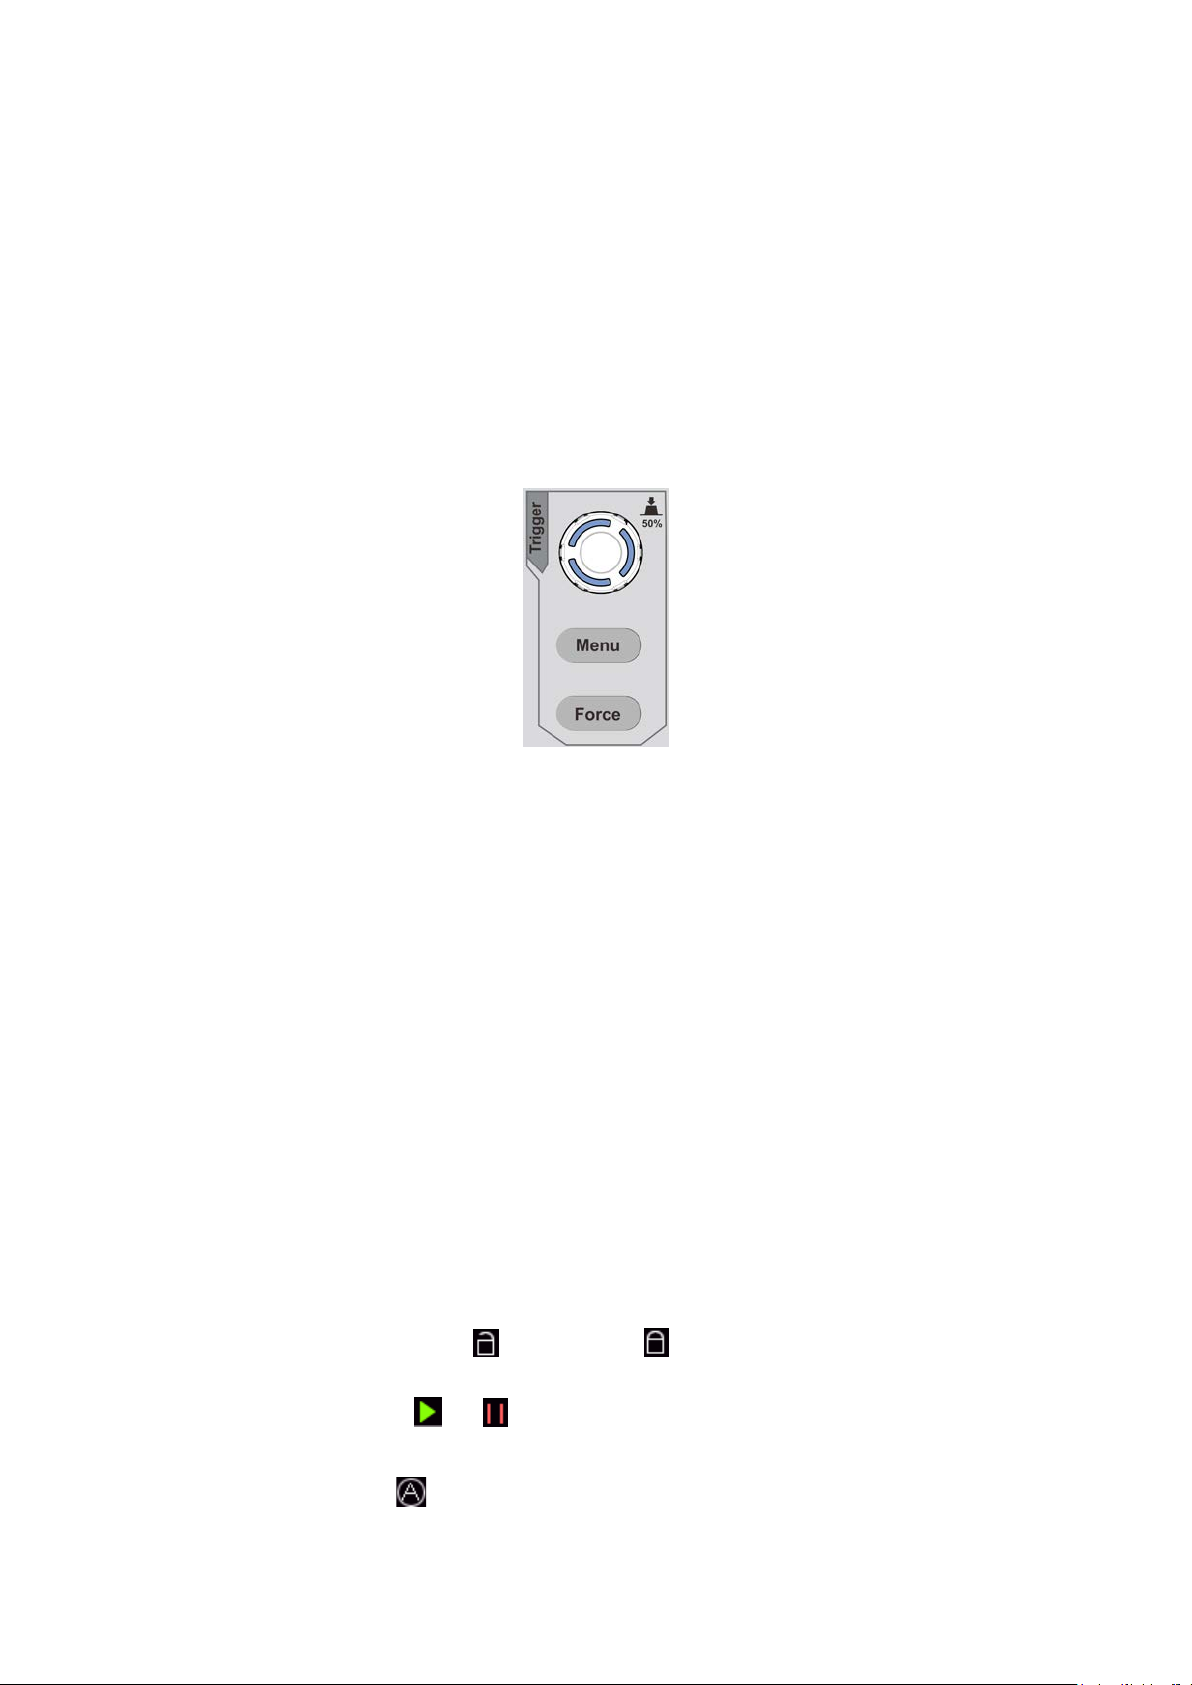
Introduction to the Trigger System
As shown in Figure 3-12, there are one knob and three buttons make up Trigger
Controls. The following practices will direct you to be familiar with the setting of the
trigger system gradually.
Figure 3-12 Trigger Control Zone
1. Push the Trigger Men u button and call out the trigger menu. With the operations
of the menu selection buttons, the trigger setting can be changed.
2. Use the Trigger Level knob to change the trigger level setting.
By turning the T rigger Level knob, the trigger indicator in the screen will move
up and down. With the movement of the trigger indicator, it can be observed that
the trigger level value displayed in the screen changes accordingly.
Note: Turning the Trigger Level knob can change trigger level value and it is
also the hotkey to set trigger level as the vertical mid point values of the
amplitude of the trigger signal.
3. Push the Force button to force a trigger signal, which is mainly applied to the
"Normal" and "Single" trigger modes.
Touchsc reen Co nt rols
You can control the oscilloscope by different gestures. The touchable icon at the top right
of the screen is used to enable (
The instruction of touchscreen controls is as below.
) or disable (
) the touchscreen controls.
Run/Stop: Click the or on the left top of the display area to run or stop the
waveform sampling.
Autoset: Click the on the left top of the display area to auto set.
Select a menu ite m: Touch the menu items in the bottom menu, or in the right menu,
16
Page 22
3.Junior User Guidebook
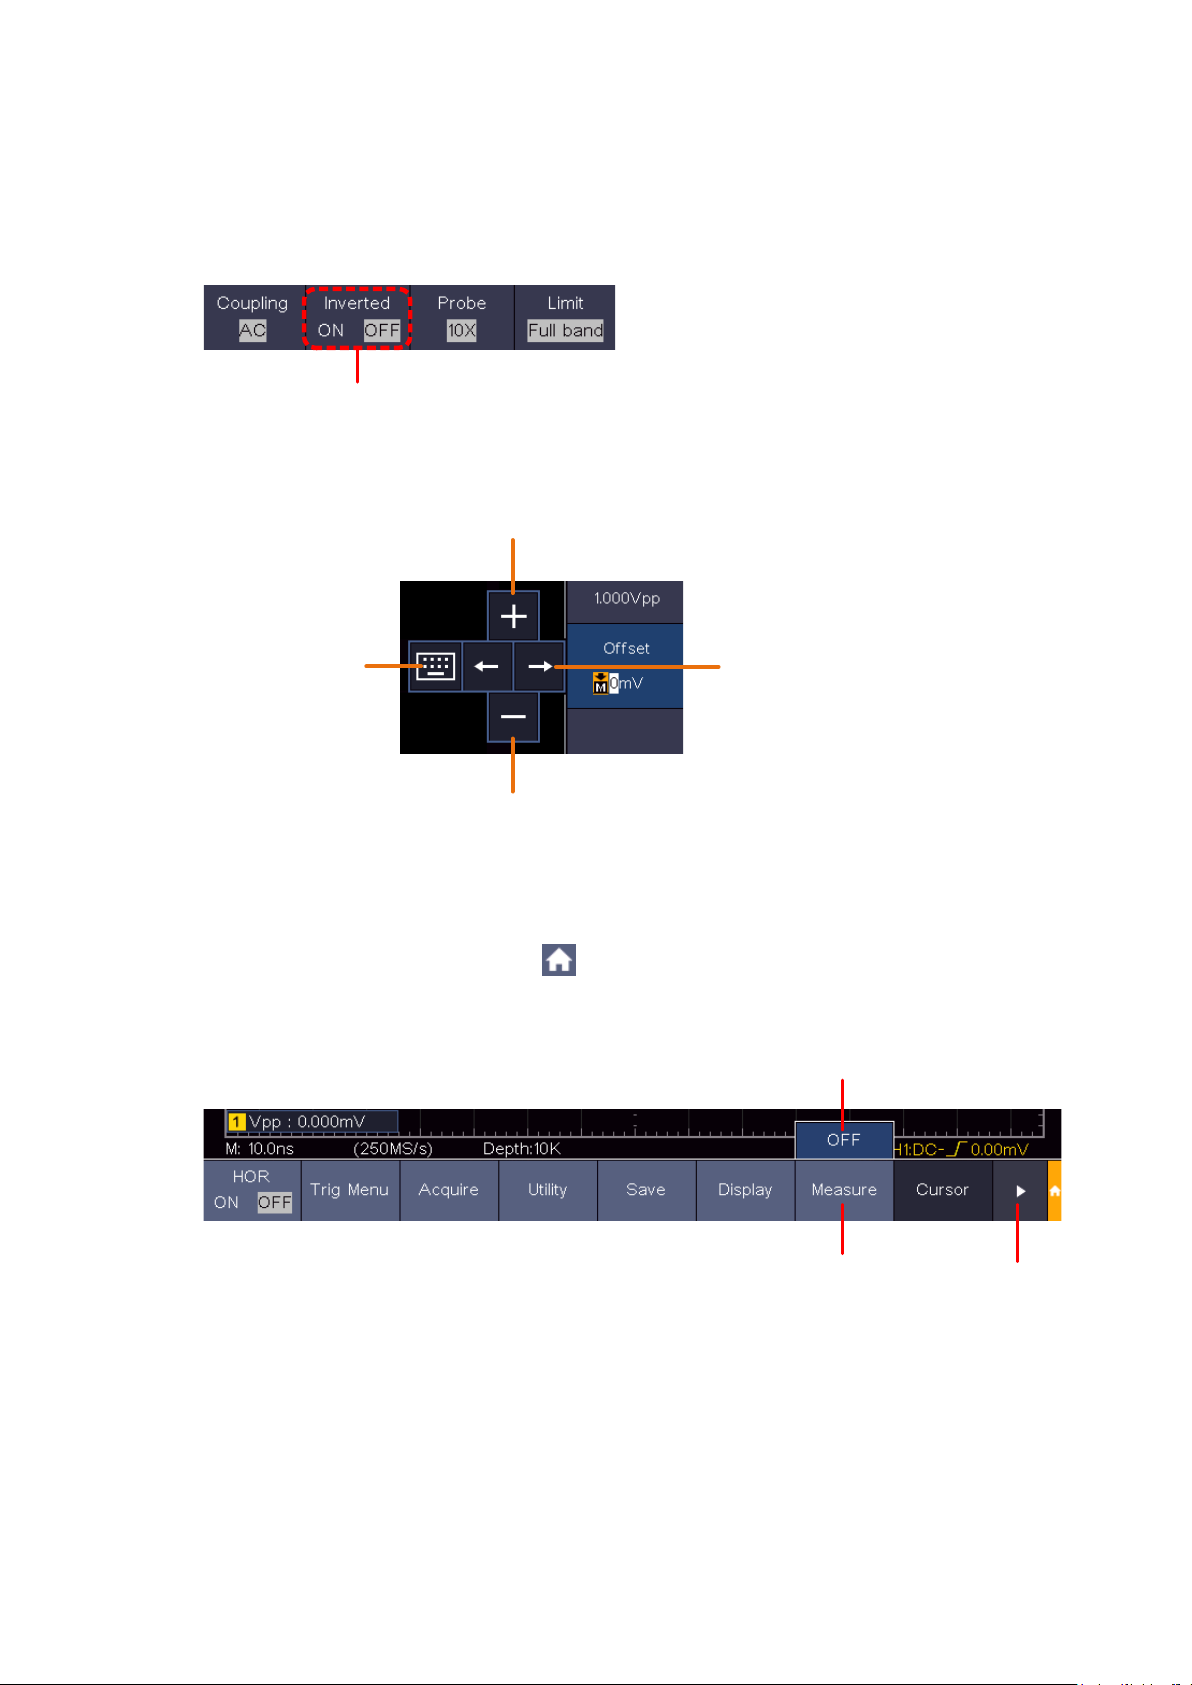
Press repeatedly to
switch the options
Click to increase the
value of cursor position
Move the cursor
Click to decrease the
value of cursor position
Click to show the
soft keyboard
Turn off the function
Enter the function
menu
Next page
or in the left menu.
Switch menu items: If there are options that can be switched on the menu, you can
repeatedly touch the area of the menu item to switch, or push the corresponding
button to switch. See figure below:
Adjust value on the menu item:
Scroll the list: If there is a scroll bar in the left menu or in the file system window,
you can swipe up and down to scroll the list.
Touchable menu pane: Click the
icon on the right bottom of the display area, a
shortcut menu will be shown. Click to enter the corresponding function menu.
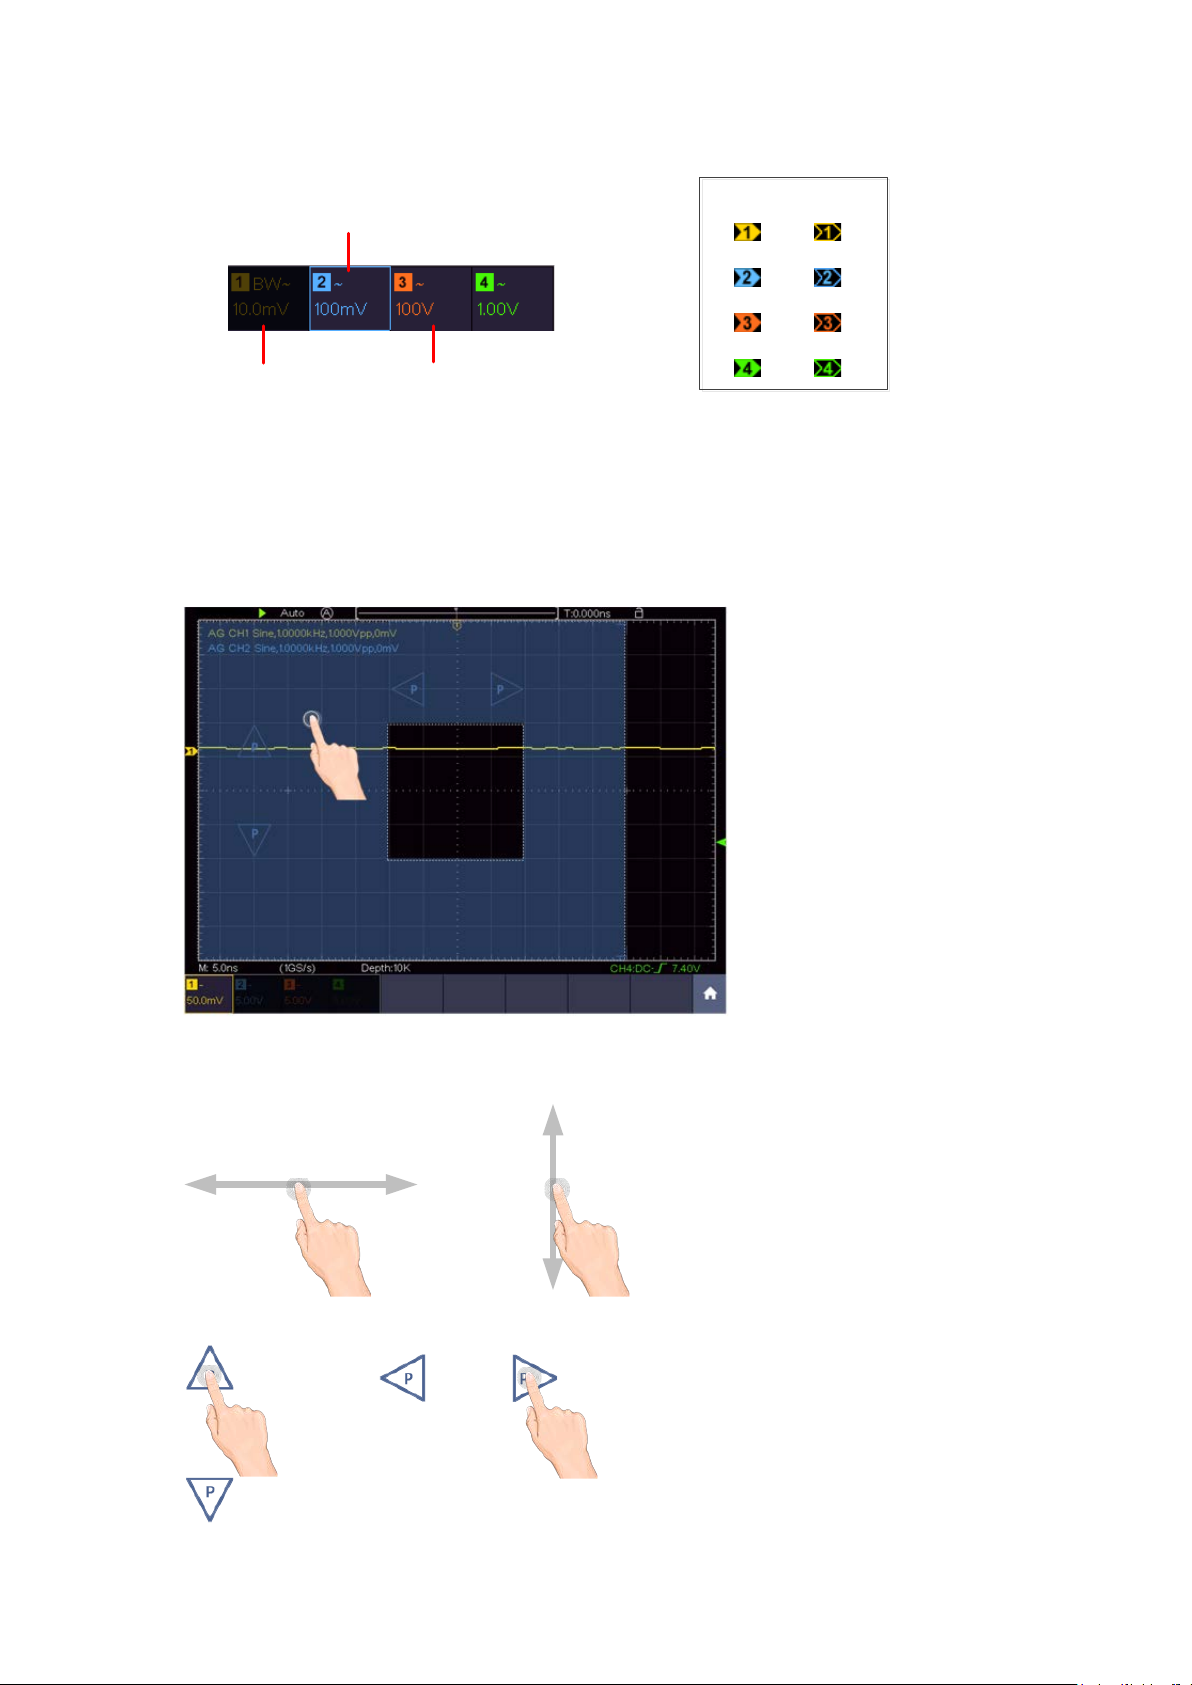
Set the channel status: C lick the channel on the left bottom of the display area, you
can turn on, select or turn off the channel. You can al so touch the channel pointer on
the left side of the display area to make it in selected state.
17
Page 23
3.Junior User Guidebook
Channel is off
Channel is on and selected
Channel is on
Selected
Unselected
Channel
pointer
Control the
horizontal position
Control the vertical position
of the selected channel
Set the horizontal and vertical position
Click in the area as shown in the figure below, the P icon will appear. Click anywhere
outside the icon to hide it.
Note: Swipe up/down or left/right in this area, you can make the icon appear and
control it.
When the P icon appears, in the full screen, swipe left/right to control the horizontal
position, swipe up/down to control the vertical position of the selected channel.
Click the P icon to fine-turn, long-press to adjust continuously.
18
Page 24
3.Junior User Guidebook
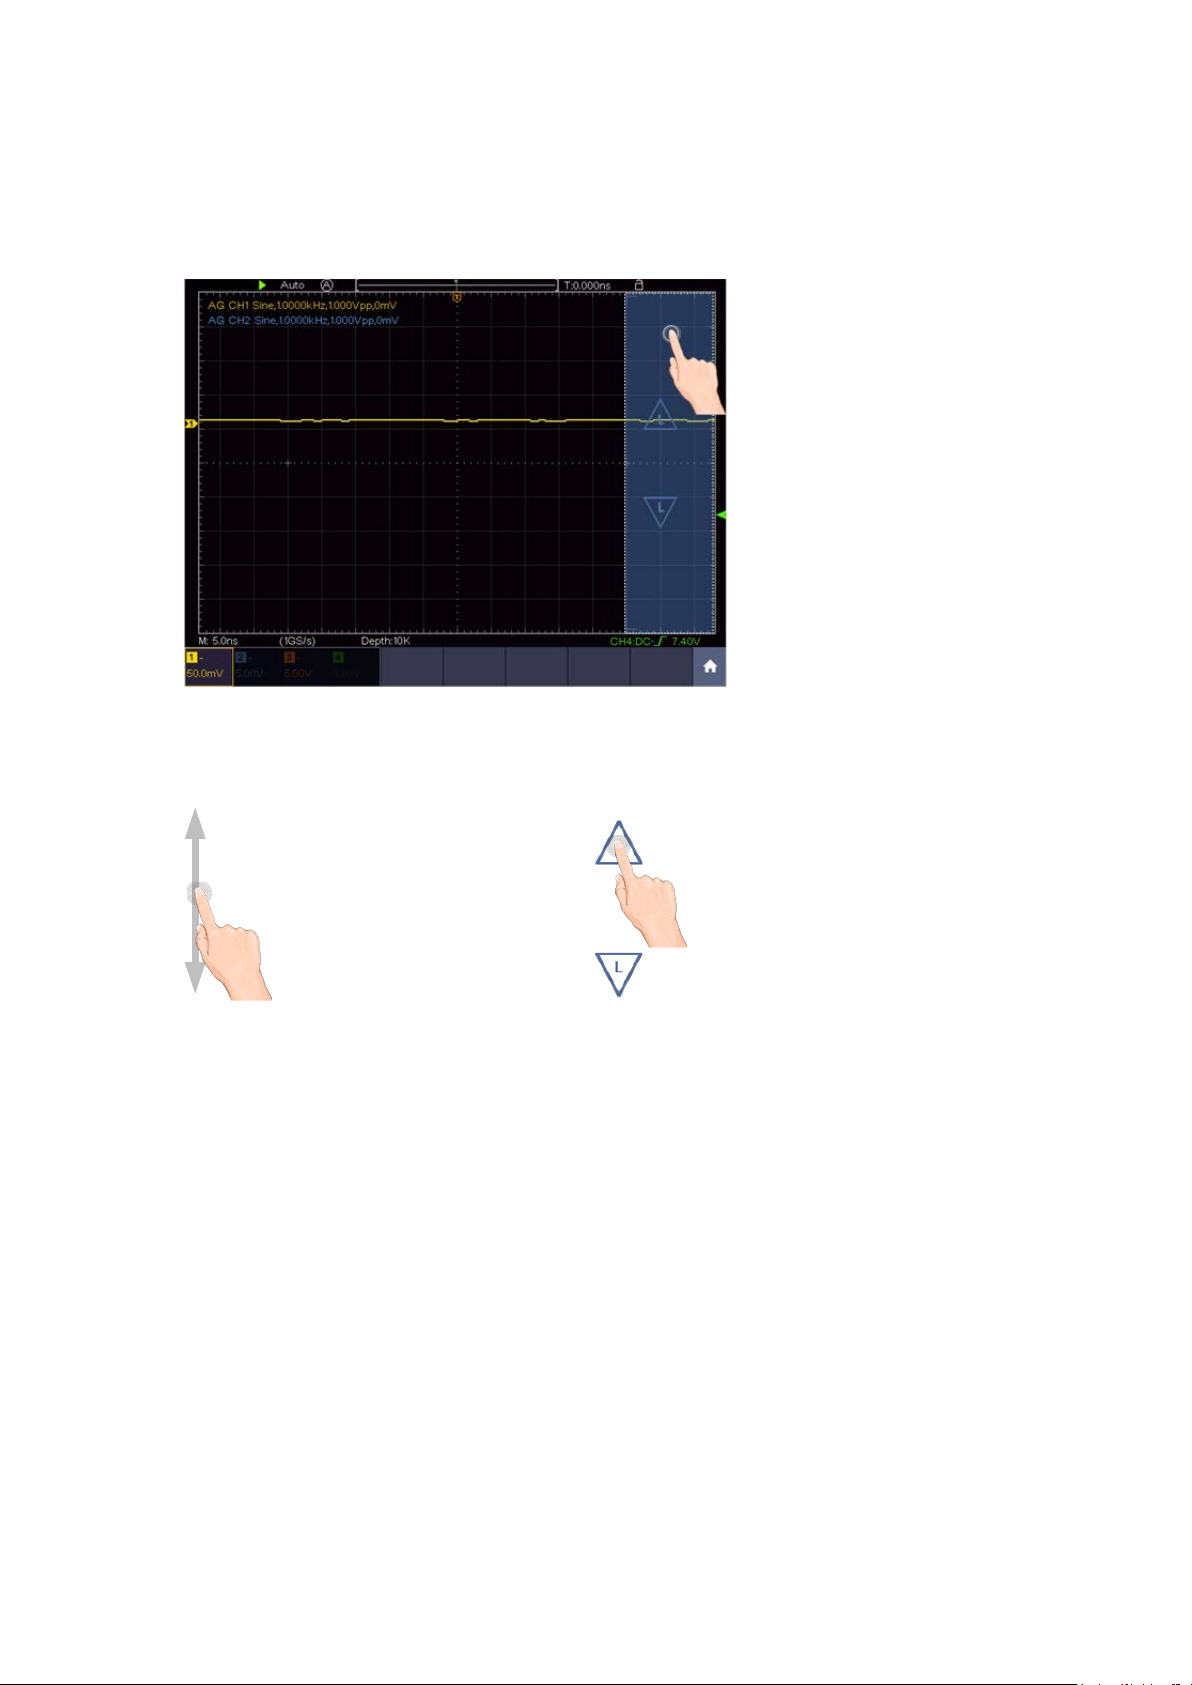
Control the trigger level of the
source in the trigger menu
Set the trigger level
Click in the area as shown in the figure below, the L icon will appear. Click anywhere
outside the icon to hide it.
Note: Swipe up/down in this area, you can make the icon appear and control it.
When the L icon appears, in the full screen, swipe up/down to control the trigger level
of the source in the trigger menu.
Click the L icon to fine-turn, long-press to adjust continuously.
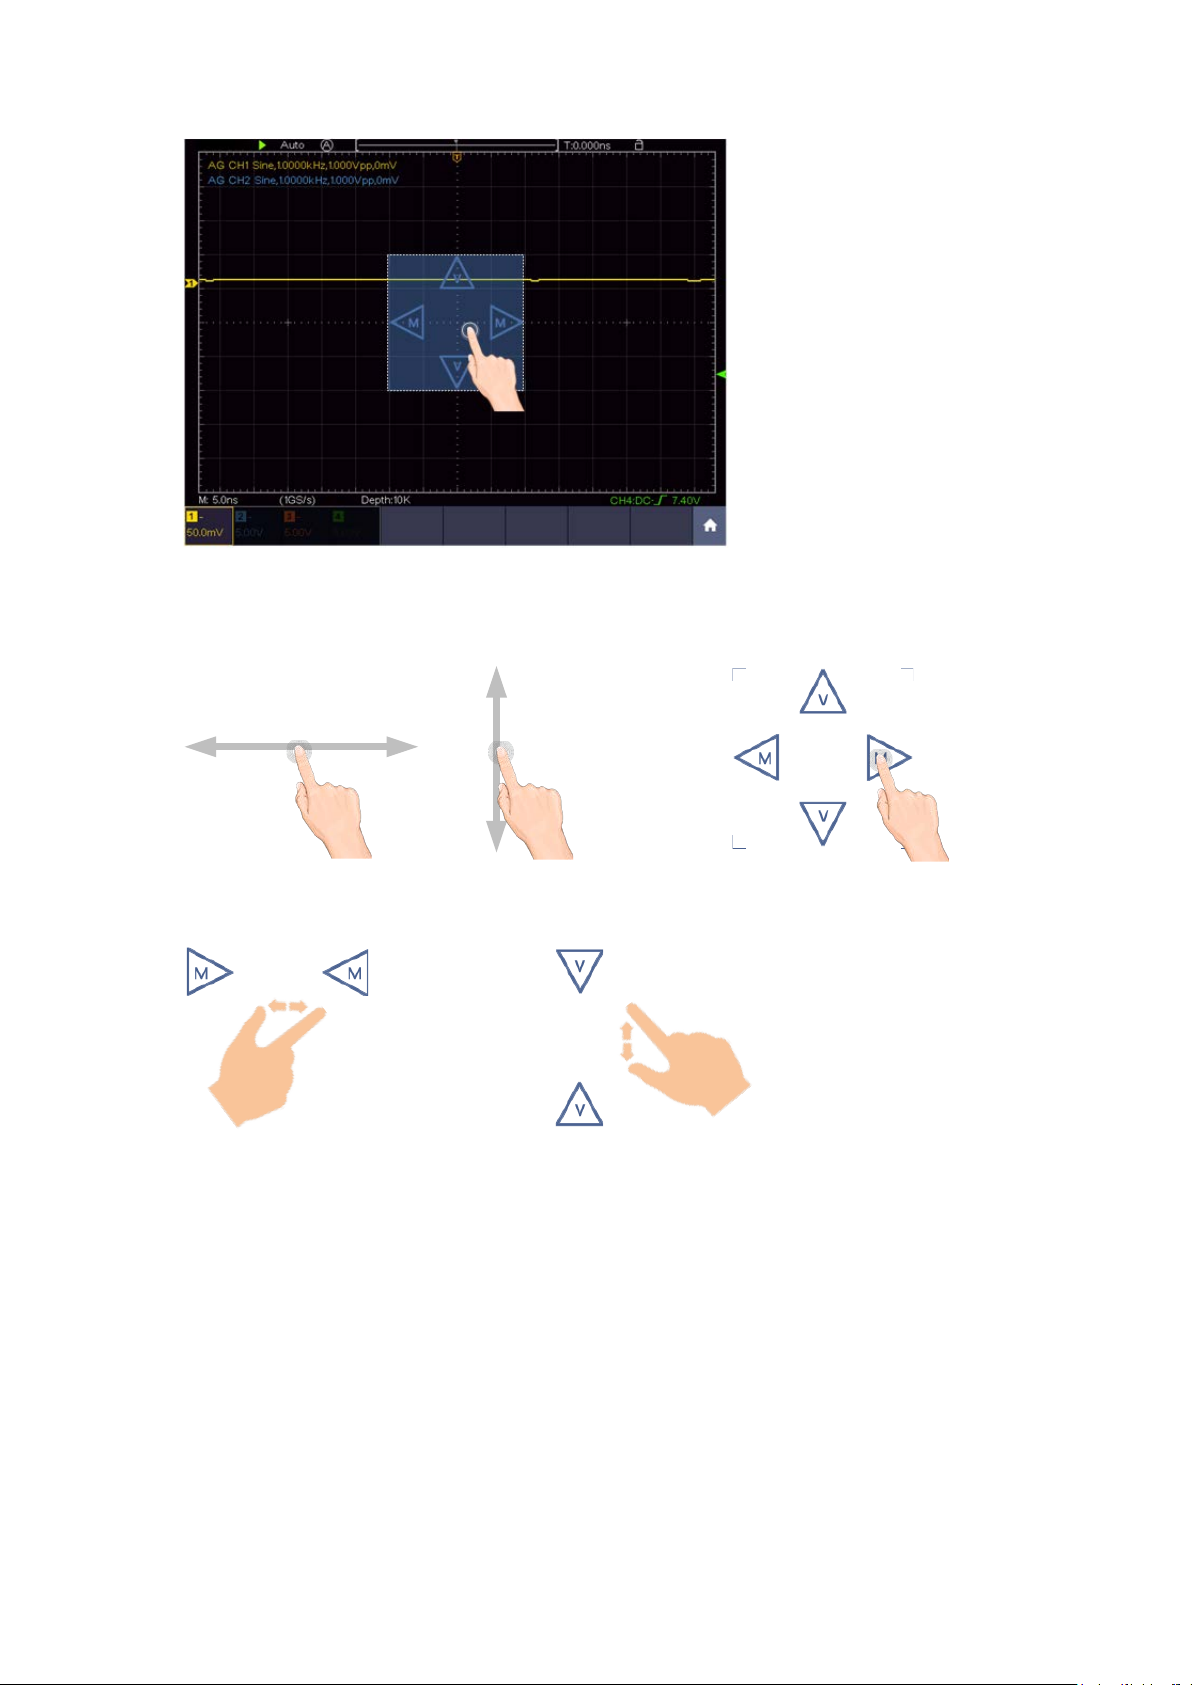
Set the time base and the voltage division
Click in the area as shown in the figure below, the M and V icons will appear. Click
anywhere outside the icon to hide it.
Note: Swipe up/down or left/right in this area, you can make the icon appear and
control it.
19
Page 25
3.Junior User Guidebook
Control the
time base
Control the
voltage division
When the M and V icons appear, in the full screen, swipe left/right to change the time
base, swipe up/down to change the voltage division of the selected channel.
Click the icons to fine-turn, long-press to adjust continuously.
In the full screen, pinch and spread horizontally to change the time base; pinch and
spread vertically to change the voltage division of the selected channel.
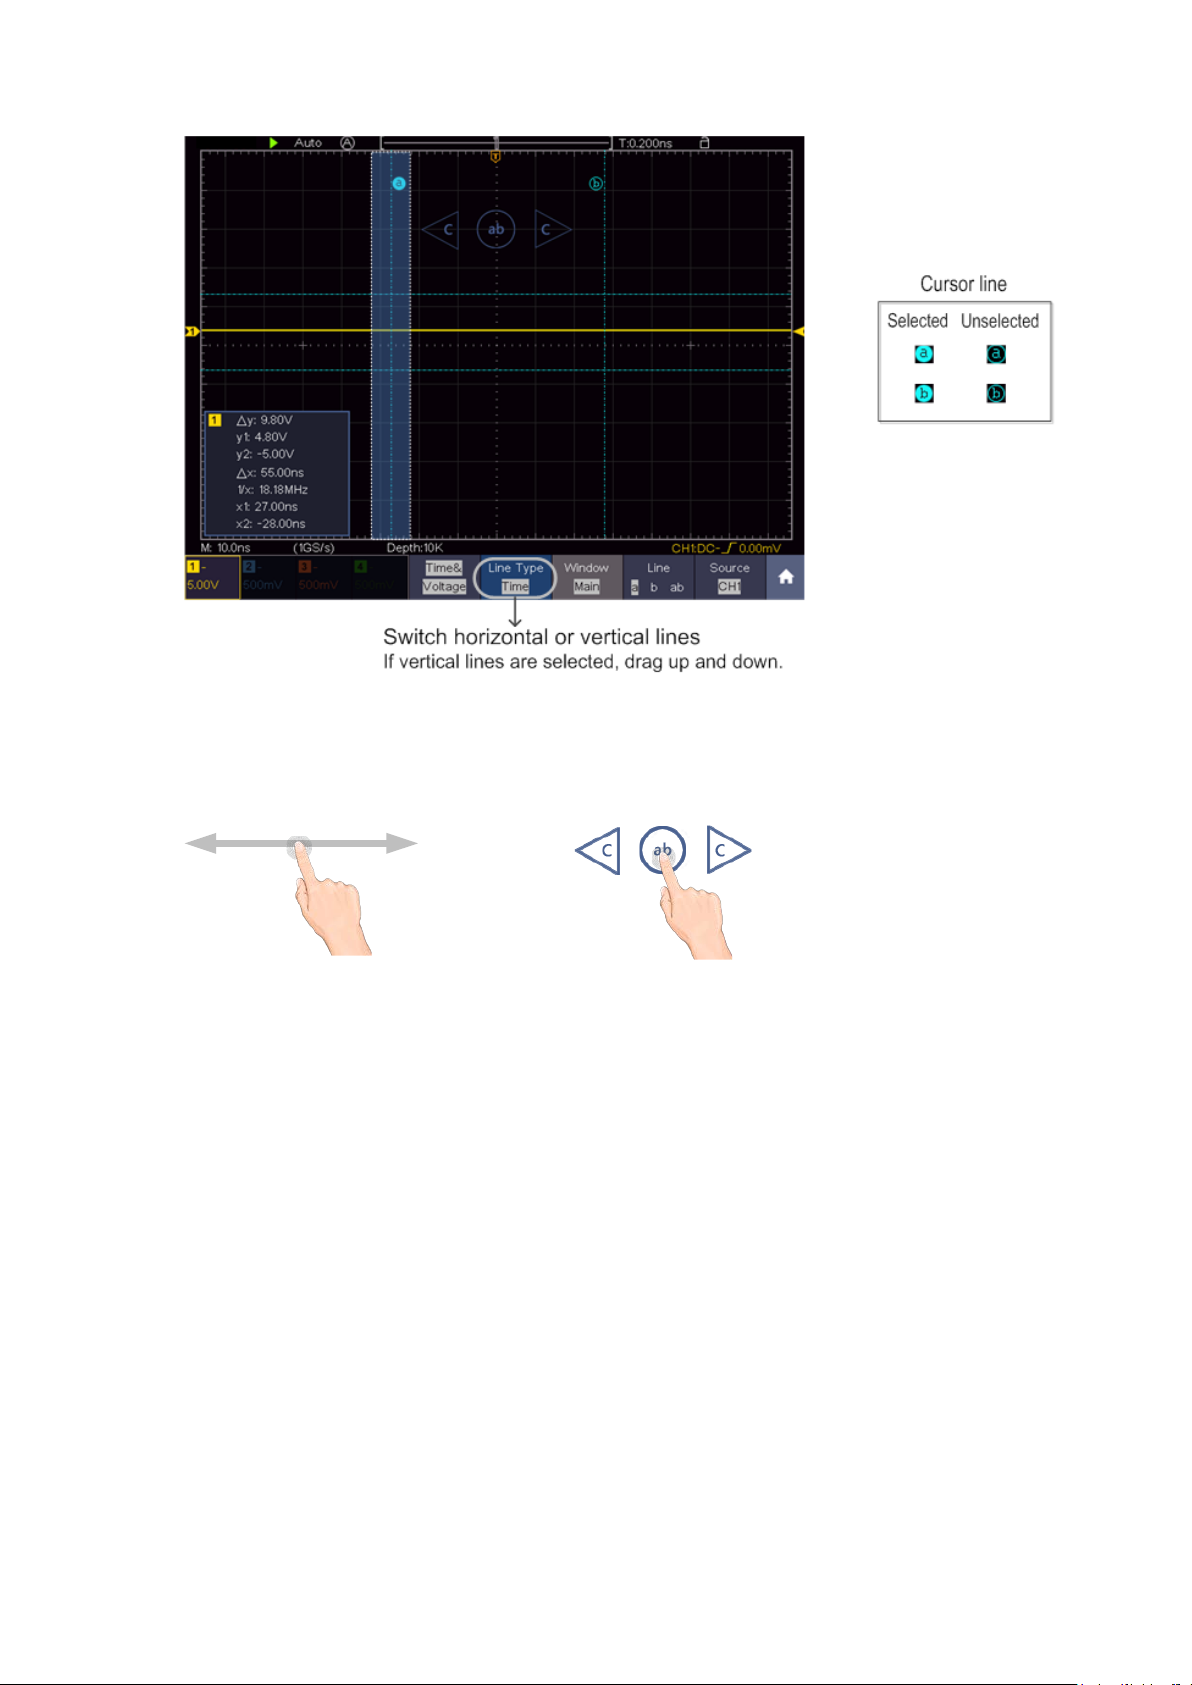
Measure with Cursors
Click nearby a cursor line as shown in the figure below, the line will be selected, and
the C icon will appear. Click anywhere outside the icon to hide it.
Note: Swipe in this area, you can make the icon appear and control it.
20
Page 26
3.Junior User Guidebook
Control the vertical
cursor line
Switch to select the lines
When the C icon appears, in the full screen, swipe left/right to move the selected line.
Click the direction buttons of the C icon to fine-turn, long-press to move continuously.
Click the center "ab" button to select a, b, or a&b.
21
Page 27

4.Advanced User Guidebook
4. Advanced User Guidebook
Up till now, you have already been familiar with the basic operations of the function areas,
buttons and knobs in the front panel of the oscilloscope. Based the introduction of the
previous Chapter, the user should have an initial knowledge of the determination of the
change of the oscilloscope setting through observing the status bar. If you have not been
familiar with the above-mentioned operations and methods yet, we advise you to read the
section of Chapter 3 "Junior User Guidebook".
This chapter will deal with the following topics mainly:
How to Set the Vertical System
How to Set the Horizontal System
How to Set the Trigger/Decoding System
How to Implement the Sampling Setup
How to Set the Display System
How to Save and Recall Waveform
How to Record/Playback Waveforms
How to Clone and Recall a waveform
How to Implement the Auxiliary System Function Setting
How to Update your Instrument Firmware
How to Measure Automatically
How to Measure with Cursors
How to Use Autoscale
How to Use Built-in Help
How to Use Executive Buttons
How to Print the Screen Image
It is recommended that you read this chapter carefully to get acquainted the various
measurement functions and other operation methods of the oscilloscope.
22
Page 28

4.Advanced User Guidebook
Function
Menu
Setting
Description
DC
GROUND
Pass both AC and DC components of the input signal.
Disconnect the input signal.
ON
OFF
Display inverted waveform.
Display original waveform.
Turn the M knob to set the Amps/Volts ratio. The
Volts/Amp ratio is automatically calculated.
Full band
Get full bandwidth.
Limit the channel bandwidth to 20MHz to reduce
How to Set the Vertical System
The VERTICAL CONTROLS includes three menu buttons such as CH1, CH2, CH3,
CH4 and Math, and two knobs such as Vertical Position, Vertical Scale.
Setting of CH1 - CH4
Each chann el has an indep endent verti cal men u and each item is set res pect ively bas ed on
the channel.
To turn waveform s on or off (ch ann e l, math)
Pushing the CH1, CH2, CH3, CH4, or Math buttons have the following effect:
• If the waveform is off, the waveform is turned on and its menu is displayed.
• If the waveform is on and its menu is not displayed, its menu will be displayed.
• If the waveform is on and its menu is displayed, the waveform is turned off and its menu
goes away.
The description of the Channel Menu is shown as the following list:
Coupling
Inverted
Probe
Limit
1. To set channel coupling
AC
Attenu
MeasCurr
A/V (mA/V)
V/A (mV/A)
20M
0.001X
to
1000X
YES
NO
Block the DC component of the input signal.
Step by 1 – 2 – 5. Match this to the probe attenuation
factor to have an accurate reading of vertical scale.
If you are meas uring current by probing the voltage
drop across a resistor, choose YES.
range is 100 mA/V - 1 KA/V.
Amps/Volts ratio = 1/Resistor value
display noise.
Taking the Channel 1 for example, the measured signal is a square wave signal
containing the direct current bias. The operation steps are shown as below:
(1) Push the CH1 button to show the CH1 SETUP menu.
(2) Select Coupling in the bottom menu.
23
Page 29

4.Advanced User Guidebook
(3) Select DC in the right menu. Both DC and AC components of the signal are passed.
(4) Select AC in the right menu. The direct current component of the signal is blocked.
2. To adjust the probe attenuation
For correct measu rements, the attenu ation coefficien t settings in the operating menu of
the Channel should always match what is on the probe (see "How to Set the Probe
Attenuation Coefficient" on P12). If the attenuation coefficient of the probe is 1:1, the
menu setting of the input channel should be set to X1.
Take the Channel 1 as an example, the attenuation coefficient of the probe is 10:1, the
operation steps are shown as follows:
(1) Push the CH1 button to show the CH1 SETUP menu.
(2) Select Probe in the bottom menu. Select Attenu in the right menu, turn the M knob
to set it as 10×.
3. To measure current by probing the voltage drop across a resistor
Take the Channel 1 as an ex ample, if you are measuring current by probing the voltage
drop across a 1Ω resistor, the operation steps are shown as follows:
(1) Push the CH1 button to show CH1 SETUP menu.
(2) Select Probe in the bottom menu. In the right menu, set MeasCurr as YES, the
A/V radio menu will appear below. Select it; turn the M knob to set the Amps/Volts
ratio. Amps/Volts ratio = 1/Resistor value. Here the A/V radio should be set to 1.
4. To invert a waveform
Waveform inverted: the displayed signal is turned 180 degrees against the phase of the
earth potential.
Taking the Channel 1 for example, the operation steps are shown as follows:
(1) Push the CH1 button to show the CH1 SETUP menu.
(2) Select Inverted in the bottom menu, switch to ON. th e waveform is inverted. Push
again to switch to OFF, the waveform goes back to its original one.
5. To set bandwidth limit
When high frequency components of a waveform are not important to its analysis, the
bandwidth limit control can be used to reject frequencies above 20 MHz.
Taking the Channel 1 for example, the operation steps are shown as below:
(1) Push the CH1 button to show CH1 SETUP menu.
(2) Select Limit in the bottom menu.
(3) Select Full band in the right menu. The high frequency of the signal will be
allowed to pass.
(4) Select 20M in the right menu. The bandwidth is limited to 20 MHz. The
frequencies above 20MHz will be rejected.
24
Page 30

4.Advanced User Guidebook
Function Menu
Setting
Description
CH1
CH4
Select the sign of mathematical
CH1
CH4
Vertical
(V/div)
Turn the M knob to adjust the vertical divis ion of the Math
waveform
CH1
CH4
Hamming
Bartlett
Degrees
Position value
Switch to select the horizontal position or
M knob to adjust it
Switch to select the vertical position or
voltage division of the FFT waveform,
turn the M knob to adjust it
Use Mathematical Manipulation Function
The Mathematical Manipulation function is used to show the results of the addition,
multiplication, division and subtraction operations between two channels, the FFT
operation for a channel, advanced math feature including Intg, Diff, Sqrt, user defined
function, and digital filter. Press the Math button to display the menu on the bottom.
The Waveform Calculation menu:
Waveform
Math
Factor1
Sign + - * /
Factor2
Vertical
(div)
Source
Turn the M knob to adjust the vertical position of the Math
waveform
CH2
CH3
CH2
CH3
CH2
CH3
Select the signal source of the factor1
manipulation
Select the signal source of the factor2
Select the FFT source.
Rectangle
Window
FFT
Format
Hori (Hz)
Vertical
Blackman
Hanning
Kaiser
V RMS
Decibels
Radian
Time base value/
Position value
Division value/
25
Select window for FFT.
V RMS and Decibels are
time base of the FFT waveform, turn the
Page 31

4.Advanced User Guidebook
User
Function
CH1
CH2
Only the signals whose frequencies are
off frequency
can pass the filter.
Only the signals whose frequencies are
greater than the current cutoff frequency
can pass the filter.
Only the signals whose frequencies are
and lower than the current cutoff
frequency upper can pass the filter.
Only the signals whose frequencies are
lower than the current cutoff frequency
ent cutoff
frequency upper can pass the filter.
Retangular
Blackman
cut-off
upper down
Vertical
(div)
Turn the M knob to adjust the vertical
position of Math waveform
Enable or disable FFT peak search.
peak.
Intg, Diff, Sqrt, and user defined function
DIR
channel
type
window
low-pass
high-pass
band-pass
band-reject
Tapered
Triangular
Hanning
Hamming
Select channel
lower than the current cut-
greater than the cutoff frequency down
down or greater than the curr
Select window for digital filter
FFT Peak
fre
or
ON
OFF
Turn the M knob to set cut-off frequency
Dynamic marker ▽ marks the FFT
Waveform math
Taking the additive operation between Channel 1 and Channels 2 for example, the
operation steps are as follows:
1. Press the Math button to display the math menu in the bottom. The pink M waveform
appears on the screen.
2. Select Waveform Math in the bottom menu.
3. In the right menu, select Factor1 as CH1.
4. Select Sign as + in the right menu.
5. In the right menu, select Factor2 as CH2.
26
Page 32
4.Advanced User Guidebook
Channel
Confirm
Clear
Operators
Integral
Differential Square root
Expression
6. Select Vertical (div) in the right menu, turn the M knob to adjust the vertical position of
Math waveform.
7. Select Vertical (V/div) in the right menu, turn the M knob to adjust the vertical division
of Math waveform.
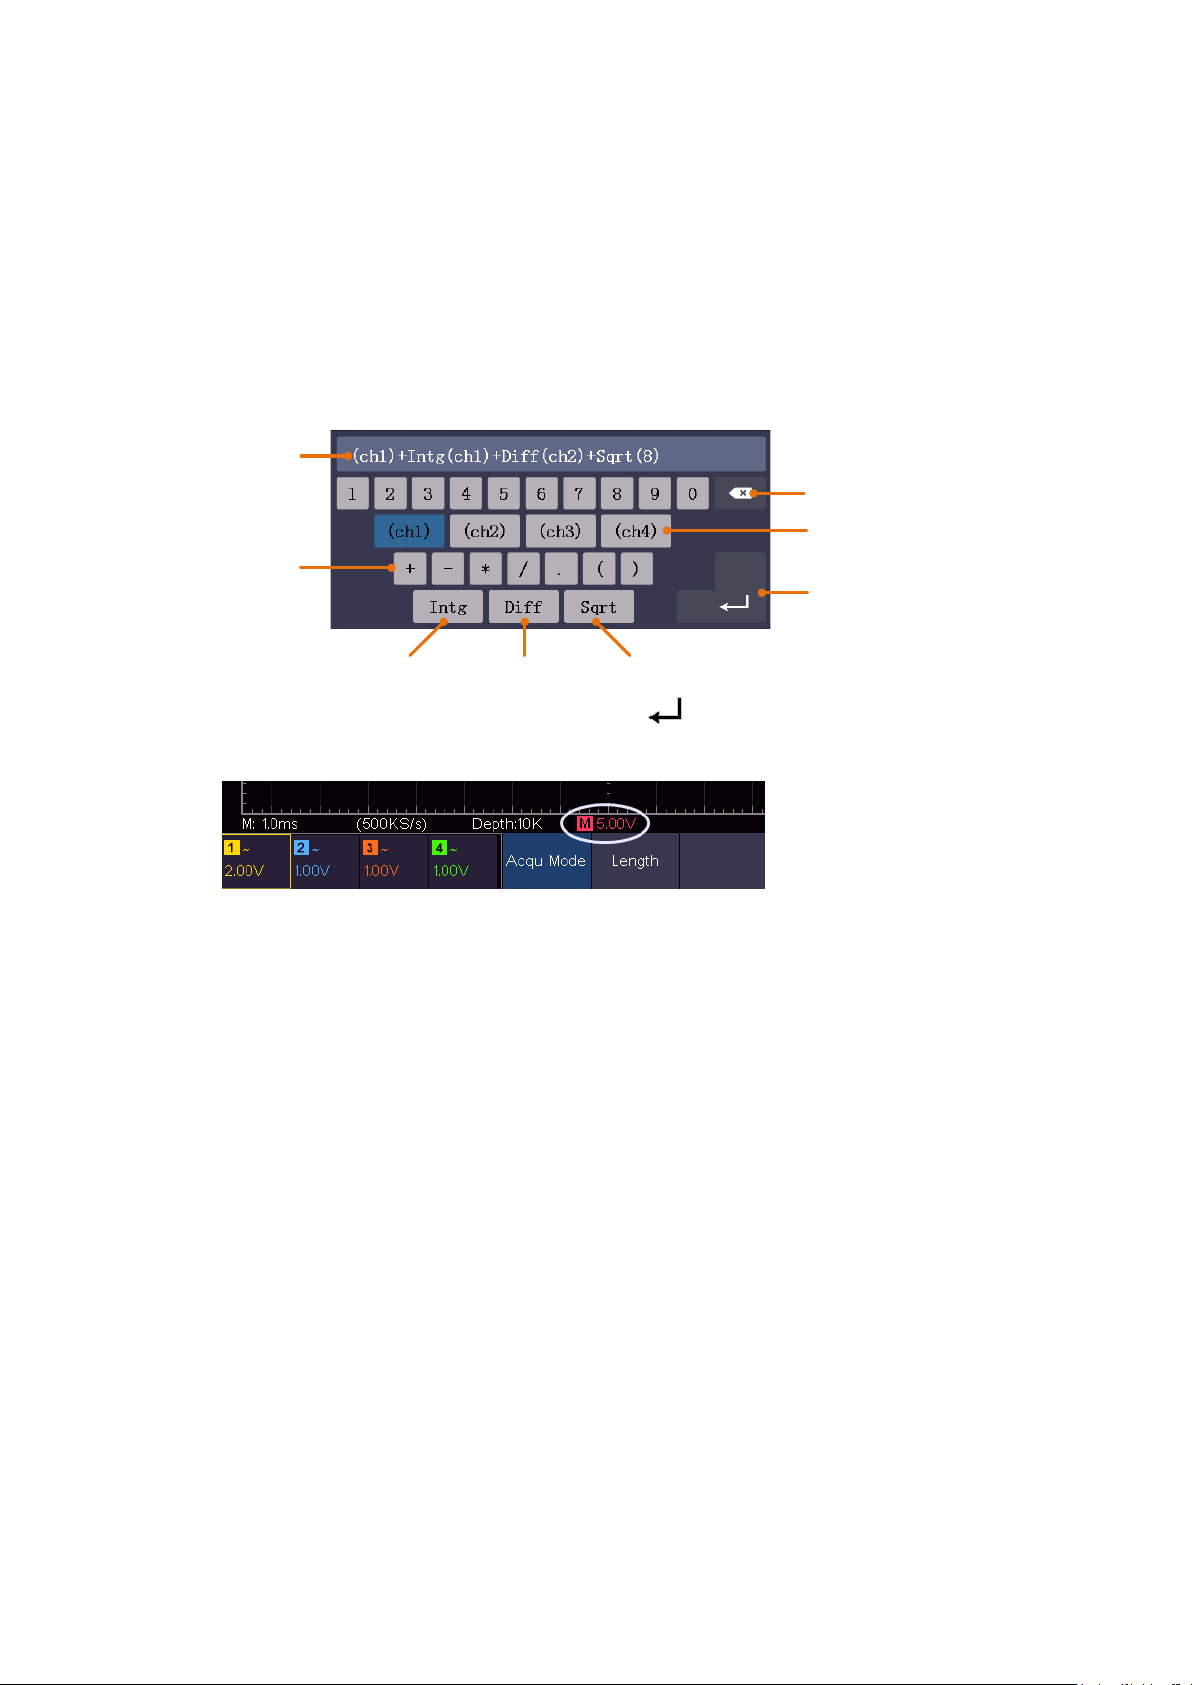
User defined function
1. Press the Math button to display the math menu in the bottom.
2. Select User Function in the bottom menu, an expression input keyboard pops up.
3. Create an expression. When done, choose
in the keyboard to confirm
. The
division of Math waveform is displayed at the left bottom of screen.
Digital Filter
Digital filter provides 4 types of filters (low pass, high pass, band pass and band reject).
The specified freq uencies can be fil t er ed by setting the cut-off frequenc y. Digital filter can
only apply to CH1 or CH2.
1. Press the Math button to display the math menu in the bottom.
2. Select DIR in the bottom menu.
3. In the right menu, select channel as CH1 or CH2.
4. In the right menu, select type, select the desired filter type.
5. In the right menu, select window, select the desired window.
6. When low-pass or high-pass type is selected, select cut-off fre in the right menu.
When band-pass or band-reject type is s elected, select upper or down in the right
menu. Turn M knob to adjust the frequency.
7. In the right menu, select Vertical (div), turn M knob to adjust the vertical position of
Math waveform. The voltage division of Math waveform is th e same as the selected
channel.
Note: On the Scan format, digital filter is disabled.
27
Page 33
4.Advanced User Guidebook
Type
Characteristics
Window
Better solution for magnitude than Rectangle, and
It has slightly better
Transients or bursts where the signal levels
event are significantly
Using FFT function
The FFT (fast Fourier transform) math function mathematically converts a time-domain
waveform into its frequency components. It is very useful for analyzing the input signal on
Oscilloscope. You can match these frequencies with known system frequencies, such as
system clocks, oscillators, or power supplies.
FFT function in this oscilloscope transforms 8192 data points of the time-domain signal
into its frequency components mathematically (the record length should be 10K or above).
The final frequency contains 4096 points ranging from 0Hz to Nyquist frequency.
Taking the FFT operation for example, the operation steps are as follows:
1. Press the Math button to display the math menu in the bottom.
2. Select FFT in the bottom menu.
3. In the right menu, select Source as CH1.
4. In the right menu, select Window. In the left menu, turn the M knob to select the
proper window type.
5. In the right menu, select Format. In the left menu, turn the M knob to select
amplitude unit (V RMS, Decibels) or phase unit (Radian, Degrees).
6. Select Hori (Hz) in the r ight menu; select repeatedly to make the symbol in front
of the horizontal position value (the upper one), turn the M knob to adjust the
horizontal position of FFT waveform; then select to make the symbol in front of
the time base value below, turn the M knob to adjust the time base of FFT waveform.
7. Select Vertical in the right menu; do the same operations as above to set the vertical
position and vertical division.
To select the FFT window
■ Th ere are 6 FFT windows. Each one has trade-offs between frequency resolution and
magnitude accuracy. What you want to measure and your source signal characteristics
help you to determine which window to use. Use the following guidelines to select the
best window.
good for frequency as well.
frequency resolution than Hanning.
Recommend to use for:
Hamming
Sine, periodic and narrow band random noise.
before and after the
different.
28
Page 34

4.Advanced User Guidebook
nonrepetitive signals and measuring frequency
e the signal levels
before and after the event are significantly
The frequency resolution when using the Kaiser
Best solution for frequency, worst for magnitude.
Best type for measuri ng the frequency spect rum of
components near DC.
Recommend to use for:
Rectangle
Blackman
Hanning
Transients or bursts, the signal level befo re and
after the event are nearly equal.
Equal-amplitude sine waves with frequencies
those are very close.
Broadband random noise with a relatively slow
varying spectrum.
Best solution for magnitude, worst for frequency.
Recommend to use for:
Single frequency waveforms, to find higher
order harmonics.
Good for magnitude, but poorer frequency
resolution than Hamming.
Recommend to use for:
Sine, periodic and narrow band random noise.
Transients or bursts wher
different.
window is fair; the spectral leakage and amplitude
accuracy are both good.
Kaiser
The Kaiser window is best used when frequencies
are very close to the same value but have widely
differing amplitudes (the side lobe level and shape
factor are closest to the traditional Gaussian RBW ).
This window is also good for random signals.
The Bartlett window is a slightly narrower variant
Bartlett
of the triangular window, with zero weight at both
ends.
Notes for using FFT
Use the default dB scale for details of multiple frequencies, even if they have very
different amplitudes. Use the Vrms scale to compare frequencies.
29
Page 35

4.Advanced User Guidebook
DC component or offset can cause incorre ct magnitude values of FFT waveform. To
minimize the DC component, choose AC Coupling on the source signal.
To reduce random noise and aliased components in repetitive or single-shot events, set
the oscilloscope acquisition mode to average.
What is Nyquist freque nc y?
The Nyquist frequ ency is the highes t frequency that any real-time digitizing oscilloscope
can acquire without aliasing. This frequency is half of the sample rate. Frequencies above
the Nyquist frequency will be under sampled, which causes aliasing. So pay more
attention to the relation between the frequency being sampled and measured.
Use Vertical Position and Scale Knobs
The 4 channels use the same Vertical Position and Ver tical Scale knobs. If you want to
set the vertical scale and vertical position of a channel, press CH1, CH2, CH3 or CH4 at
first to select the desired channel. Then turn the Vertical Position and Vertical Scale
knobs to set the values.
1. The Vertical Position knob is used to adjust the vertical positions of the selected
waveforms.
The analytic resolution of this control knob changes with the vertical division. When
the Vertical Position knob is rotated, the pointer of the earth datum point of the
selected channel is directed to move up and down following the waveform, and the
position message at the center of the screen would change accordingly (see Figure
4-1).
2. The Vertical Scale knob is used to regulate the vertical resolution of the selected
wave forms.
The sensitivity of the vertical division steps as 1-2-5. The vertical scale is displayed at
the left bottom corner of the screen (see Figure 4-1).
30
Page 36

4.Advanced User Guidebook
Figure 4-1 Information about Vertical Scale
How to Set the Horizontal System
The HORIZONTAL CONTROLS includes the Horizontal HOR button and such
knobs as Horizontal Position and Horizontal Scale.
1. Horizontal Position knob: this knob is used to adjust the horizontal positions of
all channels (include those obtained from the mathematical manipulation), the
analytic resolution of which changes with the time base.
2. Horizontal Scale knob: it is used to set the horizontal scale factor for setting the
main time base or the window.
3. Horizontal HOR button: push it to switch between the normal mode and the
wave zoom mode. For more detailed operations, see the introductions below.
Zoom the Waveform
Push the Horizontal HOR button to enter wave zoom mode. The top half of the
display shows the Main window and the bottom half displays the Zoom window. The
Zoom window is a magnified portion of the Main window.
Figure 4-2 Wave Zoom Mode
In normal mode, the Horizontal Position and Horizontal Scale knobs are used to
adjust the horizontal position and time base of the Main window.
In wave zoom mode, the Horizontal Position and Horizontal Scale knobs are used
to adjust the horizontal position and time base of the Zoom window.
31
Page 37

4.Advanced User Guidebook
How to Set the Trigger/Decoding System
Trigger determines when DSO starts to acquire data and displa y wav efo rm . On ce
trigger is set correctly, it can convert the unstable display to meaningful
waveform.
When DSO starts to acquire data, it will collect enough data to draw waveform
on left of trigger point. DSO continues to acquire data while waiting for trigger
condition to occur. Once it detects a trigger it will acquire enough data
continuously to draw the waveform on right of trigger point.
Trigger control area consists of 1 knob and 2 menu buttons.
Trigger Level: The knob that set the trigger level; push the knob and the level
will be set as the vertical mid point values of the amplit ude of the trigger
signal.
Force: Force to create a trigger signal and the function is mainly used in
"Normal" and "Single" mode.
Trigger Menu: The button that activates the trigger control menu.
Trigge r Control
The oscilloscope provides three trigger types: single trigger, logic trigger and bus
trigger. Each type of trigger has different sub menus.
Press Trigger Menu panel button, then bottom menu Trigger Type, select Single,
Logic or Bus Trigger on the popup right menus, turn the M knob to choose
different trigger types.
Single trigger: Use a trigger level to capture stable waveforms in two channels
simultaneously.
Logic trigger: Trigger the signal according to the condition of logic relationship.
Bus trigger: Set bus timing trigger.
The Single Trigger, Logic Trigger and Bus Trigger menus are described
respectively as follows:
Single Trigger
Single trigger has eight types: edge trigger, video trigger, pulse trigger, slope trigger,
runt trigger, windows trigger, timeout trigger and Nth edge trigger.
Edge Trigger: It occurs when the trigger input passes through a specified voltage
level with the specified slope.
Video Trigger: Tri gger on fields or lines for standard video signal.
Pulse Trigger: Find pulses with certain widths.
Slope Trigger: The oscilloscope begins to trigger according to the signal rising or
32
Page 38

4.Advanced User Guidebook
Menu
Settings
Instruction
Single Mode
Edge
Set vertical channel trigger type as edge trigger.
CH1
AC Line
Channel 1 as trigger signal.
AC power line as trigger signal.
AC
Block the direct current component.
component pass.
Trigger on rising ed ge
Trigger on falling edge
Auto
Acquire waveform even no trigger occurs
interval before another trigger occur, press
falling speed.
Runt Trigger: Trigger pulses that pass through one trigger level but fail to pass
through the other trigger level.
Windows Trigger: Provide a high trigger level and l ow tri gger level, the oscill oscope
triggers when the input signal passes through the high trigger level or
the low trigger level.
Timeout Trigger: The oscilloscope triggers when the time interval from when the
rising edge (or the falling edge) passes through the trigger level to
when the neighbouring falling edge (or the rising edge) passes
through the trigger level is greater than the timeout time set.
Nth Edge Trigger: The oscilloscope triggers on the Nth edge that appears on the
specified idle time.
The eight trigger modes in Single Trigger are described respectively as follows:
1. Edge Tri gger
An edge trigger occurs on trigger level value of the specified edge of input signal.
Select Edge trigger mode to trigger on rising edge or falling edge.
In Edge Trigger mode, the trigger setting information is displayed on bottom right of
the screen, for example, ,indicates that trigger type is edge,
trigger source is CH1, coupling is DC, and trigger level is 0.00mV.
Edge menu list:
Source
Coupling
Slope
CH2
CH3
CH4
DC
HF
Channel 2 as trigger signal.
Channel 3 as trigger signal.
Channel 4 as trigger signal.
Allow all component pass.
Block the high-frequency signal, only low-frequency
Normal
Mode
Holdoff
Single
Holdoff
Acquire waveform when trigger occurs
When trigger occurs, acquire one waveform then stop
100 ns - 10 s, turn the M knob or click to set time
33
Page 39

4.Advanced User Guidebook
Reset
to move cursor to
Set Holdoff time as default value (100 ns).
MENU
SETTING
INSTRUCTION
Single Mode
Video
Set vertical channel trigger type as video trigger
CH1
CH4
Select CH1 as the trigger source
Select CH4 as the trigger source
NTSC
SECAM
Line
Synchronic trigger in video line
Mode
Holdoff
Trigger Level: trigger level indicates vertical trig position of the channel, turn the trig
level knob or slide on the touch screen upward and downward to move trigger level,
during setting, an orange red dotted line displays to show trig position, and the value
of trigger level changes at the right corner, after setting, dotted line disappears.
panel button or click
choose which digit to be set.
2. Video Trigger
Choose video trigger to trigger on fields or lines of NTSC, PAL or SECAM standard
video signals.
In Video Trigger mode, the trigger setting information is displayed on bottom right of
the screen, for exam ple, ,indicates that trigger type is Video, trigger
source is CH1, and Sync type is Even.
Video Trigger menu list:
Source
Modu
Sync
3. Pulse Width Trigger
Pulse trigger occurs according to the width of pulse. The abnormal signals can be
detected through setting up the pulse width condition.
In Pulse Width Trigger mode, the trigger setting information is displayed on bottom
CH2
CH3
PAL
Field
Odd
Even
Line NO.
Auto Acquire waveform even no trigger occurred
Select CH2 as the trigger source
Select CH3 as the trigger source
Select video modulation
Synchronic trigger in video field
Synchronic trigger in video odd filed
Synchronic trigger in video even field
Synchronic trigger in designed video line, turn the M
knob or click to set the line number
34
Page 40

4.Advanced User Guidebook
MENU
SETTING
INSTRUCTION
CH1
CH4
Select CH1 as the trigger source
Select CH4 as the trigger source
AC
DC
Not allow DC portion to pass.
Allow all portion pass.
Polarity
Select pulse width condition and adjust the M knob
to move cursor to choose
which digit to be set.
Auto
Reset
Acquire waveform even no trigger occurred
Set Holdoff time as 100 ns
right of the screen, for example, ,indicates that trigger type
is pulse width, trigger source is CH1, coupling is DC, polarity is positive, and trigger
level is 0.00mV.
Pulse Widt h Tr igger menu list:
Single Mode Pulse Set vertical channel trigger type as pulse trigger.
Source
Coupling
when
Mode
Holdoff
CH2
CH3
Normal
Single
Holdoff
Select CH2 as the trigger source
Select CH3 as the trigger source
Choose the polarity
or click to set time, press panel
button or click
Acquire waveform when trigger occurred
When trigger occurs, acquire one waveform then stop
100 ns - 10 s, adjust M knob or click to set time
interval before another trigger occur, press
panel button or click to move cursor to
choose which digit to be set.
4. Slope Trig ger
Slope trigger sets the oscilloscope as the positive/negative slope trigger within the
specified time.
In Slope Trigger mode, the trigger setting information is displayed on bottom right of
the screen, for exam ple, ,indicates that trigger type is slope,
trigger source is CH1, slope is rising, 0.00mV is the differential between up level and
low level threshold.
35
Page 41

MENU
SETTING
INSTRUCTION
Single
Mode
CH1
CH4
Select CH1 as the trigger source
Select CH4 as the trigger source
slope
panel button or click
to move cursor to choose which digit to be
set.
High level
Slew rate
Adjust M knob to set the High level upper limit.
Slew rate = (High level - Low level) / Settings
Auto
Reset
Acquire waveform even no trigger occurred
Set Holdoff time as 100 ns
Slope trigger menu list:
Slope Set vertical channel trigger type as slope trigger.
4.Advanced User Guidebook
Source
When
Threshold
&SlewRate
Mode
Holdoff
CH2
CH3
Low level
Normal
Single
Holdoff
Select CH2 as the trigger source
Select CH3 as the trigger source
Slope selecting
Set slope condition; turn the M knob or click to
set slope time, press
Adjust M knob to set Low level lower limit.
Acquire waveform when trigger occurred
When trigger occurs, acquire one waveform then stop
100 ns – 10 s, turn the M knob or click to set
time interval before another trigger occur, press
panel button or click to move cursor to
choose which digit to be set.
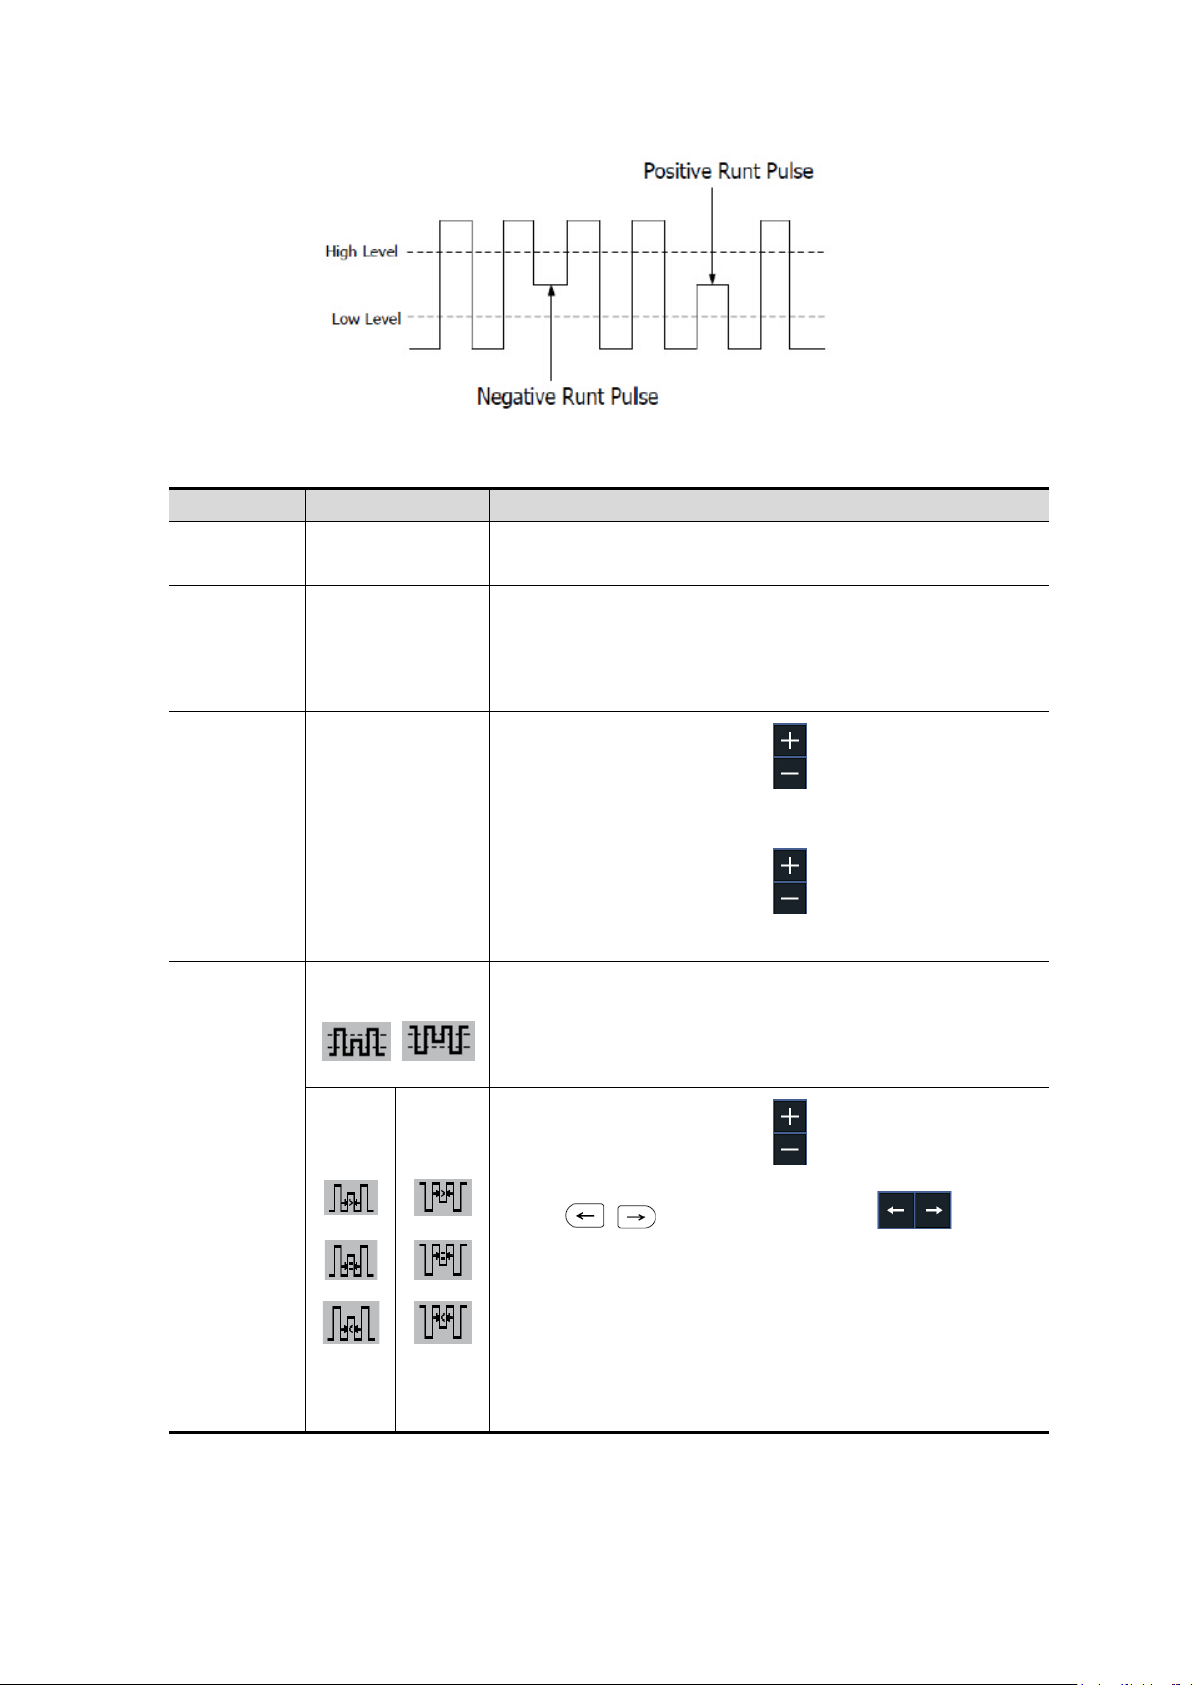
5.Runt Tr igge r
Trigger pulses that pass through one trigger level but fail to pass through the other
trigger level. Shown as below figure,
In Runt Trigger mode, the trigger setting information is displayed on bottom right of
the screen, for example, ,indicates that trigger type is runt,
trigger source is CH1, polarity is positive, 0.00mV is the differential between up level
and low level threshold.
36
Page 42
Runt Trigger
MENU
SETTING
INSTRUCTION
Single
Mode
CH1
CH4
Select CH1 as the trigger source
Select CH4 as the trigger source
threshold.
Positive Polarity, the oscilloscope triggers on the
negative runt pulse.
width.
Runt Trigger menu list:
Runt Set vertical channel trigger type as runt trigger.
4.Advanced User Guidebook
Source
Threshold
Condition
CH2
CH3
Up Level
Low Level
Polarity
Select CH2 as the trigger source
Select CH3 as the trigger source
Adjust the M knob or click to set the up level
threshold.
Adjust the M knob or click to set the low level
positive runt pulse.
Negative Polarity, the oscilloscope triggers on the
Adjust the M knob or click to set pulse width,
press panel button or click to
move cursor to choose which digit to be set.
Trigger when runt pulse is greater than the set pulse
width.
Trigger when runt pulse equals to the set pulse width.
Trigger when runt pulse is lower than the set pulse
37
Page 43

4.Advanced User Guidebook
Auto
Reset
Acquire waveform even no trigger occurred
Set Holdoff time as 100 ns
MENU
SETTING
INSTRUCTION
Single
Mode
CH1
CH4
Select CH1 as the trigger source
Select CH4 as the trigger source
threshold.
Positive Polarity, the oscilloscope triggers on the
negative Windows pulse.
Mode
Holdoff
Normal
Single
Holdoff
Acquire waveform when trigger occurred
When trigger occurs, acquire one waveform then stop
100 ns - 10 s, adjust M knob or click to set time
interval before another trigger occur, press
panel button or click to move cursor to choose
which digit to be set.
6.Windows Trigger
Provide a high trigger level and low trigger level, the oscilloscope triggers when the
input signal passes through the high trigger level or the low trigger level.
In Windows Trigger mode, the trigger setting information is displayed on bottom right
of the screen, for example, ,indicates that trigger type is
windows, trigger source is CH1, polarity is positive, 0.00mV the differential between
up level and low level threshold.
Windows Trigger menu list:
Windows Set vertical channel trigger type as Windows trigger.
Source
Threshold
CH2
CH3
Up Level
Low Level
Select CH2 as the trigger source
Select CH3 as the trigger source
Adjust the M knob or click to set the up level
threshold.
Adjust the M knob or click to set the low level
Polarity
Condition
positive Windows pulse.
Negative Polarity, the oscilloscope triggers on the
38
Page 44
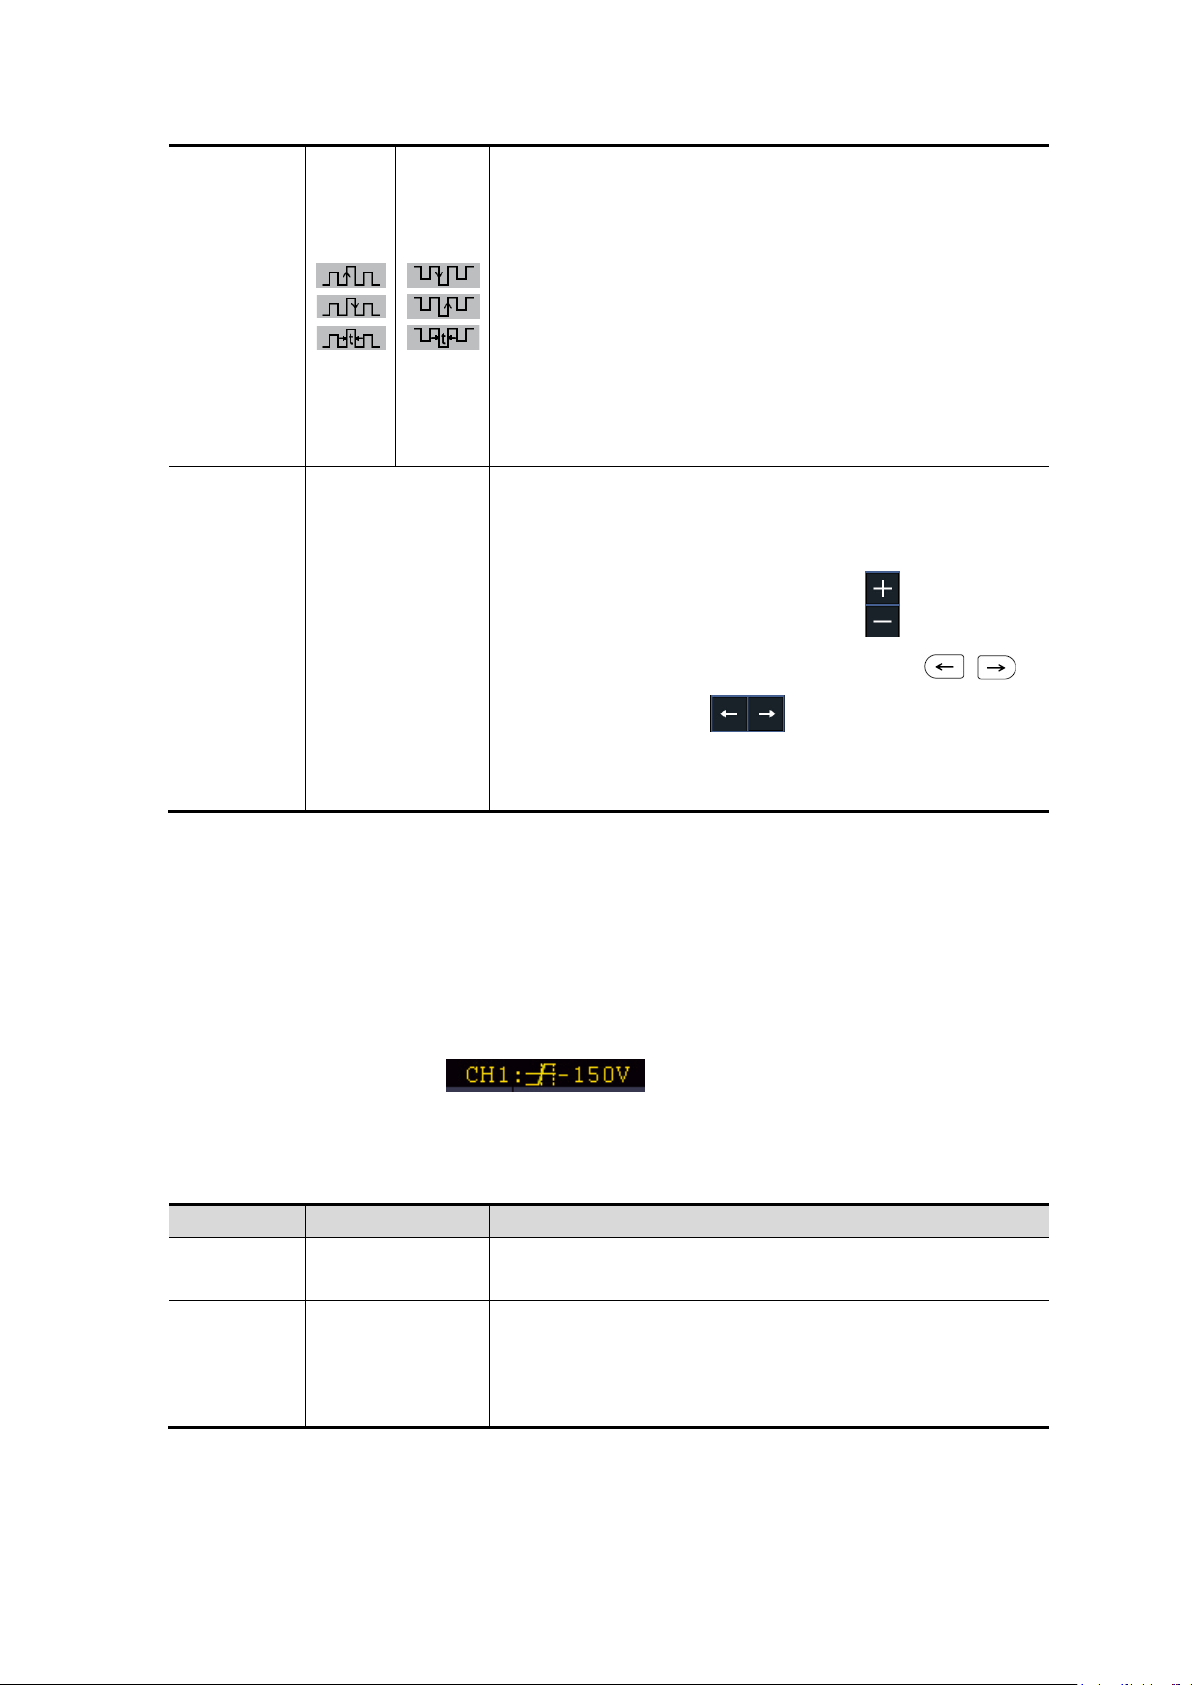
4.Advanced User Guidebook
Enter: Triggers when the trigger signal enters the
Exit: Triggers when the trigger signal exits the
Time: Specify the hold time of the input signal after
specified trigger level. The oscilloscope
triggers when the accumulated hold time is greater than
Auto
Reset
Acquire waveform even no trigger occurred
Set Holdoff time as 100 ns
MENU
SETTING
INSTRUCTION
Single
Mode
CH1
CH4
Select CH1 as the trigger source
Select CH4 as the trigger source
specified trigger level range.
Mode
Holdoff
Normal
Single
Holdoff
specified trigger level range.
entering the
the windows time. Available range is 30ns-10s, default
100ns.
Acquire waveform when trigger occurred
When trigger occurs, acquire one waveform then stop
100 ns - 10 s, adjust M knob or click to set time
interval before another trigger occur, press
panel button or click to move cursor to choose
which digit to be set.
7.Time out Trigger
The oscilloscope triggers when the time interval from when the rising edge (or the
falling edge) passes through the trigger level to when the neighbouring falling edge
(or the rising edge) passes through the trigger level is greater than the timeout time
set.
In Timeout Trigger mode, the trigger setting information is displayed on bottom right
of the screen, for example, ,indicates that trigger type is Timeout,
trigger source is CH1, edge is positive, 0.00mV is up level or low level threshold.
Timeout Trigger menu list:
Timeout Set vertical channel trigger type as Timeout trigger.
Source
CH2
CH3
Select CH2 as the trigger source
Select CH3 as the trigger source
39
Page 45
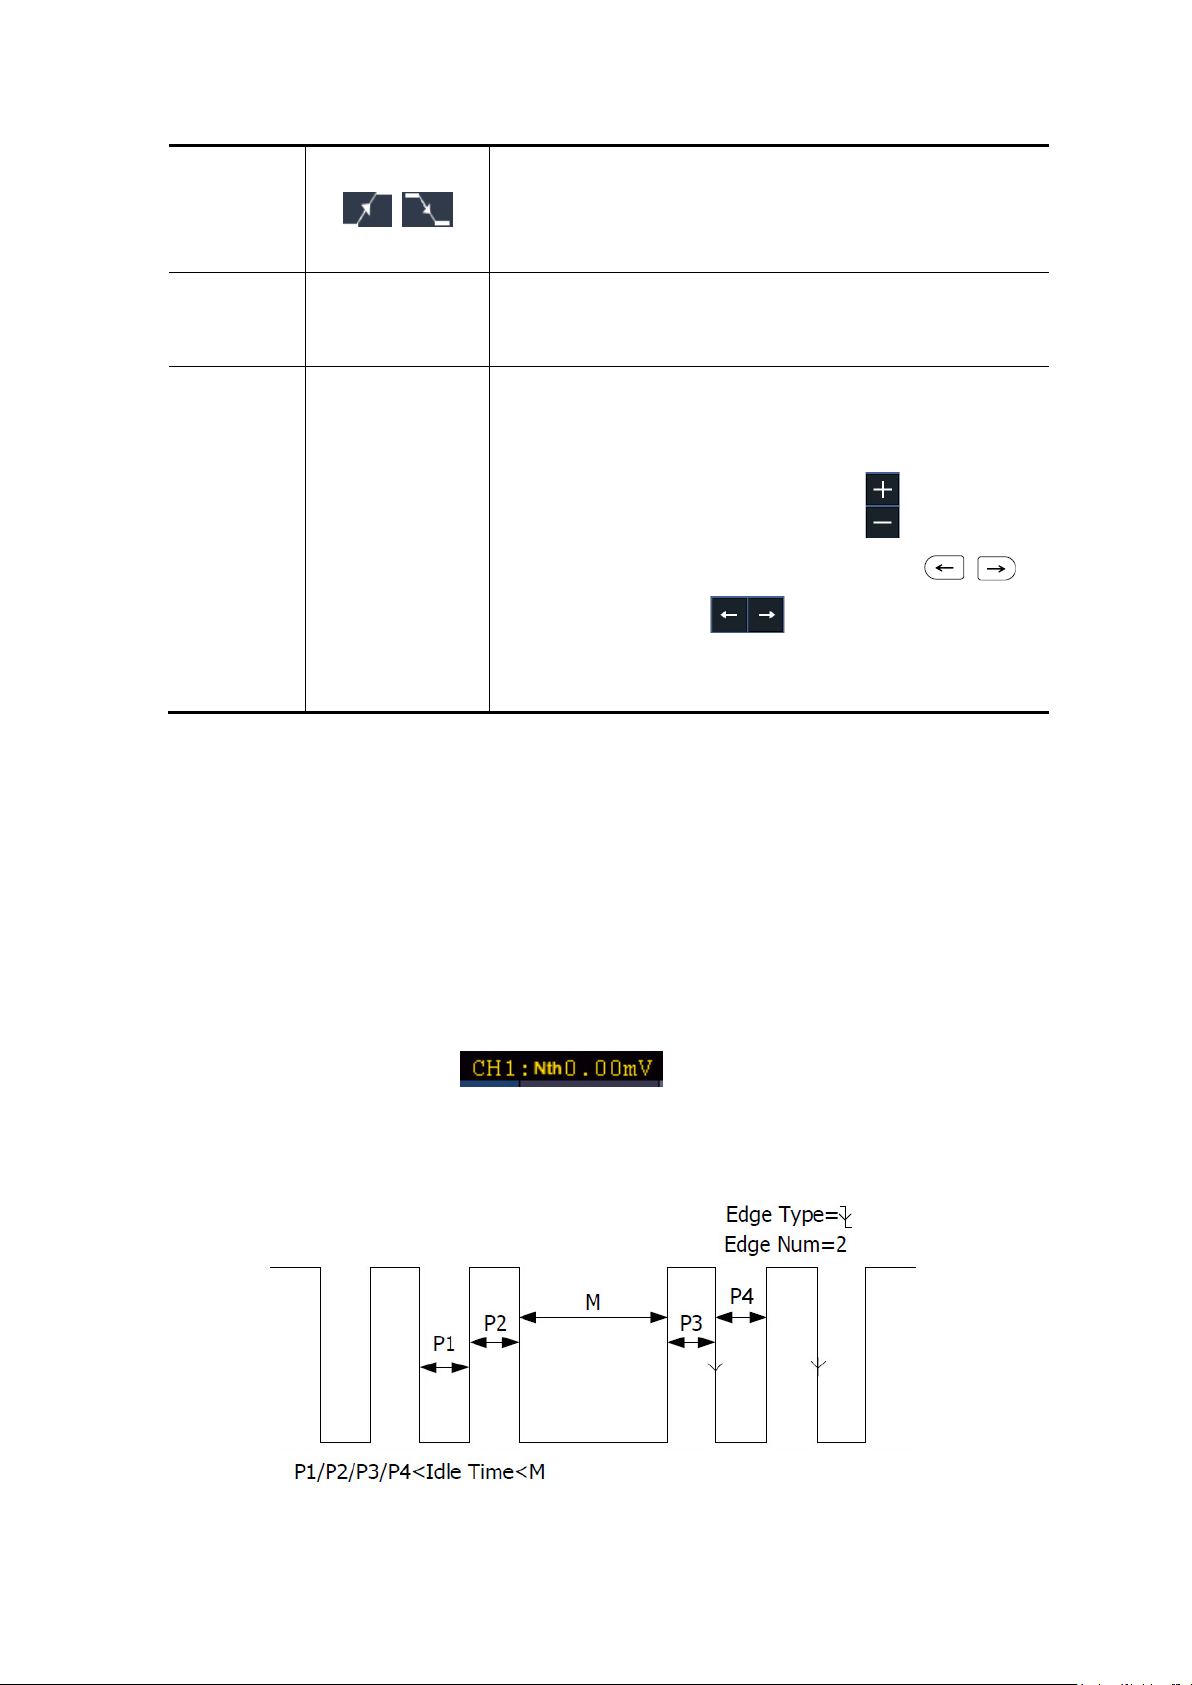
Edge
Start timing when the rising edge of the input signal
passes through the trigger level.
Set idle time. Idle time means the minimum time of idle
clock before searching data that can meet trigger
conditions. Available range is 30ns-10s, default 100ns.
Auto
Reset
Acquire waveform even no trigger occurred
Set Holdoff time as 100 ns
Edge
Configure Idle T ime
4.Advanced User Guidebook
passes through the trigger level.
Start timing when the falling edge of the input signal
Normal
Single
Acquire waveform when trigger occurred
When trigger occurs, acquire one waveform then stop
Mode
Holdoff
Holdoff
100 ns - 10 s, adjust M knob or click to set time
interval before another trigger occur, press
panel button or click move cursor to choose
which digit to be set.
8.Nth Edge trigger
The oscilloscope triggers on the Nth edge that appears on the specified idle time. As
figure shown below, the oscilloscope should trigger on the second falling edge after
the specified idle time and the idle time should be set to P1/P2/P3/P4 < Idle Time < M.
Wherein, M, P1, P2, P3 and P4 are positive or negative pulse width participating in
the counting.
In Nth Edge Trigger mode, the trigger setting information is displayed on bottom right
of the screen, for example, ,indicates that trigger type is Nth
Edge, trigger source is CH1, -150V is up level or low level threshold.
40
Page 46
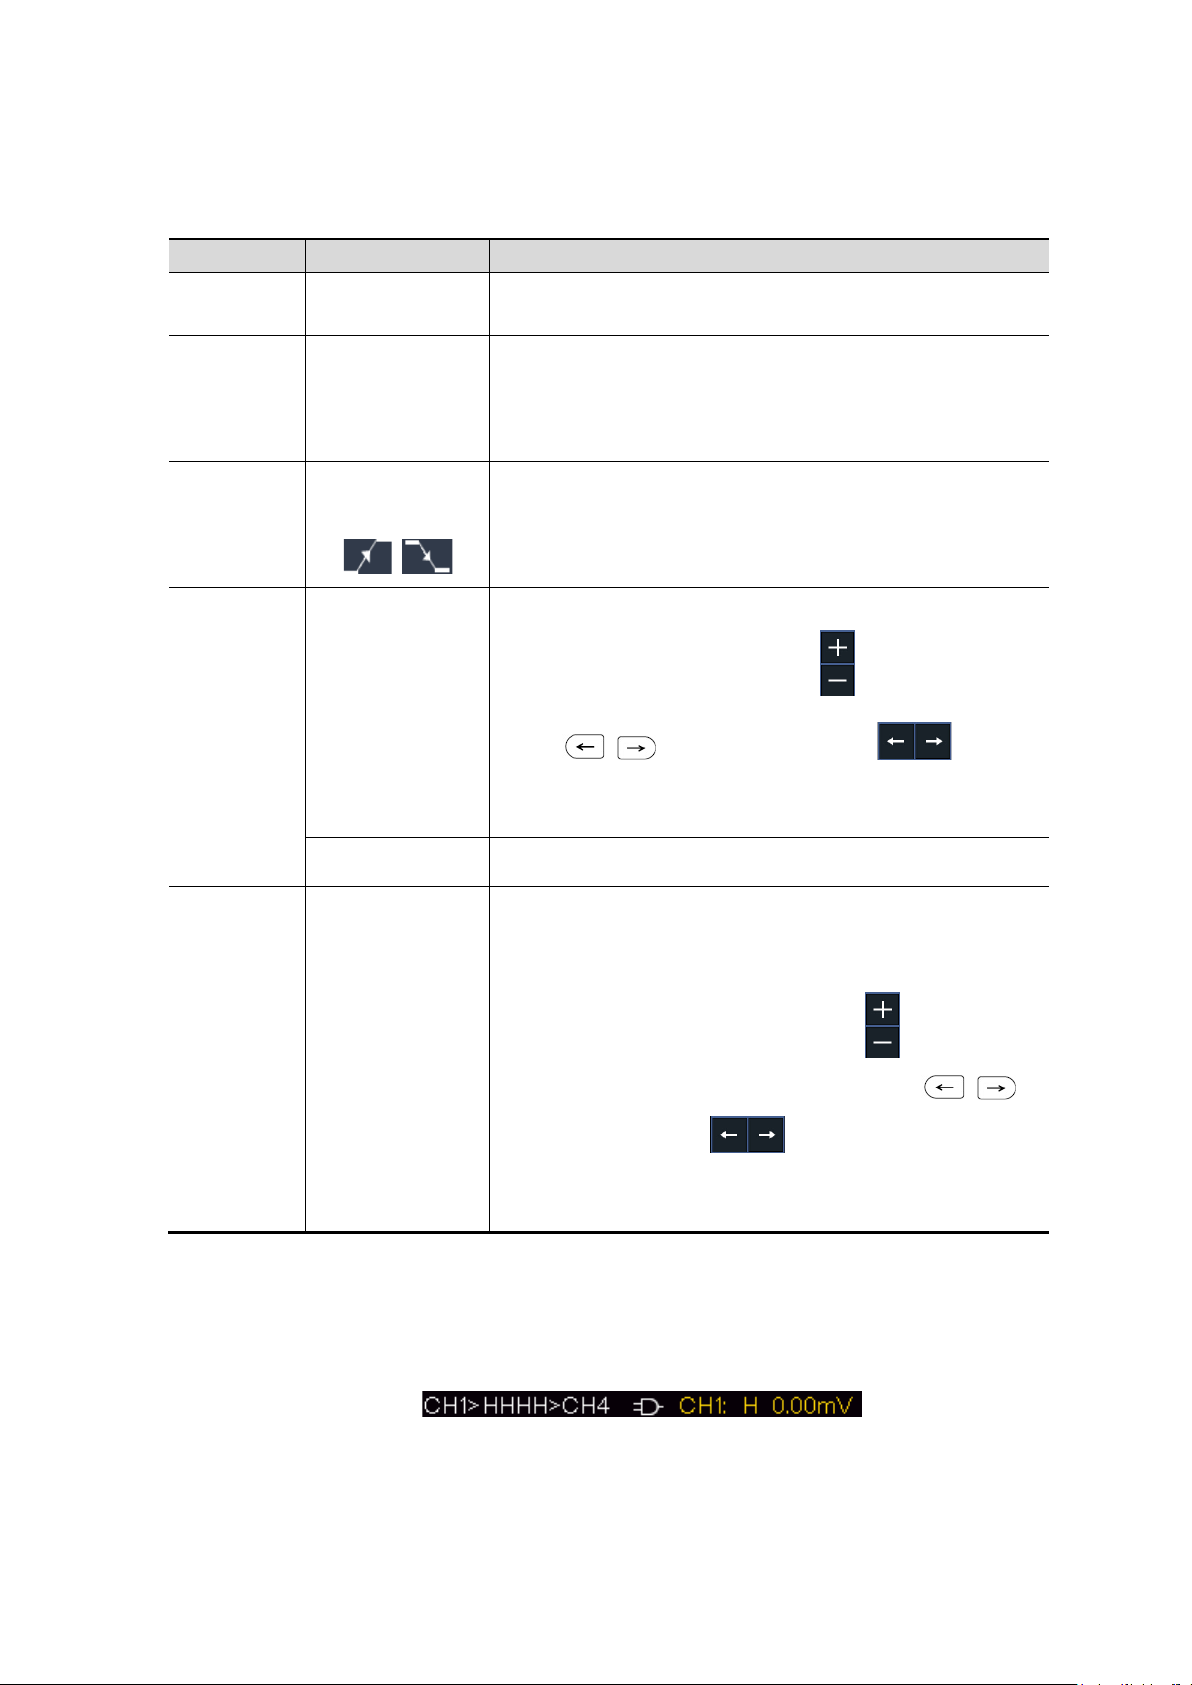
Nth Edge Trigger menu list:
MENU
SETTING
INSTRUCTION
Single
Mode
CH1
CH4
Select CH1 as the trigger source
Select CH4 as the trigger source
Edge
Trigger on the rising edge of the input signal when
voltage level meets the specified trigger level.
Set idle time before the edge counting in Nth Edge
range is 30ns-10s, default 100ns.
Auto
Reset
Acquire waveform even no trigger occurred
Set Holdoff time as 100 ns
Nth Edge Set vertical channel trigger type as Nth Edge trigger.
4.Advanced User Guidebook
Nth Edge Trigger
Source
Edge
Configure
Mode
Holdoff
CH2
CH3
Idle T ime
Edge Num
Normal
Single
Holdoff
Select CH2 as the trigger source
Select CH3 as the trigger source
voltage level meets the specified trigger level.
Trigger on the falling edge of the input signal when
Trigger. Adjust M knob or click to set idle time
press panel button or click to
move cursor to choose which digit to be set. Available
Set the edge number value of “N” in Nth Edge trigger.
Acquire waveform when trigger occurred
When trigger occurs, acquire one waveform then stop
100 ns - 10 s, adjust M knob or click to set time
interval before another trigger occur, press
panel button or click move cursor to choose
which digit to be set.
Logic Trigger
Trigger according to logic relation.
In Logic Trigger mode, the trigger setting information is displayed on bottom right of
the screen, for example,
trigger type is Logic, logic mode is AND, CH1 high level and trigger level is 0.00mV.
Logic Trigger menu list:
41
,indicates that
Page 47
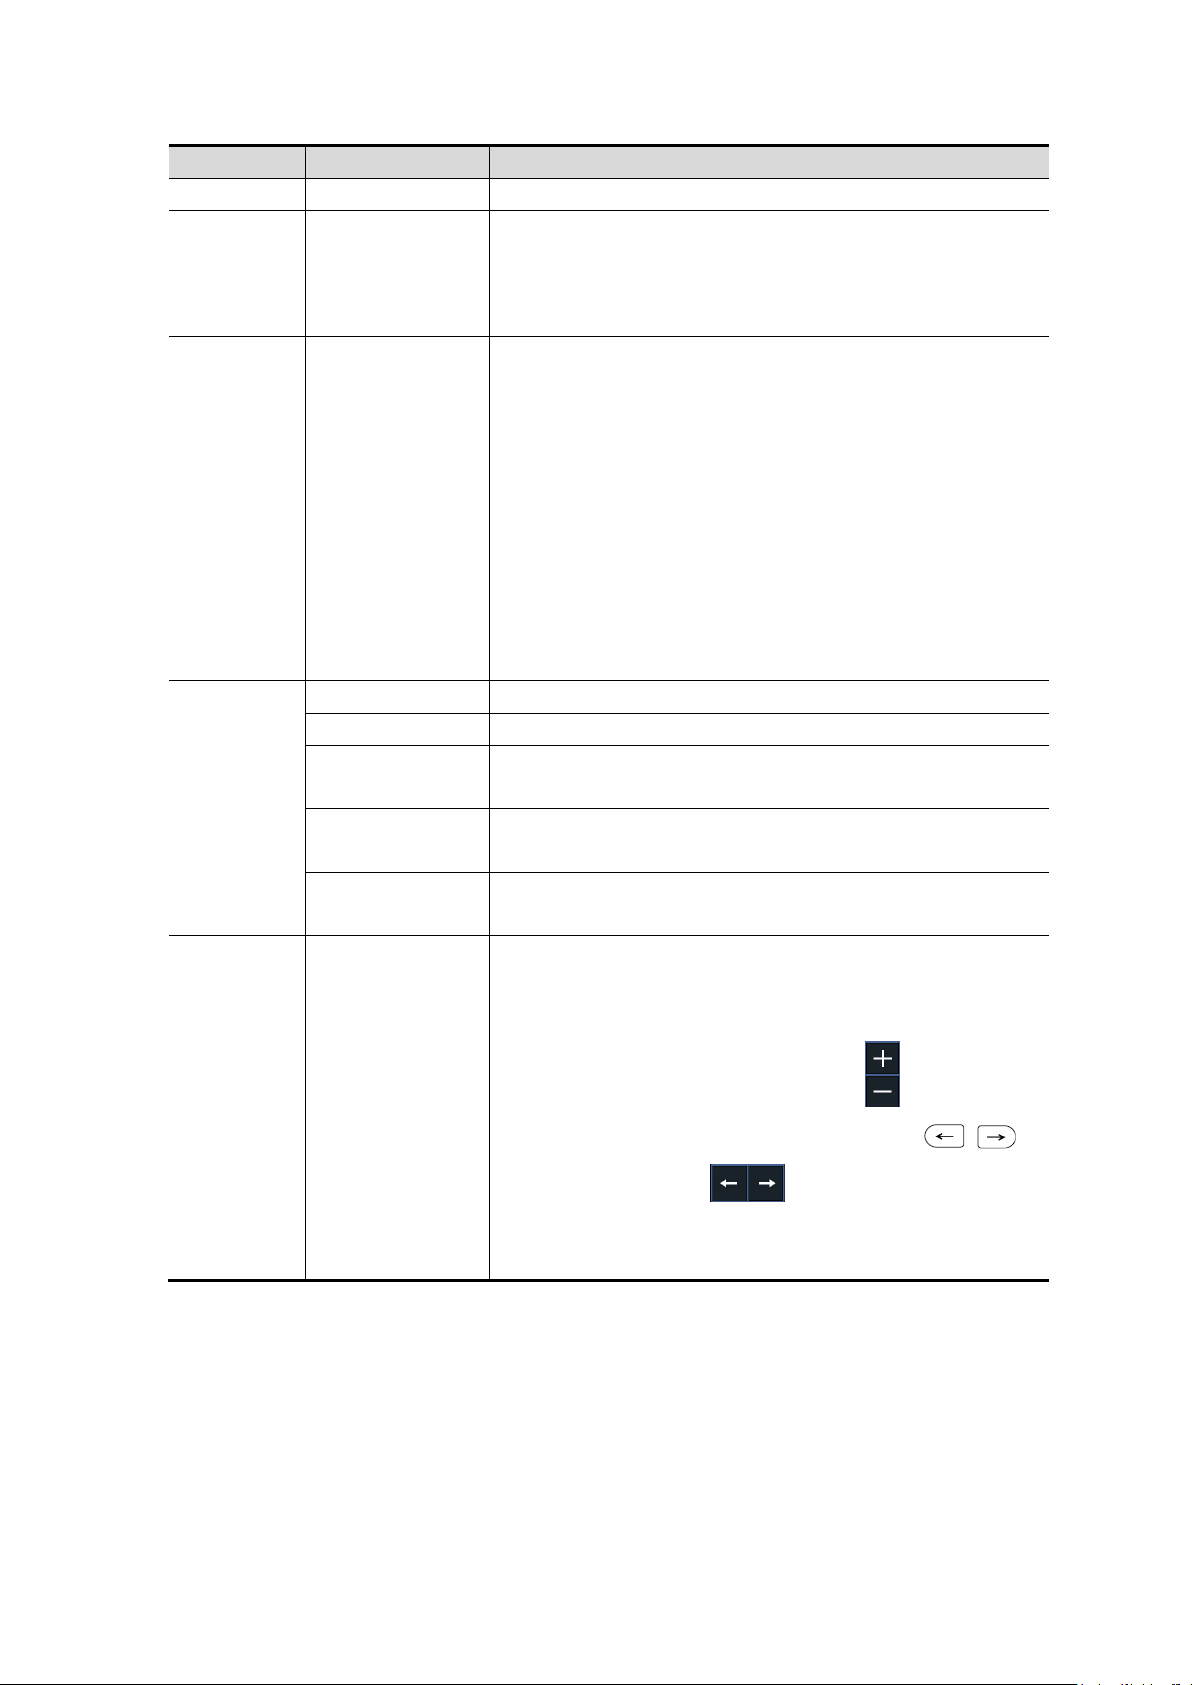
4.Advanced User Guidebook
MENU
SETTING
INSTRUCTION
Mode
Logic
Set vertical channel trigger type as Logic trigger.
AND
XOR
Set logic mode as AND.
Set logic mode as XOR.
CH1
Set CH1 as High Level, Low level, high or low level,
at the same time.
Goes True
Trigger when condition turns True from False.
Goes False
Trigger when condition turns False from True.
Trigger when the time of true condition is greater than
the set time
Trigger when the time of true condition is equal to the
set time
Trigger when the time of true condition is lower than
the set time
Auto
Reset
Acquire waveform even no trigger occurred
Set Holdoff time as 100 ns
Logic
Mode
Input Mode
Out Mod
OR
XNOR
CH2
CH3
CH4
Is True >
Is True =
Set logic mode as OR.
Set logic mode as XNOR.
Rise and Fall.
Set CH2 as High Level, Low level, high or low level,
Rise and Fall.
Set CH3 as High Level, Low level, high or low level,
Rise and Fall.
Set CH4 as High Level, Low level, high or low level,
Rise and Fall.
Note:When input mode of one channel is set as Rise or
Fall, the other channel could not be set as Rise and Fall
Is True <
Normal
Single
Mode
Holdoff
Bus Trigger
Holdoff
Acquire waveform when trigger occurred
When trigger occurs, acquire one waveform then stop
100 ns - 10 s, adjust M knob or click to set time
interval before another trigger occur, press
panel button or click move cursor to choose
which digit to be set.
1. RS232 Trigger
RS232 is a serial communication mode used in the data transmission between PCs or
between PC and Terminal. A character is transmit ted as a f rame of data wh ich consist
of 1bit start bit, 5-8bits data bits, 1bit check bit and 1-2 stop bits.
42
Page 48

4.Advanced User Guidebook
MENU
SETTING
INSTRUCTION
Sour
CH1
CH4
Select CH1 as the trigger source.
Select CH4 as the trigger source.
Pola
Nor
mal
Select polarity of data transmission as Normal. Select
Inve
rted
Trigger on the start frame of position. After choosing
s Configure to enter detailed
settings.
Trigger when error frame is detected. After choosing
this condition, press Configure to enter detailed
settings.
Trigger when Chk Error is detected. After choosing
to enter detailed
settings.
Trigger on the last bit of the preset data. After
choosing this condition, press Configure to enter
detailed settings.
Common Baud: adjust M knob to choose common
from 50 to 10,000,000.
Stop Bit:Select “1”or ”2”.
baud.
In RS232 bus trigger mode, the trigger setting information is displayed on bottom
right of the screen, for example, ,indicates that trigger type
is RS232, CH1 trigger level is 0.00mV.
Format as shown in the figure below,
RS232 Trigger
RS232 Trigger menu list:
Bus Type RS232 Set vertical channel bus t ype as RS232 trigger.
Input
When
ce
CH2
CH3
rity
Start
Error
Chk Error
Data
Select CH2 as the trigger source.
Select CH3 as the trigger source.
polarity of data transmission as Inverted.
this condition, pres
this condition, press Configure
Start
baud.
Custom Baud: adjust M knob to choose baud, ranges
Configure
Error
Parity: “NO””EVEN””ODD”
Common Baud: adjust M knob to choose common
43
Page 49

Custom Baud: adjust M knob to choose baud, ranges
from 50 to 10,000,000.
Chk Error
Even-Odd:Select Even or Odd.
from 50 to 10,000,000.
Data Bits:Set as 5、6、7、8 bits.
0-63, 0-127 or 0-255.
Mode
Holdoff
Auto
Single
Acquire waveform even no trigger occurred
When trigger occurs, acquire one waveform then stop
MENU
SETTING
INSTRUCTION
SCL
SDA
Set SCL.
Set SDA.
Trigger when SDA data transitions from high to low
while SCL is high.
Restart
When another start condition occurs before a stop
4.Advanced User Guidebook
Common Baud: adjust M knob to choose common
baud.
Custom Baud: adjust M knob to choose baud, ranges
Data
Normal
Data:Set data according to data bits, ranges from 0-31,
Acquire waveform when trigger occurred
2. I2C Trigger
The I2C serial bus consists of SCL and SDA. The transmission rate is determined by
SCL, and the transmission data is determined by SDA. As shown in below figure,
oscilloscope can trigger on the start, restart, stop, ack lost, specific device address or
data value, also device address and data value at the same time.
In I2C bus trigger mode, the trigger setting information is displayed on bottom right
of the screen, for ex ample, ,indicates that
trigger type is I2C, CH1 trigger level is 0.00mV, CH2 trigger level is 0.00mV.
I2C Trigger menu list:
Bus Type
I2C Set vertical channel bus type as I2C trigger.
Source
Start
When
44
Page 50

condition.
Stop
Trigger when SDA data transitions from low to high
while SCL is high.
Trigger when SDA data is high during any
acknowledgement of SCL clock position.
Trigger on the read or write bit when the preset
address is met.
Addr
Bits
Set address according to the preset address bits,
Note: The set is not available when Address bits is set
to “8”.
Addr
Dire
ction
Search for the preset data value on SDA and trigger on
the dump edge of SCL of the last bit of the data area.
Byte
h
Curr
it
Data
All
Bits
Trigger when Address and Data conditions are met at
the same time .
Mode
Holdoff
Auto
Single
Acquire waveform even no trigger occurred
When trigger occurs, acquire one waveform then stop
MENU
SETTING
INSTRUCTION
Ack Lost
Address
Adr
For
mat
ess
Data
4.Advanced User Guidebook
Set Address Bits to be “7”、“8”or“10”.
address range is 0-127, 0-255, 0-1023 respectively.
Set Data Direction to be Read or Write.
lengt
DatF
orma
Addr / Data
entB
t
Normal
Set data byte length, available range 1-5 byte s. Adjust
M knob or click to set byte length.
Select the data bit, ranges from 0 to (byte length*8 -1).
Set data to be H, L or X (H or L)
Set all the data bits to be the specified value in Data
Acquire waveform when trigger occurred
3. SPI Trigger
Trigger on the specified data when the timeout condition is meet. When using SPI
trigger, you need to specify the SCL and SDA data sources.
In SPI bus trigger mode, the trigger setting information is displayed on bottom right
of the screen, for example, ,indicates that
trigger type is SPI, CH1 trigger level is 0.00mV, CH2 trigger level is 0.00mV.
SPI Trigger menu list:
45
Page 51

4.Advanced User Guidebook
SCL
SDA
Set SCL.
Set SDA.
Set the minimum time that SCL must be idle, that is a
Set Edge Clock as Rising edge or Falling edge. Means
Set all the data bits to be the specified value in Data.
Current Bit
Data
All Bits
Mode
Holdoff
Auto
Single
Acquire waveform even no trigger occurred
When trigger occurs, acquire one waveform then stop
Bus Type
SPI Set vertical channel bus type as SPI trigger.
Source
Time Out Time out
Clock Edge
Data Bits
ClockEdg
e&Data
period of SCL, available range 100ns-10s. Time out
means SCL keeps idle for a specified time before
oscilloscope starts to search for the data(SDA) on
which to trigger. adjust M knob or click to set
time out, press panel button or click
move cursor to choose which digit to be set.
sample the SDA data on the rising edge or falling edge
of the clock.
Set the number of bits of the serial data character
string. It can be set to any integer between 4-32. adjust
M knob or click to set Data Bits.
Set the number of the data bits, ranges from 0-31,
adjust M knob or click to set Current Bit.
Set the value of the current data bit as H,L or X (H or
L).
Normal
Acquire waveform when trigger occurred
4. CAN T r igger
CAN (Controller Area Network) is a serial communication protocol of the ISO
international standardization.
By using the CAN bus trigger, you can trigger on Start of Frame, Type of Frame,
Identifier, Data, ID & Data, End of Frame, Missing Ack, or Bit Stuffing Error.
You need to specify the signal source, trigger signal type, sample point, and signal
rate of the CAN signal.
In CAN bus trigger mode, the trigger setting information is displayed on bottom
right of the screen , for example, ,indicates that trigger
46
Page 52

4.Advanced User Guidebook
MENU
SETTING
INSTRUCTION
CH1
CH4
Select CH1 as the trigger source.
Select CH4 as the trigger source.
CAN_H
RX
Actual CAN_H bus signal.
Received signal on the CAN signal line.
oscilloscope samples the bit level at this point. “Sample
“bit’s time”. The range is 5% to 95%.
Common
Baud
and then adjust it in this menu.
Start
Trigger on the start frame of the data frame.
Data
Remote
Error
Configure
Format
Select Standard or Extended.
Use the M knob and Direction
key on the front panel to set.
Byte
Length
Set the number of bytes with the
M knob. The range is 1 to 8.
Set the data with the M knob
panel.
type is CAN, CH1 trigger level is -126 mV.
CAN Trigger menu list:
Bus Type CAN Set vertical channel bus type as CAN trigger.
Input
Source
Type
Sample
Point
CH2
CH3
CAN_L
TX
Select CH2 as the trigger source.
Select CH3 as the trigger source.
Actual CAN_L bus signal.
Transmission signal on the CAN signal line.
Turn the M knob (or tap on in touchscreen) to set
the Sample point, which is a point within a bit’s time. The
point” is represent ed by the percenta ge of “the time from
the start of the bit’s time to the sample point time” in the
Turn the M knob to select from the Baud list on the left.
Condition
Custom
Baud
Type
ID
Data
Turn the M knob (or tap on in touchscreen) to set
the Baud. The range is 10,000 to 1,000,000.
Tip: You can select the nearest value in Common Baud,
Type
(Bottom
menu)
Trigger on the selected frame.
Overload
(Bottom
menu)
ID
Configure
(Bottom
menu)
Data
and Direction key on the front
47
Page 53

ID&Data
Format
Select Standard or Extended.
Use the M knob and Direction
key on the front panel to set.
Byte
Length
Set the number of bytes with the
M knob. The range is 1 to 8.
Set the data with the M knob
panel.
End
Trigger on the end frame of the data frame.
Missing
Ack
Bit
Stuffing
Mode
Holdoff
Auto
Single
Acquire waveform even no trigger occurred
When trigger occurs, acquire one waveform then stop
MENU
SETTING
INSTRUCTION
4.Advanced User Guidebook
ID
Configure
(Bottom
menu)
Data
Trigger on Missing Ack.
Trigger on Bit Stuffing Error.
Normal
Acquire waveform when trigger occurred
and Direction key on the front
Bus Decoding
1. RS232 Decoding
To decode RS232 signal:
(1) Connect the RS232 signal to the Signal Input Channel of the oscilloscope.
(2) Adjust to the proper time base and voltage division.
(3) In trigger menu, select Bus trigger, and select bus type as RS232, set parameters
based on the characteristics of th e signal, trigger the signal correctly and obtain
stable display. Refer to "RS232 Trigger" on page 42.
(4) Push the Decode button on the front panel. Select bus type as RS232. set
parameters based on the chara cteris tics o f th e si gnal. When the par ameter s are set
correctly, the information carried by the signal will be displayed.
Tip: If there are repetitive m enu items in both trigger menu and decoding menu, you
can set anyone of them, the other will be changed synchronously.
Note:
Use the Trigger Level knob to adjust the thresholds of bus trigger and bus
decoding.
When decoding, if "Parity" is not set to "None", and the check bit error is
detected, two red error marks will be displayed in the corresponding position in
the waveform.
RS232 Decoding menu list:
Bus Type RS232 Set bus type of decoding as RS232.
48
Page 54

4.Advanced User Guidebook
Common
Baud
and then adjust it in this menu.
Set the data width of each frame to match the signal. It
set the even-odd check mode to match the polarity used
Binary
ON
If a USB storage device is currently connected to the
in a .csv
ON
Turn the M knob to select from the Baud list on the left.
Configure
Display
Custom
Baud
Data Bits
Parity
Format
EventTable
Save
EventTable
Turn the M knob (or tap on in touchscreen) to set
the Baud. The range is 50 to 10,000,000.
Tip: You can select the nearest value in Common Baud,
can be set to 5, 6, 7 or 8.
by the signal.
Decimal
Set the display format of the bus.
Hex
ASCII
Select "ON" to display the event table.
OFF
instrument, save the event table data
(spreadsheet) format ted file on th e external USB storage
device.
ASCII
Table
OFF
Select "ON" to display the ASCII table.
2. I2C Decoding
To decode I2C signal:
(1) Connect the clock line (SCLK) and the data line (SDA) of the I2C signal to the
Signal Input Channels of the oscilloscope.
(2) Adjust to the proper time base and voltage division.
(3) In trigger menu, select Bus trigger, and select bus type as I2C, set parameters
based on the characteristics of th e signal, trigger the signal correctly and obtain
stable display. Refer to "I2C Trigger" on page 44.
(4) Push the Decode button on the front panel. Select bus type as I2C. set parameters
based on the chara cteristics of the si gnal. When the param eters are set cor rectly,
the information carried by the signal will be displayed.
Tip: If there are repetitive m enu items in both trigger menu and decoding menu, you
can set anyone of them, the other will be changed synchronously.
Decoded information interpretation:
49
Page 55

4.Advanced User Guidebook
Information
Abbreviation
Background
Read Address
R, Read, or do not display
Green
Write Address
W, Write, or do not dis play
Green
Data
D, Data, or do not display
Black
MENU
SETTING
INSTRUCTION
Binary
ON
If a USB storage device is currently connected to the
in a .csv
ON
Note:
Use the Trigger Level knob to adjust the thresholds of bus trigger and bus
decoding.
When the ACK (ACKnowledge Character) is not met, two red error marks will be
displayed in the corresponding position in the waveform.
I2C Decoding menu list:
Bus Type I2C Set bus type of decoding as I2C.
Display
Format
EventTable
Save
EventTable
ASCII
Table
Decimal
Hex
ASCII
OFF
instrument, save the event table data
(spreadsheet) format ted file on th e external USB storage
device.
OFF
Set the display format of the bus.
Select "ON" to display the event table.
Select "ON" to display the ASCII table.
3. SPI Decoding
To decode SPI signal:
(1) Connect the clock line (SCLK) and the data line (SDA) of t he SPI signal to the
Signal Input Channels of the oscilloscope.
(2) Adjust to the proper time base and voltage division.
(3) In trigger menu, select Bus trigger, and select bus type as SPI, set parameters
based on the characteristi cs of the signal, trigger the signal correctly and obtain
stable display. Refer to "SPI Trigger" on page 45.
(4) Push the Decode button on the front panel. Select bus type as SPI. set parameters
based on the chara cteristics of the si gnal. When the param eters are set cor rectly,
the information carried by the signal will be displayed.
Tip: If there are repetitive m enu items in both trigger menu and decoding menu, you
can set anyone of them, the other will be changed synchronously.
50
Page 56

4.Advanced User Guidebook
MENU
SETTING
INSTRUCTION
Select the clock edge to match the signal, sample the
Set the minimum time that the clock (SCL) signal must
Set the data width of each frame to match the signal. It
Bit Order
Select LS First or MS First to match the signal.
Binary
ON
If a USB storage device is currently connected to the
in a .csv
ON
Note:
Use the Trigger Level knob to adjust the thresholds of bus trigger and bus
decoding.
LS Firs t in Bit Order menu item (Least Significant Bit First) means that the least
significant bit will arrive first: hence e.g. the hexadecimal number 0x12, will
arrive as the sequenc e 01001000 in binary representation, will be decoded as the
reversed sequence 00010010.
SPI Decoding menu list:
Bus Type SPI Set bus type of decoding as SPI.
Configure
Display
SCLK
Time Out
Data Bits
Format
EventTable
Save
EventTable
SDA data on the rising or falling edge of the clock.
be idle before the oscil los cope star ts to search for the d ata
(SDA) on which to trigger. The range is 30 ns to 10 s.
can be set to any integer between 4 and 32.
Decimal
Set the display format of the bus.
Hex
ASCII
Select "ON" to display the event table.
OFF
instrument, save the event table data
(spreadsheet) format ted file on th e external USB storage
device.
ASCII
Table
OFF
4. CAN Decoding
To decode CAN signal:
(1) Connect the CAN signal to the Signal Input Channel of the oscilloscope.
(2) Adjust to the proper time base and voltage division.
(3) In trigger menu, select Bus trigg er, and select bus type as CAN, set param eters
based on the characteristics of th e signal, trigger the signal correctly and obtain
stable display. Refer to "CAN Trigger" on page 46.
Select "ON" to display the ASCII table.
51
Page 57

4.Advanced User Guidebook
Information
Abbreviation
Background
Identifier
I, ID, or do not display
Green
Overload Frame
OF
Green
Error Frame
EF
Green
Data Length code
L, DLC, or d o not displ ay
Blue
Data
D, Data, or do not display
Black
Error: Red
MENU
SETTING
INSTRUCTION
Binary
ON
If a USB storage device is currently connected to the
in a .csv
ON
(4) Push the Decode button on the front panel. Select bus type as CAN. set
parameters based on the chara cteris tics o f th e si gnal. When the par ameter s are set
correctly, the information carried by the signal will be displayed.
Tip: If there are repetitive m enu items in both trigger menu and decoding menu, you
can set anyone of them, the other will be changed synchronously.
Decoded information interpretation:
Cyclic Redundancy Check C, CRC, or do not display
Valid: Purple
Note:
Use the Trigger Level knob to adjust the thresholds of bus trigger and bus
decoding.
When the ACK (ACKnowledge Character) of Data Frame or Remote Frame is
not met, two red error marks will be displayed in the corresponding position in
the waveform.
Error Frame, R emote Fram e, and Overlo ad Fram e wi ll be identified in the "Data"
column in the event table (Data Frame will not be identified).
CAN Decoding menu list:
Bus Type CAN Set bus type of decoding as CAN.
Decimal
Format
Hex
Set the display format of the bus.
ASCII
EventTable
Display
Save
EventTable
OFF
instrument, save the event table data
(spreadsheet) format ted file on th e external USB storage
device.
ASCII
Table
OFF
Select "ON" to display the event table.
Select "ON" to display the ASCII table.
52
Page 58

4.Advanced User Guidebook
Function Menu
Setting
Description
Sample
Normal sampling mode.
Use to capture maximal and minimal
over adjacent intervals. It is used for the
detection of the jamming burr and the
possibility of reducing the confusion.
Function Menu
Setting
Description
1000
for two channels; max 40M for one
10K
100K
1M
10M
20M
40M
Function Menu
Setting
Description
Sinx/x
Use sine(x)/x interpolation
x
Use linear interpolation
How to Operate the Function Menu
The function menu control zone includes 8 function menu buttons: Measure, Acquire,
Utility, Cursor, Autoscale, Save, Display, Help and 3 immediate-execution buttons :
Autoset, Run/Stop, Single.
How to Implement Sampling Setup
Push the Acquire button, Acqu Mode, Length and Intrpl is shown in the bottom
menu.
The description of the Acqu Mode menu is shown as follows:
samples. Finding highest and lowest points
Acqu
Mode
Peak Detect
Average 4, 16, 64, 128
The description of the Record Length menu is shown as follows:
Length
The description of the Intrpl menu is shown as follows:
Intrpl
Interpolation method is a processing method to connect the sampled points, using
some points to calculate the whole appearance of the waveform. Select the appropriate
interpolation method according to the actual signal.
It is used to reduce the random and don't-care
noises, with the optional number of averages.
Choose the record length
Note: When four channels are turned on, the
max record length is 10M; and max 20M
channel.
Sine(x)/x interpolation: Connect the sampled points with curved lines.
Linear interpolation: Connect the sampled points with straight lines. This method is
53
Page 59

4.Advanced User Guidebook
suitable to rebuild the straight-edged signals, such as square or pulse wave.
Figure 4-3 Sine(x)/x interpolation
Figure 4-4 Linear interpolation
How to Set the Display System
Push the Display button and the Display menu is shown as follows:
54
Page 60

4.Advanced User Guidebook
Function Menu
Setting
Description
Dots
Only the sampling points are displayed.
in the display is filled with the vector form.
OFF
Infinity
ON
OFF
ON
OFF
Full
Screen
ON
OFF
ON
OFF
Erase the results of previous acquisitions from
the display. The oscilloscope will start to
accumulate acquisitions again.
Type
Persist
&Color
XY Mode
Counter
Clear
Persist
Color
Enable
Vect
1 Second
2 Seconds
5 Seconds
The space between th e adjacent samp ling points
Set the persistence time
Turn on/off the color temperature function
Turn on/off XY display function
Turn on/off the full screen view in XY mode
Turn on/off counter
Persist
When the Persist function is used, the persistence display effect of the picture tube
oscilloscope can be simulated. The reserved original data is displayed in fade color
and the new data is in bright color.
(1) Push the Display button.
(2) Select Persist&Color in the bottom menu.
(3) Select Persist in the right menu.
(4) In the Time menu, select the persist time, including OFF, 1 Second, 2 Seconds,
5 Seconds and Infinity. When the "Infinity" option is set for Persist Time, the
measuring points will be stored till the controlling value is changed. Select OFF
to turn off persistence and clear the display.
(5) Select Clear in the bottom menu to erase the results of previous acquisitions from
the display. The oscilloscope will start to accumulate acquisitions again.
Color
Color temperature function uses color-grading to indicate frequency of occurrence.
The hot colors like red/yellow indicate frequently occurring events, and the colder
colors like blue/green indicate rarely occurring events.
55
Page 61
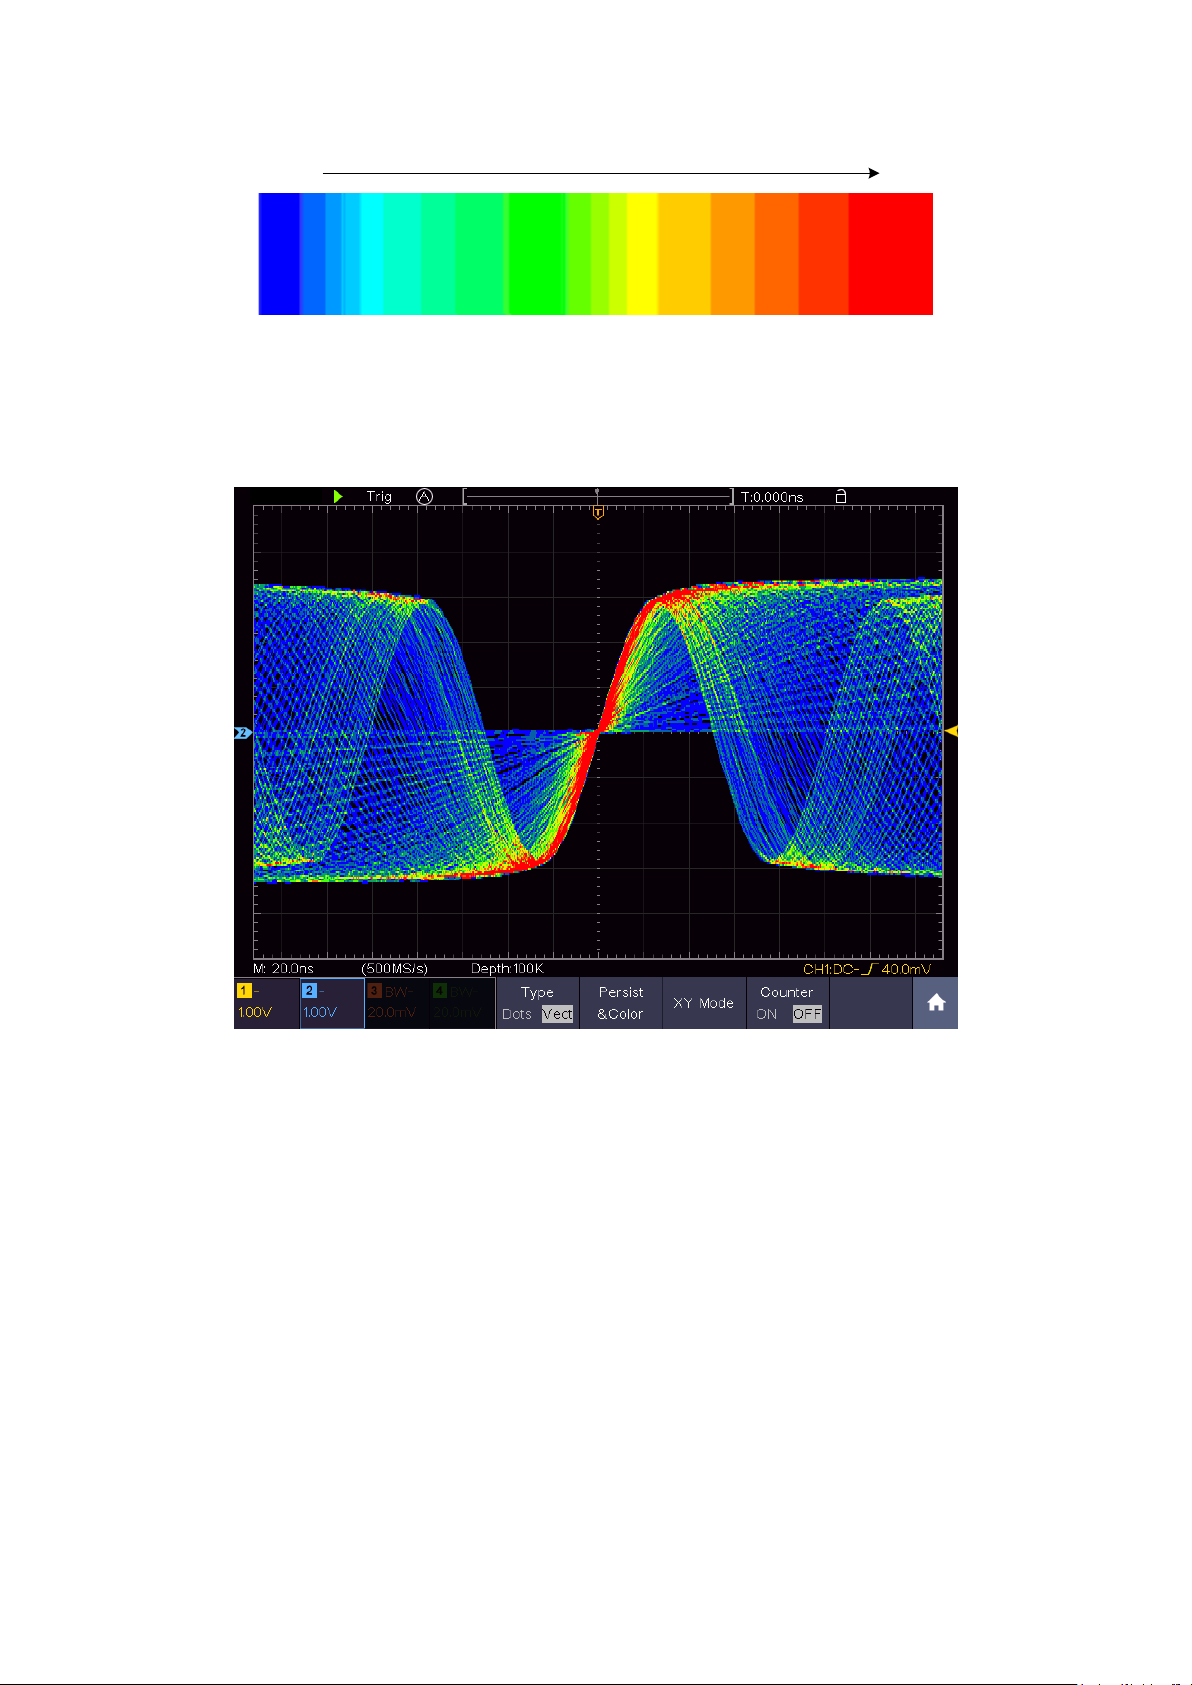
4.Advanced User Guidebook
Cold Hot
(1) Push the Display button.
(2) Select Persist&Color in the bottom menu.
(3) Select Color in the right menu, choose between ON/OFF.
Figure 4-5 The col or temperature function is on
XY Format
This format is only applicable to Channel 1 and Channel 2. After the XY display
format is selected, Channel 1 is displayed in the horizontal axis and Channel 2 in the
vertical axis; the oscilloscope is set in the un-triggered sample mode: the data are
displayed as bright spots.
The operations of all control knobs are as follows:
The Horizontal Scale and the Horizontal Position knobs are used to set the
horizontal scale and position.
The Ver tical Scale and the Vertical Position knobs are used to set the vertical
scale and position.
The following functions can not work in the XY Format:
56
Page 62
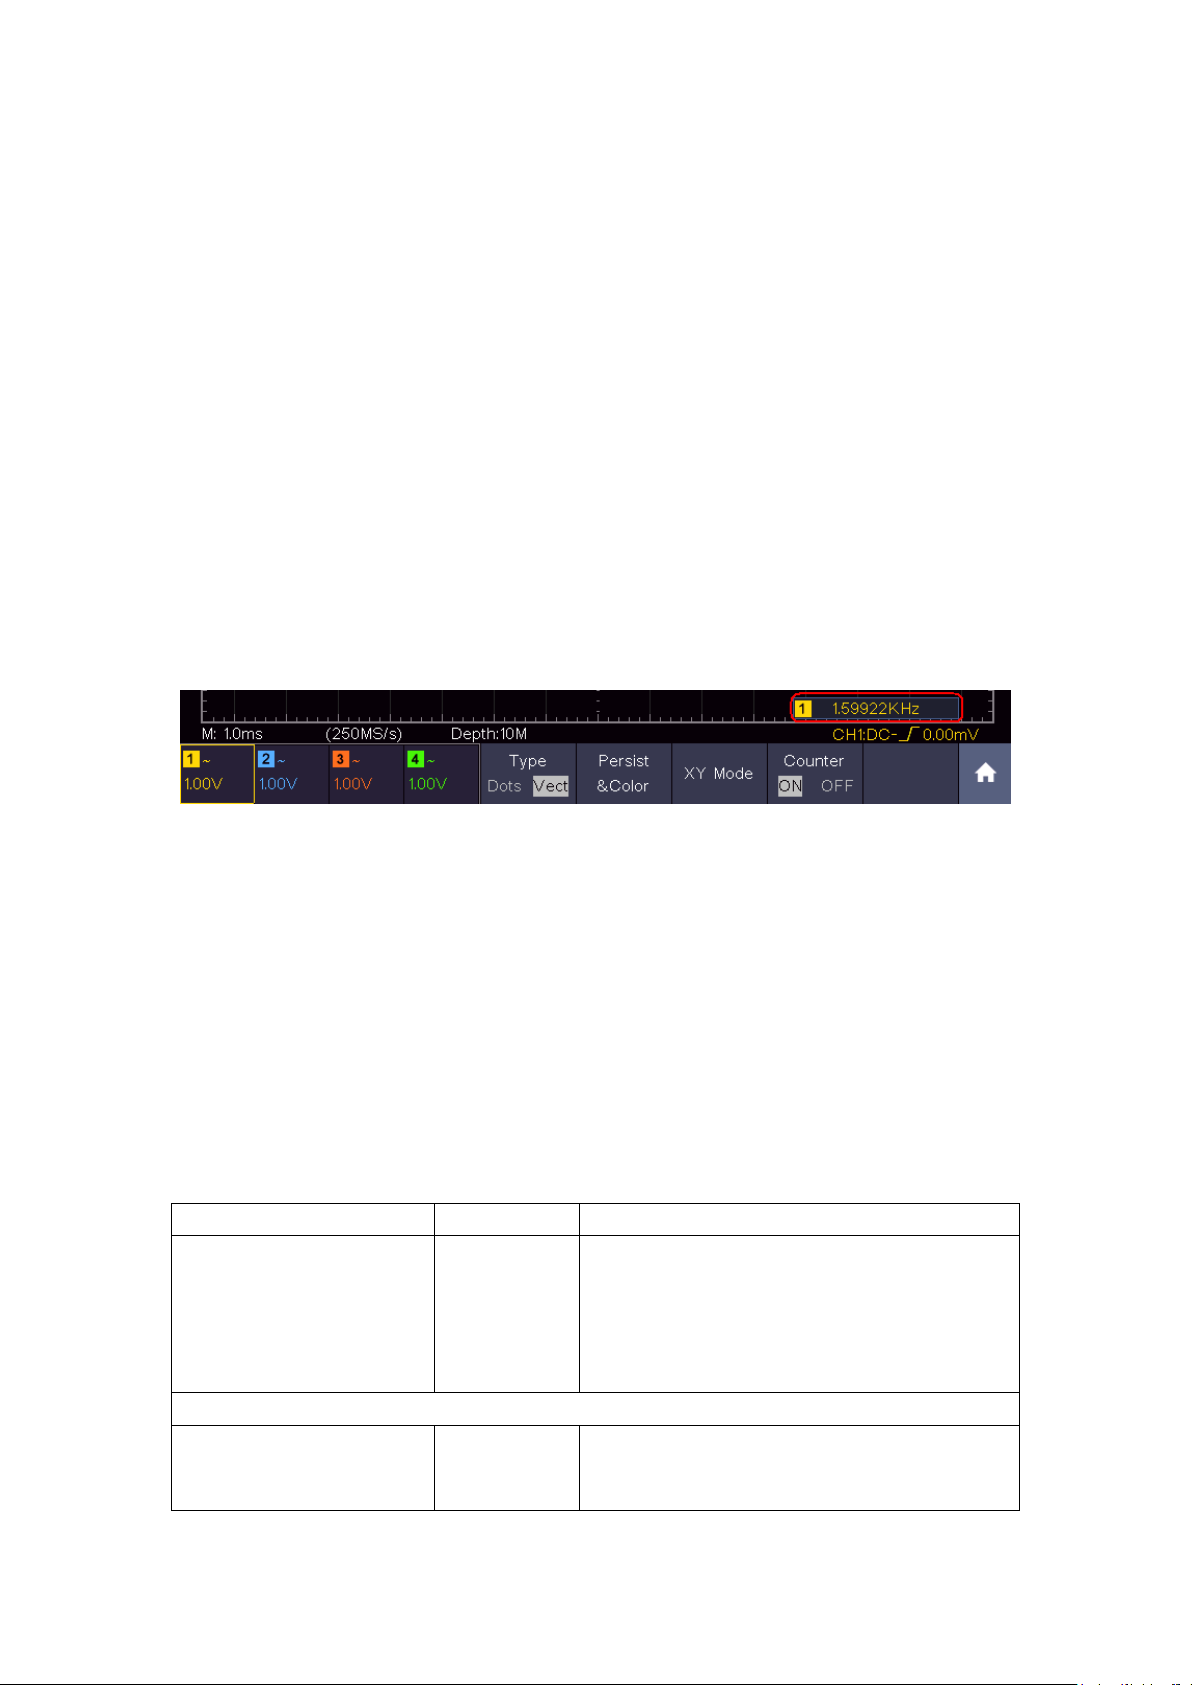
4.Advanced User Guidebook
Function Menu
Setting
Description
Wave
Clone
Choose the saving type.
and Recall a waveform” on P68.
When the type is Wave, the menu shows as following:
Format
For internal storage, only BIN can be
can be BIN, TXT or CSV.
Reference or digital wave form
Cursor
Trigger control
FFT
Operation steps:
1. Push the Display button.
2. Select XY Mode in the bottom menu. Select Enable as ON in the right menu.
3. To make the XY view full screen, select Full Screen as ON in the right menu.
Counter
It is a 6-digit single-channel counter. The co unter can only measure the frequenc y of
the triggering chann el. The frequency range is from 2Hz to the full bandwidth. Onl y if
the measured channel is in Edge mode of Single trigger type, the counter can be
enabled. The counter is displayed at the right bottom of the screen.
Operation steps:
1. Push Trigger M enu button, set the trigger type to Single, set the trigger mode to
Edge, select the signal source.
2. Push the Display button.
3. Select Counter as ON or OFF in the bottom menu.
How to Save and Recall a Waveform
Push the Save button, you can save the waveforms, configures, screen ima ges, record
or clone the waveform.
The description of the Save Function Menu is shown as the following table:
Type
Configure
Image
Record
About the Record type, see "How to
Record/Playback Waveforms" on P64.
About the Clone type, see “How to Clone
Type
Wave
(Right menu)
selected. For external storage, the format
57
Page 63

4.Advanced User Guidebook
CH1
(or MathFFT)
certain channel is off, the corresponding
Wave0 to
Wave99
Choose the address which the waveform is
saved to or recall from.
Recall or close the waveform stored in the
When the show is
the address number and relevant
will prompt "None is saved".
Close all the waveforms stored in the
object address.
Save the waveform of the source to the
save menu is set, you can save the
in the bottom menu, in the
menu, you can select the
storage format.
Save to internal storage or USB storage.
When External is selected, save the
analysis software (on the supplied CD).
When the type is Configure, the menu shows as following:
Setting0
Save the current oscilloscope configure to
the internal storage
Recall the configure from the selected
address
When the type is Image, the menu shows as following:
Source
Object & Show
Object
Show
CH2
CH3
CH4
Math
ON
OFF
Close All
Check the waveform to be saved. (If
menu item will be disabled.)
current object address.
ON, if the current object address has b een
used, the stored waveform will be shown,
information will be displayed at the top left
of the screen; if the address is empty, it
selected address. Whatever the Type of
Save
Storage
Configure
Save
Internal
External
…..
Setting19
waveform by just pressing the Copy panel
button in any user interface.
Select Type
right Format
waveform according to the current record
length (see "Record Length menu" on P53);
the file name is editable. The BIN
waveform file could be open by waveform
The setting address
Load
58
Page 64

4.Advanced User Guidebook
Save the current display screen. The file
file name is editable. The file is stored in
BMP format.
can be only stored in a USB storage, so a
Save
USB storage must be connected first. The
Save and Rec all the Wave form
The oscilloscope can s tore 100 waveforms, which can be displayed with the current
waveform at the same time. The stored waveform called out can not be adjusted.
In order to save the waveform of CH1, CH2 and Math into the address 1, the
operation steps should be followed:
1. Turn on CH1, CH2 and Math channels.
2. Push the Save button.
3. Saving: Select Type in the bottom menu, select Wave in the left menu.
4. Select Storage in the bottom menu, select Internal in the right menu.
5. Select Source in the bottom menu, check CH1, CH2, Math in the right menu for
Source.
6. Select Object & Show in the bottom menu, select Wave1 as object address in the
left menu.
7. Select Save in the bottom menu to save the waveform.
8. Recalling: Select Object & Show in the bottom menu, select Wave1 in the left
menu. In the right menu, select Show as ON, the waveform stored in the address
will be shown, the address number and relevant information will be displayed at
the top left of the screen.
In order to save the w aveform of CH1 and CH2 into the US B storage as a BIN file,
the operation steps should be followed:
1. Turn on CH1 and CH2 channels.
2. Push the Save button.
3. Saving: Select Type in the bottom menu, select Wave in the left menu.
4. Select Storage in the bottom menu, select External in the right menu.
5. Select Type in the bottom menu, select BIN in the right menu as the storage
format.
6. Select Source in the bottom menu, check CH1, CH2 in the right menu for
Source.
7. Select Save in t he bottom menu, an input keyboard used to edit the file name will
59
Page 65

4.Advanced User Guidebook
pop up. The default name is current system date and time. Select the ke y i n
the keyboard to confirm.
8. Recalling: The BIN wav eform fil e could be open b y waveform anal ysis software
(on the supplied CD).
Tip:
Whatever the Type of save menu is set, you can save the waveform by just pressing
the Copy panel button in an y user interface. If the Storage of th e save me nu is set as
"External", you should install the USB disk. Please refer to the contents below to
install the USB disk and name the file to be saved.
Save the current screen im age:
The screen image can only be stored in USB disk, so you should connect a USB disk
with the instrument.
1. Install the USB disk: Insert the USB disk into the "USB Host port" of "Figure
3-1 Front panel". If an icon appears on the top right of the screen, the USB
disk is installed successfully. If the USB disk cannot be recognized, format the
USB disk according to the methods in "USB disk Requirements" on P60.
2. After the USB disk is installed, push the Save panel button, the save menu is
displayed at the bottom of the screen.
3. Select Type in the bottom menu, select Image in the left menu.
4. Select Save in the bottom menu, an input keyboard used to edit the file name will
pop up. The default name is current system date and time. Select the key in
the keyboard to confirm.
USB disk Requirements
The supported format of the USB disk: FAT32 file system, the allocation unit size
cannot exceed 4K, mass storage USB disk is also supported. If the US B disk doesn't
work properly, format it into the supported format and try again. Follow any of the
following two methods to format the USB disk: using system-provided function and
using the formatting tools. (The USB disk of 8 G or 8 G above can only be formatted
using the second method – using the formatting tools.)
Use system-provided function to format the USB disk
1. Connect the USB disk to the computer.
2. Right click Computer- Manage to enter Computer Management interface.
3. Click Disk Management menu, and information about the USB disk will display
on the right side with red mark 1 and 2.
60
Page 66

4.Advanced User Guidebook
Figure 4-6: Disk Management of computer
4. Right click 1 or 2 red mark area, choose Format. And system will pop up a
warning message, click Yes.
Figure 4-7: Format the USB disk warning
5. Set File System as FAT32, Allocation unit size 4096. Check "Perform a qu ick
format" to execute a quick format. Click OK, and then click Yes on the warning
message.
61
Page 67

Figure 4-8: Formatting the USB disk setting
6. Formatting process.
4.Advanced User Guidebook
Figure 4-9: Formatting the USB disk
7. Check whether the USB disk is FAT32 with allocation unit size 4096 after
formatting.
Use Minitool Partition Wizard to format
Download URL: http://www.partitionwizard.com/free-partition-manager.html
Tip: There are many tools for the USB disk formatting on the market, just take
Minitool Partition Wizard for example here.
1. Connect the USB disk to the computer.
2. Open the software Minitool Partition Wizard.
62
Page 68
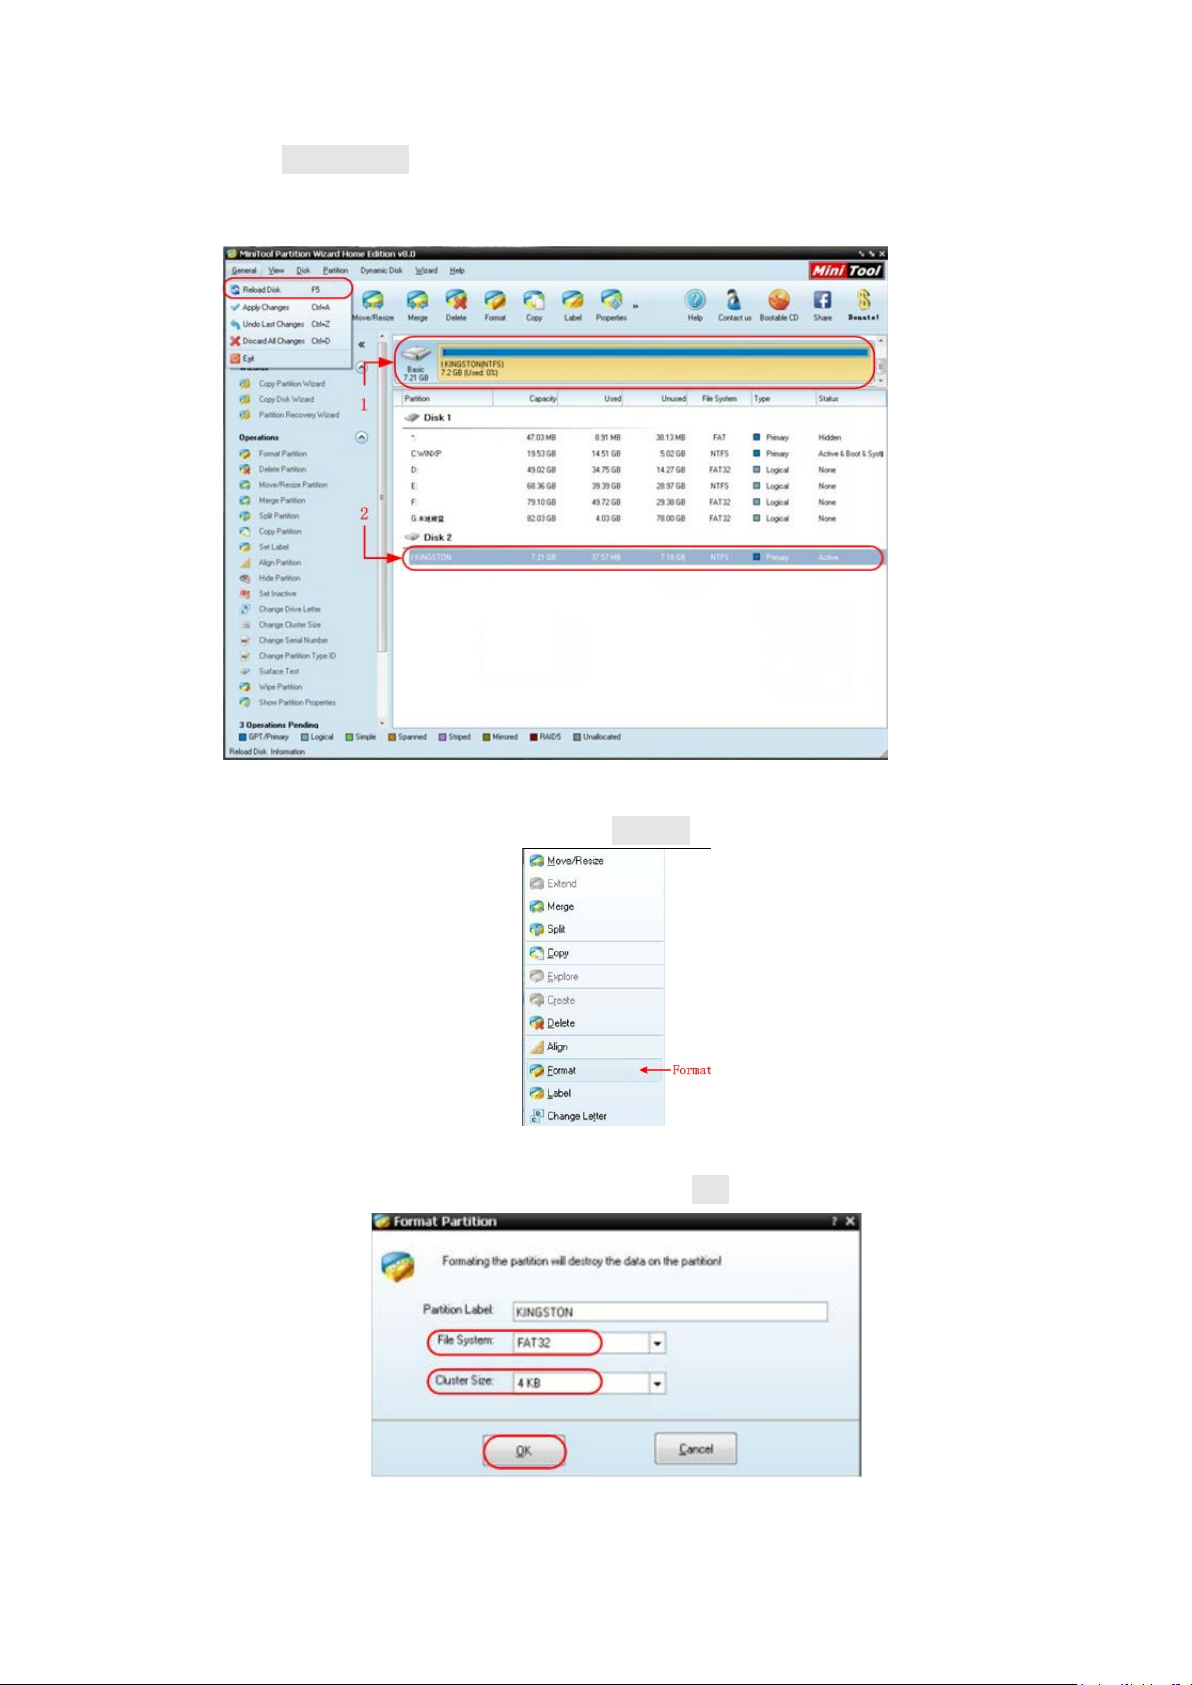
4.Advanced User Guidebook
3. Click Reload Disk on the pull-down menu at the top left or push keyboard F5,
and information about the USB disk will display on the right side with red mark 1
and 2.
Figure 4-10: Reload Disk
4. Right click 1 or 2 red mark area, choose Format.
Figure 4-11: Choose format
5. Set File System FAT32, Cluster size 4096. Click OK.
Figure 4-12: Format setting
63
Page 69

4.Advanced User Guidebook
6. Click Apply at the top left of the menu. Then click Yes on the pop-up warning to
begin formatting.
Figure 4-13: Apply setting
7. Formatting process
Figure 4-14: Format process
8. Format the USB disk successfully
Figure 4-15: Format successfully
How to Record/Playback Waveforms
Push Save button. Select Type in the bottom menu, in the left menu, turn the M knob
to select Record.
Wave Record function can record the input current wave. You can set the interval
between record ed fr am es in the range of 10 ms - 10 s. The max frame number rea ches
1000, and you can get better anal ysis effect with pla yback and storage fu nction. The
64
Page 70

4.Advanced User Guidebook
Menu
Setting
Instruction
OFF
Storage
Close wave record function
Set storage menu
Turn the M knob to select the number of frames to
record (1 - 1000)
Turn the M knob to select the interval between
recorded frames (10ms - 10s)
ON
OFF
Refresh wave during recording
Stop refreshing
Play
Stop
Begin to record
Stop recording
Menu
Setting
Instruction
Start frame
Turn the M knob to select the number of start frame
played back frames (10ms - 10s)
Loop
Once
Play back the wave continuously
Play back the wave just one time
Play
Stop
Begin to record
Stop recording
storage medium contains two kinds: Internal and External.
When the storage medium is Internal, Wave Record contains four modes: OFF,
Record, Playback and Storage.
When storage medium is External, Wave Record contains two modes: OFF, Record.
Record: To record wave according to the interval until it reaches the end frame set.
Record menu (Internal Storage) shows as follows:
Mode
Record
Playback
Set record menu
Set playback menu
End frame
Record mode
FrameSet
Interval
Refresh
Operate
Note:
Both of the waveforms of Channel 1 and Channel 2 will be recorded. If a Channel is
turned off while recording, the waveform of the channel is invalid in the playback
mode.
Playback: Play back the wave recorded or saved.
Playback menu shows as follows:
Playback Mode
FrameSet
End frame
Cur frame
Interval
to playback (1 - 1000)
Turn the M knob to select the number of end frame
to playback (1 - 1000)
Turn the M knob to select the number of current
frame to playback (1 - 1000)
Turn the M knob to select the interval between
Play mode
Operate
Storage: Save the current wave according to the start frame and end frame set.
Storage menu shows as follows:
65
Page 71

4.Advanced User Guidebook
Menu
Setting
Instruction
Turn the M knob to select the number of start frame
to store (1 - 1000)
Turn the M knob to select the number of end frame to
store (1 - 1000)
Save
Save the waveform record file to the internal memory
Load
Load the waveform record file from the memory
Menu
Setting
Instruction
OFF
Record
Close wave record function
Set record menu
Turn the M knob to select the number of frames to
record (1 – 900,000)
Turn the M knob to select the interval between
recorded frames (10ms - 10s)
Infinity
Record infinitely until the storage medium is full
ON
OFF
Refresh wave during recording
Stop refreshing
Storage
Start frame
Mode
Frame Set
End frame
To use wave record function, do as follows:
(1) Push Save button.
(2) Select Type in the bottom menu, in the left menu, turn the M knob to select
Record.
(3) Select Mode in the bottom menu, select OFF in the right menu.
(4) In the bottom menu, select Storage as Internal.
(5) Select Mode in the bottom menu, select Record in the right menu.
(6) Select FrameSet in the bottom menu, set End frame and Interval in the right
menu.
(7) In the bottom menu, set Refresh.
(8) In the bottom menu, select Operate as Play.
(9) Select Mode in the bottom menu, select Playback in the right menu. Set
FrameSet and Playmode, select Operate as Play.
(10) To save the wave recorded, select Mode in the bottom menu, select Storage in
the right menu. Select FrameSet in the bottom menu to set th e range of frames to
store, select Save in the bottom menu.
(11) To load the waveform from the internal memory, select Load in the bottom menu,
then enter the Playback of the Mode to analyze the wave.
Note: When pla ybacking the waveform, the sampling, trigger, or display function is
not available.
When storage medium is External, Wave Record contains two modes: OFF,
Record.
Record menu (External Storage) shows as follows:
Mode
End frame
Record mode
FrameSet
Interval
Refresh
66
Page 72

4.Advanced User Guidebook
Play
Stop
Begin to record
Stop recording
Operate
Note:
Both of the waveforms of Channel 1 and Channel 2 will be recorded. If a Channel is
turned off while recording, the waveform of the channel is invalid in the playback
mode.
To use wave record to external, do as follows:
1. Push Save button.
2. Select Type in the bottom menu, in the left menu, turn the M knob to select
Record.
3. Select Mode in the bottom menu, select OFF in the right menu.
4. In the bottom menu, select Storage as External.
5. Select Mode in the bottom menu, select Record in the right menu.
6. Select FrameSet in the bottom menu, set End frame and Interval in the right
menu. If you want to record wave to external infinitely, select Infinity in the right
menu, the End frame will display “-”.
7. In the bottom menu, set Refresh.
8. In the bottom menu, select Operate as Play.
Connect external device to the computer, and wave_record_0.bin is the recorded
file. Open the software, and do as follows to play back the waveform.
1. Choose Communications Auto Player.
2. Transform recording waveform from machine.
3. Add the well transformed files.
4. Set play mode and time delay.
5. Click the green button on the left corner to begin playing back the waveform.
67
Page 73

4.Advanced User Guidebook
Menu
Setting
Instruction
Type
Clone
Select the clone function.
Mode
Select the source mode.
m, which
The cloned waveform includes one waveform, which
The cloned waveform includes two waveforms, which
will be used for AG Out1 and AG Out2
AG Output
CH3 CH4
AG Output
CH3 CH4
Figure 4-16: Play back waveform by software
How to Clone and Recall a waveform
Push Save button. Select Type in the bottom menu, in the left menu, turn the M knob
to select Clone.
You can clone on e or two channel wav eforms between two cu rsors, and save it as a
cloned waveform in to th e internal memory or a USB m emory device. Y ou can save
four cloned waveform s in the instrument internal memory. The cloned waveform files
saved to a USB memory device are saved with the extension "ota".
If the optional Arbitrary Function Generator is available in your instrument, you can
output the stored waveform from a file in the internal memory or in a USB memory
device; and the waveform between two cursors can be output directly without save
operation.
Clone W ave menu shows as follows:
Source
Out1
Out2
Out1&Out2
Out1
CH1 CH2
Out2
CH1 CH2
The cloned waveform includes one wavefor
will be used for AG Out1
will be used for AG Out2
Select the source, which will be used for AG Out1
Select the source, which will be used for AG Out2
68
Page 74
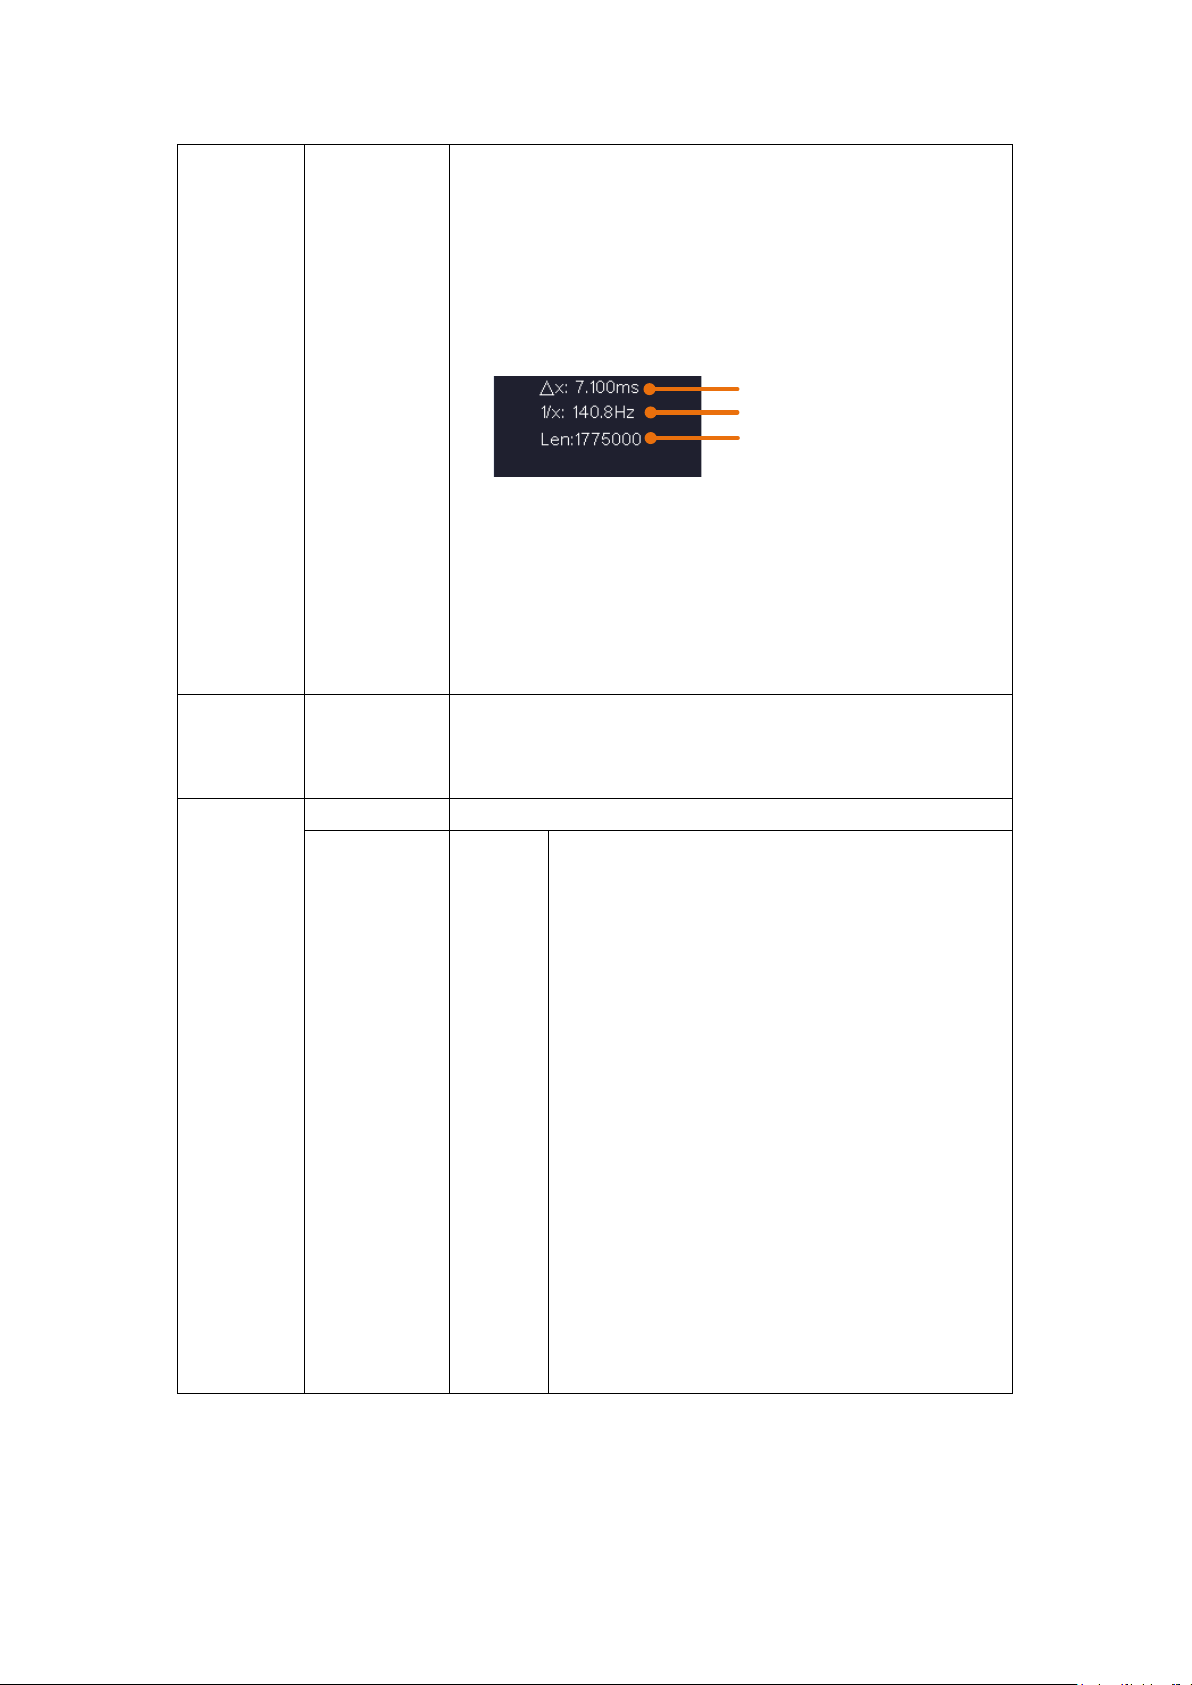
4.Advanced User Guidebook
a
Turn the M knob to move line a.
the
is displayed at the left bottom
Length
Frequency
Time
appears in the information or a
e screen, that means the length of the cloned
is
When the
.
in the bottom
menu, and set the record length to a smaller value.
Clone
available)
, and output it
Save
Save the waveform between two cursors
You can select one of the four objects in the
left list. When selecting a object, a message
center, show the
"Current object: Out1 have no output,
"Current object: Out1 have output, Out2
means one waveform is
"Current object: Out1 have no output,
means one waveform is
"Current object: Out1 have output, Out2
wo waveforms are stor ed
in this object, its source mode is Out1&Out2.
Line
(When the
generator is
b
ab
x
Clone
Turn the M knob to move line b.
Two cursors are linked. Turn the M knob to move
pair of cursors.
Set the cursors to select the entire screen automatically.
The waveform information
corner of the screen.
Note: If "Out Of Limits"
message "Waveform points beyond the limit." appears
on th
waveform exceeds the limit. When the source mode
Out1 or Out2, the maximum length is 2M;
source mode is Out1&Out2, the maximum length is 1M
Push the Acquire button, select Length
Clone the waveform between two cursors
through the built-in generator.
Save
Storage Internal
will appear in the screen
information of the selected object.
Out2 have no output" means no waveform is
stored in this object.
have no output"
stored in this object, its source mode is Out1.
Out2 have output"
stored in this object, its source mode is Out2.
have output" means t
69
Page 75

4.Advanced User Guidebook
Save the waveform onto a USB memory
a USB memory device into the port on
appears on the
top right of the screen, the USB memory
. If the USB
memory device cannot be recognized, format
the USB memory device according to the
.
onto
the USB memory device as a OTA file.
(Generator is available and internal storage is selected)
Output the waveform stored in the selected object.
device
Insert
the front panel. If the icon
External
device is installed successfully
methods in "USB disk Requirements" on P60
The name is default as cu rrent s ystem date and
time. The cloned waveform will be saved
Output
The following steps take the oscilloscope with dual-channel AG for instance.
To save the CH1 waveform and save to the internal/USB memory:
(1) Push Save button.
(2) Select Type in the bottom menu, turn the M knob to select Clone in the left
menu.
(3) Select Source in the bottom menu, select Mode as Out1. in the right menu.
(4) Select AG Output Out1 as CH1. in the right menu.
(5) Select Line in the bottom menu. If a or b is selected, turn the M knob to move the
cursor. If ab is selected, turn the M knob to move the pair of cursors. If x is
selected, the entire screen will be selected automatically.
(6) Select Save in the bottom menu.
To save the waveform to internal memory, select Storage in the right menu
as Internal. Turn the M knob to select an object in the left menu, select Save
in the right menu.
To save the waveform onto a USB memory device, select Storage in the
right menu as External. Select Save in the right menu. An input keyboard
used to edit the file name will pop up. Turn the M knob to select the keys,
push the knob to input. Select the key in the keyboard to confirm. The
cloned waveform will be saved onto the USB memory device as a OTA file.
To output the waveform stored in the internal memory through the generator:
(The generator is optional.)
(1) Push Save button.
(2) Select Type in the bottom menu, turn the M knob to select Clone in the left
menu.
(3) Select Save in the bottom menu, select Storage as Internal in the right menu.
(4) Turn the M knob to select an object in the left menu.
70
Page 76

4.Advanced User Guidebook
(5) Select Output in the right menu.
To output the waveform stored in the USB memory device through the generator:
(The generator is optional.)
(1) Push button to set the output channel of the generator.
(2) Select Arb in the bottom menu, select Others in the right menu, and select File
Browse.
(3) select Memory in the right menu as USB. The instrument lists a directory of the
folders and files on the USB memory device. Select a folder or file using the M
knob to scroll up and down the list. To enter the current folder, select Change Dir
in the right menu, select it again to return to the upper directory.
(4) Select the desired ota file, select Read in the right menu.
To output the CH1 and CH2 waveforms through the generator directly:
(The generator is optional.)
(1) Push Save button.
(2) Select Type in the bottom menu, turn the M knob to select Clone in the left
menu.
(3) Select Source in the bottom menu, select Mode as Out1&Out2 in the right
menu.
(4) In the right menu, select AG Output Out1 as CH1; select AG Output Out2 as
CH2.
(5) Select Line in the bottom menu. Select the cursor and move it to select the
desired waveform.
(6) Select Clone in the bottom menu. The generator will output the waveform
between two cursors.
Data format description of OTA waveform file
If the source mode is set to Out1 or Out2, OTA file consists of two parts: the file header and the
channel data. If the source mode is set to Out1&Out2, OTA file consists of three parts: file header,
the first channel data, and the second channel data. The file header represents the parameter of file
data, which is expressed in "parameter name + value". Each parameter name is a case-sensitive
string of 4 bytes. The parameter value is at least 4 bytes.
1.Format description of the file header:
1) HEAD
Parameter name Meaning Value Comment
HEAD Header size 4 bytes int
2) TYPE
Parameter name Meaning Value Comment
TYPE Model 12 bytes char
3) BYTE
71
Page 77

4.Advanced User Guidebook
Parameter name Meaning Value Comment
BYTE Data length in bit 4 bytes int
4) SIZE
Parameter name Meaning Value Comment
SIZE File size 4 bytes int Used to check the file
integrity
5) V O LT
Parameter name Meaning Value Comment
VOLT Voltage division,
divided by 400 is
ADC resolution.
(When the source
mode is Out1&Out2,
it is the first channel
voltage division.)
6) SAMP
Parameter name Meaning Value Comment
SAMP Sample rate 4 bytes float The unit is Sa/s.
7) ADCB
Parameter name Meaning Value Comment
ADCB ADC bit, ADC
resolution
8) CHAN
Parameter name Meaning Value Comment
CHAN Number of channels 4 bytes int 1 or 2
9) VOL2
Parameter name Meaning Value Comment
VOL2 Voltage division,
divided by 400 is
ADC resolution.
(When the source
mode is Out1&Out2,
it is the second
channel voltage
division.)
4 bytes float The value indicates voltage
(the unit is mV), such as 200
mV.
4 bytes int 8-bit or 12-bit
4 bytes float The value indicates voltage
(the unit is mV), such as 200
mV.
2.Data
The data type is signed integer. You can determine the data type (char, short int or int) based on
the BYTE parameter. The valid range is determined by the ADCB parameter, e.g. the valid range
for 8-bit ADC is -127 to +127.
72
Page 78
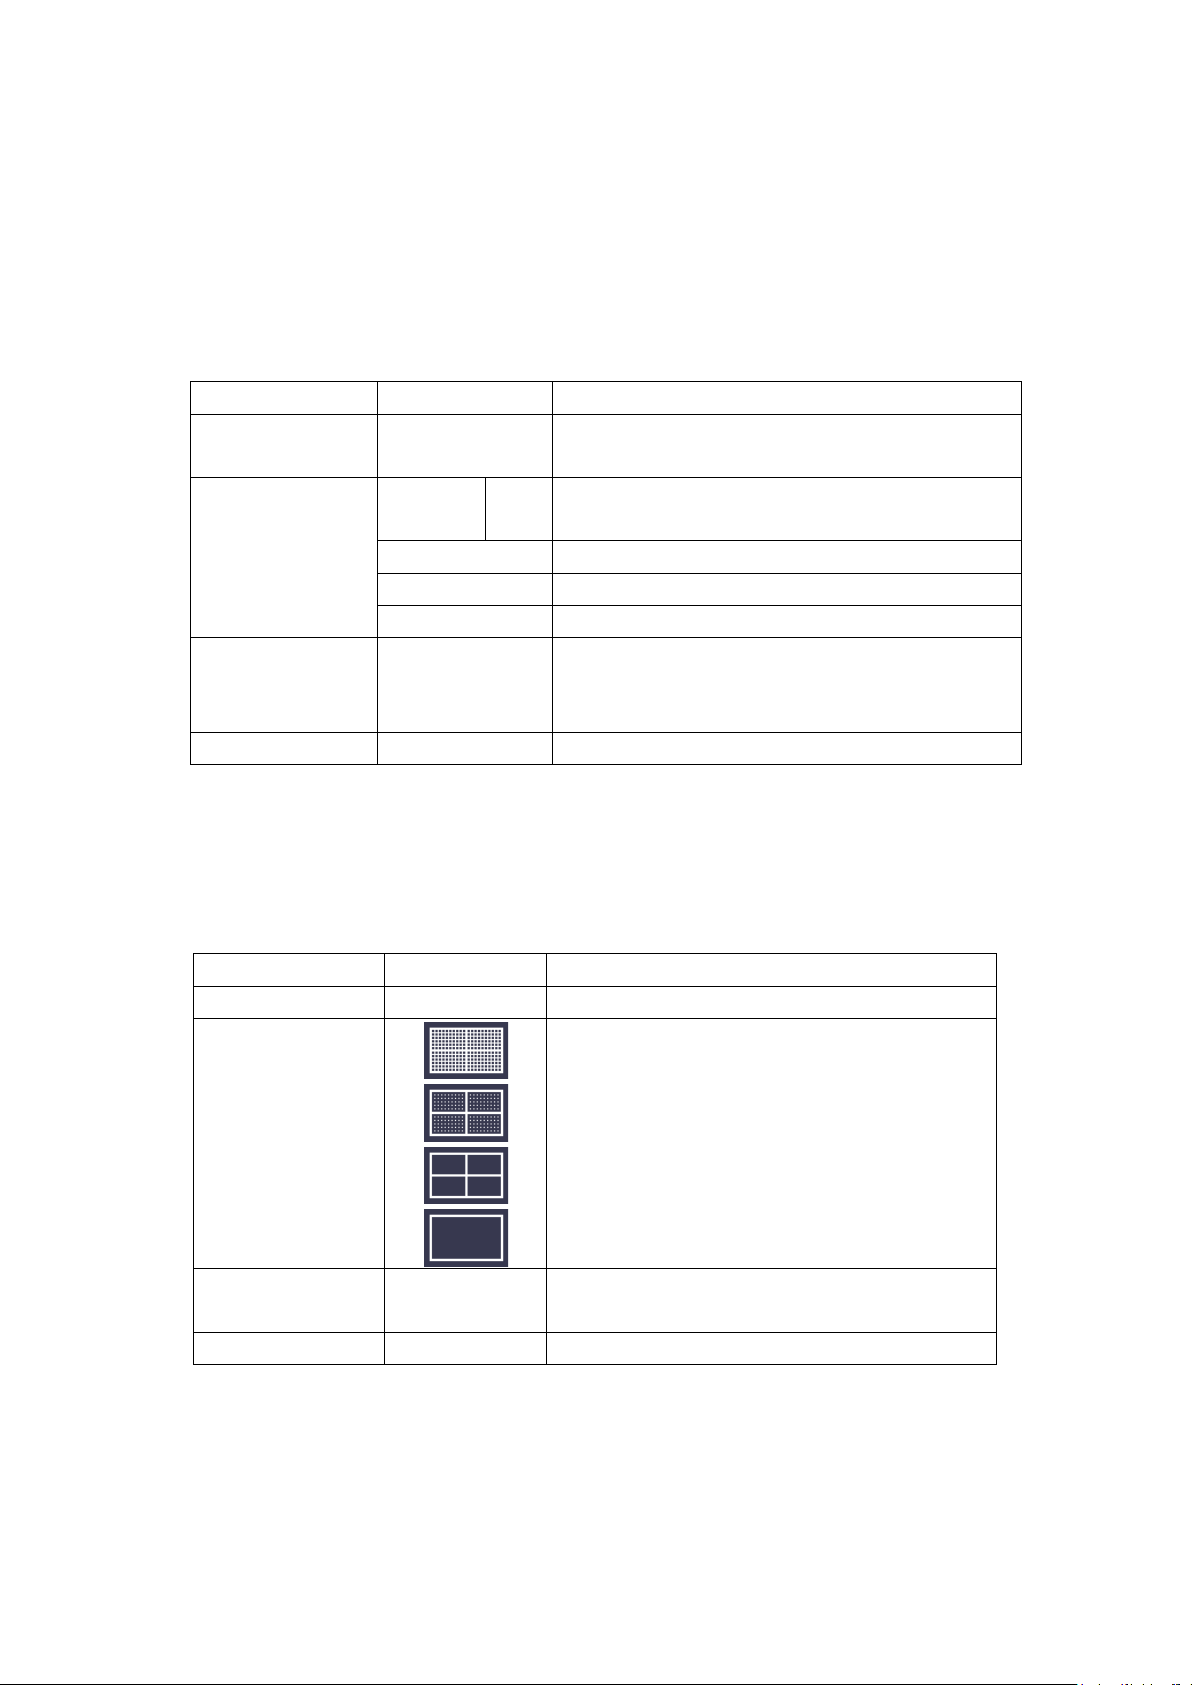
4.Advanced User Guidebook
Function Menu
Setting
Description
Choose the display language of the operating
system.
ON
OFF
Hour Min
Setting Hour/Minute
Day Month
Setting Date/Month
Year
Setting Year
Lock all keys. Unlock method: push Trigger
Force button, repeat 3 times.
About
Version number and serial number showing
Function Menu
Setting
Description
BackLight
0% - 100%
Turn the M knob to adjust the backlight.
ON
OFF
Menu Time
OFF, 5s - 30s
Set the disappear time of menu
How to Implement the Auxiliary System Function Setting
●Config
Push the Utility button, select Function in the bottom menu, select Configure in
the left menu.
The description of Configure Menu is shown as the follows:
Language
Display
Set Time
KeyLock
On/Off the date display
Menu button in trigger control area, then push
●Display
Push the Utility button, select Function in the bottom menu, select Display in the
left menu.
The description of Display Menu is shown as the follows:
Graticule
Battery
●Adjust
Push the Utility button, select Function in the bottom menu, select Adjust in the
left menu.
The description of Adjust Menu is shown as the follows:
Select the grid type
Turn on or off the battery display
73
Page 79

4.Advanced User Guidebook
Function Menu
Description
Self Cal
Carry out the self-calibration procedure.
Default
Call out the factory settings.
ProbeCh.
Check whether probe attenuation is good.
Function Menu
Setting
Description
Enable
Operate
Control enable switch
Control operate switch
Pass
Info
Signal tested corresponds with the rule
Control the display status of info frame
Do Self Cal (Self-Calibration)
The self-calibration procedure can improve the accuracy of the oscilloscope under
the ambient temperature to the greatest extent. If the change of the ambient
temperature is up to or exceeds 5℃, the self-calibration procedure should be
executed to obtain the highest level of accuracy.
Before executing the self-calibration procedure, disconnect all probes or wires from
the input connector. Push the Utility button, select Function in the bottom menu,
the function menu will display at the left, select Adjust. If everything is ready,
select Self Cal in the bottom menu to enter the self-calibration procedure of the
instrument.
Probe checking
To check whether probe attenuation is good. The results contain three circumstances:
Overflow compensation, Good compensation, Inadequate compensation. According to
the checking result, users can adjust probe attenuation to the best. Operation steps are
as follows:
1. Connect the probe to CH1, adjust the probe attenuation to the maximum.
2. Push the Utility button, select Function in the bottom menu, select Adjust in the
left menu.
3. Select ProbeCh. in the bottom menu, tips about probe checking shows on the
screen.
4. Select ProbeCh. again to begin probe checking and the checking result will occur
after 3s; push any other key to quit.
● Pass/Fail
The Pass/Fail function monitors changes of signals and output pass or fail signals by
comparing the input signal that is within the pre-defined mask.
Push the Utility button, select Function in the bottom menu, select Pass/fail in the
left menu.
operate
Output
Fail
Beep
Stop
Signal tested not correspond with the rule
Beep when it satisfies the rule
Stop once satisfying the rule
74
Page 80

4.Advanced User Guidebook
Source
Create
Select the source as CH1, CH2, CH3 or CH4
Use the rule set as testing rule
Number
Load
Select any one from Rule1 - Rule8 as your rule name
Load some rule as the testing rule
Rule
SaveRule
Horizontal
Vertical
Save
Change the Horizontal tolerance value by turning the
M knob
Change the Vertical t olerance value by turnin g the M
knob
Select Save to save the rule
The description of Pass/fail Menu is shown as the follows:
Pass/Fail test:
Detect whether the input signal is within the limits of the rule, if it exceeds limits of
the rule, it is "Fail"; otherwise it is "Pass". Also it can output fail or pass signal b y
built-in and configurable output port. To run the test, read the following steps:
1. Push the Utility button, select Function in the bottom menu, select Pass/fail in the
left menu.
2. Enable switch on: Select Operate in the bottom menu, select Enable in the right
menu as ON.
3. Create rule: Select Rule in the bottom menu. Select Source in the right menu,
select the source in the left menu. Set Horizontal tolerance and Vertical tolerance
in the right menu. Select Create in the right menu to create the rule.
4. Set output type: Select Output in the bottom menu t o enter output option setting.
Choose any one or two of the options "Pass", "Fail" or "Beep". "Pass" and "Fail"
are mutually exclusive options, which could not be chosen simultaneously. "Stop"
means stop once the condition satisfies your setting.
5. Begin to test: Select Operate in the bottom menu, select Operate in the right
menu as Start, the test will begin.
6. Save rule: Select SaveRule in the bottom menu. Select the save location in the
left menu, and then select Save in the right menu to save the rules, which could be
called up at once when need. Select Load to call up the rule saved.
Note:
1. When Pass/Fail is ON, if XY or FFT is ready to run, then Pass/Fail will be closed;
under the mode of XY or FFT, Pass/Fail is unable.
2. Under the mode of Factory, Auto Scale and Auto Set, Pass/Fail will be closed.
3. When no save setting left in the rule save, tip will be given to show "NO RULE
SAVED".
4. Under the status of stop, data comparin g will stop, and when it goes on running,
the number of Pass/Fail will increase from the former number, not from zero.
5. When the waveform playback mode is on, Pass/Fail is used to test the
played-back waveform specially.
● Output
Push the Utility button, select Function in the bottom menu, select Output in the left
menu.
75
Page 81

4.Advanced User Guidebook
Function
Menu
Trig level
Output trig signal synchronously
Pass/fail
Output High Level when Pass , and Low Level when Fail
CH2 Output of dual-channel waveform generator
(optional)
Output menu item in the bottom menu sets the output type of Trig Out(P/F) port on
Rear Panel. In the bottom menu, select Output. The description of Output menu is
shown as the follows:
Setting Description
Type
AG
Output
Device and Print Setup menu items set the print output, refer to "How to Print the
Screen Image" on page 89.
● LAN Set
Using the LAN port, the oscilloscope can be connected with a computer.
● Update
Use the front-panel USB port to update your instrument firmware using a USB
memory device. Refer to "How to Update your Instrument Firmware" on page 76.
● FRA (Frequency Response Analysis)
If there is a built-in arbitrary function generator (optional), you can use the frequency
response analysis. Refer to "Frequency Response Analysis" on page 97.
How to Update your Instrument Firmware
Use the front-panel USB port to update your instrument firmware using a USB
memory device.
USB memory device requirements: Insert a USB memory device into the USB port
on the front panel. If the icon appears on the top right of the screen, the USB
memory device is installed successfully. If the USB memory device cannot be
detected, format the USB memory device according to the methods in "USB disk
Requirements" on P60.
Caution: Updating your instrument firmware is a sensitive operation, to prevent
damage to the instrument, do not power off the instrument or remove the USB
memory device during the update process.
To update your instrument firmware, do the following:
1. Push the Utility button, select Function in the bottom menu, select Configure in
the left menu, select About in the bottom menu. View the model and the currently
76
Page 82

4.Advanced User Guidebook
installed firmware version.
2. From a PC, visit the website and check if the website offers a newer firmware
version. Download the firmware file. The file name must be *.update. The file
name can be up to 15 characters long (including the suffix). Copy the firmware
file onto your USB memory device.
3. Insert the USB memory device into the front-panel USB port on your instrument.
4. Push the Utility button, select Function in the bottom menu, select Update in the
left menu.
5. Select Open in the bottom menu, the instrument lists a directory of the folders on
the USB memory device. Turn the M knob to select a folder, select Open in the
bottom menu to enter t he folder. Navigate to the folder wh ere the firmw are file is,
and select the file with the .update suffix.
6. In the bottom menu, select Open, the messages below will be shown.
7.
In the bottom menu, select Start again, the interfaces below will be displayed in
sequence. The update process will take up to three minutes. After completion, the
instrument will be shut down automatically.
8.
Long press the
button to power on the instrument.
How to Measure Automatically
Push the Measure button to display the menu for the settings of the Automatic
77
Page 83

4.Advanced User Guidebook
Function Menu
Description
Meas Type
(left menu)
Source
CH3 CH4
Add the selected measure types (shown at the left
bottom, you could only add 8 types at most)
Select the types need to be deleted.
Remove menu on the right.
Remove All
Remove all the measures
ON
OFF
Show all the measures of the snapshot source
Turn off the snapshot
CH1
CH4
Measurements. At most 8 t ypes of measurements could be displayed on the bottom
left of the screen.
The oscilloscopes provide 31 parameters for auto measurement, including Period,
Frequency, Mean, PK-PK, RMS, Max, Min, Top, Base, Amplitude, Overshoot,
Preshoot, Rise Time, Fall Time, +PulseWidth, -PulseWidth, +Duty Cycle, -Duty
Cycle, Delay A→B , Delay A→B, Cycle RMS, Cursor RMS, Screen Duty,
Phase A→B , Phase A→B , +PulseCount, -PulseCount, RiseEdgeCnt,
FallEdgeCnt, Area, and Cycle Area.
The "Automatic Measurements" menu is described as the following table:
Select the measure types
Add
CH1 CH2
Select the source
Add
Meas Type
(left menu)
The selected type and source are shown in the
Remove
Remove Remove the selected measure type
Snapshot
Source
CH2
CH3
Select the snapshot source
Measure
Only if the waveform channel is in the ON state, the measurement can be performed.
The autom atic measur ement can not be performed in the following situation: 1) On
the saved waveform. 2) On Waveform Math waveform. 3) On the Video trigger
mode.
On the Scan format, period and frequency can not be measured.
Measure the period, the frequency of the CH1, following the steps below:
1. Push the Measure front panel button to show the Measure menu.
2. Select Add in the bottom menu.
3. In the left Type menu, turn the M knob to select Period.
4. In the right menu, select CH1 in the Source menu item.
78
Page 84

4.Advanced User Guidebook
5. In the right menu, select Add. The period type is added.
6. In the left Type menu, turn the M knob to select Frequency.
7. In the right menu, select CH1 in the Source menu item.
8. In the right menu, select Add. The frequency type is added.
The measured value will be displayed at the bottom left of the screen automatically
(see Figure 4-17).
Figure 4-17 Automatic measurement
The automatic measurement of voltage parameters
The oscilloscopes provide automatic voltage measurements including Mean, PK-PK,
RMS, Max, Min, Vtop, Vbase, Vamp, OverShoot, PreShoot, Cycle RMS, and
Cursor RMS. Figure 4-18 below shows a pulse with some of the voltage
measurement points.
79
Page 85

4.Advanced User Guidebook
Figure 4-18
Mean: The arithmetic mean over the entire waveform.
PK-PK: Peak-to-Peak Voltage.
RMS: The true Root Mean Square voltage over the entire waveform.
Max: The maximum amplit ude. The most positive peak voltage measured over the
entire waveform.
Min: The minimum amplitude. The most negative peak voltage measured over the
entire waveform.
Vtop: Voltage of the waveform's flat top, useful for square/pulse waveforms.
Vbase: Voltage of the waveform's flat base, useful for square/pulse waveforms.
Vamp: Voltage between Vtop and Vbase of a waveform.
OverShoot: Defined as (Vmax-Vtop)/Vamp, useful for square and pulse
waveforms.
PreShoot: Defined as (Vmin-Vbase)/Vamp, useful for square and pulse
waveforms.
Cycle RMS: The true Root Mean Square voltage over the first entire period of the
waveform.
Cursor RMS: The true Root Mean Square voltage over the range of two cursors.
The automat ic measurement of time parameters
The oscilloscopes provide time parameters auto-measurements include Period,
Frequency, Rise Time, Fall Time, +D width, -D width, +Duty, -Duty, Delay
A→B , Delay A→B , Screen Duty , Phase A→B, and Phase A→B .
Figure 4-19 shows a pulse with some of the time measurement points.
Figure 4-19
Rise Time: Time that the leading edge of the first pulse in the waveform takes to
rise from 10% to 90% of its amplitude.
Fall Time: Time that the falling edge of the first pulse in the waveform takes to
fall from 90% to 10% of its amplitude.
80
Page 86

4.Advanced User Guidebook
+D width: The width of the first positive pulse in 50% amplitude points.
-D width: The width of the first negative pulse in the 50% amplitude points.
+Duty: +Duty Cycle, defined as +Width/Period.
-Duty:-Duty Cycle, defined as -Width/Period.
Delay A→B : The delay between the two channels at the rising edge.
Delay A→B : The delay between the two channels at the falling edge.
Screen Duty: Defines as (the width of the positive pulse)/(Entire period)
Phase A→B : Phase difference calculated according to " Delay A→B " and
the period of source A, expressed in degree. The calculation formula is as shown
below:
Phase A→B = (Delay A→B ÷ Period of source A) × 360°
Phase A→B : Phase difference calculated according to " Delay A→B " and
the period of source A, expressed in degree. The calculation formula is as shown
below:
Phase A→B = (Delay A→B ÷ Period of source A) × 360°
Other measurements
+PulseCount : The number of positive pulses that rise above the mid
reference crossing in the waveform.
-PulseCount
reference crossing in the waveform.
RiseEdgeCnt
value to the high reference value in the waveform.
FallEdgeCnt
reference value to the low reference value in the waveform.
Area : The area of the whole waveform within the screen and the unit is
voltage-second. The area measured above the zero reference (namely the vertical
offset) is positive; the area measured below the zero reference is negative. The
area measured is the algebraic sum of the area of the whole waveform within the
screen.
: The number of negative pulses that fall below the mid
: The number of positive transitions from the low reference
: The number of negative transitions from the high
Cycle Area : The area of the first period of waveform on the screen and
the unit is voltage-second. The area above the zero reference (namely the vertical
offset) is positive and the area below the zero reference is negative. The area
measured is the algebraic sum of the area of the whole period waveform.
Note: When the waveform on the screen is less than a period, the period area
measured is 0.
81
Page 87

4.Advanced User Guidebook
Function
Menu
Voltage
Display the voltage measurement cursor and menu.
the vertical cursors and the waveform
Line Type
tage type)
Window
mode)
a
Turn the M knob to move line a.
the pair of cursors.
Display the channel to which the cursor
measurement will be applied.
How to Measure with Cursors
Push the Cursor button to turn cursors on and display the cursor menu. Push it
again to turn cursors off.
The Cursor Measurement for normal mode:
The description of the cursor menu is shown as the following table:
Setting Description
Type
(Time&Vol
(Wave
zoom
Line
Time
Time&Voltage
AutoCursr
Time
Voltage
Main
Extension
b
ab
Display the time measurement cursor and menu.
Display the time and voltage measurement cursor
and menu.
The horizontal cursors ar e set as t he intersections of
Makes the vertical cursors active.
Makes the horizontal cursors active.
Measure in the main window.
Measure in the extension window.
Turn the M knob to move line b.
Two cursors are linked. Turn the M knob to move
Source CH1 to CH4
Perform the following operation steps for the time and voltage cursor measurement
of the channel CH1:
1. Push Cursor to display the cursor menu.
2. Select Source in the bottom menu, select CH1 in the right menu.
3. Select the first menu item in the bottom menu, the Type menu will display at
the right of the screen. In the right menu, select Time&Voltage for Type,
two blue dotted lines displayed along the horizontal direction of the screen,
two blue dotted lines displayed along the vertical direction of the screen.
Cursor measure window at the left bottom of the screen shows the cursor
readout.
4. In the bottom m enu, select Line Type as Time to make th e vertical cursors
active. If the Line in the bottom menu is select as a, turn the M knob to move
line a to the right or left. If b is selected, turn the M knob to move line b.
5. In the bottom menu, select Line Type as Voltage to make the horizontal
cursors active. Sele ct Line in the bottom menu as a or b, turn the M knob to
82
Page 88

4.Advanced User Guidebook
move it.
6. Push t he Horizontal HOR but ton to enter wave zoom mode. In the bottom
cursor menu, select Window as Main or Extension to make the cursors
shown in the main window or zoom window.
Figure 4-20 Time&Voltage Cursor Measurement
Auto Cursor
For the AutoCursr type, the horizontal cursors are set as the intersections of the
vertical cursors and the waveform.
Figure 4-21 Auto Cursor
The Cursor Measurement for F FT mode
83
Page 89

4.Advanced User Guidebook
Function
Menu
Display the Vamp (or Phase) measurement
Freq
Display the Freq measurement cursor and menu.
Freq&Vamp
(or Freq&Phase)
Display the corresponding measurement cursor
and menu.
The horizontal cursors are set as t h e intersections
Line Type
type)
Window
mode)
a
Turn the M knob to move line a.
b
Turn the M knob to move line b.
Two cursors are linked. Turn the M knob to
move the pair of cursors.
Display the channel to which the cursor
measurement will be applied.
In FFT mode, push the Cursor button to turn cursors on and display the cursor menu.
The description of the cursor menu in FFT mode is shown as the following table:
Setting Description
Type
(Freq&Vamp
or
Freq&Phase
(Wave zoom
Line
Vamp (or Phase)
AutoCursr
cursor and menu.
of the vertical cursors and the waveform
Freq Makes the vertical cursors active.
Vamp (or Phase) Makes the horizontal cursors active.
Main
Extension
Measure in the main window.
Measure in the FFT extension window.
ab
Source Math FFT
Perform the following operation steps for the amplitude and frequency cursor
measurement of math FFT:
1. P ress the Math button t o display the math menu in the bottom. Select FFT.
In t he right m enu, s elect Format. In the left menu, turn the M knob to select
amplitude unit (V RMS or Decibels).
2. Push Cursor to display the cursor menu.
3. In the bottom menu, select Window as Extension.
4. Select the first menu item in the bottom menu, the Type menu will display at
the right of the screen. In the right menu, select Freq&Vamp for T ype, two
blue dotted lines displayed along the horizontal direction of the screen, two
blue dotted lines displayed along the vertical direction of the screen. Cursor
measure window at the left bottom of the screen shows the cursor readout.
5. In the bottom menu, select Line Type as Freq t o make the vertical cursors
active. If the Line in the bottom menu is select as a, turn the M knob to move
line a to the right or left. If b is selected, turn the M knob to move line b.
6. In the bottom menu, select Line Type as Vamp to make the horizontal
84
Page 90
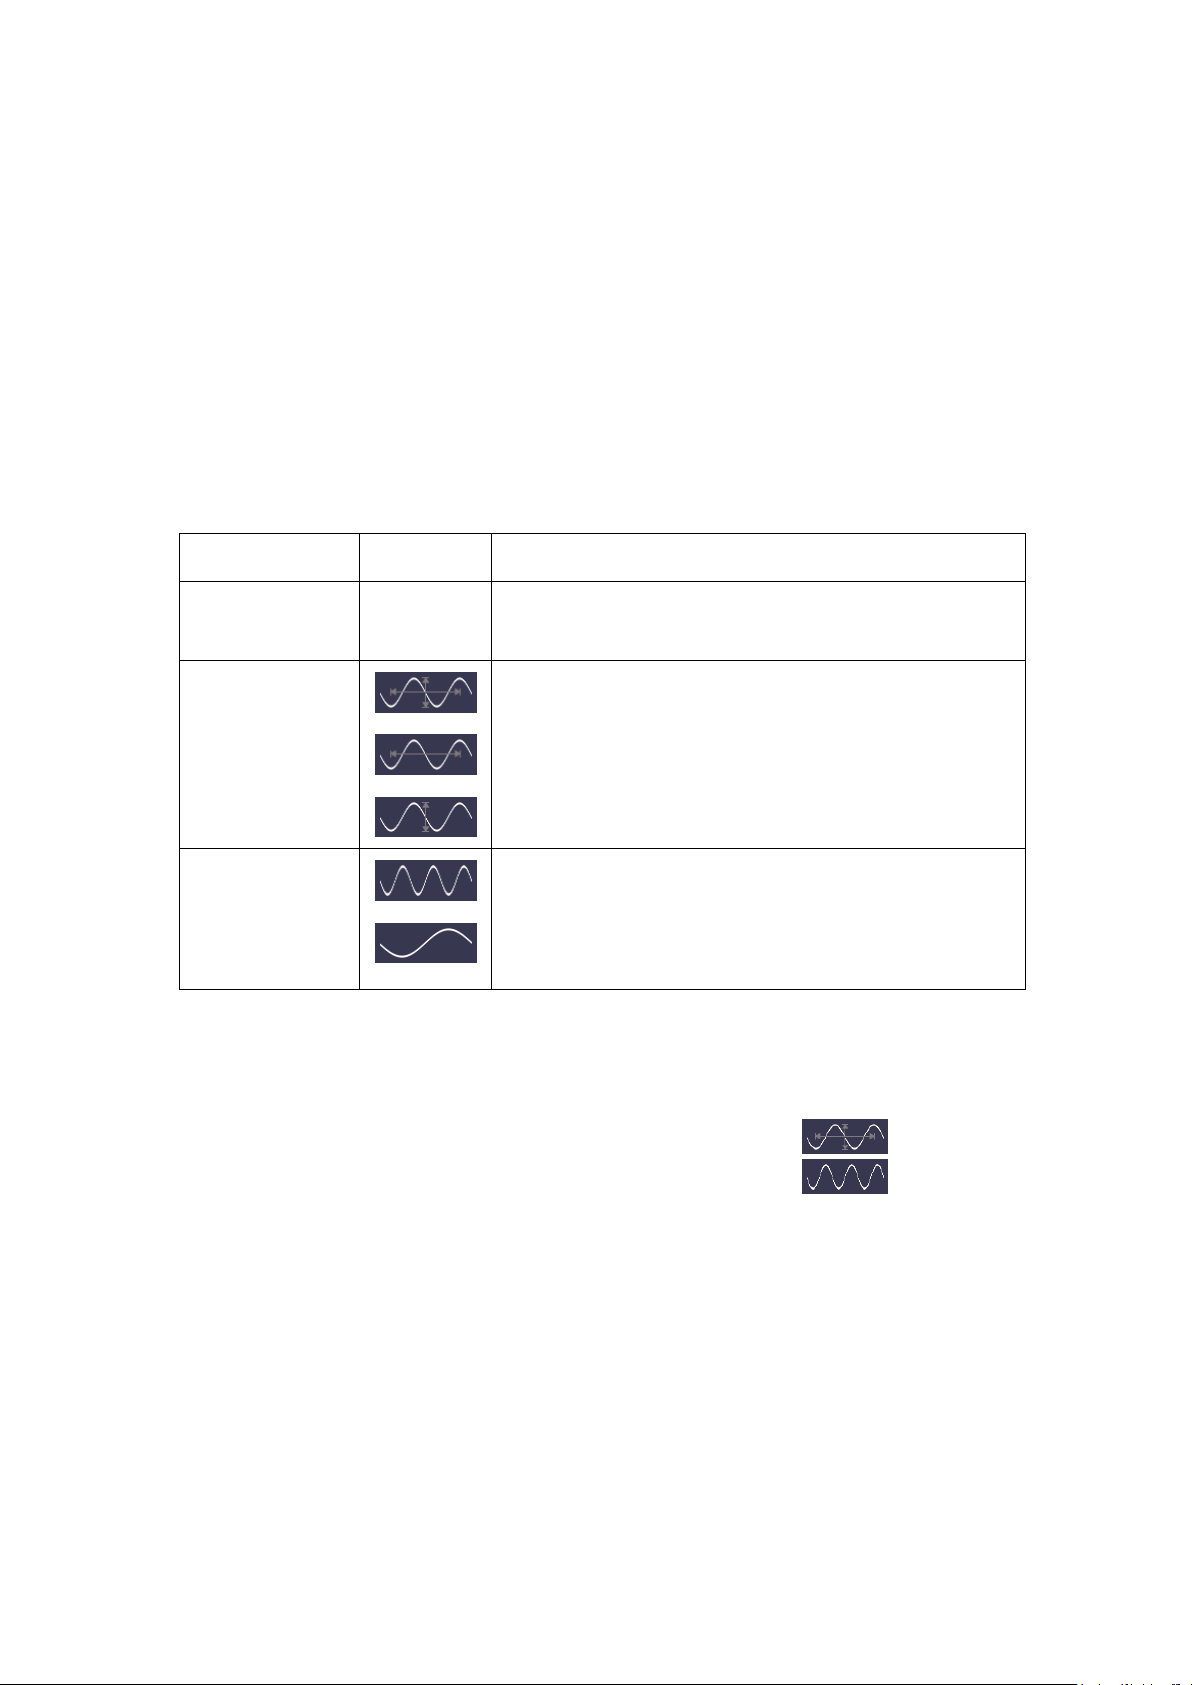
4.Advanced User Guidebook
ON
Turn on
Follow-up and adjust both vertical and horizontal
cursors active. Sele ct Line in the bottom menu as a or b, turn the M knob to
move it.
7. In the bottom cursor menu, you can select Window as Main to make the
cursors shown in the main window.
How to Use Autoscale
This is a very useful function for first time users to carry out a simple and quick test
on the input signal. The function is applied to follow-up signals automatically even if
the signals change at any time. Autoscale enables the instrument to set up trigger
mode, voltage division and time scale automatically according to the type, amplitude
and frequency of the signals.
The menu is as follows:
Function Menu Setting Instruction
Autoscale.
Autoscale
OFF
Turn off Autoscale.
settings.
Mode
Follow-up and only adjust horizontal scale.
Follow-up and only adjust vertical scale.
Show Multi-period waveforms.
Wave
Only show one or two periods.
To measure the signal using autoscale, you can do as the follows:
1. Push the Autoscale button, the function menu will appear.
2. In the bottom menu, select ON in the Autoscale menu item.
3. In the bottom menu, Select Mode. In the right menu, select
4. In the bottom menu, Select Wave. In the right menu, select
Then the wave is displayed in the screen, shown as Figure 4-22.
.
.
85
Page 91

4.Advanced User Guidebook
Figure 4-22 Autoscal e H or izontal-Vertical multi-period waveforms
Note:
1. When entering into Autoscale function, a autoscale indicat or will be flickering on
the top left of the screen.
2. In the mode of Autoscale, the oscilloscope can self-estimate Trigger Mode (Edge,
Video). At this point, the trigger menu is not available.
3. When the input signal contains the DC componen t, the coupling will be set to AC,
the amplitude of the input signal should be greater than 5mV, and the frequency
should be greater than 20Hz.
4. At the mode of Autoscale, DSO is always set as DC coupling with AUTO
triggering, the holdoff is set to 100ns.
5. At the mode of Autoscale, if adjust the vertical position, voltage division, trigger
level or time scale, the oscilloscope will pause the Autoscale fu nction. To resume
Autoscale, push the Autoset front panel button.
6. When video triggering, the horizontal time scale is 50us.
7. While the Autoscale is working, the settings below will be made forcibly:
The DSO will switch from the wave zoom mode to the normal mode.
In the decoding, pass/fail or XY mode, when entering into Autoscale, these m odes
will be turned off.
In the STOP status, when entering into Autoscale, the status will be set to RUN.
How to Use Built-in Help
1. Push Help button, the catalog will display in the screen.
2. In the bottom menu, press Prev Page or Next Page to choose help topic, or just
turn the M knob to choose.
3. Press OK to view the details about the topic, or just push the M knob.
4. Press Quit to exit the help, or just do other operations.
86
Page 92

4.Advanced User Guidebook
Function Items
Setting
Channel Coupling
DC
Vertical Scale
Adjust to the proper division.
Vertical Position
Adjust to the proper position.
Bandwidth
Full
Horizontal Level
Middle
Horizontal Sale
Adjust to the proper division
Trigger Type
Slope or Video
The previous source before autoseting.
which has input
will be set to CH1.
Trigger Coupling
DC
Trigger Slope
Rising edge
Trigger Level
3/5 of the Vpk-pk
Trigger Mode
Auto
Display Format
YT
Force
Stop
Help
Exit
Pass/Fail
Off
Inverted
Off
Zoom Mode
Exit
Record Length
If greater than 10M, it will be set to 10M
Waveform Math or
FFT
Waveform Record
Off
Slow-scan
Off
Persist
Off
How to Use Executive Buttons
Executive Buttons include Autoset, Run/Stop, Single, Copy.
Autoset
It's a very useful and quick way to apply a set of pre-set functions to the incoming
signal, and display the best possible viewing waveform of the signal.
The details of functions applied to the signal when using Autoset are shown as
the following table:
Trigger Source
When the previous source has no input signal, the source
will be set to the minimum channel
signal.
When all the channels have no input signal, the source
Off
Note: When the autoscale is turned on and running, the Autoset button is invalid.
Judge waveform type by Autoset
Five kinds of types: Sine, Square, video signal, DC level, Unknown signal.
87
Page 93
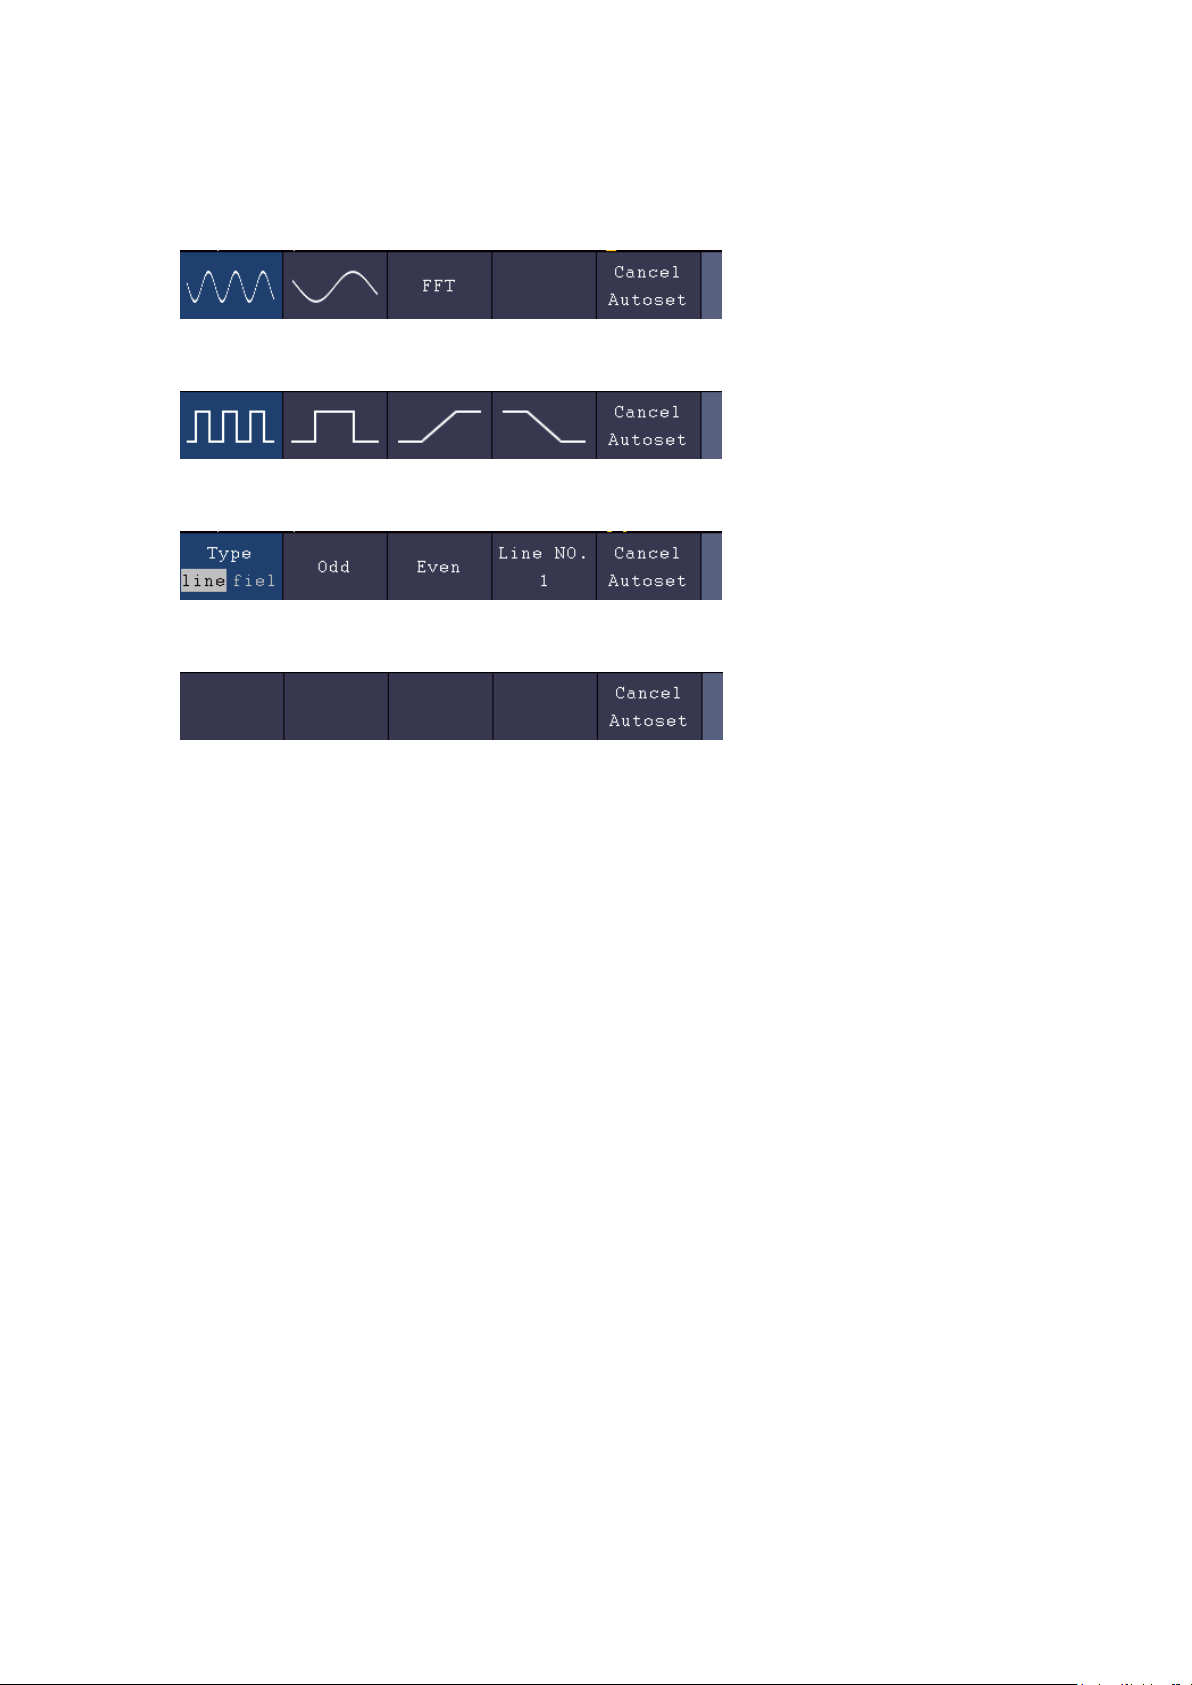
4.Advanced User Guidebook
Menu as follow:
Sine: (Multi-period, Single-period, FFT, Cancel Autoset)
Square: (Multi-period, Single-period, Rising Edge, Falling Edge, Cancel Autoset)
Video signal:
DC level, Unknown signal:
Description for some icons:
Multi-period: To display multiple periods
Single-period: To display single period
FFT: Switch to FFT mode
Rising Edge: Display the rising edge of square waveform
Falling Edge: Display the falling edge of square waveform
Cancel Autoset:Go back to display the upper menu and waveform information
Note: The Autoset function requires that the frequenc y of signal should be no lower
than 20Hz, and the amplitude should be no less than 5mv. Otherwise, the Autoset
function may be invalid.
Run/Stop: Enable or disable sampling on input signals.
Notice: W hen there is no sampling at STOP state, the vertical division and
the horizontal time base of the waveform still can be adjusted within a
certain range, in other words, the signal can be expanded in the horizontal or
vertical direction.
When the horizontal time base is ≤50ms, the horizont al time base can be
expanded for 4 divisions downwards.
Single: Push this button you can set the trigger mode as single directly, so when
trigger occurs, acquire one waveform then stop.
Copy: You can save the waveform by just pushing the Copy panel button i n any
user interface. The source wave and the storage location are according to
88
Page 94

4.Advanced User Guidebook
the settings of the Save function menu when the Type is Wave. For more
details, please see "Save Function Menu" on P57.
How to Print the Screen Image
To print an image of what appears on the oscilloscope screen, do as the follows:
(1) Connect the printer to the USB Device port on the rear panel of the oscilloscope.
Note: The USB Device port supports PictBridge compatible printers.
(2) Push the Utility button, select Function in the bottom menu, select Output in the
left menu.
(3) In the bottom menu, select Device as PICT. (When PC is selected, you can get
an image by Oscilloscope software.)
(4) In the bottom menu, select Print Setup. In the right menu, set up print parameters.
The On selection of Ink Saver will print out a copy with a white background.
(5) Once you have connected a printer to your oscilloscope and set up print
parameters, you can print current screen images with a single push of the Print
button on the front panel.
89
Page 95

5.Use the Arbitrary Function Generator (Optional)
5. Use the Arbitrary Function Generator (Optional)
The function generator provides 4 basic waveforms (sine, square, ramp, and pulse) and 46
built-in arbitrary waveforms (Noise, Exponential rise, Exponential fall, Sin(x)/x, Staircase,
etc.). You can create a user-definable waveform and save it to internal storage or USB
device.
Output Connection
Push the Utility button, select Function in the bottom menu, select Output in the left
menu. In the bottom menu, select Output, in the right menu, select AG Output.
Single-channel:
Connect the BNC cable to the port marked Out in the back of the oscilloscope.
Dual-channel:
Connect the BNC cable to the port marked Out 1or Out 2 in the back of the oscilloscope.
Out 1 is the output of CH1, Out 2 is the output of CH2, also can be used as the port of
trigger signal output & Pass/Fail output.
To see the output of the generator, connect the other end of the BNC cable to one of the
input channels on the front of the oscilloscope.
To Set Channels
Single-channel:
Push to turn on/off the channel output. The indicator will be lighted when the
corresponding channel is tuned on.
Dual-channel:
To Switch Ch annels in Menu Settings
Push button to switch between CH1 menu, CH2 menu, and Channel Copy menu.
To Turn On/Off Output of Channels
Push or to turn on/off output of the corresponding channel. The indicator
will be lighted when the corresponding channel is tuned on.
Channel Copy menu
Push button to switch to Channel Copy menu.
90
Page 96

5.Use the Arbitrary Function Generator (Optional)
Copy Channel
Select CH2 To CH1 in the bottom menu to copy parameters of CH2 to CH1.
Select CH1 To CH2 in the bottom menu to copy parameters of CH1 to CH2.
Frequency Lock
Select Freq Lock in the bottom menu as On, the fr equency of the two channels can be
adjusted synchronously.
Amplitude Lock
Select A mpl Lock in the bottom menu as On, the amplitude of the two channel s can be
adjusted synchronously.
Align Phase
Select Align Phase in the bottom menu to align the initial phase of two channel signals.
To Set Signals
(1) Push (single-channel) or (dual-channel) button to show the bottom
menu of generator.
(2) Select the desired waveform in the bottom menu, the corresponding menu is displayed
on the right.
(3) The parameters can be set in the right menu.
To Output Sine Signals
The parameters of S ine waveform in the right m enu are: Frequency/Period, Start Phase,
Amplitude/High Level, Offset/Low Leve l .
To Set the Frequency
Select Frequency in the right menu (if Frequency is not displayed, select Period and
push it again to switch to Frequency). Set the parameter in the right menu, see below.
Three methods to change the chosen parameter:
Turn the M knob to change the value of cursor position. Press / direction
key to move the cursor.
Use the input keyboard: Push the M knob, an input keyboard will pop up. Turn the
M knob to move between the keys. Push the M knob to input the chosen key.
91
Page 97

Units
Clear
OK
Use the touchscreen:
Click to increase the
value of cursor position
Move the cursor
Click to decrease the
value of cursor position
5.Use the Arbitrary Function Generator (Optional)
To Set the Period
Select Period in the right menu (if Period is not di splayed, select Frequency and select i t
again to switch to Period). Set the parameter in the right menu.
To Set the Start Phase
Select StartPhase in the right menu. Set the parameter in the right menu.
To Set the Amplitude
Select Amplitude in the right menu (if Amplitude is not displayed, select High Level and
select it again to switch to Amplitude). Set the parameter in the right menu.
To Set the Offset
Select Offset in the right menu (if Offset is not displayed, select Low Level and select i t
again to switch to Offset). Set the parameter in the right menu.
To Set the High Level
Select High Level in the right menu (if High Level is not displayed, select Amplitude
92
Page 98

5.Use the Arbitrary Function Generator (Optional)
and select it again to switch to High Level). Set the parameter in the right menu.
To Set the Low Level
Select Low Level in the right menu (if Low Level is not displayed, select Offset and
select it again to switch to Low Level). Set the parameter in the right menu.
To Output Square Signals
The parameters of S quare waveform are: Frequency/Period, Start Phase, Amplitude/High
Level, Offset/Low Level.
To set the Frequency/Period, Start Phase, Amplitude/High Level, Offset/Low Level, please
refer to To Output Sine Signals on page 91.
To Output Ramp Signals
The parameters of Ramp waveform are: Frequency/Period, Start Phase, Amplitude/High
Level, Offset/Low Level, Symmetry.
To set the Frequency/Period, Start Phase, Amplitude/High Level, Offset/Low Level, please
refer to To Output Sine Signals on page 91.
To Set the Symmetry of Ramp Select Symmetry in the right menu of Ramp. Set the parameter in the right menu.
To Output Pulse Signals
The parameters of Pulse waveform are: Frequency/Period, Start Phase, Amplitude/High
Level, Offset/Low Level, Width/Duty Cycle.
To set the Frequency/Period, Start Phase, Amplitude/High Level, Offset/Low Level, please
refer to To Output Sine Signals on page 91.
To Set the Pulse Width of Pulse
Select Width in the right menu (if Width is not displayed, select Duty Cycle and select i t
again to switch to Width). Set the parameter in the right menu.
To Set the Duty Cycle of Pulse
Select Duty Cycle in the right menu (if Duty Cycle is not displayed, select Width and
select it again to switch to Duty Cycle). Set the parameter in the right menu.
To Output Arbitrary Signals
The menu items of Arbitrary waveform are: Frequency/Period, Start Phase,
Amplitude/High Level, Offset/Low Level, New, File Browse, Built-in. You can operate
the menu by using the menu selection buttons on the right.
To set the Frequency/Period, Start Phase, Amplitude/High Level, Offset/Low Level, please
refer to To Output Sine Signals on page 91.
The Arbitrary signal consists of two types: the user-definable waveform and the system
built-in waveform.
93
Page 99
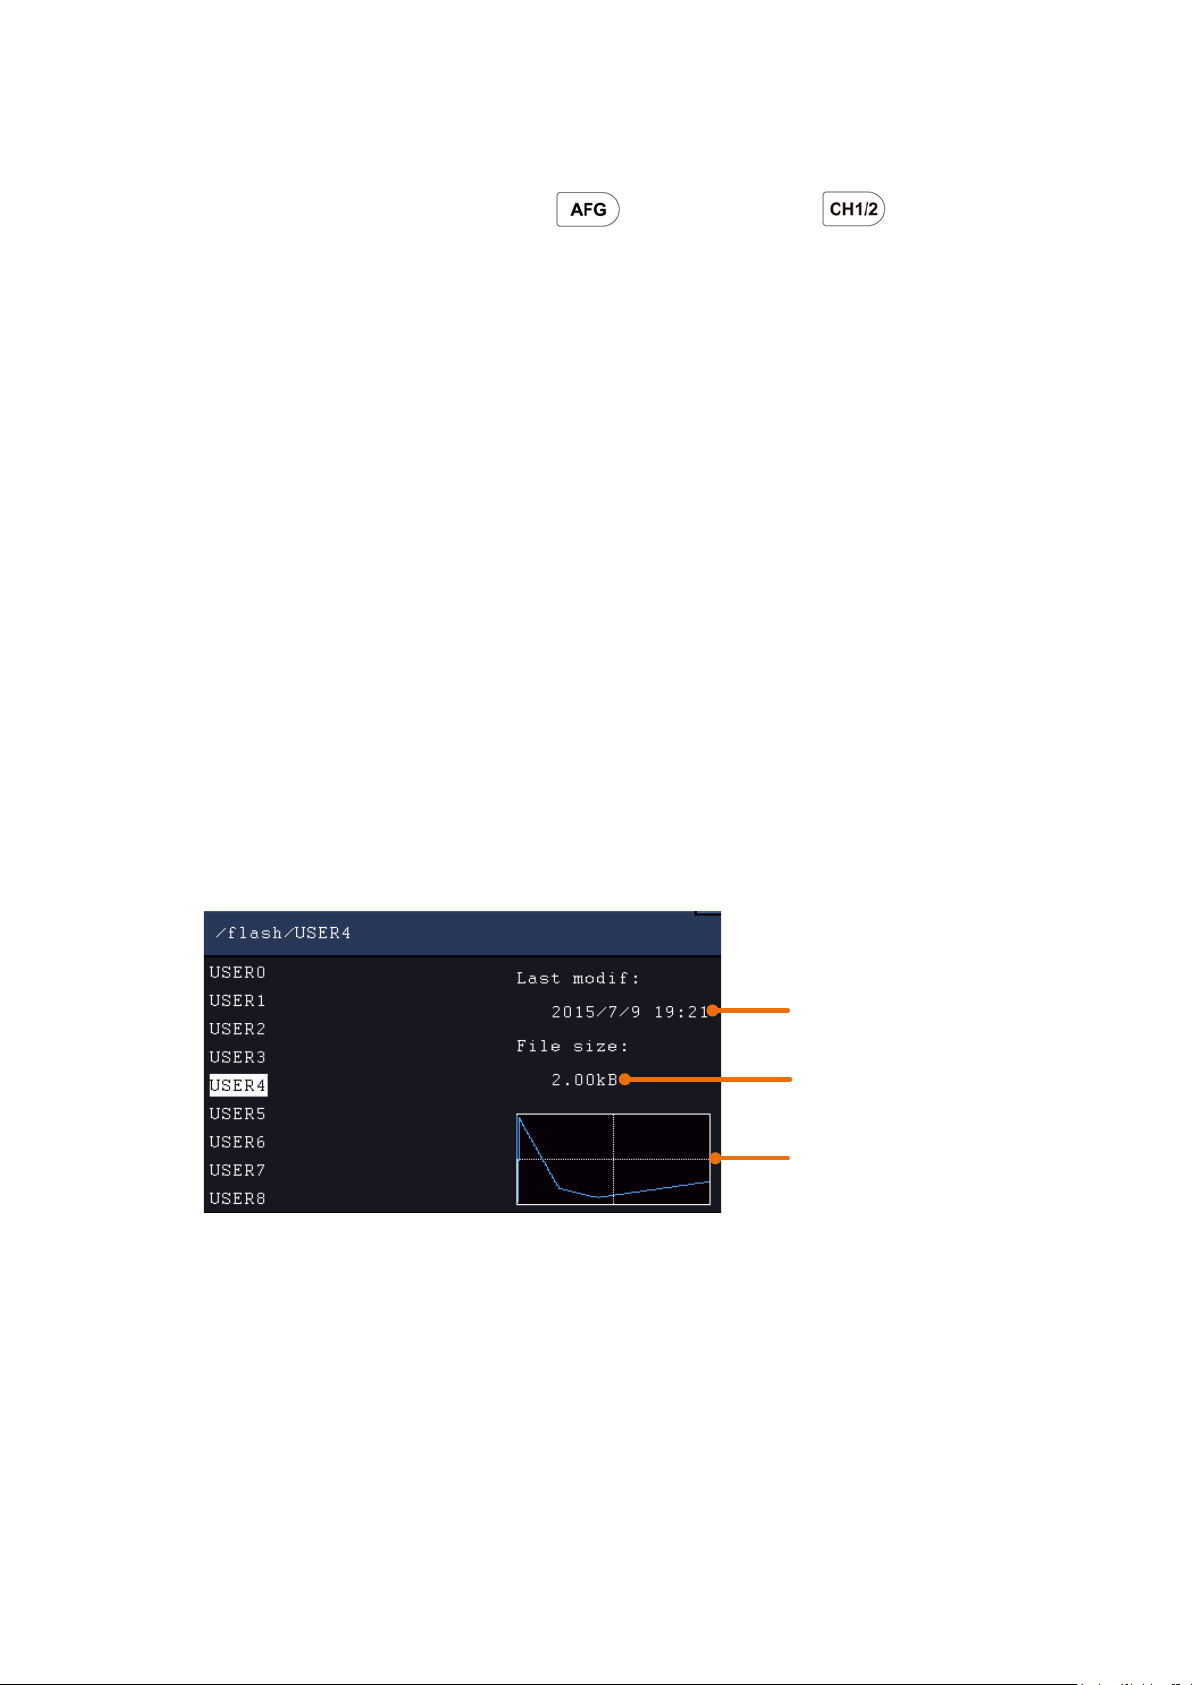
5.Use the Arbitrary Function Generator (Optional)
File size
Last modification time
Waveform graph
Create a New Waveform
(1) Enter the operation menu: Push (single-channel) or (dual-channel)
button. Select Arb in the bottom menu, select Others in the right menu, and select
New.
(2) Set the number of waveform points: Select Points in the right menu, turn the M
knob to change the value, or use the input keyboard (push the M knob to show it) to
input the value and choose the unit. X1, X1000, Xle6, Xle9 in the keyboard
respectively repres ent 1, 1000, 1000000, 1000000000. The waveform points range is
2 - 8192.
(3) Set the interpolation: Select Intrpl in the right menu, choose between On/Off. If
you choose On, the points will be connected with beelines; otherwise, the voltages
between two consecutive points will not change, and the waveform looks like a
step-up one.
(4) Edit the waveform points: Select Edit Points in the right menu.
Select Point, input the number of the point to be edited.
Select Voltage, input the voltage for the current point.
Repeat the step above, set all the points to your needs.
Select Save, enter the file system.
If you want to save the waveform to internal memory, select Memory in the right
menu as Internal. Turn the M knob to select a file from USER0 through USER31.
Select Save in the right menu.
If a USB device is connected, and you want to save the waveform to it, select
Memory in the right menu as USB. The instrument lists a directory of the folders and
files on the USB memory device. Select a folder or file using the M knob to scroll up
and down the list. To enter the current folder, select Ch ange Dir in the right menu,
select it again to return to the upper directory.
94
Page 100

5.Use the Arbitrary Function Generator (Optional)
Confirm
Clear
Switch the case
Switch to
symbol
keyboard
Enter the desired storage path , select Save in the right menu, an input k eyboard pops
up, input the file name, choose
in the keyboard to confirm
. The waveform is saved
as BIN file in the folder.
Note: The input length can have up to 35 characters.
File Browse
To read a waveform stored in internal storage or USB device:
(1) Push (single-channel) or (dual-channel) button. Select Arb in the
bottom menu, select Others in the right menu, and select File Browse.
(2) Select the desired waveform file in internal storage (FLASH) or USB device
(USBDEVICE).
(3) Select Read in the right menu.
Built-in Waveform
There are 46 built-in Arbitrary waveforms.
Steps for selecting the built-in waveform:
(1) Push (single-channel) or (dual-channel) button to show the bottom
menu of generator.
(2) Select Arb in the bottom menu, select Others in the right menu, and select Built-in.
(3) Select Common, Math, Window or Others in the right menu. E.g. select Others to
enter the following interface.
95
 Loading...