

Page 1

Version 03/08
Item No.: 12 24 94
DIGITAL STORAGE OSCILLOSCOPE
DSO-1022 M
Page 2

DSO-1022 M
OPERATING MANUAL
Page 3
Table of Contents
PageChapter Title
General Safety Rules
Preface
Chapter 1
Chapter 2
User Guide
General Check
Functional Check
Probe Compensation
Autoset Waveform Display
Getting to Know the Vertical System
Getting to Know the Horizontal System
Getting to Know the Trigger System
Instrument Setups
Setting up the Vertical System
Setting up the Horizontal System
Setting up the Trigger System
Alternate Trigger
Setting up the Sampling System
Setting up the Display System
Save and Recall
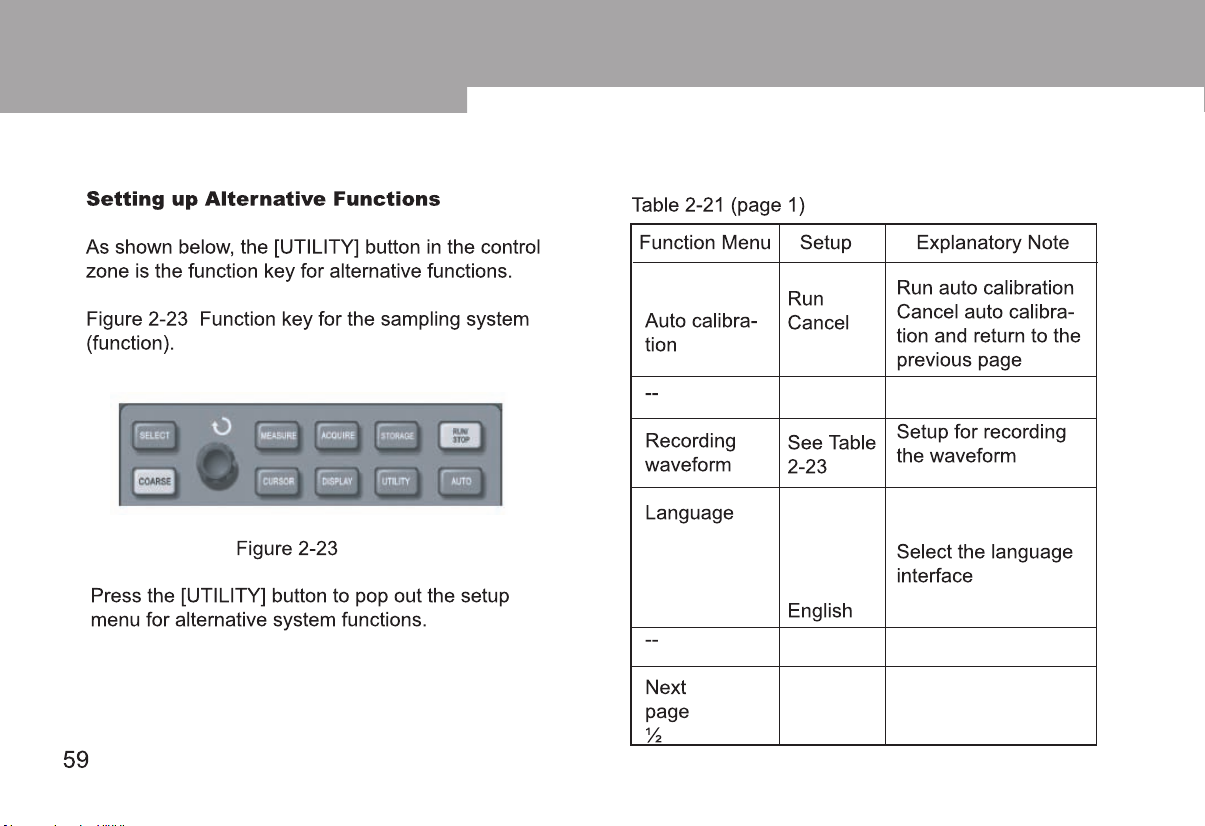
Setting up Alternative Functions
Auto Measurement
Cursor Measurement
3
5
9
13
13
16
17
18
19
21
23
23
35
39
46
51
55
56
59
62
70
1
Page 4

Chapter 3
Chapter 4
Chapter 5
Index
Table of Contents
Using the Run Button
Practical Example Scenarios
Scenario 1: Measuring simple signals
Scenario 2: Observing the delay caused by a sine wave
signal passes through the circuit
Scenario 3: Acquiring single signal
Scenario 4: Reducing random noise of signals
Scenario 5: Using cursors for measurement
Scenario 6: Using the X-Y function
Scenario 7: Video signal triggering
System Prompts and Troubleshooting
Definitions of System Prompts
Troubleshooting
Appendixes
Appendix A: Technical Indicators
Appendix B: Accessories
Oscilloscopes
Appendix C: Maintenance and Cleaning
PageChapter Title
71
74
74
75
77
78
80
82
84
86
86
86
88
88
96
96
97
2
Page 5

General Safety Rules
To avoid personal injury and damage to this product or
any other connected units, please take time to read the
following safety precautions. To avoid any potential
danger, please use this product strictly in accordance
with use instructions and safety rules.
Maintenance should be carried out only by
qualified personnel.
Avoid fire and personal injury.
Use the correct power cord. Use only a desig
3
nated power cord specified for this product and certified for the country of use.
Use the
plug when the probe or testing cable is connected to
the power source.
Ensure the product is properly grounded.
This product should be properly grounded with the
earth wire of the power cord. To avoid electric shock,
the grounding conductor must be connected to earth
ground. Please ensure that the product is properly
grounded before connecting any input or output terminal.
Connect the oscilloscope probe properly.
Earth wire of the probe is in the same voltage as the
earth. Do not connect the earth wire to high voltage.
Observe all terminal rated values. To avoid fire
and impact caused by excessive electric current,
check all rated values and labels on the product.
Please read detailed information of rated values in the
product manual before connecting the product.
Do not operate this product without Cover.
correct power plug. Do not remove the
Page 6
When the exterior cover or front panel is open, do not
operate the product.
Use a
ppropriate fuses. Use only the type of fuse
and rated indicator designated for this product.
Avoid exposing circuitry. Upon power connection please do not touch any exposed adaptor or
component.
Do not operate with suspected failure. If you
suspect the product is damaged, have it inspected by
a qualified maintenance technician.
Maintain good ventilation.
Warning: Warning statements identify conditions or
actions that could result in injury or loss of life.
Caution: Caution statements
actions that could result in damage to this product or
other property.
identify conditions or
“Caution” means possible damage to this product or
other properties.
Symbols on the product: The following symbols
may appear on the product:
Do not operate in a humid place.
Do not operate in combustible and explo
sive conditions.
Keep the product surface clean and dry.
Safety Messages and Symbols
Messages on the product: The following mes-
sages may appear on the product:
“Danger” means potential damage that is immediate.
“Warning” means potential damage that is not immediate.
High voltage
Caution! Refer to manual
Protective earth terminal
Earth terminal for chassis
Earth terminal for testing
4
Page 7

Preface
This manual provides information on the operation of Digital Storage Oscilloscope DSO-1022 M
. Guidance is given in several chapters as follows:
Chapter 1 User Guide: Simple guide to the oscilloscope functions and notes on installation.
Chapter 2 Instrument Setups: Guide to oscilloscope operation.
Chapter 3
Chapter 4 System Prompts and Trouble-shooting
Chapter 5 Servicing and Support
Chapter 6 Appendixes
Appendix A: Technical Indicators
Appendix B: Accessories for DSO-1022 M Oscilloscopes
Appendix C: Maintenance and Cleaning
Practical Example Scenarios: Example scenarios are provided to solve various testing
problems.
5
Page 8

Digital Storage Oscilloscope DSO-1022 M:
Digital Storage Oscilloscope DSO-1022 M offer user-friendliness, outstanding technical indicators and a host of
advanced features. They are your perfect tools to complete testing tasks swiftly and efficiently.
Introduction
Dear Customer,
Thank you very much for making the excellent decision to purchase a Voltcraft® product.You have acquired an
above-average quality product from a brand family which has distinguished itself in the field of measuring,charging
and network technology by particular competence and permanent innovation.
Whether your are a sophisticated do-it-yourself electronics enthusiast or a professional user, with a Voltcraft®
product you always have the optimal solution at hand, even for solving the most difficult problems. Along with the
remarkable feature that we offer the advanced technology and the robust quality of our Voltcraft® products at a
favourable cost-performance ratio that is almost unbeatable. We are certain that using Voltcraft® will be the
beginning of a long, successful relationship.
We hope you will enjoy using your new Voltcraft® product!
If you have queries about handling the device, that are not answered in this operating instruction,our technical
support is available under the following address and telephone number:
Voltcraft®, 92242 Hirschau, Lindenweg 15, Germany, phone 0180 / 586 582 723 8
6
Page 9

DSO-1022 M oscilloscopes offer user-friendly front
panel that allows access to all functions easy operation. The scaling of all channels and the positions of
buttons are optimally arranged for direct view operation. As design is based on the mode of traditional
instruments, users can use the new units without
spending considerable time in learning and familiarizing with operation. For faster adjustment to ease
testing, there is an AUTO key. The new units also
feature more appropriate waveform and range scale
positions.
In addition to easy operation, the DSO-1022 M oscilloscopes have all the high performance indicators and
powerful functions that ensure speedy testing and
measurement. With 500MS/s real-time sampling rate ,
these oscilloscopes can display signals much quicker,
while powerful trigger and analytical features enable
easy capture and analysis of waves, while a clear LCD
display and mathematics functions enable the user to
observe and analyse signal problems promptly and
clearly.
The performance features listed below will explain
why the new series can fully satisfy your testing and
measurement requirements:
7
Dual analog channels
mono LCD display system at 320 x 240
resolution
Automatic waveform and status configuration
Storage of
waveforms, setups recurrence
Sophisticated window expansion function to analyse
waveform details and overview precisely
Automatic measurement of 19 waveform parameters
Automatic cursor tracing measurement
Unique wave recording and replay function
Built-in FFT
Multiple waveform mathematics functions (including
add, subtract, multiply and divide)
Edge, video, pulse width and alternate trigger functions
Multilingual menu displays
Help System
waveforms, setups and bit map and
Page 10

DSO-1022 M Oscilloscope accessories
2 x 1.5m, 1:1/10:1 probe(see passive voltage probe
operating manual),comply with EN61010-031:
2002 standard.
Power supply line conforming to all international
standards
User Manual
DSO-1022 M communications software (USB/RS232C)
USB Lead
8
Page 11

Digital Storage Oscilloscope DSO-1022 M are small and
compact benchtop oscilloscopes. The user-friendly front
panel enables easy operation for basic testing and measuring tasks.
This chapter provides notes on the following:
General check
Functional check
Probe compensation
Automatic settings for waveform display
Getting to know the vertical system
Getting to know the horizontal system
Getting to know the trigger system
Chapter One User Guide
When starting to use a new oscilloscope, the first step
is always to familiarize yourself with the use of the front
operation panel. This rule of thumb applies to
Storage Oscilloscope DSO-1022 M
describes the operation and functions of the front
panel, so you can learn how to use a Digital Storage
Oscilloscope DSO-1022 M as quickly as possible.
The
Digital Storage Oscilloscope DSO-1022 M
front panel with at-a-glance functions for easy operation. There are buttons and function keys on the front
panel. The functions of buttons are similar to other
oscilloscopes. The row of 5 keys on the right of the
display panel are the menu operation keys (designated
as F1 to F5 from top to down). With these keys you can
set up different options of the current menu. The other
keys are function keys. You can use them to enter
different function menus or access particular functions
. This chapter briefly
Digital
provides a
Page 12
Page 13

Page 14

Indicative definitions in this manual:
Text indications for operation keys given in this manual are
identical to signs on the front panel keys.
Please note that all signs for measurement function keys
appear with frames, e.g. [MEASURE], to represent a front
panel function key marked with the word MEASURE.
Signs for the operation keys on the menu are in shadowed
text, e.g. SAVE WAVEFORM, to indicate the save waveform option of the save menu.
Figure 1-3
interface
Schematic diagram for the display
Figure 1-3
12
Page 15

General Check
We suggest checking your new
scope DSO-1022 M
1. Check the unit for possible shipping
damages
If the package carton or foam plastic protective lining is
seriously damaged, please do not discard until you
have carried out a check on the entire unit and accessories to ensure satisfactory electrical and mechanical
performance.
2. Check the accessories
A checklist of accessories that come with your
Storage Oscilloscope DSO-1022 M
section Accessories for
DSO-1022 M
missing items against this list.
in the following steps.
Digital Storage Oscilloscope
of this manual. Please check for any
Digital Storage Oscillo-
Digital
is provided in the
13
Functional Check
Carry out a quick functional check in the following
steps to make sure your oscilloscope is operating
normally.
ower on the unit
1. P
Power on the unit. Power supply voltage is 100-240V
AC, 45-440Hz. After connectingto power, let the unit
carry out self-calibration to optimize the oscilloscope
signal path for measurement accuracy. Press the
[FUNCTION] button and then [F1] to start the calibration. Then press [F1] on the next page to display
Page 16
Page 17

2 .You have to set the probe attenuation factor of the oscilloscope. This factor changes the vertical range multiple to
ensure the measurement result correctly reflects the amplitude of the measured signal. Set the attenuation factor of the
probe as follows: Press [F4] to display 10X on the menu.
15
Figure 1-6 Deflection factor setting of
the probe on the oscilloscope
Probe ration
Figure 1-6
Page 18

1 . Connect the probe tip and ground clamp to the corresponding probe compensation signal terminals. Press
[AUTO] and you will see a square wave in the display of
about 3V peak-to-peak at 1kHz in a few seconds. See
Figure 1-7 for details. Repeat these steps to check CH2.
Press [OFF] function button to disable CH1, then press
[CH2] function button to enable CH2. Repeat steps 2 and 3.
Probe Compensation
When connecting the probe to any input channel for the first
time, perform this adjustment to match the probe to the
channel. Skipping the compensation calibration step will
result in measurement error or fault. Please adjust probe
compensation as follows:
Figure 1-7 Probe compensation signal
Figure 1-7
1.
In the probe menu set the attenuation factor to 10X.
Move the switch on the probe to 10X and connect the
probe to CH1. If you are using the probe hook-tip, ensure
a proper and secure connection. Connect the probe tip to
the probe compensator’s signal output connector, then
connect the ground clamp to the earth wire of the probe
compensator. Enable CH1 and press [AUTO].
Observe the shape of the displayed waveform.
2.
Overcompensation
Correct Compensation
Undercompensation
16
Page 19

Figure 1-8 Probe compensation calibration
Overcompensation Correct Compensation Undercompensation
Figure 1-8
If you see a “Undercompensation” or “Overcompensa-
3.
tion” waveform
display, adjust the variable capacitor on
the probe with a screwdriver with non-metal handle, until
a “Correct Compensation” waveform illustrated above is
displayed.
Warning: To avoid electric shock when measuring high
voltage with the probe, ensure integrity of the probe’s
Autoset Waveform Display
Digital Storage Oscilloscope DSO-1022 M feature an
autoset function. Your oscilloscope can automatically adjust
the vertical deflection factor, scanning time base and trigger
mode based on the input signal, until the most appropriate
waveform is displayed. The autoset function can only be
operated when the signal to be measured is 50Hz or above
and the duty ratio is larger than 1%.
Using the Autoset Function:
Connect the signal to be measured to the signal input
1.
channel.
2.
Press [AUT
O]. The oscilloscope will automatically set the
vertical deflection factor, scanning time base and trigger
mode. Should you require to make more detailed check,
you can adjust manually after the autoset process until you
get the optimum waveform display.
Page 20

Getting to Know the Vertical System
As shown in the figure below, there are a series of buttons
and knobs in the vertical control zone. The following steps
will get you familiar with the use of these controls.
Figure 1-9 Vertical control zone on the front panel
1.
Turn the vertical position knob to display the signal in the
centre of the window. The vertical position knob controls
the vertical display position of the signal. When you turn
the vertical position knob, the sign indicating Ground
channel will move up and down with the waveform.
Measurement Tips
If the channel coupling is DC, you can measure the
signal’s DC quickly by checking the difference between
the waveform and signal ground.
In the case of AC coupling, the DC within the signal will
be filtered. With this coupling mode you can display the
AC of the signal with higher sensitivity.
Shortcut key RETURN TO ZERO for resetting the ver
analog channel to zero
tical position of the dual
Page 21

2.
Change the vertical setups and check changes of status
information.
You can identify changes of any vertical range by reading
the status display column at the lower corner of the waveform window. Turn the vertical scale knob to change the
vertical VOLT/DIV range. You will find that the range in the
current status column has changed accordingly. Press
[CH1], [CH2], [MATH] or [REF] and the screen will show
the corresponding operation menu, sign, waveform and
range status information. Press [OFF] to disable the
selected channel.
Figure 1-10 Horizontal
control zone on the
front panel
Getting to Know the Horizontal System
As shown in the figure on the right hand side, there are
one button and two knobs in the horizontal control
zone. The following steps will get you familiar with
horizontal time base setups.
19
Figure 1-10
Use the horizontal scale knob to change the
1.
horizontal time base setup and check any changes
in status information. Turn the horizontal scale knob
to change the SEC/DIV time base range. Y
find that the time base range in the current status
column has changed accordingly. Range of
horizontal scanning rate is 20ns~50s, in steps of
1-2-5.
ou will
Page 22

2.
Use the horizontal position knob to adjust the
horizontal position of the waveform window. The
horizontal position knob controls trigger shift of the
signal. When this function is used for trigger shift
and the horizontal position knob is turned, you will
find that the waveform changes with the knob.
3.
Press [MENU] to display the ZOOM menu. In this
menu press [F3] to activate WINDOW EXPANSION.
Then press [F1] to quit WINDOW EXPANSION and
return to the MAIN TIME BASE. You can also set the
HOLDOFF time with this menu.
Shortcut key for resetting the trigger point shift to
horizontal zero position
This shortcut key can quickly return to RETURN
TO ZERO and reset the trigger point to the
vertical centre point. You can also turn the horizontal position knob to adjust the horizontal position of
the signal in the waveform window.
Definition:
Trigger point means the actual trigger point
relative to the centre point of the storage device.
By turning the horizontal position knob, you can
move the trigger point horizontally.
Holdof
f means reactivating the time interval of the
trigger circuit. Turn the multi-function control knob
to set the holdoff time.
20
Page 23

Getting to Know the Trigger System
As shown by Figure 1-11, there are one knob and
three buttons in the trigger menu control zone. The
following steps will get you familiar with trigger
setups.
Figure 1-11 Trigger menu on the front panel
Figure 1-11
21
1.
Use the trigger level knob to change the trigger
level. Y
indicates the trigger level. The sign will move up
and down with the knob. While you move the
trigger level, you will find the trigger level value on
the screen changing accordingly.
Shor
level to zero position
Press 50% to quickly rest the trigger level to zero
(channel vertical reference point). At trigger zero
you get the highest sensitivity. Y
the trigger level knob to reset the trigger point to
zero.
2.
ou will see a trigger sign on the screen that
tcut key for resetting the trigger
ou can also turn
Open the [TRIGGER MENU] (see the figure
below) to change trigger setups.
Press [F1] and select EDGE TRIGGER
Press [F2] and set TRIGGER SOURCE to CH1
Press [F3] and set EDGE TYPE as RISING
Press [F4] and set TRIGGER MODE as AUTO
Press [F5] and set TRIGGER COUPLING as DC
Page 24

Figure 1-12 Trigger menu
Figure 1-12
3.
Press [FORCE] to generate a compulsory trigger
signal that is mainly used in the normal and single
trigger modes.
22
Page 25

You should be familiar with basic operation of the
vertical controls, horizontal controls and trigger
system menu of your Digital Storage Oscilloscope
DSO-1022 M by now. After reading the last chapter,
you should be able to use the menus to set up your
oscilloscope. If you are still unfamiliar with these
basic operation and methods, please read Chapter 1.
This chapter will guide you through the following:
Setting up the vertical system ([CH1], [CH2],
[MATH], [REF], [OFF], [VER
[VERTICAL SCALING])
Setting up the horizontal system ([MENU],
[HORIZONTAL POSITION], [HORIZONTAL SCALING])
Setting up the Trigger system ([TRIGGER LEVEL],
[MENU], [50%], [FORCE])
Setting up the sampling method ([ACQUIRE])
Setting up the display mode ([DISPLAY])
Save and exit ([STORAGE])
Setting up the help system ([UTILITY])
Auto measurement ([MEASURE])
Cursor measurement ([CURSOR])
Using the execution buttons ([AUTO], [START/STOP])
TICAL POSITION],
23
Chapter 2 - Instrument Setups
It is recommended that you read this chapter carefully
to understand the various measurement functions and
system operation of your
DSO-1022 M
Setting up the Vertical System
CH1, CH2 and setups
Each channel has its own vertical menu. You should
set up each item for each channel individually. Press
the [CH1] or [CH2] function button and the system will
display the operation menu for CH1 or CH2. For
explanatory notes please see Table 2-1 below:
Digital Storage Oscilloscope
Page 26

Table 2-1:
Function Menu Setup Explanatory Note
Coupling
Bandwidth
limit
VOLTS/DIV
Explanatory notes for channel menu
Intercept the DC
AC
DC
Ground
On
Off
Coarse
tune
Fine
tune
quantities of the input
signal.
Pass AC and DC
quantities of input
signal.
Disconnect input signal.
Limit bandwidth to
20MHz to reduce
noise display.
Full bandwidth.
Coarse tune in steps of
1-2-5 to set up the
deflection factor of the
vertical system. Fine
tune means further
tuning within the
coarse tune setup
range to improve the
vertical resolution.
Function Menu Setup Explanatory Note
Select either one value
based on the probe
attenuation factor to
keep the vertical
deflection factor
reading correct. There
are four values: 1X,
10X, 100X and 1000X.
Waveform invert
function on.
Normal waveform
display.
Probe
Invert
1X
10X
On
Off
24
Page 27

1. Setting up channel coupling
Take an example of applying a signal to CH1. The
signal being measured is a sine signal that contains
DC quantities.
Press [F1] to select AC. It is now set up as AC
coupling. DC quantities of the signal being measured
will be intercepted. The waveform display is as
follows:
Figure 2-1 DC quantities of the signal are intercepted
Figure 2-1
25
Press [F1] to select DC. Both DC and AC quantities
of the signal being measured can pass through. The
waveform display is as follows:
Figure 2-2 Both DC and AC quantities of the
signal are displayed
Figure 2-2
Page 28

Press [F1] to select GROUND. It is now set up as
ground. Both DC and AC quantities contained in the
signal being measured will be intercepted. The
waveform display is as follows:
(Note: In this mode, although waveform is not
displayed, the signal remains connected to the
channel circuit)
Figure 2-3 Both DC and AC quantities of the signal
are intercepted
2. Setting up the channel band
Take an example of applying a signal to CH1. The
signal being measured is a pulse signal that contains
high frequency oscillation.
Press [CH1] to turn CH1 on. Then press [F2] to set
BANDWIDTH LIMIT OFF
bandwidth. The signal being measured can pass
through even if it contains high frequency quantities.
The waveform display is as follows:
Figure 2-4 Waveform display when bandwidth limit is
off
. It is now set up as full
width
Figure 2-3
Figure 2-4
26
Page 29

Press [F2] to set BANDWIDTH LIMIT ON. All high
frequency quantities higher than 20MHz in the signal
being measured will be limited. The waveform
display is as follows:
Figure 2-5 Waveform display when
bandwidth limit is on
Figure 2-5
27
3. Setting up the probe r
To match the PROBE attenuation factor setup, it is
necessary to set up the probe attenuation factor in
the channel operation menu accordingly. For
example, when the probe attenuation factor is 10:1,
set the probe attenuation factor at 10X in the menu.
Apply this principle to other values to ensure the
voltage reading is correct.
The figure below shows the setup and vertical range
display when the probe is set at 10:1:
ate
Page 30

Figure 2-6 Setting up the probe attenuation factor in
the channel menu
Figure 2-6
4. Vertical VOLTS/DIV adjustment setup
You can adjust the VOLTS/DIV range of the vertical
deflection factor either in the coarse tune mode or fine
tune mode. In COARSE TUNE mode, the VOLTS/DIV
range is 2mV/div~5V/div
In FINE TUNE mode, you can change the deflection
factor in even smaller steps within the current vertical
range, so as to continuously adjust the vertical
deflection factor within the range of 2mV/div~5V/div
without interruption.
. Tuning is in steps of 1-2-5.
28
Page 31

Figure 2-7 Coarse tuning and fine tuning
the vertical deflection factor
Figure 2-7
29
5. Waveform inversion setup
Waveform inversion: The displayed signal is inverted
180 degrees with respect to the ground level. Figure
2-8 shows the uninverted waveform. Figure 2-9
shows the inverted waveform.
Figure 2-8 Inversion setup for vertical
channel inversion (uninverted)
Figure 2-8
Page 32

Figure 2-9 Inversion setup for
vertical channel inversion (inverted)
Figure 2-9
I. Opera
Math functions are displays of +, -, ×, and FFT
mathematical results of CH1 and CH2. The menu is
as follows:
Figure 2-10 Math functions
ting Math Functions
Figure 2-10
30
Page 33

Table 2-2 Explanatory notes for the math menu
Function Menu Setup Explanatory Note
Type
Signal
source 1
Operator
Signal
source 2
Math
CH1
CH2
+
×
CH1
CH2
To carry out +, -, ×,
functions
Set signal source 1 as
CH1 waveform
Set signal source 1 as
CH2 waveform
Signal source 1 +
Signal source 2
Signal source 1 Signal source 2
Signal source 1 ×
Signal source 2
Signal source 1 ÷
Signal source 2
Set signal source 2 as
CH1 waveform
Set signal source 2 as
CH2 waveform
31
FFT spectrum analysis
By using the FFT (Fast Fourier Transform) algorithm,
you can convert time domain signals (YT) into
frequency domain signals. With FFT, you can
conveniently observe the following types of signals:
Measure the harmonic wave composition and
distortion of the system
Demonstrate the noise characteristics of the DC
power
Analyse oscillation
Page 34

Table 2-3 Explanatory notes for the FFT menu
Function Menu Setup Explanatory Note
Type
Signal
source
Window
FFT
CH1
CH2
Hanning
Hamming
Blackman
Rectangle
To carry out FFT
algorithm functions
Set CH1 as math
waveform
Set CH2 as math
waveform
Set Hanning window
function
Set Hamming window
function
Set Blackman window
function
Set Rectangle window
function
How to operate FFT functions
Signals with DC quantities or DC offset will cause
error or offset of FFT waveform quantities. To
reduce DC quantities, select AC coupling. To
reduce random noise and frequency aliasing
resulted by repeated or single pulse event, set the
acquiring mode of your oscilloscope to average
acquisition.
Select the FFT Window
Assuming the YT waveform is constantly repeating
itself, the oscilloscope will carry out FFT conversion of
time record of a limited length. When this cycle is a
whole number, the YT waveform will have the same
amplitude at the start and finish. There is no waveform
interruption. However, if the YT waveform cycle is not a
whole number, there will be different amplitudes at the
start and finish, resulting in transient interruption of
high frequency at the connection point. In frequency
domain, this is known as leakage. To avoid leakage,
multiply the original waveform by one window function
to set the value at 0 for start and finish compulsively.
For application of the window function, please see the
table below:
32
Page 35

Table 2-4
33
FFT Window Feature
The best frequency resolution, the
Rectangle
Hanning
Hamming
Blackman
worst amplitude resolution. Basically similar to a status without
adding window
Frequency resolution is better
than the rectangle window, but
amplitude resolution is poorer
Frequency resolution is marginally
better than Hanning window.
The best amplitude resolution and
the poorest frequency resolution.
.
Most Suitable Measurement Item
emporary or fast pulse. Signal level is
T
generally the same before and after.
Equal sine wave of very similar frequency.
There is broad-band random noise with
slow moving wave spectrum.
Sine, cyclical and narrow-band
random noise.
emporary or fast pulse. Signal level
T
varies greatly before and after.
Mainly for single-frequency signals to
search for higher-order harmonic wave.
Page 36

Definition
FFT resolution means the quotient of the sam-
pling and math points. When math point value is
fixed, the sampling rate should be as low as possible
relative to the FFT resolution.
Nyquist frequency: To rebuild the original
waveform, at least 2f sampling rate should be used
for waveform with a maximum frequency of f. This is
known as Nyquist stability criterion, where f is the
Nyquist frequency and 2f is the Nyquist sampling
rate.
II. Reference Waveform
Display of the saved reference waveforms can be set
on or off in the [REF] menu. The waveforms are
saved in the non volatile memory of the oscilloscope
and identified with the following names: RefA, RefB.
To display (recall) or hide the reference waveforms,
take the following steps:
Press the [REF] menu button on the front panel.
1.
Press RefA (RefA
2.
signal source and then select the position of the
reference option). Select the
signal source by turning the multi-function control knob
on the upper part of the front panel. You can choose
from 1 to 10. After selecting a numeral for saved waveform, e.g.
form which was originally stored in that position.
After displaying the waveform, press the CANCEL
button [F5] to go back to the previous menu.
3.
Press RefB (RefA reference option). Select the
second signal source for the math function by
repeating step 2.
In actual application, when using your Digital
Storage Oscilloscope DSO-1022 M to measure
and observe such waveforms, you can compare
the current waveform with the reference waveform
for analysis. Press [REF] to display the reference
waveform menu. Setup is as follows:
1, press the recall button to display the wave-
34
Page 37

Table 2-5 Selecting the storage position
Function Menu Setup Explanatory Note
1~10 stand for
Signal source
selection
Disk
Close
Recall
1~10
DSO
--
--
positions of 10 groups
of waveforms respectively
Select an internal
storage position
Close the recalled
waveform
Recall the selected
waveform
T
o select an internal storage position, choose
between 1 and 10.
To save a waveform, see the [ST
Setting up the Horizontal System
Horizontal Control Knob
You can use the horizontal control knob to change the
horizontal graticule (time base) and trigger the
horizontal position of the memory (triggering position).
The vertical centre point above the horizontal orientation of the screen is the time reference point of the
waveform. Changing the horizontal graticule will
cause the waveform to increase or decrease in size
relative to the screen centre. When the horizontal
position changes, the position with respect to the
waveform triggering point is also changed.
Horizontal position: Adjust the horizontal positions of
channel waveforms (including math waveforms).
Resolution of this control button changes with thetime
base.
ORAGE] menu.
35
Cancel
--
Go back to the
previous menu
Horizontal scaling: Adjust the main time base, i.e
sec/div. When time base extension is on, you can use
Page 38

the horizontal scaling knob to change the delay
scanning time base and change the window width.
For details see notes on time base extension.
Horizontal control knob menu: Display the horizontal
menu (see the table below).
Table 2-6
Function Menu Setup Explanatory Note
1. Enable main time base
2. If window extension is
Main time base
--
--
enabled, press main time
base to disable window
extension
Figure 2-11 Horizontal system interface
Figure 2-1
1
Window
extension
--
f
Holdof
--
Enable time base
Adjust holdof
f time
36
Page 39

Icon definitions
represents the memory position of the current
waveform.
represents the memory position of the triggering
point.
represents the position of the triggering point in the
current waveform window.
horizontal time base (main time base), i.e sec/div.
horizontal distance between the triggering position
and the window centre point.
37
Definitions
Y-T Mode: In this mode the Y axis indicates
voltage and the X axis indicates time.
X-Y Mode: In this mode the X axis indicates CH1
voltage and the Y axis indicates CH2 voltage.
Slow Scanning Mode: When horizontal time
base control is set at 50ms/div or slower, the unit
will operate in the slow scan sampling mode. When
observing low frequency signals in slow scanning
mode, it is advised to set the channel coupling as
DC.
Sec/Div: A horizontal scaling (time base) unit. If
waveform sampling is stopped (by pressing the
[RUN/STOP] button), time base control can expand
or compress the waveform.
Page 40

Window Extension
Window extension can be used to zoom in or zoom
out a band of waveform to check image details.
The window extension setting must not be slower
than that of the main time base.
Figure 2-12 Display with the window extended
In
divided into two zones as shown above. The upper
part displays the original waveform. You can move
this zone left and right by turning the horizontal
POSITION knob, or increase and decrease the
selected zone in size by turning the horizontal SCALE
knob.
time base extension mode, the display is
the
Figure 2-12
The lower
of the selected original waveform zone. Please note
that the resolution of extended time base relative to
the main time base is now higher (as shown in the
above figure). Since the waveform shown in the entire
lower part corresponds to the selected zone in the
upper part, you can increase the extended time base
by turning the horizontal SCALE knob to decrease the
size of the selected zone. In other words, you can
increase the multiple of waveform extension.
X-Y Mode
This mode is suitable for CH1 and CH2 only. After
selecting the X-Y
will display CH1 voltage, while the vertical axis will
display CH2 voltage.
part is the horizontally extended waveform
display mode, the horizontal axis
38
Page 41

Figure 2-13 Waveform display in X-Y
Figure 2-13
39
mode
Caution: In the normal X-Y mode, the oscilloscope
can use the random sampling rate to acquire waveforms. To adjust sampling rate and channel vertical
range in the X-Y mode, the omitted sampling rate is
100MS/s. Generally,through adjusting time base
range, lower the sampling rate appropriately will result
in lissajous figures of better display quality. The
following functions have no effect in the X-Y display
mode:
Auto measurement mode
Cursor measurement mode
Reference or math waveform
Vector display type
Horizontal position knob
Trigger control
Setting up the Trigger System
Triggering decides when the oscilloscope collects data
and display waveforms. Once the trigger is correctly
set up, it can convert unstable display into significant
waveforms. When beginning to collect data, the
oscilloscope first collects sufficient data to draw a
waveform on the left of the triggering point. While
waiting for the triggering condition to occur, it will
Page 42

continuously collect data. When trigger is detected,
the oscilloscope will continuously collect sufficient
data to draw a waveform on the right of the triggering
point. The trigger control zone on the operation panel
of your oscilloscope comprises a trigger level adjustment knob, a trigger menu button [MENU], [50%] for
setting up the trigger level at the vertical centre point
of the signal, and a compulsory trigger button
[FORCE]
Pulse Trigger: When the pulse width of the trigger
signal reaches a preset trigger condition, trigger
occurs.
Video T
standard video signals.
Alternate Trigger: Applicable to triggering
signals without frequency coherence.
Below are notes for various trigger menus.
rigger: Carry out field or line trigger to
Trigger level: Trigger level sets the signal voltage
with respect to the triggering point.
[50%]: Setting the trigger level at the vertical centre
point of the trigger signal amplitude.
[FORCE]: To generate a compulsory trigger signal.
Mainly used in the trigger mode and “Normal” and
“Single” modes.
[MENU]: Button for the trigger setup menu
ger Control
Trig
Trigger modes: edge, pulse, video and alternate
Edge Trigger: When the edge of the trigger signal
reaches a given level, trigger occurs.
Edge Trigger
Edge trigger means triggering at the trigger threshold. When selecting “edge trigger”, you are triggering
at the rising and falling edges of the input signal.
40
Page 43

Table 2-8
Function Menu Setup Explanatory Note
Type Edge
Set CH1 as the signal source trigger signal
Set CH2 as the signal source trigger signal
Set the external trigger input channel as the signal source trigger signal
Set the external trigger source divided by 5 to extend the external
trigger level range
Signal source
selection
CH1
CH2
EXT
EXT/5
41
Inclination
rigger mode
T
T
rigger coupling
AC Line
Alternate
Rising
Falling
Auto
Normal
Single
DC
AC
H/F Reject
L/F Reject
Set up as AC Line trigger
CH1, CH2 trigger their own signals alternately
Set to trigger on the signal’
Set to trigger on the signal’
Set to sample waveform only if no trigger condition is detected
Set to sample waveform only if trigger condition is satisfied
Set to sample waveform once when detecting one trigger and then stop
Intercept DC quantities of the input signal
Allow AC and DC quantities of the input signal to pass
Reject high frequency quantities above 80kHz of the signal
Reject low frequency quantities below 80kHz of the signal
s rising edge
s falling edge
Page 44

Pulse Trigger
Pulse trigger means determining the triggering time
based on the pulse width. You can acquire abnormal pulse by setting the pulse width condition.
Table 2-9 (page 1)
Function Menu Setup Explanatory Note
Type
Trigger source
Pulse width
condition
Setting
Next
½
Pulse
CH1
CH2
EXT
EXT/5
AC Line
Alternate
Larger
Smaller
Equal
20ns - 10s
--
Set CH1 as the signal source trigger signal
Set CH2 as the signal source trigger signal
Set the external trigger input channel as the signal source trigger signal
Set the external trigger source divided by 5 to extend the external trigger
level range
Set up as AC Line trigger
CH1, CH2 trigger their own signals alternately
Trigger when pulse width is larger than default value
rigger when pulse width is smaller than default value
T
Trigger when pulse width equals to default value
Set the pulse width at 20ns~10s and adjust by turning the control knob on
the upper front panel
Go to next page
42
Page 45

Table 2-10 (page 2)
Function Menu Setup Explanatory Note
43
Trigger polarity
rigger mode
T
Previous
2/2
Positive pulse width
Negative pulse width
Auto
Normal
Single
--
Set positive pulse width as the trigger signal
Set negative pulse width as the trigger signal
The system automatically samples waveform data when there
is no trigger signal input. The scan baseline is shown on the
display. When the trigger signal is generated, it automatically
turns to trigger scan.
The system stops acquiring data when there is no trigger
signal. When the trigger signal is generated, trigger scan
occurs.
One trigger will occur when there is an input trigger signal.
Then trigger will stop.
Go to previous page
Page 46

Video Trigger
By selecting video trigger, you can carry out field or line trigger with
NTSC or PAL standard video signals. Default trigger coupling is DC.
Trigger menus are as follows:
Table 2-11 Video trigger setup
Function Menu Setup Explanatory Note
Type Pulse
Set CH1 as the trigger signal
Set CH2 as the trigger signal
Set the external trigger input channel as the trigger signal
Attenuate the external trigger source 5 times as the trigger signal
Set ALL Line as the trigger signal
Set CH1 and CH2 as alternate trigger signals
Suitable for video signals of low black level
Suitable for video signals of high black level
Set the TV line to synchronize with trigger
Set synchronized trigger on the specified line and adjust by turning
the control knob on the upper front panel
Set the video odd field to synchronized trigger
Set the video even field to synchronized trigger
Trigger source
Standard
Synchronization
CH1
CH2
EXT
EXT/5
AC Line
Alternate
PAL
NTSC
All lines
Specified lines
Odd field
Even field
44
Page 47

When PAL is selected for STANDARD format and
SYNCHRONIZATION mode is either All Line or
Specified Line, you will see a screen display as
shown in Figure 2-14. When SYNCHRONIZATION
mode is either Odd Field or Even Field, you will see
a screen display as shown in Figure 2-15.
Figure 2-14 Video trigger: line synchronization
Figure 2-14
45
Figure 2-15 V
ideo trigger: field synchronization
Figure 2-15
Page 48

Alternate Trigger
When alternate trigger is selected, the trigger signal
will be present in two vertical channels. This triggering
mode is suitable for observing two signals of unrelated signal frequencies. The figure below shows the
alternate trigger waveform. Trigger menus are listed
in Table 2-12.
Figure 2-16 Observing two signals of different
frequencies in the alternate trigger mode
able 2-12 Alternate trigger setup
T
Function Menu Setup Explanatory Note
Type
T
rigger source
Edge
Alternate
Set trigger mode to
edge
Set CH1 and CH2 to
alternate trigger
Figure 2-16
Inclination
Trigger mode
T
rigger coupling
Rising
Auto
AC
Set trigger inclination
as rising edge
Set trigger mode to
automatic
Set trigger coupling
mode to AC
46
Page 49

Setup for Trigger coupling mode
Enter the trigger setup menu to set up the trigger
coupling mode and achieve the most stable synchronization. The trigger coupling menus are as follows:
Function Menu Setup Explanatory Note
Type
Edge
Set CH1 and CH2 to
Trigger source
Inclination
Alternate
Rising
alternate trigger
Set trigger inclination as
rising edge
Adjusting the Holdoff Time
You can adjust the holdoff time to observe complicated waveforms (e.g. pulse string series). Holdoff
time means the waiting time for the trigger to be
ready for use again. During this time the oscilloscope
will not trigger until the holdoff is complete. For
example, if you wish to trigger one group of pulse
series at the first pulse, set the holdoff time to the
pulse string width as shown in Figure 2-18. For
holdoff menus please see the table below:
Trigger mode
Coupling
47
Auto
DC
AC
H/F Reject
L/F Reject
Set trigger mode to
automatic
Intercept DC quantities
Allow all quantities to pass
Intercept high frequency
quantities of the signal, only
allow low frequency
quantities to pass
Intercept low frequency
quantities of the signal, only
allow high frequency
quantities to pass
Page 50

Table 2-15
Function Menu Setup Explanatory Note
1. Enable main time
base
2. If window exten-
Main time base
--
sion is enabled,
press main time
base to disable
window extension
Figure 2-17 Use the holdoff function to synchronize
complicated signals
Window exten
sion
--
Holdoff
-
--
Enable time base
extension
Adjust holdof
f time
Figure 2-17
48
Page 51

Operation
Follow the normal signal synchronization procedure
1.
and select the edge, trigger source and inclination in
the trigger [MENU]. Adjust the trigger level to make
the waveform display as stable as possible.
Press the key in the horizontal [MENU] to display
2.
the horizontal menu.
Adjust the multi-function control knob in the upper
3.
front panel. The holdoff time will change accordingly
until the waveform display is stable.
Definitions
1.Trigger source: Trigger can be obtained from
various sources: input channel (CH1, CH2), external
trigger (EXT, EXT/5), grid.
Input Channel: The most common trigger
source is input channel (choose either one). The
selected trigger source can operate normally whether
the input is displayed or not.
External Trigger: This type of trigger source
can trigger in a third channel while acquiring data in
two other channels. For example, you can use an
external clock or the signal from a circuit to be
measured
49
as the trigger source.
Both EXT and EXT/5 trigger sources use external
trigger signals from the EXT
the signals directly. You can use EXT within the
trigger level range of –1.6V and +1.6V.
EXT/5 divide the trigger by 5. As a result, trigger
range is extended to –8V to +8V, enabling the
oscilloscope to trigger at a large signal.
AC Line: It means the AC Line power source.
This trigger mode is suitable for observing signals
related to the AC Line
- e.g. the correlation between lighting equipment and
power source equipment - to achieve stable synchronization.
2.Trigger mode: Determine the action of your
oscilloscope when there is no trigger. This oscilloscope offers three trigger modes for selection: auto,
normal and single.
Auto Trigger: The system will sample waveform
data when there is no trigger signal input. The scan
baseline is shown on the display. When the trigger
signal is generated, it automatically turns to trigger
scan for signal synchronization.
TRIG jack. EXT can use
Page 52

Note: When time base of the scan waveform is set to
50ms/div or slower, the Auto mode allows no trigger
signal.
Normal Trigger: In this mode, your oscilloscope samples waveforms only when triggering
conditions are met. The system stops acquiring data
and waits when there is no trigger signal. When the
trigger signal is generated, trigger scan occurs.
Single Trigger: In this mode, you only have to
press the [RUN] button once and the oscilloscope
will wait for trigger. When the oscilloscope detects
one trigger, it will sample and display the acquired
waveform, then stop.
3.Trigger coupling: Trigger coupling determines
which quantities of the signal are transmitted to the
trigger circuit. Coupling modes are DC, AC, low
frequency reject and high frequency reject.
DC: Allowing all quantities to pass.
AC: Intercepting DC quantities and attenuating
signals under 10Hz.
Low Frequency Reject: Intercepting DC
quantities and attenuating low frequency quantities
under 80kHz.
High Frequency Reject: Attenuating high
frequency quantities over 80kHz.
4.Pretrig
before/after triggering.
The trigger position is typically set at the horizontal
center of the screen. In this case, you are able to
view five divisions of pretrigger and delayed trigger
information. Use the horizontal position button to
adjust the horizontal shift of the waveform to see
more pretrigger information. By observing pretrigger
data, you can see the waveform before trigger
occurs. For example, you can detect the glitch that
occurs when the circuitry starts. Observation and
analysis of trigger data can help you identify the
cause of glitch.
ger/Delayed Trigger: Data sampled
50
Page 53

Setting up the Sampling System
As shown below, [ACQUIRE] button in the control
zone is the function key for the sampling system.
Figure 2-18 Function key for the sampling system.
Figure 2-18
51
Press the [ACQUIRE] button to pop out the sampling
setup menu. You can use this menu to adjust the
sampling mode.
Table 2-16 Sampling menu
Function Menu Setup Explanatory Note
Turn on the ordinary sampling
mode
Turn on the peak detect mode
Set to average sampling and
display the average number of
times
Set the average number of
times in multiples of 2, i.e. 2,
4, 8, 16, 32, 64, 128, 256. To
change the average number of
times, use the multi-function
control knob on the left of
figure 2-18.
Acquisition
mode
A
verage
number of
times
--
--
--
Sample
Peak
detect
Average
2~256
Page 54

By changing acquisition setup, you can observe the
consequent changes in waveform display. If the signal
contains considerable noise, you will see the following
waveform displays when average sampling is not selected
and when 32-time average sampling is selected, see figure
2-19 and 2-20:
Figure 2-19 Waveform without average sampling
Figure 2-19
Figure 2-20 Waveform when 32-time average
sampling is selected
Figure 2-20
52
Page 55

Note:
1.To avoid mixed envelop, select Peak Detect.
2.To reduce random noise of the displayed signal,
select average sampling and increase the average
number of times in multiples of 2, i.e selecting from 2
to 256.
53
Page 56

Definitions:
Real time sampling: In this mode, the system makes full acquisition to fill the memory. Maximum sampling
rate is 250MS/s. At a setting of 50ns or faster, the oscilloscope will automatically carry out interpolation, i.e.
inserting a sampling point between other sampling points.
Peak detect mode: In this mode, the oscilloscope identifies the maximum and minimum values of the input
signals at each sampling interval and use these values to display the waveform. In effect, the oscilloscope can
acquire and display narrow pulse which would otherwise be omitted in the sampling mode. Noise seems to be
more significant in this mode.
Average mode: The oscilloscope acquires several waveforms and take the average value to display the final
waveform. You can use this mode to reduce random noise.
54
Page 57

Setting up the Display System
As shown below, the [DISPLAY] button in the control
zone is the function key for the display system.
Figure 2-21 Function key for the sampling system
(display).
Figure 2-21
Press the [DISPLAY] button to pop out the setup
menu shown below
the display mode.
. You can use this menu to adjust
Table 2-17 Display menu
Function Menu Setup Explanatory Note
Sampling points are
Display type
Format
Persist
Vector
dots
YT
XY
Off
Infinite
linked for display
Sampling points are
directly displayed
Operating mode of
the oscilloscope
X-Y is the display
mode; CH1 is X input,
CH2 is Y input
The waveform on the
screen is refreshed at
higher speed
The original waveform
on the screen remains
on display. New data
will be added continu
ously until this function
is disabled
-
55
Contrast
+, -
Setting the waveform
contrast
Page 58

(STORAGE).
[STORAGE]
[STORAGE]
[STORAGE]
Page 59

Length
Page 60

Page 61
French
German
Dutch
Page 62

Page 63

Page 64

Digital Storage Oscilloscope DSO-1022 M
Digital Storage
Oscilloscope DSO-1022 M
Page 65

Page 66

Digital Storage Oscilloscope DSO-1022 M
Page 67

Digital Storage Oscilloscope DSO-1022 M
Page 68

Page 69

Page 70

Page 71

Page 72

Page 73

Page 74

Page 75

Page 76

Page 77

Page 78

Page 79

Page 80

Page 81

Page 82

Page 83

Page 84

Page 85

Page 86

Page 87

Page 88

Page 89

Page 90

Digital Storage Oscilloscope DSO1022 M
250MS/s
Page 91
Page 92

≤
≤14ns
Page 93

Page 94

Page 95

Page 96

Page 97

DSO-1022 M
Page 98

Digital Storage
Oscilloscope DSO-1022 M
DSO-1022 M
USB Lead
RS-232 Cable
Page 99

97
Page 100

VOLTCRAFT IM INTERNET http://www.voltcraft.de
Imprint
These operating instructions are published by Voltcraft®, Lindenweg 15, D-92242 Hirschau/ Germany, Phone +49 180 586 582 723 8.
No reproduction (including translation) is permitted in whole or part e.g. photocopy, microfilming or storage in electronic data processing equipment, without the express written consent of the publisher.
The operating instructions reflect the current technical specifications at time of print. We reserve the right to change the technical or physical specifications.
© Copyright 2008 by Voltcraft
®
.
*02_03/08_01-SP
 Loading...