

Page 1

vRealize Operations
Manager User Guide
vRealize Operations Manager 6.7
Page 2

vRealize Operations Manager User Guide
You can find the most up-to-date technical documentation on the VMware website at:
https://docs.vmware.com/
If you have comments about this documentation, submit your feedback to
docfeedback@vmware.com
VMware, Inc.
3401 Hillview Ave.
Palo Alto, CA 94304
www.vmware.com
Copyright © 2018 VMware, Inc. All rights reserved. Copyright and trademark information.
VMware, Inc. 2
Page 3

Contents
About This User Guide 4
Monitoring Objects in Your Managed Environment by Using
1
vRealize Operations Manager 5
What to Do When... 5
User Scenario: A User Calls with a Problem 6
User Scenario: An Alert Arrives in Your Inbox 10
User Scenario: You See Problems as You Monitor the State of Your Objects 19
Monitoring and Responding to Alerts 32
Monitoring Alerts in vRealize Operations Manager 33
Monitoring and Responding to Problems 37
Evaluating Object Information Using Badge Alerts and the Summary Tab 38
Investigating Object Alerts 41
Evaluating Metric Information 44
Capacity Tab Overview 46
Using Troubleshooting Tools to Resolve Problems 46
Creating and Using Object Details 48
Examining Relationships in Your Environment 53
User Scenario: Investigate the Root Cause of a Problem by Using the Troubleshooting Tab
Options 54
Running Actions from vRealize Operations Manager 58
Run Actions From Toolbars in vRealize Operations Manager 58
Troubleshoot Actions in vRealize Operations Manager 59
Monitor Recent Task Status 61
Troubleshoot Failed Tasks 62
Viewing Your Inventory 70
VMware, Inc.
Capacity Optimization for Your Managed Environment 71
2
Example: Reclaiming Resources from Oversized VMs 72
Example: Excluding VMs from Reclaim Action 73
What-If Analysis: Adding a Workload 74
Example: Run a What-If Scenario 75
Example: Import Workload from an Existing VM Scenario 76
Custom Datacenters in VMware vRealize Operations Manager 78
3
Page 4

About This User Guide
The VMware® vRealize Operations Manager User Guide describes what to do when users experience
performance problems in your managed environment.
As a system administrator, you might become aware of a problem with an object in your environment
when vRealize Operations Manager generates an alert, or when a user contacts you. To help ensure
optimal performance, this information describes how you use vRealize Operations Manager to monitor,
troubleshoot, and take action to address problems. It also provides information on how to assess whether
problems due to over demand or lack of capacity require a system change or upgrade.
Intended Audience
This information is intended for vRealize Operations Manager administrators, virtual infrastructure
administrators, and operations engineers who track and maintain object performance in your managed
environment.
VMware Technical Publications Glossary
VMware Technical Publications provides a glossary of terms that might be unfamiliar to you. For
definitions of terms as they are used in VMware technical documentation, go to
http://www.vmware.com/support/pubs.
VMware, Inc.
4
Page 5

Monitoring Objects in Your
Managed Environment by Using
vRealize Operations Manager 1
You can use vRealize Operations Manager to resolve problems that your customers raise, respond to
alerts that identify problems before your customers report problems, and generally monitor your
environment.
When your customers experience performance problems and call you to resolve the problem, the data
that vRealize Operations Manager collects and analyzes is presented to you in graphical forms. You can
then compare and contrast objects, understand the relationship between objects, and determine the root
cause of problems.
A generated alert notifies you when objects in your environment are experiencing problems. If you resolve
the problem based on the alert before your customers notice, then you avoid service interruptions.
You can investigate the problems that generate alerts or that result in calls by using the Alerts, Events,
Details, and Environment tabs. If you find the root cause of the problem, you might be able to resolve
the problem by running an action. The actions make changes to objects in the target system, for example,
the VMware vCenter Server® system, from vRealize Operations Manager. If you find the root cause of the
problem, you might be able to resolve the problem by running an action. The actions make changes to
objects in the target system, for example, the VMware vCenter Server system, from
vRealize Operations Manager.
This chapter includes the following topics:
n
What to Do When...
n
Monitoring and Responding to Alerts
n
Monitoring and Responding to Problems
n
Running Actions from vRealize Operations Manager
n
Viewing Your Inventory
What to Do When...
As a virtual infrastructure administrator, network operations center engineer, or other IT professional, use
vRealize Operations Manager to monitor objects in your environment. Using
vRealize Operations Manager, you can ensure service to your customers and resolve any problems that
occur.
VMware, Inc.
5
Page 6

vRealize Operations Manager User Guide
Your vRealize Operations Manager administrator has configured vRealize Operations Manager to
manage two vCenter Server instances that manage multiple hosts and virtual machines. It is your first day
using vRealize Operations Manager to manage your environment.
n
User Scenario: A User Calls with a Problem
The vice president of sales telephones tech support reporting that a virtual machine, VPSALES4632,
is running slowly. She is working on sales reports for an upcoming meeting and is running behind
schedule because of the slow performance of the virtual machine.
n
User Scenario: An Alert Arrives in Your Inbox
You return from lunch to find an alert notification in your inbox. You can use
vRealize Operations Manager to investigate and resolve the alert.
n
User Scenario: You See Problems as You Monitor the State of Your Objects
As you investigate your objects in the context of this scenario, vRealize Operations Manager
provides details to help you resolve the problems. You analyze the state of your environment,
examine current problems, investigate solutions, and take action to resolve the problems.
User Scenario: A User Calls with a Problem
The vice president of sales telephones tech support reporting that a virtual machine, VPSALES4632, is
running slowly. She is working on sales reports for an upcoming meeting and is running behind schedule
because of the slow performance of the virtual machine.
As an operations engineer, you reviewed the morning alerts and did not see problems with that virtual
machine, so you begin troubleshooting the problem.
Procedure
1 Search for a Specific Object
As a network operations engineer, you must locate the customer's virtual machine in
vRealize Operations Manager so that you can begin troubleshooting the reported problem.
2 Review Alerts Related to Reported Problems
The sales vice president reports degraded performance in a virtual machine. To determine if the
virtual machine has any alerts indicating the cause, review alerts for the virtual machine.
3 Use Troubleshooting to Investigate a Reported Problem
To troubleshoot problems with the VPSALES4632 virtual machine, consider evaluating symptoms,
examining time line information and events, and creating metric charts to find the root cause.
Search for a Specific Object
As a network operations engineer, you must locate the customer's virtual machine in
vRealize Operations Manager so that you can begin troubleshooting the reported problem.
You use vRealize Operations Manager to monitor three vCenter Server instances with a total of 360 hosts
and 18,000 virtual machines. The easiest way to locate a particular virtual machine is to search for it.
VMware, Inc. 6
Page 7

vRealize Operations Manager User Guide
Procedure
1 In the Search text box on the vRealize Operations Manager title bar, enter the name of the virtual
machine.
The Search text box displays all the objects that contain the string you enter in the text box. If your
customer knows that the virtual machine name contains SALES, enter the string and the virtual
machine is included in the list.
2 Select the object in the list.
The main pane displays the object name and the Summary tab. The left pane displays and the related
objects, including the host system and vCenter Server instance.
What to do next
Look for alerts related to the reported problem for the object. See Review Alerts Related to Reported
Problems.
Review Alerts Related to Reported Problems
The sales vice president reports degraded performance in a virtual machine. To determine if the virtual
machine has any alerts indicating the cause, review alerts for the virtual machine.
Alerts on an object can give you an insight into problems beyond the specific problem reported by the
user.
Prerequisites
Locate the customer's virtual machine so that you can review related alerts. See Search for a Specific
Object.
Procedure
1 Click the Summary tab for the object generating alerts.
The Summary tab displays active alerts for the object.
2 Review the top alerts for Health, Risk, and Efficiency.
Top alerts identify the primary contributors to the current state of the object. Do any of them appear to
contribute to the slow response time? For example, any ballooning or swapping alerts indicate that
you must add memory to the virtual machine. Are any alerts related to memory contention?
Contention can be an indicator that you must add memory to the host.
3 If the Summary tab does not include top problems that appear to explain the reported problem, click
the Alerts tab.
The Alerts tab displays all active alerts for the current object.
VMware, Inc. 7
Page 8

vRealize Operations Manager User Guide
4 Review the alerts for problems that are similar to or contribute to the reported problem.
a To view the active and canceled alerts, click Status: Active to clear the filter and display active
and inactive alerts.
The canceled alerts might provide information about the problem.
b So that you can locate alerts generated on or before the time when your customer reported the
problem, click the Created On column to sort the alerts.
c To view alerts for the parent objects in the same list with the alert for the virtual machine, click
View From, then select, for example, Host System under Parents.
The system adds these object types to the list so that you can determine if alerts among the
parent objects are contributing to the reported problem.
5 If you locate an alert that appears to explain the reported problem, click the alert name in the alerts
list.
6 On the Alert > Symptoms tabs, review the triggered symptoms and recommendations to determine if
the alert indicates the root cause of the reported problem.
What to do next
n
If the alert appears to indicate the source of the problem, follow the recommendations and verify the
resolution with your customer. For an example, see Run a Recommendation on a Datastore to
Resolve an Alert.
n
If you cannot locate the cause of the reported problem among the alerts, begin more in-depth
troubleshooting. See Use Troubleshooting to Investigate a Reported Problem.
Use Troubleshooting to Investigate a Reported Problem
To troubleshoot problems with the VPSALES4632 virtual machine, consider evaluating symptoms,
examining time line information and events, and creating metric charts to find the root cause.
If a review of the alerts did not help you identify the cause of the problem reported for the virtual machine,
use the following tabs: Alert > Symptoms, Event > Timeline, and All Metrics to troubleshoot the virtual
machine history and current state
.
Prerequisites
n
Locate the object for which the problem was reported. See Search for a Specific Object.
n
Review the alerts for the virtual machine to determine if the problem is already identified and
recommendations made. See Review Alerts Related to Reported Problems.
Procedure
1 In the menu, click Environment, then click Inventory and select VPSALES4632 from the tree.
The main pane updates to display the object Summary tab.
VMware, Inc. 8
Page 9

vRealize Operations Manager User Guide
2 Click the Alerts tab, click the Symptoms tab, and review the symptoms to determine if one of the
symptoms is related to the reported problem.
Depending on how your alerts are configured, some symptoms might be triggered but not sufficient to
generate an alert.
a Review symptom names to determine if one or more symptoms are related to the reported
problem.
The Information column provides the triggering condition, trend, and current value. What are the
most common symptoms that affect response time? Do you see any symptoms related to CPU or
memory use?
b Sort by the Created On date so that you can focus on the time frame in which your customer
reported that the problem.
c Click the Status: Active filter button to disable the filter so that you can review active and inactive
symptoms.
It appears the problem is related to CPU or memory use. But you do not know if the problem is with
the virtual machine or with the host.
3 Click the Events > Timeline tabs and review the alerts, symptoms, and change events that might
help identify common trends that are contributing to the reported problem.
a To determine if other virtual machines had symptoms triggered and alerts generated at the same
time as your reported problem, click View From > Peer.
Other virtual machine alerts are added to the time line. If you see that multiple virtual machines
triggered symptoms in the same time frame, then you can investigate parent objects.
b Click View From and select Host System from the Parent list.
The alerts and symptoms that are associated with the host on which the virtual machine is
deployed are added to the time line. Use the information to determine if a correlation exists
between the reported problem and the alerts on the host.
4 Click the Events > Events tab to view changes in the collected metrics for the problematic virtual
machine. Metrics might direct you toward the cause of the reported problem.
a Manipulate the Date Controls to identify the approximate time when your customer reported the
problem.
b Use the Filters to filter on event criticality and status. Select Symptoms if you want to include the
filters in your analysis.
c Click an Event to view the details about the event.
d Click View From, select Host System under Parents, and repeat the analysis.
Comparing events on the virtual machine and the host, and evaluating those results, indicates that
CPU or memory problems are the likely cause of the problem.
VMware, Inc. 9
Page 10

vRealize Operations Manager User Guide
5 If the problem relates to CPU or memory use, click All Metrics and create metric charts to identify
whether it is CPU, memory, or both.
a If host is still the focus, begin by working with host metrics.
b In the metric list, double-click the CPU Usage (%) and the Memory Usage (%) metrics to add
them to the workspace on the right.
c In the map, click the VPSALES4632 object.
The metric list now displays the virtual machine metrics.
d In the metric list, double-click the CPU Usage (%) and the Memory Usage (%) metrics to add
them to the workspace on the right.
e Review the host and virtual machine charts to see if you can identify a pattern that indicates the
cause of the reported problem.
Comparing the four charts shows normal CPU use ion both the host and the virtual machine, and
normal memory use on the virtual machine. However, memory use on the host is consistently
elevated three days before the reported problem on VPSALES4632.
The host memory is consistently elevated, which impacts virtual machine response time. The number of
running virtual machines is well within the supported number. The cause might be many intensive process
applications on the virtual machines. Move some of the virtual machines to other hosts, distribute the
workload, or power off idle virtual machines.
What to do next
n
In this example, use vRealize Operations Manager to power off virtual machines on the host so that
you can improve performance in the running virtual machines. See Run Actions From Toolbars in
vRealize Operations Manager.
n
If you want to use the combination of charts that you created on the All Metrics tab again, click
Generate Dashboard.
User Scenario: An Alert Arrives in Your Inbox
You return from lunch to find an alert notification in your inbox. You can use vRealize Operations Manager
to investigate and resolve the alert.
As a network operations engineer, you are responsible for several hosts and their datastores and virtual
machines. You receive emails when an alert is generated for your monitored objects. In addition to
alerting you to problems in your environment, alerts can provide viable recommendations to resolve those
problems. As you investigate this alert, you are evaluating the data to determine if one or more of the
recommendations can resolve the problem.
This scenario assumes that you configured the outbound alerts to send standard email using SMTP. It
also assumes that you configured notifications to send you alert notifications using the Standard Email
Plug-In. When outbound alerts and notifications are configured, vRealize Operations Manager sends
messages when an alert is generated so that you can respond quickly.
VMware, Inc. 10
Page 11

vRealize Operations Manager User Guide
Prerequisites
n
Verify that outbound alerts are configured for standard email alerts. See vRealize Operations
Manager Customization and Administration Guide.
Procedure
1 Respond to an Alert in Your Email
As a network operations engineer, you receive an email message from
vRealize Operations Manager about a datastore for which you are responsible. The email
notification informs you about the problem even when you are not presently working in
vRealize Operations Manager.
2 Evaluate Other Triggered Symptoms for the Affected Data Store
Because you need more information about the data store before you decide on the best response,
you examine the Symptoms tab to see other triggered symptoms for the data store.
3 Compare Alerts and Events Over Time in Response to a Datastore Alert
To evaluate an alert over time, compare the current alert and symptoms to other alerts and
symptoms, other events, other objects, and over time.
4 View the Affected Datastore in Relation to Other Objects
To view the object for which the alert was generated as it relates to other objects, use the topological
map on the Relationships tab.
5 Construct Metric Charts to Investigate the Cause of the Data Store Alert
To analyze the capacity metrics related to the generated alert, you create charts that compare
different metrics. These comparisons help identify when something changed in your environment
and what effect it had on the datastore.
6 Run a Recommendation on a Datastore to Resolve an Alert
As a network operations engineer, you investigated the alert regarding datastore disk space and
determined that the provided recommendations can the problem. The recommendation to delete
unused snapshots is especially useful. Use vRealize Operations Manager to delete the snapshots.
Respond to an Alert in Your Email
As a network operations engineer, you receive an email message from vRealize Operations Manager
about a datastore for which you are responsible. The email notification informs you about the problem
even when you are not presently working in vRealize Operations Manager.
In your email client, you receive an alert similar to the following message.
Alert was updated at Tue Jul 01 16:34:04 MDT:
Info: datastore1 Datastore is acting abnormally from Mon Jun 30 10:21:07 MDT and was last updated at
Tue Jul 01 16:34:04 MDT
Alert Definition Name: Datastore is running out of disk space
Alert Definition Description: Datastore is running out of disk space
Object Name: datastore1
Object Type: Datastore
VMware, Inc. 11
Page 12

vRealize Operations Manager User Guide
Alert Impact: risk
Alert State: critical
Alert Type: Storage
Alert Sub-Type: Capacity
Object Health State: info
Object Risk State: critical
Object Efficiency State: info
Symptoms:
SYMPTOM SET - self
Symptom Name | Object Name | Object ID | Metric | Message Info
Datastore space use reaching limit datastore1 | b0885859-e0c5-4126-8eba-6a21c895fe1b |
Capacity|Used Space | HT above 99.20800922575977 > 95
Recommendations:
- Storage vMotion some virtual machines to a different datastore
- Delete unused snapshots of virtual machines
- Add more capacity to the datastore
Notification Rule Name: All alerts - datastores
Notification Rule Description:
Alert ID: a9d6cf35-a332-4028-90f0-d1876459032b
Operations Manager Server - 192.0.2.0
Alert details
Prerequisites
n
Verify that outbound alerts are configured for standard email alerts. See vRealize Operations
Manager Customization and Administration Guide.
n
Verify that the notifications are configured to send messages to your users for the alert definition. For
an example of how to create an alert notification, see vRealize Operations Manager Customization
and Administration Guide.
Procedure
1 In your email client, review the message so that you understand the state of the affected objects and
determine if you must begin investigating immediately.
Look for the alert name, the alert state to determine the current level of criticality, and the affected
objects.
2 In the email message, click Alert Details.
vRealize Operations Manager opens on the Summary tab in the alert details for the generated alert
and affected object.
VMware, Inc. 12
Page 13

vRealize Operations Manager User Guide
3 Review the Summary tab information.
Option Evaluation Process
Alert name and
description
Recommendations Review the top recommendation, and if available, other recommendations, to understand the
What is Causing the
Problem?
Review the name and description and verify that you are evaluating the alert for which you
received an email message.
steps that you must take to resolve the problem. If implemented, do the prioritized
recommendations resolve the problem?
Which symptoms were triggered? Which were not triggered? What effect does this evaluation
have on your investigation? In this example, the alert that the datastore is running out of space is
configured so that the criticality is symptom-based. If you received a critical alert, then it is likely
that the symptoms are already at a critical level, having moved up from Warning and Immediate.
Look at the sparkline or metric graph chart for each symptom to determine when the problem
escalated on the datastore object.
What to do next
n
If you determine that the recommendations might resolve the problem, implement them. See Run a
Recommendation on a Datastore to Resolve an Alert.
n
If you need more information about the affected objects, continue your investigation. Begin by looking
at other triggered symptoms for the datastore. See Evaluate Other Triggered Symptoms for the
Affected Data Store.
Evaluate Other Triggered Symptoms for the Aected Data Store
Because you need more information about the data store before you decide on the best response, you
examine the Symptoms tab to see other triggered symptoms for the data store.
If other symptoms are triggered for the object besides the symptom included in the alert, evaluate them to
determine what the symptoms reflect about the state of the object, and to decide whether the related
recommendations might resolve the problem.
Prerequisites
Verify that you are addressing the alert for which you received an alert message in your email. See
Respond to an Alert in Your Email.
Procedure
1 In the menu, click Alerts and select the alert name in the data grid.
The center pane view changes to display the alert detail tabs.
2 Click View additional metrics > Alerts > Symptoms and review the active symptoms.
Option Evaluation Process
Criticality Are other symptoms of similar criticality present that are affecting the object?
Symptom Are any of the triggered symptoms related to the symptoms that triggered the current alert? Symptoms related to
time remaining, capacity, or stress that could indicate storage problems?
VMware, Inc. 13
Page 14

vRealize Operations Manager User Guide
Option Evaluation Process
Created On Do the date and time stamps for the symptoms indicate that they were triggered before the alert you are
investigating, indicating that it might be a related symptom? Were the symptoms triggered after the alert was
generated, indicating that the alert symptoms contributed to these other symptoms?
Information Can you identify a correlation between the alert symptoms and the other symptoms based on the triggering
metric values?
What to do next
n
If your review of the symptoms and the provided information clearly indicates that the
recommendations will solve the problem, implement one or more of the recommendations. For an
example of implementing one of the recommendations, see Run a Recommendation on a Datastore
to Resolve an Alert.
n
If your review of the symptoms did not convince you that the recommendations will resolve the
problem or provide you with enough information to identify the root cause, continue your investigation
using the Events > Timeline tab. See Compare Alerts and Events Over Time in Response to a
Datastore Alert.
Compare Alerts and Events Over Time in Response to a Datastore Alert
To evaluate an alert over time, compare the current alert and symptoms to other alerts and symptoms,
other events, other objects, and over time.
As a network operations engineer, you use the Events > Timeline tab to compare this alert to other alerts
and events in your environment. This way, you can determine if you can resolve the problem of the
datastore running out of disk space by applying one or more alert recommendations.
Prerequisites
Verify that you are addressing the alert for which you received an alert message in your email. See
Respond to an Alert in Your Email.
Procedure
1 In the menu, click Alerts and select the alert name in the data grid.
The alert details appear to the right.
2 Click View Events > Timeline.
The Timeline tab displays the generated alert and the triggered symptoms for the affected object in a
scrollable timeline format, starting when the alert was generated.
3 Scroll through the timeline using the week timeline at the bottom.
4 To view events that might contribute to the alert, click Event Filters and click the check box for each
event type.
Events related to the object are added to the timeline. You add the events to your evaluation of the
current state of the object and determine whether the recommendations can resolve the problem.
VMware, Inc. 14
Page 15

vRealize Operations Manager User Guide
5 Click View From and select Host under Parents.
Because the alert is related to disk space, adding the host to the timeline enables you to see what
alerts and symptoms are generated for the host. As you scroll through the timeline, ask: when did
some of the related alerts begin? When are they no longer on the timeline? What was the effect on
the state of the datastore object?
6 Click View From and select Peer under Parents.
If other datastores have alerts related to the alert you are currently investigating, seeing when the
alerts for the other datastores were generated can help you determine what resource problems you
are experiencing.
7 To remove canceled alerts from your timeline, click Filters and deselect the Canceled check box.
Removing the canceled alerts and symptoms from the timeline clears the view and enables you to
focus on current alerts.
What to do next
n
If your evaluation of alerts in the timeline indicated that one or more of the recommendations to
resolve the alert are valid, implement the recommendations. See Run a Recommendation on a
Datastore to Resolve an Alert.
n
If you need more information about the affected object, continue your investigation. See View the
Affected Datastore in Relation to Other Objects.
View the Aected Datastore in Relation to Other Objects
To view the object for which the alert was generated as it relates to other objects, use the topological map
on the Relationships tab.
As a network operations engineer, you view a datastore and the related objects in a map to further your
understanding of the problem. The map view helps determine if implementing the alert recommendations
can resolve the problem.
Prerequisites
Evaluate the alert over time and in comparison to related objects. See Compare Alerts and Events Over
Time in Response to a Datastore Alert.
Procedure
1 In the menu, click Alerts, select the alert name in the data grid, and click View additional metrics >
All Metrics.
2 Click Show Object Relationships.
The Relationships tab displays the datastore in a map with the related objects. By default, the badge
that this alert affects is selected only on the toolbar. Objects in the tree show a colored square to
indicate the current state of the badge.
VMware, Inc. 15
Page 16

vRealize Operations Manager User Guide
3 To view the alert status of the objects for the other badges, click the Health button and then the
Efficiency button.
As you click each badge button, the squares on each object indicate whether an alert is generated
and the criticality of the alert.
4 To view alerts for an object, select the object and click Alerts.
The alert list dialog box appears, enabling you to search and sort for alerts for the object.
5 To view a list of the child objects for an object in the map, click the object.
A list of the number of children by object type appears at the bottom of the center pane.
6 Use the options to evaluate the datastore.
For example, what does the map tell you about the number of virtual machines that are associated
with the datastore? If many virtual machines are associated with a datastore, moving them might free
datastore disk space.
What to do next
n
If your review of the map provided enough information to indicate that one or more of the
recommendations to resolve the alert are valid, implement the recommendations. See Run a
Recommendation on a Datastore to Resolve an Alert.
n
If you need more information about the affected object, continue your investigation. See Construct
Metric Charts to Investigate the Cause of the Data Store Alert.
Construct Metric Charts to Investigate the Cause of the Data Store Alert
To analyze the capacity metrics related to the generated alert, you create charts that compare different
metrics. These comparisons help identify when something changed in your environment and what effect it
had on the datastore.
As a network operations engineer, you create custom charts so that you can further investigate the
problem, and to determine if implementing the alert recommendations will resolve the problem that the
alert identifies.
Prerequisites
View the topological map for the data store to determine if related objects are contributing to the alert or if
triggering symptoms indicate that the data store is contributing to other problems in your environment.
See View the Affected Datastore in Relation to Other Objects.
Procedure
1 In the menu, click Alerts, select the alert name in the data grid, and click View additional metrics >
All Metrics.
The Metric Charts tab does not include charts. You must add the charts to compare.
VMware, Inc. 16
Page 17

vRealize Operations Manager User Guide
2 To analyze the first recommendation, Add more capacity to the Datastore Storage, add related charts
to the workspace.
a Enter capacity in the metric list search text box.
The list displays metrics that contain the search term.
b Double-click the following metrics to add the following charts to the workspace:
n
Capacity | Used Space (GB)
n
Disk Space | Capacity (GB)
n
Summary | Number of Capacity Consumers
c Compare the charts.
For example, if the Capacity | Used Space (%) chart shows an increase in used space, but the
Disk Space | Capacity (GB) did not increase and the Summary | Number of Capacity Consumers
did not decrease, then adding capacity is a solution, but it does not address the root cause.
3 To analyze the second recommendation, vMotion some Virtual Machines to a different
Datastore, add related charts to the workspace.
a Enter vm in the metric list search text box.
b Double-click the Summary | Total Number of VMs metric to add it to the workspace
c Compare the 4 charts.
For example, if the Summary | Total Number of VMs chart shows that the number of virtual
machines did not increase enough to negatively affect the data store, then moving some of the
virtual machines is a solution, but it does not address the root cause.
4 To analyze the third recommendation, Delete unused snapshots of virtual machines, add related
charts to the workspace.
a Enter snapshot in the metric list search text box.
b Double-click the following metrics to add the charts to the workspace:
n
Disk Space | Snapshot Space (GB)
n
Disk Space Reclaimable | Snapshot Space | Waste Value (GB)
c Compare the charts.
For example, if the amount of Disk Space | Snapshot Space (GB) increased and the Disk Space
Reclaimable | Snapshot Space | Waste Value (GB) indicates an area where space can be
reclaimed, then deleting unused snapshots will positively affect the data store disk space problem
and resolve the alert.
VMware, Inc. 17
Page 18

vRealize Operations Manager User Guide
5 If this is a problematic data store that you must continue to monitor, you can create a dashboard.
a Click the Generate Dashboard button on the workspace toolbar.
b Enter a name for the dashboard and click OK.
In this example, use a name like Datastore disk space.
The dashboard is added to your available dashboards.
You compared metric charts to determine if the recommendations are valid and which recommendation to
implement first. In this example, the Delete unused snapshots of Virtual Machines recommendation
appears to be the most likely way to resolve the alert.
What to do next
Implement the alert recommendations. See Run a Recommendation on a Datastore to Resolve an Alert.
Run a Recommendation on a Datastore to Resolve an Alert
As a network operations engineer, you investigated the alert regarding datastore disk space and
determined that the provided recommendations can the problem. The recommendation to delete unused
snapshots is especially useful. Use vRealize Operations Manager to delete the snapshots.
If you have not enabled actions in the vCenter adapter, you can manually delete the snapshots on your
vCenter Server instance.
Prerequisites
n
Compare the metric charts to identify the likely root cause of the alert. See Compare Alerts and
Events Over Time in Response to a Datastore Alert .
Procedure
1 In the menu, click Alerts and select the alert name in the data grid. The alerts detail information
appears on the right.
2 Review the Recommendations.
Recommendations include the Storage vMotion some virtual machines to a different
datastore recommendation and the Delete unused snapshots for virtual machines
recommendation. The delete unused snapshot recommendation includes an action button.
3 Click Delete Unused Snapshots for Datastore.
4 In the Days Old text box, select or enter the number of days old the snapshot must be to be retrieved
for deletions and click OK.
For example, enter 30 to retrieve all snapshots on the datastore that are 30 days old or older.
5 In the Delete Unused Snapshots for Datastore dialog box, review the Snapshot Space, Snapshot
Create Time, and the VM Name. Determine which snapshots to delete and select the check box for
each one to delete.
VMware, Inc. 18
Page 19

vRealize Operations Manager User Guide
6 Click OK.
The dialog box that appears provides a link to Recent Tasks and a link to the task.
7 To verify that the task ran successfully, click Recent Tasks.
The Recent Tasks page appears. The Delete Unused Snapshots action includes two tasks, one to
retrieve the snapshots and one to delete the snapshots.
8 Select the Delete Unused Snapshot task that has the more recent finish time.
This is the delete task. The status should be Completed.
In this example, you ran an action on the datastore in vCenter Server. The other recommendations might
also be valid.
What to do next
n
Verify that the recommendations resolve the alert. Run a few collection cycles after you run the action
and verify that the alert is canceled. Alerts are canceled when the conditions that generated them are
no longer true.
n
Implement the other recommendations. The other recommendations for this alert require you to use
other applications. You cannot implement the recommendations from vRealize Operations Manager.
User Scenario: You See Problems as You Monitor the State of Your Objects
As you investigate your objects in the context of this scenario, vRealize Operations Manager provides
details to help you resolve the problems. You analyze the state of your environment, examine current
problems, investigate solutions, and take action to resolve the problems.
As a virtual infrastructure administrator, you regularly browse through vRealize Operations Manager at
various levels so that you know the general state of the objects in your managed environment. Although
no one has called or complained, and you do not see any new alerts, you are starting to see that your
cluster is running out of capacity.
This scenario refers to objects that are associated with the VMware vSphere Solution, which connects
vRealize Operations Manager to one or more vCenter Server instances. The objects in your environment
include multiple vCenter Server instances, data centers, clusters (cluster compute resources), host
systems, resource pools, and virtual machines.
As you perform the steps in this scenario, and progress through the stages of troubleshooting, you learn
how to use vRealize Operations Manager to help you resolve problems. You will analyze the state of the
objects in your environment, examine current problems, investigate solutions, and take action to resolve
the problems.
This scenario shows you how to evaluate the problems that occur on your objects, and take action to
resolve problems.
n
With the Analysis tab, you view the settings for object resources, click the links provided to further
analyze the problem, and examine the policy settings and thresholds.
VMware, Inc. 19
Page 20

vRealize Operations Manager User Guide
n
Using the Events tab, you examine the symptoms that triggered on the objects, determine when the
problems that triggered those symptoms occurred, identify the events associated with those
problems, and examine the metric values involved.
n
On the Details tab, you investigate the metric activity as a graph, list, or distribution chart, and view
the heat maps to examine the criticality levels of your objects.
n
With the Environment tab, you evaluate the health, risk, and efficiency of various objects as they
relate to your overall object hierarchy. You view the object relationships to determine how an object
that is in a critical state might be affecting other objects.
To support future troubleshooting and ongoing maintenance, you can create a new alert definition, and
create a dashboard and one or more views and reports. To plan for growth and account for newly
approved projects, you can create and commit capacity projects. To enforce the rules used to monitor
your objects, you can create and customize operational policies.
Prerequisites
Verify that you are monitoring one or more vCenter Server instances. See the
vRealize Operations Manager Customization and Administration Guide.
Procedure
1 Analyze the State of Your Environment
The Analysis tabs help you analyze your objects in multiple ways. As a Virtual Infrastructure
Administrator, you use the Analysis tabs to evaluate the details about the state of your objects to
help you resolve problems.
2 Troubleshoot Problems with a Host System
You use the Troubleshooting tabs to identify the root cause of problems that are not resolved by alert
recommendations or simple analysis.
3 Examine the Environment Details
Examine the status of your objects in the views and heatmaps so that you can identify the trends
and spikes that are occurring with the resources on your cluster and objects. To determine whether
any deviations have occurred, you can display overall summaries for an object, such as for the
cluster disk space usage breakdown.
4 Examine the Environment Relationships
You use the Environment Overview and List to examine the status of the badges as they relate to
the objects in your environment hierarchy, and determine which objects are in a critical state for a
particular badge. To view the relationships between your objects to determine whether an ancestor
object that has a critical problem might be causing problems with the descendants of the object, you
use the Environment Map.
VMware, Inc. 20
Page 21

vRealize Operations Manager User Guide
5 Fix the Problem
You use the analysis and troubleshooting features of vRealize Operations Manager to examine
problems that put your objects in a critical state, and identify solutions. To resolve the problems,
where actions exist for the object type, you select an object and an available action that is specific to
the object. Or, you can open the object in the vSphere Web Client and modify the object settings to
resolve the problem.
6 Create a New Alert Definition
Based on the root cause of the problem, and the solutions that you used to fix the problem, you can
create a new alert definition for vRealize Operations Manager to alert you. When the alert is
triggered on your host system, vRealize Operations Manager alerts you and provides
recommendations on how to solve the problem.
7 Create Dashboards and Views
To help you investigate and troubleshoot problems with your cluster and host systems that might
occur in the future, you can create dashboards and views that apply the troubleshooting tools and
solutions that you used to research and solve the problems with your host system, to make those
troubleshooting tools and solutions available for future use.
Analyze the State of Your Environment
The Analysis tabs help you analyze your objects in multiple ways. As a Virtual Infrastructure
Administrator, you use the Analysis tabs to evaluate the details about the state of your objects to help you
resolve problems.
As you browse through the inventory tree, you notice that one of your clusters, named USA-Cluster, is
experiencing capacity problems. You use the Analysis tabs to begin to investigate the cause of the
problem on USA-Cluster, and you start to see problems reported with the capacity on one of your host
systems and other objects.
Prerequisites
Verify that you understand the context of this scenario. See User Scenario: You See Problems as You
Monitor the State of Your Objects.
Procedure
1 In the menu, click Environment, then in the left pane click vSphere Hosts and Clustersand select
the object.
2 Click the Analysis tab.
You see red icons on the Capacity Remaining and Time Remaining tabs.
3 Click the Time Remaining tab.
You see that the memory allocation is severely constrained.
4 View the time remaining breakdown for the cluster.
The icons indicate that zero days remain, with no planned capacity projects considered.
VMware, Inc. 21
Page 22

vRealize Operations Manager User Guide
5 Scroll down until you see the Time Remaining in Related Objects pane.
The parent object is the data center, and the peer represents another cluster. The child objects
include the resource pool and host systems. The data center and one of the host systems are
experiencing critical memory problems.
6 Hover your mouse over the red parent and child icons.
The memory capacity has expired on the data center and one of the host systems.
The memory capacity problem on the cluster is affecting the memory capacity of the related objects.
What to do next
Use the Troubleshooting tab to further troubleshoot the capacity problems on your cluster and host
system. See Troubleshoot Problems with a Host System.
Troubleshoot Problems with a Host System
You use the Troubleshooting tabs to identify the root cause of problems that are not resolved by alert
recommendations or simple analysis.
To further troubleshoot the symptoms of the capacity problems that are occurring on the cluster and host
system, and determine when those problems occurred, you use the Troubleshooting tabs to continue to
investigate the memory problem.
Prerequisites
Use the Analysis tabs to analyze your environment. See Analyze the State of Your Environment.
Procedure
1 In the menu, click Environment, then in the left pane click vSphere Hosts and Clusters and select
the object. For example, USA-Cluster.
2 Click the Alerts tab and review the symptoms.
The Symptoms tab displays the symptoms that triggered on the selected cluster. You notice that
several critical symptoms exist.
n
Cluster Compute Resource Time Remaining with committed projects is critically
low
n
Cluster Compute Resource Time Remaining is critically low
n
Capacity remaining is critically low
VMware, Inc. 22
Page 23

vRealize Operations Manager User Guide
3 Analyze the critical symptoms.
a Hover your mouse over each critical symptom to identify the metric used.
b To view only the symptoms that affect the cluster, enter cluster in the quick filter text box.
When you hover over Cluster Compute Resource Time Remaining is critically low,
the metric Badge|Time Remaining with committed projects (%) appears. You notice that
its value is less than or equal to zero, which caused the capacity symptom to trigger and generate
an alert on USA-Cluster.
4 Click the Events > Timeline tab to review the triggered symptoms, alerts, and events that occurred
on USA-Cluster over time, and identify when the problems occurred.
a Click the calendar and select Last 7 Days as the range.
Several events appear in red.
b Hover your mouse over each event to view the details.
c To display the events that occurred on the cluster's data center, click View From, and select
Datacenter.
Warning events for the data center appear in yellow.
d Hover your mouse over the warning events.
You notice that the density is starting to get low, and that a hard threshold violation occurred on
the data center late in the evening. The hard threshold violation shows that the Badge|Density
metric value was under the acceptable value of 25, and that the violation triggered with a value of
14.89.
e To view the affected child objects, click View From and select Host System.
5 Click the Events tab to examine the changes that occurred on USA-Cluster, and determine whether a
change occurred that contributed to the root cause of the alert or other problems with the cluster.
a Review the graph.
By reviewing the graph, you can determine whether a reoccurring event has caused the errors.
Each event indicates that the guest file system is out of disk space. The affected objects appear
in the pane below the graph.
b Click each red triangle to identify the affected object and highlight it in the pane below.
6 Click the All Metrics tab to evaluate the objects in their context in the environment topology to help
identify the possible cause of a problem.
a In the top view, select USA-Cluster.
b In the metrics pane, expand Badge and double-click Badge|Capacity Remaining (%).
The Badge|Capacity Remaining (%) calculation is added to the lower right pane.
c In the metrics pane, double-click Density.
VMware, Inc. 23
Page 24

vRealize Operations Manager User Guide
d In the metrics pane, double-click Workload.
e On the toolbar, click Date Controls and select Last 7 Days.
The metric chart indicates that the capacity for the cluster remained at a steady level for the past
week, but that the cluster density increased to its maximum value in the last several days. The
Badge|Workload (%) calculation displays the workload extremes that correspond to the density
problem.
You have analyzed the symptoms, timeline, events, and metrics related to the problems on your cluster,
and determined that the heavy workload on the cluster has decreased the cluster density in the last
several days, which indicates that the cluster is starting to run out of capacity.
What to do next
Examine the Details views and heatmaps to interpret the properties, metrics, and alerts to look for trends
and spikes that occur in the resources for your objects, the distributions of resources across your objects,
and data maps to examine the use of various resource types across your objects. See Examine the
Environment Details.
Examine the Environment Details
Examine the status of your objects in the views and heatmaps so that you can identify the trends and
spikes that are occurring with the resources on your cluster and objects. To determine whether any
deviations have occurred, you can display overall summaries for an object, such as for the cluster disk
space usage breakdown.
To examine the problems with your USA-Cluster further, use the Details views to display the metrics and
collected capacity data for your cluster. Each view includes specific metrics data collected from your
objects. For example, trend views use data collected from objects over time to generate trends and
forecasts for resources such as memory, CPU, disk space, and so on.
Use the heatmaps to examine the capacity levels on the cluster, host systems, and virtual machines. The
block sizes and colors are based on the metrics selected in the heatmap configuration. For example, the
heatmap that shows the most abnormal workload for virtual machines is sized by the Badge|Workload
(%) metric, and is colored by the Badge|Anomaly metric.
Prerequisites
Use the Troubleshooting tabs to look for root causes. See Troubleshoot Problems with a Host System
Procedure
1 Click Environment > vSphere Hosts and Clusters > USA-Cluster.
VMware, Inc. 24
Page 25

vRealize Operations Manager User Guide
2 Examine the detailed information about USA-Cluster in the views.
a Click the Details tab and click Views.
The views provide multiple ways to look at different types of collected data by using trends, lists,
distributions, and summaries.
b In the search text box, enter capacity.
The list filters and displays the capacity views for clusters and other objects.
c Click the view named Cluster Capacity Risk Forecast, and examine the number of virtual
machines for USA-Cluster in the lower pane.
Even though the USA-Cluster has two host systems and 30 virtual machines, no capacity exists.
3 Examine the host systems in the cluster, and reclaim capacity from the descendant virtual machines.
a Click the Analysis tab, and click Capacity Remaining.
b In the inventory tree, expand USA-Cluster, and click each of the host systems.
The host system named w2-vcopsqe2-009 is in a critical state, with no capacity remaining.
c In the lower pane, expand Memory, and expand Allocation.
The stress free value is zero, and the amount of memory available is zero, which indicates that
the capacity of the host system has been depleted.
d Click the Details tab, and click Views, and click the Virtual Machine Reclaimable Capacity
view.
e In the lower pane, click the title of the Reclaimable Memory column to sort the list of virtual
machines so that the largest amount of reclaimable capacity is on top.
f To reclaim capacity from several virtual machines, click to the right of the first virtual machine
name, then press Shift and click to the right of the last virtual machine that has capacity to
reclaim.
The virtual machines that have reclaimable capacity are highlighted.
g Click the gear icon, and select Set CPU Count and Memory for VM.
h Click the Current CPU column title to sort the list according to the highest number of CPUs.
Based on the actual use of the virtual machines listed, the New CPU column recommends fewer
CPUs for each virtual machine.
i Click the check box next to each virtual machine that has a recommended lower CPU count, and
click OK.
By reducing the number of CPUs for each virtual machine, you free up capacity on your host
system, and improve the USA-Cluster capacity and workload.
VMware, Inc. 25
Page 26

vRealize Operations Manager User Guide
4 Examine the heatmaps for the host system and virtual machine objects in USA-Cluster.
a In the inventory tree, click USA-Cluster.
b Click Details, click Heatmaps, and click through the list of heatmap views.
c Click Which VMs currently have the highest CPU demand and contention?
The heatmap displays blocks that represent the objects in USA-Cluster. The block for a virtual
machine appears in red, which indicates that it has a critical problem.
d Hover over the red block and examine the details.
The cluster, host system, and virtual machine names appear, with links to more information about
the object.
e Click Show Sparkline to display the activity trend on the virtual machine.
f Click each of the Details links to display more information.
To verify that freeing up memory on the virtual machines has improved the workload of the host system
and the cluster, you can now examine the status of the host system and cluster.
You used views and heatmaps to evaluate the status of your objects and identify trends and spikes, and
free up capacity for your host system and USA-Cluster. To further narrow in on problems, you can
examine the other views and heatmaps. You can also create your own views and heatmaps.
What to do next
Examine the badge status for the objects in your environment hierarchy to determine which objects are in
a critical state, and examine the object relationships to determine whether a problem on one object is
affecting one or more other objects. See Examine the Environment Relationships.
Examine the Environment Relationships
You use the Environment Overview and List to examine the status of the badges as they relate to the
objects in your environment hierarchy, and determine which objects are in a critical state for a particular
badge. To view the relationships between your objects to determine whether an ancestor object that has a
critical problem might be causing problems with the descendants of the object, you use the Environment
Map.
As you click each of the badges in the Environment Overview, you see that several objects are
experiencing critical problems with health, workload, and faults. Others are reporting critical risk status,
and many are in critical time remaining and capacity remaining states.
Several objects are experiencing stress. You notice that you can reclaim capacity from multiple virtual
machines and a host system, but the overall efficiency status for your environment displays no problems.
Prerequisites
Examine the status of your objects in views and heatmaps. See Examine the Environment Details.
VMware, Inc. 26
Page 27

vRealize Operations Manager User Guide
Procedure
1 Click Environment > vSphere Hosts and Clusters > USA-Cluster.
2 Examine the USA-Cluster environment overview to evaluate the badge states of the objects in a
hierarchical view.
a In the inventory tree, click USA-Cluster, and click Environment > Overview.
b On the Badge toolbar, click through the badges and look for red icons to identify critical problems.
Option Evaluation Process
Status icons When the status of my object is critical, what must I do to resolve the problem?
How can I be notified before serious problems occur?
Badges: Health, Workload,
Anomalies, and Faults
Badges: Risk, Time
Remaining, Capacity
Remaining, Stress
Badges: Efficiency,
Reclaimable Capacity,
Density
How might the health and workload of my host systems be affecting my virtual machines?
Are anomalies and faults on my host systems and virtual machines affecting other
objects?
How does the stress level of my cluster and host systems affect the virtual machines
descendants?
To improve efficiency, how can I reclaim capacity from the cluster, host systems, resource
pool, and virtual machines, and apply the reclaimed capacity to other objects in my
environment?
As you click through the badges, you notice that your vCenter Server and other top level objects
appear to be healthy, but you see that a host system and several virtual machines are in a critical
state for health, workload, and faults. Several objects also have critical problems with time
remaining and capacity remaining.
c Hover your mouse over the red icon for the host system to display the IP address.
d Enter the IP address in the search text box, and click the link that appears.
The host system is highlighted in the inventory tree. You can then look for recommendations or
alerts for the host system on the Summary tab.
3 Examine the environment list and view the badge status for your objects to determine which objects
are in a critical state.
a Click Environment > List.
b Examine the badge states for the objects in USA-Cluster.
c Click the Capacity Remaining badge column name to sort the object list and display the objects
that are in a critical state.
Many of the objects that are at risk for capacity remaining also display critical states for time
remaining, risk, and health. You notice that multiple virtual machines and a host system named
w2-vropsqe2-009 are critically affected. Because the host system is experiencing the most critical
problems, and is likely affecting other objects, you must focus on resolving the problems with the
host system.
VMware, Inc. 27
Page 28

vRealize Operations Manager User Guide
d Click the host system named w2-vropsqe2-009, which is in a critical state, to locate it in the
inventory tree.
e Click w2-vropsqe2-009 in the inventory tree, and click the Summary tab to look for
recommendations and alerts so that you can take action.
4 Examine the environment map.
a Click Environment > Map.
b In the inventory tree, click USA-Cluster, and view the map of related objects.
In the relationship map, you can see that the USA-Cluster has an ancestor data center, one
descendant resource pool, and two descendant host systems.
c Click the host system named w2-vropsqe2-009.
The types and numbers of descendant objects for this host system appear in the list below. Use
the descendant object list identify all of the objects related objects to the host system that might
be experiencing problems.
What to do next
Take action in the user interface to resolve the problems. See Fix the Problem.
Fix the Problem
You use the analysis and troubleshooting features of vRealize Operations Manager to examine problems
that put your objects in a critical state, and identify solutions. To resolve the problems, where actions exist
for the object type, you select an object and an available action that is specific to the object. Or, you can
open the object in the vSphere Web Client and modify the object settings to resolve the problem.
You have used the Analysis, Troubleshooting, Details, and Environment areas of the user interface to
examine the critical problems that occur on your objects. To resolve those problems, you can select
actions from the Actions menu, which appears in list and view menus, and various dashboard widgets.
The actions that you can select are specific to an object type, such as a virtual machine. Although you
can select an action when you have selected a host system that is experiencing critical problems related
to capacity and time, all but one of the actions that you can take apply to virtual machines. The action to
delete unused snapshots applies to datastores.
Prerequisites
Examine the environment relationships. See Examine the Environment Relationships.
Procedure
1 In the menu, click Environment, then click vSphere Hosts and Clusters > vSphere World in the
left pane.
2 From the Details view, select the host system and take action.
a In the inventory tree, click the host system named w2-vropsqe2-009.
b Click Details > Views, and enter memory in the search text box.
VMware, Inc. 28
Page 29

vRealize Operations Manager User Guide
c Click the view named Host Rightsizing CPU, Memory, and Disk Space.
The host system named w2-vropsqe2-009 appears in the lower pane. You see that the
provisioned CPUs and memory for the host system are wasting capacity, and realize that you can
free up some capacity in an attempt to resolve the capacity problem on the host system.
Provisioned Recommendation Reclaimable
16 Core CPUs 10 Core CPUs 35 Core CPUs
127 GB memory 35 GB memory 68 GB memory
4,011 GB disk space 11,158 GB disk space 122 GB disk space
d In the lower pane, click to the right of the host system named w2-vropsqe2-009.
e On the toolbar in the lower pane, click the Open in external application icon, and click Open
Host in vSphere Client.
f Log in to the vSphere Web Client, and modify the provisioned CPU and memory for the host
system.
3 (Optional) From the Environment view, select the host system and take action.
a In the inventory tree, click USA-Cluster.
b Click Environment > List.
c Click to the right of the name of the w2-vropsqe2-009 host system.
d In the lower pane, click to the right of the host system named w2-vropsqe2-009.
e On the toolbar in the lower pane, click the Open in external application icon, and click Open
Host in vSphere Client.
f Log in to the vSphere Web Client, and modify the provisioned CPU and memory for the host
system.
4 (Optional) From the inventory tree, select the host system and take action.
a In the inventory tree, click w2-vropsqe2-009.
b At the top of the toolbar in the right pane, click Actions.
c Click Open Host in vSphere Client.
d Log in to the vSphere Web Client, and modify the provisioned CPU and memory for the host
system.
You have used the available actions to resolve problems on a host system that is experiencing critical
problems. The available action appears in Content > Actions.
What to do next
To become aware of critical problems on your objects before they adversely affect the performance of
other objects and your environment, create an alert definition, and optionally add actions to the alert
definition recommendations. See Create a New Alert Definition.
VMware, Inc. 29
Page 30

vRealize Operations Manager User Guide
Create a New Alert Definition
Based on the root cause of the problem, and the solutions that you used to fix the problem, you can
create a new alert definition for vRealize Operations Manager to alert you. When the alert is triggered on
your host system, vRealize Operations Manager alerts you and provides recommendations on how to
solve the problem.
To alert you before your host systems experience critical capacity problems, and have
vRealize Operations Manager notify you of problems in advance, you create alert definitions, and add
symptom definitions to the alert definition.
Procedure
1 In the menu, click Alerts and then in the left pane, select Alert Settings > Alert Definitions.
2 Enter capacity in the search text box.
Review the available list of capacity alert definitions. If a capacity alert definition does not exist for
host systems, you can create one.
3 Click the plus sign to create a new capacity alert definition for your host systems.
a In the alert definition workspace, for the Name and Description, enter
Hosts - Alert on Capacity Exceeded.
b For the Base Object Type, select vCenter Adapter > Host System
c For the Alert Impact, select the following options.
Option Selection
Impact Select Risk.
Criticality Select Immediate.
Alert Type and Subtype Select Application : Capacity.
Wait Cycle Select 1.
Cancel Cycle Select 1.
d For Add Symptom Definitions, select the following options.
Option Selection
Defined On Select Self.
Symptom Definition Type Select Metric / Supermetric.
Quick filter (Name) Enter capacity.
e From the Symptom Definition list, click Host System Capacity Remaining is moderately low
and drag it to the right pane.
In the Symptoms pane, make sure that the Base object exhibits criteria is set to All by default.
VMware, Inc. 30
Page 31

vRealize Operations Manager User Guide
f For Add Recommendations, enter virtual machine in the quick filter text box.
g Click Review the symptoms listed and remove the number of vCPUs from the virtual
machine as recommended by the system, and drag it to the recommendations area in the right
pane.
This recommendation is set to Priority 1.
4 Click Save to save the alert definition.
Your new alert appears in the list of alert definitions.
You have added an alert definition to have vRealize Operations Manager alert you when the capacity of
your host systems begins to run out.
Create Dashboards and Views
To help you investigate and troubleshoot problems with your cluster and host systems that might occur in
the future, you can create dashboards and views that apply the troubleshooting tools and solutions that
you used to research and solve the problems with your host system, to make those troubleshooting tools
and solutions available for future use.
To readily view the status of your cluster and host systems when your CIO asks you about their health,
you can use the decision support dashboards on the vRealize Operations Manager Home page. For
example, you can:
n
Use the vSphere Clusters dashboard to view the utilization index, CPU demand, and memory use for
your clusters. This dashboard also tracks the net use and disk I/O operations.
n
Use vSphere Cluster Configuration Summary dashboard to track the high availability status, and
other configuration items.
n
Use the vSphere Hosts Overview to examine the capacity levels of your cluster, host systems, and
virtual machines.
n
Use the Health of Host Systems dashboard to view the active alert list, capacity metric chart and
heatmap for your host system.
Or, you might need to create your own dashboards to track the status of your clusters and host systems.
If you work in a Network Operations Center environment and have multiple monitors, you can run multiple
instances of vRealize Operations Manager, and dedicate a monitor to each specific dashboard so that
you can visually track the status of your objects.
Prerequisites
Create an alert definition to alert you when the capacity of your host system is getting low. See Create a
New Alert Definition.
Procedure
1 In the menu, click Dashboards and look through the list of existing dashboards to determine whether
you can use the cluster and host system dashboards to track your clusters and host systems.
VMware, Inc. 31
Page 32

vRealize Operations Manager User Guide
2 Click the Health of Host Systems dashboard, and review the widgets included on it.
The inclusion of the Object List, Alert List, Metric Picker, Metric Chart, Heatmap, and Top-N widgets
would allow you to easily peruse the status of the host systems that you select in the Object List
widget. This dashboard has the widget interaction configured so that the object you select in the
Object List widget is the object for which the other widgets display data.
3 Create and configure a new dashboard that has widgets to monitor the health of your host systems
and generate alerts.
a Above the dashboard view, click Actions and select Create Dashboard.
b In the New Dashboard workspace, for the Dashboard Name, enter Health of Host Systems,
and leave the other default settings.
c In the Widget List workspace, add the Object List widget and configure it to display host system
objects.
d Add the Alert List widget to the dashboard, and configure it to display capacity alerts when the
capacity of your host systems becomes an immediate risk.
e In the Widget Interactions workspace, for each widget listed, select the Object List widget as the
provider to drive the data to the other widgets, and click Apply Interactions.
f In the Dashboard Navigation workspace, select the dashboards that receive data from the
selected widgets, and click Apply Navigations.
After vRealize Operations Manager collects data, if a problem occurs with the capacity of your host
systems, the Alert List widget on your new dashboard displays the alerts that are configured for your
host systems.
What to do next
Prepare to share information with others, plan for growth and new projects, and use policies to
continuously monitor all of the objects in your environment. To plan for growth and new projects, see
Chapter 2 Capacity Optimization for Your Managed Environment. To generate reports, and create and
customize policies, see the vRealize Operations Manager Customization and Administration Guide.
Monitoring and Responding to Alerts
Alerts indicate a problem in your environment. Alerts are generated when the collected data for an object
is compared to alert definitions for that object type and the defined symptoms are true. When an alert is
generated, you are presented with the triggering symptoms, so that you can evaluate the object in your
environment, and with recommendations for how to resolve the alert.
Alerts notify you when an object or group of objects are exhibiting symptoms that are unfavorable for your
environment. By monitoring and responding to alerts, you stay aware of problems and can react to them
in a timely fashion.
Generated alerts drive the status of the top level badges, Health, Risk, and Efficiency.
VMware, Inc. 32
Page 33

vRealize Operations Manager User Guide
In addition to responding to alerts, you can generally respond to the status of badges for objects in your
environment.
You cannot assign alerts to vRealize Operations Manager users. Your users must take ownership of an
alert.
Monitoring Alerts in vRealize Operations Manager
You can monitor your environment for generated alerts in several areas in vRealize Operations Manager.
The alerts are generated when the symptoms in the alert definition are triggered, letting you know when
the objects in your environment are not operating within the parameters you defined as acceptable.
Generated alerts appear in many areas of vRealize Operations Manager so that you can monitor and
respond to problems in your environment.
Alerts
Alerts are classified as Health, Risk, or Efficiency. Health alerts indicate problems that require immediate
attention. Risk alerts indicate problems that must be addressed in the near future, before the problems
become immediate health problems. Efficiency alerts indicate areas where you can reclaim wasted space
or improve the performance of objects in your environment.
You can monitor the alerts for your environment in the following locations.
n
Alerts
n
Health
n
Risk
n
Efficiency
You can monitor alerts for a selected object in the following locations.
n
Alert Details, including the Summary, Timeline, and Metric Charts tabs
n
Summary tab
n
Alerts tab
n
Events tab
n
Custom dashboards
n
Alert notifications
Working with Alerts
Alerts indicate a problems that must be resolved so that triggering conditions no longer exist and the alert
is canceled. Suggested resolutions are provided as recommendations so that you can approach the
problem with solutions.
As you monitor alerts, you can take ownership, suspend, or manually cancel alerts.
VMware, Inc. 33
Page 34

vRealize Operations Manager User Guide
When you cancel an alert, the alert and any symptoms of type fault, message event, or metric event are
canceled. You cannot manually cancel other types of symptoms. If the alert was triggered by a fault
symptom, message event symptom or metric event symptom, then the alert is effectively canceled. If the
alert was triggered by a metric symptom or property symptom, a new alert might be created for the same
conditions in the next few minutes.
The correct way to remove an alert is to address the underlying conditions that triggered the symptoms
and generated the alert.
Migrated Alerts
If you migrated alerts from a previous version of vRealize Operations Manager, the alerts are listed in the
overview with a cancelled status, but alert details are not available.
User Scenario: Monitor and Process Alerts in vRealize Operations Manager
Alerts in vRealize Operations Manager notify you when objects in your environment have a problem. This
scenario illustrates one way that you can monitor and process alerts for the objects for which you are
responsible.
An alert is generated when one or more of the alert symptoms are triggered. Depending on how the alert
is configured, the alert is generated when one symptom is triggered or when all of the symptoms are
triggered.
As the alerts are generated, you must process the alerts based on the negative affect they have on
objects in your environment. To do this, you start with Health alerts, and process them based on criticality.
As a virtual infrastructure administrator, you review the alerts at least twice a day. As part of your
evaluation process in this scenario, you encounter the following alerts:
n
Virtual machine has unexpected high CPU workload
n
Host has memory contention that a few virtual machines cause
n
Cluster has many virtual machines that have memory contention because of memory compression,
ballooning, or swapping
Procedure
1 In the menu, click Alerts.
2 Select Time in the Group By filter and the click the down arrow in the Created On column, so the
most recent alerts are listed first .
3 In All Filters, select Criticality > Warning
You have listed all the Warning alerts in order of when they fired, with the most recent alerts
appearing first.
VMware, Inc. 34
Page 35

vRealize Operations Manager User Guide
4 Review the alerts by name, the object on which it was triggered, the object type, and the time at
which the alert was generated.
For example, do you recognize any of the objects as objects that you are responsible for managing?
Do you know that the fix that you will implement in the next hour will fix any of the alerts that are
affecting the Health status of the object? Do you know that some of your alerts cannot be resolved at
this time because of resource constraints?
5 To indicate to other administrators or engineers that you are taking ownership of the Virtual
machine has unexpected high CPU workload alerts, click the selected alerts, click Actions on
the menu bar, and click Take Ownership.
The Assigned to: field in Alert Details updates with your user name. You can only take ownership of
alerts, you cannot assign them to other users.
6 To take ownership and temporarily exclude the alert from affecting the state of the object, select the
Host has memory contention caused by a few virtual machines alert in the list, click
Actions on the menu bar, and click Suspend.
a Enter 60 to suspend the alert of an hour.
b Click OK.
The alert is suspended for 60 minutes and you are listed as the owner in the alert list. If it is not
resolved in an hour, it returns to an active state.
7 Select the row that contains the Cluster has many Virtual Machines that have memory
contention due to memory compression, ballooning or swapping alert, click Actions on
the menu bar, and click Cancel Alert to remove the alert from the list.
This alert is a known problem that you cannot resolve until the new hardware arrives.
The alert is removed from the alert list, but the underlying condition is not resolved by this action. The
symptoms in this alert are based on metrics, so the alert will be generated during the next collection
and analysis cycle. This pattern continues until you resolve the underlying hardware and workload
distribution issues.
You processed the critical health alerts and took ownership of the ones to resolve or troubleshoot further.
What to do next
Respond to an alert. See User Scenario: Respond to a vRealize Operations Manager Alert in the Health
Alert List.
User Scenario: Respond to a vRealize Operations Manager Alert in the Health
Alert List
Generated alerts in vRealize Operations Manager appear in the alert lists. You use the alert lists to
investigate, resolve, and begin troubleshooting problems in your environment.
In this scenario, you investigate and resolve the Virtual machine has unexpected high CPU
workload alert. The alert might be generated for more than one virtual machine.
VMware, Inc. 35
Page 36

vRealize Operations Manager User Guide
Prerequisites
n
Process and take ownership of the alerts you will troubleshoot and resolve. See User Scenario:
Monitor and Process Alerts in vRealize Operations Manager.
n
Review information about how the Power Off Allowed setting works when you run actions. See the
section Working with Actions That Use Power Off Allowed in the vRealize Operations Manager
Information Center.
Procedure
1 In the menu, click Alerts.
2 To limit the list to virtual machine alerts, click All Filters on the toolbar.
a Select Object Type in the drop-down menu.
b Enter virtual machine in the text box.
c Click Enter.
The alerts list displays only alerts based on virtual machines.
3 To locate the alerts by name, enter high CPU workload in the Quick filter (Alert) text box.
4 In the list, click the Virtual machine has unexpected high CPU workload alert name.
5 Review the information. Click Alert Settings > Recommendations in the left pane to show the
recommendations.
Option Evaluation Process
Alert Description Review the description so that you better understand the alert.
Recommendations Do you think that implementing one or more of the recommendations will resolve
the alert?
What is Causing the Issue? Do the triggered symptoms support the recommendations? Do the other triggered
symptoms contradict the recommendation, indicating that you must investigate
further?
In this example, the triggered symptoms indicate that the virtual machine CPU
demand is at a critical level and that the virtual machine anomaly is starting to get
high.
Non-Triggered Symptoms Some alerts are generated only when all the symptoms are triggered. Others are
configured to generate an alert when any one of the symptoms are triggered. If
you have non-triggered symptoms, evaluate them in the context of the triggered
alerts.
Do the non-triggered symptoms support the recommendations? Do the nontriggered symptoms indicate that recommendations are not valid and that you
must investigate further?
VMware, Inc. 36
Page 37

vRealize Operations Manager User Guide
6 To resolve the alert based on the recommendation to check the guest applications to determine
whether high CPU workload is an expected behavior, click the Action menu on the center pane
toolbar and select Open Virtual Machine in vSphere Client.
a Log in to the vCenter Server instance using your vSphere credentials.
b Launch the console for the virtual machine and identify which guest applications are consuming
CPU resources.
7 To resolve the alert based on the recommendation to add more CPU capacity to this virtual machine,
click Set CPU Count for VM.
a Enter a new value in the New CPU text box.
The value that appears is the calculated recommended size. If vRealize Operations Manager was
monitoring the virtual machine for six or more hours, depending on your environment, the value
that appears is the CPU Recommended Size metric.
b Select the following options to allow power off or to create a snapshot, depending on how your
virtual machines are configured.
Option Description
Power Off Allowed Shuts down or powers off the virtual machine before modifying the value. If
VMware Tools is installed and running, the virtual machine is shut down. If
VMware Tools is not installed or not running, the virtual machine is powered
off without regard for the state of the operating system.
In addition to whether the action shuts down or powers off a virtual machine,
you must consider whether the object is powered on and what settings are
applied.
Snapshot Creates a snapshot of the virtual machine before you add CPUs.
If the CPU is changed with CPU Hot Plug enabled, then the snapshot is taken
with the virtual machine running, which consumes more disk space.
c Click OK.
The action adds the recommended number of CPUs to the target virtual machine.
8 Allow several collection cycles to run after implementing the recommended changes and check the
alert list.
What to do next
If the alert does not reappear after several collection cycles, it is resolved. If it reappears, further
troubleshooting is required. For an alternative scenario for troubleshooting alerts, see User Scenario: An
Alert Arrives in Your Inbox.
Monitoring and Responding to Problems
The organization of the tabs and options in vRealize Operations Manager provides a built-in workflow that
you can use when you work with objects in your environment.
VMware, Inc. 37
Page 38

vRealize Operations Manager User Guide
The tabs, Summary, Alerts, Capacity, and so on, provide a progressive level of detail about the selected
object. As you work through the tabs, starting with the high level Summary and Alerts tabs, you see the
general state of an object. The data provided in the Events tabs is useful when you are investigating the
root cause of a problem. The Details tabs are specific data views and the Environment tabs show object
relationships.
As you monitor objects in your environment, you will discover which tabs provide the information that you
need when you are investigating problems.
Evaluating Object Information Using Badge Alerts and the Summary Tab
The Summary tab that is associated with the other object tabs summarizes Heath, Risk, and Efficiency
badge alerts for the selected object and displays the top alerts that lead to the current state.
Use this tab as an overview of alerts for an object, object group, or application - to evaluate the affect that
alerts are having on an object and to begin troubleshooting problems. For more detail on the badge
Alerts, click Badge Alerts, further to the right on the tool bar.
Badge Alert Types
The Health, Risk, and Efficiency badge states are based on the number and criticality of the generated
alerts for the selected object.
n
Health alerts indicate problems that affect the health of your environment and require immediate
attention to ensure that service to your customers is not affected.
n
Risk alerts indicate problems that are not immediate threats but should be addressed in the near
future.
n
Efficiency alerts tell you where you can improve performance or reclaim resources.
Alerts for an Object or an Object Group
When you are working with a single object, the Top alerts are the alerts generated for the object and the
Top Alerts for Children are the alerts generated for any child or other descendant objects in the currently
selected navigation hierarchy. For example, if you are working with a host object in the vSphere Host and
Clusters navigation hierarchy, children can include virtual machines and datastores.
When you are working with object groups, which can include one object type, such as hosts, or multiple
objects types, such as hosts, virtual machines, and datastores, all the group member objects are children
of the group container. The most critical generated alerts for the member objects appear as Top Alerts for
Children.
For an object group, the only Top Alerts that might be generated are the predefined group population
alerts. A group population alert considers the health of all group members and is triggered if the average
health is above the Warning, Immediate, or Critical threshold. If a group population alert is generated,
then the badge score and color is affected by the alert. If a group population alert is not generated, then
the badges are green. This behavior is because an object group is a container for other objects.
VMware, Inc. 38
Page 39

vRealize Operations Manager User Guide
Summary Tab and Related Hierarchies
The alerts that appear on the Summary tab for an object can vary depending on the currently selected
hierarchy in the Related Hierarchies in the left pane.
Depending on the selected hierarchy, you see different alerts and relationships on the Summary tab for
an object. The current focus object name is on the center pane title bar, but the children alerts depend on
the relationships that the highlighted hierarchy defined in the Related Hierarchies list in the upper left
pane. For example, if you are working with a host object relative to virtual machines in the vSphere Hosts
and Clusters hierarchy, then children commonly include virtual machines and datastores. But if you are
working with the same host as a member of an object group, then any alerts on virtual machines that are
also members of the group do not appear because the host and the virtual machines are considered
children of the group and peers among each other. In this example, the focus of the Summary tab is the
host in the context of the group, not the vSphere Hosts and Clusters hierarchy.
Summary Tab Evaluation Techniques
You can evaluate the state of objects, starting with the Summary tab, by using one or more of the
following techniques.
n
Select an object or object group, click on the alerts on the Summary tab, and resolve the problems
that the alert indicates.
n
Select an object, review the alerts on the Summary > Alerts tab, and select other objects, comparing
the volume and types of alerts generated for different objects.
User Scenario: Evaluate the Badge Alerts for Objects for a
vRealize Operations Manager Object Group
In vRealize Operations Manager, you use alerts on a group to review the summary alert information for
hosts and virtual machine descendant objects. Using this method, you can see how the state of one
object type can affect the state of the other.
As a network operations center engineer, you are responsible for monitoring a group of hosts and virtual
machines for the sales department. As part of your daily tasks, you check the state of the objects in the
group to determine if there are any immediate problems or any upcoming problems based on generated
alerts. You start with your group of objects, particularly the host systems in the group, and review the
information in the Summary tab.
In this example, the group includes the following object alerts.
n
Host has memory contention caused by a few virtual machines is a Health alert
n
Virtual Machine has a chronic high memory workload is a Risk alert
n
Virtual Machine is demanding more CPU than the configured limit is a Risk alert
n
Virtual Machine has large disk snapshots is an Efficiency alert
VMware, Inc. 39
Page 40

vRealize Operations Manager User Guide
The following method of evaluating alerts on the Summary tab is provided as an example for using
vRealize Operations Manager and is not definitive. Your troubleshooting skills and your knowledge of the
particulars of your environment determine which methods work for you.
Prerequisites
n
Create a group that includes virtual machines and the hosts on which they run. For example, Sales
Dept VMs and Hosts. For an example of how to create a similar group, see the vRealize Operations
Manager Configuration Guide.
n
Review how the Summary tab works with object groups and related hierarchies. See Evaluating
Object Information Using Badge Alerts and the Summary Tab.
Procedure
1 In the menu, click Environment .
2 Click the Custom Groups tab and click, for example, your Sales Dept VMs and Hosts group.
3 To view the alerts for a host and the associated child virtual machines, in the left pane, click, for
example, Host System and click the host name in the lower left pane.
The Summary tab displays the Health, Risk, and Efficiency badges, the top alerts for the host.
(Because the group is still the focus, the alerts for the child virtual machines do not appear in the Top
Alerts for Descendants widgets at the Badge Alerts tab.)
4 To view the Summary tab for the host so that you can also work with the child virtual machines, click
the right arrow to the right of the host name in the lower left pane.
5 Select the vSphere Hosts and Clusters, located in the upper part of the left pane.
To work with alerts for child virtual machines, the host in the vSphere Hosts and Clusters hierarchy
must be the focus of the Summary tab rather than the host as a member of the object group.
6 To view the alert details for an alert in the list, click the alert name.
When multiple objects are affected, and you click the alert link to view the details, the Health Issues
dialog box appears. If there is only one object affected, the Alerts tab for the object is displayed.
7 On the Alerts tab, begin evaluating the recommendations and triggered symptoms.
In this scenario, a recommendation for this generated alert is to move some virtual machines with a
high memory workload from this host to a host with more available memory.
8 To return to the object Summary tab so that you can review alerts for any child virtual machines, click
the back button located in the left pane.
The host is again the focus of the object Summary tab. Generated alerts for the child virtual
machines appear in the following table.
VMware, Inc. 40
Page 41

vRealize Operations Manager User Guide
9 Click each virtual machine alert and evaluate the information provided on the Alerts tab.
Virtual Machine Alert Evaluation
Virtual Machine has a
chronic high memory
workload
Virtual Machine is
demanding more CPU
than the configured
limit
The recommendation is to add more memory to this virtual machine.
If one or more virtual machines are experiencing high workload, this situation is probably contributing
to the host memory contention alert. These virtual machines are candidates for moving to a host with
more available memory. Moving the virtual machines can resolve the host memory contention alert
and the virtual machine alert.
The recommendations include increasing or removing the CPU limits on this virtual machine.
If one or more virtual machines are demanding more CPU than is configured, and the host is
experiencing memory contention, then you cannot add CPU resources to the virtual machine without
further stressing the host. These virtual machines are candidates for moving to a host with more
available memory. Moving the virtual machines can allow you to increase the CPU count and resolve
the virtual machine alert, and might resolve the host memory contention alert.
10 Take the suggested actions.
Your actions might resolve the virtual machine and host alerts.
What to do next
After a few collection cycles, look again at your Sales VMs and Hosts group to determine if the alerts are
canceled and no longer appear in the object Summary tab. If the alerts are still present, see User
Scenario: Investigate the Root Cause of a Problem by Using the Troubleshooting Tab Options for an
example troubleshooting workflow.
Investigating Object Alerts
The Alerts tab provides a list of generated alerts for the currently selected object. When you are working
with objects, reviewing and responding to generated alerts on the Alert tab helps you manage problems
in your environment.
The alerts notify you when a problem occurs in your environment based on configured alert definitions.
Object alerts are useful to you as an investigative tool in two ways. They can provide you with proactive
notification about problems in your environment before a user calls you to complain, and they provide
information about the object that you can use when troubleshooting general or reported problems.
As you review the Alerts tab, you can add ancestors and descendants to the list to broaden your view of
the alerts. You can see if alerts on the current object affect other objects or how the current object is
affected by the problems indicated by alerts on other objects.
Depending on the best practices and workflows of your infrastructure operations team, you can use the
object Alerts tab to manage generated alerts on individual objects.
n
Take ownership of alerts so that your team knows that you are working to resolve the problem.
n
Suspend an alert so that is temporarily excluded from affecting the Health, Risk, or Efficiency state of
the object while you investigate the problem.
VMware, Inc. 41
Page 42

vRealize Operations Manager User Guide
n
Cancel alerts that you know are a result of a deliberate action, for example, a network card was
removed from a host for replacement, or that are known issues that you cannot resolve at this time
because of resource constraints. Canceling an alert that is generated because of only fault, message
event, or metric event symptoms cancels the alert permanently. Canceling an alert that is generated
because of metric, super metric, or property symptoms can result in the alert being regenerated if the
underlying metric or property condition remains true. It is only effective to cancel alerts generated
because of fault, message event, or metric event symptoms.
Investigating and resolving alerts helps you provide the best possible environment to your customers.
User Scenario: Respond to Alerts on the Alerts Tab for Problem Virtual Machines
You respond to alerts for objects so that you can bring the affected objects back to the required level of
configuration or performance. Based on the information in the alert and using other information provided
in vRealize Operations Manager, you evaluate the alert, identify the most likely solution, and resolve the
problem.
As a virtual infrastructure administrator or operations manager, you troubleshoot problems with objects.
Reviewing and responding to the generated alerts for objects is part of any troubleshooting process. In
this example, you want to resolve workload problems for a virtual machine. As part of that process, you
review the Alerts tab to determine what alerts might indicate or contribute to the identified problem.
The problem virtual machine is db-01-kyoto, which you use as a database server.
The following method of responding to alerts is provided as an example for using
vRealize Operations Manager and is not definitive. Your troubleshooting skills and your knowledge of the
particulars of your environment determine which methods work for you.
Prerequisites
n
Verify that the vCenter Adapter has been configured for the actions in each vCenter Server instance.
n
Verify that you understand how to use the Power Off Allowed option if you are running Set CPU
Count, Set Memory, and Set CPU Count and Memory actions. See the section on Working With
Actions That Use Power Off Allowed in the vRealize Operations Manager Information Center.
Procedure
1 Enter the name of the object, db-01-kyoto, in the Search text box and select the virtual machine in
the list.
The object Summary tab appears. The Top Alerts panes display important active alerts for the object.
2 Click the Analysis tab.
The Workload tab is the first tab. This badge indicates that the workload is highest by CPU, but
memory is also above the configured limit.
VMware, Inc. 42
Page 43

vRealize Operations Manager User Guide
3 Click the Alerts tab.
In this example, the alert list includes the follow alerts that might be related to the problem you are
investigating.
n
Virtual machine has unexpected high CPU workload.
n
Virtual machine has unexpected high memory workload.
4 In the upper left pane, select the vSphere Hosts and Clusters related hierarchy and select ancestor
or descendant alerts to add to the list.
You want to check for possible alerts on ancestor or descendant objects in the context of the selected
hierarchy.
a On the toolbar, click Show Ancestor Alerts and select the Host System and Resource Pool
check boxes.
Any alerts for the host system or resource pool related to this virtual machine are added to the
list.
b Click Show Descendant Alerts and select Datastore.
Any alerts for the datastore are added to the list.
In this example, there are no additional alerts for the host, resource pool, or datastore, so you begin
addressing the virtual machine alerts.
5 Click the Virtual machine has unexpected high CPU workload alert name.
The Alert Details Summary tab appears.
6 Review the recommendations to determine if one or more suggested recommendations can fix the
problem.
This example includes the following common recommendations:
n
Check the guest applications to determine whether high CPU workload is
expected behavior.
n
Add more CPU capacity for this virtual machine.
7 To follow the Check the guest applications to determine whether high CPU workload is
expected behavior recommendation, click Actions on the title bar and select Open Virtual
Machine in vSphere Client.
The vSphere Web Client Summary tab appears so that you can open the virtual machine in the
console and check which applications are are contributing to the reported high CPU workload.
VMware, Inc. 43
Page 44

vRealize Operations Manager User Guide
8 To follow the Add more CPU Capacity for this virtual machine recommendation, click Set
CPU Count for VM .
a Enter a value in the New CPU text box.
The default value that appears before you provide a value is a recommended value based on
analytics.
b To allow the action to power off the virtual machine before running the action if Hot Add for CPU
is not enabled, select the Power Off Allowed check box.
c To create a snapshot before changing the virtual machine CPU configuration, select the
Snapshot check box.
d Click OK.
e Click the Task ID link and verify that the task ran successfully.
The specified number of CPUs are added to the virtual machine.
What to do next
After a few collection cycles, return to the object Alerts tab. If the alert no longer appears, then your
actions resolved the alert. If the problem is not resolved, see User Scenario: Investigate the Root Cause
of a Problem by Using the Troubleshooting Tab Options for an example troubleshooting workflow.
Evaluating Metric Information
The All Metrics tab provides a relationship map and user-defined metric charts. The topological map
helps you evaluate objects in the context of their place in your environment topology. The metric charts
are based on the metrics for the selected object that you think helps identify the possible cause of a
problem in your environment.
VMware, Inc. 44
Page 45

vRealize Operations Manager User Guide
Although you might be investigating problems with a single object, for example, a host system, the
relationship map allows you to see the host in the context of parent and child objects. It also works as a
hierarchical navigation system. If you double-click an object in the map, that object becomes the focus of
the map. The available metrics for the object become active in the lower-left pane.
You can also build your own set of metric charts. You select the objects and metrics that provide you with
a detailed view of changes to different metrics for a single object, or for related objects over time.
Where available, the All Metrics tab provides pre-defined sets of metrics to help you when looking at a
specific aspect of an object. For example, if you have a problem with a host, access the most relevant
information about the host by looking at the metrics displayed in the pre-defined lists. You can edit these
groups of metrics, and create additional groups, by dragging and dropping metrics and properties from
the All Metrics and All Properties lists.
For more information about the metrics, refer to the Definitions for Metrics, Properties, and Alerts Guide.
Where You Find the All Metrics Tab
n
In the menu, click Environment, then select a group, custom data center, application, or inventory
object.
n
Alternatively, click Environment, then use the hierarchies in the left pane to quickly drill down to the
objects that you want.
Create Metric Charts When You Troubleshoot a Virtual Machine Problem
You create a custom group of metric charts when you troubleshoot a problem with a virtual machine so
that you can compare different metrics. The level of detail that you can create using the All Metrics tab,
can contribute significantly to your effort to find the root cause of a problem.
As an administrator investigating a performance problem with a virtual machine, you determined that you
must see detailed charts about the following reported symptoms.
n
Guest file system overall disk space usage reaching critical limit
n
Guest partition disk space usage
The following method of evaluating problems using the All Metrics tab is provided as an example for
using vRealize Operations Manager and is not definitive. Your troubleshooting skills and your knowledge
of the particulars of your environment determine which methods work for you.
Procedure
1 Enter the name of the virtual machine in the Search text box on the menu bar.
In this example, the virtual machine name is sales-10-dk.
2 Click the All Metrics tab.
3 In the relationship topology map, click the virtual machine, dk-new-10.
The metrics list, located in the left of the center pane, displays virtual machine metrics.
VMware, Inc. 45
Page 46

vRealize Operations Manager User Guide
4 On the chart toolbar, click Date Control and select a time that is on or before the symptoms were
triggered.
5 Add metric charts to the display area for the virtual machine.
a In the metric list, select Guest Files System Stats > Total Guest File System Free (GB) and
double-click the metric name.
b To add the guest partition, for example, C:\, select Guest Files System Stats > C:\ > Guest File
System Free (GB) and double-click the metric name.
c To add disk space for comparison, select Disk Space > Capacity Remaining (%) and double-
click the metric name.
6 Compare the charts.
You can see a decrease in the file system free space, and that the virtual machine disk space
capacity remaining is decreasing at a steady rate. You determine that you must add disk space to the
virtual machine. However, you do not know if the datastore can support the change to the virtual
machine.
7 Add the datastore capacity chart to the charts.
a In the topology map, double-click the host.
The topology map refreshes with the host as the focus object.
b Click the datastore.
c In the metric list, which is updated to display datastore metrics, select Capacity > Available
Space (GB) and double-click the metric name.
8 To determine if sufficient capacity is available on the datastore to support increasing the disk space
on the virtual machine, review the datastore capacity chart.
You know that you must increase the size of the virtual disk on the virtual machine.
What to do next
Expand the virtual disk on the virtual machine and assign it to stressed partitions. Click Actions, on the
object title bar, and view the virtual machine in the vSphere Web Client.
Capacity Tab Overview
Use the Capacity tab to assess workload status and resource contention in the selected object. You can
determine time remaining until cpu, memory, or storage resources run out. With robust capacity planning
and optimization, you can manage your production capacity effectively as your organization addresses
changing requirements.
Using Troubleshooting Tools to Resolve Problems
The data provided in the Alerts, Symptoms, Timeline, Events, and All Metrics tabs help you identify
the root cause of a complex problem.
VMware, Inc. 46
Page 47

vRealize Operations Manager User Guide
You can use the troubleshooting tabs individually or as part of a workflow to resolve problems. Each of
the tabs displays the collected data in a different way. Sometimes, as you are troubleshooting problems,
you move directly from an analysis tab to the All Metrics tab. Under other circumstances, the Timeline
tab might provide the information that you need.
Symptoms Tab Overview
You can view a list of triggered symptoms for the selected object. You use the symptoms when you are
troubleshooting problems with an object.
The Symptoms tab displays all the triggered symptoms for the currently selected object. A review of the
triggered symptoms provides you with a list of the problems that the currently selected object is
experiencing. If you need to better understand which symptoms are associated with currently generated
alerts, go to the Alerts tab for the object.
As you evaluate the triggered symptoms, consider the time at which they were created and the
configuration information and trend charts, where applicable.
Timeline Tab Overview
The timeline provides a view of the triggered symptoms, generated alerts, and events for an object over a
period of time. You use the timeline to identify common trends over time that are contributing to the
current status of objects in your environment.
The timeline provides a three-tier scrolling mechanism that you can use to move quickly through large
spans of time, or slowly and minutely through individual hours when you are focusing on a particular
period of time. To ensure that you have the data that you need, configure the Date Controls to encompass
the problem you are investigating.
It is not always effective to investigate a problem on an individual object by looking only at the object. Use
the parent, children, and peer options to examine the object in a broader environmental context. This
context often reveals unexpected influences or consequences for the problem.
The timeline is a tool that provides you a graphical view of patterns. If a symptom is triggered and
canceled by the system at various intervals over time, you can compare the event to other changes to the
object or to the related objects. These changes might be the root cause of the problem.
Events Tab Overview
Events are changes in vRealize Operations Manager metrics that reflect changes that occurred on
managed objects because of user actions, system actions, triggered symptoms, or generated alerts on an
object. You use the Events tab to compare the occurrence of events with the generated alerts to
determine if a change on your managed object contributed to the root cause of the alert or other problems
with the object.
Events can occur on any object, not just the one listed.
The following vCenter Server activities are some of the activities that generate
vRealize Operations Manager events:
n
Powering a virtual machine on or off
VMware, Inc. 47
Page 48

vRealize Operations Manager User Guide
n
Creating a virtual machine
n
Installing VMware Tools on the guest OS of a virtual machine
n
Adding a newly configured ESX/ESXi system to a vCenter Server system
Depending on alert definitions, these events might generate alerts.
If you monitor the same virtual machines with other applications that provide information to
vRealize Operations Manager, and the adapters for those applications are configured to provide change
events, the Events tab includes certain change events that occur on the monitored objects. These
change events might provide further insight into the cause of problems that you are investigating.
Creating and Using Object Details
The views and heat map details provide you with specific data about the object. You use this information
to evaluate problems in more detail. If the current views or heat maps do not provide the information that
you need, you can create one to use as tool as you investigate your specific problem.
Working with Heat Maps
With the vRealize Operations Manager heat map feature, you can locate trouble areas based on the
metric values for objects in your virtual infrastructure. vRealize Operations Manager uses analytics
algorithms that you can use to compare the performance of objects across the virtual infrastructure in real
time using heat maps.
You can use predefined heat maps or create your own custom heat maps to compare the metric values of
objects in your virtual environment. vRealize Operations Manager has predefined heat maps on the
Details tab that you can use to compare commonly used metrics. You can use this data to plan to reduce
waste and increase capacity in the virtual infrastructure.
What a Heat Map Shows
A heat map contains rectangles of different sizes and colors, and each rectangle represents an object in
your virtual environment. The color of the rectangle represents the value of one metric, and the size of the
rectangle represents the value of another metric. For example, one heat map shows the total memory
and percentage of memory use for each virtual machine. Larger rectangles are virtual machines with
more total memory, green indicates low memory use, and red indicates high use.
vRealize Operations Manager updates the heat maps in real time as new values are collected for each
object and metric. The colored bar below the heat map is the legend. The legend identifies the values that
the endpoints represent and the midpoint of the color range.
Heat map objects are grouped by parent. For example, a heat map that shows virtual machine
performance, groups the virtual machines by the ESX hosts on which they run.
Create a Custom Heat Map
You can define an unlimited number of custom heat maps to analyze exactly the metrics that you need.
VMware, Inc. 48
Page 49

vRealize Operations Manager User Guide
Procedure
1 In the menu, click Environment.
2 Select an object to inspect from an inventory tree.
3 Click the Heat Maps tab under the Details tab.
4 Select the tag to use for first-level grouping of the objects from the Group By drop-down menu.
If a selected object does not have a value for this tag, it appears in a group called Other Groups.
5 Select the tag to use to separate the objects into subgroups from the Then By drop-down menu.
If a selected object does not have a value for this tag, it appears in a subgroup called Other Groups.
6 Select a Mode option.
Option Description
Instance Track all instances of a metric for an object with a separate rectangle for each
metric.
General Pick an specific instance of a metric for each object and track only that metric.
7 If you selected General mode, select the attribute to use to set the size of the rectangle for each
resource in the Size By list and the attribute to use to determine the color of the rectangle for each
object in the Color By list.
Objects that have higher values for the Size By attribute have larger areas in the heat map display.
You can also select fixed-size rectangles. The color varies between the colors you set based on the
value of the Color By attribute.
In most cases, the attribute lists include only metrics that vRealize Operations Manager generates. If
you select an object type, the list shows all of the attributes that are defined for that object type.
a To track metrics only for objects of a particular kind, select the object type from the Object Type
drop-down menu.
8 If you selected Instance mode, select an attribute kind from the Attribute Kind list.
The attribute kind determines the color of the rectangle for each object.
9 Configure colors for the heat map.
a Click each of the small blocks under the color bar to set the color for low, middle, and high values.
The bar shows the color range for intermediate values. You can also set the values to match the
high and low end of the color range.
b (Optional) Enter minimum and maximum color values in the Min Value and Max Value text
boxes.
If you leave the text boxes blank, vRealize Operations Manager maps the highest and lowest
values for the Color By metric to the end colors. If you set a minimum or maximum value, any
metric at or beyond that value appears in the end color.
VMware, Inc. 49
Page 50

vRealize Operations Manager User Guide
10 Click Save to save the configuration.
The custom heat map you created appears in the list of heat maps on the Heat Maps tab.
Find the Best or Worst Performing Objects for a Metric
You can use heat maps to find the objects with the highest or lowest values for a particular metric.
Prerequisites
If the combination of metrics that you want to compare is not available in the list of defined heat maps,
you must define a custom heat map first. See Create a Custom Heat Map.
Procedure
1 In the menu, click Environment and select an object from an inventory tree.
2 Click the Heat Maps tab under the Details tab.
All metric heat maps related to the selected resource appear in the list of predefined heat maps.
3 In the list of heat maps, click the map to view.
The name and metrics values for each object shown on the heat map appear in the list below the
heat map.
4 Click the column header for the metric you are interested in to change the sort order, so that the best
or worst performing objects appear at the top of the column.
Compare Available Resources to Balance the Load Across the Infrastructure
A heat map can be used to compare the performance of selected metrics across the virtual infrastructure.
You can use this information to balance the load across ESX hosts and virtual machines.
Prerequisites
If the combination of metrics to compare is not available in the list of defined heat maps, you must define
a custom heat map first. See Create a Custom Heat Map.
Procedure
1 In the menu, click Environment.
2 Select an object to inspect from an inventory tree.
3 Click the Heat Maps tab under the Details tab.
4 In the list of heat maps, click the one to view.
The heat map of the selected metrics appears, sized and grouped according to your selection.
5 Use the heat map to compare objects and click resources and metric values for all objects in your
virtual environment.
The list of names and metric values for all objects shown on the heat map appear in the list below the
heat map. You can click column headers to sort the list by column. If you sort the list by a metric
column, you can see the highest or lowest values for that metric on top.
VMware, Inc. 50
Page 51

vRealize Operations Manager User Guide
6 (Optional) To see more information about an object in the heat map, click the rectangle that
represents this object or click the pop-up window for more details.
What to do next
Based on your findings, you can reorganize the objects in your virtual environment to balance the load
between ESX hosts, clusters or datastores.
Using Heat Maps to Analyze Data for Capacity Risk
Planning for capacity risk involves analyzing data to determine how much capacity is available and
whether you make efficient use of the infrastructure.
Identify Clusters That Have Enough Space for Virtual Machines
Identify the clusters in a datacenter that have enough space for your next set of virtual machines.
Procedure
1 In the left pane of vRealize Operations Manager, click Environment.
2 Select vSphere World.
3 Click the Heat Map tab under the Details tab.
4 Select the Which clusters have the most free capacity and least stress? heat map.
5 In the heat map, point to each cluster area to view the percentage of remaining capacity.
A color other than green indicates a potential problem.
6 Click Details in the pop-up window to examine the resources for the cluster or datacenter.
What to do next
Identify the green clusters with the most capacity to store virtual machines.
Examine Abnormal Host Health
Identifying the source of a performance problem with a host involves examining its workload.
Procedure
1 In the left pane of vRealize Operations Manager, click Environment.
2 Select vSphere World.
3 Click the Heat Map tab under the Details tab.
4 Select the Which hosts currently have the most abnormal workload? heat map.
5 In the heat map, point to the cluster area to view the percentage of remaining capacity.
A color other than green indicates a potential problem.
6 Click Details for the ESX host in the pop-up window to examine the resources for the host.
What to do next
Adjust workloads to balance resources as necessary.
VMware, Inc. 51
Page 52

vRealize Operations Manager User Guide
Identify Datastores with Enough Space for Virtual Machines
Identify the datastores that have the most space for your next set of virtual machines.
Procedure
1 In the left pane of vRealize Operations Manager, click Environment.
2 Select vSphere World.
3 Click the Heat Map tab under the Details tab.
4 Select the Which datastores have the highest disk space overcommitment and the lowest time
remaining? heat map.
5 In the heat map, point to each datacenter area to view the space statistics.
6 If a color other than green indicates a potential problem, click Details in the pop-up window to
investigate the disk space and disk I/O resources.
What to do next
Identify the datastores with the largest amount of available space for virtual machines.
Identify Datastores with Wasted Space
To improve the efficiency of your virtual infrastructure, identify datastores with the highest amount of
wasted space that you can reclaim .
Procedure
1 In the left pane of vRealize Operations Manager, click Environment.
2 Select vSphere World.
3 Click the Heat Map tab under the Details tab.
4 Select the Which datastores have the most wasted space and total space storage? heat map.
5 In the heat map, point to each datacenter area to view the waste statistics.
6 If a color other than green indicates a potential problem, click Details in the pop-up window to
investigate the disk space and disk I/O resources.
What to do next
Identify the red, orange, or yellow datastores with the highest amount of wasted space.
Identify the Virtual Machines with Resource Waste Across Datastores
Identify the virtual machines that waste resources because of idle, oversized, or powered-off virtual
machine states or because of snapshots.
Procedure
1 In the left pane of vRealize Operations Manager, click Environment.
2 Select vSphere World.
VMware, Inc. 52
Page 53

vRealize Operations Manager User Guide
3 Click the Heat Map tab under the Details tab.
4 Select the For each datastore, which VMs have the most wasted disk space? heat map.
5 In the heat map, point to each virtual machine to view the waste statistics.
6 If a color other than green indicates a potential problem, click Details for the virtual machine in the
pop-up window and investigate the disk space and I/O resources.
What to do next
Identify the red, orange, or yellow virtual machines with the highest amount of wasted space.
Examining Relationships in Your Environment
Most objects in an environment are related to other objects in that environment. The Environment tab
shows how objects in your environment are related. You use this display to troubleshoot problems that
might not be about the object that you originally chose to examine. For example, a problem alert on a
host might be because a virtual machine related to the host lacks capacity.
Environment Tab
When you select an object from the inventory of your environment and display the Object Details screen,
you can display an overview of the related objects by clicking the Environment tab. The tab shows all the
objects in your environment that are related to the selected object, with a status badge for each object.
Use the Environment tab to identify related objects in your environment with health, risk, or efficiency
problems.
Example: Use the Environment Tab to Find Problems
Suppose that you are trying to investigate the reason for slow performance in the environment. You can
select key objects such as host systems to see if any related objects such as virtual machines indicate
problems.
Procedure
1 In the menu, click Environment, then click vSphere Hosts and Clusters in the left pane and select
the vSphere World object.
2 Select the Environment tab.
The system displays health badges for all objects in the vSphere World.
3 Click each of the host system badges.
The health badge of the virtual machines that belong to the host are highlighted. A host that displays
a good health badge, may have virtual machines that display a warning status.
What to do next
Now you can investigate the reason for the problem. For example, once it is determined whether the
problem is chronic or temporary, you can decide how to address it. See Using Troubleshooting Tools to
Resolve Problems.
VMware, Inc. 53
Page 54

vRealize Operations Manager User Guide
User Scenario: Investigate the Root Cause of a Problem by Using
the Troubleshooting Tab Options
One of your customers reports poor performance for his virtual machine, including slowness and fails.
This scenario provides one way that you can use vRealize Operations Manager to investigate the
problem based on information available in the Troubleshooting tabs.
As a virtual infrastructure administrator, you respond to a help ticket in which one of your customers
reports problems with his virtual machine, sales-10-dk. The reported conditions are poor application
performance, including slow load times and slow boot, some of his programs are taking longer and longer
to load, and his files are taking longer to save. Today his programs started to fail and an update failed to
install.
When you look at the Alerts tab for the virtual machine you see an alert for chronic high memory
workload leading to memory stress, where the triggered symptoms indicate memory stress and the
recommendation is to add memory.
Based on past experience, you are not convinced that this alert indicates the root cause, so you review
the Analysis tabs. All of the associated badges are green except for Capacity Remaining, which
indicates memory and disk space problems, and Time Remaining, which has 0 days remaining for
memory and disk space.
From this initial review, you know that problems exist in addition to the memory alert, so you use the
Events tabs to do a more thorough investigation.
Review the Triggered Symptoms When You Troubleshoot a Virtual Machine Problem
As a virtual infrastructure administrator, you respond to customer complaints and alerts, and identify
problems that occur on the objects in your environment. You use the information on the Symptoms tab to
help determine whether the triggered symptoms indicate conditions that contribute to the reported or
identified problem.
You must research a problem of poor performance on one of your virtual machines, as reported by one of
your customers. When you view the Alerts tab for the virtual machine, the only alert that appears is
named Virtual Machine is Violating Risk Profile 1 in vSphere Hardening Guide.
When you reviewed the Analysis tabs for the virtual machine, you identified that problems were occurring
with memory and disk space. Now, you focus your attention to the triggered symptoms on the virtual
machine.
The following method of using the Symptoms tab to evaluate problems is provided as an example for
using vRealize Operations Manager, and is not definitive. Your troubleshooting skills and your knowledge
of the particular aspects of your environment determine which methods work for you.
Procedure
1 In the menu, click Dashboards, then click Troubleshoot a VM in the left pane, .
VMware, Inc. 54
Page 55

vRealize Operations Manager User Guide
2 Search for a virtual machine to troubleshoot.
In this example, the virtual machine name is named sales-10-dk.
3 With the virtual machine selected, click the Alerts tab, and click the Symptoms tab.
4 Review and evaluate the triggered symptoms.
Option Evaluation Process
Symptom Are any of the triggered symptoms related to the critical states you see for memory or disk space?
Status Are the symptoms active or inactive? Even inactive symptoms can provide information about the past state of
the object. To add any inactive symptoms, click Status: Active on the toolbar to remove the filter.
Created On When did the symptoms trigger? How does the time of the triggered symptom compare with the other
symptoms?
Information Can you identify a correlation between the triggered symptoms and the state of the Time Remaining and
Capacity Remaining badges?
From your review, you determine that some of the triggered symptoms are associated with compliance
alerts for the virtual machine as defined in the vSphere Hardening Guide. The violated symptoms
triggered for the alert named vSphere Hardening Guide, which is one of several compliance risk profiles
provided with vRealize Operations Manager.
The following symptoms triggered in the compliance alert named Virtual Machine is Violating
Risk Profile 1 in vSphere Hardening Guide:
n
Independent nonpersistent disks are being used
n
Autologon feature is enabled
n
Copy/paste operations are enabled
n
Users and processes without privileges can remove, connect and modify devices
n
Guests can receive host information
Other symptoms also triggered, which are related to memory and time remaining.
n
Guest file system overall disk space usage reaching critical limit
n
Virtual machine disk space time remaining is low
n
Virtual machine CPU time remaining is low
n
Guest partition disk space usage
n
Virtual machine memory time remaining is low
What to do next
Review the symptoms for the object on a timeline. See Compare Symptoms on a Timeline When You
Troubleshoot a Virtual Machine Problem.
You can find the vSphere Hardening Guides at http://www.vmware.com/security/hardening-guides.html.
VMware, Inc. 55
Page 56

vRealize Operations Manager User Guide
Compare Symptoms on a Timeline When You Troubleshoot a Virtual Machine Problem
Looking at the triggered symptoms for an object over time enables you to compare triggered symptoms,
alerts, and events when you are troubleshooting problems with objects in your environment. The
Timeline tab in vRealize Operations Manager provides a visual chart on which to see triggered symptoms
that you can use to investigate problems in your environment.
After you identify the following symptoms as possible indicators of the root cause of the reported
performance problems on the sales-10-dk virtual machine, you compare them to each other over time.
Look for unusual or common patterns.
n
Guest file system overall disk space use reaching critical limit
n
Virtual machine disk space time remaining low
n
Virtual machine CPU time remaining low
n
Guest partition disk space use
n
Virtual machine memory time remaining is low
The following method of evaluating problems using the Timeline tab is provided as an example for using
vRealize Operations Manager and only one method. Your troubleshooting skills and your knowledge of
the specifics of your environment determine which methods work for you.
Prerequisites
Review the triggered object symptoms. See Review the Triggered Symptoms When You Troubleshoot a
Virtual Machine Problem.
Procedure
1 Enter the name of the virtual machine in the Search text box on the main title bar.
In this example, the virtual machine name is sales-10-dk.
2 Click the Events tab and click the Timeline tab.
3 On the Timeline toolbar, click Date Controls and select a time that is on or before the reference
symptoms were triggered.
The default time range is the last 6 hours. For a broader view of the virtual machine over time,
configure a range that includes triggered symptoms and generated alerts.
4 To view the point at which the symptoms were triggered and to identify which line represents which
symptom, drag the timeline week, day, or hour section left and right across the page.
5 Click Event Filters and select all the event types.
Consider whether events correspond to triggered symptoms or generated alerts.
6 In the Related Hierarchies list in the upper left pane, click vSphere Hosts and Clusters.
The available ancestors and descendant objects depend on the selected hierarchy.
VMware, Inc. 56
Page 57

vRealize Operations Manager User Guide
7 To see if the host is experiencing a contributing problems, click View From and select Host System
under Parent.
Consider whether the host has symptoms, alerts, or events that provide you with more information
about memory or disk space problems.
Comparing virtual machine symptoms to host symptoms, and looking at the symptoms over time indicates
the following trends:
n
The host resource use, host disk use, and host CPU use symptoms are triggered for about 10
minutes approximately every 4 hours.
n
The virtual machine guest file system out of space symptom is triggered and canceled over time.
Sometimes the symptom is active for an hour and canceled. Sometimes it is active for two hours. But
no more than 30 minutes occur between cancellation and the next triggering of the symptom.
What to do next
Look at events in the context of the analysis badges and alerts. See Identify Influential Events When You
Troubleshoot a Virtual Machine Problem.
Identify Influential Events When You Troubleshoot a Virtual Machine Problem
Events are changes to objects in your environment that are based on changes to metrics, properties, or
information about the object. Examining the events for the problematic virtual machine in the context of
the analysis badges and alerts might provide visual clues to the root cause of a problem.
As a virtual infrastructure administrator investigating a reported performance problem with a virtual
machine, you compared symptoms on the timeline and identified interesting behavior around the guest
file system that you want to examine in the context of other badge metrics to determine if you can find the
root cause of the problem.
The following method of evaluating problems using the Events tab is provided as an example for using
vRealize Operations Manager and is not definitive. Your troubleshooting skills and your knowledge of the
particulars of your environment determine which methods work for you.
Prerequisites
Examine triggered symptoms, alerts, and events over time. See Compare Symptoms on a Timeline When
You Troubleshoot a Virtual Machine Problem
Procedure
1 Enter the name of the virtual machine in the Search text box, located on the main title bar.
In this example, the virtual machine name is sales-10-dk.
2 Click the Events tab and select the Events button.
3 On the Events toolbar, click Date Controls and select a time that is on or before the symptoms were
triggered.
4 Click Event Filters and select all of the event types.
Consider whether any changes correspond to other events.
VMware, Inc. 57
Page 58

vRealize Operations Manager User Guide
5 Click View From > Parent > > Select All and click through the badges in the timeline to review
events.
Consider whether any of the events, which are listed in the data grid below the chart, correspond to
problems with the host that might contribute to the reported problem.
6 Click View From > Child > > Select All and click through the badges on the toolbar to review the
events.
Consider whether any of the events show problems with the datastore.
Your evaluation shows no particular correlation between the workload or anomalies and the time at which
the guest file system out of space symptom was triggered each time.
Running Actions from vRealize Operations Manager
The actions available in vRealize Operations Manager allow you to modify the state or configuration of
selected objects in vCenter Server from vRealize Operations Manager. For example, you might need to
modify the configuration of an object to address a problematic resource issue or to redistribute resources
to optimize your virtual infrastructure.
The most common use of the actions is to solve problems. You can run them as part of your
troubleshooting procedures or add them as a resolution recommendation for alerts.
When you grant a user access to actions in vRealize Operations Manager, that user can take the granted
action on any object that vRealize Operations Manager manages, and not only on objects that the user
can access outside of vRealize Operations Manager.
When you are troubleshooting problems, you can run the actions from the center pane Actions menu or
from the toolbar on list views that contain the supported objects.
When an alert is triggered, and you determine that the recommended action is the most likely way to
resolve the problem, you can run the action on one or more objects.
Run Actions From Toolbars in vRealize Operations Manager
When you run actions in vRealize Operations Manager, you change the state of vCenter Server objects.
You run one or more actions when you encounter objects where the configuration or state of the object is
affecting your environment. These actions allow you to reclaim wasted space, adjust memory, or
conserve resources.
This procedure for running actions is based on the vRealize Operations Manager Actions menus and is
commonly used when you are troubleshooting problems. The available actions depend on the type of
objects with which you are working. You can also run actions as alert recommendations.
Prerequisites
n
Verify that the vCenter Adapter is configured to run actions for each vCenter Server instance. See the
vRealize Operations Manager Configuration Guide.
VMware, Inc. 58
Page 59

vRealize Operations Manager User Guide
n
Ensure that you understand how to use the Power Off Allowed option if you are running Set CPU
Count, Set Memory, and Set CPU Count and Memory actions. See the section Working With Actions
That Use Power Off Allowed in the vRealize Operations Manager Information Center.
Procedure
1 Select the object in the Environment page inventory trees or select one or more objects it in a list
view.
2 Click Actions on the main toolbar or in an embedded view.
3 Select one of the actions.
If you are working with a virtual machine, only the virtual machine is included in the dialog box. If you
are working with clusters, hosts, or datastores, the dialog box that appears includes all objects.
4 Select the check box to run the action on the object, and click OK.
The action runs and a dialog box appears that displays the task ID.
5 To view the status of the job and verify that the job finished, click Recent Tasks or click OK to close
the dialog box.
The Recent Tasks list appears, which includes the task you just started.
What to do next
To verify that the job completed, click Environment in the menu and click History >Recent Tasks. Find
the task name or task ID in the list and verify that the status is finished. See Monitor Recent Task Status.
Troubleshoot Actions in vRealize Operations Manager
If you are missing data or cannot run actions from vRealize Operations Manager, review the
troubleshooting options.
Verify that your vCenter Adapter is configured to connect to the correct vCenter Server instances, and
configured to run actions. See vRealize Operations Manager Customization and Administration Guide.
n
Actions Do Not Appear on Object
An action might not appear on an object, such as a host or virtual machine, because that object is
being managed by vRealize Automation.
n
Missing Column Data in Actions Dialog Boxes
Data is missing for one or more objects in an Actions dialog box, making it difficult to determine if
you want to run the action.
n
Missing Column Data in the Set Memory for VM Dialog Box
The read-only data columns do not display the current values, which makes it difficult to properly
specify a new memory value.
n
Host Name Does Not Appear in Action Dialog Box
When you run an action on a virtual machine, the host name is blank in the action dialog box.
VMware, Inc. 59
Page 60

vRealize Operations Manager User Guide
Actions Do Not Appear on Object
An action might not appear on an object, such as a host or virtual machine, because that object is being
managed by vRealize Automation.
Problem
Actions such as Rebalance Container might not appear in the drop-down menu when you view the
actions for your data center.
n
If a data center is managed by vRealize Automation, actions do not appear.
n
If a data center is not managed by vRealize Automation, you can take action on the virtual machines
that are not being managed by vRealize Automation.
Cause
When vRealize Automation manages the child objects of a data center or custom data center container,
the actions that are normally available on those objects do not appear, because the action framework
excludes actions on objects that vRealize Automation manages. You cannot turn on or turn off the
exclusion of actions on vRealize Automation managed objects. This behavior is normal.
If you removed the vRealize Automation adapter instance, but did not select the Remove related objects
check box, the actions are still disabled.
To make actions available on the objects in your data center or custom data center, either confirm that
vRealize Automation is not managing the objects, or perform the steps in this procedure to remove the
vRealize Automation adapter instance.
Solution
1 To allow actions on an object, go to your vRealize Automation instance.
2 Make the change in vRealize Automation, such as to move a virtual machine.
Missing Column Data in Actions Dialog Boxes
Data is missing for one or more objects in an Actions dialog box, making it difficult to determine if you
want to run the action.
Problem
When you run an action one or more objects, some of the fields are empty.
Cause
The VMware vSphere adapter has not collected the data from the vCenter Server instance that manages
the object or the current vRealize Operations Manager user does not have privileges to view the collected
data for the object.
Solution
1 Verify that vRealize Operations Manager is configured to collect the data.
VMware, Inc. 60
Page 61

vRealize Operations Manager User Guide
2 Verify that you have the privileges necessary to view the data.
Missing Column Data in the Set Memory for VM Dialog Box
The read-only data columns do not display the current values, which makes it difficult to properly specify a
new memory value.
Problem
Current (MB) and Power State columns do not display the current values, which are collected for the
managed object.
Cause
The adapter responsible for collecting data from the vCenter Server on which the target virtual machine is
running has not run a collection cycle and collected the data. This can occur when you recently created
an VMware adapter instance for the target vCenter Server and initiated an action. The VMware vSphere
adapter has a 5-minute collection cycle.
Solution
1 After you create a VMware adapter instance, wait an additional 5 minutes.
2 Rerun the Set Memory for VM action.
The current memory value and the current power state appear in the dialog box.
Host Name Does Not Appear in Action Dialog Box
When you run an action on a virtual machine, the host name is blank in the action dialog box.
Problem
When you select virtual machine on which to run an action, and click the Action button, the dialog box
appears, but the Host column is empty.
Cause
Although your user role is configured to run action on the virtual machines, you do not have a user roll
that provides you with access to the host. You can see the virtual machines and run actions on them, but
you cannot see the host data for the virtual machines. vRealize Operations Manager cannot retrieve data
that you do not have permission to access.
Solution
You can run the action, but you cannot see the host name in the action dialog boxes.
Monitor Recent Task Status
The Recent Task status includes all the tasks initiated from vRealize Operations Manager. You use the
task status information to verify that your tasks finished successfully or to determine the current state of
tasks.
VMware, Inc. 61
Page 62

vRealize Operations Manager User Guide
You can monitor the status of tasks that are started when you run actions, and investigate whether a task
finished successfully.
Prerequisites
You ran at least one action as part of an alert recommendation or from one of the toolbars. See Run
Actions From Toolbars in vRealize Operations Manager.
Procedure
1 In the menu, click Administration, then select History from the left pane.
2 Click Recent Tasks.
3 To determine if you have tasks that are not finished, click the Status column and sort the results.
Option Description
In Progress
Completed
Failed
Maximum Time Reached
Indicates running tasks.
Indicates finished tasks.
Indicates incomplete tasks on at least one object when started on multiple
objects.
Indicates timed out tasks.
4 To evaluate a task process, select the task in the list and review the information in the Details of
Task Selected pane.
The details appear in the Messages pane. If the information message includes No action taken,
the task finished because the object was already in the requested state.
5 To view the messages for an object when the task included several objects, select the object in the
Associated Objects list.
To clear the object selection so that you can view all the messages, press the space bar.
What to do next
Troubleshoot tasks with a status of Maximum Time Reached or Failed to determine why a task did not
run successfully. See Troubleshoot Failed Tasks.
Troubleshoot Failed Tasks
If tasks fail to run in vRealize Operations Manager, review the Recent Tasks page and troubleshoot the
task to determine why it failed.
This information is a general procedure for using the information in Recent Tasks to troubleshoot
problems identified in the tasks.
n
Determine If a Recent Task Failed
The Recent Tasks provide the status of action tasks initiated from vRealize Operations Manager. If
you do not see the expected results, review the tasks to determine if your task failed.
VMware, Inc. 62
Page 63

vRealize Operations Manager User Guide
n
Troubleshooting Maximum Time Reached Task Status
An action task has a Maximum Time Reached status and you do not know the current status to the
task.
n
Troubleshooting Set CPU or Set Memory Failed Tasks
An action task for Set CPU Count or Set Memory for VM has a Failed status in the recent task list
because power off is not allowed.
n
Troubleshooting Set CPU Count or Set Memory with Powered Off Allowed
A Set CPU Count, Set Memory, or a Set CPU Count and Set Memory action indicates that the action
failed in Recent Tasks.
n
Troubleshooting Set CPU Count and Memory When Values Not Supported
If you run the Set CPU Count or Set Memory actions with an unsupported value on a virtual
machine, the virtual machine might be left in an unusable state and require you to resolve the
problem in vCenter Server.
n
Troubleshooting Set CPU Resources or Set Memory Resources When the Value is Not Supported
If you run the Set CPU Resources action with an unsupported value on a virtual machine, the task
fails and an error appears in the Recent Task messages.
n
Troubleshooting Set CPU Resources or Set Memory Resources When the Value is Too High
If you run the Set CPU Resources or Set Memory Resources action with a value that is greater than
the value that your vCenter Server instance supports, the task fails and an error appears in the
Recent Tasks messages.
n
Troubleshooting Set Memory Resources When the Value is Not Evenly Divisible by 1024
If you run the Set Memory Resources action with a value that cannot convert from kilobytes to
megabytes, the task fails and an error appears in the Recent Task messages.
n
Troubleshooting Failed Shut Down VM Action Status
A shut down VM action task has a Failed status in the Recent Task list.
n
Troubleshooting VMware Tools Not Running for a Shut Down VM Action Status
A Shut down VM action task has a Failed status in the Recent Task list and the Message indicates
that VMware Tools were required.
n
Troubleshooting Failed Delete Unused Snapshots Action Status
A Delete Unused Snapshots action task has a Failed status in the Recent Task list.
Determine If a Recent Task Failed
The Recent Tasks provide the status of action tasks initiated from vRealize Operations Manager. If you do
not see the expected results, review the tasks to determine if your task failed.
Procedure
1 In the menu, click Administration, then click History in the left pane
2 Click Recent Tasks.
VMware, Inc. 63
Page 64

vRealize Operations Manager User Guide
3 Select the failed task in the task list.
4 In the Messages list, locate the occurrences of Script Return Result: Failure and review the
information between this value and <-- Executing:[script name] on {object type}.
Script Return Result is the end of action run and <-- Executing indicates the beginning. The
information provided includes the parameters that are passed, the target object, and unexpected
exceptions that you can use to identify the problem.
Troubleshooting Maximum Time Reached Task Status
An action task has a Maximum Time Reached status and you do not know the current status to the task.
Problem
The Recent Tasks list indicates that a task had a status of Maximum Time Reached.
The task is running past the amount of time that is the default or configured value. To determine the
current status, you must troubleshoot the initiated action.
Cause
The task is running past the amount of time that is the default or configured value for one of the following
reasons:
n
The action is exceptionally long running and did not finish before the threshold timeout was reached.
n
The action adapter did not receive a response from the target system before reaching the timeout.
The action might have completed successfully, but the completion status was not returned to
vRealize Operations Manager.
n
The action did not start correctly.
n
The action adapter might have an error and be unable to report the status.
Solution
Check the state of the target object to determine whether the action completed successfully. If it did not,
continue investigating to find the root cause.
Troubleshooting Set CPU or Set Memory Failed Tasks
An action task for Set CPU Count or Set Memory for VM has a Failed status in the recent task list
because power off is not allowed.
VMware, Inc. 64
Page 65

vRealize Operations Manager User Guide
Problem
The Recent Tasks list indicates that a Set CPU Count, Set Memory, or Set CPU and Memory task has a
status of Failed. When you evaluate the Messages list for the selected task, you see this message.
Unable to perform action. Virtual Machine found
powered on, power off not allowed
When you increase memory or CPU count, you see this message.
Virtual Machine found powered on, power off not allowed, if hot add is
enabled the hotPlugLimit is exceeded
Cause
You submitted the action to increase or decrease the CPU or memory value without selecting the Allow
Power Off option. When you ran the action where a target object is currently powered on and where
Memory Hot Plug is not enabled for the target object in vCenter Server, the action fails.
Solution
1 Either enable Memory Hot Plug on your target virtual machines in vCenter Server or select Allow
Power Off when you run the Set CPU Count, Set Memory, or Set CPU and Memory actions.
2 Check your hot plug limit in vCenter Server.
Troubleshooting Set CPU Count or Set Memory with Powered O Allowed
A Set CPU Count, Set Memory, or a Set CPU Count and Set Memory action indicates that the action
failed in Recent Tasks.
Problem
When you run an action that changes the CPU count, the memory, or both, the action fails even though
you know that the Power Off Allowed was selected, the virtual machine is running, and the VMware Tools
are installed and running.
Cause
The virtual machine should shut down the guest operating system before it powers off the virtual machine
to make the requested changes. The shut down process waits 120 seconds for a response from the
target virtual machine, and fails without making changes to the virtual machine.
Solution
1 Check the target virtual machine in vCenter Server to determine if it has jobs running that are
delaying the implementation of the action.
2 Retry the action from vRealize Operations Manager.
VMware, Inc. 65
Page 66

vRealize Operations Manager User Guide
Troubleshooting Set CPU Count and Memory When Values Not Supported
If you run the Set CPU Count or Set Memory actions with an unsupported value on a virtual machine, the
virtual machine might be left in an unusable state and require you to resolve the problem in
vCenter Server.
Problem
You cannot power on a virtual machine after you successfully run the Set CPU Count or Set Memory
actions. When you review the messages in Recent Tasks for the failed Power On VM action, you see
messages stating that the host does not support the new CPU count or new memory value.
Cause
Because of the way that vCenter Server validates changes in the CPU and memory values, you can use
the vRealize Operations Manager actions to change the value to an unsupported amount if you run the
action when the virtual machine is powered off.
If the object was powered on, the task fails, but rolls back any value changes and powers the machine
back on. If the object was powered off, the task succeeds, the value is changed in vCenter Server, but the
target object is left in a state where you cannot power it on using the actions or in vCenter Server without
manually changing the CPU or memory to a supported value.
Solution
1 In the menu, click Administration, then select History from the left pane.
2 Click Recent Tasks.
3 In the task list, locate your failed Power On VM action, and review the messages associated with the
task.
4 Look for a message that indicates why the task failed.
For example, if you ran a Set CPU Count action on a powered off virtual machine to increase the
CPU count from 2 to 4, but 4 CPUs is not supported by the host. The Set CPU tasks reported that it
completed successfully in recent tasks. However, when you attempt to power on the virtual machine,
the tasks fails. In this example the message is Virtual machine requires 4 CPUs to operate,
but the host hardware only provides 2.
5 Click the object name in the Recent Task list.
The main pane updates to display the object details for the selected object.
6 Click the Actions menu on the toolbar and click Open Virtual Machine in vSphere Client.
The vSphere Web Client opens with the virtual machine as the current object.
7 In the vSphere Web Client, click the Manage tab and click VM Hardware.
8 Click Edit.
VMware, Inc. 66
Page 67

vRealize Operations Manager User Guide
9 In the Edit Settings dialog box, change the CPU count or memory to a supported value and click OK.
You can now power on the virtual machine from the Web client or from vRealize Operations Manager.
Troubleshooting Set CPU Resources or Set Memory Resources When the Value is Not Supported
If you run the Set CPU Resources action with an unsupported value on a virtual machine, the task fails
and an error appears in the Recent Task messages.
Problem
The Recent Tasks list indicates that a Set CPU Resource or Set Memory Resource action has a state of
Failed. When you evaluate the Messages list for the selected task, you see a message similar to the
following examples.
RuntimeFault exception, message:[A specified parameter was not correct. spec.cpuAllocation.reservation]
RuntimeFault exception, message:[A specified parameter was not correct. spec.cpuAllocation.limits]
Cause
You submitted the action to increase or decrease the CPU or memory reservation or limit value with an
unsupported value. For example, if you supplied a negative integer other than -1, which sets the value to
unlimited, vCenter Server could not make the change and the action failed.
Solution
u
Run the action with a supported value.
The supported values for reservation include 0 or a value greater than 0. The supported values for
limit include -1, 0, or a value greater than 0.
Troubleshooting Set CPU Resources or Set Memory Resources When the Value is Too High
If you run the Set CPU Resources or Set Memory Resources action with a value that is greater than the
value that your vCenter Server instance supports, the task fails and an error appears in the Recent Tasks
messages.
Problem
The Recent Tasks list indicates that a Set CPU Resource or Set Memory Resource action has a state of
Failed. When you evaluate the Messages list for the selected task, you see messages similar to the
following examples.
If you are working with Set CPU Resources, the information message is similar to the following example,
where 1000000000 is the supplied reservation value.
Reconfiguring the Virtual Machine Reservation to:[1000000000] Mhz
VMware, Inc. 67
Page 68

vRealize Operations Manager User Guide
The error message for this action is similar to this example.
RuntimeFault exception, message:[A specified parameter was not correct. reservation]
If you are working with Set Memory Resources, the information message is similar to the following
example, where 1000000000 is the supplied reservation value.
Reconfiguring the Virtual Machine Reservation to:[1000000000] (MB)
The error message for this action is similar to this example.
RuntimeFault exception, message:[A specified parameter was not correct.
spec.memoryAllocation.reservation]
Cause
You submitted the action to change the CPU or memory reservation or limit value to a value greater than
the value supported by vCenter Server, or the submitted reservation value is greater than the limit.
Solution
u
Run the action using a lower value.
Troubleshooting Set Memory Resources When the Value is Not Evenly Divisible by 1024
If you run the Set Memory Resources action with a value that cannot convert from kilobytes to
megabytes, the task fails and an error appears in the Recent Task messages.
Problem
The Recent Tasks list indicates that a Set Memory Resource action has a state of Failed. When you
evaluate the Messages list for the selected task, you see a message similar to the following example.
Parameter validation;[newLimitKB] failed conversion to (MB, (KB)[2000] not evenly divisible by 1024
Cause
Because vCenter Server manages memory reservations and limit values in megabytes, but
vRealize Operations Manager calculates and reports on memory in kilobytes, you must provide a value in
kilobytes that is directly convertible to megabytes. To do that, the value must be evenly divisible by 1024.
Solution
u
Run the action where the reservation and limit values are configured with supported values.
The supported values for reservation include 0 or a value greater than 0 that is evenly divisible by
1024. The supported values for a limit include -1, 0, or a value greater than 0 that is evenly divisible
by 1024.
VMware, Inc. 68
Page 69

vRealize Operations Manager User Guide
Troubleshooting Failed Shut Down VM Action Status
A shut down VM action task has a Failed status in the Recent Task list.
Problem
The Shut Down VM action did not run successfully.
The Recent Tasks list indicates that a Shut Down VM action has a task status of Failed. When you
evaluate the Messages list for the selected job, you see Failure: Shut down confirmation timeout.
Cause
The shut down process involves shutting down the guest operating system and powering off the virtual
machine. The wait time is 120 seconds to shut down the guest operating system. If the guest operating
system does not shut down in this time, the action fails because the shut down action is not confirmed.
Solution
u
Check the status of the guest operating system in vCenter Server to determine why is did not shut
down in the allotted time.
Troubleshooting VMware Tools Not Running for a Shut Down VM Action Status
A Shut down VM action task has a Failed status in the Recent Task list and the Message indicates that
VMware Tools were required.
Problem
The Shutdown VM action did not run successfully.
The Recent Tasks list indicates that a Shutdown VM action has a tasks status of Failed. When you
evaluate the Messages list for the selected job, you see VMware Tools: Not running (Not
installed).
Cause
The Shutdown VM action requires that VMware Tools be installed and running on the target virtual
machines. If you ran the action on more than one object, then VMware Tools was not installed, or
installed but not running, on at least one of the virtual machines.
Solution
u
In the vCenter Server instance that manages the virtual machine that failed to run the action, install
and start VMware Tools on the affected virtual machines.
Troubleshooting Failed Delete Unused Snapshots Action Status
A Delete Unused Snapshots action task has a Failed status in the Recent Task list.
VMware, Inc. 69
Page 70

vRealize Operations Manager User Guide
Problem
The Delete Unused Snapshots action did not run successfully.
The Recent Tasks list indicates that a Delete Unused Snapshots action has a tasks status of Failed.
When you evaluate the Messages list for the selected job, you see this message.
Remove snapshot failed, response wait expired after:[120] seconds,
unable to confirm removal
Cause
The delete snapshot process involves waiting for access to datastores. The wait time is 600 seconds to
access the datastore and delete the snapshot. If the delete request is not passed to the datastore in that
time, the action does not finish the delete snapshot action.
Solution
1 Check the status of the snapshot in vCenter Server to determine if it was deleted.
2 If it was not, submit the delete snapshot request at a different time.
Viewing Your Inventory
vRealize Operations Manager collects data from all the objects in your environment and displays a health,
risk, and efficiency status for each object.
Survey your entire inventory to get a quick idea of the state of any object or click an object name for more
detailed information. See Evaluating Object Information Using Badge Alerts and the Summary Tab.
VMware, Inc. 70
Page 71

Capacity Optimization for Your
Managed Environment 2
Capacity Optimization in vRealize Operations Manager is achieved using powerful integrated functions capacity overview, workload balancing and optimization, repurposing of underutilized resources, and
what-if predictive scenarios - to reach optimal system performance.
Capacity planners must assess whether physical capacity is sufficient to meet current or forecasted
demand. With robust capacity planning and optimization, you can manage your production capacity
effectively as your organization addresses changing requirements. The objective of strategic capacity
optimization is to reach an optimal level where production capabilities meet ongoing demand.
vRealize Operations Manager analytics provide precise tracking, measuring and forecasting of data
center capacity, usage, and trends to help manage and optimize resource use, system tuning, and cost
recovery. The system monitors stress thresholds and alerts you before potential issues can affect
performance. Multiple pre-set reports are available. You can plan capacity based on historical usage, and
run what-if scenarios as your requirements expand.
How Capacity Optimization Works
The Capacity Optimization provides four integrated functions - Overview, Reclaim, Workload
Optimization, and What-If Scenarios - that give an overview of the status of all data center activity and
trending. You can conduct on-the-spot analysis, including drilling down into further detail on any object to
identity possible performance problems or anomalies. You can rebalance and optimize compute
resources. The system further identifies underutilized workloads (virtual machines) and calculates the
potential cost savings that can accrue when these resources are reclaimed to be deployed more
effectively. You can interact with and manipulate data and outcomes based on your requirements.
Use the Capacity Optimization and Reclaim features to assess workload status and resource contention
in data centers across your environment. You can determine time remaining until cpu, memory, or storage
resources run out and realize cost savings when underutilized VMs can be reclaimed and deployed
where needed.
Workload Optimization provides for moving virtual workloads and their file systems dynamically across
datastore clusters within a data center or custom data center. You can potentially automate a significant
portion of your data center compute and storage optimization efforts. With properly defined policies
determining the threshold at which resource contention triggers an alert and automatically runs an action,
a data center performs at optimum.
VMware, Inc.
71
Page 72

vRealize Operations Manager User Guide
In addition, the What-If Analysis function- can run scenarios that help determine where additional system
resources can be brought online.
Note You may see a data center or cluster labeled as optimized when it has few or no days remaining
before CPU, memory, or storage is predicted to run out. That is because these are two different measures
of data center and cluster health. A data center can be running at optimum based on policy settings for
balance and consolidation, yet be almost out of resources. It is important to consider both measures
when managing your environment.
This chapter includes the following topics:
n
Example: Reclaiming Resources from Oversized VMs
n
Example: Excluding VMs from Reclaim Action
n
What-If Analysis: Adding a Workload
n
Example: Run a What-If Scenario
n
Example: Import Workload from an Existing VM Scenario
n
Custom Datacenters in VMware vRealize Operations Manager
Example: Reclaiming Resources from Oversized VMs
In this example, an administrator starts the UI, chooses the Assess Capacity function on the Quick Start
page, and identifies a data center with only five days of CPU time remaining. The administrator then runs
the action for reclaiming resources.
The administrator is reviewing system resources at the start of the shift.
Prerequisites
The administrator must have credentials for operating vRealize Operations Manager and managing
vCenter Server objects.
Procedure
1 Clicks Home > Assess Capacity
The Capacity Overview screen appears. In reviewing the status of data centers across the network,
the administrator sees that data center DC-Denver-19 has 5 days of time remaining.
2 The administrator clicks the DC-Denver-19 graphic.
The data in the lower half of the screen refreshes to display time remaining information and reclaim
recommendations for selected data center DC-Denver-19. (NOTE: Double-clicking the DC-Denver-19
graphic displays the Object Details page for that data center.)
3 At the graph, selects Most Constrained from the Sort By: choices and CPU from CPU|Memory|Disk
Space above the graph.
The graph refreshes to show the usage value almost touching 100% and the timeline/projection value
nearly intersecting the usage value. The data center is almost out of CPU.
VMware, Inc. 72
Page 73

vRealize Operations Manager User Guide
4 The administrator scrolls down the page to the Recommendations below the graph.
Option 1 lists total resources (CPU, memory, disk space) that can be reclaimed. Option 2 lists the
hardware to purchase to increase time remaining to 150 days.
5 Clicks RECLAIM RESOURCES.
The Reclaim screen appears, displaying data for DC-Denver-19. The How much can you save? pane
shows that $31,414/month can potentially be saved. Looking to the top of the table, the administrator
sees that the $31,414 sum appears next to Oversized VMs.
6 Clicks Oversized VMs, then clicks the chevron next to a cluster name on the left of the table.
All the VMs in the cluster are listed.
7 Selects the check box next to VM Name in the table heading.
All listed VMs are selected, and the dimmed links above the table turn live.
8 Clicks RESIZE VM(s)
The Resize VMs page appears, showing the 20 VMs available for resizing
9 The administrator leaves the recommendation as is, without editing the target reductions, then selects
the "I understand that workloads may be interrupted..." check box and clicks RESIZE VM(s).
The system runs the resize.
The data center does not run out of CPU, and instead realizes projected cost savings of $31,000+ .
What to do next
Under Optimize Capacity in the left menu, click Overview to display the Capacity Overview screen.
Confirm that DC-Denver-19 has a green checkmark indicating significant time remaining.
Example: Excluding VMs from Reclaim Action
In this example, an administrator starts the UI, chooses the Reclaim function on the Quick Start page, and
identifies a data center with an excessive number of snapshots. The administrator wants to run the action
for reclaiming resources, but chooses to exclude some VMs from the action.
The administrator is reviewing system resources at the start of the shift.
Prerequisites
The administrator must have credentials for operating vRealize Operations Manager and managing
vCenter Server objects.
Procedure
1 Clicks HOME > RECLAIM
The Reclaim screen appears. In reviewing the status of data centers across the network, the
administrator sees that data center DC-Evanston-6 has 3 days of time remaining.
VMware, Inc. 73
Page 74

vRealize Operations Manager User Guide
2 The administrator clicks the DC-Evanston-6 graphic.
The data in the lower half of the screen refreshes to display total reclaimable capacity and cost
savings potential for recommendations for selected data center DC-Denver-19. (NOTE: Doubleclicking the DC-Evanston-6 graphic displays the Object Details page for that data center.)
3 At the table, selects Snapshots from the header row.
The table refreshes to list clusters with excess snapshots.
4 The administrator clicks the chevron next to a cluster name on the left in the table.
All the VMs in the cluster are listed.
5 The administrator wants to keep snapshots for some VMs in the cluster, so selects two VMs and
clicks EXCLUDE VM(s).
A dialog box appears asking for confirmation.
6 Clicks EXCLUDE VM(s) to confirm.
The excluded VMs disappear from view and the potential cost savings drops.
7 Back at the table, with the VMs selected whose snapshots are to be deleted, the administrator clicks
DELETE SNAPSHOT(s).
The Delete Snapshots confirmation dialog box appears, showing how many snapshots are to be
deleted and the monthly savings in cost and disk space.
8 Clicks DELETE SNAPSHOT(s) to confirm.
The system deletes the snapshots.
Excessive snapshots are deleted and cost savings are realized.
What to do next
Under Optimize Capacity in the left menu, click Overview to display the Capacity Overview screen.
Confirm that DC-Evanston-6 now has 15 days of time remaining.
What-If Analysis: Adding a Workload
Using the what-if tool, you can plan for an increase in workload requirements in your virtual infrastructure.
To evaluate the demand and supply for capacity on your system objects, and to assess the potential risk
to your current capacity, you can create scenarios for adding workloads.
Why Create a Scenario
A scenario is a detailed estimation of the capacity you must have available in your environment to
incorporate upcoming changes. You define scenarios that can potentially add resources to actual data
centers. vRealize Operations Manager models the scenario and calculates whether your desired
workload can fit in the targeted data center. You can save multiple scenarios for comparison or later
review.
VMware, Inc. 74
Page 75

vRealize Operations Manager User Guide
Example: Run a What-If Scenario
In this example, an IT administrator at a financial data center must plan for an increase in workloads as
tax season approaches. To evaluate whether additional workloads can be added to existing virtual
infrastructure, the administrator runs a what-if scenario.
Prerequisites
The administrator must have credentials for operating vRealize Operations Manager and managing
vCenter Server objects.
Procedure
1 The administrator clicks Home > Optimize Capacity > What-If Analysis.
The What-If Analysis screen appears.
2 Clicks SELECT in the Add Workload pane.
The Add Workload screen appears.
3 Enters Workload Tax 2018 in the SCENARIO NAME field, then selects DC-Chicago-16
(vc_10.27.83.19) from the list under LOCATION - WHERE WOULD YOU LIKE TO ADD YOUR
WORKLOAD?
The field to the right populates with the words, Any cluster. The administrator selects Cluster Mich2long from the list.
4 The administrator clicks the Configure radio button in the APPLICATION PROFILE field, then clicks
ADVANCED CONFIGURATION.
The Advanced Configuration dialog box appears.
5 For the CPU row, the administrator enters 4 in the Resource Amount column and increments the
counter in the Expected Utilization column to 65%. For the Memory row, enters 18 in the Resource
Amount column and increments the counter in the Expected Utilization column to 65%. For the
Storage row, enters 65 in the Resource Amount column and increments the counter in the
Expected Utilization column to 65%.
The configuration is nearly complete.
6 The administrator selects Thin provisioning and clicks SAVE.
The Add Workload screen appears. The data entered on the previous screen appears in the
APPLICATION PROFILE field.
7 In the DATE area, the administrator selects 3/25/18 and 5/30/18 as the start and end dates,
respectively, then clicks RUN SCENARIO.
The scenario runs and the results appear. To the administrator's surprise, the workload does not fit.
VMware, Inc. 75
Page 76

vRealize Operations Manager User Guide
8 At the top right of the screen, the administrator selects a different cluster: Cluster - Mich3long. Then
clicks the RUN SCENARIO button to the right of the list.
The scenario runs and the results appear. This time the workload fits. It is projected to cost
$84/month to run in the VMware hybrid cloud.
The administrator identifies a location in the virtual infrastructure where the required workload can reside
and support the coming increase in production requirements.
What to do next
Assuming this plan is the best of the scenarios the administrator has run, it can be implemented in time to
support the added workload. The administrator can monitor the workload performance using the
Workload Optimization and Chapter 2 Capacity Optimization for Your Managed Environment features. For
information on Workload Optimization, see the vRealize Operations Manager Configuration Guide.
Example: Import Workload from an Existing VM Scenario
In this example, an IT administrator at a data center must plan for an increase in workloads as more staff
is hired. To evaluate whether additional workloads can be added to existing virtual infrastructure, the
administrator runs a what-if scenario using an actual VM as the workload.
Prerequisites
The administrator must have credentials for operating vRealize Operations Manager and managing
vCenter Server objects.
Procedure
1 The administrator clicks Home > Optimize Capacity > What-If Analysis.
The What-If Analysis screen appears.
2 Clicks SELECT in the Add Workload pane.
The Add Workload screen appears.
3 Enters Workload Staff Hire in the SCENARIO NAME field, then selects DC-Boston-16
(vc_10.27.83.18) from the list under LOCATION - WHERE WOULD YOU LIKE TO ADD YOUR
WORKLOAD?
The field to the right populates with the words, Any cluster. The administrator selects Cluster - 1860
from the list.
4 The administrator clicks the Import from existing VM radio button in the APPLICATION PROFILE
field, then clicks SELECT VMs.
The Select VMs dialog box appears.
5 In the RESULTS column on the left, double-click the name of the VM(s) whose attributes you want
use in this scenario.
VMware, Inc. 76
Page 77

vRealize Operations Manager User Guide
6 Cick OK.
The Add Workload screen appears. The data entered on the previous screen appears in the
APPLICATION PROFILE field.
7 At the Add Workload screen, under APPLICATION PROFILE, in the SELECTED VMS table, enter in
the Quantity column the number of copies you want of each VM you selected.
The scenario is almost ready to run.
8 In the DATE area, the administrator selects 3/25/18 and 6/30/18 as the start and end dates,
respectively, then clicks RUN SCENARIO
The scenario is successful: the workload will fit. By default, vRealize Operations Manager compares
the cost of running the workload on two providers, typically Hybrid Cloud (VMware) and AWS. The
corresponding cost details are updated for your private cloud and public cloud providers. The
planning scenario also provides a public cloud comparison between Hybrid Cloud and VMware Cloud
on AWS. You can see that the monthly cost is displayed for each of the public clouds.
VMware Cloud on AWS Hybrid Cloud
Shows the number of hosts required on VMare Cloud on AWS for the migration to
accommodate the selected workload, considering the minimum purchase of four hosts.
The actual utilized capacity of each host, with balanced workload distribution. Displays the utilization of
Total purchase cost is derived by multiplying the effective monthly purchase cost for each host
by the number of required hosts.
Total Utilized Cost per month is computed based on utilized CPU and RAM, allocated storage,
this indicates how well all three resources are being utilized as a fraction of the purchase cost.
Required CPU and memory are calculated based on utilization.
Required storage is calculated based on allocated storage capacity in your private cloud.
Shows on-demand, one and three-year subscription cost.
Shows the cost for a selected AWS region and its equivalent resources required for the
selected region.
Shows the allocated cost for
a month.
CPU, memory, and storage.
Provides overall requirement
of hosts for the given
capacity.
In the Public Cloud field, the system displays the monthly cost of running the workload on the VMware
Hybrid Cloud versus the AWS Public Cloud.
What to do next
Assuming this plan is the best of the scenarios the administrator has run, it can be implemented in time to
support the added workload. The administrator can monitor the workload performance using the
Workload Optimization and Chapter 2 Capacity Optimization for Your Managed Environment features. For
information on Workload Optimization, see the vRealize Operations Manager Configuration Guide.
VMware, Inc. 77
Page 78
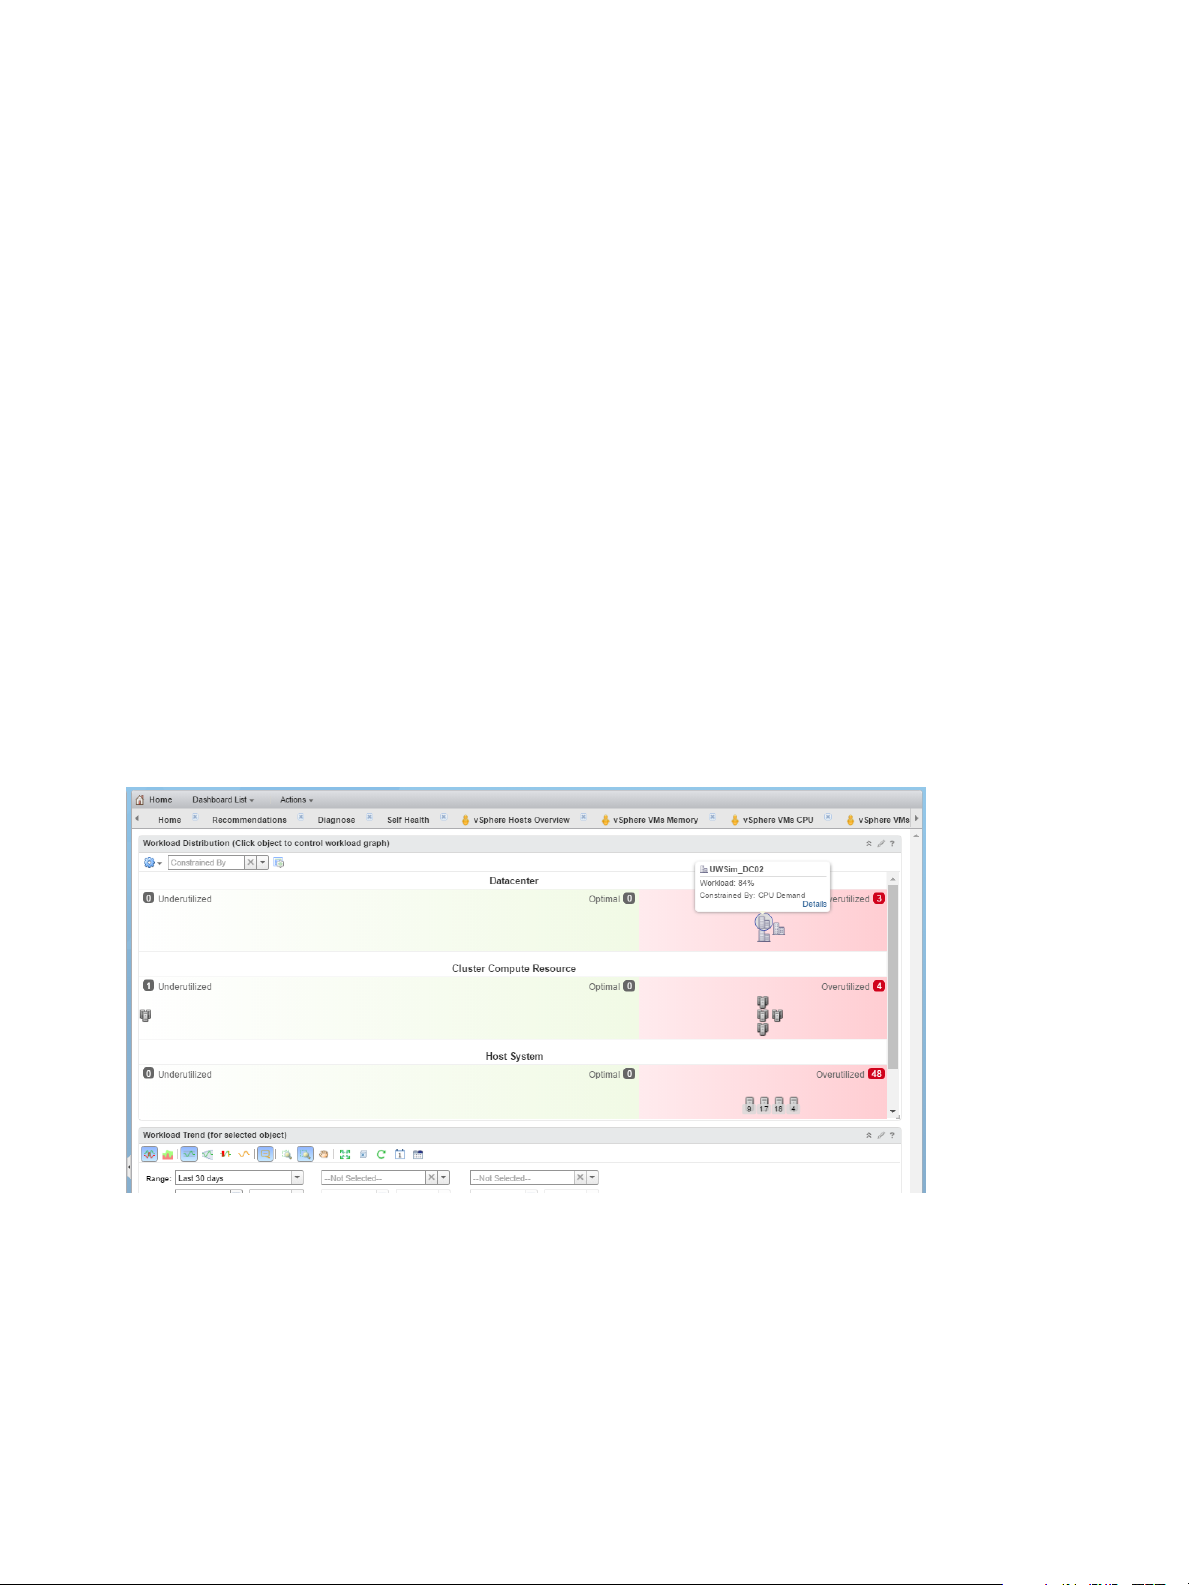
vRealize Operations Manager User Guide
Custom Datacenters in
VMware vRealize Operations Manager
A custom data center is a user-defined container for a group of objects that includes clusters, hosts, and
virtual machines. Custom data centers provide capacity analytics and capacity badge computations
based on the objects it contains. You can use custom data centers to forecast and analyze the capacity
needs for your environment.
When you create a custom data center, you can include multiple cluster objects that span multiple
vCenter Server instances. For example, you might have a production environment that spans multiple
clusters, and you must monitor and manage the performance and capacity of the entire production
environment.
After you create your custom data center, you can select it in the list of custom data centers to display a
summary of its health, risk, and efficiency. To access the list of custom data centers, click Environment
on the top menu.
This view displays the top alerts for the data center. To examine the capacity remaining for the custom
data center, click the Analysis tab, and click Capacity Remaining.
You can use your custom data center objects to balance the workload across the clusters in your
environment. Click Home, click Dashboard List, click the dashboard named Workload Distribution, and
view the use of your custom data center in the dashboard.
Click the icon for your data center to view its workload trend, CPU and memory workload measurements,
and the vSphere configuration limit.
VMware, Inc. 78
 Loading...