

Page 1

VMware vCenter Operations Manager
Getting Started Guide
vSphere User Interface
vCenter Operations Manager 5.7
This document supports the version of each product listed and
supports all subsequent versions until the document is replaced
by a new edition. To check for more recent editions of this
document, see http://www.vmware.com/support/pubs.
EN-000671-00
Page 2

VMware vCenter Operations Manager Getting Started Guide
You can find the most up-to-date technical documentation on the VMware Web site at:
http://www.vmware.com/support/
The VMware Web site also provides the latest product updates.
If you have comments about this documentation, submit your feedback to:
docfeedback@vmware.com
Copyright © 2013 VMware, Inc. All rights reserved. This product is protected by U.S. and international copyright and intellectual
property laws. VMware products are covered by one or more patents listed at http://www.vmware.com/go/patents.
VMware is a registered trademark or trademark of VMware, Inc. in the United States and/or other jurisdictions. All other marks
and names mentioned herein may be trademarks of their respective companies.
VMware, Inc.
3401 Hillview Ave.
Palo Alto, CA 94304
www.vmware.com
2 VMware, Inc.
Page 3

Contents
VMware vCenter Operations Manager Getting Started Guide 5
Introducing Key Features and Concepts 7
1
vCenter Operations Manager Features 7
Main Concepts of vCenter Operations Manager 8
Metric Concepts for vCenter Operations Manager 9
Beginning to Monitor the Virtual Environment 11
2
Object Type Icons in the Inventory Pane 11
Badge Concepts for vCenter Operations Manager 12
Major Badges in vCenter Operations Manager 12
Working with Metrics and Charts on the All Metrics Tab 21
Viewing Members and Relationships in the Monitored Environment 25
3
Check the Performance of Your Virtual Environment 26
Balancing the Resources in Your Virtual Environment 26
Find an ESX Host that Has Resources for More Virtual Machines 27
Find a Cluster that Has Resources Available for More Virtual Machines 28
Ranking the Health, Risk, and Efficiency Scores 28
View the Compliance Details 29
View a List of Members 31
Overview of Relationships 31
VMware, Inc.
Troubleshooting with vCenter Operations Manager 35
4
Troubleshooting Overview 35
Troubleshooting a Help Desk Problem 36
Troubleshooting an Alert 36
Finding Problems in the Virtual Environment 37
Finding the Cause of the Problem 39
Fix the Cause of the Problem 45
Assessing Risk and Efficiency in vCenter Operations Manager 47
5
Analyzing Data for Capacity Risk 47
Optimizing Data for Capacity 52
Forecasting Data for Capacity Risk 56
Working with Faults and Alerts 63
6
Events that Generate Faults 63
Monitoring Alerts in vCenter Operations Manager 64
3
Page 4

VMware vCenter Operations Manager Getting Started Guide
Working with Groups 73
7
Create a Group Type 74
Edit a Group Type 74
Delete a Group Type 75
Create a Group 75
Managing Groups 79
Application Custom Group 82
Set How Data Appears in vCenter Operations Manager 85
8
Create a New Policy 86
Modify an Existing Policy 106
Modify Summary, Views, and Reports Settings 107
Monitor the Performance of vCenter Operations Manager 111
9
Check the Health State of vCenter Operations Manager 111
Monitor Specific Metrics for vCenter Operations Manager 112
Monitor Specific Metrics for a vCenter Operations Manager Component 112
Index 113
4 VMware, Inc.
Page 5

VMware vCenter Operations Manager Getting Started Guide
The VMware vCenter Operations Manager Getting Started Guide provides information about using VMware
vCenter™ Operations Manager to monitor your virtual environment.
Intended Audience
This guide is intended for administrators of VMware vSphere who want to familiarize themselves with
workflow tasks to monitor and manage the performance of the vCenter Operations Manager virtual
environment.
®
VMware, Inc. 5
Page 6

VMware vCenter Operations Manager Getting Started Guide
6 VMware, Inc.
Page 7

Introducing Key Features and
Concepts 1
vCenter Operations Managerprovides monitoring functionality for your virtual environment. Understanding
important features and concepts of vCenter Operations Manager helps you use the product effectively.
This chapter includes the following topics:
n
“vCenter Operations Manager Features,” on page 7
n
“Main Concepts of vCenter Operations Manager,” on page 8
n
“Metric Concepts for vCenter Operations Manager,” on page 9
vCenter Operations Manager Features
vCenter Operations Manager collects performance data from each object at every level of your virtual
environment, from individual virtual machines and disk drives to entire clusters and datacenters. It stores and
analyzes the data, and uses that analysis to provide real-time information about problems, or potential
problems, anywhere in your virtual environment.
vCenter Operations Manager works with existing VMware products to add the following functions:
n
Combines key metrics into single scores for environmental health and efficiency and capacity risk.
n
Calculates the range of normal behavior for every metric and highlights abnormalities. Adjusts the
dynamic thresholds as incoming data allows it to better define the normal values for a metric.
n
Presents graphical representations of current and historical states of your entire virtual environment or
selected parts of it.
n
Displays information about changes in the hierarchy of your virtual environment. For example, when a
virtual machine is moved to a different ESX host, you can see how these changes affect the performance
of the objects involved.
n
Allows you to define "group" containers to organize monitored objects in accordance with the structure
of your environment.
VMware, Inc.
7
Page 8

VMware vCenter Operations Manager Getting Started Guide
Main Concepts of vCenter Operations Manager
vCenter Operations Manager uses certain concepts that can help you understand the product, its interface,
and how to use it.
Attributes and Metrics
vCenter Operations Manager collects several kinds of data for each inventory object. For example, for a virtual
machine, vCenter Operations Manager might receive data about free disk space, CPU load, and available
memory. Each type of data that vCenter Operations Manager collects is called an attribute. An instance of an
attribute for a specific inventory object is called a metric. For example, free memory for a specific virtual
machine is a metric.
For each metric, vCenter Operations Manager collects and stores multiple readings over time. For example,
the vCenter Operations Manager server polls for information about the CPU load for each virtual machine
once every five minutes. Each piece of data that vCenter Operations Manager collects is called a metric value.
Dynamic Thresholds
vCenter Operations Manager defines dynamic thresholds for every metric based on the current and historical
values of the metric. The normal range of values for a metric can differ on different days at different times
because of regular cycles of use and behavior. vCenter Operations Manager tracks these normal value cycles
and sets the dynamic thresholds accordingly. High metric values that are normal at one time might indicate
potential problems at other times. For example, high CPU use on Friday afternoons, when weekly reports are
generated, is normal. The same value on Sunday morning, when nobody is at the office, might indicate a
problem.
vCenter Operations Manager continuously adjusts the dynamic thresholds. The new incoming data allows
vCenter Operations Manager to better define what value is normal for a metric. The dynamic thresholds add
context to metrics that allows vCenter Operations Manager to distinguish between normal and abnormal
behavior.
Dynamic thresholds eliminate the need for the manual effort required to configure hard thresholds for
hundreds or thousands of metrics. More importantly, they are more accurate than hard thresholds. Dynamic
thresholds allow vCenter Operations Manager to detect deviations based on the actual normal behavior of an
object and not on an arbitrary set of limits.
The analytics algorithms take seven days to calculate the initial values for dynamic thresholds. Dynamic
thresholds appear as line segments under the bar graphs for use metrics on the Details page and on the
Scoreboard page. The length and the position of the dynamic threshold line segment depends on the calculated
normal values for the selected use metrics. Dynamic thresholds also appear as shaded gray areas of the use
metrics graphs on the All Metrics page.
Hard Thresholds
Unlike dynamic thresholds, hard thresholds are fixed values that you enter to define what is normal behaviour
for an object. These arbitrary values do not change over time unless you change them manually. You cannot
fix hard thresholds with vCenter Operations Manager.
Key Performance Indicators
vCenter Operations Manager defines attributes that are critical to the performance of an object as key
performance indicators (KPI). KPI are weighted more heavily in the calculations that determine the health of
an object. Graphs of KPI performance appear before other metrics in several areas of the product.
8 VMware, Inc.
Page 9

Chapter 1 Introducing Key Features and Concepts
Alerts and Faults
vCenter Operations Manager generates alerts when events occur on the monitored objects, when data analysis
indicates deviations from normal metric values, or when a problem occurs with one of the
vCenter Operations Manager components.
Events that the vCenter Serverpublishes are the main source for faults. These events might originate in the
vCenter Server itself, or ESX servers might generate them and the vCenter Server publishes them externally.
Only a subset of vCenter events are considered as important for fault generation.
Metric Concepts for vCenter Operations Manager
Preparing to monitor your environment with vCenter Operations Manager involves some familiarity with
metrics that help you to identify a problem.
vCenter Server presents a use-based model of metrics. vCenter Operations Manager presents a demand-based
model of metrics. Some knowledge of the metrics that affect the data and graphs is useful to determine what
to do next in a workflow.
Table 1-1. Major Metric Concepts
Metric Description
Provisioned Amount of a resource that the user configures.
The provisioned metric might apply to the amount of
physical memory for a host or the number of vCPUs for a
virtual machine.
Usable Actual amount of a resource that the object can use.
The usable amount is less than or equal to the provisioned
amount. The difference between the provisioned amount
and usable amount stems from virtualization overhead. This
overhead might include the memory that an ESX host uses
to run the host, to support reservations for virtual machines,
and to add a buffer for high availability.
The usable metric does not apply to virtual machines.
Usage Amount of a resource that an object consumes.
The usage amount is less than or equal to the usable amount.
Demand Amount of a physical resource that the object might consume
without any existing constraints.
An object becomes constrained because of underprovisioning or contention with other consumers of the
resource. A virtual machine might require 10GB of memory
but can only get 5GB because the virtual machine must share
resources with other virtual machines on the host.
When the demand amount is less than the usage amount, the
environment might have wasted resources. When the
demand amount is greater than the usage amount, the
environment might incur latency and exhibit decreased
performance.
Contention Difference between the amount of the resource that the object
requires and the amount of the resource that the object gets.
This metric measures the effect of conflict for a resource
between consumers. Contention measures latency or the
amount of time it takes to gain access to a resource. This
measurement accounts for dropped packets for networking.
VMware, Inc. 9
Page 10

VMware vCenter Operations Manager Getting Started Guide
Table 1-1. Major Metric Concepts (Continued)
Metric Description
Limit Maximum amount that an object can obtain from a resource.
Reservation Guaranteed amount of resources for an object.
Entitlement Amount of a resource that a virtual machine can use based
The limit sets the upper bound for CPU, memory, or disk I/O
resources that you allocate and configure in vCenter Server.
The usage amount is less than or equal to the limit amount.
The demand amount can be greater than the limit amount.
The limit amount is less than or equal to the provisioned
amount.
The default limit amount is unlimited.
Rules: Usage <= Limit
Demand can be greater than Limit .
The object does not start without this reserved amount. The
default amount is 0.
on the relative priority of that consumer set by the
virtualization configuration.
This metric is a function of provisioned, limit, reservation,
shares, and demand. Shares involve proportional weighting
that indicates the importance of a virtual machine.
The entitlement amount is less than or equal to the limit
amount.
The entitlement metric applies only to virtual machines.
Rules: Entitlement <= Limit <= Provisioned
Entitlement >= Reservations
10 VMware, Inc.
Page 11
Beginning to Monitor the Virtual
Environment 2
To use vCenter Operations Manager to monitor your virtual environment, you must understand the icons,
badges, and key metric concepts used in the product.
This chapter includes the following topics:
n
“Object Type Icons in the Inventory Pane,” on page 11
n
“Badge Concepts for vCenter Operations Manager,” on page 12
n
“Major Badges in vCenter Operations Manager,” on page 12
n
“Working with Metrics and Charts on the All Metrics Tab,” on page 21
Object Type Icons in the Inventory Pane
All objects that vCenter Operations Manager monitors are listed in the inventory pane.
vCenter Operations Manager uses specific icons so that you can distinguish between virtual machines, ESX
hosts, and other objects in the inventory.
Table 2-1. Object Type Icons
Icon Description
World
The World object is a logical container for all monitored
objects in vCenter Operations Manager.
vCenter Server system
Datacenter
Cluster
ESX host that is in powered-off state
ESX host that is in powered-on state
Datastore
Virtual machine that is in powered-off state
VMware, Inc. 11
Page 12

VMware vCenter Operations Manager Getting Started Guide
Table 2-1. Object Type Icons (Continued)
Icon Description
Virtual machine that is in powered-on state
Custom group created by vCenter Operations Manager or by
administrators
By default, objects in the inventory pane are grouped by hosts and clusters. You can select Datastores from
the drop-down menu at the top of the inventory pane to switch the way objects are grouped.
Badge Concepts for vCenter Operations Manager
vCenter Operations Manager uses badges to illustrate derived metrics to provide an overview of the state of
the virtual environment or an individual object. These badges serve as focus points to narrow the scope of a
potential problem and provide details about the cause of the problem.
vCenter Operations Manager provides major and minor badges that are color coded and range from a healthy
green to a potentially problematic yellow, orange, or red. Badges are organized in a simple hierarchy in which
the scores of minor badges contribute to the scores of major badges.
Scores might reflect a healthy state or a potential problem depending on the type of badge. For example, low
scores for health, time remaining, and capacity remaining might indicate potential problems, while low scores
for faults, stress, or anomalies indicate a normal state.
You can use the Dashboard tab for an overview of the performance and condition of your virtual infrastructure.
The information you see on the Dashboard tab depends on the object you select in the navigation tree. See
“Object Type Icons in the Inventory Pane,” on page 11.
You can expand the panes on the Dashboard to view information about a specific badge. You can also doubleclick badges to view details about the metrics that affect badge scores.
Major Badges in vCenter Operations Manager
vCenter Operations Manager generates major badges that start a workflow and help you to identify health,
capacity risk, and efficiency issues.
Each major badge contains minor badges. vCenter Operations Manager calculates major badges based on the
state of the minor badges.
Using Health to Measure the Overall State of the Environment
The vCenter Operations Manager Health badge serves as the first high-level indicator of the state of the virtual
environment.
The Health badge indicates immediate problems that might require your attention. It helps you identify the
current health of your system. vCenter Operations Manager combines workload, anomalies, and faults to
assess the overall health and to determine whether the workload level is expected in that environment. A low
health score might indicate a potential problem.
vCenter Operations Manager calculates the Health score by using the scores of the sub-badges that the Health
badge contains. Faults are given precedence in the Health score because they describe existing problems, while
Workload and Anomalies are combined to identify performance problems. This approach ensures that the
score of the Health badge reflects the actual state of the object, without exaggerating or underestimating
problems.
The Health score ranges between 0 (bad) and 100 (good). The badge changes its color based on the badge score
thresholds that are set by the vCenter Operations Manager administrator.
12 VMware, Inc.
Page 13
Chapter 2 Beginning to Monitor the Virtual Environment
Table 2-2. Object Health States
Badge Icon Description User Action
The health of the object is
normal.
The object is experiencing some
level of problems.
The object might have serious
problems.
The object is either not
functioning properly or will stop
functioning soon.
No data is available.
The object is offline.
No attention required.
Check the Details tab and take
appropriate action.
Check the Details tab and take
appropriate action as soon as
possible.
Check the Details tab to identify
the most probable cause of the
problem and act immediately.
A vCenter Operations Manager administrator can change the badge score thresholds. For example, a green
Health badge can indicate a score above 80 instead of 75, as set by default.
The Health Weather Map
The Health Weather Map displays the health status of all the objects related to the object that you have selected
in the inventory pane.
The Health Weather Map is available for all objects in the inventory except virtual machines. For virtual
machines, vCenter Operations Manager displays a Health Trend graph.
Each square in the Weather Map represents a related object, directly or indirectly connected to the selected
object. For example, if you selected an ESX host in the inventory pane, the number of squares in the Health
Weather Map equals the sum of all virtual machines and datastores under this ESX host plus the Datacenter,
vCenter Server, and the World object that are above the ESX host in the inventory pane. The squares in the
Health Weather Map are not sized, so there is no visible correspondence between object types in the inventory
and the squares in the map. You can use the Health Weather Map for a quick overview of the current condition
and how it has changed during the past 6 hours. If you notice a red or yellow square, you can click it to navigate
to the Details tab of the object that corresponds to this square, and view more information about its health.
By default, the Health Weather Map displays the current badge values. You can click the time line in the bottom
of the map to switch to earlier periods.
NOTE Selecting an earlier time period that is one or more hours away from the current moment displays the
condition of the monitored system as it was on the hour. For example, if the current time is 3:15 p.m. and you
click -1, vCenter Operations Manager displays the Health Weather Map for 3:00 p.m. If you click -2,
vCenter Operations Manager displays the Health Weather Map for 2:00 p.m.
Using the Workload Badge Under the Health Badge
The vCenter Operations Manager Workload badge measures how hard an object must work for resources. A
workload score of 0 indicates that a resource is not being used and a score that approaches or exceeds 100 might
cause performance problems.
Workload is an absolute measurement that calculates the demand for a resource divided by the capacity of an
object. Resources might include CPU, memory, disk I/O, or network I/O.
The Workload score ranges from 0 (good) to over 100 (bad). The badge changes its color based on the badge
score thresholds that are set by the vCenter Operations Manager administrator.
VMware, Inc. 13
Page 14
VMware vCenter Operations Manager Getting Started Guide
Table 2-3. Object Workload States
Badge Icon Description User Action
Workload on the object is not
excessive.
The object is experiencing some
high resource workloads.
Workload on the object is
approaching its capacity in at
least one area.
Workload on the object is at or
over its capacity in one or more
areas.
No data is available.
No attention required.
1 At the upper right of the
Health tab, click the View
details icon to open the
VMware vCenter Operations
Manager user interface.
2 Check the Details tab to
identify which resources
experience abnormal
workload.
1 At the upper right of the
Health tab, click the View
details icon to open the
VMware vCenter Operations
Manager user interface.
2 Check the Details tab to
identify which resources are
limited, and take appropriate
action as soon as possible.
1 At the upper right of the
Health tab, click the View
details icon to open the
VMware vCenter Operations
Manager user interface.
2 Check the Details tab to
identify which resources are
exhausted. Act immediately
to avoid or correct problems.
The object is offline.
A vCenter Operations Manager administrator can change the badge score thresholds. For example, a green
Workload badge can indicate a score below 80 instead of 85, as set by default.
Using the Anomalies Badge Under the Health Badge
The vCenter Operations Manager Anomalies badge measures the extent of abnormal behavior for an object
based on historical metrics data. A high number of anomalies might indicate a potential issue.
A low Anomalies score indicates that an object is behaving in accordance with its established historical
parameters. Most or all of the object metrics, especially its KPIs, are within their thresholds. Because changes
in behavior often indicate developing problems, if the metrics of an object go outside the calculated thresholds,
the anomalies score for the object grows. As more metrics breach the thresholds, anomalies continue to increase.
Violations by KPI metrics increase the Anomalies score more than violations by non-KPI metrics. A high
number of anomalies usually indicates a problem or at least a situation that requires your attention.
Anomalies involves the number of statistics that fall outside of the expected behavior trends while Workload
involves an absolute measurement of how hard an object works for resources. Both Anomalies and Workload
are useful when attempting to find a probable cause and troubleshooting performance problems.
14 VMware, Inc.
Page 15
Chapter 2 Beginning to Monitor the Virtual Environment
The Anomalies score ranges between 0 (good) and 100 (bad). The badge changes its color based on the badge
score thresholds that are set by the vCenter Operations Manager administrator.
Table 2-4. Object Anomalies States
Badge Icon Description User Action
The Anomalies score is normal. No attention required.
The Anomalies score exceeds the
normal range.
The Anomalies score is very
high.
Most of the metrics are beyond
their thresholds. This object
might not be working properly
or might stop working soon.
No data is available.
The object is offline.
Check the Details tab to identify
what causes the abnormal
number of anomalies, and take
appropriate action.
Check the Details tab to identify
the cause of the abnormal
behaviour, and take appropriate
action as soon as possible.
Check the Details tab, and act
immediately to avoid or correct
problems.
A vCenter Operations Manager administrator can change the badge score thresholds. For example, a green
Anomalies badge can indicate a score below 60 instead of 50, as set be default.
Using the Faults Badge Under the Health Badge
The Faults badge measures the degree of problems that the object might experience based on events retrieved
from the vCenter Server.
The events that might generate faults include the loss of redundancy in NICs or HBAs, memory checksum
errors, high availability failover, or Common Information Model (CIM) events, which require your immediate
attention.
NOTE vCenter Operations Manager calculates the Faults score for the World object by using the Faults scores
of the vCenter Server systems, the ESX hosts and clusters, and the datastores that belong to the World inventory.
Therefore, if you have one vCenter Server with a Faults score of 100 and another vCenter Server with a Faults
score of 0, this might not necessarily result in a Faults score of 50 for the World object. The final Faults score
for the World object also depends on the number of datastores, ESX hosts and clusters in the environment, and
the Fault scores of these objects.
Fault scores of virtual machines are not taken into account when calculating the Faults score for the World
object.
While the Faults score ranges between 0 to 100, the badge changes color based on the badge score thresholds
that are set by the vCenter Operations Manager administrator. For example, a green Faults badge can indicate
a score below 40 instead of a score below 25 (the system default).
VMware, Inc. 15
Page 16
VMware vCenter Operations Manager Getting Started Guide
Table 2-5. Object Faults States
Badge Icon Description User Action
No faults are registered on the
selected object.
Faults of low importance are
registered on the selected object.
Faults of high importance are
registered on the selected object.
Faults of critical importance are
registered on the selected object.
No data is available.
The object is offline.
No attention required.
Check the Details tab to find more
information and take appropriate
action.
Check the Details tab to find more
information about the reported
faults, and take appropriate
action as soon as possible.
Check the Details tab to find more
information about the reported
faults, and act immediately to
avoid or correct problems.
While the Faults score ranges between 0 to 100, the badge changes color based on the badge score thresholds
that are set by the vCenter Operations Manager administrator. For example, a green Faults badge can indicate
a score below 40 instead of a score below 25 (the system default).
Defining Risk to Assess Future Problems in vCenter Operations Manager
The vCenter Operations Manager Risk badge indicates a potential performance problem in the near future that
might affect the virtual environment.
Risk involves the time remaining, capacity remaining, and stress factors that account for the time buffer,
remaining virtual machines, and degree of habitual high workload.
vCenter Operations Manager calculates the risk score using the scores of the sub-badges that the Risk badge
contains. The formula that is applied to calculate the risk score is inverse geometric weighted mean.
The overall risk score for an object ranges between 0 (no risk) to 100 (serious risk). The badge changes its color
based on the badge score thresholds that are set by the vCenter Operations Manager administrator.
Table 2-6. Object Risk States
Badge Icon Description User Action
The selected object has no
current problems. No problems
are expected in the future.
A low chance of future problems
exists or a potential problem
might occur in the far future.
A chance of a more serious
problem exists or a problem
might occur in the medium-term
future.
The chances of a serious future
problem are high or a problem
might occur in the near future.
No attention required.
Navigate to the Scoreboard tab to
check which resources are likely
to exhaust and plan for
appropriate actions.
Navigate to the Scoreboard tab to
check which resources are close to
exhausting and take appropriate
actions as soon as possible.
Navigate to the Scoreboard tab in
to check which resources are
exhausted and act immediately to
resolve or prevent problems.
16 VMware, Inc.
Page 17
Chapter 2 Beginning to Monitor the Virtual Environment
Table 2-6. Object Risk States (Continued)
Badge Icon Description User Action
No data is available.
The object is offline.
Using the Time Remaining Badge Under the Risk Badge
The vCenter Operations Manager Time Remaining badge measures the time before a resource associated with
an object reaches capacity. This badge indicates the available timeframe to provision or load balance the
physical or virtual resources for a selected object.
vCenter Operations Manager calculates the Time Remaining score as a percentage of time that is remaining
for each compute resource compared to the provisioning buffer you set in the Configuration dialog box. By
default, the Time Remaining score provisioning buffer is 30 days. If even one of the compute resources has less
capacity than the provisioned buffer, the Time Remaining score is 0.
For example, if the provisioning buffer is set to 30 days, and the object that you selected has CPU resources for
81 days, memory resources for 5 days, disk I/O resources for 200 days, and network I/O resources for more
than one year, the Time Remaining score is 0, because one of the resources has capacity for less than 30 days.
The Time Remaining score ranges between 0 (bad) and 100 (good). The badge changes its color based on the
badge score thresholds that are set by the vCenter Operations Manager administrator.
Table 2-7. Time Remaining States
Badge Icon Description User Action
The number of days that remain
is much higher than the score
provisioning buffer you
specified.
The number of days that remain
is higher than the score
provisioning buffer, but is less
than two times the buffer you
specified.
The number of days that remain
is higher than the score
provisioning buffer, but
approaches the buffer you
specified.
The number of days that remain
is lower than the score
provisioning buffer you
specified. The selected object
might have exhausted some of
its resources or will exhaust
them soon.
No data is available for the Time
Remaining score.
No attention required.
Check and take appropriate
action.
Check and take appropriate
action as soon as possible.
Act immediately.
The object is offline.
VMware, Inc. 17
Page 18
VMware vCenter Operations Manager Getting Started Guide
Using the Capacity Remaining Badge Under the Risk Badge
The vCenter Operations Manager Capacity Remaining badge measures the number of additional virtual
machines that the object can handle before reaching capacity.
The remaining virtual machines count represents the number of virtual machines that can be deployed on the
selected object, based on the current amount of unused resources and the average virtual machine profile for
the last "n" weeks. The remaining virtual machines count is a function of the same compute resources of CPU,
Mem, Disk I/O, Net I/O, and Disk Space that are used to calculate the Time Remaining score.
vCenter Operations Manager calculates the Capacity Remaining score as a percentage of the remaining virtual
machines count compared to the total number of virtual machines that can be deployed on the selected object.
The Capacity Remaining score ranges between 0 (bad) and 100 (good). The badge changes its color based on
the badge score thresholds that are set by the vCenter Operations Manager administrator.
Table 2-8. Object Capacity States
Icon Description User Action
No attention required.
Check and take appropriate action.
Check and take appropriate action as soon as
possible.
Act immediately.
No data is available for any
of the metrics for the time
period.
The object is offline.
Using the Stress Badge Under the Risk Badge
The vCenter Operations Manager Stress badge measures a long-term workload that might involve undersized
virtual machines or ESX hosts or an excessive number of virtual machines. These conditions might generate
performance problems over time.
While workload is based on an instantaneous value, stress measures statistics over a longer period of time.
The Stress score helps you identify hosts and virtual machines that do not have enough resources allocated,
or hosts that are running too many virtual machines. A high Stress score does not imply a current performance
problem, but highlights potential for future performance problems.
The Stress score ranges between 0 (good) and 100 (bad). The badge changes its color based on the badge score
thresholds that are set by the vCenter Operations Manager administrator.
Table 2-9. Stress States
Badge Icon Description User Action
The Stress score is normal. No attention required.
Some of the object resources are
not enough to meet the
demands.
18 VMware, Inc.
Check and take appropriate
action.
Page 19
Chapter 2 Beginning to Monitor the Virtual Environment
Table 2-9. Stress States (Continued)
Badge Icon Description User Action
The object is experiencing
regular resource shortage.
Most of the resources on the
object are constantly
insufficient. The object might
stop functioning properly.
No data is available for the Stress
score.
The object is offline.
Check and take appropriate
action as soon as possible.
Act immediately.
The Compliance Badge
The Compliance badge value is based on the results of compliance templates that are run in
vCenter Configuration Manager and are pulled into vCenter Operations Manager to contribute to the Risk
badge calculation.
The Compliance badge value is a score based on one or more compliance templates that you run in VCM
against the data collected from vCenter Server, datacenter, cluster, host system, virtual machine objects that
are managed by vCenter Operations Manager and by VCM. The scores are calculated based on configured
VCM settings.
A VCM compliance template comprises one or more rules that define the configuration standards for different
object groups or all your objects. A rule is defined with one or more conditions that are run against objects to
determine if the configuration meets the required standards. The success or failure of the conditions determines
whether the rule is successful or unsuccessful. The compliance templates are not run against each object, but
are run against the collected configuration data for each object.
The Compliance score ranges from 0 (completely non-compliant) to 100 (completely compliant). The color of
the badge changes based on the badge score thresholds that are set by the vCenter Operations Manager
administrator.
Table 2-10. Object Compliance States
Badge Icon Description User Action
The object is in compliance with the
defined standards.
The object is not as compliant as you
would like based on the default values
you defined.
The object is seriously out of
compliance.
The object is non-compliant. 1 Click the Compliance badge.
No data is available for any of the
templates.
The object is offline.
No attention required.
1 Click the Compliance badge.
2 Check the template scores and take
appropriate action.
1 Click the Compliance badge.
2 Check the template scores and take
appropriate action as soon as
possible.
2 Act immediately to correct non-
compliant states based on template
results.
VMware, Inc. 19
Page 20
VMware vCenter Operations Manager Getting Started Guide
Defining Efficiency to Optimize the Environment
The vCenter Operations Manager Efficiency badge identifies the potential opportunities to improve the
performance or cost of your virtual environment.
Efficiency accounts for the waste and infrastructure density in your environment. A large amount of wasted
resources combined with a low density ratio generates a poor efficiency score.
The Efficiency score ranges between 0 (bad) and 100 (good). The badge changes its color based on the badge
score thresholds that are set by the vCenter Operations Manager administrator.
Table 2-11. Object Efficiency States
Badge Icon Description User Action
The resource use on the selected
object is optimal.
The efficiency is good, but can be
improved. Some resources are
not fully used.
The resources on the selected
object are not used in the most
optimal way.
The efficiency is bad. Many
resources are wasted.
No data is available.
The object is offline.
No attention required.
1 On the Planning tab, click
2 Use the views that are
1 On the Planning tab, click
2 Use the views that are
1 On the Planning tab, click
2 Try optimizing the resource
Using the Reclaimable Waste Badge Under the Efficiency Badge
Views.
available for the selected
object to identify underused
resources.
Views.
available for the selected
object to identify underused
resources.
Views.
use to avoid resource waste.
The vCenter Operations Manager Reclaimable Waste badge accounts for resource types such as CPU, memory,
or disk, and measures the extent of excessive provisioning for an object. It also identifies the amount of
resources that you can reclaim and provision to other objects in your virtual environment.
The Reclaimable Waste score ranges between 0 (good) and 100 (bad). The badge changes its color based on the
badge score thresholds that are set by the vCenter Operations Manager administrator.
Table 2-12. Reclaimable Waste States
Badge Icon Description User Action
No resources are wasted on the
selected object.
Some resource can be used
better.
Many resources are underused. Select Planning > Views to
20 VMware, Inc.
No attention required.
Select Planning > Views to
identify underused resources.
identify underused resources.
Page 21
Chapter 2 Beginning to Monitor the Virtual Environment
Table 2-12. Reclaimable Waste States (Continued)
Badge Icon Description User Action
Most of the resources on the
selected object are wasted.
No data is available for any of
the metrics for the time period.
The object is offline.
Select Planning > Views to
identify underused resources.
A vCenter Operations Manager administrator can change the badge score thresholds. For example, a green
badge can indicate a score below 50 instead of 75, as set by default.
Using the Density Badge Under the Efficiency Badge
The vCenter Operations Manager Density badge measures consolidation ratios to assess cost savings. You can
assess the behavior and performance of a virtual machine and related applications to maximize the
consolidation ratio without affecting the performance or service level agreements.
The density score is the ratio of the actual density to an ideal density based on the demand, the amount of
virtual capacity, and the amount of physical usable capacity. Density calculates the amount of resources that
you can provision before contention or conflict for a resource occurs between objects. The ratios account for
the number of virtual machines to host, the number of virtual CPUs to physical CPU, and the amount of virtual
memory to physical memory.
The Density score ranges between 0 (bad) and 100 (good). The badge changes its color based on the badge
score thresholds that are set by the vCenter Operations Manager administrator.
Table 2-13. Object Density States
Badge Icon Description User Action
The resource consolidation is
good.
Some resources are not fully
consolidated.
The consolidation for many
resources is low.
The resource consolidation is
extremely low.
No data is available for any of
the metrics for the time period.
The object is offline.
No attention required.
Select Planning > Views to
identify resource consolidation
opportunities.
Select Planning > Views to
identify resource consolidation
opportunities.
Select Planning > Views to
identify resource consolidation
opportunities.
A vCenter Operations Manager administrator can change the badge score thresholds. For example, a green
Density badge can indicate a score above 40 instead of 25, as set by default.
Working with Metrics and Charts on the All Metrics Tab
You can check the location of an object in the hierarchy and select metrics to view graphs of their historic values
for a period you define.
You can use the panes on the All Metrics tab under the Operations tab to search metrics and view metric
graphs.
VMware, Inc. 21
Page 22
VMware vCenter Operations Manager Getting Started Guide
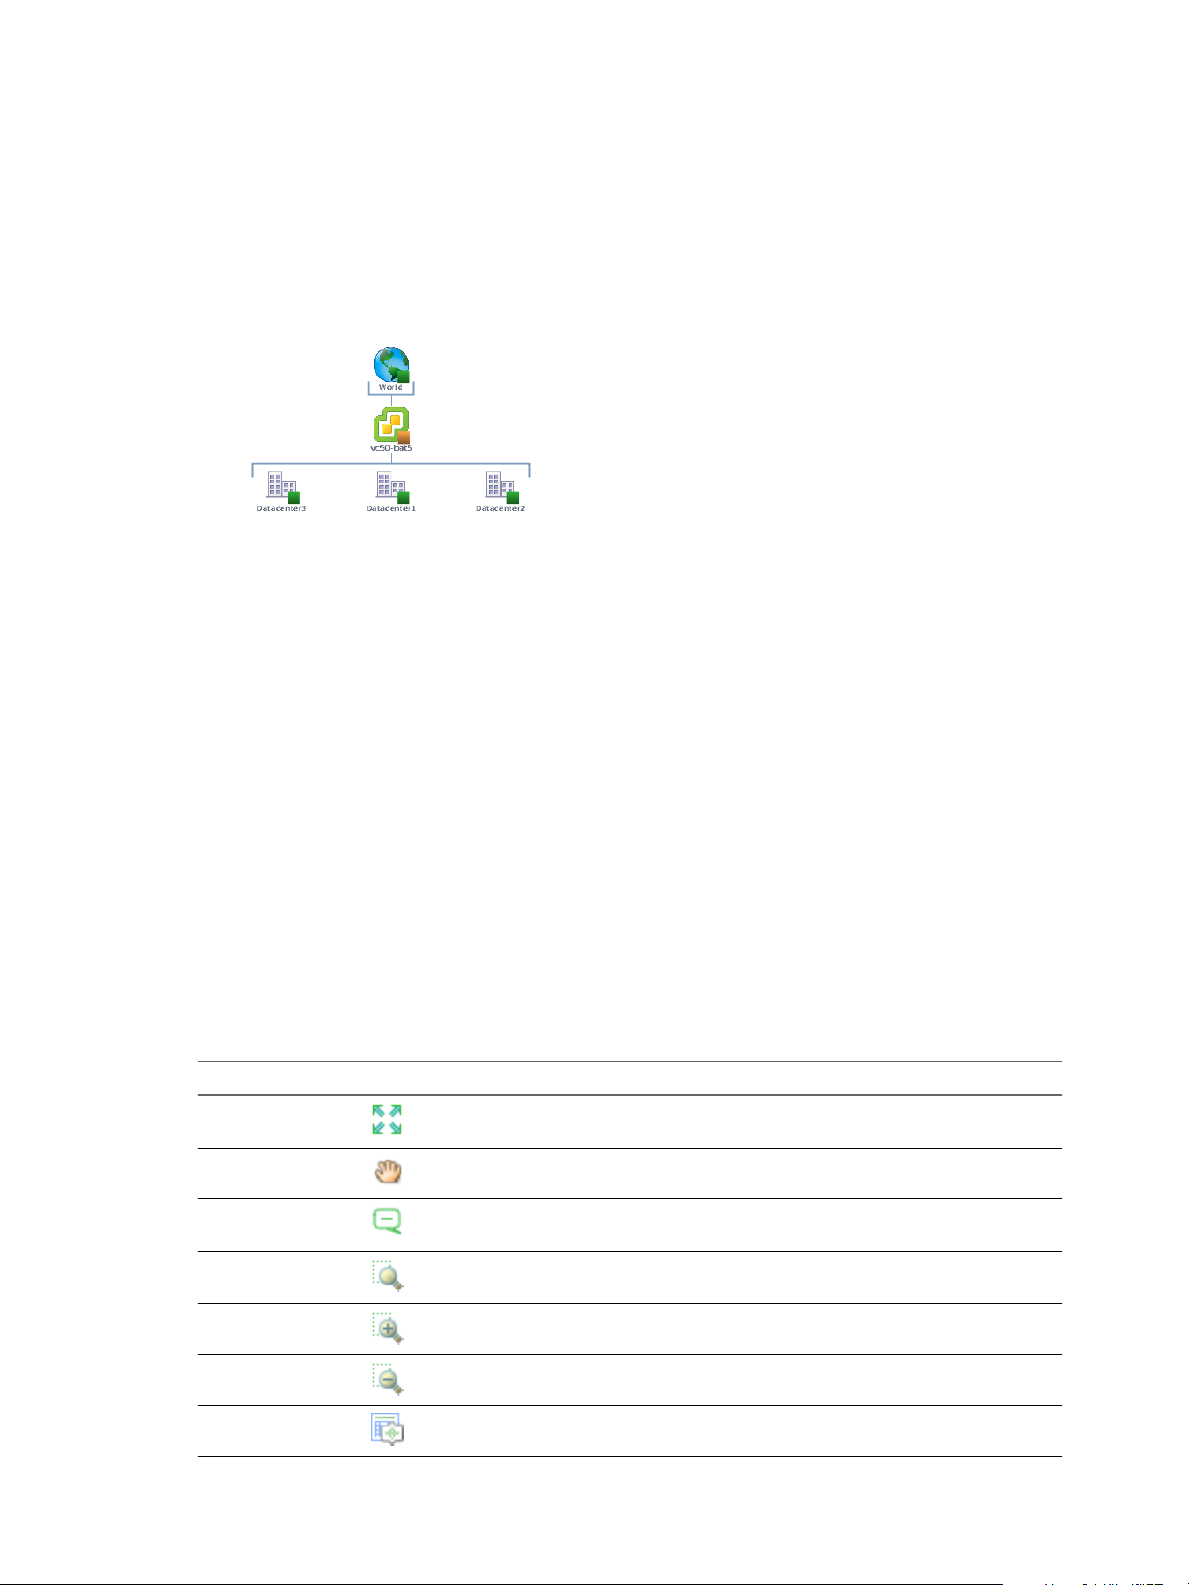
The Health Tree Pane
The Health Tree pane displays the location of the currently selected object in the hierarchy of your virtual
infrastructure. You can check all parent and child objects related to the currently selected object.
For example, the sample hierarchy shows the parent and child objects in the virtual infrastructure. The red
icon indicates a presence of a potential problem in the vCenter Server object. You can investigate the probable
cause of the problem from the Dashboard tab.
The Metric Selector Pane
The Metric Selector pane contains a list of all metric groups that are applicable to the currently selected object.
Metric groups contain all the metrics that are applicable to the currently selected object. The list of available
metrics is updated depending on the object you selected in the Health Tree pane.
The Search text box allows you find metrics using part of their names and filter the search results by metric
groups, instances or metric types.
For example, if you type % in the Search text box and select Metric from the drop-down menu, the search result
contains only metrics that are calculated as percentage.
The Metric Chart Pane
The Metric Chart pane displays the graphs of the metrics you select from the Metric Selector pane. You can
view as many graphs as you want. You can control the appearance of metric graphs and create screenshots by
using the buttons in the Metric Chart pane.
Health Tree Pane Buttons
In the All Metrics tab under the Operations tab, you can use the buttons of the Health Tree pane to control
the appearance of monitored objects in the health tree.
Button Tooltip Icon Description
Zoom to fit Resizes the view so all related objects fit in the health tree area. All previous zoom operations
are discarded.
Enter pan mode Allows you to pan the health tree.
Show values on point Enables metric value tooltips so that they appear when you point the graph with the mouse
pointer.
Enter zoom mode Allows you to enlarge sections of the health tree by drawing rectangles to enclose the area
to enlarge.
Zoom in Enlarges the middle of the health tree by one level.
Zoom out Reduces the middle of the health tree by one level.
Reset to initial object Reset the Health Tree pane to the original view for the selected object..
22 VMware, Inc.
Page 23
Chapter 2 Beginning to Monitor the Virtual Environment
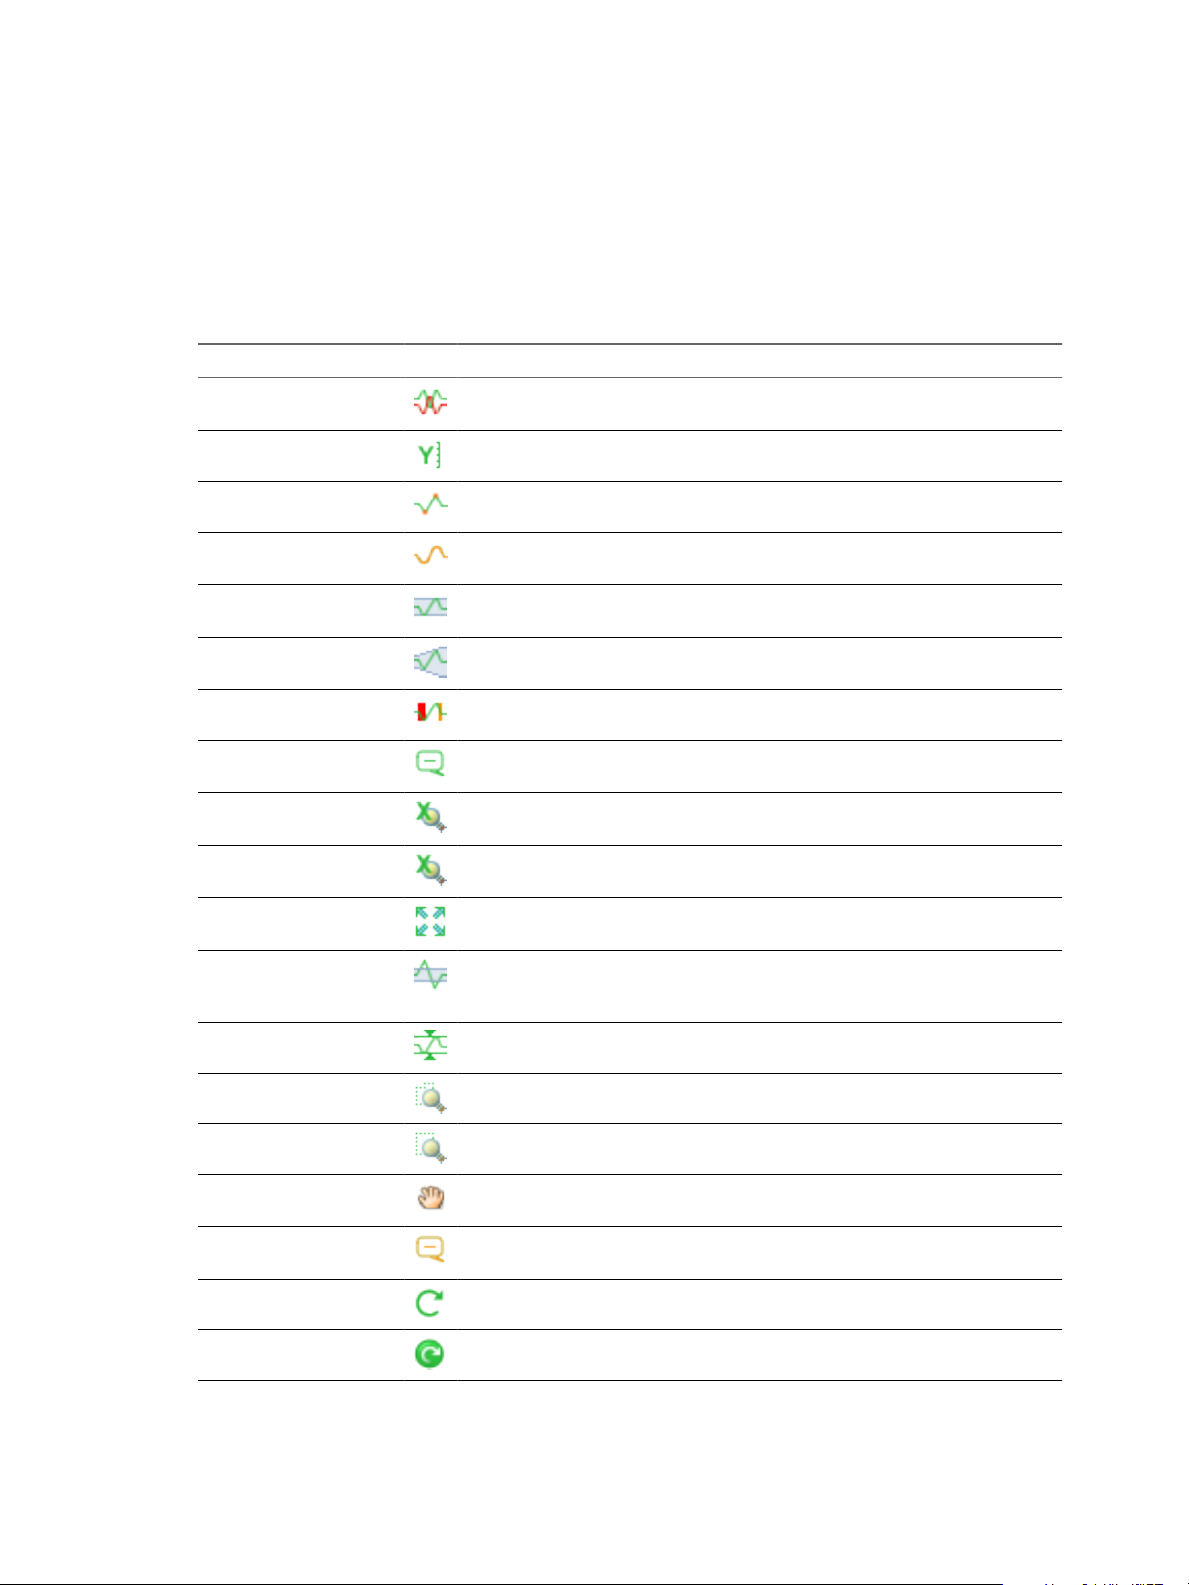
Metric Chart Pane Buttons
On the All Metrics page, you can use the buttons of the Metric Chart pane to customize the appearance of
charts, and add or delete charts.
Global Control Buttons
These buttons control the appearance of all graphs that you open in the Metric Chart pane.
Button Tooltip Icon Description
Separate graphs by period Splits the current metrics graph in separate graphs by periods based on your selection
in the time and date widget.
Show/hide Y-axis Displays or hides the Y axis of the graph to display metric values.
Show/hide metric line Displays or hides the line that connects the data points in the metric graph.
Show/hide trend line Displays or hides the line that represents the trend of the currently selected metric in
the graph.
Show 24-hour dynamic
thresholds
Show entire period dynamic
thresholds
Show/hide anomalies Displays or hides the anomalies that occurred during the selected period in the graph.
Displays or hides the calculated dynamic threshold values for a 24-hour period in the
graph.
Displays or hides the calculated dynamic threshold values for the entire monitoring
period in the graph.
Retrieve complete metric
values
Enable X-axis zoom Allows you to enlarge the selected area of the graph only on the X axis while the Y
Enable Y-axis zoom Allows you to enlarge the selected area of the graph only on the Y axis while the X
Zoom to fit Resizes the charts so the entire graphs for all selected periods fit in the chart area. All
Zoom Y-axis to dynamic
thresholds
Compress Y-axis Shortens the graph.
Zoom all graphs together Resizes all metric graphs that are open in the Metric Chart pane.
Enter zoom mode Enables resizing of the metric graphs on both axis Y and axis X.
Enter pan mode When in zoom mode, allows you to drag the enlarged section of the graph around to
Show value on point Enables metric value tooltips so that they appear when you point the graph with the
Refresh Reloads all graphs in the Metric Chart.
In zoom mode, displays the values of the selected metric when you move the mouse
pointer over the graph.
axis remains static.
axis remains static.
previous zooms are discarded.
Resizes the Y axis of the metric chart so that the highest and the lowest values on the
axis are the highest and the lowest values of the dynamic threshold calculated for this
metric.
view higher, lower, earlier, or later values of the metric.
mouse pointer.
Turn auto refresh on/off Activates or deactivates the auto refresh option for metric charts.
VMware, Inc. 23
Page 24
VMware vCenter Operations Manager Getting Started Guide
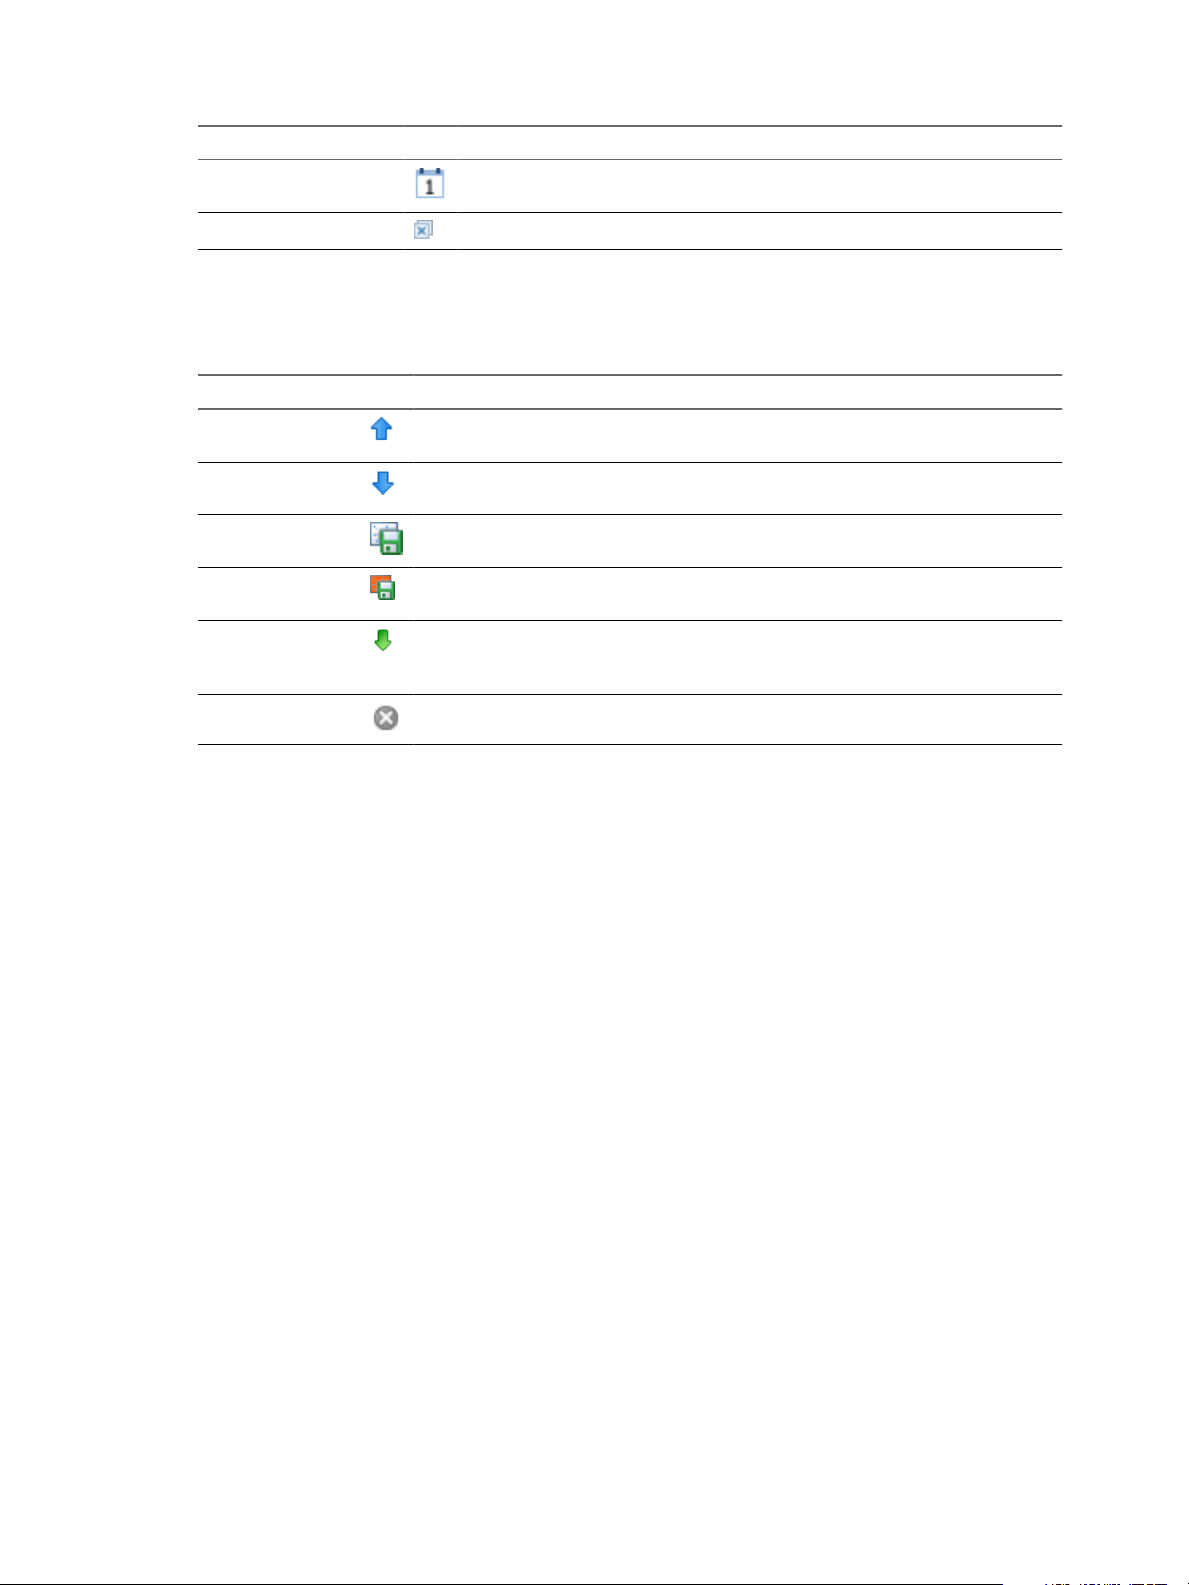
Button Tooltip Icon Description
Open date/time controls Opens the date and time widget for you to select the period to display on the metric
graph.
Remove all graphs Deletes all graphs from the Metric Chart pane.
Chart-Specific Buttons
These buttons control the specific chart to which they are attached. Some chart-specific buttons are available
only when you view graphs split by period.
Button Tooltip Icon Description
Move up When multiple graphs are open in the Metric Chart pane, this button moves the selected
graph one place up. Available only for split graphs view.
Move down When multiple graphs are open in the Metric Chart pane, this button moves the selected
graph one place down. Available only for split graphs view.
Save a snapshot Creates a real-size snapshot of the selected graph and opens a File Download window for
you to open or save the PNG file.
Save a full screen
snapshot
Download comma
separated data
Close Deletes the selected graph from the Metric Chart pane. Available only for split graphs view.
Creates an enlarged snapshot of the selected graph and opens a File Download window for
you to open or save the PNG file.
Creates a comma separated values file with the metric data for the selected graph and opens
a File Download window for you to open or save the CSV file. Available only for split graphs
view.
24 VMware, Inc.
Page 25

Viewing Members and Relationships
in the Monitored Environment 3
The Environment tab allows you to look at the objects in your virtual environment from different perspectives.
The Overview Tab
The Overview tab provides a visual representation of the population of your virtual environment by object
types. You can click objects to highlight their related parent and child objects. You can compare the scores of
related objects to narrow down the possible causes for a bad badge score.
For example, if the Health badge of an ESX host is red, but the health badge of its parent cluster is green, the
problem is either with the host itself, or with the virtual machines that run on that host. If the Health badges
of one or two virtual machines are red, these virtual machines might be causing the problem on the ESX host.
Therefore, you must check these virtual machines first. If the Health badges of all virtual machines are red, the
host system is experiencing hardware problems or cannot meet the demands of the virtual machines that run
on it.
The Scoreboard Tab
On the Scoreboard tab, you can view a population of data across multiple metrics dimensions to get a quick
glance overview of where and why problems exist. Scoreboards are useful for any object that has a population,
including group objects.
On the Scoreboard tab, you can compare the badge values of child objects of the currently selected object. For
example, you can use the Scoreboard tab to compare objects and analyze the current distribution and
availability of resources in your virtual environment.
The Members Tab
On the Members tab, you can vew a list of all objects under the currently selected object or group. In addition
to the names of objects and their parents, the list displays information about the policy that is assigned to each
object.
The Relationships Tab
The Relationships tab displays application related information provided by VMware vCenter Infrastructure
Navigator. You can view the relationship graph and object properties of the selected object and its related
objects.
This chapter includes the following topics:
n
“Check the Performance of Your Virtual Environment,” on page 26
n
“Balancing the Resources in Your Virtual Environment,” on page 26
VMware, Inc.
25
Page 26

VMware vCenter Operations Manager Getting Started Guide
n
“Find an ESX Host that Has Resources for More Virtual Machines,” on page 27
n
“Find a Cluster that Has Resources Available for More Virtual Machines,” on page 28
n
“Ranking the Health, Risk, and Efficiency Scores,” on page 28
n
“View the Compliance Details,” on page 29
n
“View a List of Members,” on page 31
n
“Overview of Relationships,” on page 31
Check the Performance of Your Virtual Environment
On the Overview tab under the Environment tab, you can check the performance of your virtual infrastructure
to identify objects with potential performance problems.
You can check the performance of all objects on the vCenter Server that you added for monitoring in
vCenter Operations Manager.
Prerequisites
Verify that you are logged in to a vSphere Client, and that vCenter Operations Manager is open.
Procedure
1 On the Environment tab, click Overview, and click the badge that you want to inspect.
Option Description
Health (default)
Workload
Anomalies
Faults
Click to check the Health scores of all monitored objects.
Click to check the Workload scores of all monitored objects.
Click to check the Anomalies scores for all monitored objects.
Click to check the Faults scores for all monitored objects.
The states of all objects for the metric you selected appear in the Environment tab as colored badges.
2 (Optional) To filter objects by state, use the Status Filter buttons in the upper right of the Overview tab.
What to do next
How you proceed depends on your findings of the performance in your virtual environment.
Balancing the Resources in Your Virtual Environment
You can get an overview of where and why problems exist in your virtual environment, and how the resources
are distributed among objects.
On the Scoreboard tab under the Environment tab, you can compare the performance and available resources
of all child objects of the currently selected object, and look for answers to the following questions.
n
What is the current distribution and availability of resources in my virtual environment?
n
Which hosts have the resources to accommodate new virtual machines?
n
Which hosts require load balancing? Can I move virtual machines from an overloaded host to a less loaded
host?
n
Which child objects have the highest and the lowest scores for health, workload, anomalies, and faults?
26 VMware, Inc.
Page 27

Chapter 3 Viewing Members and Relationships in the Monitored Environment
The Custom Overview Chart
The Custom Overview chart is a bubble chart that allows you to compare objects by their badge values. By
using the Custom Overview chart, you can draw better inferences from the data that
vCenter Operations Manager collects.
The chart presents data by four dimensions, using the following variables: color, size, x-axis, and y-axis. The
value that is represented by each variable depends on the selection in the View drop-down menu. When
Health, Risk, or Efficiency is selected in the View drop-down menu, the values for color, size, x-axis, and yaxis are populated automatically and cannot be modified. You can specify your own values only when
Custom is selected in the View drop-down menu.
You can use the buttons above the Custom Overview chart to filter objects by type and badge status. Filtering
allows you to slice the problem and narrow down the objects that are experiencing the problem to a certain
degree.
The Members List
The Members list displays details for all objects that are visualized in the Custom Overview chart. This list is
filtered based on the criteria that you specify for the Custom Overview chart. The columns contain object name,
type, and spark lines for all badges related to the object. At the end of each spark line, the latest known value
for the badge is displayed as a numeric label.
You can click objects in the Members list to highlight them in the Custom Overview chart, and you can click
objects in the Custom Overview chart to highlight them in the Members list.
The procedure that you must follow when searching for a host that can accommodate a new virtual machine
depends on the use of Distributed Resource Scheduler (DRS) on the vCenter Server.
Find an ESX Host that Has Resources for More Virtual Machines
If a vCenter Server host does not use Distributed Resource Scheduler (DRS), you can use the Scoreboard tab
to check the available resources on the ESX hosts in a cluster and make decisions on moving virtual machines
in your virtual infrastructure.
Prerequisites
Verify that you are logged in to a vSphere Client, and that vCenter Operations Manager is open.
Procedure
1 In the inventory view, click the datacenter or cluster that contains the ESX host that you want to assess.
2 On the Scoreboard tab, select Health from the View drop-down menu.
The colored bubbles in the Custom Overview chart represent the health scores for all object in the
datacenter that are online. The workload is represented by the X-axis.
The objects with highest workload appear to the right on the X-axis.
3 (Optional) To filter object types out of the Custom Overview chart, click their icons.
4 In the Custom Overview chart, click the bubble for a host that you think might accommodate more virtual
machines.
Usually, this should be the ESX host that is situated closer to the Y-axis.
The name of the host becomes highlighted in the Members List pane.
5 In the Members List pane, click the host name to open its Details tab.
VMware, Inc. 27
Page 28

VMware vCenter Operations Manager Getting Started Guide
6 On the Details tab, review the Resources pane and the Workload graphs to assess the potential capacity
for new virtual machines.
If one or more resources of the host are approaching their limits, you might not want to add a virtual
machine to this ESX host.
What to do next
If the selected ESX host has enough resources, you can add the new virtual machines.
Find a Cluster that Has Resources Available for More Virtual Machines
If the vCenter Server host uses Distributed Resource Scheduler (DRS), you can use the Scoreboard tab to check
the available resources in each cluster and make decisions on moving virtual machines in your virtual
infrastructure.
Prerequisites
Verify that you are logged in to a vSphere Client, and that vCenter Operations Manager is open.
Procedure
1 In the inventory view, click the datacenter that contains the cluster that you want to assess, and click the
Environment tab.
2 On the Scoreboard tab, select Health from the View drop-down menu.
The colored bubbles in the Custom Overview chart represent the health scores for all objects in the
datacenter that are online. The workload is represented by the X-axis.
The objects with highest workload appear to the right on the X-axis.
3 (Optional) To filter object types out of the Custom Overview chart, click their icons.
4 In the Custom Overview chart, click the bubble of a cluster that you think might accommodate more virtual
machines.
Usually, this is a cluster that is situated closer to the Y-axis.
The name of the cluster becomes highlighted in the Members List pane.
5 In the Members List pane, click the object name to open its Details tab.
6 On the Details tab, review the Resources pane and the Workload graphs to assess the potential capacity
for new virtual machines.
If one or more resources are approaching their limits, you might not want to add a virtual machine to this
cluster.
What to do next
If the selected cluster has enough resources, you can add the new virtual machines.
Ranking the Health, Risk, and Efficiency Scores
On the Scoreboard tab, you can compare the scores of the Health, Risk, and Efficiency badges and their subbadges for child objects that are directly related to the object selected in the inventory pane.
Each child object is displayed as a circle in the Custom Overview chart. Larger circle size means higher score
for the badge that is selected in the Size drop-down menu.
When you compare the Health scores, you can find health problems and see why the health has degraded.
You can also identify groups of objects that might have similar problems, check whether the workload is high
in the selected population, and whether the population has a lot of faults or anomalies.
28 VMware, Inc.
Page 29

When you compare the Efficiency scores, you can analyse visually the distribution of resources among child
objects of the selected object.
When you compare the Risk scores, you can prioritize objects that need your attention sooner than others.
You can click the names of objects in the Members List to navigate to their Details tabs. Viewing details about
the workload and resources that are available to the selected object can help you identify the possible reasons
for poor badge scores.
View the Compliance Details
The Compliance score is a value that is based on results that are generated in
vCenter Configuration Manager when the compliance templates that are mapped to the Compliance badge
are run. You can review the number of failed conditions that contribute to the score and access the template
in VCM to evaluate the results. Based on your evaluation, you can make changes to improve the score.
Prerequisites
n
Verify that the vCenter Configuration Manager adapter is installed. See vCenter Operations Manager
Enterprise Adapter Guide.
n
Verity that you have access to a supported version of Internet Explorer on the physical or virtual machine
on which you are running vCenter Configuration Manager so that you can open the templates in VCM.
See the VCM Installation Guide for supported versions of Internet Explorer.
Chapter 3 Viewing Members and Relationships in the Monitored Environment
n
Verify that the VCM mappings are created, tested, and scoring as expected. See the VCM online Help and
the VCM Administration Guide.
Procedure
1 In the inventory panel, select a vCenter Server, datacenter, cluster, host, or virtual machine object.
2 Click the Dashboard tab and expand Why is Risk {score}?.
3 To see the details of the compliance score, click the Compliance badge.
4 On the Views tab, click Compliance.
The templates from which the badge score was calculated appear in the Details pane. The templates with
the worst noncompliant scores are at the top of the list.
5 To view the non-compliant results so that you can determine what needs to be resolved, click View details
in VCM.
The Info window that appears provides the full URL for the template results.
6 If necessary, copy and paste the URL into the Internet Explorer address bar and go to the address.
7 On the VMware vCenter Configuration Manager page, click Login.
The selected template results appear in the VCM console.
What to do next
Review and resolve noncompliance results in vCenter Configuration Manager. See “Resolve Non-Compliant
Rules for Compliance Templates,” on page 29.
Resolve Non-Compliant Rules for Compliance Templates
The Compliance score is is a value based on template rules that are run in VCM. To improve score, view the
template results and determine how to resolve non-compliant rules for the target objects.
When you are working in VCM, click the Help icon to access information about the page on which you are
working and for more information about the available actions.
VMware, Inc. 29
Page 30

VMware vCenter Operations Manager Getting Started Guide
Prerequisites
n
Select the template for which you are evaluating results. See “View the Compliance Details,” on page 29.
n
If you do not see the name of the object for which you are resolving non-compliant results, correlate the
name that appears in VCM with the name used in vCenter Operations Manager. See “Correlate
Compliance Object Names,” on page 31.
Procedure
1 On the VMware vCenter Configuration Manager page, click Login.
The selected template results appear in the VCM console.
2 Review the status column to identify the non-compliant rules that require your attention.
3 Resolve non-compliance results.
Click Help on the template results data grid for more information about the following options for resolving
non-compliant results.
n
Use enforceable compliance to enforce results.
n
Use VCM to enforce non-enforceable compliance results.
n
Manually change the settings or configurations.
n
Add exceptions when you expect the object to not meet the rule and you do not want to see it again
as a non-compliant object.
4 Collect data from the machine groups and virtual object groups for which resolved non-compliant results.
5 Run the mappings in VCM.
When you run the mappings, the templates are run for the objects.
6 To review the badge scores in VCM, click Console and select Dashboard > Virtual Environments >
vCenter Operations Manager Compliance Rollup.
Verify the scores to ensure that you resolved all the necessary non-compliant results.
What to do next
In vCenter Operations Manager, review the Compliance badge scores to ensure that your scores are now at
acceptable levels. You must allow approximately five minutes for vCenter Operations Manager to pull the new
scores from VCM.
Differing Object Names for Compliance Objects
The virtual machine object name in vCenter Operations Manager might be different from the object name in
the VCM compliance templates. This difference is a result of how vCenter Operations Manager and VCM
retrieve and collect data from vCenter Server.
Some virtual objects in the templates might be managed in VCM as both a virtual machine on which the
VCM Agent is installed and as a virtual object that is managed through a vCenter Server instance using the
Managing Agent. When the object is managed as a virtual machine and as a virtual object, the name that appears
in the template detail results might be different from the name that appears in vCenter Operations Manager.
The name in the VCM template results is the object name that you assigned when the object was created, usually
similar to the DNS name. The name in vCenter Operations Manager is based on the vCenter Server object name
unless you renamed the object in vCenter Server. If you renamed the object, vCenter Operations Manager
displays the user-assigned name. If the name is different from the originally assigned name, you see one name
in vCenter Operations Manager and the DNS-derived name in VCM.
To verify that you are working with the same object, use the data in VCM to correlate the object name, the
guest object name, and the DNS name.
30 VMware, Inc.
Page 31

Correlate Compliance Object Names
If the object name in the VCM template results does not match the name of the object in
vCenter Operations Manager, use VCM to correlate the object names and ensure that you are evaluating and
remediating the same object.
To verify that you are working with the same object, use the data in VCM to correlate the object name, the
guest object name, and the DNS name.
Procedure
1 In VCM, click Console and selectVirtual Environments > vCenter > Guests > Summary.
2 In the Guest column, locate the name used in vCenter Operations Manager and identify the Guest Machine
Name and the DNS Name that is used by VCM.
The Guest Machine name and the DNS name are commonly the names used in the template results.
View a List of Members
You can view the objects that belong to the currently selected object or group.
The list of objects contains columns that show the object name, object type, parent object, parent type, and the
policy that is assigned to the object. By default, all columns appear. You can sort the list by one column in
ascending or descending order. You can also hide or show columns.
Chapter 3 Viewing Members and Relationships in the Monitored Environment
Procedure
1 Click the Environment tab, and click Members.
2 To sort the list by a specific column: with the mouse, point to the column header and click the triangle to
display the menu of sort options.
Option Action
Sort the Members list by the selected
column.
Display the drop-down list of
columns, and select or deselect the
checked columns to hide or show
them.
Overview of Relationships
VMware vCenter Infrastructure Navigator is an application awareness plug-in to the vCenter Server.
Infrastructure Navigator probes the virtual machine entities inside the vCenter Server and provides application
related information.
After Infrastructure Navigator integration with vCenter Operations Manager, the application related
information is displayed in the Relationships tab under the Environment tab of the
vCenter Operations Manager.
The Relationships tab displays the relationship graph and object properties of the selected object. The object
that you select is highlighted and displayed in the middle of the graph. For all the objects that are running in
your environment, the Relationships tab displays the various types of relationships with respect to the
highlighted object.
Click Sort Ascending or Sort Descending.
With the mouse, point to Columns.
VMware, Inc. 31
Page 32

VMware vCenter Operations Manager Getting Started Guide
Relationship Graph Pane Buttons
You can use the relationship graph pane buttons to control the appearance of objects in the relationship graph.
Table 3-1. Relationship Graph Pane Buttons
Button Tooltip Button Icon Description
Zoom to fit Resizes the view so that all related objects fit in the relationship
Enter pan mode Allows you to pan the relationship graph.
Show values on point Enables metric value tooltips so that they appear when you
Enter zoom mode Allows you to enlarge sections of the relationship graph by
Zoom in Enlarges the middle of the relationship graph by one level.
Zoom out Reduces the middle of the relationship graph by one level.
Reset to initial object Reset the relationship graph and the properties table pane to
Resource details Opens the Details page under the Operations tab.
graph.
point the graph with the mouse pointer.
drawing rectangles to enclose the area to enlarge.
the object selected from the inventory tree.
Select a Relationship
The Relationships tab displays different types of relationships of a selected object. Depending on your choice
you can select the type of relationship that you want to view.
Procedure
1 Click the Relationships tab under the Environment tab.
2 From the Show drop-down menu, select the relationships that you want to view.
Relationships Description
All Relationships
vSphere Relationships
Group Relationships
Application Relationships
Displays the sum of all the three relationships. This relationship is selected
by default.
Displays relationships between the vSphere objects.
Displays the group relationships with respect to the selected object.
You can view this relationship only at the virtual machine level. Displays the
following relationships between the virtual machines and application
objects:
n
Set of applications that run on the selected virtual machine.
n
Set of applications that the selected virtual machine depends on.
Viewing the Properties of an Object
You can see a graphical view of an object's child relationships on the Relationships tab. You can use the
Relationship graph pane buttons to manipulate the graph, and select the type of relationships to view.
For the selected object in the left-hand inventory pane, the Relationships tab displays a graph of the object's
relationships and a list of its properties. The list displays the number of objects that have each property.
Properties vary according to the type of object.
32 VMware, Inc.
Page 33

Chapter 3 Viewing Members and Relationships in the Monitored Environment
Procedure
1 In the inventory pane, click the object for which you want to view relationships.
2 Click the Relationships tab under the Environment tab.
The relationship graph and properties of the object are displayed. (You can also directly select the object
and see its object properties by double-clicking the object from the relationship graph.)
3 Use the Relationships graph pane buttons to examine objects in the graph.
4 Use the Show drop-down list to select the type of relationships to view.
5 (Optional) To view the properties of any object in the relationship graph, click the object.
View the Properties of the Application Object
The vCenter Operations Manager user interface displays the relationships graph and object properties of an
application object. The properties of an application object include Process, Listening Port, Category, Runs on,
and Dependent of Service.
At the virtual machine level, the relationship graph also displays the application that are running on this virtual
machine and applications that this selected virtual machine depends on. If you select any application from the
relationship graph, the application object properties of that application is displayed. The virtual machines that
are above the application node are a set of virtual machines that depend on the selected application. The virtual
machines that are below the application node are the virtual machines that the application runs on.
Procedure
1 In the inventory pane, click the virtual machine object.
2 Click the Relationships tab under the Environment tab.
The relationship graph and properties of the virtual machine object are displayed. The relationship graph
also displays the applications that run on the virtual machine and the applications that the virtual machine
depends on.
3 Click the application object for which you want to see the object properties.
The application object properties are displayed. You can also directly select the application object and see
its relationship graph and application object properties by double-clicking the application object from the
relationship graph.
Table 3-2. Properties of the Application Object
Application Description
Title Displays the name of the selected application.
Process Displays the process name of the selected application.
Listening Port Displays a list of listening port numbers of the selected
application.
Category Displays the name of the category the selected application
belong to.
Runs on Displays the name of the entity on which the selected
application is running. If it is an external entity, IP address
is displayed. If it is a virtual machine that is managed by
vCenter Operations Manager, you can click on the link to
navigate to that virtual machine.
Dependent of Service Displays a set of virtual machines that depend on the
selected application. You can click the link to navigate to
the dependent virtual machine.
VMware, Inc. 33
Page 34

VMware vCenter Operations Manager Getting Started Guide
4 (Optional) To view the properties of any object other than the application object in the relationship graph,
click the object
34 VMware, Inc.
Page 35

Troubleshooting with
vCenter Operations Manager 4
You can use the monitoring features of vCenter Operations Manager to troubleshoot performance and capacity
problems in the virtual environment.
This chapter includes the following topics:
n
“Troubleshooting Overview,” on page 35
n
“Troubleshooting a Help Desk Problem,” on page 36
n
“Troubleshooting an Alert,” on page 36
n
“Finding Problems in the Virtual Environment,” on page 37
n
“Finding the Cause of the Problem,” on page 39
n
“Fix the Cause of the Problem,” on page 45
Troubleshooting Overview
vCenter Operations Manager provides visual and metric indicators that enable you to research performance
and capacity problems in the virtual environment.
The troubleshooting process consists of these main steps:
1 Find an object that has a problem.
2 Identify the cause of the problem.
3 Fix the cause of the problem.
For example, a user might call the help desk and report a performance problem. You can use the Health major
badge and Workload, Anomalies, and Faults minor badges to identify the object that is experiencing
performance degradation. After you identify the problem area, you can relocate the object or transfer resources
to it.
Finding an Object with a Problem
A troubleshooting process is often initiated in one of these ways:
n
An end user reports a problem with their system.
n
One or more alert notifications are received, reporting problems with the environment.
n
A vCenter Operations Manager user, such as a system administrator, identifies an immediate or near-term
problem.
VMware, Inc.
35
Page 36

VMware vCenter Operations Manager Getting Started Guide
Identifying the Cause
Consider these items to help find and isolate the cause of a problem:
n
The symptoms that appear in vCenter Operations Manager. For example, what are the Workload, Faults,
and Anomalies scores?
n
The population affected. Which objects are experiencing the symptoms?
n
The time frame of the problem. Is it temporary or long-term?
Addressing the Cause
After you understand the cause, you can take appropriate action in the virtual environment to fix the problem.
Typically, remediation involves shifting or adding resources in the environment.
Troubleshooting a Help Desk Problem
Use the vCenter Operations Manager Search feature to find an object that a user is having problems with.
If you receive a notice that a user is experiencing a problem with their environment, you can use the
vCenter Operations Manager Search feature to find the object that is causing the problem. For example, a user
might be experiencing performance problems with a virtual machine.
You can search for any object in the virtual environment, including groups of objects created in
vCenter Operations Manager.
Procedure
1 In the Search text box in the upper right of the page, type all or part of the object name.
You can search using any fragment of the object's name, for example, Storage. The resulting list might
display Storage3-ESX41, Storage5-ESX41U1, and the like.
A list of objects that match your search criteria appears as you type. The list is limited to the first 10
matching items.
2 In the list of matching objects, find the object you are searching for and click it.
The object is highlighted in the Inventory pane and the Dashboardtab is updated.
3 On the Dashboard tab, check the badge scores and colors, especially the Health badge for the object and
the Alert Volume chart for the object.
4 Navigate to the Workload, Anomalies, and Faults badges under the object's Health badge, and examine
alert notifications, to determine the cause of the user's problem.
Troubleshooting an Alert
Use the Alert Volume graph or the alert icons to begin investigating one or more alerts.
The vCenter Operations Manager Dashboard displays alert information in the Alert Volume chart under the
Health badge, and in the alert icons on the far right. The chart shows the number and type of alerts that occurred
over the past week, and the icons show the type and number of alerts that are currently active.
Procedure
1 Examine the Alert Volume chart to see if a pattern exists over the past seven days.
A pattern can indicate an ongoing problem.
2 Navigate to the Alerts tab by clicking the Alert Volume chart or clicking an alert icon.
36 VMware, Inc.
Page 37

Chapter 4 Troubleshooting with vCenter Operations Manager
3 On the Alerts tab, review the list and the information given for each alert.
You can use the columns and filters to sort the alert list.
The alert information provides actionable data for identifying and resolving a problem. For example, it shows
whether a resource is unavailable or running out of capacity. You can address the problem in the vSphere
Client.
Finding Problems in the Virtual Environment
When you log in to vCenter Operations Manager, examine the badges and graphs on the Dashboard tab to
determine if problems exist.
The Dashboard tab provides an overview of your virtual environment. The Health badge indicates immediate
issues.
In addition, the Stress badge, which is a component of the Risk badge, shows the objects in the virtual inventory
that have habitual high workloads that you might need to adjust.
n
Identify an Overall Health Issue on page 37
The Health badge is the indicator of a potential problem in the virtual environment that
vCenter Operations Manager monitors.
n
Identify Objects with Stressed Capacity on page 38
Identify the stressed virtual machines, hosts, and clusters that might require more capacity.
n
Identify Stressed Hosted or Clusters for Load Balancing on page 38
Identify the stressed or undersized hosts and clusters to assign more capacity to those objects and
optimize the load.
Identify an Overall Health Issue
The Health badge is the indicator of a potential problem in the virtual environment that
vCenter Operations Manager monitors.
By default, the Dashboard tab displays information about the World object. You can select another object in
the inventory pane to check for immediate health problems on the object. (You can also use the Search text box
at the upper right, entering part or all of the object's name, to locate an object.)
Prerequisites
In the vCenter Operations Manager interface, verify that the Dashboard tab is open.
Procedure
1 On the Dashboard tab, check the color of the Health badge.
2 If the color of the Health badge is other than green, click the arrow under the badge to expand the detailed
view.
The Health pane displays the sub-badges for Workload, Anomalies, and Faults. Badge colors help you
identify the possible cause of the problem.
VMware, Inc. 37
Page 38

VMware vCenter Operations Manager Getting Started Guide
3 Identify the cause of the health problem depending on the object that you selected in the inventory pane.
Selected Object Action
n
World
n
vCenter Server
n
Datacenter
n
Cluster
n
ESX host
n
Virtual machine
n
Datastore
a In the Health pane, identify the sub-badge that indicates poor score.
b Click the Environment tab under the Operations tab.
c Select the sub-badge that indicated poor score on the Dashboard page.
d Check the Environment tab for badges of related objects that are
e Double-click an object that indicates poor score.
f On the Details tab under the Operations tab, navigate to the object that
a In the Health pane, identify the sub-badge that indicates poor score and
b On the Details tab under the Operations tab, review the resource data,
What to do next
How you proceed depends on your findings on the Details page.
Identify Objects with Stressed Capacity
indicating problems.
the badge represents and review the resource data, key metrics, and
badge-specific information.
click it.
key metrics, and badge-specific information.
Identify the stressed virtual machines, hosts, and clusters that might require more capacity.
Prerequisites
In the vCenter Operations Manager interface, verify that the Dashboard tab is open.
Procedure
1 Click the Risk tab under the Dashboard tab, and click the arrow under the badge to expand the detailed
view.
2 To view the number of any stressed objects, select an object other than a datastore from the inventory
pane.
3 To investigate the details of stressed objects, click the Stress badge.
The Views tab opens.
4 Select the Stress badge and access the view that corresponds to the object.
What to do next
Assign less work to the virtual machines or reconfigure the capacity appropriate to the virtual machine load.
Identify Stressed Hosted or Clusters for Load Balancing
Identify the stressed or undersized hosts and clusters to assign more capacity to those objects and optimize
the load.
Prerequisites
Verify that you are logged in to a vSphere Client and that vCenter Operations Manager is open.
Procedure
1 In the inventory pane, select the object that you want to inspect.
38 VMware, Inc.
Page 39

2 Click the View tab under the Planning tab and select the Stressed Hosts and Clusters - List view.
The objects that appear in this view are overused and have fewer resources than the virtual machines
demand.
What to do next
Assign less work to these hosts and clusters or reconfigure the capacity appropriate to the workload.
Finding the Cause of the Problem
To find the cause of a problem, examine its symptoms, the objects affected, and the time frame.
Perform these main steps to research the cause of a problem.
1 Examine the symptoms on the Workload, Anomalies, and Faults badges and scores.
If workload is high, review performance degradation. In particular, examine memory resource problems
and the top consumers of resources.
If anomalies are high or the workload is abnormal, look for events that occurred when the objects
experienced the problem.
2 Determine the affected population.
Determine whether one object is affected, or whether peers or families are affected.
Chapter 4 Troubleshooting with vCenter Operations Manager
3 Determine the time frame of the problem.
Use the Health weather map and Stress charts to determine if the problem is recent and isolated or chronic
in nature.
n
Determine Whether the Environment Operates as Expected on page 40
Anomalies in vCenter Operations Manager provide insight into the behavior of your environment and
help you to determine whether a high workload might still reflect a normal or expected load.
n
Identify the Source of Performance Degradation on page 40
Identifying the probable source of performance degradation in vCenter Operations Manager involves
investigating the percentage of CPU, memory, disks, and network resources usage in the virtual
environment.
n
Identify the Underlying Memory Resource Problem for a Virtual Machine on page 41
When you navigate through a vCenter Operations Manager workflow and identify a virtual machine
with a potential problem, you can resolve the underlying problem by using the memory metric data.
n
Identify the Underlying Memory Resource Problem for Clusters and Hosts on page 42
When you navigate through a vCenter Operations Manager workflow and identify a cluster or a host
with a potential problem, check the CPU metric graphs to identify a possible resolution.
n
Identify the Top Resource Consumers on page 42
To address high use levels in your virtual environment, identify the top resource consumers.
n
Identify Events that Occurred when an Object Experienced Performance Degradation on page 43
Identifying when the abnormal events started to cause performance degradation and the trend of the
problem in vCenter Operations Manager involves examining the Health scores of the object and its
related objects.
n
Determine the Extent of a Performance Degradation on page 43
After you identify the performance problem, determine the effect on the rest of the object population and
the consistency of the issue.
VMware, Inc. 39
Page 40

VMware vCenter Operations Manager Getting Started Guide
n
Determine the Timeframe and Nature of a Health Issue on page 43
The Dashboard provides information to help you determine the nature and timeframe of a health issue,
including whether it is a transient or chronic problem.
n
Determine the Cause of a Problem with a Specific Object on page 44
Determining a cause of a problem with a specific object involves identifying whether the problem is
transient or chronic in the virtual environment.
Determine Whether the Environment Operates as Expected
Anomalies in vCenter Operations Manager provide insight into the behavior of your environment and help
you to determine whether a high workload might still reflect a normal or expected load.
By default, the Dashboard tab displays information about the World object. You can select another object in
the inventory pane to check for immediate health problems on the object. (You can also use the Search text box
at the upper right, entering part or all of the object's name, to locate an object.)
In the Anomalies pane, the blue line represents the actual level of anomalies for the selected object. The gray
line represents the noise threshold line that shows the normal level of anomalies for the selected object.
Prerequisites
In the vCenter Operations Manager interface, verify that the Dashboard tab is open.
Procedure
1 In the inventory pane, select the object that you want to inspect.
2 Click the arrow under the Health badge to expand the detailed view.
3 In the Anomalies pane, check the badge score and the noise threshold line.
If the blue line of the abnormal metric count is far below the noise line, the level of anomalies is normal.
If the blue line of abnormal metric count approaches or surpasses the noise line, the object might be
experiencing health degradation.
4 If you see an abnormal level of anomalies, click the Anomalies badge.
The Details tab opens and you can continue investigating the problem.
What to do next
On the Details tab under the Operations tab, you can check metric values to identify the resource that might
be causing the high Anomalies score. Depending on which resource indicates abnormal operation, check the
Key Metrics pane for further information.
Identify the Source of Performance Degradation
Identifying the probable source of performance degradation in vCenter Operations Manager involves
investigating the percentage of CPU, memory, disks, and network resources usage in the virtual environment.
Prerequisites
Verify that you are logged in to a vSphere Client and that vCenter Operations Manager is open.
Procedure
1 In the inventory pane, select the object that you want to inspect.
2 Click the Environment tab under the Operations tab, and select the Workload badge.
3 To filter the objects and related objects by state, click the Status Filter buttons to view only the red, orange,
and yellow states.
40 VMware, Inc.
Page 41

Chapter 4 Troubleshooting with vCenter Operations Manager
4 Point to the object state other than green to view the workload details.
5 Double-click a related object to investigate why it is experiencing heavy resource demands.
6 On the Details tab under the Operations tab, you can check the percentage of resource use that might be
causing the high Workload score.
7 To locate the available resources of the object and related objects, click the Scoreboard tab under the
Operations tab, and select the Workload badge.
The Scoreboard tab displays the workload scores for all ESX hosts in the cluster. By default, ESX hosts
with a high workload are presented as large badges.
8 To filter the objects and related objects by state, click the Status Filter buttons to view only the red, orange,
and yellow states.
9 Click the object that indicates a poor score.
10 On the Details tab under the Operations tab, review the Resources pane and the Workload graphs to
assess the potential capacity to move virtual machines to balance the workload.
What to do next
Click the Analysis tab to compare the performance of selected objects across the virtual infrastructure. You
can use this information to balance the load across ESX hosts and virtual machines.
Identify the Underlying Memory Resource Problem for a Virtual Machine
When you navigate through a vCenter Operations Manager workflow and identify a virtual machine with a
potential problem, you can resolve the underlying problem by using the memory metric data.
The CPU graphs for clusters and hosts show the Provisioned metric. The CPU graphs for virtual machines
show the Entitlement metric. See “Metric Concepts for vCenter Operations Manager,” on page 9.
Prerequisites
In the vCenter Operations Manager interface, verify that the Dashboard tab is open.
Procedure
1 In the inventory pane, select the object that you want to inspect.
2 Click the Environment tab under the Operations tab.
3 If the color of the badge is other than green, double-click it.
4 On the Details tab, select the Workload badge to analyze the memory metrics graphs.
Metric Relationship Meaning
Demand is equal to Usage
Demand is greater than Usage
Demand is greater than Usage and
less than Provisioned
Object has enough resources.
Virtual machine might be in the process of waiting for CPU cycles.
This metric relationship indicates the following implications:
n
Limits set on a virtual machine might cause the virtual machine to use
less CPU resources than the demand. vCenter Operations Manager
aggregates CPU metrics for virtual machines into the host CPU graph.
n
The CPU Dynamic Power Management in the BIOS might cause a CPU
issue. Verify that the setting is in operating system control mode or
disable the setting.
n
Virtual machines that are usually idle but happen to become busy at the
same time might cause contention.
VMware, Inc. 41
Page 42

VMware vCenter Operations Manager Getting Started Guide
Understand the metric relationships in the memory graphs and solve the underlying resource problem for the
virtual machine.
Identify the Underlying Memory Resource Problem for Clusters and Hosts
When you navigate through a vCenter Operations Manager workflow and identify a cluster or a host with a
potential problem, check the CPU metric graphs to identify a possible resolution.
vCenter Operations Manager presents memory information that shows the metric relationships and the
breakdown of the way the virtual machines use the memory resource.
Prerequisites
In the vCenter Operations Manager interface, verify that the Dashboard tab is open.
Procedure
1 In the inventory pane, select the object that you want to inspect.
2 Click the Environment tab under the Operations tab.
3 Click the Workload badge.
4 On the Details tab, analyze the memory metrics graphs for the virtual machine's workload.
Metric Relationship Meaning
Demand is less than Usage
Memory Reserved is less than
Memory Usable
Virtual machines that receive memory relinquish that memory only when
other virtual machines require it. The host does not reclaim memory from a
virtual machine just because that memory is not in demand.
It is acceptable for memory reservation to be less than usable memory.
However, you might want to increase the reservation to guarantee resources
in the range of normal demand.
What to do next
Understand the metric relationships in the CPU graphs and solve the underlying resource problem.
Identify the Top Resource Consumers
To address high use levels in your virtual environment, identify the top resource consumers.
Prerequisites
Verify that you are logged in to a vSphere Client and that vCenter Operations Manager is open.
Procedure
1 Click the Analysis tab to view the heat map gallery.
2 Depending on the resource, select a CPU, memory, network, or storage focus area.
3 To view a heat map that shows contention by use, select the host, virtual machine, or cluster object.
The larger the size of the heat map tile, the higher the use.
Click the Analysis tab to view the heat map gallery.
4 If a color other than green indicates a potential problem, click Details for the object in the pop-up window
to investigate the resources for that object.
What to do next
Identify the top consumers of resources such as CPU or memory.
42 VMware, Inc.
Page 43

Chapter 4 Troubleshooting with vCenter Operations Manager
Identify Events that Occurred when an Object Experienced Performance Degradation
Identifying when the abnormal events started to cause performance degradation and the trend of the problem
in vCenter Operations Manager involves examining the Health scores of the object and its related objects.
In the Events tab under the Operations tab, you can view graphs of health-related badge scores and events
that occurred on the selected object and its related objects. When you notice that the score of a badge changed
after an event occurred, you can click that event to view more details.
Prerequisites
Verify that you are logged in to a vSphere Client and that vCenter Operations Manager is open.
Procedure
1 In the inventory pane, select the object that you want to inspect.
2 If the color of the Health badge is other than green, click the Events tab under the Operations tab to see
events that occurred as far back as a month.
Use the buttons above the badge score graph to control what you see on the Events tab.
3 Point to the abnormal event in the Events graph to view the time range when the problem started to
decrease the possible causes that contributed to the poor badge score.
What to do next
Depending on the details of the event, investigate the problem in vCenter Server.
Determine the Extent of a Performance Degradation
After you identify the performance problem, determine the effect on the rest of the object population and the
consistency of the issue.
Prerequisites
Verify that you are logged in to a vSphere Client and that vCenter Operations Manager is open.
Procedure
1 In the inventory pane, select the object that you want to inspect.
2 Click the Health badge if it is other than green.
3 In the Related Objects pane of the Details tab, verify the color of the Parent Objects and Peer Objects
icons.
n
If the selected object is the only object with a high score, no effect exists on the Peer Objects or Child
Objects.
n
If the Parent Object is in a red, yellow, or orange state, click the Parent Object to investigate the details.
Determine the Timeframe and Nature of a Health Issue
The Dashboard provides information to help you determine the nature and timeframe of a health issue,
including whether it is a transient or chronic problem.
By default, the Dashboard tab displays information about the World object. You can select another object in
the inventory pane to check for immediate health problems on the object. (You can also use the Search text box
at the upper right, entering part or all of the object's name, to locate an object.)
VMware, Inc. 43
Page 44

VMware vCenter Operations Manager Getting Started Guide
Prerequisites
In the vCenter Operations Manager interface, verify that the Dashboard tab is open.
Procedure
1 In the Health pane, check whether the Weather Map of Health displays colors other than green. (The
weather map is most appropriate for grouped objects such as the World, vCenters, and Datacenters.)
Colors that dominate the map over the past six hours indicate a larger trend.
2 If a trend exists, click the Health badge.
The Details tab under the Operations tab appears.
3 To identify the type of problem an object has, click the Workload, Anomalies, or Faults badge and point
to the metric values for more information.
4 Click the Dashboard tab and expand the Risk pane to check the Stress graph.
The graph in the Stress pane displays the resource demand over the past week and helps you determine
when the peak demand occurred.
5 If a particular peak, such as a 6 p.m. peak, exists that might require investigation, click the Stress badge.
The Views tab under the Planning page appears.
What to do next
Click the Views tab under the Planning tab to investigate possible causes of the problem and assess resources
allocation.
Determine the Cause of a Problem with a Specific Object
Determining a cause of a problem with a specific object involves identifying whether the problem is transient
or chronic in the virtual environment.
Prerequisites
Verify that you are logged in to a vSphere Client and that vCenter Operations Manager is open.
Procedure
1 In the inventory pane, select the object that you want to inspect.
2 Check the Health, Risk and Efficiency scores for the object.
n
If any of the scores are in the yellow, orange or red state, click the badge and investigate the subbadges.
n
If the problem is because of Health, click the Anomalies badge to check for changes in expected
behavior and the Workload badge to assess whether heavy resource demand exists.
3 Determine whether the demand experienced is for a specific time or whether it indicates a longer trend.
n
If the demand is transient, in the Health pane check the Workload badge.
n
If the problem results from chronic stress, in the Risk pane, check the Stress badge and click the object
in the yellow, orange, or red state.
4 Click the Summary tab under the Planning tab to check the trend and forecast of CPU and memory
demand for that object.
If the object is approaching capacity, consider moving some virtual machines to a less resource-constrained
object.
44 VMware, Inc.
Page 45

Chapter 4 Troubleshooting with vCenter Operations Manager
5 Identify the top transient resource consumers, click the Scoreboard tab under the Operations tab, and
select the Workload badge.
6 To filter the objects and related objects by Workload, click the Status Filter buttons to view only the red,
orange, and yellow states.
You can prioritize the virtual machines with high Workload scores and move them to a less resourceconstrained object.
7 Identify the resource consumers causing chronic stress, click the Scoreboard tab under the Planning tab,
and select the Stress badge.
8 To filter the objects and related objects by Stress, click the Status Filter buttons to view only the red, orange,
and yellow states.
You can prioritize the virtual machines with high Stress scores and move them to a less resourceconstrained object.
What to do next
Identify a candidate object to which to move the problem virtual machines, click the Analysis tab, and select
the CPU orMemory focus area depending on the constrained resource for the virtual machine object.
The heat map gallery helps identify candidate objects to which to move the virtual machines.
Fix the Cause of the Problem
After you know the cause of a problem, you can take steps to resolve it, such as shifting or adding resources.
You can use the views in vCenter Operations Manager to diagnose a problem and decide how to solve it. You
can investigate and navigate to these views using the Capacity Remaining badge, which is a component of the
Risk badge.
You use the vSphere Client to make changes, such as adding a virtual machine or transferring a virtual machine
to another host.
Determine the Percentage of Used and Remaining Capacity to Assess Current Needs
The Capacity Remaining pane under the Risk badge provides an overview of the used and remaining capacity
for all objects in the inventory except for virtual machine objects.
You can use the bar chart under the Capacity Remaining badge to determine how many new virtual machines
you can add to your environment.
Prerequisites
In the vCenter Operations Manager interface, verify that the Dashboard tab is open.
Procedure
1 In the inventory pane, select the object that you want to inspect.
2 Click the arrow under the Risk badge to expand the detailed view.
3 Under the Capacity Remaining badge, review the bar chart of used and remaining capacity.
4 To view more details about capacity-related metrics, click the Capacity Remaining badge.
5 On the Views tab, you can switch views to find aggregate information for used and total capacity, and
capacity trends.
VMware, Inc. 45
Page 46

VMware vCenter Operations Manager Getting Started Guide
46 VMware, Inc.
Page 47

Assessing Risk and Efficiency in
vCenter Operations Manager 5
vCenter Operations Manager provides workflows for assessing efficient use of the infrastructure as well as
risks to future capacity.
Planning for capacity risk involves analyzing, optimizing, and forecasting data to determine how much
capacity is available and whether you make efficient use of the infrastructure.
This chapter includes the following topics:
n
“Analyzing Data for Capacity Risk,” on page 47
n
“Optimizing Data for Capacity,” on page 52
n
“Forecasting Data for Capacity Risk,” on page 56
Analyzing Data for Capacity Risk
vCenter Operations Manager provides using more than 20 predefined heat maps on the Analysis tab that you
can use to compare commonly used metrics. You can use this data to plan to reduce waste and increase capacity
in the virtual infrastructure.
Determine When an Object Might Run Out of Resources
The Time Remaining pane under the Risks badge provides a summary of when an object in the virtual
environment might run out of resources such as disk space, memory, CPU, or network.
Prerequisites
Verify that you are logged in to a vSphere Client and that vCenter Operations Manager is open.
Procedure
1 In the inventory pane, select the object that you want to inspect.
2 Click the Risk tab under the Dashboard tab, and click the arrow under the badge to expand the detailed
view.
3 In the Time Remaining pane, identify the resource that is approaching capacity.
4 Click the Summary tab under the Planning tab.
5 In the Objects and Resources pane, view a breakdown of the remaining capacity and trend information
for each resource.
The Time Remaining value represents an aggregated forecast based on the number of virtual machines
and indicates when capacity might equal resource use.
VMware, Inc.
47
Page 48

VMware vCenter Operations Manager Getting Started Guide
What to do next
To further investigate which resources constrain the virtual machine count, click the Views tab and select the
Virtual Machine Capacity - Summary view.
Identify Clusters with the Space for Virtual Machines
Identify the clusters in a datacenter that have space for your next set of virtual machines.
Prerequisites
Verify that you are logged in to a vSphere Client and that vCenter Operations Manager is open.
Procedure
1 Click the Analysis tab.
2 In the heat map gallery, narrow the scope from the drop-down menu to display the remaining capacity
for clusters.
Option Action
Focus Area
Smallest Box Shows
Description
3 Click the Which clusters have the most free capacity and least stress? view.
Select Capacity.
Select Cluster.
Select Which clusters have the most free capacity and least stress?.
4 In the heat map, point to each cluster area to view the percentage of remaining capacity.
5 If a color other than green indicates a potential problem, click Details in the pop-up window to investigate
the resources for the cluster or datacenter.
What to do next
Identify the green clusters with the most capacity to store virtual machines.
Investigating Abnormal Host Health
Identifying the source of a performance problem with a host involves investigating its workload.
Prerequisites
Verify that you are logged in to a vSphere Client and that vCenter Operations Manager is open.
Procedure
1 In the inventory pane, select the object that you want to inspect.
2 Click the Analysis tab.
3 In the heat map, narrow the scope from the drop-down menu to display the cluster and host health sized
according to workload.
Option Action
Focus Area
Smallest Box Shows
Description
4 Click the Which hosts currently have the most abnormal Workload? view.
Section Health.
Section Host.
Section Which hosts currently have the most abnormal Workload?.
48 VMware, Inc.
Page 49

Chapter 5 Assessing Risk and Efficiency in vCenter Operations Manager
5 In the heat map, point to the cluster area to view the percentage of remaining capacity.
A color other than green indicates a potential problem.
6 Click Details for the ESX host in the pop-up window to investigate the resources for that host.
What to do next
Adjust workloads to balance resources as necessary.
Identify Datastores with Space for Virtual Machines
Identify the datastores that have the most space for your next set of virtual machines.
Prerequisites
Verify that you are logged in to a vSphere Client and that vCenter Operations Manager is open.
Procedure
1 Click the Analysis tab.
2 In the heat map gallery, narrow the scope from the drop-down menu to display the datastore space.
Option Action
Focus Area
Smallest Box Shows
Description
3 Click Which datastores have the highest disk space overcommitment and lowest time remaining?
Select Storage.
Select Datastore.
Select Which datastores have the highest disk space overcommitment and
lowest time remaining?
4 In the heat map, point to each datacenter area to view the space statistics.
5 If a color other than green indicates a potential problem, click Details for the datastore in the pop-up
window to investigate the disk space and disk I/O resources.
What to do next
Identify the datastores with the largest amount of available space for virtual machines.
Identify Datastores with Wasted Space
Identify datastores with the highest amount of wasted space that you can reclaim to improve the efficiency of
your virtual infrastructure.
Prerequisites
Verify that you are logged in to a vSphere Client and that vCenter Operations Manager is open.
Procedure
1 Click the Analysis tab.
2 In the heat map gallery, narrow the scope from the drop-down menu to display the datastore waste.
Option Action
Focus Area
Smallest Box Shows
Description
3 Click the Which datastores have the most wasted space and total space usage? view.
Select Storage.
Select Datastore.
Select Which datastores have the most wasted space and total space usage?
VMware, Inc. 49
Page 50

VMware vCenter Operations Manager Getting Started Guide
4 In the heat map, point to each datacenter area to view the waste statistics.
5 If a color other than green indicates a potential problem, click Details for the datastore in the pop-up
window to investigate the disk space and disk I/O resources.
What to do next
Identify the red, orange, or yellow datastores with the highest amount of wasted space.
Address a Problem with a Specific Virtual Machine
Identifying the cause of a problem with a specific virtual machine involves investigating whether the problem
is because of a constraining environment or because of changes in the guest operating system configuration.
Prerequisites
Verify that you are logged in to a vSphere Client and that vCenter Operations Manager is open.
Procedure
1 Search for the problematic virtual machine name in the vCenter Operations Manager search box.
2 Check the Health, Risk and Efficiency scores for the virtual machine.
n
If any of the badges are in the yellow, orange or red state, click the badge and investigate the
subbadges.
n
If the problem is because of Health, check the Anomalies badge for changes in expected behavior and
the Workload badge to assess whether heavy resource demand exists.
n
If the problem results from chronic stress, identify the constraining resource, such as CPU or memory,
and click the Stress badge under the Riskpane for more information.
3 Click the Summary tab under the Planning tab to check the trend and forecast of CPU and memory
demand for that virtual machine and the host that stores it.
If the forecast indicates a virtual machine resource demand problem, increase the resources allocated to
the virtual machine.
4 Identify an object candidate to which to move the virtual machines, click the Analysis tab, and select the
CPU or memory focus areas depending on the constrained resource for the virtual machine.
The heat map gallery helps identify cluster or host candidates to which to move the virtual machines.
5 If the problem results from changes to the guest operating system configuration, click the Events tab under
the Operations tab for that virtual machine.
6 Examine the Events graph to see if the guest operating system change events or vSphere events caused
the problem.
The guest change events will have a different icon shape.
Identify the Virtual Machines with Resource Waste Across Datastores
Identify the virtual machines that waste resources because of idle, oversized, or powered off virtual machine
states or because of snapshots.
Prerequisites
Verify that you are logged in to a vSphere Client and that vCenter Operations Manager is open.
Procedure
1 Click the Analysis tab.
50 VMware, Inc.
Page 51

Chapter 5 Assessing Risk and Efficiency in vCenter Operations Manager
2 In the heat map gallery, narrow the scope from the drop-down menu to display the virtual machines with
waste across datastores.
Option Action
Focus Area
Smallest Box Shows
Description
Select Storage.
Select VM.
Select For each datastore, which VMs have the most wasted disk space?
3 Click the For each datastore, which VMs have the most wasted disk space? view.
4 In the heat map, point to each virtual machine to view the waste statistics.
5 If a color other than green indicates a potential problem, click Details for the virtual machine in the pop-
up window to investigate the disk space and disk I/O resources.
What to do next
Identify the red, orange, or yellow virtual machines with the highest amount of wasted space.
Address a Problem with a Specific Datastore
Identifying the cause of a problem with a specific datastore involves investigating the I/O intensive virtual
machines that adversely affect the disk space.
Prerequisites
Verify that you are logged in to a vSphere Client and that vCenter Operations Manager is open.
Procedure
1 Search for the problematic datastore name in the vCenter Operations Manager search box.
2 Check the Health, Risk and Efficiency scores for the datastore.
3 If the Risk badge shows that disk I/O is approaching capacity, click the Summary tab under the
Planning tab to view the forecast of resources and constrained resources.
a On the Analysis tab, select the Storage focus area and the Datastore object to view Datastore I/O
Contention Sized by I/O Usage Grouped by Datastore candidates that can accommodate the large
disk I/O virtual machines.
b Move the disk I/O intensive virtual machines to another datastore.
4 If the datastore shows that disk space is approaching capacity, click the Summary tab under the
Planning tab to view the breakdown of the resource capacity usage.
If snapshots occupy a significant amount of disk space, remove snapshots from some of the virtual
machines on the datastore.
5 On the Analysis tab, select the Storage focus area and click Which datastores have the most wasted space
and total space usage? to list the virtual machines in the datastore.
What to do next
Filter the virtual machines in the red, orange, and yellow states to identify the virtual machines that waste the
most disk space.
Identify the Host and Datastore with the Highest Latency
Identify the host and datastore pair with the highest latency to prevent a potential performance problem.
The heat map statistics for host I/O contention measure the latency or the time it takes to gain access to a
resource.
VMware, Inc. 51
Page 52

VMware vCenter Operations Manager Getting Started Guide
Prerequisites
Verify that you are logged in to a vSphere Client and that vCenter Operations Manager is open.
Procedure
1 Click the Analysis tab.
2 In the heat map gallery, narrow the scope from the drop-down menu to display the datastore waste.
Option Action
Focus Area
Smallest Box Shows
Description
3 Click theFor each datastore, which hosts currently have the highest I/O usage and latency? view.
4 In the heat map, point to each datacenter area to view the latency statistics.
What to do next
Identify the host and datastore pair with the highest latency. Then determine how many hosts are using the
datastore. If only one VM is using the datastore, or if more than one is but none of the others have high latency,
there might be a problem with the host. Find out which VMs are on the host and what their storage usage is.
If there are multiple hosts and they all are red, there might be a population pressure problem on the datastore.
If this is the case, you should consider relocating some VMs.
Select Storage.
Select Host.
Select For each datastore, which hosts currently have the highest I/O usage
and latency?
Optimizing Data for Capacity
Optimizing data for capacity in vCenter Operations Manager involves finding opportunities for resource
optimization and cost savings.
Determine How Efficiently You Use the Virtual Infrastructure
Determining the efficiency of the vCenter Operations Manager virtual infrastructure involves investigating
the optimal, waste, and stressed virtual machines.
Prerequisites
In the vCenter Operations Manager interface, verify that the Dashboard tab is open.
Procedure
1 In the inventory pane, select the object that you want to inspect.
2 Click the arrow under the Efficiency badge to expand the detailed view.
The Efficiency pane displays the subbadges for Reclaimable Waste and Density.
What to do next
Examine the Reclaimable Waste and Density subbadge colors to identify whether resources are underused
or partially consolidated.
Depending on your findings, you can investigate possible opportunities to improve efficiency.
52 VMware, Inc.
Page 53

Chapter 5 Assessing Risk and Efficiency in vCenter Operations Manager
Identify the Consolidation Ratio Trend for a Datacenter or Cluster
The consolidation ratio trend of a datacenter or cluster helps you understand the behavior and performance
of your virtual machines and applications.
Prerequisites
Verify that you are logged in to a vSphere Client and that vCenter Operations Manager is open.
Procedure
1 In the inventory pane, select the object that you want to inspect.
2 Click the arrow under the Efficiency badge to expand the detailed view.
3 In the Density pane, compare the consolidation ratio trend in the VM : Host Ratio and the vCPU : CPU
Ratio graphs.
If the ratios are below the optimal rate, the resource consolidation is low.
What to do next
To further investigate opportunities to optimize resource consolidation, click the Views tab under the
Planning tab.
Determine Reclaimable Resources from Underused Objects
Determining reclaimable resources in vCenter Operations Manager involves identifying the objects that are
underused.
Reclaimable waste is calculated for each resource type like CPU, memory, and disk, for each object in the virtual
environment.
Prerequisites
Verify that you are logged in to a vSphere Client and that vCenter Operations Manager is open.
Procedure
1 In the inventory pane, select the object that you want to inspect.
2 Click the arrow under the Efficiency badge to expand the detailed view.
3 In the Reclaimable Waste pane, identify the CPU, memory, and disk resources that are underused and
click the Reclaimable Waste badge.
4 In the Views tab, select the Undersized Virtual Machines - List view.
What to do next
Identify the virtual machines that are underused and provision fewer resources for them (or delete them).
Assess Virtual Machine Capacity Use
Identify optimization opportunities for a single virtual machine with vCenter Operations Manager.
Prerequisites
Verify that you are logged in to a vSphere Client and that vCenter Operations Manager is open.
Procedure
1 In the inventory pane, select the object that you want to inspect.
VMware, Inc. 53
Page 54

VMware vCenter Operations Manager Getting Started Guide
2 Click the Views tab under the Planning tab and select Virtual Machine Capacity Usage - Summary.
If the Host CPU and Memory use is high, the virtual machine does not have enough capacity to perform
assigned work.
What to do next
Determine whether you can optimize performance for this virtual machine by assigning capacity to match
typical load demand. If the virtual machine is powered off or idle, you can decommission the virtual machine
to reclaim unused capacity.
Implement a strategy for optimizing use of this virtual machine based on the information you obtain from the
view. Save your results by exporting the information to an export file.
Assess Virtual Machine Optimization Data
To optimize data with vCenter Operations Manager, identify overused and underused virtual machines for a
selected object.
A virtual machine can be oversized in memory and undersized in CPU or the reverse.
vCenter Operations Manager counts the virtual machine in both the oversized virtual machine count and in
the undersized virtual machine count.
This double counting can be misleading because you might expect the values for powered-off, undersized,
oversized, and idle virtual machines to add up to the total virtual machine value.
Prerequisites
Verify that you are logged in to a vSphere Client and that vCenter Operations Manager is open.
Procedure
1 In the inventory pane, select the object that you want to inspect.
2 Click the Views tab under the Planning tab and select Virtual Machine Optimization - Summary.
3 Examine the Total Virtual Machines, Powered-Off Virtual Machines, Undersized Virtual Machines,
Oversized Virtual Machines, and Idle Virtual Machines values to determine how many machines assigned
to this object can be optimized.
Table 5-1. Example of Virtual Machine Optimization - Summary
Virtual Machine Type Number
Total Virtual Machines 12
Powered-Off Virtual Machines 0
Undersized Virtual Machines 6
Oversized Virtual Machines 6
Idle Virtual Machines 1
Identify Powered-Off Virtual Machines to Optimize Data
Powered-off virtual machines in your infrastructure are resources with capacity that you can reclaim.
Prerequisites
Verify that you are logged in to a vSphere Client and that vCenter Operations Manager is open.
Procedure
1 In the inventory pane, select the object that you want to inspect.
54 VMware, Inc.
Page 55

Chapter 5 Assessing Risk and Efficiency in vCenter Operations Manager
2 Click the arrow under the Efficiency badge to expand the detailed view.
3 In the Reclaimable Waste pane, identify the powered off virtual machines and delete the virtual click the
Reclaimable Waste badge.
4 In the Views tab, select the Powered-Off Virtual Machines view.
The virtual machines that appear in this view are powered off and you can restart the machines in the
vSphere Client.
What to do next
In the vSphere Client, determine why the virtual machine is powered off. If the virtual machine is obsolete,
you can remove it from the inventory.
Identify Idle Virtual Machines to Optimize Capacity
Optimizing the capacity in the virtual environment involves identifying idle virtual machines that are powered
on but not in use.
Prerequisites
Verify that you are logged in to a vSphere Client and that vCenter Operations Manager is open.
Procedure
1 In the inventory pane, select the object that you want to inspect.
2 Click the arrow under the Efficiency badge to expand the detailed view.
3 In the Reclaimable Waste pane, identify the powered off virtual machines and click the Reclaimable
Waste badge.
4 In the Views tab, select the Idle Virtual Machines - List view.
The idle virtual machines in this view either do not perform any work or perform below a specified
threshold.
5 Select theOversized Virtual Machines - List view to evaluate candidate objects that can receive more
work.
Identify Oversized Virtual Machines to Optimize Data
To optimize and right-size the capacity for your virtual environment, identify the oversized virtual machines
and assign less capacity to those virtual machines.
Prerequisites
Verify that you are logged in to a vSphere Client and that vCenter Operations Manager is open.
Procedure
1 In the inventory pane, select the object that you want to inspect.
2 Click the arrow under the Efficiency badge to expand the detailed view.
3 In the Views tab, select the Oversized Virtual Machines - List view.
The virtual machines that appear in this view are underused and have more capacity than is required for
the workload.
4 To determine how to update the CPU, check the value in the Recommended vCPU column.
5 (Optional) To examine a datacenter, run a Capacity Overview Report from the Reports tab.
VMware, Inc. 55
Page 56

VMware vCenter Operations Manager Getting Started Guide
What to do next
Assign more work to the underused virtual machines or reconfigure the capacity appropriate to the virtual
machine load.
Determine the Trend of Waste for a Virtual Machine
To optimize the capacity for your virtual environment, determine the trend of powered off, idle, undersized,
and oversized virtual machines over a period of time to help you identify wasted resources.
Prerequisites
Verify that you are logged in to a vSphere Client and that vCenter Operations Manager is open.
Procedure
1 In the inventory pane, select the object that you want to inspect.
2 Click the Views tab under the Planning tab and select the Virtual Machine Waste and Stress -Trend
view.
The CPU, memory, disk I/O, and network resources trend charts appear in this view.
3 (Optional) To view the object resource data in a list, click the Table link.
4 To view the object resource data interval, select the timeframe from the Interval drop-down menu and
click Update.
What to do next
Depending on the trend of wasted resources, reconfigure the capacity to be appropriate for the virtual machine
load.
Forecasting Data for Capacity Risk
Forecasting data for capacity risk in vCenter Operations Manager involves creating capacity scenarios to
examine the demand and supply of resources in the virtual infrastructure.
A what-if scenario is a supposition about how capacity and load change if certain conditions are changed,
without making actual changes to your virtual infrastructure. If you implement the scenario, you know in
advance what your capacity requirements are.
NOTE The What-if Scenario wizard is accessible only if you select a host or a cluster in the inventory pane.
vCenter Operations Manager assigns names, such as Add 1 New VM, to scenarios. The What-if Scenarios pane
refreshes as each new scenario is applied in the view results. Scenarios persist until you delete them or until
you refresh vCenter Operations Manager.
Create Capacity Scenarios for Virtual Machines With New Profiles
Virtual machine scenarios assess the consequences of adding a new virtual machine to a cluster or host without
applying actual changes to your virtual environment.
To help you make configuration selections for virtual machines, the right pane of the What-If Scenario wizard
contains population information that shows the total virtual machine use of the selected object and
representative virtual machine data. vCenter Operations Manager calculates virtual machine data by
partitioning the range of capacity for CPU, memory, and disk dimensions into thirds, assigning the virtual
machines to bins based on configuration, and creating a profile for each bin where the capacity of the profile
56 VMware, Inc.
Page 57

Chapter 5 Assessing Risk and Efficiency in vCenter Operations Manager
is the maximum configuration of the virtual machines in the bin and the use of the profile is the average usage
of the virtual machines in the bin. The value of the virtual machines assigned to the profile and the use is the
average of the virtual machines assigned to the profile. The right pane includes information on the smallest
and largest hosts.
For information about relevant CPU and memory maximums, see the VMware vSphere documentation.
NOTE The What-if Scenario wizard is accessible only if you select a host or a cluster in the inventory pane.
Prerequisites
In vCenter Operations Manager, verify that the Summary tab under the Planning tab is open.
Procedure
1 Select the destination object in the inventory pane.
The destination object is a cluster or host where you locate the new virtual machines if you implement
your scenario.
2 Click the New what-if scenario link.
The What-If Scenario wizard opens.
3 Select a view for the scenario and click Next.
This step is not available if you opened the What-if Scenario wizard from the Views tab.
4 On the Change Type page, select Virtual machines and click Next.
5 Select Add virtual machines by specifying profile of new virtual machines and click Next.
6 Set the virtual machine count and the configuration for the virtual machine.
Option Description
vCPU Configuration
vCPU Utilization
vCPU Reservation
vCPU Limit
Memory Reservation
Memory Limit
Virtual Disk Type
Virtual Disk Linked Clone
Virtual Disk Configuration
Virtual Disk Utilization
Number of virtual CPU cores that a target virtual machine will have,
followed by the target processor core speed, in GHz or MHz.
Expected average CPU use for this virtual machine.
Required minimum of CPU resources that the virtual machine must have.
Amount of maximum CPU resources that the virtual machine can use.
Required minimum of memory for this virtual machine.
Amount of maximum memory that the destination virtual machine can have.
Thin or Thick disk configuration.
You might apply thin disk provisioning when you start with only the
necessary partition and plan to grow it over time.
Shared space that uses linked clones.
Linked clones involve delta disks that reference a master disk rather than a
full copy of the entire virtual hard disk. For thick disks with linked clones,
vCenter Operations Manager calculates linked clone capacity as one master
copy that uses 100 percent of the specified disk size and the remaining copies
use 10 percent delta disks. For thin disks with linked clones,
vCenter Operations Manager uses the same calculation but the disk size
multiplied by the use percentage defines the master copy size.
Disk size.
Expected average disk use for the virtual machine.
The use percentage applies only to thin disks.
vCenter Operations Manager does not require you to specify the disk I/O and network I/O use of the new
virtual machines, and instead uses the average disk I/O and network I/O use across virtual machines in
the host or cluster as an estimation of the new virtual machine use.
VMware, Inc. 57
Page 58

VMware vCenter Operations Manager Getting Started Guide
7 Click Next when your configuration selections are complete.
8 On the Ready to Complete page, check the parameters of your what-if scenario and click Finish to view
the outcomes.
vCenter Operations Manager applies the scenario to the view you selected and shows current capacity
compared to the expected capacity if you add the virtual machines to the target object.
Create Capacity Scenarios for Virtual Machines With Existing Profiles
You can create a scenario that uses profiles of existing virtual machines as models to simulate adding one or
more new virtual machines to a host or a cluster.
To help you make configuration selections for virtual machines, the right pane of the What-If Scenario wizard
contains population information that shows the total virtual machine use of the selected object and
representative virtual machine data. vCenter Operations Manager calculates virtual machine data by
partitioning the range of capacity for CPU, memory, and disk dimensions into thirds, assigning the virtual
machines to bins based on configuration, and creating a profile for each bin where the capacity of the profile
is the maximum configuration of the virtual machines in the bin and the use of the profile is the average usage
of the virtual machines in the bin. The value of the virtual machines assigned to the profile and the use is the
average of the virtual machines assigned to the profile. The right pane includes information on the smallest
and largest hosts.
For information about relevant CPU and memory maximums, see the VMware vSphere documentation.
NOTE The What-if Scenario wizard is accessible only if you select a host or a cluster in the inventory pane.
Prerequisites
In vCenter Operations Manager, verify that the Summary tab under the Planning tab is open.
Procedure
1 Select the destination object in the inventory pane.
The destination object is a cluster or host where you locate the new virtual machines if you implement
your scenario.
2 Click the New what-if scenario link.
The What-If Scenario wizard opens.
3 Select a view for the scenario and click Next.
This step is not available if you opened the What-if Scenario wizard from the Views tab.
4 On the Change Type page, select Virtual machines and click Next.
5 Select Add virtual machines using profiles of existing virtual machines as models and click Next.
6 Select existing virtual machines from the list to use as profiles for the new virtual machines.
The list of the existing virtual machines applies to the datacenter of the selected object. The Datacenter
and the Cluster or Host drop-down menus narrow the scope of the virtual machine list. The list provides
CPU, memory, and disk information such as the used space and the use of thin disks or linked clones.
7 Click Next.
8 To duplicate any virtual machines, increase the virtual machine count and click Next.
9 On the Ready to Complete page, check the parameters of your what-if scenario and click Finish to view
the outcomes.
58 VMware, Inc.
Page 59

Chapter 5 Assessing Risk and Efficiency in vCenter Operations Manager
vCenter Operations Manager applies the scenario to the view you selected and shows current capacity
compared to the expected capacity if you add the virtual machines to the target object.
What to do next
If you have more than one scenario for a view, you can combine and compare the outcomes. To save the
information, export the scenario results.
Create a Hardware Change Scenario
Before you purchase new hardware, you can create hardware change scenarios to determine if the purchase
is necessary. To determine the effect of adding, removing, or updating the hardware capacity in a cluster, create
a scenario that models changes to hosts and datastores.
Prerequisites
In vCenter Operations Manager, verify that the Summary tab under the Planning tab is open.
Procedure
1 Select the target host in the inventory panel.
The target host is where you simulate changes to the environment to examine possible outcomes.
2 Click the New what-if scenario link.
3 Select a view for the scenario and click Next.
This step is not available if you opened the What-if Scenario wizard from the Views tab.
4 On the Change Type page, select Hosts & Datastores and click Next.
5 Use the buttons to add, remove, or restore hosts in the host list.
Actions are applied only to hosts that you selected using the check boxes in the hosts list.
6 Click host rows to change the physical resources and click Save.
You can use the text boxes and drop-down menus to modify the CPU capacity and the memory size of
the selected host.
Option Description
CPU Total
Memory Total
Number of CPU cores that a target single host will have, followed by the
target processor core speed.
Amount of memory that the target host profile will have.
7 Click Next.
8 Use the buttons to add, remove, or restore datastores in the datastores list.
Actions are applied only to datastores that you selected using the check boxes in the datastores list.
9 Click datastore rows to modify the disk size and click Save.
The Population Details pane to the right contains information about the actual datastore capacity, the disk
I/O use, and the number of hosts that link the datastore. The sharing status indicates whether different
hosts share the datastore.
10 Click Next.
11 On the Ready to Complete page, check the parameters of your what-if scenario and click Finish to view
the outcomes.
VMware, Inc. 59
Page 60

VMware vCenter Operations Manager Getting Started Guide
vCenter Operations Manager applies the scenario to the view that you selected. The scenario forecast appears
in the chart as a gray dotted line. You can compare the actual current capacity to the expected capacity if you
apply the changes you specified in the hardware change scenario.
What to do next
If you have more than one scenario, you can combine or compare the scenario outcomes. You can export the
scenario results to an Adobe PDF or CSV file to save the information.
Create a What-If Scenario to Remove Virtual Machines
You can create a scenario that simulates removing a virtual machine or group of virtual machines from a host
or a cluster.
Prerequisites
In vCenter Operations Manager, verify that the Summary tab under the Planning tab is open.
Procedure
1 Select the target object in the inventory panel.
The target object identifies the host or the cluster from which the virtual machines are removed if you
implement your scenario.
2 Click the New what-if scenario link.
3 Select a view for the scenario and click Next.
This step is not available if you opened the What-if Scenario wizard from the Views tab.
4 On the Change Type page, select Virtual machines and click Next.
5 Select Remove virtual machines and click Next.
6 On the Configuration page, select the virtual machines to remove from the selected host or cluster and
click Next.
7 On the Ready to Complete page, check the parameters of your what-if scenario and click Finish to view
the outcomes.
vCenter Operations Manager applies the scenario to the view that you selected. The forecasted capacity appears
in the chart as a gray dotted line. You can compare the current capacity to the expected capacity if you remove
the virtual machines from the target object.
What to do next
If you have more than one scenario, you can combine or compare the scenario outcomes. You can export the
scenario results to an Adobe PDF or CSV file to save the information.
Combine the Results of What-If Scenarios
You can combine the results of all what-if scenarios to assess their cumulate effect on your environment.
The list of scenarios that you created appears in the What-If Scenarios pane under the Legend pane.
Prerequisites
In vCenter Operations Manager, verify that the Views tab under the Planning tab is open.
Verify that you have created at least two what-if scenarios.
60 VMware, Inc.
Page 61

Chapter 5 Assessing Risk and Efficiency in vCenter Operations Manager
Procedure
1 In the What-If Scenarios pane, select Combine from the drop-down menu.
The combined values for all what-if scenarios appear as dotted lines in the Forecasted area of the view.
2 To view aggregate scenario values in tabular form, click the Table link.
What to do next
You can compare the results of different what-if scenarios to determine the best course of action.
Compare the Results of What-If Scenarios
You can compare a scenario result to the actual capacity of your environment and to other scenario results and
determine the best course of action.
The list of scenarios that you created appears in the What-If Scenarios pane under the Legend pane.
Prerequisites
In vCenter Operations Manager, verify that the Views tab under the Planning tab is open.
Procedure
1 In the What-If Scenarios pane, select Compare from the drop-down menu.
Existing data and scenario data appear in different line styles in the Forecasted area of the view.
2 (Optional) To view scenario results in tabular form, click the Table link.
The table view contains separate columns to show the effect of the simulated change.
What to do next
You can combine scenario results to assess the cumulative effect of all scenarios.
Delete a Scenario from the What-If Scenarios List
You can remove scenarios in the What-If Scenarios pane if you do not need them.
The list of scenarios that you created appears in the What-If Scenarios pane under the Legend pane.
When you finish examining a what-if scenario, you can delete it.
Prerequisites
In vCenter Operations Manager, verify that the Views tab under the Planning tab is open.
Procedure
1 To delete a what-if scenario, click the X icon to the right of the scenario name.
A confirmation dialog box opens.
2 Click Yes to confirm the deletion and return to the Views tab.
vCenter Operations Manager refreshes the view in the Details pane to remove the data from the scenario.
VMware, Inc. 61
Page 62

VMware vCenter Operations Manager Getting Started Guide
62 VMware, Inc.
Page 63

Working with Faults and Alerts 6
vCenter Operations Manager generates alerts when events occur on the monitored objects, when data analysis
indicates deviations from normal metric values, or when a problem occurs with one of the
vCenter Operations Manager components. Events that the vCenter Server publishes are the main source for
faults.
This chapter includes the following topics:
n
“Events that Generate Faults,” on page 63
n
“Monitoring Alerts in vCenter Operations Manager,” on page 64
Events that Generate Faults
Problem events and problem remediation events generate faults.
Events that the vCenter Server publishes are the main source for faults. These events might originate in the
vCenter Server itself, or ESX servers might generate them and the vCenter Server publishes them externally.
Only a subset of vCenter events are considered as important for fault generation.
Faults are collected by the vCenter adapter for vCenter Operations Manager. During normal operation, fault
events are collected every 5 minutes by the vCenter adapter.
If the Faults badge of an object has a high score, you can use the information from the Details tab to troubleshoot
and resolve the faults. For information about a particular fault for an object, see the help topic for the fault
event on that type of object.
Problem Events
Problem events indicate the occurrence of a fault scenario. vCenter Operations Manager computes a fault badge
score and creates an alert for the problem event. The greater the severity of the problem, the higher the fault
badge score that is computed. An example of this type of event is Host Connectivity Lost, which occurs on a
host object. This event indicates that the vCenter Server cannot communicate to the host. More than one event
might result from the same problem or type of fault.
Remediation or Clear Events
Remediation, or clear, events communicate resolution of a problem. Upon receiving a remediation or clear
event, vCenter Operations Manager resets the fault score and clears or cancels the associated alert. An example
of this type of event is Connected to Host, Connected to Host, which indicates that communication between
the vCenter Server and the host is active again.
VMware, Inc.
63
Page 64

VMware vCenter Operations Manager Getting Started Guide
Device-Specific Faults
Faults occur on a resource, but at times can represent a problem that is more specific. For example, a vSphere
host can lose network connectivity, but the problem is also specific to a NIC within the host. Another example
is when a vSphere host loses connectivity to a storage device. The fault manifests itself on the host, but it is
also specific to the storage device to which the connectivity was lost.
These types of device-specific faults are a subcategory of problem events. Device-specific faults exhibit a unique
behavior. A fault alert of this type consists of all devices exhibiting the problem. This list of devices changes
dynamically, based on devices entering and leaving the problem state. The fault state is restored when no
devices exhibit a problem. This behavior ensures that the fault on a resource is cleared only if all traces of the
problem are resolved completely.
For example, consider a host with two physical NICs, A and B. Network connectivity on NIC A is lost.
vCenter Operations Manager creates a fault with NIC A listed as an affected device. If NIC B encounters the
same problem, it is added to the device list on the already created fault. Whenever NIC A or NIC B have a
restored connection, they are removed from the fault, and the fault is cleared after both NICs are connected.
The behavior of device-specific faults is completely different from that of alarms in vCenter Server. vCenter
alarms are agnostic to devices and are generic. They are created and cleared regardless of which devices have
a problem. This vCenter Server alarm behavior can lead to discrepancies between vCenter alarms and
vCenter Operations Manager faults.
Monitoring Alerts in vCenter Operations Manager
The alerts workflow in a vCenter Operations Manager virtual environment involves identifying alerts to
respond to, maintaining alerts, and identifying alert trends.
Alerts in vCenter Operations Manager are available for all of the minor badges. Alert messages provide an
alternate path to identify and resolve issues.
What Is an Alert in vCenter Operations Manager
vCenter Operations Manager generates alerts when events occur on the monitored objects, when data analysis
indicates deviations from normal metric values, or when a problem occurs with one of the
vCenter Operations Manager components.
The Alert Volume Chart
The Alert Volume chart is a graphical representation of the number of alerts that were activated during the
last 7 days. The color coding in the graph represents the level of criticality of alerts.
Alert Icon Description
Critical alert. You must act immediately.
Immediate alert. Act as soon as possible.
Warning alert. Check the condition of the selected object.
Information alert.
The Alert Volume chart helps you visually assess what is the overall volume of alerts triggered in your
environment, what is the ratio between alerts of different criticality, and what criticality level prevails in your
environment.
64 VMware, Inc.
Page 65

Chapter 6 Working with Faults and Alerts
Types of Alerts
vCenter Operations Manager generates several types of alerts. Double-click alerts in the list to view the alert
details.
Badge Score Alerts
Fault Alerts
Administrative Alerts
Badge score alerts are triggered when a badge changes its color. Badge colors
change based on the hard thresholds that you set in the Configuration dialog
box. Alerts can be triggered for the Workflow, Anomalies, Time Remaining,
Capacity Remaining, Stress, Waste, and Density badges. You can select which
badges activate alerts in the Configuration dialog box.
NOTE You cannot cancel badge score alerts.
The color of the Faults badge changes based on the number of events that
occurred in the virtual infrastructure that you monitor.
vCenter Operations Manager does not weigh the importance of events, and the
Faults badge color might remain unchanged if a single event occurs. As a result,
you might miss an isolated, but critical fault event that occurred on the vCenter
Server. Therefore, fault alerts are triggered when an individual event occurs
and are not related to the color of the Faults badge. You can enable and disable
fault alerts in the Configuration dialog box.
NOTE Only fault alerts can be cancelled in vCenter Operations Manager.
Administrative alerts are displayed only when the World object is selected
in the navigation tree. Administrative alerts are related to problems on the
vCenter Operations Manager system and virtual environment and do not affect
monitored objects, but affect the proper operation and data collection of the
application.
Administrative alerts can be two types: system and environment. If any
administrative alerts are present, a purple notification icon appears in the
vertical alert pane on the far right. If the number of administrative alerts is zero,
the icon is not present. The following table lists the alert icons.
Administrative Alert
Alert Icon
Type Description
Notification One or more administrative alerts has occurred.
System alert A component of the
vCenter Operations Manager application has
failed.
Environment alert vCenter Operations Manager has stopped
receiving data from one or more resources. This
might indicate a problem with the resource or the
network infrastructure.
NOTE You cannot cancel administrative alerts.
VMware, Inc. 65
Page 66

VMware vCenter Operations Manager Getting Started Guide
External Alert Notifications
An administrator can configure vCenter Operations Manager to send email and SNMP notifications when an
alert triggers. SMTP and SNMP notifications are set on the vCenter Operations Manager Administration Web
page. The URL format is https://VM-IP/admin/, where VM-IP is the IP address or fully qualified host name of
the UI VM virtual machine that is part of the vCenter Operations Manager virtual appliance.
Filter Alerts to Identify Notifications
Filter the alerts in your virtual environment to easily identify notifications by time, severity, and duration.
Prerequisites
Verify that you are logged in to a vSphere Client and that vCenter Operations Manager is open.
Procedure
1 In the inventory pane, select the object that you want to inspect.
2 Click the Alerts tab to view a list of active alerts.
3 In the Alerts list, filter the alerts by columns or select an alert icon.
Option Action
To view the most critical alerts that
need immediate attention.
To filter badge alerts in the object.
To filter sub-badge alerts in the
object.
To view the most recent alerts in the
object.
To filter the duration of the alert to
identify the alerts that the
administrator has not attended to.
To view the Administrative alerts in
the object.
To view the System alerts in the
object.
To view the Environment alerts in the
object.
Select the Criticality column.
Select the Type column.
Select the Sub-Type column.
Select the Start Time column.
Select the Duration column.
Select the Administrative Alert icon.
Select the System icon.
Select the Environment icon.
What to do next
To investigate the possible causes of an alert, double-click the alert for details.
Identify Capacity-Related Alerts
Capacity-related alerts might be triggered because of resources running out of capacity, stressed virtual
machines, or resources wasting memory.
Prerequisites
Verify that you are logged in to a vSphere Client and that vCenter Operations Manager is open.
Procedure
1 In the inventory pane, select the object that you want to inspect.
2 Click the Alerts tab to view a list of active alerts.
66 VMware, Inc.
Page 67

Chapter 6 Working with Faults and Alerts
3 In the Alerts list, filter the list by the Capacity Remaining badge to view alerts that address capacity.
When you double-click an alert, vCenter Operations Manager opens a pop-up window displaying the
alert details.
What to do next
To find aggregate information for used and total capacity and capacity trends, click the Views tab under the
Planning tab and select the Capacity badge.
Identify the Overall Trend of Alert Types
You can use the overall trend of alert types to identify the number of critical alerts over a period of time.
Prerequisites
Verify that you are logged in to a vSphere Client and that vCenter Operations Manager is open.
Procedure
1 In the inventory pane, select the object that you want to inspect.
2 Click the Alerts tab to view a list of active alerts.
3 To view the alert distribution across the last seven days, check the Alert Volume graph.
A trend in alerts typically indicates a problem to investigate. Over time, you might also want to customize
alert settings, which will be reflected in the trend display.
Maintaining vCenter Operations Manager Alerts
Maintaining alerts in the vCenter Operations Manager environment requires administrative privileges.
After identifying an alert from the Alerts list, administrators can take and release ownership of the alert,
suspend, suppress, or cancel an alert.
n
Take Ownership of an Alert on page 68
Users can take ownership of alerts in the Alerts list.
n
Release Ownership of an Alert on page 68
If you are no longer responsible for an alert or want to let other users take ownership of that alert, you
must release the ownership.
n
Suppress an Alert on page 68
You can hide an alert from the Alerts list for a specific number of days.
n
Suspend an Alert on page 69
You can hide an alert from the Alerts list for a specific number of minutes.
n
Cancel a Fault Alert on page 70
You can deactivate fault alerts if they are no longer valid.
n
Cancel a Compliance Alert on page 70
You can cancel compliance alerts if you want to acknowledge or ignore a compliance score until the issue
is resolved and you run the mappings in vCenter Configuration Manager.
VMware, Inc. 67
Page 68

VMware vCenter Operations Manager Getting Started Guide
Take Ownership of an Alert
Users can take ownership of alerts in the Alerts list.
Owning an alert means that you are responsible for taking the necessary remediation actions, and prevents
other users from suspending or suppressing the alert. This can reduce overlapping efforts when multiple
operators manage alerts. The user names of alert owners appear in the User Name column of the Alerts list.
IMPORTANT Only owners can suspend or suppress the alerts they own.
Prerequisites
Verify that you are logged in to a vSphere Client, and vCenter Operations Manager is open.
Procedure
1 Click the Alerts tab.
2 In the Alerts list, click the alert you want to own.
3 (Optional) To select multiple alerts in the list, press the Shift or Control key and click to select the alerts.
4
Click the Take Ownership button .
5 Click Yes to confirm.
The alert appears as Assigned in the Control State column of the alert list.
Release Ownership of an Alert
If you are no longer responsible for an alert or want to let other users take ownership of that alert, you must
release the ownership.
Prerequisites
Verify that you are logged in to a vSphere Client, and vCenter Operations Manager is open.
Procedure
1 Click the Alerts tab.
2 In the Alerts list, click one of the alerts that you own.
3 (Optional) To select multiple alerts in the list, press the Shift or Control key and click to select the alerts.
4
Click the Release Ownership button .
5 Click Yes to confirm.
Your user name is removed from the User Name column of the Alerts list.
Suppress an Alert
You can hide an alert from the Alerts list for a specific number of days.
When you suppress an alert, you take ownership of this alert.
NOTE You cannot suppress an alert owned by another user.
68 VMware, Inc.
Page 69

Chapter 6 Working with Faults and Alerts
Prerequisites
Verify that you are logged in to a vSphere Client, and vCenter Operations Manager is open.
NOTE You do not need administrative privileges to suppress or suspend alerts.
Procedure
1 Click the Alerts tab.
2 In the Alerts list, click the alert you want to suppress.
3 (Optional) To select multiple alerts in the list, press the Shift or Control key and click to select the alerts.
4
Click the Suppress button .
5 In the Confirm dialog box, type the number of days to suppress the alert for, and click OK.
By default, vCenter Operations Manager hides suppressed and suspended alerts from the Alerts list for the
period you specified. You can use the filters in the Control State column header to show or hide suppressed
and suspended alerts.
If the problem still exists when the period you specified expires, vCenter Operations Manager reactivates the
alert and the alert appears in the Alerts list. Your user name remains assigned as the alert owner.
Suspend an Alert
You can hide an alert from the Alerts list for a specific number of minutes.
When you suspend an alert, you take ownership of the alert.
NOTE You can suspend only alerts that are not owned by another user.
Prerequisites
Verify that you are logged in to a vSphere Client, and vCenter Operations Manager is open.
NOTE You do not need administrative privileges to suppress or suspend alerts.
Procedure
1 Click the Alerts tab.
2 In the Alerts list, click the alert you want to suspend.
3 (Optional) To select multiple alerts in the list, press the Shift or Control key and click to select the alerts.
4
Click the Suspend button
5 In the Confirm dialog box, type the number of minutes to suspend the alert for, and click OK.
By default, vCenter Operations Manager hides suppressed and suspended alerts from the Alerts list for the
period you specified. You can use the filters in the Control State column header to show or hide suppressed
and suspended alerts.
.
If the problem still exists when the period you specified expires, vCenter Operations Manager reactivates the
alert and the alert appears in the Alerts list. Your user name remains assigned as the alert owner.
VMware, Inc. 69
Page 70

VMware vCenter Operations Manager Getting Started Guide
Cancel a Fault Alert
You can deactivate fault alerts if they are no longer valid.
Fault alerts are triggered by events that are retrieved from the vCenter Server. All the fault events that appear
in vCenter Operations Manager have associated remediation events that will clear the fault badge score and
the associated alert. To deactivate a fault alert, vCenter Operations Manager must receive a remediation
notification when the problem on the vCenter Server is resolved. If vCenter Operations Manager does not
receive such an event, the fault alert remains active.
Because faults contribute to the Health badge score, active fault alerts degrade the health score even if the
problems that triggered them are solved. Although relatively rare, there can be scenarios where the ESXi host
or vCenter Server fails to generate or publish the remediation event, causing the fault score to remain high and
the alert to remain active after the problem causing the fault has been resolved. Therefore, you might need to
deactivate outdated fault alerts manually.
NOTE Only fault alerts can be cancelled in vCenter Operations Manager. You cannot cancel badge score alerts
nor administrative alerts.
Fault alerts cannot be cancelled on custom groups. Instead, you must correct any problems causing the fault
on each individual group member. Cancelling alerts on group members will also clear the group-level alert.
Prerequisites
Verify that you are logged in to a vSphere Client, and vCenter Operations Manager is open.
NOTE You do not need administrative privileges to cancel fault alerts.
Procedure
1 Click the Alerts tab.
2 In the Alerts list, click the fault alert that you want to deactivate.
You can press the Shift or Control key while you click to select multiple fault alerts in the list.
3
Click the Cancel Fault Alert button .
4 Click Yes to confirm.
Canceling a fault manually has the same effect as a remediation event.The canceled fault alert is removed from
the Alerts list and vCenter Operations Manager updates the Fault badge score and the Health Score.
NOTE Badge scores are not refreshed in real time. These values are refreshed on each data collection cycle.
The data collection interval is five minutes by default.
Cancel a Compliance Alert
You can cancel compliance alerts if you want to acknowledge or ignore a compliance score until the issue is
resolved and you run the mappings in vCenter Configuration Manager.
Canceling a compliance alert sets the Compliance badge score to 100. The score remains 100 until new scores
are pulled from VCM.
Compliance alerts cannot be cancelled on custom groups. Instead, you must act on any problem causing the
alert for each affected group member. Canceling alerts on group members will also clear the group-level alert.
Procedure
1 In the inventory panel, select a vCenter Server, datacenter, cluster, host, or virtual machine object.
70 VMware, Inc.
Page 71

Chapter 6 Working with Faults and Alerts
2 Click the Alertstab.
3 In the Alerts list, click the compliance alert you are canceling.
You can press the Shift or Control key while you click to select multiple compliance alerts in the list.
4 Click the Cancel Fault or Compliance Alert button.
5 Click Yes to confirm.
The canceled compliance alert is removed from the Alerts list and vCenter Operations Manager updates the
Compliance badge score and the Risk score.
What to do next
Resolve the noncompliant rules for the virtual object. See “Resolve Non-Compliant Rules for Compliance
Templates,” on page 29.
VMware, Inc. 71
Page 72

VMware vCenter Operations Manager Getting Started Guide
72 VMware, Inc.
Page 73

Working with Groups 7
Groups allow you to create your own containers for objects in your environment.
vCenter Operations Manager has several fixed container objects that are defined mainly by the adapters used.
These containers include the World group, vCenter Server objects, Datacenter objects, ESX and Cluster objects,
and Datastore objects that appear in the inventory view. Fixed containers follow the structure of your virtual
environment. You cannot control the objects that are included in these containers.
To define your own containers to group monitored objects depending on the logical organization of your
environment, you can use groups.
Metrics and Badges for Groups
The approach that vCenter Operations Manager applies for calculating metrics and badge values for groups
differs from the approach that is applied for calculating metrics for fixed container objects. The metrics on a
fixed container object use data about the object itself and are computed using prescriptive formulas that can
be arbitrarily complex. Metrics on a group are about the child objects that the group contains, and are simply
rolled up from them.
Types of Groups
Adapter-Managed
Groups
Rule-Managed Groups
Manually Managed
Groups
VMware, Inc. 73
In these groups, group membership is managed by the adapters that are
installed on the vCenter Operations Manager system. For example, the vCenter
Server adapter creates groups like datastore, host, network, and so on, which
correspond to container objects in the vSphere inventory. Some folder groups
created by the vCenter Server adapter might appear empty if the objects that
they contain are not supported as first class objects in
vCenter Operations Manager.
NOTE You cannot modify adapter-based groups from the user interface.
In these groups, group membership is based on the rules that you define while
you create or update a group. You create these groups by selecting Dynamic
membership type in the New Group wizard, and can update them in the Edit
Group dialog box.
In these groups, you select group members one by one from the inventory. You
create these groups by selecting Manual membership type in the New Group
wizard, and can edit them in the Edit Group wizard.
Page 74

VMware vCenter Operations Manager Getting Started Guide
Each group must be assigned a group type. Group types are categories that you define to help organize the
groups that you create. You use the Configuration dialog box to create group types.
NOTE All operations on a group are based on the current members of the group. You cannot go back in time
and run operations based on the group members at that point in the past.
This chapter includes the following topics:
n
“Create a Group Type,” on page 74
n
“Edit a Group Type,” on page 74
n
“Delete a Group Type,” on page 75
n
“Create a Group,” on page 75
n
“Managing Groups,” on page 79
n
“Application Custom Group,” on page 82
Create a Group Type
As part of the groups creation process, you must select a group type from a list of predefined types.
By creating a group type, you create a new category in the groups inventory. Group types help you organize
the groups that you create.
vCenter Operations Manager provides a set of pre-defined group types for you to use. The available types are:
Location, Environment, Department, Function, Service Level Objective, and Security Zone.
Procedure
1 Click the Configuration link at the upper right of the vCenter Operations Manager interface.
2 In the Configuration dialog box, click Manage Group Types.
3 Click the Add Group Type icon .
4 Enter a name for the group type and click OK.
The new group type appears in the list.
5 Click Done to close the Configuration dialog box.
A new object named after the group type appears in the groups inventory tree.
Edit a Group Type
Edit a group type to change its name.
A group type is a named category used to help organize custom groups of objects that you create. You can edit
group types that you or other users create, and you can edit group types that are currently assigned to groups.
You cannot edit group types created by vCenter Operations Manager adapters. These group types are: VCM
Machine Groups (created by the VCM adapter), Application (created by the Infrastructure Navigator adapter,
and Folder (created by the vCenter adapter).
Procedure
1 Click the Configuration link at the upper right of the window.
2 In the Configuration dialog box, click Manage Group Types.
3 Select the group type you want to edit.
The group type must be managed by a user.
74 VMware, Inc.
Page 75

4
Click the Edit icon at the top of the dialog box.
5 In the text box that displays the Group Type name, make changes.
6 Click OK to confirm the editing change.
Delete a Group Type
Delete a group type when you decide to no longer use it to organize groups in your inventory.
A group type is a named category used to help organize custom groups of objects that you create. You can
delete group types that you or other users create.
NOTE If you delete a group type that is assigned to a custom group, that group will be deleted as well.
You cannot edit group types created by vCenter Operations Manager adapters. These group types are: VCM
Machine Groups (created by the VCM adapter), Application (created by the Infrastructure Navigator adapter,
and Folder (created by the vCenter adapter).
Procedure
1 Click the Configuration link at the upper right of the window.
2 In the Configuration dialog box, click Manage Group Types.
Chapter 7 Working with Groups
3 Select the group type you want to delete.
The group type must be managed by a user.
4
Click the Delete icon at the top of the dialog box.
A warning dialog box appears, asking you to confirm the permanent deletion. If the group type is assigned
to any custom groups, you are warned that the group type and its custom groups will be deleted.
5 Click OK to confirm the deletion.
Create a Group
You create groups to monitor batches of objects that belong to different generic containers.
Grouping objects in custom containers allows you to view aggregated data for these objects, regardless of their
location in the inventory.
You must have a vCenter Operations Manager admin or vCenter Server Administrator role, or vCenter
Operations Manager Admin permission assigned to your user name on the vCenter Server level in order to
create or edit groups.
Procedure
1 Specify the Basic Parameters of the New Group on page 76
When you create a new group, you must specify the basic details of the group.
2 Define Group Members on page 77
You can populate groups either automatically based on rules or manually.
3 Review Your Settings and Create the Group on page 79
Before you add a group to the groups list, you must verify that all group members appear as expected,
and that the group settings are correct.
VMware, Inc. 75
Page 76

VMware vCenter Operations Manager Getting Started Guide
Specify the Basic Parameters of the New Group
When you create a new group, you must specify the basic details of the group.
Prerequisites
If not group types exist, you must define at least one group type before you can create a group. See “Create a
Group Type,” on page 74.
Procedure
1 From the Actions drop-down menu, select Create new group.
2 On the Edit group details page of the New Group wizard, fill in the basic parameters of the group.
Option Description
Name
Description
Type
Policy
Membership Type
Automatically keep the membership
up to date
3 Click Next.
Type a name for the new group.
Optionally, type a description for the group.
Select the group type from the drop-down menu. You create group types
before you create groups.
Select the policy to apply to group members.
n
Inherit policy from parent - if the group that you create is nested under
another group, you can select this option to propagate the policy
assigned to the parent group to the nested group.
n
Default policy - You can select this option to use the default policy that
is set in the Configuration dialog box.
NOTE Default policy is the policy that you have decided to apply to
monitored objects by default.
n
All custom policies that you created appear as separate entries in the
Policy drop-down menu. You can select the one to apply to the new
group.
NOTE If an object belongs to several groups that have different policies
assigned, the policy with the highest priority applies to this object. The
priority of policies is determined by their position in the list of policies. You
can find the list of policies on the Manage Policies page of the Configuration
dialog box.
Select the way group members are added to the group.
n
Dynamic - members are added to the group based on the rules that you
specify on the following pages of the New Group wizard. Select this
option to create a rule-based group.
NOTE This option must be selected if you want to create lists of objects
to exclude from the group.
n
Manual - you select group members manually, from the inventory tree.
No rules are applied to the group, and you update group members
manually. Select this option to create a manually managed group.
This option is available only for rule-based groups, if you selected
Dynamic membership type.
n
Select the option if you want vCenter Operations Manager to run
periodically a search query to find objects that match the group
membership rules, and update the list of group members according to
search results.
n
Do not select this option if, after the initial creation and population of the
group, you want group members to be added or deleted only when you
select the Update members option from the Actionsdrop-down menu.
76 VMware, Inc.
Page 77

Chapter 7 Working with Groups
What to do next
Set the rules that determine which objects belong to the group or select these objects manually.
Define Group Members
You can populate groups either automatically based on rules or manually.
The mechanism for adding group members depends on the option that you select from the Membership
Type drop-down menu on the Edit group details page.
Table 7-1. Defining Group Members Depending on the Membership Type
Membership Type Procedure to Follow
Dynamic Define Group Membership Criteria
Manual Select Group Members Manually
Define the Rules for Group Membership
You create rules to define which objects belong to a group. Based on these rules,
vCenter Operations Manager adds or removes group members.
You define the rules for group membership in the New Group wizard. You can modify the rules that you
created for a group in the Edit Group dialog box.
Each criterion defines a set of objects that needs to be considered for group membership. The format of all
criteria is Scope:Property:Condition:Value.
A group of criteria is called a rule set. You add new criteria to the rule set by using the Add a new criteria
button. The logical operator between criteria in a rule set is AND.
A rule group contains two or more rule sets. You add rule sets by using the Add a new rule set button. The
logical operator between rule groups is OR.
Prerequisites
Verify that Dynamic membership type is selected on the Edit group details page of the New Group wizard.
Procedure
1 On the Define membership page, use the drop-down menus to create the rules that determine which
objects belong to the group.
The logical operation between criteria in a rule is AND. The logical operation between rule sets is OR.
NOTE The custom group criteria use the last stored value from the vCenter Operations Manager database.
For example, the last recorded state of virtual machines from a host is powered-on. The host is
disconnected from the vCenter Server and all virtual machines on the host were powered off. If you create
a group that must contain only powered-on virtual machines, the powered-off machines from the
disconnected host are added as group members because their last known state is powered-on.
2 (Optional) Create lists of exceptions to the rules.
You can select the objects to include and objects to exclude from the group despite the rules that you
defined.
3 (Optional) To view the list of objects that match the membership rules that you defined, click Preview.
4 Click Next.
What to do next
You can review the settings for the new group.
VMware, Inc. 77
Page 78

VMware vCenter Operations Manager Getting Started Guide
Create Whitelists and Blacklists for Group Members
Optionally, you can control whether specific objects are included in or excluded from your group, irrespective
of the membership rules that you set.
You list the objects that are exceptions to the rules that you specified while you create a rule-based group on
the Define membership page of the New Group wizard.
You can modify these lists later, by using the Edit Group dialog box.
NOTE These settings override the membership criteria and rules that you have defined.
Prerequisites
Verify that Dynamic membership type is selected on the Edit group details page of the New Group wizard.
You can create lists of object to include or exclude only for groups with dynamic membership type enabled.
Procedure
1 To permanently include objects in the group, select the check boxes of the objects in the navigation tree,
and click Add on the left of the Objects to Include list.
You can use the search text box to locate objects in the inventory.
You can use the drop-down options of the Add button to add only the selected object, or the selected object
and its child objects.
2 To permanently exclude specific objects from the group, select the check boxes of the objects in the
navigation tree, and click Add on the left of the Objects to Exclude list.
You can use the search text box to locate objects in the inventory.
You can use the drop-down options of the Add button to add only the selected object, or the selected object
and its child objects.
3 Click Next.
What to do next
You can review the settings for the new group.
Select Group Members Manually
You can add objects objects from the inventory to a group.
You select the group members in the New Group wizard. You can add or delete group members in the Edit
Group dialog box.
Prerequisites
Manual membership type must be selected on the Edit group details page of the New Group wizard.
Procedure
1 On the Define membership page, select the view for inventory objects.
Option Description
Hosts and Clusters
Groups
Datastores
Click to view the entire inventory tree and select from vCenter Server objects
to individual virtual machines.
Click to nest groups within the group that you create.
NOTE You cannot nest adapter-managed groups.
Click to limit the view to vCenter Server objects, Datacenters, and Datastores.
78 VMware, Inc.
Page 79

Chapter 7 Working with Groups
2 Select the check boxes in front of the objects that you want to add to the group, and click Add.
If you select groups, these groups will be nested in the new group that you create.
3 Click Next.
Example: Nesting Groups in groups
Assume that you have created a group that is called group1, and you want to nest group1 in a new group, called
new group.
1 From the Actions drop-down menu, select Create new group.
2 On the Edit group detail page of the New Group wizard, type new group in the Name text box.
3 From the Membership Type drop-down menu, select Manual, and click Next.
4 On the Define Membership page, click the Groups icon.
5 In the inventory, select group1, and click Add.
6 Click Next and Finish to close the New Group wizard.
What to do next
You can review the settings for the new group.
Review Your Settings and Create the Group
Before you add a group to the groups list, you must verify that all group members appear as expected, and
that the group settings are correct.
Procedure
u
On the Review settings page of the New Group wizard, verify that all group members are displayed
correctly and click Finish.
The group that you created appears in the groups navigation tree, under the group type that you selected
during the configuration.
What to do next
You can view aggregated metrics for the objects that belong to the group.
Managing Groups
You can add groups, modify their settings, apply policies, and delete groups from the groups inventory view.
The options for managing a group appear in the Actions drop-down menu on the upper right when a group
is selected in the groups inventory view.
n
Modify a Group on page 80
You can change the settings that you applied to a group to add or remove members that are included in
the group, or to change how vCenter Operations Manager updates group members.
n
Clone an Existing Group on page 81
To save time for creating groups with similar settings, you can clone existing groups, and modify part
of their parameters to create new groups.
n
Delete a Group on page 82
If you no longer need a group that you created, you can remove it from the list of groups.
VMware, Inc. 79
Page 80

VMware vCenter Operations Manager Getting Started Guide
Modify a Group
You can change the settings that you applied to a group to add or remove members that are included in the
group, or to change how vCenter Operations Manager updates group members.
Prerequisites
You must have a vCenter Operations Manager admin or vCenter Server Administrator role, or vCenter
Operations Manager Admin permission assigned to your user name on the vCenter Server level in order to
create or edit groups.
Procedure
1 In the groups inventory view, select the group that you want to edit.
2 From the Actions drop-down menu, select Edit group.
3 From the navigation pane on the left, select the set of options that you want to modify.
Option Description
Edit group details
Define membership
4 To apply the changes, click OK or select another page from the navigation pane of the Edit Group dialog
box.
On this page of the Edit Group dialog box, you can change the following
parameters.
n
Group name
n
Group description
n
Policy that is applied to group members
NOTE You cannot change the group type.
On this page of the Edit Group dialog box, you can change the following
parameters.
n
Group membership type
n
Membership criteria and rules for rule-based groups
n
Automatic updates of group members for rule-based groups
n
Group members for manually managed groups
n
Objects to include in the group. Applies to manually defined groups
Change the Group Membership Type of an Existing Group
The group membership type determines how a group is populated. You can select a different membership
type if you want to change how group is populated.
Prerequisites
Verify that you understand the difference between dynamic, or rule-based, and manual group membership
type. See Chapter 7, “Working with Groups,” on page 73.
Procedure
1
Click the groups icon to navigate to the groups view.
2 In the groups inventory view, click the group that you want to modify.
3 From the Actions drop-down menu, select Edit group.
80 VMware, Inc.
Page 81

Chapter 7 Working with Groups
4 Change the group membership type.
Option Description
Make a manual group dynamic
Make a dynamic group manual
a On the Define membership page of the Edit Group dialog box, select
the Advanced settings check box.
b Click OK to confirm.
All group members are added to the Objects to always include list.
You can create the rules for dynamic addition of group members.
a On the Define membership page of the Edit Group dialog box, deselect
the Advanced settings check box.
b Click OK to confirm.
All current group members and objects from the whitelist are moved to
the group members list. The objects from the blacklist are not saved.
5 To apply the changes, click OK or select another page from the navigation pane of the Edit Group dialog
box.
Change How vCenter Operations Manager Updates Group Members
For rule-based groups, you can switch between manual or automatic updating of group members.
Prerequisites
Verify that the group that you want to modify is rule-based. See Chapter 7, “Working with Groups,” on
page 73.
Procedure
1
Click the groups icon to navigate to the groups view.
2 In the groups inventory view, click the group that you want to modify.
3 From the Actions drop-down menu, select Edit group.
4 In the navigation pane of the Edit Group dialog box, select Define Membership.
5 Select or deselect the Automatically keep the membership up to date option.
Option Description
Option selected
Option not selected
vCenter Operations Manager periodically runs a search query to find objects
that match the group membership rules, and updates the list of group
members according to search results.
vCenter Operations Manager adds or deletes group members only when you
select the Update members option from the Actions drop-down menu.
6 To apply the changes, click OK or select another page from the navigation pane of the Edit Group dialog
box.
Clone an Existing Group
To save time for creating groups with similar settings, you can clone existing groups, and modify part of their
parameters to create new groups.
NOTE You cannot clone adapter-managed groups.
VMware, Inc. 81
Page 82

VMware vCenter Operations Manager Getting Started Guide
Prerequisites
You must have a vCenter Operations Manager admin or vCenter Server Administrator role, or vCenter
Operations Manager Admin permission assigned to your user name on the vCenter Server level in order to
create or edit groups.
Verify that you have created at least one group.
Procedure
1 In the groups inventory view, select the group that you want to clone.
2 From the Actions drop-down menu, select Clone group.
3 Type a new name for the cloned group.
NOTE The names of cloned groups cannot duplicate the names of other groups in your environment.
4 Use the Next button to navigate to the set of options that you want to modify.
Option Description
Edit group details
Define membership
5 To apply the changes, click Next or Finish.
On this page of the Clone Group dialog box, you can change the following
parameters.
n
Group type
n
Group description
n
Group membership type
n
Automatic updates of group members for rule-based groups
n
Policy that is applied to group members
On this page of the Clone Group dialog box, you can change the following
parameters.
n
Membership criteria and rules for rule-based groups
n
Group members for manually managed groups
n
Objects to include in the group. Applies to manually defined groups
Delete a Group
If you no longer need a group that you created, you can remove it from the list of groups.
Procedure
1 In the groups inventory view, click the group that you want to delete.
2 From the Actions drop-down menu, select Delete group, and click Yes to confirm the deletion.
Application Custom Group
vCenter Infrastructure Navigator discovers a set of virtual machines that are correlated as a platform for a
multi-tier application by using a user configured application template or static applications, and publishes this
information.
If you integrate Infrastructure Navigator 2.0 with vCenter Operations Manager,
vCenter Operations Manager queries and processes this application related information and reports this
application correlated group of virtual machines as an adapter-defined application custom group. You can
monitor the discovered application custom group as a vCenter Operations Manager object.
Two types of Infrastructure Navigator data are published.
82 VMware, Inc.
Page 83

Chapter 7 Working with Groups
Type Description
Application Definition Describes an application definition. For example, name and description.
Application Describes an application instance and its member entities.
You can also manually create a custom group based on a selected application. For example, you can specify
an application, Tomcat, and then create a custom group with a group of virtual machines all running Tomcat.
For more information, see “Create a Group,” on page 75.
View Entities of an Application Custom Group
After the integration of Infrastructure Navigator 2.0, application custom group related information is queried,
processed, and displayed in the vCenter Operations Manager user interface.
Procedure
1 Click the Groups tab.
The discovered application custom group is listed under the Application folder.
2 Select the application custom group for which you want to view the entity information.
3 Click the Members tab under the Environment tab.
The Members tab displays the member entities of the discovered application custom group.
VMware, Inc. 83
Page 84

VMware vCenter Operations Manager Getting Started Guide
84 VMware, Inc.
Page 85

Set How Data Appears in
vCenter Operations Manager 8
An administrator can modify the way vCenter Operations Manager analyzes and presents data in the
dashboard, in different views, and reports.
All settings in the Configuration window are optional, and allow you to adapt the appearance and operation
of vCenter Operations Manager to your environment and preferences.
NOTE The settings that are available to you depend on the license that you have.
Initial Setup
Applying Custom
Settings
After you install and configure vCenter Operations Manager and before you
work with the application, review the default policy settings with other users.
Decide whether to begin work using the default policy settings or to modify
them. The default policy is applied to all objects and newly created groups by
default. You can change the policy associated with a certain group by using the
Configurations dialog box. Most changes are noticeable immediately.
An administrator can modify any policy in vCenter Operations Manager at any
time. The changes that the administrator applies affect all users. Therefore, the
administrator must notify the users who are working with
vCenter Operations Manager about any new settings that are applied to the
policies.
CAUTION Be sure you understand how data is affected before you modify the
default policy settings.
Always change the settings at the end of a performance period. For example,
if you change the settings for calculating average usage in the middle of the
collection period, partial data for that period is based on the old settings and
the remainder of the data is based on the new settings. The discrepancy might
be difficult to reconcile.
You can view a summary of settings that affect calculations for the currently
selected view in the View Information pane of the Views tab under Planning.
You can change the settings as you work with a selected view. For example, if
you know that your disk I/O will behave differently from its usual pattern for
a week and this might affect the views, you can change the settings in the
Configuration dialog box to turn off the resource.
Ordering Policies in the
Configuration Dialog
Box
VMware, Inc. 85
The order in which policies appear in the Manage Policies pane of the
Configuration dialog box determines their priority. The higher a policy is in
the list, the higher its priority.
Page 86

VMware vCenter Operations Manager Getting Started Guide
The priority of policies is important for objects that belong to more that one
group. If an object belongs to two or more groups and different policies are
assigned to each group, the object is associated with the policy that has the
highest priority.
This chapter includes the following topics:
n
“Create a New Policy,” on page 86
n
“Modify an Existing Policy,” on page 106
n
“Modify Summary, Views, and Reports Settings,” on page 107
Create a New Policy
You create policies to define a set of rules for vCenter Operations Manager to apply when analyzing and
presenting data in the user interface.
Associating Policies
You can associate policies to specific groups.
with Groups
NOTE You can associate only one policy per group, while one policy can be
associated with many groups.
You can associate a policy with a group while you create or edit groups, and
while you create or modify policies.
While creating or modifying a group, you can select the policy that you want
to associate with the group from a list of already defined policies.
While creating or modifying a policy, you can select the groups that you want
to associate with the policy.
The Default Policy
The Default policy is the policy that is associated with all groups for which no
other policy is selected.
If you have modified the Default policy, but want to revert to the original policy
settings, open the Default policy for editing and go to section 1a General. From
the Clone from drop down menu, select Original Defaults.
Prerequisites
Verify that you are logged in to a vSphere Client as an administrator, and vCenter Operations Manager is open.
n
Set the General Parameters of a Policy on page 87
To distinguish a policy from other policies in the list, you must specify a name and provide a
comprehensive description of the policy.
n
Associate a Policy with One or More Groups on page 88
You can determine what policies are applied to groups in vCenter Operations Manager.
n
Customize Badge Thresholds for Infrastructure Objects on page 89
You can modify the default badge threshold levels for virtual infrastructure objects so that your own
ranges appear in the vCenter Operations Manager interface.
n
Customize Badge Thresholds for Virtual Machine Objects on page 90
You can modify the default badge threshold levels for virtual machines so that your own ranges appear
in the vCenter Operations Manager interface.
n
Customize the Badge Thresholds for Groups on page 93
You can modify the default badge threshold levels for groups so that your own ranges appear in the
vCenter Operations Manager interface.
86 VMware, Inc.
Page 87

Chapter 8 Set How Data Appears in vCenter Operations Manager
n
Modify Capacity and Time Remaining Settings on page 94
Select whether to use stress to account for spikes and peaks, specify the bases for Capacity and Time
Remaining, and, select Demand and Allocation models for compute resources.
n
Modify Usable Capacity Settings on page 96
If you activate the use of usable capacity, you can modify usable capacity settings to specify High
Availability, calculation, and buffer rules.
n
Modify Usage Calculation Settings on page 97
Specify the number of hours during the work week over which average capacity usage is calculated, and
identify peak hours or spikes by excluding data that falls into a regular pattern. If the allocation model
is enabled, set the target ratios for CPU, Memory, and Disk Space.
n
Modify the Criteria for Powered-Off and Idle Virtual Machine State on page 98
You can specify the amount of time after which the virtual machine is classified as powered-off or idle,
and select the threshold used to detect idle status for virtual machines.
n
Modify the Criteria for Oversized and Undersized Virtual Machines on page 99
You can select the level of activity that constitutes an oversized or undersized virtual machine.
n
Modify the Criteria for Underused and Stressed Capacity on page 101
Underused and stressed capacity settings help you identify the load on clusters and hosts before you
deploy virtual machines.
n
Select Which Badges Generate Alerts on page 103
You can select the badges for which you want alerts to appear on the Alerts tab in
vCenter Operations Manager.
n
Modify Trend and Forecast Analysis Settings on page 104
You can define trend and forecast parameters around data points that include outlier detection or
smoothing filters.
Set the General Parameters of a Policy
To distinguish a policy from other policies in the list, you must specify a name and provide a comprehensive
description of the policy.
Prerequisites
Verify that you are logged in to a vSphere Client as an administrator, and vCenter Operations Manager is open.
Procedure
1 Click the Configuration link on the main vCenter Operations Manager page.
2 Create a new policy or open an existing policy for editing.
Option Description
To create a new policy
To modify an existing policy
3 Type a name and description for the policy.
In the Manage Policies pane, click the Create Policy icon .
In the Manage Policies pane, select the policy that you want to associate to
groups and click the Edit Policy icon .
VMware, Inc. 87
Page 88

VMware vCenter Operations Manager Getting Started Guide
4 From the Clone from drop-down menu, select an existing policy to reuse its settings.
Option Description
Default Policy
Original Default
Optimized for 15-minute peak period
Optimized for 30- minute peak period
Excludes over-sized analysis
Ignore these objects
Production environment
Test and development environment
Batch workloads
Interactive workloads
5 Click OK or Finish to save your settings, or select another option to configure.
Select to apply the Default policy that is associated with all groups for which
no other policy is selected.
Select to use the original policy settings of vCenter Operations Manager. For
the original default policy, stress is included in capacity and time calculations
(see section 3a Capacity and Time Remaining). However, resource
allocation is not included in stress calculations (see section4c Underuse and
Stress).
Select to detect resources using more than 100% of their usable capacity for
more than 15 minutes within any given hour.
Select to detect resources using more than 100% of their usable capacity for
more than 30 minutes within any given hour.
Select if your company policy allows the existence of over-sized virtual
machines in your environment. For example, if you provision certain virtual
machines with enough resources to cover the highest possible workload,
these machines might be considered as over-sized when the workload is
normal. You can create a separate group for such highly-provisioned
machines and assign the Excludes over-sized analysis policy to the group,
so that these machines will not be included in calculating the values for
capacity-related badges.
For testing and development. This policy deactivates all alerts and badge
threshold settings.
For real-world production. Both demand and allocation models are
configured. Uses a 4-hour sliding window for measurement. Container
object thresholds for CPU and memory are set to demand above 40% for more
than 10% of the configured time period (see section4c Underuse and Stress).
For testing and development. Uses the current defaults, and a demand
model, in which requested resources are used to determine capacity
remaining (see section3a Capacity and Time Remaining).Only fault alerts
are enabled (see section5 Configure alerts).
For production. Optimized for throughput. Uses an 8-hour sliding window
for measurement.
For production. Optimized for response time. Uses a 1-hour sliding window
for measurement.
6 Click Done to close the Configuration dialog box.
Associate a Policy with One or More Groups
You can determine what policies are applied to groups in vCenter Operations Manager.
You can use the Configuration dialog box to associate policies with groups either while you create a new policy
or while modifying an existing policy.
NOTE You can assign only one policy per group.
Prerequisites
Verify that you are logged in to a vSphere Client as an administrator, and vCenter Operations Manager is open.
Procedure
1 Click the Configuration link on the main vCenter Operations Manager page.
88 VMware, Inc.
Page 89

Chapter 8 Set How Data Appears in vCenter Operations Manager
2 Create a new policy or open an existing policy for editing.
Option Description
To create a new policy
To modify an existing policy
In the Manage Policies pane, click the Create Policy icon .
In the Manage Policies pane, select the policy that you want to associate to
groups and click the Edit Policy icon .
3 Under Policy Details, click 1b Associations.
4 In the list of groups, select the groups that you want to associate with the current policy and click Add.
5 (Optional) To remove groups that are already associated with the policy, select the groups in the list on
the right and click Remove.
6 Click OK or Finish to save your settings, or select another option to configure.
7 Click Done to close the Configuration dialog box.
The policy is associated with the selected groups.
NOTE If an object belongs to more than one group and different policies are assigned to each group, the object
will be associated with the policy that stands higher in the list of policies in the Configuration dialog box.
Example: Associating policies to objects that belong to numerous groups
Assume that a virtual machine belongs to group A and group B. Policy X is assigned to group A. Policy Y is
assigned to group B. In the Manage Policies pane of the Configuration dialog box, policies are ordered as
follows.
n
Default Policy
n
Policy X
n
Policy C
n
Policy Y
The virtual machine is associated with policy X because this policy appears higher in the list.
Customize Badge Thresholds for Infrastructure Objects
You can modify the default badge threshold levels for virtual infrastructure objects so that your own ranges
appear in the vCenter Operations Manager interface.
An administrator can modify any policy in vCenter Operations Manager at any time. The changes that the
administrator applies affect all users. Therefore, the administrator must notify the users who are working with
vCenter Operations Manager about any new settings that are applied to the policies.
Prerequisites
Verify that you are logged in to a vSphere Client as an administrator, and vCenter Operations Manager is open.
Procedure
1 Click the Configuration link on the main vCenter Operations Manager page.
VMware, Inc. 89
Page 90

VMware vCenter Operations Manager Getting Started Guide
2 Create a new policy or open an existing policy for editing.
Option Description
To create a new policy
To modify an existing policy
3 Under Configure badges, click 2a Infrastructure badge thresholds.
4 Slide the color icons on the selected axis to modify the default values and set the ranges to show the green,
yellow, orange, or red badge.
NOTE You cannot revert the changes you apply to badge thresholds. Topic Default Badge Threshold
Values lists the default threshold values for your reference.
5 (Optional) To enable or disable a color range for a badge, click the icon of that color.
Only the outlines of the icon that you disabled remain on the axis.
If the badge score crosses the threshold marked by the disabled icon, the badge color does not change.
vCenter Operations Manager does not trigger alerts derived from disabled badge thresholds.
In the Manage Policies pane, click the Create Policy icon .
In the Manage Policies pane, select the policy that you want to associate to
groups and click the Edit Policy icon .
6 Click OK or Finish to save your settings, or select another option to configure.
7 Click Done to close the Configuration dialog box.
Badge thresholds are updated. The badge colors will change when the next collection cycle begins.
NOTE Depending on your selection in the Configure alerts section of the policy configuration dialog box, new
badge thresholds might affect the number of alerts that vCenter Operations Manager generates.
Customize Badge Thresholds for Virtual Machine Objects
You can modify the default badge threshold levels for virtual machines so that your own ranges appear in the
vCenter Operations Manager interface.
An administrator can modify any policy in vCenter Operations Manager at any time. The changes that the
administrator applies affect all users. Therefore, the administrator must notify the users who are working with
vCenter Operations Manager about any new settings that are applied to the policies.
Prerequisites
Verify that you are logged in to a vSphere Client as an administrator, and vCenter Operations Manager is open.
Procedure
1 Click the Configuration link on the main vCenter Operations Manager page.
2 Create a new policy or open an existing policy for editing.
Option Description
To create a new policy
To modify an existing policy
In the Manage Policies pane, click the Create Policy icon .
In the Manage Policies pane, select the policy that you want to associate to
groups and click the Edit Policy icon .
3 Under Configure badges, click 2b VM badge thresholds.
90 VMware, Inc.
Page 91

Chapter 8 Set How Data Appears in vCenter Operations Manager
4 Slide the color icons on the selected axis to modify the default values and set the ranges to show the green,
yellow, orange, or red badge.
NOTE You cannot revert the changes you apply to badge thresholds. Topic Default Badge Threshold
Values lists the default threshold values for your reference.
5 (Optional) To enable or disable a color range for a badge, click the icon of that color.
Only the outlines of the icon that you disabled remain on the axis.
If the badge score crosses the threshold marked by the disabled icon, the badge color does not change.
vCenter Operations Manager does not trigger alerts derived from disabled badge thresholds.
6 Click OK or Finish to save your settings, or select another option to configure.
7 Click Done to close the Configuration dialog box.
Badge thresholds are updated. The badge colors will change when the next collection cycle begins.
NOTE Depending on your selection in the Configure alerts section of the policy configuration dialog box, new
badge thresholds might affect the number of alerts that vCenter Operations Manager generates.
Default Badge Threshold Values
If you modify the badge thresholds in the Configuration window, you cannot reset to the default values.
Because you cannot revert the changes you apply to badge thresholds for infrastructure, virtual machine, and
group objects, Table 8-1 lists the default badge threshold values for your reference.
Table 8-1. Default Badge Threshold Values
Default Score
Range for
InfrastructureDefault Score
Badge Icon Status
Health Good 100-76 100-76 100-76
Abnormal 75-51 75-51 75-51
Degraded 50-26 50-26 50-26
Bad 25-0 25-0 25-0
Workload Good 0-79 0-84 0-24
Abnormal 80-89 85-94 25-49
Degraded 90-95 95-100 50-74
Range for VM
Default Score Range
for Groups
Bad >95 >100 75-100
Anomalies Good 0-49 0-49 0-24
Abnormal 50-74 50-74 25-49
VMware, Inc. 91
Page 92
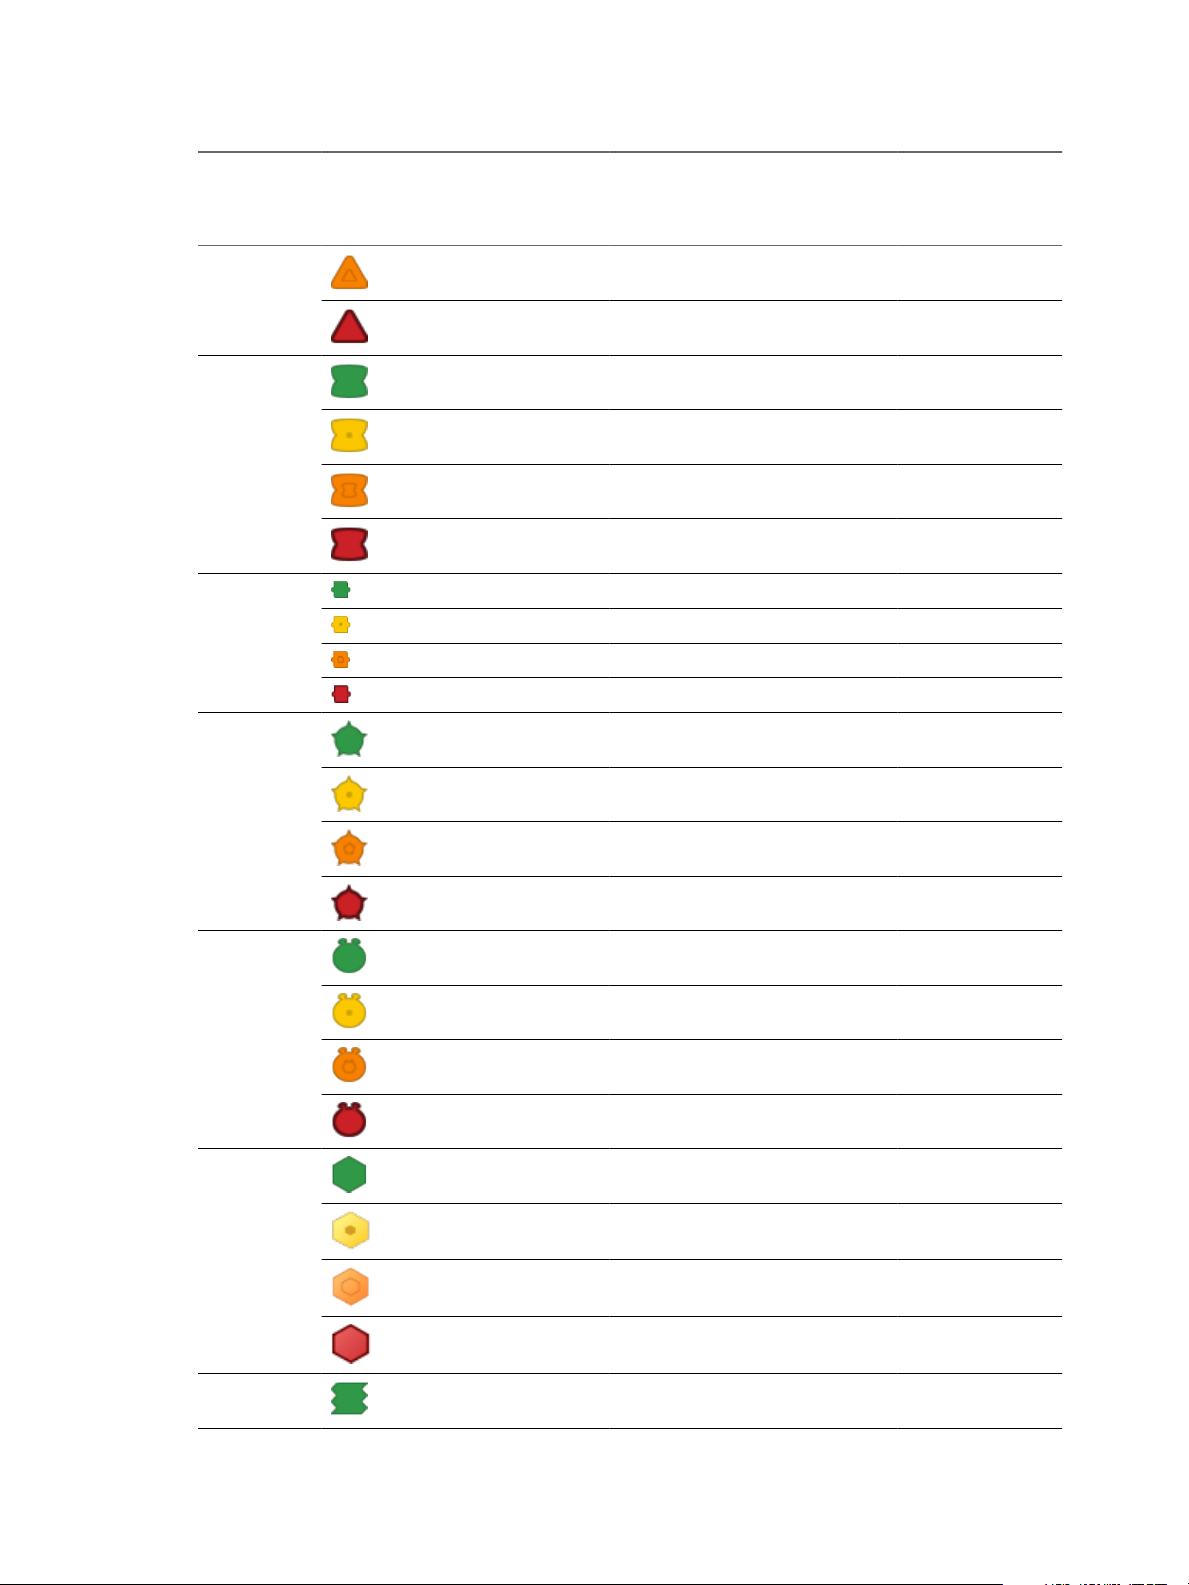
VMware vCenter Operations Manager Getting Started Guide
Table 8-1. Default Badge Threshold Values (Continued)
Badge Icon Status
Degraded 75-89 75-89 50-74
Bad 90-100 90-100 75-100
Faults Good 0-24 0-24 0-24
Abnormal 25-49 25-49 25-49
Degraded 50-74 50-74 50-74
Bad 75-100 75-100 75-100
Compliance Good 100-76 100-76 100-76
Abnormal 75-51 75-51 75-51
Default Score
Range for
InfrastructureDefault Score
Range for VM
Default Score Range
for Groups
Degraded 50-26 50-26 50-26
Bad 25-0 25-0 25-0
Risk Good 0-49 0-49 0-24
Abnormal 50-74 50-74 25-49
Degraded 75-100 75-100 50-74
Bad 100 100 75-100
Time
Good 100-51 100-51 100-76
Remaining
Abnormal 50-26 50-26 75-51
Degraded 25-1 25-1 50-26
Bad 0 0 25-0
Capacity
Good 100-11 100-11 100-76
Remaining
Abnormal 10-6 10-6 75-51
Degraded 5-1 5-1 50-26
Bad 0 0 25-0
Stress Good 0 0 0-24
92 VMware, Inc.
Page 93
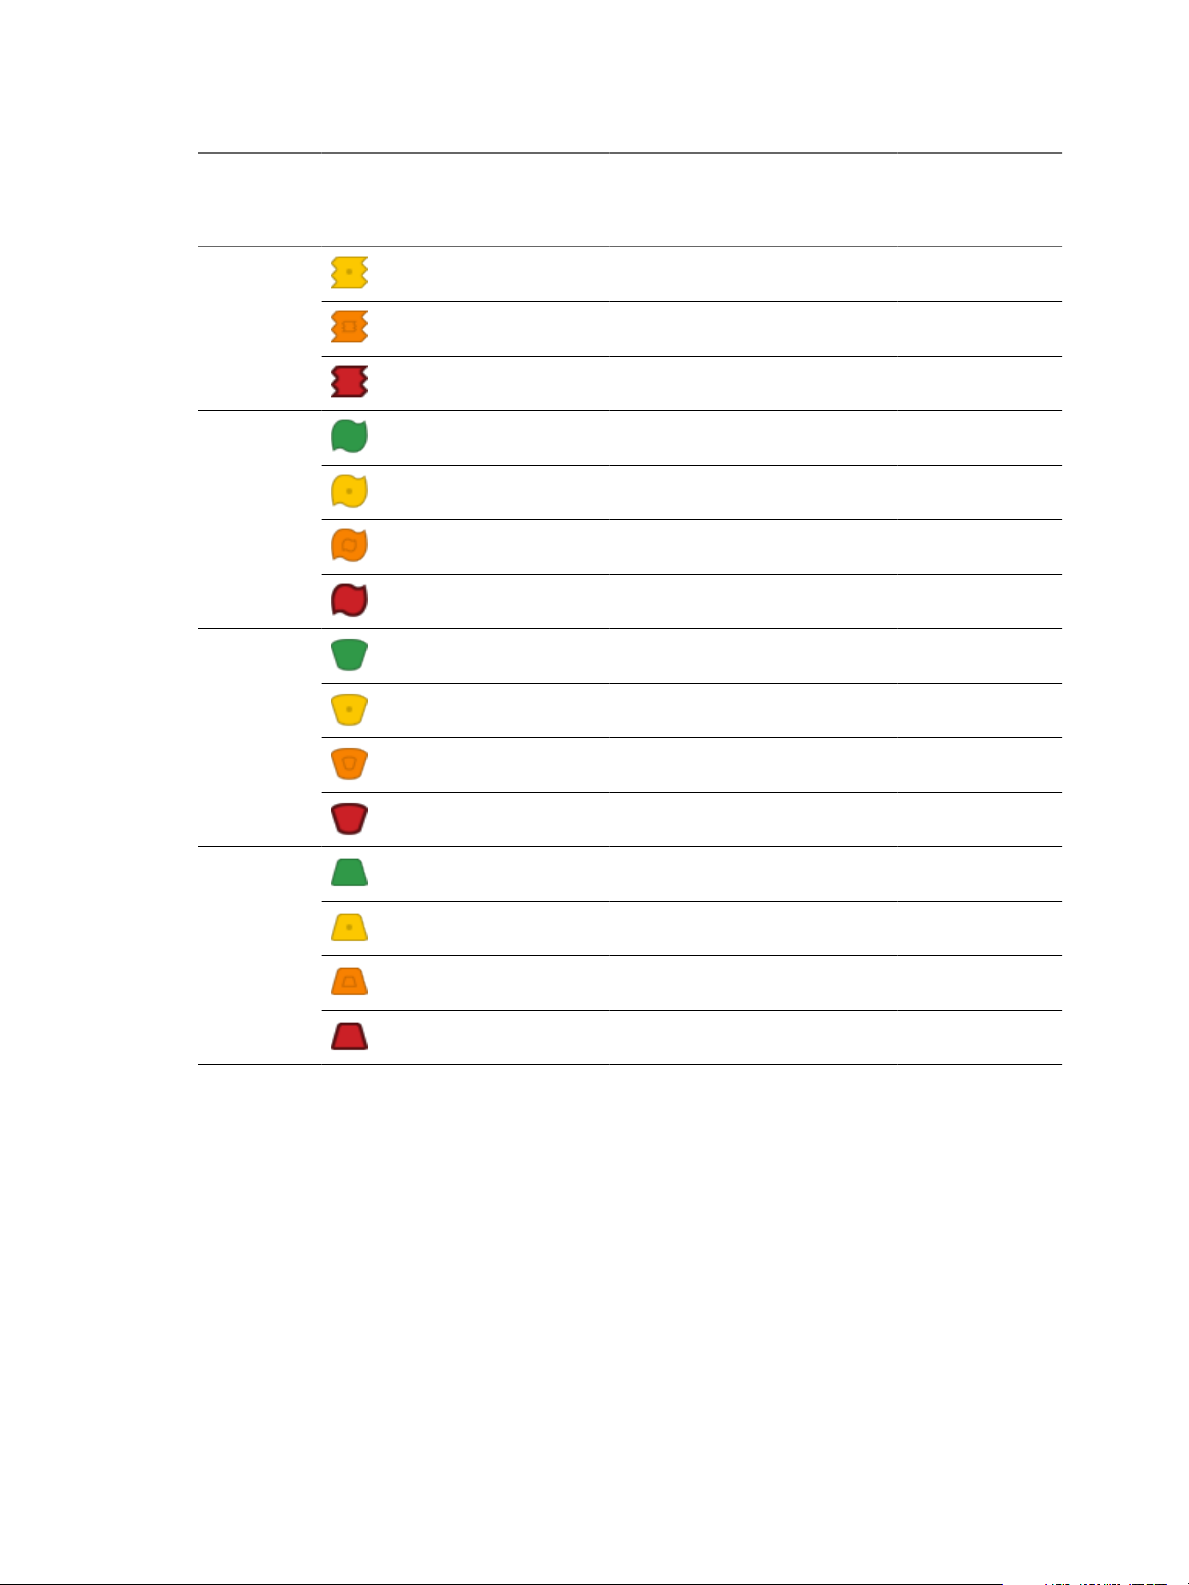
Chapter 8 Set How Data Appears in vCenter Operations Manager
Table 8-1. Default Badge Threshold Values (Continued)
Default Score
Range for
InfrastructureDefault Score
Badge Icon Status
Abnormal 1-4 1-4 25-49
Degraded 5-29 5-29 50-74
Bad 30-100 30-100 75-100
Efficiency Good 100-26 100-26 100-76
Abnormal 25-11 25-11 75-51
Degraded 10-1 10-1 50-26
Bad 0 0 25-0
Range for VM
Default Score Range
for Groups
Reclaimable
Waste
Density Good 100-26 100-26 100-76
Good 0-49 0-49 0-24
Abnormal 50-89 50-74 25-49
Degraded 75-99 75-99 50-74
Bad 100 100 75-100
Abnormal 25-11 25-11 75-51
Degraded 10-1 10-1 50-26
Bad 0 0 25
Customize the Badge Thresholds for Groups
You can modify the default badge threshold levels for groups so that your own ranges appear in the
vCenter Operations Manager interface.
An administrator can modify any policy in vCenter Operations Manager at any time. The changes that the
administrator applies affect all users. Therefore, the administrator must notify the users who are working with
vCenter Operations Manager about any new settings that are applied to the policies.
Prerequisites
Verify that you are logged in to a vSphere Client as an administrator, and vCenter Operations Manager is open.
Procedure
1 Click the Configuration link on the main vCenter Operations Manager page.
VMware, Inc. 93
Page 94

VMware vCenter Operations Manager Getting Started Guide
2 Create a new policy or open an existing policy for editing.
Option Description
To create a new policy
To modify an existing policy
3 Under Configure badges, click 2c Groups badge thresholds.
4 Slide the color icons on the selected axis to modify the default values and set the ranges to show the green,
yellow, orange, or red badge.
NOTE You cannot revert the changes you apply to badge thresholds. Topic Default Badge Threshold
Values lists the default threshold values for your reference.
5 (Optional) To enable or disable a color range for a badge, click the icon of that color.
Only the outlines of the icon that you disabled remain on the axis.
If the badge score crosses the threshold marked by the disabled icon, the badge color does not change.
vCenter Operations Manager does not trigger alerts derived from disabled badge thresholds.
In the Manage Policies pane, click the Create Policy icon .
In the Manage Policies pane, select the policy that you want to associate to
groups and click the Edit Policy icon .
6 Click OK or Finish to save your settings, or select another option to configure.
7 Click Done to close the Configuration dialog box.
Badge thresholds are updated. The badge colors will change when the next collection cycle begins.
NOTE Depending on your selection in the Configure alerts section of the policy configuration dialog box, new
badge thresholds might affect the number of alerts that vCenter Operations Manager generates.
Modify Capacity and Time Remaining Settings
Select whether to use stress to account for spikes and peaks, specify the bases for Capacity and Time Remaining,
and, select Demand and Allocation models for compute resources.
An administrator can modify any policy in vCenter Operations Manager at any time. The changes that the
administrator applies affect all users. Therefore, the administrator must notify the users who are working with
vCenter Operations Manager about any new settings that are applied to the policies.
Prerequisites
Verify that you are logged in to a vSphere Client as an administrator, and vCenter Operations Manager is open.
Procedure
1 Click the Configuration link on the main vCenter Operations Manager page.
2 Create a new policy or open an existing policy for editing.
Option Description
To create a new policy
To modify an existing policy
In the Manage Policies pane, click the Create Policy icon .
In the Manage Policies pane, select the policy that you want to associate to
groups and click the Edit Policy icon .
94 VMware, Inc.
Page 95

Chapter 8 Set How Data Appears in vCenter Operations Manager
3 Click 3a Capacity and time remaining and modify the settings.
Option Description
Spikes and Peaks
Capacity Remaining is based on:
Time Remaining is based on:
Demand or Allocation by Compute
Resource
Determines whether to take the more conservative approach of using stress
in accounting for spikes and peaks in capacity use.
Choose the model for capacity calculations:
n
Physical or Configured Capacity. Uses physical capacity in metric
calculations. vCenter Operations Manager does not calculate VMware
HA and buffer percentages.
n
Usable Capacity. Activates support for VMware HA and buffer
percentages in metric calculations. You can further specify HA and
buffer settings in the Usable Capacity global settings.
Contains settings that affect the calculations of Time Remaining badge scores
and alerts.
n
From the drop-down menu, select the algorithm to be used for
calculating the Time Remaining badge score.
n
Select Planning Cyclical to use planning data and algorithm.
n
Select Real Time to use real time data and algorithm.
n
In the Days of provisioning buffer text box, type the number of days to
be used as score provisioning buffer when calculating the score of the
Time Remaining badge. vCenter Operations Managerapplies the
following formula to calculate the badge score.
Time Remaining badge score = Log10(Time Remaining Provisioning Buffer
Threshold + 1) / Log10(Time Remaining Window Provisioning Buffer Threshold + 1) * 100
For each compute resource (VM, Datastore, or Containers), select whether to
use Demand or Allocation (or both) in calculations for CPU, Memory, Disk
I/O, Disk Space, and Network I/0. Containers are the World, vCenters, data
centers, clusters and hosts, but not groups.
A Demand model uses requested resources to calculate remaining resources.
An Allocation model considers allocated resources to be used and
unallocated resources as capacity remaining. Demand is more aggressive,
while Allocation is more conservative.
Reservations for CPU and Memory are always included in Capacity and
Time remaining calculations.
4 Click OK or Finish to save your settings, or select another option to configure.
5 Click Done to close the Configuration dialog box.
The capacity and time remaining settings are reconfigured.
Example: Examples of Capacity and Time Remaining Settings
These examples show how some of the settings are used.
Compute Resources to
Analyze
Usable Capacity
What to do next
If you selected Usable Capacity, configure the high availability and buffer settings in section 3b Usable
capacity of the policy configuration dialog box.
VMware, Inc. 95
If you have a mixed host environment or your ESX or vSphere version limits
the ability to view disk I/O metrics, you can turn off that resource type.
If you stress the load on your systems and want extra headroom for error,
activate buffer support with this setting.
Page 96

VMware vCenter Operations Manager Getting Started Guide
Modify Usable Capacity Settings
If you activate the use of usable capacity, you can modify usable capacity settings to specify High Availability,
calculation, and buffer rules.
An administrator can modify any policy in vCenter Operations Manager at any time. The changes that the
administrator applies affect all users. Therefore, the administrator must notify the users who are working with
vCenter Operations Manager about any new settings that are applied to the policies.
The capacity buffer is a percentage of virtual machine capacity that is held in reserve to prevent the virtual
machine from consuming 100 percent of its resources.. Buffer limits apply to hosts and virtual machines. For
example, if a virtual machine is used at 50 percent capacity, adding a scenario that would simulate using
another 50 percent of capacity onto that virtual machine puts the virtual machine at its capacity limit. A peak
load might demand more performance from the virtual machine than it can deliver. The buffer limits help
prevent this event by forecasting the remaining capacity. This information appears in the following places:
n
In the Time Remaining and Trend Information table on the Summary tab under the Planning tab.
n
In the Total Remaining column of some views on the Views tab under the Planning tab.
NOTE For the following settings to apply, you must have set the basis for Capacity Remaining to Usable
Capacity on the Capacity and Time Remaining tab.
Prerequisites
Verify that you are logged in to a vSphere Client as an administrator, and vCenter Operations Manager is open.
Procedure
1 Click the Configuration link on the main vCenter Operations Manager page.
2 Create a new policy or open an existing policy for editing.
Option Description
To create a new policy
To modify an existing policy
In the Manage Policies pane, click the Create Policy icon .
In the Manage Policies pane, select the policy that you want to associate to
groups and click the Edit Policy icon .
3 Click 3b Usable Capacity and change the settings for usable capacity.
Option Description
Use High Availability (HA)
Configuration, and reduce capacity
% of resource capacity to reserve as
buffer:
Capacity Calculation Rules
If HA is configured on the clusters in your virtual environment, selecting this
option excludes the CPU and memory reserved per the HA settings when
calculating capacity scores in vCenter Operations Manager.
Sets the percent of reserve capacity for CPU, memory, disk I/O, disk space,
or Network I/O.
Select how to calculate capacity.
n
Use last known capacity. Bases capacity calculations on the last known
capacity for the selected data interval. This setting affects the remaining
capacity. Although you expect a proportional relationship between
utilization and capacity, the average utilization might exceed the last
known capacity when the capacity drops.
n
Use actual capacity. Bases capacity calculations on the average known
capacity for the selected data interval.
If you choose lUse last known capacity and your capacity has dropped over time, it is likely that your
average usage will be larger than your last known capacity. This situation can generate an alert due to
negative capacity remaining.
96 VMware, Inc.
Page 97

Chapter 8 Set How Data Appears in vCenter Operations Manager
4 Click OK or Finish to save your settings, or select another option to configure.
5 Click Done to close the Configuration dialog box.
The usable capacity settings are reconfigured.
Example: Examples of Usable Capacity Global Settings
These examples show how some of the settings are used.
Use last known capacity
If the interval included in the view is two months, and today is June 30, views
of capacity such as Average Virtual Machine Capacity show you the capacity
used on June 30.
Use actual capacity
If the interval included in the view is two months, and today is June 30, views
of capacity show you the average of capacity used in May and June.
Modify Usage Calculation Settings
Specify the number of hours during the work week over which average capacity usage is calculated, and
identify peak hours or spikes by excluding data that falls into a regular pattern. If the allocation model is
enabled, set the target ratios for CPU, Memory, and Disk Space.
An administrator can modify any policy in vCenter Operations Manager at any time. The changes that the
administrator applies affect all users. Therefore, the administrator must notify the users who are working with
vCenter Operations Manager about any new settings that are applied to the policies.
Prerequisites
Verify that you are logged in to a vSphere Client as an administrator, and vCenter Operations Manager is open.
Procedure
1 Click the Configuration link on the main vCenter Operations Manager page.
2 Create a new policy or open an existing policy for editing.
Option Description
To create a new policy
To modify an existing policy
In the Manage Policies pane, click the Create Policy icon .
In the Manage Policies pane, select the policy that you want to associate to
groups and click the Edit Policy icon .
3 Click 3c Usage calculation to change the settings for work week calculation and allocation overcommit
ratios.
4 Set the Usage Work Week to a continual array of sampling or specific times to sample.
Option Description
All hours on all days
Specific hours and days
Average capacity use is calculated based on inventory and performance data
collected during all 24 hours of each day throughout the business week.
Average capacity use is calculated based on inventory and performance data
collected during business hours that you define for each day throughout the
business week.
VMware, Inc. 97
Page 98

VMware vCenter Operations Manager Getting Started Guide
5 Enter Allocation Overcommit Ratios
An allocation model considers allocated resources as used in resource calculations. Allocation or demand
models for compute resources are configured in section 3a Capacity and Time Remaining.
Option Description
CPU
Memory
Disk Space
Sets a numeric ratio for virtual-to-physical overcommitment.
Sets a percentage ratio for virtual-to-physical overcommitment.
Sets a percentage ratio for virtual-to-physical overcommitment.
6 Click OK or Finish to save your settings, or select another option to configure.
7 Click Done to close the Configuration dialog box.
The Usage Calculation settings are reconfigured.
Modify the Criteria for Powered-Off and Idle Virtual Machine State
You can specify the amount of time after which the virtual machine is classified as powered-off or idle, and
select the threshold used to detect idle status for virtual machines.
An administrator can modify any policy in vCenter Operations Manager at any time. The changes that the
administrator applies affect all users. Therefore, the administrator must notify the users who are working with
vCenter Operations Manager about any new settings that are applied to the policies.
vCenter Operations Manager uses performance counters to measure the activity for a host or virtual machine.
The following counters detect activity thresholds:
n
CPU use in MHz
n
Disk I/O in KBps
n
Network I/O in KBps
The thresholds are evaluated for the period specified for views. You set this period in the Number of intervals
to use text box of the Manage Display Settings section in the Configuration dialog box. For example, if the
default setting for Number of intervals to use is four, and the Interval to use is weekly,
vCenter Operations Manager examines the performance activity for the past month.
Prerequisites
Verify that you are logged in to a vSphere Client as an administrator, and vCenter Operations Manager is open.
Procedure
1 Click the Configuration link on the main vCenter Operations Manager page.
2 Create a new policy or open an existing policy for editing.
Option Description
To create a new policy
To modify an existing policy
In the Manage Policies pane, click the Create Policy icon .
In the Manage Policies pane, select the policy that you want to associate to
groups and click the Edit Policy icon .
98 VMware, Inc.
Page 99

Chapter 8 Set How Data Appears in vCenter Operations Manager
3 Click 4a Powered off and idle VMs and change the settings for powered-off and idle virtual machines.
Option Description
% Time Powered-off threshold
Idle VM Detection Rules
% Time Idle threshold
Detection based on any of the
thresholds
Detection based on all of the
thresholds
Average Resource Usage Criteria
Percentage of time during which the virtual machine is powered off.
A virtual machine is considered as powered off by using the following
calculation.
The number of hours that vm is powered off in non-trend view
interval
/ number of hours set in non-trend view >= %time powered off
threshold
Percentage of time during which the virtual machine is powered on but
inactive, so that you identify the virtual machine as idle.
For a given hour, a virtual machine passes the idle detection criteria for that
hour if it satisfies the resource threshold for all/any specified enabled
resource.
A virtual machine is considered idle by using the followinf calculation.
Number of hours that virtual machine passes the idle
detection criteria in non-trend view interval
/ number of hours in non-trend view >= %time idle threshold
If any of the selected counters falls below the minimum threshold, the virtual
machine is considered to be idle.
All selected counters must fall below the minimum threshold for the virtual
machine to be considered idle.
You can select the minimum usage of CPU, Disk I/O, and network resources
to determine the idle detection criteria. vCenter Operations Manager uses
these criteria to determine if the virtual machine is idle, based on the % Time
Idle threshold that you set.
4 Click OK or Finish to save your settings, or select another option to configure.
5 Click Done to close the Configuration dialog box.
The settings for powered off and idle virtual machines are reconfigured.
Modify the Criteria for Oversized and Undersized Virtual Machines
You can select the level of activity that constitutes an oversized or undersized virtual machine.
An administrator can modify any policy in vCenter Operations Manager at any time. The changes that the
administrator applies affect all users. Therefore, the administrator must notify the users who are working with
vCenter Operations Manager about any new settings that are applied to the policies.
IMPORTANT Oversizing and undersizing refers to the amount of capacity that a virtual machine has available,
not the amount of work being performed. An undersized virtual machine has less capacity than is needed to
perform work. An oversized virtual machine has more capacity than is needed to perform work.
Prerequisites
Verify that you are logged in to a vSphere Client as an administrator, and vCenter Operations Manager is open.
Procedure
1 Click the Configuration link on the main vCenter Operations Manager page.
VMware, Inc. 99
Page 100

VMware vCenter Operations Manager Getting Started Guide
2 Create a new policy or open an existing policy for editing.
Option Description
To create a new policy
To modify an existing policy
3 In the Configure state-related thresholds section, click 4b Oversized and undersized VMs.
4 Change the settings for oversized and undersized virtual machines.
Option Description
VMs are oversized when:
Amount of CPU demand below
Amount of memory demand below
is more than number% for the entire
range
VMs are undersized when:
Amount of CPU demand peaks
above
Amount of memory demand peaks
above
is more than number% for
Any number hour period
Entire range
5 Click OK or Finish to save your settings, or select another option to configure.
In the Manage Policies pane, click the Create Policy icon .
In the Manage Policies pane, select the policy that you want to associate to
groups and click the Edit Policy icon .
Considers the virtual machine oversized when the following conditions are
met:
n
CPU use is less than the percentage of its allocated capacity as indicated
in this field.
n
Duration of CPU activity under this threshold compared to total time
evaluated meets the % oversized threshold.
Considers the virtual machine oversized when the following conditions are
met:
n
Memory use is less than the percentage of its allocated capacity as
indicated in this field.
n
Duration of memory activity under this threshold compared to total time
evaluated meets the % oversized threshold.
Sets the amount of nonusage in the the entire environment defined by the %
oversized thresholds and the time range to analyze.
You define the time range in the Manage Display Settings section of the
Configuration dialog box.
Considers the virtual machine undersized when the following conditions are
met:
n
CPU demand is more than the percentage of its allocated capacity as
indicated in this field.
n
Duration of CPU activity under this threshold compared to total time
evaluated meets the % undersized threshold.
Considers the virtual machine undersized when the following conditions are
met:
n
Memory use is more than the percentage of its allocated capacity as
indicated in this field.
n
Duration of memory activity under this threshold compared to total time
evaluated meets the % undersized threshold.
Sets the amount of use in the entire environment defined by the % undersized
threshold and the time range to analyze.
Sets the time range to analyze as a period of hours.
Sets the time range to analyze as the range defined in the Manage Display
Settings section of the Configuration dialog box.
6 Click Done to close the Configuration dialog box.
The criteria for oversized and undersized virtual machines are reconfigured.
100 VMware, Inc.
 Loading...