

Page 1

VMware vCenter Operations Manager
Advanced Getting Started Guide
vCenter Operations Manager Advanced 5.0
This document supports the version of each product listed and
supports all subsequent versions until the document is replaced
by a new edition. To check for more recent editions of this
document, see http://www.vmware.com/support/pubs.
EN-000671-00
Page 2

VMware vCenter Operations Manager Advanced Getting Started Guide
You can find the most up-to-date technical documentation on the VMware Web site at:
http://www.vmware.com/support/
The VMware Web site also provides the latest product updates.
If you have comments about this documentation, submit your feedback to:
docfeedback@vmware.com
Copyright © 2012 VMware, Inc. All rights reserved. This product is protected by U.S. and international copyright and intellectual
property laws. VMware products are covered by one or more patents listed at http://www.vmware.com/go/patents.
VMware is a registered trademark or trademark of VMware, Inc. in the United States and/or other jurisdictions. All other marks
and names mentioned herein may be trademarks of their respective companies.
VMware, Inc.
3401 Hillview Ave.
Palo Alto, CA 94304
www.vmware.com
2 VMware, Inc.
Page 3

Contents
VMware vCenter Operations Manager Advanced Getting Started Guide 5
vCenter Operations Manager Features 7
1
Main Concepts of vCenter Operations Manager 7
Metric Concepts for vCenter Operations Manager Planning 8
Preparing to Monitor a vCenter Operations Manager Virtual Environment 11
2
Object Type Icons in the Inventory Pane 11
Badge Concepts for vCenter Operations Manager Planning 12
Major Badges in vCenter Operations Manager 12
Working with Metrics and Charts on the All Metrics Tab 20
Planning the vCenter Operations Manager Workflow 23
3
Monitoring Day-to-Day Activity in vCenter Operations Manager 24
Identify an Overall Health Issue 24
Determine the Timeframe and Nature of a Health Issue 24
Determine Whether the Environment Operates as Expected 25
Identify the Source of Performance Degradation 26
Identify Events that Occurred when an Object Experienced Performance Degradation 26
Identify the Top Resource Consumers 27
Determine the Extent of a Performance Degradation 27
Determine When an Object Might Run Out of Resources 28
Determine the Cause of a Problem with a Specific Object 28
Address a Problem with a Specific Virtual Machine 29
Address a Problem with a Specific Datastore 30
Identify Objects with Stressed Capacity 30
Identify Stressed Objects with vCenter Operations Manager 31
Identify the Underlying Memory Resource Problem for Clusters and Hosts 31
Identify the Underlying Memory Resource Problem for a Virtual Machine 32
Determine the Percentage of Used and Remaining Capacity to Assess Current Needs 32
VMware, Inc.
Preparing Proactive Workflows in vCenter Operations Manager 35
4
Planning and Analyzing Data for Capacity Risk 35
Optimizing Data for Capacity 39
Forecasting Data for Capacity Risk 43
Planning vCenter Operations Manager Workflow with Alerts 49
5
What Is an Alert in vCenter Operations Manager 49
Filter Alerts to Identify Notifications 50
Identify Capacity Related Alerts 51
Identify the Overall Trend of Alert Types 51
3
Page 4

VMware vCenter Operations Manager Advanced Getting Started Guide
Maintaining vCenter Operations Manager Alerts 52
Customizing vCenter Operations Manager Configuration Settings 57
6
Customize the Badge Thresholds for Infrastructure Objects 57
Customize the Badge Thresholds for Virtual Machine Objects 58
Default Badge Threshold Values 58
Edit Configuration Settings to Receive Notifications When a Badge Crosses a Threshold 61
Index 63
4 VMware, Inc.
Page 5

VMware vCenter Operations Manager Advanced Getting Started Guide
The VMware vCenter Operations Manager Advanced Getting Started Guide provides information about the
VMware® vCenter™ Operations Manager planning process.
Intended Audience
This guide is intended for administrators of VMware vSphere who want to familiarize themselves with
planning workflow tasks to monitor and manage the performance of the vCenter Operations Manager virtual
environment.
VMware, Inc. 5
Page 6

VMware vCenter Operations Manager Advanced Getting Started Guide
6 VMware, Inc.
Page 7

vCenter Operations Manager Features 1
vCenter Operations Manager collects performance data from each object at every level of your virtual
environment, from individual virtual machines and disk drives to entire clusters and datacenters. It stores and
analyzes the data, and uses that analysis to provide real-time information about problems, or potential
problems, anywhere in your virtual environment.
vCenter Operations Manager works with existing VMware products to add the following functions.
n
Combines key metrics into single scores for environmental health and efficiency and capacity risk.
n
Calculates the range of normal behavior for every metric and highlights abnormalities. Adjusts the
dynamic thresholds as incoming data allows it to better define the normal values for a metric.
n
Presents graphical representations of current and historical states of your entire virtual environment or
selected parts of it.
n
Displays information about changes in the hierarchy of your virtual environment. For example, when a
virtual machine is moved to a different ESX host, you can see how these changes affect the performance
of the objects involved.
This chapter includes the following topics:
n
“Main Concepts of vCenter Operations Manager,” on page 7
n
“Metric Concepts for vCenter Operations Manager Planning,” on page 8
Main Concepts of vCenter Operations Manager
vCenter Operations Manager uses certain concepts that can help you understand the product, its interface,
and how to use it.
Attributes and Metrics
vCenter Operations Manager collects several kinds of data for each inventory object. For example, for a virtual
machine, vCenter Operations Manager might receive data about free disk space, CPU load, and available
memory. Each type of data that vCenter Operations Manager collects is called an attribute. An instance of an
attribute for a specific inventory object is called a metric. For example, free memory for a specific virtual
machine is a metric.
For each metric, vCenter Operations Manager collects and stores multiple readings over time. For example,
the vCenter Operations Manager server polls for information about the CPU load for each virtual machine
once every five minutes. Each piece of data that vCenter Operations Manager collects is called a metric value.
VMware, Inc.
7
Page 8

VMware vCenter Operations Manager Advanced Getting Started Guide
Dynamic Thresholds
vCenter Operations Manager defines dynamic thresholds for every metric based on the current and historical
values of the metric. The normal range of values for a metric can differ on different days at different times
because of regular cycles of use and behavior. vCenter Operations Manager tracks these normal value cycles
and sets the dynamic thresholds accordingly. High metric values that are normal at one time might indicate
potential problems at other times. For example, high CPU use on Friday afternoons, when weekly reports are
generated, is normal. The same value on Sunday morning, when nobody is at the office, might indicate a
problem.
vCenter Operations Manager continuously adjusts the dynamic thresholds. The new incoming data allows
vCenter Operations Manager to better define what value is normal for a metric. The dynamic thresholds add
context to metrics that allows vCenter Operations Manager to distinguish between normal and abnormal
behavior.
Dynamic thresholds eliminate the need for the manual effort required to configure hard thresholds for
hundreds or thousands of metrics. More importantly, they are more accurate than hard thresholds. Dynamic
thresholds allow vCenter Operations Manager to detect deviations based on the actual normal behavior of an
object and not on an arbitrary set of limits.
The analytics algorithms take seven days to calculate the initial values for dynamic thresholds. Dynamic
thresholds appear as line segments under the bar graphs for use metrics on the Details page and on the
Scoreboard page. The length and the position of the dynamic threshold line segment depends on the calculated
normal values for the selected use metrics. Dynamic thresholds also appear as shaded gray areas of the use
metrics graphs on the All Metrics page.
Hard Thresholds
Unlike dynamic thresholds, hard thresholds are fixed values that you enter to define what is normal behaviour
for an object. These arbitrary values do not change over time unless you change them manually. You cannot
fix hard thresholds with vCenter Operations Manager.
Key Performance Indicators
vCenter Operations Manager defines attributes that are critical to the performance of an object as key
performance indicators (KPI). KPI are weighted more heavily in the calculations that determine the health of
an object. Graphs of KPI performance appear before other metrics in several areas of the product.
Probable Causes
If the condition of the currently selected object is degraded, you can view a list of probable causes for this
degradation on the Details page. vCenter Operations Manager analyzes the metrics behavior of all objects that
are related to the currently selected object to determine the probable reason for its health degradation.
The probable cause metrics might be about the object itself, about its child objects, or about other related objects.
They are the conditions, or symptoms, that are the first steps that led to the degraded condition of the object.
For example, an increase in CPU load by a virtual machine might lead to performance problems for other
virtual machines on the same ESX host, or for the ESX host itself.
Metric Concepts for vCenter Operations Manager Planning
Preparing to monitor your environment with vCenter Operations Manager involves some familiarity with
metrics that help you to identify a problem.
vCenter Server presents a use-based model of metrics. vCenter Operations Manager presents a demand-based
model of metrics. Some knowledge of the metrics that affect the data and graphs is useful to determine what
to do next in a workflow.
8 VMware, Inc.
Page 9

Chapter 1 vCenter Operations Manager Features
Table 1-1. Major Metric Concepts
Metric Description
Provisioned Amount of a resource that the user configures.
The provisioned metric might apply to the amount of
physical memory for a host or the number of vCPUs for a
virtual machine.
Usable Actual amount of a resource that the object can use.
The usable amount is less than or equal to the provisioned
amount. The difference between the provisioned amount
and usable amount stems from factors such as hardware
capacity and virtualization overhead. This overhead might
include the memory that an ESX host uses to run the host, to
support reservations for virtual machines, and to add a
buffer for high availability.
The usable metric does not apply to virtual machines.
Usage Amount of a resource that an object consumes.
The usage amount is less than or equal to the usable amount.
Demand Amount of a physical resource that the object might consume
without any existing constraints.
An object becomes constrained because of underprovisioning or contention with other consumers of the
resource. A virtual machine might require 10GB of memory
but can only get 5GB because the virtual machine must share
resources with other virtual machines on the host.
When the demand amount is less than the usage amount, the
environment might have wasted resources. When the
demand amount is greater than the usage amount, the
environment might incur latency and exhibit decreased
performance.
Contention Effect of the difference between the amount of the resource
that the object requires and the amount of the resource that
the object gets.
This metric measures the effect of conflict for a resource
between consumers. Contention measures latency or the
amount of time it takes to gain access to a resource. This
measurement accounts for dropped packets for networking.
Limit Maximum amount that an object can obtain from a resource.
The limit sets the upper bound for CPU, memory, or disk I/O
resources that you allocate and configure in vCenter Server.
The usage amount is less than or equal to the limit amount.
The demand amount can be greater than the limit amount.
The limit amount is less than or equal to the provisioned
amount.
The default limit amount is unlimited.
Rules: Usage <= Limit
Demand can be greater than Limit .
VMware, Inc. 9
Page 10

VMware vCenter Operations Manager Advanced Getting Started Guide
Table 1-1. Major Metric Concepts (Continued)
Metric Description
Reservation Guaranteed amount of resources for an object.
Entitlement Amount of a resource that a virtual machine can use based
The object does not start without this reserved amount. The
default amount is 0.
on the relative priority of that consumer set by the
virtualization configuration.
This metric is a function of provisioned resources, limit,
reservation, shares, and demand. Shares involve
proportional weighting that indicates the importance of a
virtual machine.
The entitlement amount is less than or equal to the limit
amount. The only case in which entitlement is less than
provisioned is when the total provisioned amount is greater
then total capacity.
The entitlement metric applies only to virtual machines.
Rules: Entitlement <= Limit <= Provisioned
Entitlement >= Reservations
10 VMware, Inc.
Page 11
Preparing to Monitor a
vCenter Operations Manager Virtual
Environment 2
Preparing to monitor the vCenter Operations Manager virtual environment involves understanding the
vCenter Operations Manager badges and the key metric concepts.
This chapter includes the following topics:
n
“Object Type Icons in the Inventory Pane,” on page 11
n
“Badge Concepts for vCenter Operations Manager Planning,” on page 12
n
“Major Badges in vCenter Operations Manager,” on page 12
n
“Working with Metrics and Charts on the All Metrics Tab,” on page 20
Object Type Icons in the Inventory Pane
All objects that vCenter Operations Manager monitors are listed in the inventory pane.
vCenter Operations Manager uses specific icons so that you can distinguish between virtual machines, ESX
hosts, and other objects in the inventory.
Table 2-1. Object Type Icons
Icon Description
World
The World object is a logical container for all monitored
objects in vCenter Operations Manager.
vCenter Server system
Datacenter
Cluster
ESX host that is in powered-off state
ESX host that is in powered-on state
Datastore
Virtual machine that is in powered-off state
Virtual machine that is in powered-on state
VMware, Inc. 11
Page 12

VMware vCenter Operations Manager Advanced Getting Started Guide
By default, objects in the inventory pane are grouped by hosts and clusters. You can select Datastores from
the drop-down menu at the top of the inventory pane to switch the way objects are grouped.
Badge Concepts for vCenter Operations Manager Planning
vCenter Operations Manager uses badges to illustrate derived metrics to provide an overview of the state of
the virtual environment or an individual object. These badges serve as focus points to narrow the scope of a
potential problem and provide details about the cause of the problem.
vCenter Operations Manager provides major and minor badges that are color coded and range from a healthy
green to a potentially problematic yellow, orange, or red. Badges are organized in a simple hierarchy in which
the scores of minor badges contribute to the scores of major badges.
Scores might reflect a healthy state or a potential problem depending on the type of badge. For example, low
scores for health, time remaining, and capacity remaining might indicate potential problems, while low scores
for faults, stress, or anomalies indicate a normal state.
You can use the Dashboard tab for an overview of the performance and condition of your virtual infrastructure.
The information you see on the Dashboard tab depends on the object you select in the navigation tree. See
“Object Type Icons in the Inventory Pane,” on page 11.
You can expand the panes on the Dashboard to view information about a specific badge. You can also doubleclick badges to view details about the metrics that affect badge scores.
Major Badges in vCenter Operations Manager
vCenter Operations Manager generates major badges that start a workflow and help you to identify health,
capacity risk, and efficiency issues.
Each major badge contains minor badges. vCenter Operations Manager calculates major badges based on the
state of the minor badges.
Defining Health to Measure the Overall State of the Environment
The vCenter Operations Manager Health badge serves as the first high-level indicator of the state of the virtual
environment.
The Health badge indicates immediate problems that might require your attention. It helps you identify the
current health of your system. vCenter Operations Manager combines workload, anomalies, and faults to
assess the overall health and to determine whether the workload level is expected in that environment. A low
health score might indicate a potential problem.
The overall health score for an object ranges from 0 (bad) to 100 (good). vCenter Operations Manager calculates
the Health score using the scores of the sub-badges that the Health badge contains. Faults are given precedence
in the Health score because they describe existing problems, while Workload and Anomalies are combined to
identify performance problems. This approach ensures that the score of the Health badge reflects the actual
state of the object, without overexposing or underestimating problems.
The Health score ranges between 0 (bad) and 100 (good). The badge changes its color based on the badge score
thresholds that are set by the vCenter Operations Manager administrator.
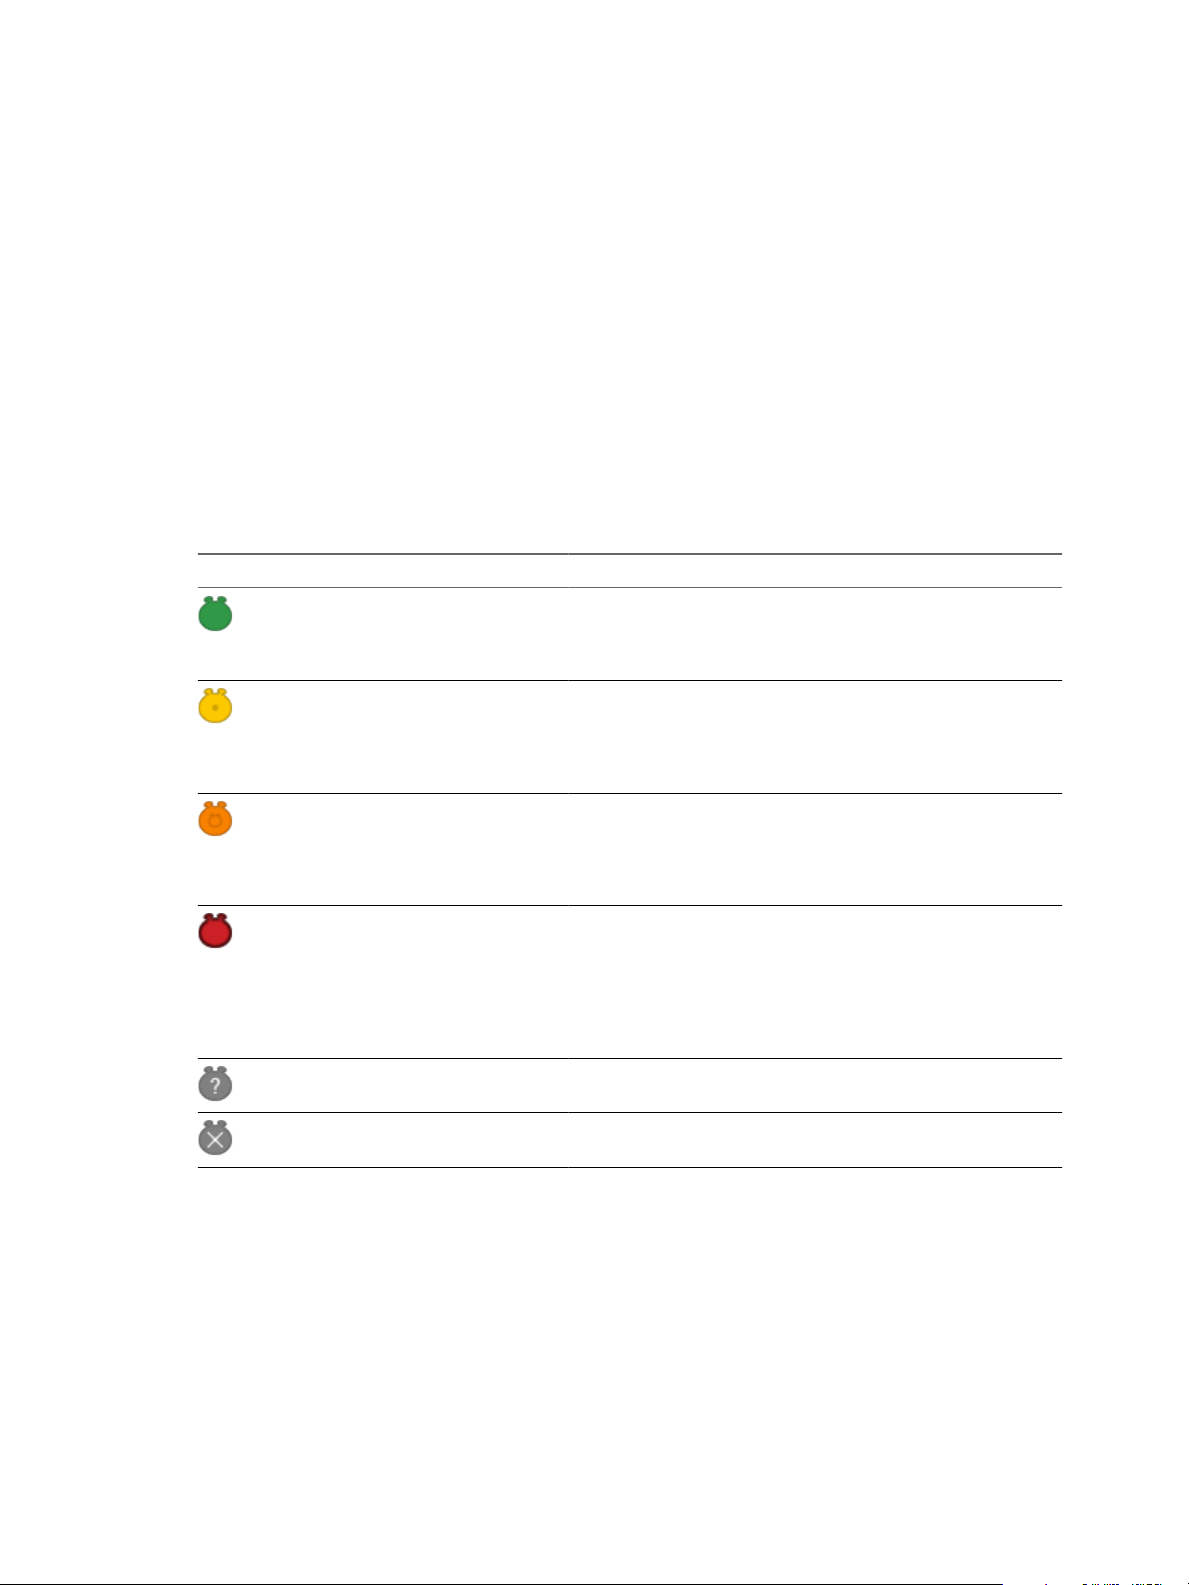
Table 2-2. Object Health States
Badge Icon Description User Action
The health of the object is
normal.
The object is experiencing some
level of problems.
12 VMware, Inc.
No attention required.
Check and take appropriate
action.
Page 13
Chapter 2 Preparing to Monitor a vCenter Operations Manager Virtual Environment
Table 2-2. Object Health States (Continued)
Badge Icon Description User Action
The object might have serious
problems.
The object is either not
functioning properly or will stop
functioning soon.
No data is available for any of
the metrics for the time period.
The object is offline.
Check and take appropriate
action as soon as possible.
Act immediately.
A vCenter Operations Manager administrator can change the badge score thresholds. For example, a green
Health badge can indicate a score above 80 instead of 75, as set by default.
Using the Workload Badge Under the Health Badge
The vCenter Operations Manager Workload badge measures how hard an object must work for resources. A
workload score of 0 indicates that a resource is not being used and a score that approaches or exceeds 100 might
cause performance problems.
Workload is an absolute measurement that calculates the demand for a resource divided by the capacity of an
object. Resources might include CPU, memory, disk I/O, or network I/O.
The Workload score ranges from 0 (good) to over 100 (bad). The badge changes its color based on the badge
score thresholds that are set by the vCenter Operations Manager administrator.
Table 2-3. Object Workload States
Badge Icon Description User Action
Workload on the object is not
excessive.
The object is experiencing some
high resource workloads.
Workload on the object is
approaching its capacity in at
least one area.
Workload on the object is at or
over its capacity in one or more
areas.
No data is available for any of
the metrics for the time period.
The object is offline.
No attention required.
Check and take appropriate
action.
Check and take appropriate
action as soon as possible.
Act immediately to avoid or
correct problems.
A vCenter Operations Manager administrator can change the badge score thresholds. For example, a green
Workload badge can indicate a score below 80 instead of 85, as set by default.
VMware, Inc. 13
Page 14
VMware vCenter Operations Manager Advanced Getting Started Guide
Using the Anomalies Badge Under the Health Badge
The vCenter Operations Manager Anomalies badge measures the extent of abnormal behavior for an object
based on historical metrics data. A high number of anomalies might indicate a potential issue.
A low Anomalies score indicates that an object is behaving in accordance with its established historical
parameters. Most or all of the object metrics, especially its KPIs, are within their thresholds. Because changes
in behavior often indicate developing problems, if the metrics of an object go outside the calculated thresholds,
the anomalies score for the object grows. As more metrics breach the thresholds, anomalies continue to increase.
Violations by KPI metrics increase the Anomalies score more than violations by non-KPI metrics. A high
number of anomalies usually indicates a problem or at least a situation that requires your attention.
Anomalies involves the number of statistics that fall outside of the expected behavior trends while Workload
involves an absolute measurement of how hard an object works for resources. Both Anomalies and Workload
are useful when attempting to find a probable cause and troubleshooting performance problems.
The Anomalies score ranges between 0 (good) and 100 (bad). The badge changes its color based on the badge
score thresholds that are set by the vCenter Operations Manager administrator.
Table 2-4. Object Anomalies States
Badge Icon Description User Action
The Anomalies score is normal. No attention required.
The Anomalies score exceeds the
normal range.
The Anomalies score is very
high.
Most of the metrics are beyond
their thresholds. This object
might not be working properly
or will stop working soon.
No data is available for any of
the metrics for the time period.
The object is offline.
Check and take appropriate
action.
Check and take appropriate
action as soon as possible.
Act immediately to avoid or
correct problems.
A vCenter Operations Manager administrator can change the badge score thresholds. For example, a green
Anomalies badge can indicate a score below 60 instead of 50, as set be default.
Using the Faults Badge Under the Health Badge
The vCenter Operations Manager Faults badge measure the degree of problems that the object might
experience based on events retrieved from the vCenter Server.
The events that might generate faults include the loss of redundancy in NICs or HBAs, memory checksum
errors, high availability failover, or Common Information Model (CIM) events, which require your immediate
attention.
The Faults score ranges between 0 (no faults) and 100 (critical faults). The badge changes its color based on the
badge score thresholds that are set by the vCenter Operations Manager administrator.
14 VMware, Inc.
Page 15
Chapter 2 Preparing to Monitor a vCenter Operations Manager Virtual Environment
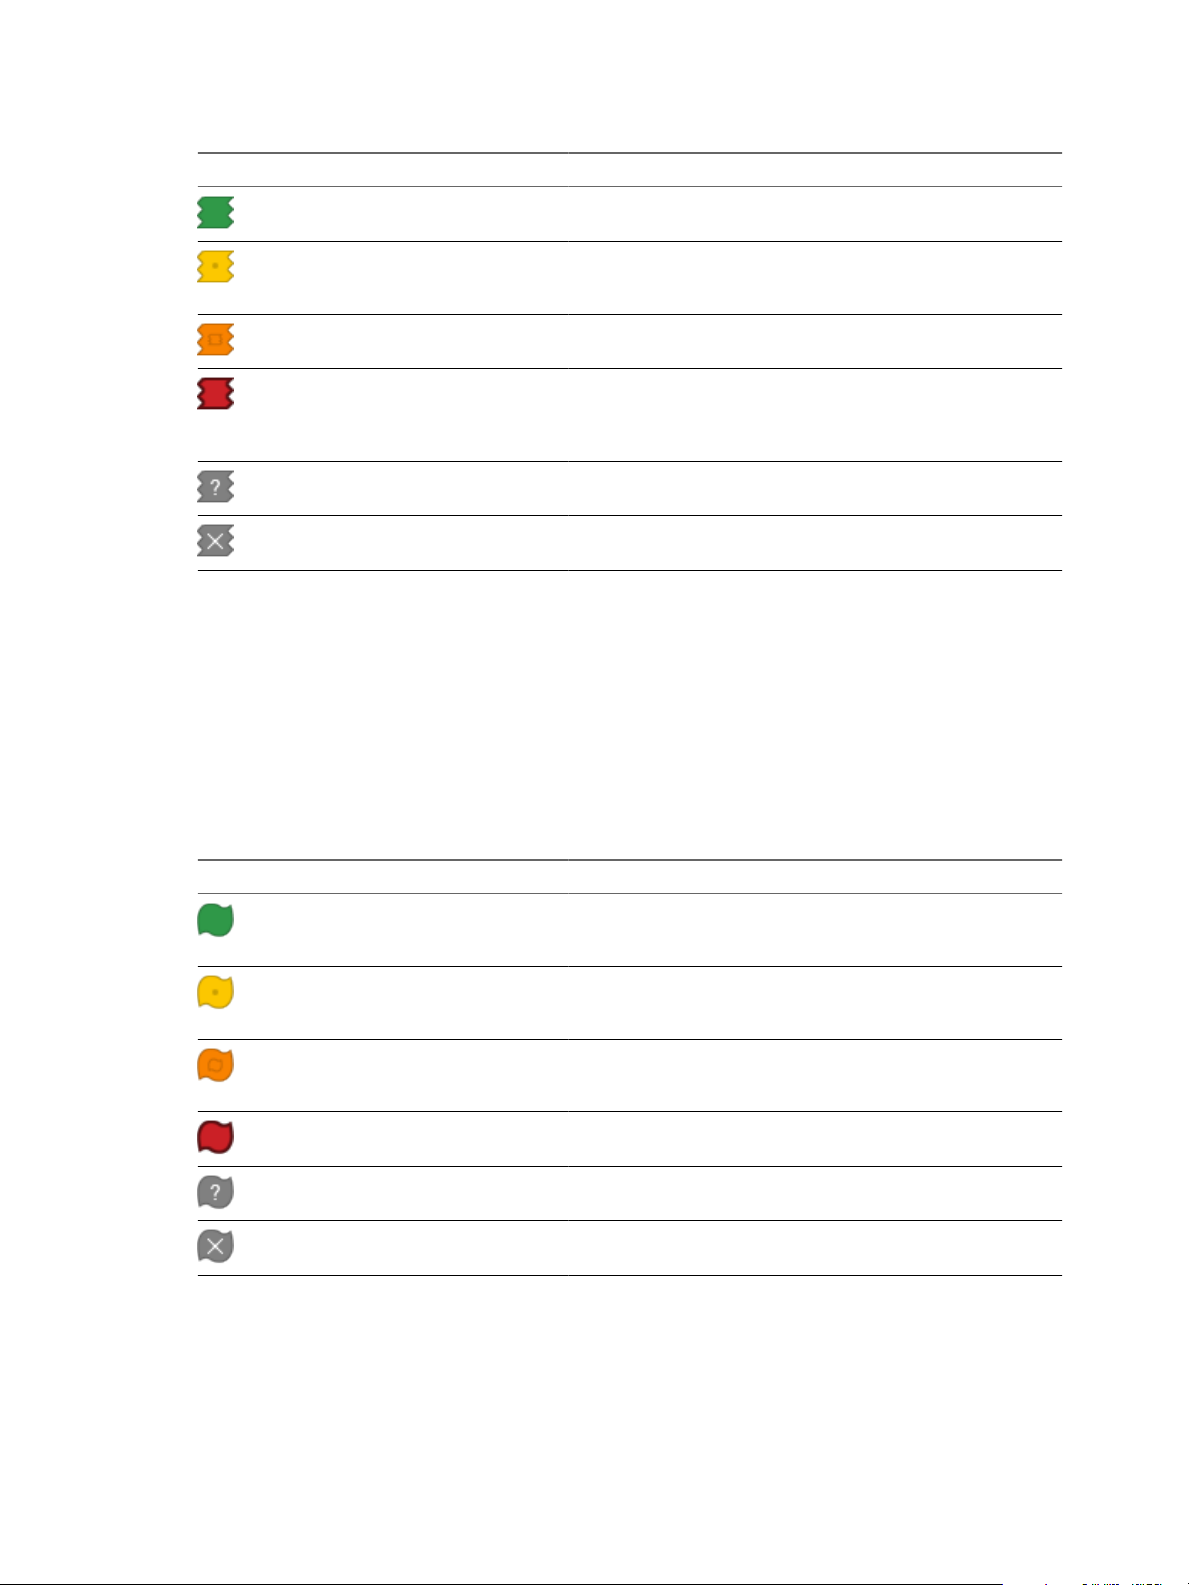
Table 2-5. Object Faults States
Badge Icon Description User Action
No faults are registered on the
selected object.
Faults of low importance are
registered on the selected object.
Faults of high importance are
registered on the selected object.
Faults of critical importance are
registered on the selected object.
No data is available for any of
the metrics for the time period.
The object is offline.
No attention required.
Check and take appropriate
action.
Check and take appropriate
action as soon as possible.
Act immediately to avoid or
correct problems.
A vCenter Operations Manager administrator can change the badge score thresholds. For example, a green
Faults badge can indicate a score below 40 instead of 25, as set by default.
Defining Risk to Assess Future Problems in vCenter Operations Manager
The vCenter Operations Manager Risk badge indicates a potential performance problem in the near future that
might affect the virtual environment.
Risk involves the time remaining, capacity remaining, and stress factors that account for the time buffer,
remaining virtual machines, and degree of habitual high workload.
vCenter Operations Manager calculates the risk score using the scores of the sub-badges that the Risk badge
contains. The formula that is applied to calculate the risk score is inverse geometric weighted mean.
The overall Risk score for an object ranges between 0 (no risk) to 100 (serious risk). The badge changes its color
based on the badge score thresholds that are set by the vCenter Operations Manager administrator.
Table 2-6. Object Risk States
Badge Icon Description User Action
The selected object has no
current problems. No problems
are expected in the future.
There is a low chance of future
problems or a potential problem
might occur in the far future.
There is a chance of a more
serious problem or a problem
might occur in the medium-term
future.
The chances of a serious future
problem are high or a problem
might occur in the near future.
No data is available for any of
the metrics for the time period.
The object is offline.
No attention required.
Check and take appropriate
action.
Check and take appropriate
action as soon as possible.
Act immediately.
VMware, Inc. 15
Page 16
VMware vCenter Operations Manager Advanced Getting Started Guide
Using the Time Remaining Badge Under the Risk Badge
The vCenter Operations Manager Time Remaining badge measures the time before a resource associated with
an object reaches capacity. This badge indicates the available timeframe to provision or load balance the
physical or virtual resources for a selected object.
vCenter Operations Manager calculates the Time Remaining score as a percentage of time that is remaining
for each compute resource compared to the provisioning buffer you set in the Configuration dialog box. By
default, the Time Remaining score provisioning buffer is 30 days. If even one of the compute resources has less
capacity than the provisioned buffer, the Time Remaining score is 0.
For example, if the provisioning buffer is set to 30 days, and the object that you selected has CPU resources for
81 days, memory resources for 5 days, disk I/O resources for 200 days, and network I/O resources for more
than one year, the Time Remaining score is 0, because one of the resources has capacity for less than 30 days.
The Time Remaining score ranges between 0 (bad) and 100 (good). The badge changes its color based on the
badge score thresholds that are set by the vCenter Operations Manager administrator.
Table 2-7. Time Remaining States
Badge Icon Description User Action
The number of days that remain
is much higher than the score
provisioning buffer you
specified.
The number of days that remain
is higher than the score
provisioning buffer, but is less
than two times the buffer you
specified.
The number of days that remain
is higher than the score
provisioning buffer, but
approaches the buffer you
specified.
The number of days that remain
is lower than the score
provisioning buffer you
specified. The selected object
might have exhausted some of
its resources or will exhaust
them soon.
No data is available for the Time
Remaining score.
The object is offline.
No attention required.
Check and take appropriate
action.
Check and take appropriate
action as soon as possible.
Act immediately.
Using the Capacity Remaining Badge Under the Risk Badge
The vCenter Operations Manager Capacity Remaining badge measures the number of additional virtual
machines that the object can handle before reaching capacity.
The remaining virtual machines count represents the number of virtual machines that can be deployed on the
selected object, based on the current amount of unused resources and the average virtual machine profile for
the last "n" weeks. The remaining virtual machines count is a function of the same compute resources of CPU,
Mem, Disk I/O, Net I/O, and Disk Space that are used to calculate the Time Remaining score.
vCenter Operations Manager calculates the Capacity Remaining score as a percentage of the remaining virtual
machines count compared to the total number of virtual machines that can be deployed on the selected object.
16 VMware, Inc.
Page 17

Chapter 2 Preparing to Monitor a vCenter Operations Manager Virtual Environment
The Capacity Remaining score ranges between 0 (bad) and 100 (good). The badge changes its color based on
the badge score thresholds that are set by the vCenter Operations Manager administrator.
Table 2-8. Object Capacity States
Icon Description User Action
The object is not expected to
reach its capacity limits
within the next 120 days.
You can deploy a large
number of virtual machines
on the selected object.
The object is expected to
reach its capacity limits in
less than 120 but more than
60 days. You can deploy a
limited number of virtual
machines to the selected
object.
The object is expected to
reach its capacity limits in
less than 60 but more than
30 days. You can deploy
very few virtual machines
to the selected object.
The object is expected to
reach its capacity limits
within the next 30 days. The
selected object cannot
accommodate more virtual
machines.
No data is available for any
of the metrics for the time
period.
The object is offline.
No attention required.
Check and take appropriate action.
Check and take appropriate action as soon as
possible.
Act immediately.
A vCenter Operations Manager administrator can change the default badge score thresholds. For example,
green can indicate a score above 60 instead of 50.
Using the Stress Badge Under the Risk Badge
The vCenter Operations Manager Stress badge measures a long-term workload that might involve undersized
virtual machines or ESX hosts or an excessive number of virtual machines. These conditions might generate
performance problems over time.
While workload is based on an instantaneous value, stress measures statistics over a longer period of time.
The Stress score helps you identify hosts and virtual machines that do not have enough resources allocated,
or hosts that are running too many virtual machines. A high Stress score does not imply a current performance
problem, but highlights potential for future performance problems.
The Stress score ranges between 0 (good) and 100 (bad). The badge changes its color based on the badge score
thresholds that are set by the vCenter Operations Manager administrator.
VMware, Inc. 17
Page 18
VMware vCenter Operations Manager Advanced Getting Started Guide
Table 2-9. Stress States
Badge Icon Description User Action
The Stress score is normal. No attention required.
Some of the object resources are
not enough to meet the
demands.
The object is experiencing
regular resource shortage.
Most of the resources on the
object are constantly
insufficient. The object might
stop functioning properly.
No data is available for the Stress
score.
The object is offline.
Check and take appropriate
action.
Check and take appropriate
action as soon as possible.
Act immediately.
Defining Efficiency to Optimize the Environment
The vCenter Operations Manager Efficiency badge identifies the potential opportunities to improve the
performance or cost of your virtual environment.
Efficiency accounts for the waste and infrastructure density in your environment. A large amount of wasted
resources combined with a low density ratio generates a poor efficiency score.
The Efficiency score ranges between 0 (bad) and 100 (good). The badge changes its color based on the badge
score thresholds that are set by the vCenter Operations Manager administrator.
Table 2-10. Object Efficiency States
Badge Icon Description User Action
The efficiency is good. The
resource use on the selected
object is optimal.
The efficiency is good, but can be
improved. Some resources are
not fully used.
The resources on the selected
object are not used in the most
optimal way.
The efficiency is bad. Many
resources are wasted.
No data is available for any of
the metrics for the time period.
The object is offline.
No attention required.
Select Planning > Views to
identify underused resources.
Select Planning > Views to
identify underused resources.
Try optimizing the resource use to
avoid resource waste.
18 VMware, Inc.
Page 19
Chapter 2 Preparing to Monitor a vCenter Operations Manager Virtual Environment
Using the Reclaimable Waste Badge Under the Efficiency Badge
The vCenter Operations Manager Reclaimable Waste badge accounts for resource types such as CPU, memory,
or disk, and measures the extent of excessive provisioning for an object. It also identifies the amount of
resources that you can reclaim and provision to other objects in your virtual environment.
The Reclaimable Waste score ranges between 0 (good) and 100 (bad). The badge changes its color based on the
badge score thresholds that are set by the vCenter Operations Manager administrator.
Table 2-11. Reclaimable Waste States
Badge Icon Description User Action
No resources are wasted on the
selected object.
Some resource can be used
better.
Many resources are underused. Select Planning > Views to
Most of the resources on the
selected object are wasted.
No data is available for any of
the metrics for the time period.
The object is offline.
No attention required.
Select Planning > Views to
identify underused resources.
identify underused resources.
Select Planning > Views to
identify underused resources.
A vCenter Operations Manager administrator can change the badge score thresholds. For example, a green
badge can indicate a score below 50 instead of 75, as set by default.
Using the Density Badge Under the Efficiency Badge
The vCenter Operations Manager Density badge measures consolidation ratios to assess cost savings. You can
assess the behavior and performance of a virtual machine and related applications to maximize the
consolidation ratio without affecting the performance or service level agreements.
The density score is the ratio of the actual density to an ideal density based on the demand, the amount of
virtual capacity, and the amount of physical usable capacity. Density calculates the amount of resources that
you can provision before contention or conflict for a resource occurs between objects. The ratios account for
the number of virtual machines to host, the number of virtual CPUs to physical CPU, and the amount of virtual
memory to physical memory.
The Density score ranges between 0 (bad) and 100 (good). The badge changes its color based on the badge
score thresholds that are set by the vCenter Operations Manager administrator.
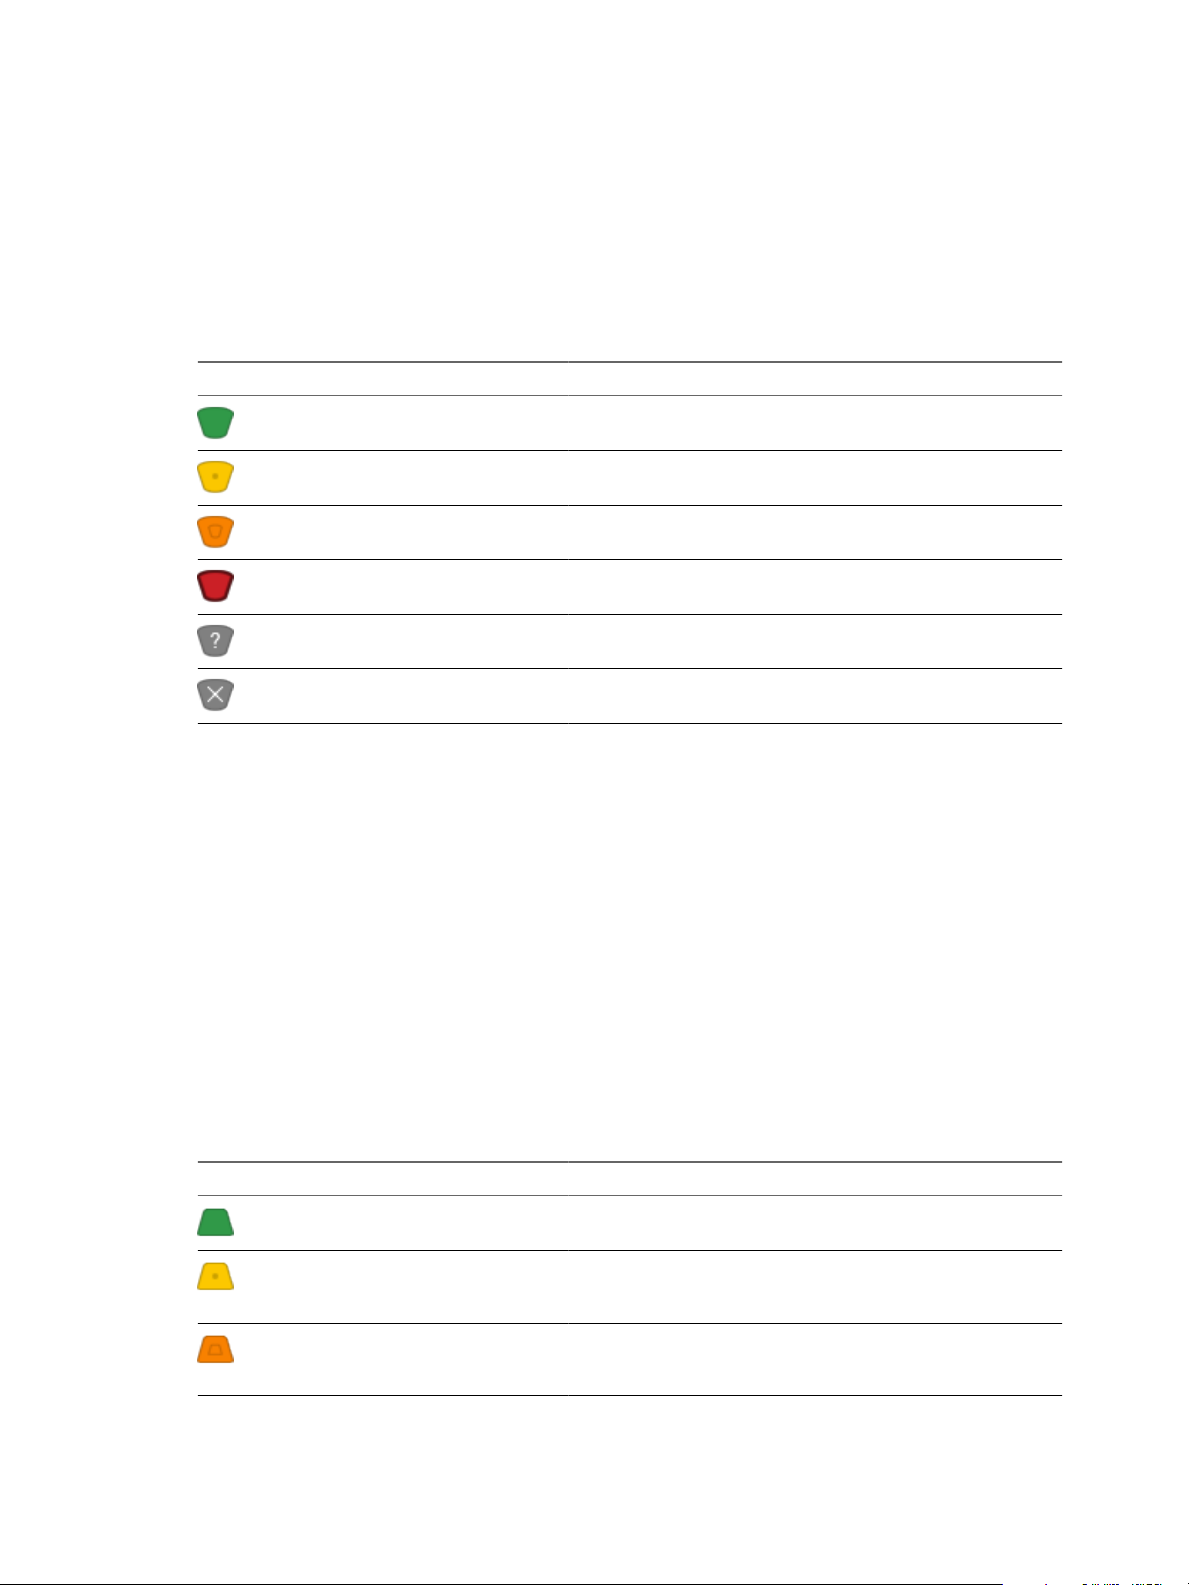
Table 2-12. Object Density States
Badge Icon Description User Action
The resource consolidation is
good.
Some resources are not fully
consolidated.
The consolidation for many
resources is low.
VMware, Inc. 19
No attention required.
Select Planning > Views to
identify resource consolidation
opportunities.
Select Planning > Views to
identify resource consolidation
opportunities.
Page 20
VMware vCenter Operations Manager Advanced Getting Started Guide
Table 2-12. Object Density States (Continued)
Badge Icon Description User Action
The resource consolidation is
extremely low.
No data is available for any of
the metrics for the time period.
The object is offline.
Select Planning > Views to
identify resource consolidation
opportunities.
A vCenter Operations Manager administrator can change the badge score thresholds. For example, a green
Density badge can indicate a score above 40 instead of 25, as set by default.
Working with Metrics and Charts on the All Metrics Tab
You can check the location of an object in the hierarchy and select metrics to view graphs of their historic values
for a period you define.
You can use the panes on the All Metrics tab under the Operations tab to search metrics and view metric
graphs.
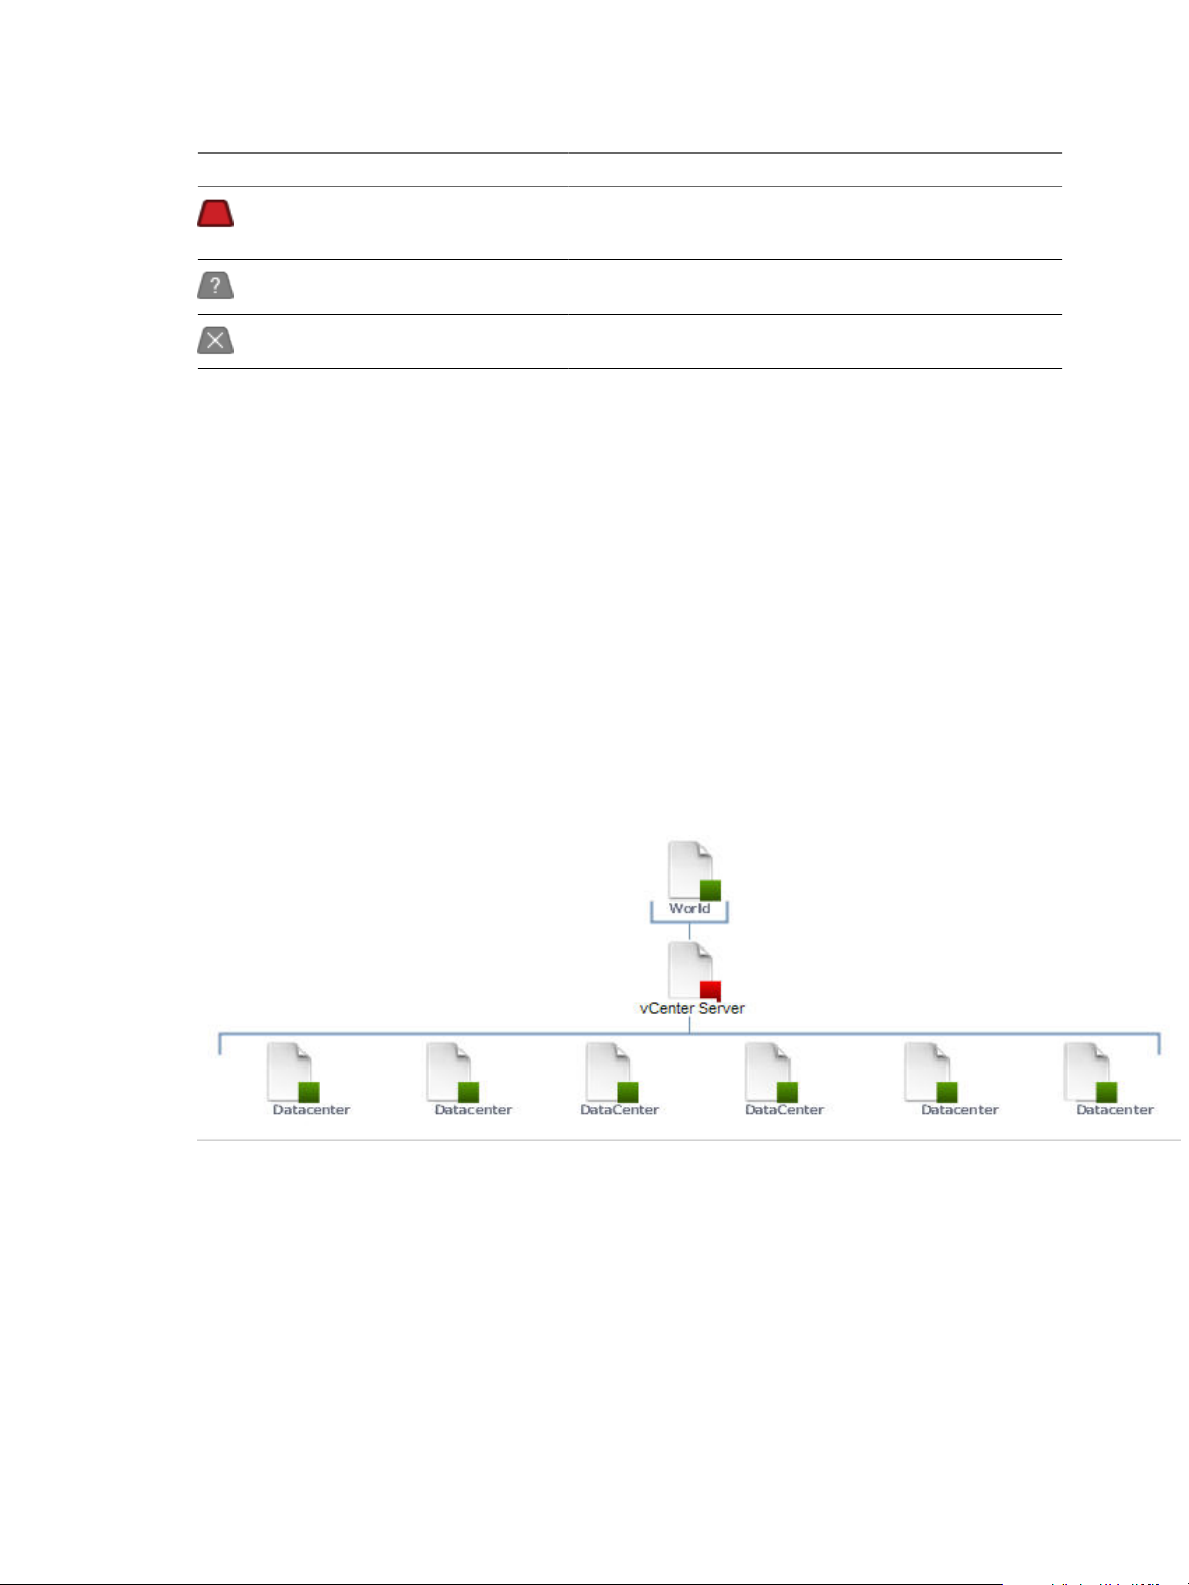
The Health Tree Pane
The Health Tree pane displays the location of the currently selected object in the hierarchy of your virtual
infrastructure. You can check all parent and child objects related to the currently selected object.
For example, the sample hierarchy shows the parent and child objects in the virtual infrastructure. The red
icon indicates a presence of a potential problem in the vCenter Server object. You can investigate the probable
cause of the problem from the Dashboard tab.
The Metric Selector Pane
The Metric Selector pane contains a list of all metric groups that are applicable to the currently selected object.
Metric groups contain all the metrics that are applicable to the currently selected object. The list of available
metrics is updated depending on the object you selected in the Health Tree pane.
The Search text box allows you find metrics using part of their names and filter the search results by metric
groups, instances or metric types.
For example, if you type % in the Search text box and select Metric from the drop-down menu, the search result
contains only metrics that are calculated as percentage.
20 VMware, Inc.
Page 21

Chapter 2 Preparing to Monitor a vCenter Operations Manager Virtual Environment
The Metric Chart Pane
The Metric Chart pane displays the graphs of the metrics you select from the Metric Selector pane. You can
view as many graphs as you want. You can control the appearance of metric graphs and create screenshots by
using the buttons in the Metric Chart pane.
Health Tree Pane Buttons
In the All Metrics tab under the Operations tab, you can use the buttons of the Health Tree pane to control
the appearance of monitored objects in the health tree.
Button Tooltip Icon Description
Zoom to fit Resizes the view so all related objects fit in the health tree area. All previous zoom operations
are discarded.
Enter pan mode Allows you to pan the health tree.
Show values on point Enables metric value tooltips so that they appear when you point the graph with the mouse
pointer.
Enter zoom mode Allows you to enlarge sections of the health tree by drawing rectangles to enclose the area
to enlarge.
Zoom in Enlarges the middle of the health tree by one level.
Zoom out Reduces the middle of the health tree by one level.
Reset to initial object Reset the Health Tree pane to the original view for the selected object..
Metric Chart Pane Buttons
On the All Metrics page, you can use the buttons of the Metric Chart pane to customize the appearance of
charts, and add or delete charts.
Global Control Buttons
These buttons control the appearance of all graphs that you open in the Metric Chart pane.
Button Tooltip Icon Description
Separate graphs by period Splits the current metrics graph in separate graphs by periods based on your selection
in the time and date widget.
Show/hide Y-axis Displays or hides the Y axis of the graph to display metric values.
Show/hide metric line Displays or hides the line that connects the data points in the metric graph.
Show/hide trend line Displays or hides the line that represents the trend of the currently selected metric in
the graph.
Show 24-hour dynamic
thresholds
Show entire period dynamic
thresholds
Show/hide anomalies Displays or hides the anomalies that occurred during the selected period in the graph.
Displays or hides the calculated dynamic threshold values for a 24-hour period in the
graph.
Displays or hides the calculated dynamic threshold values for the entire monitoring
period in the graph.
VMware, Inc. 21
Page 22

VMware vCenter Operations Manager Advanced Getting Started Guide
Button Tooltip Icon Description
Retrieve complete metric
values
Enable X-axis zoom Allows you to enlarge the selected area of the graph only on the X axis while the Y
Enable Y-axis zoom Allows you to enlarge the selected area of the graph only on the Y axis while the X
Zoom to fit Resizes the charts so the entire graphs for all selected periods fit in the chart area. All
Zoom Y-axis to dynamic
thresholds
Compress Y-axis Shortens the graph.
Zoom all graphs together Resizes all metric graphs that are open in the Metric Chart pane.
Enter zoom mode Enables resizing of the metric graphs on both axis Y and axis X.
Enter pan mode When in zoom mode, allows you to drag the enlarged section of the graph around to
Show value on point Enables metric value tooltips so that they appear when you point the graph with the
Refresh Reloads all graphs in the Metric Chart.
In zoom mode, displays the values of the selected metric when you move the mouse
pointer over the graph.
axis remains static.
axis remains static.
previous zooms are discarded.
Resizes the Y axis of the metric chart so that the highest and the lowest values on the
axis are the highest and the lowest values of the dynamic threshold calculated for this
metric.
view higher, lower, earlier, or later values of the metric.
mouse pointer.
Turn auto refresh on/off Activates or deactivates the auto refresh option for metric charts.
Open date/time controls Opens the date and time widget for you to select the period to display on the metric
graph.
Remove all graphs Deletes all graphs from the Metric Chart pane.
Chart-Specific Buttons
These buttons control the specific chart to which they are attached. Some chart-specific buttons are available
only when you view graphs split by period.
Button Tooltip Icon Description
Move up When multiple graphs are open in the Metric Chart pane, this button moves the selected
graph one place up. Available only for split graphs view.
Move down When multiple graphs are open in the Metric Chart pane, this button moves the selected
graph one place down. Available only for split graphs view.
Save a snapshot Creates a real-size snapshot of the selected graph and opens a File Download window for
you to open or save the PNG file.
Save a full screen
snapshot
Download comma
separated data
Close Deletes the selected graph from the Metric Chart pane. Available only for split graphs view.
Creates an enlarged snapshot of the selected graph and opens a File Download window for
you to open or save the PNG file.
Creates a comma separated values file with the metric data for the selected graph and opens
a File Download window for you to open or save the CSV file. Available only for split graphs
view.
22 VMware, Inc.
Page 23

Planning the
vCenter Operations Manager
Workflow 3
Planning your workflow in a vCenter Operations Manager virtual environment involves reacting to day-today problems and initiating ways to proactively prevent problems and find opportunities for resource
optimization and cost savings.
Use the vCenter Operations Manager badges to help guide your workflow.
This chapter includes the following topics:
n
“Monitoring Day-to-Day Activity in vCenter Operations Manager,” on page 24
n
“Identify an Overall Health Issue,” on page 24
n
“Determine the Timeframe and Nature of a Health Issue,” on page 24
n
“Determine Whether the Environment Operates as Expected,” on page 25
n
“Identify the Source of Performance Degradation,” on page 26
n
“Identify Events that Occurred when an Object Experienced Performance Degradation,” on page 26
n
“Identify the Top Resource Consumers,” on page 27
n
“Determine the Extent of a Performance Degradation,” on page 27
n
“Determine When an Object Might Run Out of Resources,” on page 28
n
“Determine the Cause of a Problem with a Specific Object,” on page 28
n
“Address a Problem with a Specific Virtual Machine,” on page 29
n
“Address a Problem with a Specific Datastore,” on page 30
n
“Identify Objects with Stressed Capacity,” on page 30
n
“Identify Stressed Objects with vCenter Operations Manager,” on page 31
n
“Identify the Underlying Memory Resource Problem for Clusters and Hosts,” on page 31
n
“Identify the Underlying Memory Resource Problem for a Virtual Machine,” on page 32
n
“Determine the Percentage of Used and Remaining Capacity to Assess Current Needs,” on page 32
VMware, Inc.
23
Page 24

VMware vCenter Operations Manager Advanced Getting Started Guide
Monitoring Day-to-Day Activity in vCenter Operations Manager
Monitoring day-to-day activity in the vCenter Operations Manager virtual environment involves evaluating
the overall health of the system and reacting to potential problems at the current time.
Identify an Overall Health Issue
The Health badge is the indicator of a potential problem in the virtual environment that
vCenter Operations Manager monitors.
By default, the Dashboard tab displays information about the World object. You can select another object in
the inventory pane to check for immediate health problems on the object. (You can also use the Search text box
at the upper right, entering part or all of the object's name, to locate an object.)
Prerequisites
In the vCenter Operations Manager interface, verify that the Dashboard tab is open.
Procedure
1 On the Dashboard tab, check the color of the Health badge.
2 If the color of the Health badge is other than green, click the arrow under the badge to expand the detailed
view.
The Health pane displays the sub-badges for Workload, Anomalies, and Faults. Badge colors help you
identify the possible cause of the problem.
3 Identify the cause of the health problem depending on the object that you selected in the inventory pane.
Selected Object Action
n
World
n
vCenter Server
n
Datacenter
n
Cluster
n
ESX host
n
Virtual machine
n
Datastore
a In the Health pane, identify the sub-badge that indicates poor score.
b Click the Environment tab under the Operations tab.
c Select the sub-badge that indicated poor score on the Dashboard page.
d Check the Environment tab for badges of related objects that are
indicating problems.
e Double-click an object that indicates poor score.
f On the Details tab under the Operations tab, navigate to the object that
the badge represents and review the resource data, key metrics, and
badge-specific information.
a In the Health pane, identify the sub-badge that indicates poor score and
click it.
b On the Details tab under the Operations tab, review the resource data,
key metrics, and badge-specific information.
What to do next
How you proceed depends on your findings on the Details page.
Determine the Timeframe and Nature of a Health Issue
The Dashboard provides information to help you determine the nature and timeframe of a health issue,
including whether it is a transient or chronic problem.
By default, the Dashboard tab displays information about the World object. You can select another object in
the inventory pane to check for immediate health problems on the object. (You can also use the Search text box
at the upper right, entering part or all of the object's name, to locate an object.)
24 VMware, Inc.
Page 25

Chapter 3 Planning the vCenter Operations Manager Workflow
Prerequisites
In the vCenter Operations Manager interface, verify that the Dashboard tab is open.
Procedure
1 In the Health pane, check whether the Weather Map of Health displays colors other than green. (The
weather map is most appropriate for grouped objects such as the World, vCenters, and Datacenters.)
Colors that dominate the map over the past six hours indicate a larger trend.
2 If a trend exists, click the Health badge.
The Details tab under the Operations tab appears.
3 To identify the type of problem an object has, click the Workload, Anomalies, or Faults badge and point
to the metric values for more information.
4 Click the Dashboard tab and expand the Risk pane to check the Stress graph.
The graph in the Stress pane displays the resource demand over the past week and helps you determine
when the peak demand occurred.
5 If a particular peak, such as a 6 p.m. peak, exists that might require investigation, click the Stress badge.
The Views tab under the Planning page appears.
What to do next
Click the Views tab under the Planning tab to investigate possible causes of the problem and assess resources
allocation.
Determine Whether the Environment Operates as Expected
Anomalies in vCenter Operations Manager provide insight into the behavior of your environment and help
you to determine whether a high workload might still reflect a normal or expected load.
By default, the Dashboard tab displays information about the World object. You can select another object in
the inventory pane to check for immediate health problems on the object. (You can also use the Search text box
at the upper right, entering part or all of the object's name, to locate an object.)
In the Anomalies pane, the blue line represents the actual level of anomalies for the selected object. The gray
line represents the noise threshold line that shows the normal level of anomalies for the selected object.
Prerequisites
In the vCenter Operations Manager interface, verify that the Dashboard tab is open.
Procedure
1 In the inventory pane, select the object that you want to inspect.
2 Click the arrow under the Health badge to expand the detailed view.
3 In the Anomalies pane, check the badge score and the noise threshold line.
If the blue line of the abnormal metric count is far below the noise line, the level of anomalies is normal.
If the blue line of abnormal metric count approaches or surpasses the noise line, the object might be
experiencing health degradation.
4 If you see an abnormal level of anomalies, click the Anomalies badge.
The Details tab opens and you can continue investigating the problem.
VMware, Inc. 25
Page 26

VMware vCenter Operations Manager Advanced Getting Started Guide
What to do next
On the Details tab under the Operations tab, you can check metric values to identify the resource that might
be causing the high Anomalies score. Depending on which resource indicates abnormal operation, check the
Key Metrics pane for further information.
Identify the Source of Performance Degradation
Identifying the probable source of performance degradation in vCenter Operations Manager involves
investigating the percentage of CPU, memory, disks, and network resources usage in the virtual environment.
Prerequisites
Verify that you are logged in to a vSphere Client and that vCenter Operations Manager is open.
Procedure
1 In the inventory pane, select the object that you want to inspect.
2 Click the Environment tab under the Operations tab, and select the Workload badge.
3 To filter the objects and related objects by state, click the Status Filter buttons to view only the red, orange,
and yellow states.
4 Point to the object state other than green to view the workload details.
5 Double-click a related object to investigate why it is experiencing heavy resource demands.
6 On the Details tab under the Operations tab, you can check the percentage of resource use that might be
causing the high Workload score.
7 To locate the available resources of the object and related objects, click the Scoreboard tab under the
Operations tab, and select the Workload badge.
The Scoreboard tab displays the workload scores for all ESX hosts in the cluster. By default, ESX hosts
with a high workload are presented as large badges.
8 To filter the objects and related objects by state, click the Status Filter buttons to view only the red, orange,
and yellow states.
9 Click the object that indicates a poor score.
10 On the Details tab under the Operations tab, review the Resources pane and the Workload graphs to
assess the potential capacity to move virtual machines to balance the workload.
What to do next
Click the Analysis tab to compare the performance of selected objects across the virtual infrastructure. You
can use this information to balance the load across ESX hosts and virtual machines.
Identify Events that Occurred when an Object Experienced Performance Degradation
Identifying when the abnormal events started to cause performance degradation and the trend of the problem
in vCenter Operations Manager involves examining the Health scores of the object and its related objects.
In the Events tab under the Operations tab, you can view graphs of health-related badge scores and events
that occurred on the selected object and its related objects. When you notice that the score of a badge changed
after an event occurred, you can click that event to view more details.
Prerequisites
Verify that you are logged in to a vSphere Client and that vCenter Operations Manager is open.
26 VMware, Inc.
Page 27

Procedure
1 In the inventory pane, select the object that you want to inspect.
2 If the color of the Health badge is other than green, click the Events tab under the Operations tab to see
events that occurred as far back as a month.
Use the buttons above the badge score graph to control what you see on the Events tab.
3 Point to the abnormal event in the Events graph to view the time range when the problem started to
decrease the possible causes that contributed to the poor badge score.
What to do next
Depending on the details of the event, investigate the problem in vCenter Server.
Identify the Top Resource Consumers
To address high use levels in your virtual environment, identify the top resource consumers.
Prerequisites
Verify that you are logged in to a vSphere Client and that vCenter Operations Manager is open.
Procedure
Chapter 3 Planning the vCenter Operations Manager Workflow
1 Click the Analysis tab to view the heat map gallery.
2 Depending on the resource, select a CPU, memory, network, or storage focus area.
3 To view a heat map that shows contention by use, select the host, virtual machine, or cluster object.
The larger the size of the heat map tile, the higher the use.
Click the Analysis tab to view the heat map gallery.
4 If a color other than green indicates a potential problem, click Details for the object in the pop-up window
to investigate the resources for that object.
What to do next
Identify the top consumers of resources such as CPU or memory.
Determine the Extent of a Performance Degradation
After you identify the performance problem, determine the effect on the rest of the object population and the
consistency of the issue.
Prerequisites
Verify that you are logged in to a vSphere Client and that vCenter Operations Manager is open.
Procedure
1 In the inventory pane, select the object that you want to inspect.
2 Click the Health badge if it is other than green.
3 In the Related Objects pane of the Details tab, verify the color of the Parent Objects and Peer Objects
icons.
n
If the selected object is the only object with a high score, no effect exists on the Peer Objects or Child
Objects.
n
If the Parent Object is in a red, yellow, or orange state, click the Parent Object to investigate the details.
VMware, Inc. 27
Page 28

VMware vCenter Operations Manager Advanced Getting Started Guide
Determine When an Object Might Run Out of Resources
The Time Remaining pane under the Risks badge provides a summary of when an object in the virtual
environment might run out of resources such as disk space, memory, CPU, or network.
Prerequisites
Verify that you are logged in to a vSphere Client and that vCenter Operations Manager is open.
Procedure
1 In the inventory pane, select the object that you want to inspect.
2 Click the Risk tab under the Dashboard tab, and click the arrow under the badge to expand the detailed
view.
3 In the Time Remaining pane, identify the resource that is approaching capacity.
4 Click the Summary tab under the Planning tab.
5 In the Objects and Resources pane, view a breakdown of the remaining capacity and trend information
for each resource.
The Time Remaining value represents an aggregated forecast based on the number of virtual machines
and indicates when capacity might equal resource use.
What to do next
To further investigate which resources constrain the virtual machine count, click the Views tab and select the
Virtual Machine Capacity - Summary view.
Determine the Cause of a Problem with a Specific Object
Determining a cause of a problem with a specific object involves identifying whether the problem is transient
or chronic in the virtual environment.
Prerequisites
Verify that you are logged in to a vSphere Client and that vCenter Operations Manager is open.
Procedure
1 In the inventory pane, select the object that you want to inspect.
2 Check the Health, Risk and Efficiency scores for the object.
n
If any of the scores are in the yellow, orange or red state, click the badge and investigate the subbadges.
n
If the problem is because of Health, click the Anomalies badge to check for changes in expected
behavior and the Workload badge to assess whether heavy resource demand exists.
3 Determine whether the demand experienced is for a specific time or whether it indicates a longer trend.
n
If the demand is transient, in the Health pane check the Workload badge.
n
If the problem results from chronic stress, in the Risk pane, check the Stress badge and click the object
in the yellow, orange, or red state.
4 Click the Summary tab under the Planning tab to check the trend and forecast of CPU and memory
demand for that object.
If the object is approaching capacity, consider moving some virtual machines to a less resource-constrained
object.
28 VMware, Inc.
Page 29

Chapter 3 Planning the vCenter Operations Manager Workflow
5 Identify the top transient resource consumers, click the Scoreboard tab under the Operations tab, and
select the Workload badge.
6 To filter the objects and related objects by Workload, click the Status Filter buttons to view only the red,
orange, and yellow states.
You can prioritize the virtual machines with high Workload scores and move them to a less resourceconstrained object.
7 Identify the resource consumers causing chronic stress, click the Scoreboard tab under the Planning tab,
and select the Stress badge.
8 To filter the objects and related objects by Stress, click the Status Filter buttons to view only the red, orange,
and yellow states.
You can prioritize the virtual machines with high Stress scores and move them to a less resourceconstrained object.
What to do next
Identify a candidate object to which to move the problem virtual machines, click the Analysis tab, and select
the CPU orMemory focus area depending on the constrained resource for the virtual machine object.
The heat map gallery helps identify candidate objects to which to move the virtual machines.
Address a Problem with a Specific Virtual Machine
Identifying the cause of a problem with a specific virtual machine involves investigating whether the problem
is because of a constraining environment or because of changes in the guest operating system configuration.
Prerequisites
Verify that you are logged in to a vSphere Client and that vCenter Operations Manager is open.
Procedure
1 Search for the problematic virtual machine name in the vCenter Operations Manager search box.
2 Check the Health, Risk and Efficiency scores for the virtual machine.
n
If any of the badges are in the yellow, orange or red state, click the badge and investigate the
subbadges.
n
If the problem is because of Health, check the Anomalies badge for changes in expected behavior and
the Workload badge to assess whether heavy resource demand exists.
n
If the problem results from chronic stress, identify the constraining resource, such as CPU or memory,
and click the Stress badge under the Riskpane for more information.
3 Click the Summary tab under the Planning tab to check the trend and forecast of CPU and memory
demand for that virtual machine and the host that stores it.
If the forecast indicates a virtual machine resource demand problem, increase the resources allocated to
the virtual machine.
4 Identify an object candidate to which to move the virtual machines, click the Analysis tab, and select the
CPU or memory focus areas depending on the constrained resource for the virtual machine.
The heat map gallery helps identify cluster or host candidates to which to move the virtual machines.
5 If the problem results from changes to the guest operating system configuration, click the Events tab under
the Operations tab for that virtual machine.
VMware, Inc. 29
Page 30

VMware vCenter Operations Manager Advanced Getting Started Guide
6 Examine the Events graph to see if the guest operating system change events or vSphere events caused
the problem.
The guest change events will have a different icon shape.
Address a Problem with a Specific Datastore
Identifying the cause of a problem with a specific datastore involves investigating the I/O intensive virtual
machines that adversely affect the disk space.
Prerequisites
Verify that you are logged in to a vSphere Client and that vCenter Operations Manager is open.
Procedure
1 Search for the problematic datastore name in the vCenter Operations Manager search box.
2 Check the Health, Risk and Efficiency scores for the datastore.
3 If the Risk badge shows that disk I/O is approaching capacity, click the Summary tab under the
Planning tab to view the forecast of resources and constrained resources.
a On the Analysis tab, select the Storage focus area and the Datastore object to view Datastore I/O
Contention Sized by I/O Usage Grouped by Datastore candidates that can accommodate the large
disk I/O virtual machines.
b Move the disk I/O intensive virtual machines to another datastore.
4 If the datastore shows that disk space is approaching capacity, click the Summary tab under the
Planning tab to view the breakdown of the resource capacity usage.
If snapshots occupy a significant amount of disk space, remove snapshots from some of the virtual
machines on the datastore.
5 On the Analysis tab, select the Storage focus area and click Datastore Space Waste Sized by Space Usage
Grouped By Datacenter to list the virtual machines in the datastore.
What to do next
Filter the virtual machines in the red, orange, and yellow states to identify the virtual machines that waste the
most disk space.
Identify Objects with Stressed Capacity
Identify the stressed virtual machines, hosts, and clusters that might require more capacity.
Prerequisites
In the vCenter Operations Manager interface, verify that the Dashboard tab is open.
Procedure
1 Click the Risk tab under the Dashboard tab, and click the arrow under the badge to expand the detailed
view.
2 To view the number of any stressed objects, select an object other than a datastore from the inventory
pane.
3 To investigate the details of stressed objects, click the Stress badge.
The Views tab opens.
4 Select the Stress badge and access the view that corresponds to the object.
30 VMware, Inc.
Page 31

Chapter 3 Planning the vCenter Operations Manager Workflow
What to do next
Assign less work to the virtual machines or reconfigure the capacity appropriate to the virtual machine load.
Identify Stressed Objects with vCenter Operations Manager
Identify the stressed or undersized hosts and clusters to assign more capacity to those objects and optimize
the load.
Prerequisites
Verify that you are logged in to a vSphere Client and that vCenter Operations Manager is open.
Procedure
1 In the inventory pane, select the object that you want to inspect.
2 Click the View tab under the Planning tab and select the Stressed Hosts and Clusters - List view.
The objects that appear in this view are overused and have fewer resources than the virtual machines
demand.
What to do next
Assign less work to these hosts and clusters or reconfigure the capacity appropriate to the workload.
Identify the Underlying Memory Resource Problem for Clusters and Hosts
When you navigate through a vCenter Operations Manager workflow and identify a cluster or a host with a
potential problem, check the CPU metric graphs to identify a possible resolution.
vCenter Operations Manager presents memory information that shows the metric relationships and the
breakdown of the way the virtual machines use the memory resource.
Prerequisites
In the vCenter Operations Manager interface, verify that the Dashboard tab is open.
Procedure
1 In the inventory pane, select the object that you want to inspect.
2 Click the Environment tab under the Operations tab.
3 Click the Workload badge.
4 On the Details tab, analyze the memory metrics graphs for the virtual machine's workload.
Metric Relationship Meaning
Demand is less than Usage
Memory Reserved is less than
Memory Usable
Virtual machines that receive memory relinquish that memory only when
other virtual machines require it. The host does not reclaim memory from a
virtual machine just because that memory is not in demand.
It is acceptable for memory reservation to be less than usable memory.
However, you might want to increase the reservation to guarantee resources
in the range of normal demand.
What to do next
Understand the metric relationships in the CPU graphs and solve the underlying resource problem.
VMware, Inc. 31
Page 32

VMware vCenter Operations Manager Advanced Getting Started Guide
Identify the Underlying Memory Resource Problem for a Virtual Machine
When you navigate through a vCenter Operations Managerworkflow and identify a virtual machine with a
potential problem, you can resolve the underlying problem by using the memory metric data.
The CPU graphs for clusters and hosts show the Provisioned metric. The CPU graphs for virtual machines
show the Entitlement metric. See “Metric Concepts for vCenter Operations Manager Planning,” on page 8.
Prerequisites
In the vCenter Operations Manager interface, verify that the Dashboard tab is open.
Procedure
1 In the inventory pane, select the object that you want to inspect.
2 Click the Environment tab under the Operations tab.
3 If the color of the badge is other than green, double-click it.
4 On the Details tab, select the Workload badge to analyze the memory metrics graphs.
Metric Relationship Meaning
Demand is equal to Usage
Demand is greater than Usage
Demand is greater than Usage and
less than Provisioned
Object has enough resources.
Virtual machine might be in the process of waiting for CPU cycles.
This metric relationship indicates the following implications:
n
Limits set on a virtual machine might cause the virtual machine to use
less CPU resources than the demand. vCenter Operations Manager
aggregates CPU metrics for virtual machines into the host CPU graph.
n
The CPU Dynamic Power Management in the BIOS might cause a CPU
issue. Verify that the setting is in operating system control mode or
disable the setting.
n
Virtual machines that are usually idle but happen to become busy at the
same time might cause contention.
Understand the metric relationships in the memory graphs and solve the underlying resource problem for the
virtual machine.
Determine the Percentage of Used and Remaining Capacity to Assess Current Needs
The Capacity Remaining pane under the Risk badge provides an overview of the used and remaining capacity
for all objects except virtual machines.
You can use the bar chart under the Capacity Remaining badge to determine how much space you have in
which to add new virtual machines to your environment.
Prerequisites
In the vCenter Operations Manager interface, verify that the Dashboard tab is open.
Procedure
1 In the inventory pane, select the object that you want to inspect.
2 Click the arrow under the Risk badge to expand the detailed view.
3 Under the Capacity Remaining badge, review the bar chart of used and remaining capacity.
4 To view more details about capacity-related metrics, click the Capacity Remaining badge.
32 VMware, Inc.
Page 33

Chapter 3 Planning the vCenter Operations Manager Workflow
5 On the Views tab, you can switch views to find aggregate information for used and total capacity, and
capacity trends.
VMware, Inc. 33
Page 34

VMware vCenter Operations Manager Advanced Getting Started Guide
34 VMware, Inc.
Page 35

Preparing Proactive Workflows in
vCenter Operations Manager 4
vCenter Operations Manager supports workflows for assessing both current issues and risks to future capacity
for mission-critical objects as well.
Planning for capacity risk involves analyzing, optimizing, and forecasting data to determine how much
capacity is available and whether you make efficient use of the infrastructure.
This chapter includes the following topics:
n
“Planning and Analyzing Data for Capacity Risk,” on page 35
n
“Optimizing Data for Capacity,” on page 39
n
“Forecasting Data for Capacity Risk,” on page 43
Planning and Analyzing Data for Capacity Risk
Planning and analyzing data for capacity risk in vCenter Operations Manager involves using more than 20
predefined heat maps in the Analysis tab to compare commonly used metrics and create a plan to reduce waste
in the virtual infrastructure.
Identify Clusters with the Space for Virtual Machines
Identify the clusters in a datacenter that have space for your next set of virtual machines.
Prerequisites
Verify that you are logged in to a vSphere Client and that vCenter Operations Manager is open.
Procedure
1 Click the Analysis tab.
2 In the heat map gallery, narrow the scope from the drop-down menu to display the remaining capacity
for clusters.
Option Action
Focus Area
Smallest Box Shows
Description
3 Click theCluster Capacity Remaining Sized By Workload Grouped By Datacenter view.
4 In the heat map, point to each cluster area to view the percentage of remaining capacity.
Select Capacity.
Select Cluster.
Select Cluster Capacity Remaining Sized By Workload Grouped By
Datacenter.
VMware, Inc.
35
Page 36

VMware vCenter Operations Manager Advanced Getting Started Guide
5 If a color other than green indicates a potential problem, click Details in the pop-up window to investigate
the resources for the cluster or datacenter.
What to do next
Identify the green clusters with the most capacity to store virtual machines.
Identify the Source of Performance Degradation Through Heat Maps
Identifying the source of a performance problem in vCenter Operations Manager involves investigating cluster
and host health heat maps.
Prerequisites
Verify that you are logged in to a vSphere Client and that vCenter Operations Manager is open.
Procedure
1 In the inventory pane, select the object that you want to inspect.
2 Click the Analysis tab.
3 In the heat map, narrow the scope from the drop-down menu to display the cluster and host health sized
according to workload.
Option Action
Focus Area
Smallest Box Shows
Description
Section Health.
Section Host.
Section Host Health Sized By Workload Grouped By Datacenter/Cluster.
4 Click the Host Health Sized By Workload Grouped By Datacenter/Cluster view.
5 In the heat map, point to the cluster area to view the percentage of remaining capacity.
A color other than green indicates a potential problem.
6 Click Details for the ESX host in the pop-up window to investigate the resources for that host.
What to do next
Adjust workloads to balance resources as necessary.
Identify Datastores with Space for Virtual Machines
Identify the datastores that have the most space for your next set of virtual machines.
Prerequisites
Verify that you are logged in to a vSphere Client and that vCenter Operations Manager is open.
Procedure
1 Click the Analysis tab.
2 In the heat map gallery, narrow the scope from the drop-down menu to display the datastore space.
Option Action
Focus Area
Smallest Box Shows
Description
Select Storage.
Select Datastore.
Select Datastore Space Contention Sized By Total Space Grouped By
Datacenter.
36 VMware, Inc.
Page 37

Chapter 4 Preparing Proactive Workflows in vCenter Operations Manager
3 Click Datastore Space Contention Sized By Total Space Grouped By Datacenter.
4 In the heat map, point to each datacenter area to view the space statistics.
5 If a color other than green indicates a potential problem, click Details for the datastore in the pop-up
window to investigate the disk space and disk I/O resources.
What to do next
Identify the datastores with the largest amount of available space for virtual machines.
Identify Datastores with Wasted Space
Identify datastores with the highest amount of wasted space that you can reclaim to improve the efficiency of
your virtual infrastructure.
Prerequisites
Verify that you are logged in to a vSphere Client and that vCenter Operations Manager is open.
Procedure
1 Click the Analysis tab.
2 In the heat map gallery, narrow the scope from the drop-down menu to display the datastore waste.
Option Action
Focus Area
Smallest Box Shows
Description
Select Storage.
Select Datastore.
Select Datastore Space Waste Sized by Space Usage Grouped by
Datacenter.
3 Click the Datastore Space Waste Sized by Space Usage Grouped by Datacenter view.
4 In the heat map, point to each datacenter area to view the waste statistics.
5 If a color other than green indicates a potential problem, click Details for the datastore in the pop-up
window to investigate the disk space and disk I/O resources.
What to do next
Identify the red, orange, or yellow datastores with the highest amount of wasted space.
Identify the Virtual Machines with Resource Waste Across Datastores
Identify the virtual machines that waste resources because of idle, oversized, or powered off virtual machine
states or because of snapshots.
Prerequisites
Verify that you are logged in to a vSphere Client and that vCenter Operations Manager is open.
Procedure
1 Click the Analysis tab.
VMware, Inc. 37
Page 38

VMware vCenter Operations Manager Advanced Getting Started Guide
2 In the heat map gallery, narrow the scope from the drop-down menu to display the virtual machines with
waste across datastores.
Option Action
Focus Area
Smallest Box Shows
Description
Select Storage.
Select VM.
Select VM Sized by Space Usage Grouped By Datastore.
3 Click the VM Sized by Space Usage Grouped By Datastore view.
4 In the heat map, point to each virtual machine to view the waste statistics.
5 If a color other than green indicates a potential problem, click Details for the virtual machine in the pop-
up window to investigate the disk space and disk I/O resources.
What to do next
Identify the red, orange, or yellow virtual machines with the highest amount of wasted space.
Identify the Host and Datastore with the Highest Latency
Identify the host and datastore pair with the highest latency to prevent a potential performance problem.
The heat map statistics for host I/O contention measure the latency or the time it takes to gain access to a
resource.
Prerequisites
Verify that you are logged in to a vSphere Client and that vCenter Operations Manager is open.
Procedure
1 Click the Analysis tab.
2 In the heat map gallery, narrow the scope from the drop-down menu to display the datastore waste.
Option Action
Focus Area
Smallest Box Shows
Description
Select Storage.
Select Host.
Select Host I/O Contention Sized by I/O Usage Grouped By Datastore.
3 Click theHost I/O Contention Sized by I/O Usage Grouped By Datastore view.
4 In the heat map, point to each datacenter area to view the latency statistics.
What to do next
Identify the host and datastore pair with the highest latency. Then determine how many hosts are using the
datastore. If only one VM is using the datastore, or if more than one is but none of the others have high latency,
there might be a problem with the host. Find out which VMs are on the host and what their storage usage is.
If there are multiple hosts and they all are red, there might be a population pressure problem on the datastore.
If this is the case, you should consider relocating some VMs.
38 VMware, Inc.
Page 39

Chapter 4 Preparing Proactive Workflows in vCenter Operations Manager
Optimizing Data for Capacity
Optimizing data for capacity in vCenter Operations Manager involves finding opportunities for resource
optimization and cost savings.
Determine How Efficiently You Use the Virtual Infrastructure
Determining the efficiency of the vCenter Operations Manager virtual infrastructure involves investigating
the optimal, waste, and stressed virtual machines.
Prerequisites
In the vCenter Operations Manager interface, verify that the Dashboard tab is open.
Procedure
1 In the inventory pane, select the object that you want to inspect.
2 Click the arrow under the Efficiency badge to expand the detailed view.
The Efficiency pane displays the subbadges for Reclaimable Waste and Density.
What to do next
Examine the Reclaimable Waste and Density subbadge colors to identify whether resources are underused
or partially consolidated.
Depending on your findings, you can investigate possible opportunities to improve efficiency.
Identify the Consolidation Ratio Trend for a Datacenter or Cluster
The consolidation ratio trend of a datacenter or cluster helps you understand the behavior and performance
of your virtual machines and applications.
Prerequisites
Verify that you are logged in to a vSphere Client and that vCenter Operations Manager is open.
Procedure
1 In the inventory pane, select the object that you want to inspect.
2 Click the arrow under the Efficiency badge to expand the detailed view.
3 In the Density pane, compare the consolidation ratio trend in the VM : Host Ratio and the vCPU : CPU
Ratio graphs.
If the ratios are below the optimal rate, the resource consolidation is low.
What to do next
To further investigate opportunities to optimize resource consolidation, click the Views tab under the
Planning tab.
Determine Reclaimable Resources from Underused Objects
Determining reclaimable resources in vCenter Operations Manager involves identifying the objects that are
underused.
Reclaimable waste is calculated for each resource type like CPU, memory, and disk, for each object in the virtual
environment.
VMware, Inc. 39
Page 40

VMware vCenter Operations Manager Advanced Getting Started Guide
Prerequisites
Verify that you are logged in to a vSphere Client and that vCenter Operations Manager is open.
Procedure
1 In the inventory pane, select the object that you want to inspect.
2 Click the arrow under the Efficiency badge to expand the detailed view.
3 In the Reclaimable Waste pane, identify the CPU, memory, and disk resources that are underused and
click the Reclaimable Waste badge.
4 In the Views tab, select the Undersized Virtual Machines - List view.
What to do next
Identify the virtual machines that are underused and provision fewer resources for them (or delete them).
Assess Virtual Machine Capacity Use
Identify optimization opportunities for a single virtual machine with vCenter Operations Manager.
Prerequisites
Verify that you are logged in to a vSphere Client and that vCenter Operations Manager is open.
Procedure
1 In the inventory pane, select the object that you want to inspect.
2 Click the Views tab under the Planning tab and select Virtual Machine Capacity Usage - Summary.
If the Host CPU and Memory use is high, the virtual machine does not have enough capacity to perform
assigned work.
What to do next
Determine whether you can optimize performance for this virtual machine by assigning capacity to match
typical load demand. If the virtual machine is powered off or idle, you can decommission the virtual machine
to reclaim unused capacity.
Implement a strategy for optimizing use of this virtual machine based on the information you obtain from the
view. Save your results by exporting the information to an export file.
Assess Virtual Machine Optimization Data
To optimize data with vCenter Operations Manager, identify overused and underused virtual machines for a
selected object.
A virtual machine can be oversized in memory and undersized in CPU or the
reverse.vCenter Operations Manager counts the virtual machine in both the oversized virtual machine count
and in the undersized virtual machine count.
This double counting can be misleading because you might expect the values for powered-off, undersized,
oversized, and idle virtual machines to add up to the total virtual machine value.
Prerequisites
Verify that you are logged in to a vSphere Client and that vCenter Operations Manager is open.
Procedure
1 In the inventory pane, select the object that you want to inspect.
2 Click the Views tab under the Planning tab and select Virtual Machine Optimization - Summary.
40 VMware, Inc.
Page 41

Chapter 4 Preparing Proactive Workflows in vCenter Operations Manager
3 Examine the Total Virtual Machines, Powered-Off Virtual Machines, Undersized Virtual Machines,
Oversized Virtual Machines, and Idle Virtual Machines values to determine how many machines assigned
to this object can be optimized.
Table 4-1. Example of Virtual Machine Optimization - Summary
Virtual Machine Type Number
Total Virtual Machines 12
Powered-Off Virtual Machines 0
Undersized Virtual Machines 6
Oversized Virtual Machines 6
Idle Virtual Machines 1
Identify Powered-Off Virtual Machines to Optimize Data
Powered-off virtual machines in your infrastructure are resources with capacity that you can reclaim.
Prerequisites
Verify that you are logged in to a vSphere Client and that vCenter Operations Manager is open.
Procedure
1 In the inventory pane, select the object that you want to inspect.
2 Click the arrow under the Efficiency badge to expand the detailed view.
3 In the Reclaimable Waste pane, identify the powered off virtual machines and delete the virtual click the
Reclaimable Waste badge.
4 In the Views tab, select the Powered-Off Virtual Machines view.
The virtual machines that appear in this view are powered off and you can restart the machines in the
vSphere Client.
What to do next
In the vSphere Client, determine why the virtual machine is powered off. If the virtual machine is obsolete,
you can remove it from the inventory.
Identify Idle Virtual Machines to Optimize Capacity
Optimizing the capacity in the virtual environment involves identifying idle virtual machines that are powered
on but not in use.
Prerequisites
Verify that you are logged in to a vSphere Client and that vCenter Operations Manager is open.
Procedure
1 In the inventory pane, select the object that you want to inspect.
2 Click the arrow under the Efficiency badge to expand the detailed view.
3 In the Reclaimable Waste pane, identify the powered off virtual machines and click the Reclaimable
Waste badge.
4 In the Views tab, select the Idle Virtual Machines - List view.
The idle virtual machines in this view either do not perform any work or perform below a specified
threshold.
VMware, Inc. 41
Page 42

VMware vCenter Operations Manager Advanced Getting Started Guide
5 Select theOversized Virtual Machines - List view to evaluate candidate objects that can receive more
work.
Identify Oversized Virtual Machines to Optimize Data
To optimize and right-size the capacity for your virtual environment, identify the oversized virtual machines
and assign less capacity to those virtual machines.
Prerequisites
Verify that you are logged in to a vSphere Client and that vCenter Operations Manager is open.
Procedure
1 In the inventory pane, select the object that you want to inspect.
2 Click the arrow under the Efficiency badge to expand the detailed view.
3 In the Views tab, select the Oversized Virtual Machines - List view.
The virtual machines that appear in this view are underused and have more capacity than is required for
the workload.
4 To determine how to update the CPU, check the value in the Recommended vCPU column.
5 (Optional) To examine a datacenter, run a Capacity Overview Report from the Reports tab.
What to do next
Assign more work to the underused virtual machines or reconfigure the capacity appropriate to the virtual
machine load.
Determine the Trend of Waste for a Virtual Machine
To optimize the capacity for your virtual environment, determine the trend of powered off, idle, undersized,
and oversized virtual machines over a period of time to help you identify wasted resources.
Prerequisites
Verify that you are logged in to a vSphere Client and that vCenter Operations Manager is open.
Procedure
1 In the inventory pane, select the object that you want to inspect.
2 Click the Views tab under the Planning tab and select the Virtual Machine Waste and Stress -Trend
view.
The CPU, memory, disk I/O, and network resources trend charts appear in this view.
3 (Optional) To view the object resource data in a list, click the Table link.
4 To view the object resource data interval, select the timeframe from the Interval drop-down menu and
click Update.
What to do next
Depending on the trend of wasted resources, reconfigure the capacity to be appropriate for the virtual machine
load.
42 VMware, Inc.
Page 43

Chapter 4 Preparing Proactive Workflows in vCenter Operations Manager
Forecasting Data for Capacity Risk
Forecasting data for capacity risk in vCenter Operations Manager involves creating capacity scenarios to
examine the demand and supply of resources in the virtual infrastructure.
A what-if scenario is a supposition about how capacity and load change if certain conditions are changed,
without making actual changes to your virtual infrastructure. If you implement the scenario, you know in
advance what your capacity requirements are.
NOTE The What-if Scenario wizard is accessible only if you select a host or a cluster in the inventory pane.
vCenter Operations Manager assigns names, such as Add 1 New VM, to scenarios. The What-if Scenarios pane
refreshes as each new scenario is applied in the view results. Scenarios persist until you delete them or until
you refresh vCenter Operations Manager.
Create Capacity Scenarios for Virtual Machines With New Profiles
Virtual machine scenarios assess the consequences of adding a new virtual machine to a cluster or host without
applying actual changes to your virtual environment.
To help you make configuration selections for virtual machines, the right pane of the What-If Scenario wizard
contains population information that shows the total virtual machine use of the selected object and
representative virtual machine data. vCenter Operations Manager calculates virtual machine data by
partitioning the range of capacity for CPU, memory, and disk dimensions into thirds, assigning the virtual
machines to bins based on configuration, and creating a profile for each bin where the capacity of the profile
is the maximum configuration of the virtual machines in the bin and the use of the profile is the average usage
of the virtual machines in the bin. The value of the virtual machines assigned to the profile and the use is the
average of the virtual machines assigned to the profile. The right pane includes information on the smallest
and largest hosts.
For information about relevant CPU and memory maximums, see the VMware vSphere documentation.
NOTE The What-if Scenario wizard is accessible only if you select a host or a cluster in the inventory pane.
Prerequisites
In vCenter Operations Manager, verify that the Summary tab under the Planning tab is open.
Procedure
1 Select the destination object in the inventory pane.
The destination object is a cluster or host where you locate the new virtual machines if you implement
your scenario.
2 Click the New what-if scenario link.
The What-If Scenario wizard opens.
3 Select a view for the scenario and click Next.
This step is not available if you opened the What-if Scenario wizard from the Views tab.
4 On the Change Type page, select Virtual machines and click Next.
5 Select Add virtual machines by specifying profile of new virtual machines and click Next.
VMware, Inc. 43
Page 44

VMware vCenter Operations Manager Advanced Getting Started Guide
6 Set the virtual machine count and the configuration for the virtual machine.
Option Description
vCPU Configuration
vCPU Utilization
vCPU Reservation
vCPU Limit
Memory Reservation
Memory Limit
Virtual Disk Type
Virtual Disk Linked Clone
Virtual Disk Configuration
Virtual Disk Utilization
Number of virtual CPU cores that a target virtual machine will have,
followed by the target processor core speed, in GHz or MHz.
Expected average CPU use for this virtual machine.
Required minimum of CPU resources that the virtual machine must have.
Amount of maximum CPU resources that the virtual machine can use.
Required minimum of memory for this virtual machine.
Amount of maximum memory that the destination virtual machine can have.
Thin or Thick disk configuration.
You might apply thin disk provisioning when you start with only the
necessary partition and plan to grow it over time.
Shared space that uses linked clones.
Linked clones involve delta disks that reference a master disk rather than a
full copy of the entire virtual hard disk. For thick disks with linked clones,
vCenter Operations Manager calculates linked clone capacity as one master
copy that uses 100 percent of the specified disk size and the remaining copies
use 10 percent delta disks. For thin disks with linked clones,
vCenter Operations Manager uses the same calculation but the disk size
multiplied by the use percentage defines the master copy size.
Disk size.
Expected average disk use for the virtual machine.
The use percentage applies only to thin disks.
vCenter Operations Manager does not require you to specify the disk I/O and network I/O use of the new
virtual machines, and instead uses the average disk I/O and network I/O use across virtual machines in
the host or cluster as an estimation of the new virtual machine use.
7 Click Next when your configuration selections are complete.
8 On the Ready to Complete page, check the parameters of your what-if scenario and click Finish to view
the outcomes.
vCenter Operations Manager applies the scenario to the view you selected and shows current capacity
compared to the expected capacity if you add the virtual machines to the target object.
Create Capacity Scenarios for Virtual Machines With Existing Profiles
You can create a scenario that uses profiles of existing virtual machines as models to simulate adding one or
more new virtual machines to a host or a cluster.
To help you make configuration selections for virtual machines, the right pane of the What-If Scenario wizard
contains population information that shows the total virtual machine use of the selected object and
representative virtual machine data. vCenter Operations Manager calculates virtual machine data by
partitioning the range of capacity for CPU, memory, and disk dimensions into thirds, assigning the virtual
machines to bins based on configuration, and creating a profile for each bin where the capacity of the profile
is the maximum configuration of the virtual machines in the bin and the use of the profile is the average usage
of the virtual machines in the bin. The value of the virtual machines assigned to the profile and the use is the
average of the virtual machines assigned to the profile. The right pane includes information on the smallest
and largest hosts.
For information about relevant CPU and memory maximums, see the VMware vSphere documentation.
NOTE The What-if Scenario wizard is accessible only if you select a host or a cluster in the inventory pane.
44 VMware, Inc.
Page 45

Chapter 4 Preparing Proactive Workflows in vCenter Operations Manager
Prerequisites
In vCenter Operations Manager, verify that the Summary tab under the Planning tab is open.
Procedure
1 Select the destination object in the inventory pane.
The destination object is a cluster or host where you locate the new virtual machines if you implement
your scenario.
2 Click the New what-if scenario link.
The What-If Scenario wizard opens.
3 Select a view for the scenario and click Next.
This step is not available if you opened the What-if Scenario wizard from the Views tab.
4 On the Change Type page, select Virtual machines and click Next.
5 Select Add virtual machines using profiles of existing virtual machines as models and click Next.
6 Select existing virtual machines from the list to use as profiles for the new virtual machines.
The list of the existing virtual machines applies to the datacenter of the selected object. The Datacenter
and the Cluster or Host drop-down menus narrow the scope of the virtual machine list. The list provides
CPU, memory, and disk information such as the used space and the use of thin disks or linked clones.
7 Click Next.
8 To duplicate any virtual machines, increase the virtual machine count and click Next.
9 On the Ready to Complete page, check the parameters of your what-if scenario and click Finish to view
the outcomes.
vCenter Operations Manager applies the scenario to the view you selected and shows current capacity
compared to the expected capacity if you add the virtual machines to the target object.
What to do next
If you have more than one scenario for a view, you can combine and compare the outcomes. To save the
information, export the scenario results.
Create a Hardware Change Scenario
Before you purchase new hardware, you can create hardware change scenarios to determine if the purchase
is necessary. To determine the effect of adding, removing, or updating the hardware capacity in a cluster, create
a scenario that models changes to hosts and datastores.
Prerequisites
In vCenter Operations Manager, verify that the Summary tab under the Planning tab is open.
Procedure
1 Select the target host in the inventory panel.
The target host is where you simulate changes to the environment to examine possible outcomes.
2 Click the New what-if scenario link.
3 Select a view for the scenario and click Next.
This step is not available if you opened the What-if Scenario wizard from the Views tab.
4 On the Change Type page, select Hosts & Datastores and click Next.
VMware, Inc. 45
Page 46

VMware vCenter Operations Manager Advanced Getting Started Guide
5 Use the buttons to add, remove, or restore hosts in the host list.
Actions are applied only to hosts that you selected using the check boxes in the hosts list.
6 Click host rows to change the physical resources and click Save.
You can use the text boxes and drop-down menus to modify the CPU capacity and the memory size of
the selected host.
Option Description
CPU Total
Memory Total
Number of CPU cores that a target single host will have, followed by the
target processor core speed.
Amount of memory that the target host profile will have.
7 Click Next.
8 Use the buttons to add, remove, or restore datastores in the datastores list.
Actions are applied only to datastores that you selected using the check boxes in the datastores list.
9 Click datastore rows to modify the disk size and click Save.
The Population Details pane to the right contains information about the actual datastore capacity, the disk
I/O use, and the number of hosts that link the datastore. The sharing status indicates whether different
hosts share the datastore.
10 Click Next.
11 On the Ready to Complete page, check the parameters of your what-if scenario and click Finish to view
the outcomes.
vCenter Operations Manager applies the scenario to the view that you selected. The scenario forecast appears
in the chart as a gray dotted line. You can compare the actual current capacity to the expected capacity if you
apply the changes you specified in the hardware change scenario.
What to do next
If you have more than one scenario, you can combine or compare the scenario outcomes. You can export the
scenario results to an Adobe PDF or CSV file to save the information.
Create a What-If Scenario to Remove Virtual Machines
You can create a scenario that simulates removing a virtual machine or group of virtual machines from a host
or a cluster.
Prerequisites
In vCenter Operations Manager, verify that the Summary tab under the Planning tab is open.
Procedure
1 Select the target object in the inventory panel.
The target object identifies the host or the cluster from which the virtual machines are removed if you
implement your scenario.
2 Click the New what-if scenario link.
3 Select a view for the scenario and click Next.
This step is not available if you opened the What-if Scenario wizard from the Views tab.
4 On the Change Type page, select Virtual machines and click Next.
46 VMware, Inc.
Page 47

Chapter 4 Preparing Proactive Workflows in vCenter Operations Manager
5 Select Remove virtual machines and click Next.
6 On the Configuration page, select the virtual machines to remove from the selected host or cluster and
click Next.
7 On the Ready to Complete page, check the parameters of your what-if scenario and click Finish to view
the outcomes.
vCenter Operations Manager applies the scenario to the view that you selected. The forecasted capacity appears
in the chart as a gray dotted line. You can compare the current capacity to the expected capacity if you remove
the virtual machines from the target object.
What to do next
If you have more than one scenario, you can combine or compare the scenario outcomes. You can export the
scenario results to an Adobe PDF or CSV file to save the information.
Combine the Results of What-If Scenarios
You can combine the results of all what-if scenarios to assess their cumulate effect on your environment.
The list of scenarios that you created appears in the What-If Scenarios pane under the Legend pane.
Prerequisites
In vCenter Operations Manager, verify that the Views tab under the Planning tab is open.
Verify that you have created at least two what-if scenarios.
Procedure
1 In the What-If Scenarios pane, select Combine from the drop-down menu.
The combined values for all what-if scenarios appear as dotted lines in the Forecasted area of the view.
2 To view aggregate scenario values in tabular form, click the Table link.
What to do next
You can compare the results of different what-if scenarios to determine the best course of action.
Compare the Results of What-If Scenarios
You can compare a scenario result to the actual capacity of your environment and to other scenario results and
determine the best course of action.
The list of scenarios that you created appears in the What-If Scenarios pane under the Legend pane.
Prerequisites
In vCenter Operations Manager, verify that the Views tab under the Planning tab is open.
Procedure
1 In the What-If Scenarios pane, select Compare from the drop-down menu.
Existing data and scenario data appear in different line styles in the Forecasted area of the view.
2 (Optional) To view scenario results in tabular form, click the Table link.
The table view contains separate columns to show the effect of the simulated change.
What to do next
You can combine scenario results to assess the cumulative effect of all scenarios.
VMware, Inc. 47
Page 48

VMware vCenter Operations Manager Advanced Getting Started Guide
Delete a Scenario from the What-If Scenarios List
You can remove scenarios in the What-If Scenarios pane if you do not need them.
The list of scenarios that you created appears in the What-If Scenarios pane under the Legend pane.
When you finish examining a what-if scenario, you can delete it.
Prerequisites
In vCenter Operations Manager, verify that the Views tab under the Planning tab is open.
Procedure
1 To delete a what-if scenario, click the X icon to the right of the scenario name.
A confirmation dialog box opens.
2 Click Yes to confirm the deletion and return to the Views tab.
vCenter Operations Manager refreshes the view in the Details pane to remove the data from the scenario.
48 VMware, Inc.
Page 49

Planning
vCenter Operations Manager
Workflow with Alerts 5
Planning your workflow in a vCenter Operations Manager virtual environment involves identifying alerts to
respond to, maintaining alerts, and identifying alert trends.
Alerts in vCenter Operations Manager are available for all of the minor badges. Alert messages provide an
alternate path to identify and resolve issues.
This chapter includes the following topics:
n
“What Is an Alert in vCenter Operations Manager,” on page 49
n
“Filter Alerts to Identify Notifications,” on page 50
n
“Identify Capacity Related Alerts,” on page 51
n
“Identify the Overall Trend of Alert Types,” on page 51
n
“Maintaining vCenter Operations Manager Alerts,” on page 52
What Is an Alert in vCenter Operations Manager
vCenter Operations Manager generates alerts when events occur on the monitored objects, when data analysis
indicates deviations from normal metric values, or when a problem occurs with one of the
vCenter Operations Manager components.
The Alert Volume Chart
The Alert Volume chart is a graphical representation of the number of alerts that were activated during the
last 7 days. The color coding in the graph represents the level of criticality of alerts. The number of currently
active alerts of each criticality level appears to the right of the graph.
Alert Icon Description
Critical alert. You must act immediately.
Immediate alert. Act as soon as possible.
Warning alert. Check the condition of the selected object.
Information alert.
The Alert Volume chart helps you visually assess what is the overall volume of alerts triggered in your
environment, what is the ratio between alerts of different criticality, and what criticality level prevails in your
environment.
VMware, Inc.
49
Page 50

VMware vCenter Operations Manager Advanced Getting Started Guide
Types of Alerts
vCenter Operations Manager generates several types of alerts. Double-click alerts in the list to view the alert
details.
Badge Score Alerts
Fault Alerts
Administrative Alerts
Badge score alerts are triggered when a badge changes its color. Badge colors
change based on the hard thresholds that you set in the Configuration dialog
box. Alerts can be triggered for the Workflow, Anomalies, Time Remaining,
Capacity Remaining, Stress, Waste, and Density badges. You can select which
badges activate alerts in the Configuration dialog box.
The color of the Faults badge changes based on the number of events that
occurred in the virtual infrastructure that you monitor.
vCenter Operations Manager does not weigh the importance of events, and the
Faults badge color might remain unchanged if a single event occurs. As a result,
you might miss an isolated, but critical fault event that occurred on the vCenter
Server. Therefore, fault alerts are triggered when an individual event occurs
and are not related to the color of the Faults badge. You can enable and disable
fault alerts in the Configuration dialog box.
Administrative alerts are displayed only when the World object is selected in
the navigation tree. Administrative alerts are related to problems on the
vCenter Operations Manager system and virtual environment and do not affect
monitored objects, but affect the proper operation and data collection of the
application. Administrative alerts can be two types.
Administrative Alert
Type Description
System alert A component of the vCenter Operations Manager
application has failed.
Environment alert vCenter Operations Manager has stopped receiving data
from one or more resources. This might indicate a problem
with the resource or the network infrastructure.
External Alert Notifications
An administrator can configure vCenter Operations Manager to send email and SNMP notifications when an
alert triggers. SMTP and SNMP notifications are set on the vCenter Operations Manager Administration Web
page. The URL format is https://
VM-IP
/admin/, where VM-IP is the IP address or fully qualified host name of
the UI VM virtual machine that is part of the vCenter Operations Manager virtual appliance.
Filter Alerts to Identify Notifications
Filter the alerts in your virtual environment to easily identify notifications by time, severity, and duration.
Prerequisites
Verify that you are logged in to a vSphere Client and that vCenter Operations Manager is open.
Procedure
1 In the inventory pane, select the object that you want to inspect.
2 Click the Alerts tab to view a list of active alerts.
50 VMware, Inc.
Page 51

Chapter 5 Planning vCenter Operations Manager Workflow with Alerts
3 In the Alerts list, filter the alerts by columns or select an alert icon.
Option Action
To view the most critical alerts that
need immediate attention.
To filter badge alerts in the object.
To filter sub-badge alerts in the
object.
To view the most recent alerts in the
object.
To filter the duration of the alert to
identify the alerts that the
administrator has not attended to.
To view the Administrative alerts in
the object.
To view the System alerts in the
object.
To view the Environment alerts in the
object.
Select the Criticality column.
Select the Type column.
Select the Sub-Type column.
Select the Start Time column.
Select the Duration column.
Select the Administrative Alert icon.
Select the System icon.
Select the Environment icon.
What to do next
To investigate the possible causes of an alert, double-click the alert for details.
Identify Capacity Related Alerts
Capacity related alerts might be triggered because of resources running out of capacity, stressed virtual
machines, or resources wasting memory.
Prerequisites
Verify that you are logged in to a vSphere Client and that vCenter Operations Manager is open.
Procedure
1 In the inventory pane, select the object that you want to inspect.
2 Click the Alerts tab to view a list of active alerts.
3 In the Alerts list, filter the list by the Capacity Remaining badge to view alerts that address capacity.
When you double-click an alert, vCenter Operations Manager opens a pop-up window displaying the
alert details.
What to do next
To find aggregate information for used and total capacity and capacity trends, click the Views tab under the
Planning tab and select the Capacity badge.
Identify the Overall Trend of Alert Types
You can use the overall trend of alert types to identify the number of critical alerts over a period of time.
Prerequisites
Verify that you are logged in to a vSphere Client and that vCenter Operations Manager is open.
Procedure
1 In the inventory pane, select the object that you want to inspect.
VMware, Inc. 51
Page 52

VMware vCenter Operations Manager Advanced Getting Started Guide
2 Click the Alerts tab to view a list of active alerts.
3 To view the alert distribution across the last seven days, check the Alert Volume graph.
A trend in alerts typically indicates a problem to investigate. Over time, you might also want to customize
alert settings, which will be reflected in the trend display.
Maintaining vCenter Operations Manager Alerts
Maintaining alerts in the vCenter Operations Manager environment requires administrative privileges.
After identifying an alert from the Alerts list, administrators can take and release ownership of the alert,
suspend, suppress, or cancel an alert.
n
Take Ownership of an Alert on page 52
Users can take ownership of alerts in the Alerts list.
n
Release Ownership of an Alert on page 53
If you are no longer responsible for an alert or want to let other users take ownership of that alert, you
must release the ownership.
n
Suppress an Alert on page 53
You can hide an alert from the Alerts list for a specific number of days.
n
Suspend an Alert on page 54
You can hide an alert from the Alerts list for a specific number of minutes.
n
Cancel a Fault Alert on page 54
You can deactivate fault alerts if they are no longer valid.
Take Ownership of an Alert
Users can take ownership of alerts in the Alerts list.
Owning an alert means that you are responsible for taking the necessary remediation actions, and prevents
other users from suspending or suppressing the alert. This can reduce overlapping efforts when multiple
operators manage alerts. The user names of alert owners appear in the User Name column of the Alerts list.
IMPORTANT Only owners can suspend or suppress the alerts they own.
Prerequisites
Verify that you are logged in to a vSphere Client, and vCenter Operations Manager is open.
Procedure
1 Click the Alerts tab.
2 In the Alerts list, click the alert you want to own.
3 (Optional) To select multiple alerts in the list, press the Shift or Control key and click to select the alerts.
4
Click the Take Ownership button .
5 Click Yes to confirm.
The alert appears as Assigned in the Control State column of the alert list.
52 VMware, Inc.
Page 53

Chapter 5 Planning vCenter Operations Manager Workflow with Alerts
Release Ownership of an Alert
If you are no longer responsible for an alert or want to let other users take ownership of that alert, you must
release the ownership.
Prerequisites
Verify that you are logged in to a vSphere Client, and vCenter Operations Manager is open.
Procedure
1 Click the Alerts tab.
2 In the Alerts list, click one of the alerts that you own.
3 (Optional) To select multiple alerts in the list, press the Shift or Control key and click to select the alerts.
4
Click the Release Ownership button .
5 Click Yes to confirm.
Your user name is removed from the User Name column of the Alerts list.
Suppress an Alert
You can hide an alert from the Alerts list for a specific number of days.
When you suppress an alert, you take ownership of this alert.
NOTE You cannot suppress an alert owned by another user.
Prerequisites
Verify that you are logged in to a vSphere Client, and vCenter Operations Manager is open.
NOTE You don't need administrative privileges to suppress or suspend alerts.
Procedure
1 Click the Alerts tab.
2 In the Alerts list, click the alert you want to suppress.
3 (Optional) To select multiple alerts in the list, press the Shift or Control key and click to select the alerts.
4
Click the Suppress button
5 In the Confirm dialog box, type the number of days to suppress the alert for, and click OK.
By default, vCenter Operations Manager hides suppressed and suspended alerts from the Alerts list for the
period you specified. You can use the filters in the Control State column header to show or hide suppressed
and suspended alerts.
.
If the problem still exists when the period you specified expires, vCenter Operations Manager reactivates the
alert and the alert appears in the Alerts list. Your user name remains assigned as the alert owner.
VMware, Inc. 53
Page 54

VMware vCenter Operations Manager Advanced Getting Started Guide
Suspend an Alert
You can hide an alert from the Alerts list for a specific number of minutes.
When you suspend an alert, you take ownership of the alert.
NOTE You can suspend only alerts that are not owned by another user.
Prerequisites
Verify that you are logged in to a vSphere Client, and vCenter Operations Manager is open.
Procedure
1 Click the Alerts tab.
2 In the Alerts list, click the alert you want to suspend.
3 (Optional) To select multiple alerts in the list, press the Shift or Control key and click to select the alerts.
4
Click the Suspend button .
5 In the Confirm dialog box, type the number of minutes to suspend the alert for, and click OK.
By default, vCenter Operations Manager hides suppressed and suspended alerts from the Alerts list for the
period you specified. You can use the filters in the Control State column header to show or hide suppressed
and suspended alerts.
If the problem still exists when the period you specified expires, vCenter Operations Manager reactivates the
alert and the alert appears in the Alerts list. Your user name remains assigned as the alert owner.
Cancel a Fault Alert
You can deactivate fault alerts if they are no longer valid.
Fault alerts are triggered by events that are retrieved from the vCenter Server. In order to deactivate a fault
alert, vCenter Operations Manager must receive another event notification when the problem on the vCenter
Server is resolved. If vCenter Operations Manager does not receive such an event, the fault alert remains active.
Because faults contribute to the Health badge score, active fault alerts degrade the health score even if the
problems that triggered them are solved. Therefore, on rare occasions, you might need to deactivate outdated
fault alerts manually.
Prerequisites
Verify that you are logged in to a vSphere Client, and vCenter Operations Manager is open.
Procedure
1 Click the Alerts tab.
2 In the Alerts list, click the fault alert you want to deactivate.
You can press the Shift or Control key while you click to select multiple alerts in the list.
3 (Optional) To select multiple alerts in the list, press the Shift or Control key and click to select the alerts.
4
Click the Cancel Fault Alert button
5 Click Yes to confirm.
54 VMware, Inc.
.
Page 55

Chapter 5 Planning vCenter Operations Manager Workflow with Alerts
The canceled fault alert is removed from the Alerts list and vCenter Operations Manager updates the Fault
badge score and the Health Score.
NOTE Badge scores are not refreshed in real time. These values are refreshed on each data collection cycle.
The data collection interval is five minutes by default.
VMware, Inc. 55
Page 56

VMware vCenter Operations Manager Advanced Getting Started Guide
56 VMware, Inc.
Page 57

Customizing
vCenter Operations Manager
Configuration Settings 6
Customization of configuration settings include assigning operational responsibilities and receiving
notifications when badges cross thresholds.
This chapter includes the following topics:
n
“Customize the Badge Thresholds for Infrastructure Objects,” on page 57
n
“Customize the Badge Thresholds for Virtual Machine Objects,” on page 58
n
“Default Badge Threshold Values,” on page 58
n
“Edit Configuration Settings to Receive Notifications When a Badge Crosses a Threshold,” on
page 61
Customize the Badge Thresholds for Infrastructure Objects
You can modify the default badge threshold levels for virtual infrastructure objects so that your own ranges
appear in the vCenter Operations Manager Dashboard and Operations tabs.
An administrator can modify the default settings of vCenter Operations Manager at any time. The changes
that the administrator applies affect all users. Therefore, the administrator must notify other users who are
working with vCenter Operations Manager about new settings that are applied.
Prerequisites
Verify that you are logged in to a vSphere Client as an administrator, and vCenter Operations Manager is open.
Procedure
1 Click the Configuration link on the main vCenter Operations Manager page.
The Configuration dialog box appears.
2 In the Badges & Alerts navigation section, click Infrastructure Badge Thresholds.
3 Slide the color icons on the selected axis to modify the default values and set the ranges to show green,
yellow, orange, or red badge.
NOTE You cannot revert the changes you apply to badge thresholds. Therefore, “Default Badge Threshold
Values,” on page 58 lists the default threshold values for your reference.
4 (Optional) To enable or disable a color range for a badge, click the icon of that color.
Only the outlines of the icon that you disabled remain on the axis.
If the badge score crosses the threshold marked by the disabled icon, the badge color does not change.
vCenter Operations Manager does not trigger alerts derived from disabled badge thresholds.
VMware, Inc.
57
Page 58

VMware vCenter Operations Manager Advanced Getting Started Guide
5 Click OK to save your settings and close the Configuration dialog box.
Badge thresholds are updated. The badge colors will change when the next collection cycle begins.
NOTE Depending on your selection in the Alert Management section of the Configuration dialog box, new
badge thresholds might affect the number of alerts that vCenter Operations Manager generates.
Customize the Badge Thresholds for Virtual Machine Objects
You can modify the default badge threshold levels for virtual machines so that your own ranges appear in the
vCenter Operations Manager Dashboard and Operations tabs.
An administrator can modify the default settings of vCenter Operations Manager at any time. The changes
that the administrator applies affect all users. Therefore, the administrator must notify other users who are
working with vCenter Operations Manager about new settings that are applied.
Prerequisites
Verify that you are logged in to a vSphere Client as an administrator, and vCenter Operations Manager is open.
Procedure
1 Click the Configuration link on the main vCenter Operations Manager page.
The Configuration dialog box appears.
2 In the Badges & Alerts navigation section, click VM Badge Thresholds.
3 Slide the color icons on the selected axis to modify the default values and set the ranges to show green,
yellow, orange, or red badge.
NOTE You cannot revert the changes you apply to badge thresholds. Therefore, “Default Badge Threshold
Values,” on page 58 lists the default threshold values for your reference.
4 (Optional) To enable or disable a color range for a badge, click the icon of that color.
Only the outlines of the icon that you disabled remain on the axis.
If the badge score crosses the threshold marked by the disabled icon, the badge color does not change.
vCenter Operations Manager does not trigger alerts derived from disabled badge thresholds.
5 Click OK to save your settings and close the Configuration dialog box.
Badge thresholds are updated. The badge colors will change when the next collection cycle begins.
NOTE Depending on your selection in the Alert Management section of the Configuration dialog box, new
badge thresholds might affect the number of alerts that vCenter Operations Manager generates.
Default Badge Threshold Values
If you modify the default badge thresholds in the Configuration window, you cannot reset to the default values.
Because you cannot revert the changes you apply to badge thresholds, Table 6-1 lists the default badge
threshold values for your reference.
58 VMware, Inc.
Page 59

Chapter 6 Customizing vCenter Operations Manager Configuration Settings
Table 6-1. Default Badge Threshold Values
Default Score
Range for
Badge Icon Status
Infrastructure
Health Good 100-76 100-76
Abnormal 75-51 75-51
Degraded 50-26 50-26
Bad 25-0 25-0
Workload Good 0-79 0-84
Abnormal 80-89 85-94
Degraded 90-94 95-100
Bad >95 >100
Default Score Range for
VM
Anomalies Good 0-49 0-49
Abnormal 50-74 50-74
Degraded 75-89 75-89
Bad 90-100 90-100
Faults Good 0-24 0-24
Abnormal 25-49 25-49
Degraded 50-74 50-74
Bad 75-100 75-100
Risk Good 0-49 0-49
Abnormal 50-74 50-74
Degraded 75-100 75-100
Bad 100 100
Time Remaining Good 100-51 100-51
Abnormal 50-26 50-26
VMware, Inc. 59
Page 60

VMware vCenter Operations Manager Advanced Getting Started Guide
Table 6-1. Default Badge Threshold Values (Continued)
Badge Icon Status
Degraded 25-1 25-1
Bad 0 0
Capacity Remaining Good 100-51 100-51
Abnormal 50-26 50-26
Degraded 25-1 25-1
Bad 0 0
Stress Good 0 0
Abnormal 1-4 1-4
Default Score
Range for
Infrastructure
Default Score Range for
VM
Degraded 5-9 5-9
Bad >10 >10
Efficiency Good 100-26 100-26
Abnormal 25-11 25-11
Degraded 10-1 10-1
Bad 0 0
Reclaimable Waste Good 0-74 0-74
Abnormal 75-89 75-89
Degraded 90-99 90-99
Bad 100 100
Density Good 100-26 100-26
Abnormal 25-11 25-11
Degraded 10-1 10-1
Bad 0 0
60 VMware, Inc.
Page 61

Chapter 6 Customizing vCenter Operations Manager Configuration Settings
Edit Configuration Settings to Receive Notifications When a Badge Crosses a Threshold
Administrators of the vCenter Operations Manager virtual environment set notifications when a badge crosses
a threshold, to identify and troubleshoot a problem immediately after it occurs.
Prerequisites
Verify that you are logged in to a vSphere Client as an administrator, and vCenter Operations Manager is open.
Verify that the SMTP notifications are set on the vCenter Operations Manager Administration portal.
Procedure
1 Click the Notifications link on the main vCenter Operations Manager page.
2 In the Notification dialog box, click the Add Rule icon to add a new notification rule.
3 Type a rule name.
4 Type the email addresses to which to send the notification.
5 Select the alert types and severity levels that trigger the notification.
6 To receive notifications from all child objects, select Include Children.
7 To receive notifications from a specific child object, select Include Children > <ObjectName>.
VMware, Inc. 61
Page 62

VMware vCenter Operations Manager Advanced Getting Started Guide
62 VMware, Inc.
Page 63

Index
A
about VMware vCenter Operations Manager
Advanced Getting Started Guide 5
address, virtual machine problem 29
address, datastore problem 30
alert
cancel 52
release ownership 52
suppress 52
suspend 52
take ownership 52
alert types, overall trend 51
alerts
canceling faults 54
capacity related 51
critical 51
definition 49
ownership 52
releasing ownership 53
suppressing 53
suspending 54
types 49
analyzing data, capacity risk 35
anomalies
determining expected behavior 25
noise line 25
normal values 25
assign operational responsibilities 57
attributes, concept 7
average stress 24
B
badge
cross threshold 61
health 12
high-level indicator 12
badge threshold defaults 58
badges
anomalies 14
capacity remaining 16
colors 12
concept 12
cross thresholds 57
efficiency 18
faults 14
major 12
measuring events 14
risk 15
scores 12
stress 17
waste 19
workload 13
buttons
health tree 21
in charts 21
C
capacity
assessing future risk 35
in datastores for virtual machines 36
remaining in clusters for virtual machines 35
time remaining 16
capacity optimization 39
capacity remaining 16
chart buttons 21
charts 20
clusters
remaining capacity 35
stressed 31
colors 12
combining scenarios 47
comparing scenarios 47
concepts
attributes 7
dynamic thresholds 7
metrics 7
consolidation ratio trend 39
cost savings 19
critical alerts 51
D
dashboard
remaining capacity 32
used capacity 32
datastore scenarios 45
datastores
space for virtual machines 36
waste 37
with high latency 38
day-to-day operations 24
definition, alerts 49
density 19
VMware, Inc.
63
Page 64

VMware vCenter Operations Manager Advanced Getting Started Guide
determine
chronic problem 28
object capacity 28
transient problem 28
dynamic threshold, concept 7
E
efficiency
density 19
waste 19
events, determining performance problems 26
exhaust resource 28
F
faults 14
filter alerts 50
forecasting capacity 43
forecasting data, capacity risk 43
G
graph buttons 21
graphs 20
H
hardware scenarios 45
health
anomalies 14
defining 12
sub-badges 12
timeframe 24
transient or chronic 24
workload 13, 14
health tree buttons 21
heat maps
identify resource consumers 27
identifying latency 38
host scenarios 45
hosts
stressed 31
with high latency 38
I
icons for objects 11
identify
critical alerts 50
overall health issue 24
recent alerts 50
identify alert notifications 50
idle virtual machines 41
inventory icons 11
issue, consistency 27
issue, extent 27
L
latency, hosts 38
M
maintain, alerts 52
memory
interpret data 31
metrics 32
metric chart buttons 21
metric charts 20
metrics
concept 7
key concepts 8
memory 32
memory issues 31
N
noise line 25
O
object types 11
optimize
consolidation ratio 39
density 39
reclaimable resources 39
optimizing capacity 42
optimizing data, capacity 39
optimizing virtual machines 40
oversized virtual machines 42
overused clusters 31
overused hosts 31
P
performance, source of degradation 26, 36
performance degradation, events 26
planning, proactive 35
planning data, capacity risk 35
powered-off virtual machines 41
product features 7
R
reclaim, resources 39
resources
identifying underlying issues 32
memory 32
top consumers 27
risk
capacity remaining 16
defining 15
stress 17
sub-badges 15
time remaining 16
workflow 35
64 VMware, Inc.
Page 65

Index
S
scores 12
settings
infrastructure anomalies levels 57
infrastructure badge colors 57
infrastructure capacity levels 57
infrastructure density levels 57
infrastructure efficiency levels 57
infrastructure faults ranges 57
infrastructure health levels 57
infrastructure risk levels 57
infrastructure stress levels 57
infrastructure time levels 57
infrastructure waste levels 57
infrastructure workload levels 57
vm anomalies levels 58
vm badge colors 58
vm capacity levels 58
vm density levels 58
vm efficiency levels 58
vm faults ranges 58
vm health levels 58
vm risk levels 58
vm stress levels 58
vm time levels 58
vm waste levels 58
vm workload levels 58
space, reclaiming 19
stress, identifying 30
T
time remaining 16
trend
stress 42
waste 42
types of alerts 49
undersized virtual machines 30
underutilized virtual machines 40
usage 40
virtual machine scenarios
adding new virtual machines 43
adding new virtual machines from existing
machines 44
removing virtual machines 46
virtual machines
oversized 42
undersized 30
underutilized 40
waste 37
W
waste
across datastores 37
in virtual machines 37
reclaim datastores 37
what-if scenarios
adding new virtual machines 43
adding new virtual machines from existing
machines 44
combining 47
comparing 47
deleting 48
hardware 45
removing virtual machines 46
workflow
alerts 49
day-to-day 23
identifying underlying issues 32
identifying underlying resource issues 31
proactive 23
reactive 24
Workflow, proactive 35
workflow preparation 11
workload 13
U
undersized virtual machines 30
underutilized virtual machines 40, 42
utilization, identify consumers 27
V
views
capacity optimization 40, 41
optimizing capacity 30, 31, 40, 42
virtual infrastructure, efficiency 39
virtual infrastructure efficiency 39
virtual machine capacity
idle machines 41
oversized virtual machines 42
powered-off machines 41
VMware, Inc. 65
Page 66

VMware vCenter Operations Manager Advanced Getting Started Guide
66 VMware, Inc.
 Loading...